executive summary - dwang2017.files.wordpress.com · fast-fashion stores including gap, zara, and...
TRANSCRIPT
Executive Summary
This report is conducted to examine how H&M can more effectively and efficiently maximize
the profits from their current customer base. The stated objective of this research is to identify
highly profitable customers and frequent shoppers for H&M and to offer managerial implications
based on the key findings of this research. The research conducted is meant to segment H&M’s
customers based on their most relevant characteristics as shoppers, allowing for more effective
promotions and increasing sales for the company. H&M is in the fast-fashion industry that is a
highly competitive and defined as a monopolistic competition. In order to sustain their current
positioning within the market, H&M must understand the buying behaviors of their customers
for maximizing the profitability of each individual customer.
The data we received for this research is the transactional records for H&M over a period of
nearly eight years. From these records we are able to select important variables and aggregate the
data into a customer database that we can then use to establish characteristics about specific
customers. The variables that we use to segment H&M’s customers are total revenue, total
profits, months from last order, and the number of orders placed. Our variable selection is based
on the Recency Frequency Monetary Model (RFM Model). The RFM Model is a technique to
quantitatively measure who are the best customers (Rouse, 2005). The channel and payment
method in the data are also analyzed to find possible business opportunities for H&M.
Once the variables are selected and the transactional data is converted into customer data, we run
Hierarchical Cluster Analysis and K-means Cluster Analysis with Ward’s Method. Cluster
analysis is run on data in an attempt to accurately cluster the customers into segments H&M will
be able to target effectively. According to the meaningful customer characteristics we select,
H&M has seven segments of customers. Each segment represents a group of H&M’s customers
that can be targeted with similar strategies. H&M will then be able to allocate marketing
resources more efficiently, which leads the company to save money and increase their
customer’s lifetime value.
While conducting this research we found some very interesting characteristics of H&M’s
customer base. Over 88% of their customers who generated over ten million dollars of revenue
for H&M only shopped there once. This means that many of H&M’s customers are not repeat
customers. It is always less expensive for a company to retain current customers and increase
average revenue than to create new customers to buy products. We recommend H&M to develop
a membership program for its customers to not only increase the number of visits the customer
will make to the store, but also to create customer value and incentives so customers shop at
H&M more often. Another interesting finding of H&M’s customers was a group that shared
similar traits, such as number of orders and average revenue. These are semi-frequent shoppers
who might spend more at H&M if they felt there was more value for them. Initiating a promotion
where the percentage discounted from the order was correlated to the amount they spent on the
order might encourage more spending on their visits to the stores. The final meaningful segment
of customers for H&M contains a higher average revenue than the previously mentioned
segments, but is also smaller than the previous two sections as well, at only about thirteen
hundred customers. These customers generate a large revenue for H&M and the way to increase
this revenue is to increase the number of times these customers order from H&M. By sending
this group of customers the new promotion products H&M has received since their last visit, it
would create value for the customer in returning to H&M and possibly purchasing more products
than they otherwise would have.
With the findings from the research and the managerial implications determined from these
findings, H&M will have the tools to increase revenue and sales from their current customers.
Segmenting customers helps identify the groups to focus on for acquiring and retaining
consumers (Hinshaw, 2013). Once one can determine the customers that should be focused on,
one can take the next step, which is learning what the customers' wants and needs are in order to
create more customer value for the company. By understanding this research, H&M will be able
to address each group of customers in the way that most effectively maximizes the buying
potential of those customers (Optimove, 2015).

TABLE OF CONTENTS
INTRODUCTION ............................................................................................................................... 1
BACKGROUND ................................................................................................................................. 4
METHODOLOGY .............................................................................................................................. 5
VARIABLE SELECTION ........................................................................................................................ 5
METHOD ............................................................................................................................................... 7
ANALYSIS ...................................................................................................................................... 10
POST -HOC ANALYSIS .................................................................................................................. 27
CHANNEL ANALYSIS ......................................................................................................................... 27
PAYMENT METHOD ANALYSIS ......................................................................................................... 29
CONCLUSION ................................................................................................................................. 30
LIMITATIONS ................................................................................................................................. 33
FUTURE RESEARCH ....................................................................................................................... 34
REFERENCES ................................................................................................................................. 36
APPENDIX ...................................................................................................................................... 38
INFOGRAPHICS .............................................................................................................................. 42
1
Introduction
H&M, a Swedish multinational clothing company, is well known for its affordable, yet
fashionable clothing for men, women, teenagers, and children. With over 3,700 stores in
61 countries, H&M is considered to be the second largest global clothing retailer
(Wikipedia, n.d.). With this title comes responsibility as H&M faces a few challenges
when trying to acquire and retain consumers. For example, there is a large number of
customers who are one-time shoppers at H&M. Meaning, they make one or two
purchases and never come back. For the amount of customers that do this, wouldn’t it
make sense for H&M to try to get these customers to stay? Just think if H&M can keep
even just 25% of those one-time customers; they will already be more profitable. This is
just one problem that we seek to address in our study.
The environment for retailers has become increasingly more complex as consumers are
given the ability to shop online via website, phone, or mail. According to an annual
survey done by PwC on consumers' retail shopping habits, “only 27 percent of U.S.
consumers say they shop online weekly. Although people [reserved] the strength of the
traditional store, 68 percent of U.S. respondents say they have intentionally browsed
products at a store but decided to purchase them online” (PwC, 2015). The retail-clothing
market is filled with much variety and competition in the fast-fashion industry. H&M
prides itself on two main concepts: one is its cheap price and second is its high volume of
cute, stylish clothing (Rosenblum, 2015). H&M attracts a target market based on these
2
principles. Why would a consumer spend hundreds of dollars on one item when he or she
can buy something similar at a quarter of the price? Secondly, retailers such as H&M
understand the hassle of looking through catalogs of large department stores for bargain
prices. As a result, H&M eliminates that problem by providing a store that only sells
bargains (Rosenblum, 2015).
Within this industry, however, there lies much competition for H&M and its rival catalog
companies. First, a catalog company competes with in-store retailers. According to the
Omnichannel Shopping Preferences Study, “90 percent of all U.S. retail sales still happen
in stores” (Lesonsky, 2014). Meaning, that profits for a catalog company can increase if
the company targets consumers who are more likely to purchase online versus in-store.
Secondly, H&M faces competition from other top catalog retailers that include Zara,
Uniqlo and Gap. In order to figure out how to keep consumers loyal to H&M’s catalog
branch, we analyzed a large data set comparing the company’s total revenue, total profits,
the number of orders, months from last order, the payment method, and the channel
through which the purchase was made.
In this study, we sought to identify different segments of H&M customers by conducting
a series of K-Means Cluster analyses. We examined the variables of total revenue, total
profits, months from last order, and the number of orders placed to identify the highly
profitable customers and frequent shoppers of H&M. This is important for the future
3
catalog business of H&M for a number of reasons. Not only does this research allow for
H&M to discover which customers are most profitable, but it also allows the company to
come up with further marketing implications on how to keep the customers or even get
rid of those they do not feel are beneficial to the company. Throughout this study, the
reader will learn what managerial suggestions we have for H&M to retain valuable
customers and how to maximize profits based on customer segmentations. A few key
findings within this research include separating the segments into groups that are similar
to one another. One group of segments we found should be rewarded to come back and
make more purchases. By turning these new customers into frequent shoppers, H&M can
reward these customers through increased customer satisfaction or better service. For
another identified group of segments, we found that the best approach would be to reward
these consumers when they spend more money using the catalog. For example, H&M can
use the idea of cross promotion to allow customers to buy jeans and a sweatshirt together
for a cheaper price. It is also important for H&M to keep the most profitable customers.
In this case, establishing a loyalty program or offering them top-tier customer service
may allow for higher brand loyalty. The key findings will be discussed in detail in the
report.
In the next section, we will give background information on the report, followed by the
methods used, such as the data, analysis, and results of the study. We will conclude this
4
report with managerial recommendations and a future focus for H&M based on the
results from the study.
Background
The goal for H&M in this study is to understand the segments of their customers that are
highly profitable and the most frequent shoppers. H&M’s general target consumers are
those who are fashionable and stylish, yet looking for affordable prices. Due to their
trendy, quality clothing and reasonable pricing, H&M competes with a number of
fast-fashion stores including Gap, Zara, and Uniqlo. Because of this monopolistic
competition market, there are multiple buyers and sellers in the market. In order to retain
and acquire new consumers, we recommend that H&M follow the suggested managerial
implications in the upcoming sections.
To understand this market, we conducted K-Means Cluster analyses and found seven
optimal clusters. Among them, there were a few key segments that were most profitable,
others that were not as profitable. Based on our findings, we offered suggestions on how
to best handle these segments. After determining the useful variables from our analyses,
which included total revenue, total profit, months from last order, the number of orders
placed, we were able to come up with a few recommendations for H&M. We identified
one segment group of consumers, the most profitable group, which would benefit from
customized service and loyalty programs. We identified another segment group of
5
consumers who were not frequent shoppers. This calls for a different approach when
targeting this group. Maybe they are new customers that H&M needs to turn into repeat
customers. By offering different groups different levels of services, H&M can work to
increase their customer retention and increase profits in the long run.
Our study is meaningful because we help H&M identify highly profitable customers and
frequent shoppers. Why is this useful to H&M? Our results help identify segments of
consumers that would be most beneficial for increasing company profits. Also, we offer
managerial implications for H&M to effectively reach customers. Such managerial
implications can help the company decide to keep or get rid of segments of customers.
Without this study, H&M would have a hard time deciding what appropriate managerial
implications to make when targeting consumers. All consumers are different and should
be treated as such. After reading this study, the executives at H&M will have a better
understanding as to which customers are their most profitable and most frequent shoppers.
Thus, our research will result in efficient and effective marketing strategies for the future.
It is important to understand the usefulness of this research for future marketing
implications and without the identification of these segments, H&M would have a hard
time determining the best strategies to take.
In the following parts, we will explain more details about the variables we chose and
introduce the process of the cluster analyses. Based on the customer segments, we will
6
summarize the key findings and make managerial implications accordingly. Finally,
suggestions of future research are offered after limitation analysis.
Methodology
Variable Selection
In order to identify highly profitable customers and frequent shoppers for H&M, we
collected lots of transactional data from H&M for further studies1. Within this data file,
there are over 226,000 transaction records that represent more than 137,000 orders from
100,000 customers of H&M. Moreover, all transactions recorded in this dataset were
made from Dec 16, 2004 to Sep 17, 2012 at H&M.
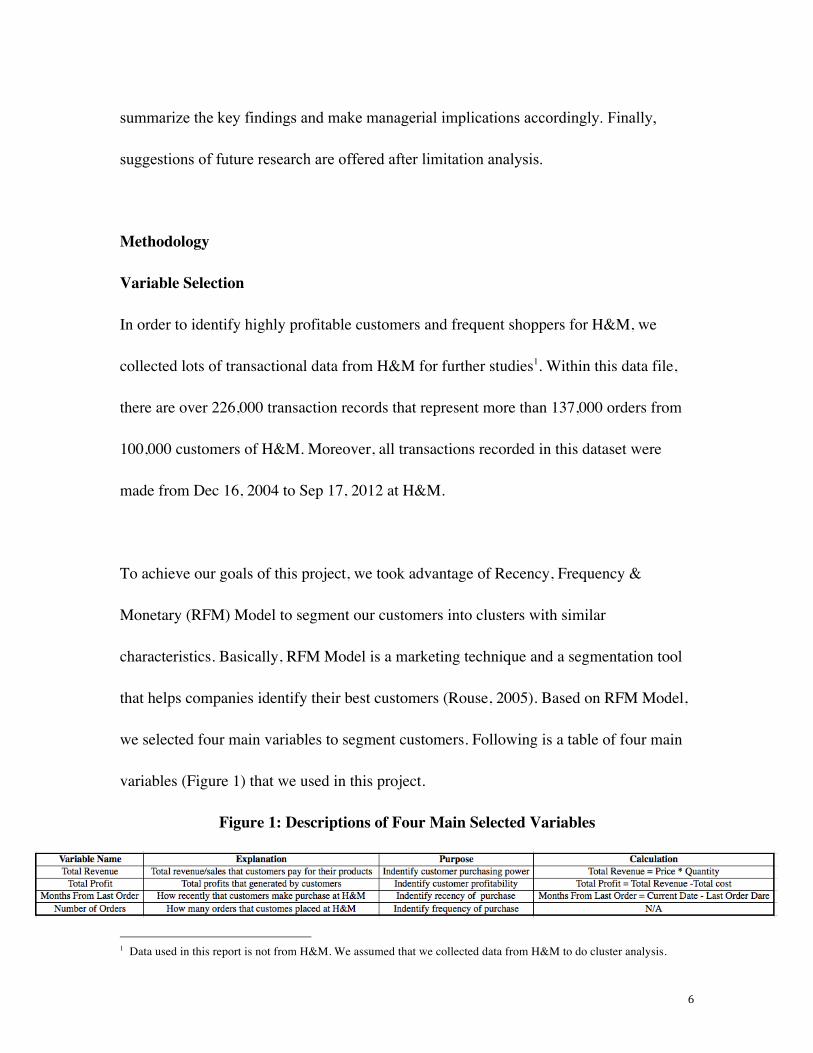
To achieve our goals of this project, we took advantage of Recency, Frequency &
Monetary (RFM) Model to segment our customers into clusters with similar
characteristics. Basically, RFM Model is a marketing technique and a segmentation tool
that helps companies identify their best customers (Rouse, 2005). Based on RFM Model,
we selected four main variables to segment customers. Following is a table of four main
variables (Figure 1) that we used in this project.
Figure 1: Descriptions of Four Main Selected Variables
1 Data used in this report is not from H&M. We assumed that we collected data from H&M to do cluster analysis.
7
According to this RFM Model, the best customers for H&M are those people who made
their purchase recently, who shop at H&M frequently or regularly, and who can generate
huge profits for the company.
Additionally, we included two more variables, Payment Method and Channel of Order
Placement so that we can better understand which payment method were widely used by
H&M customers and their preference of where to place order.
Method
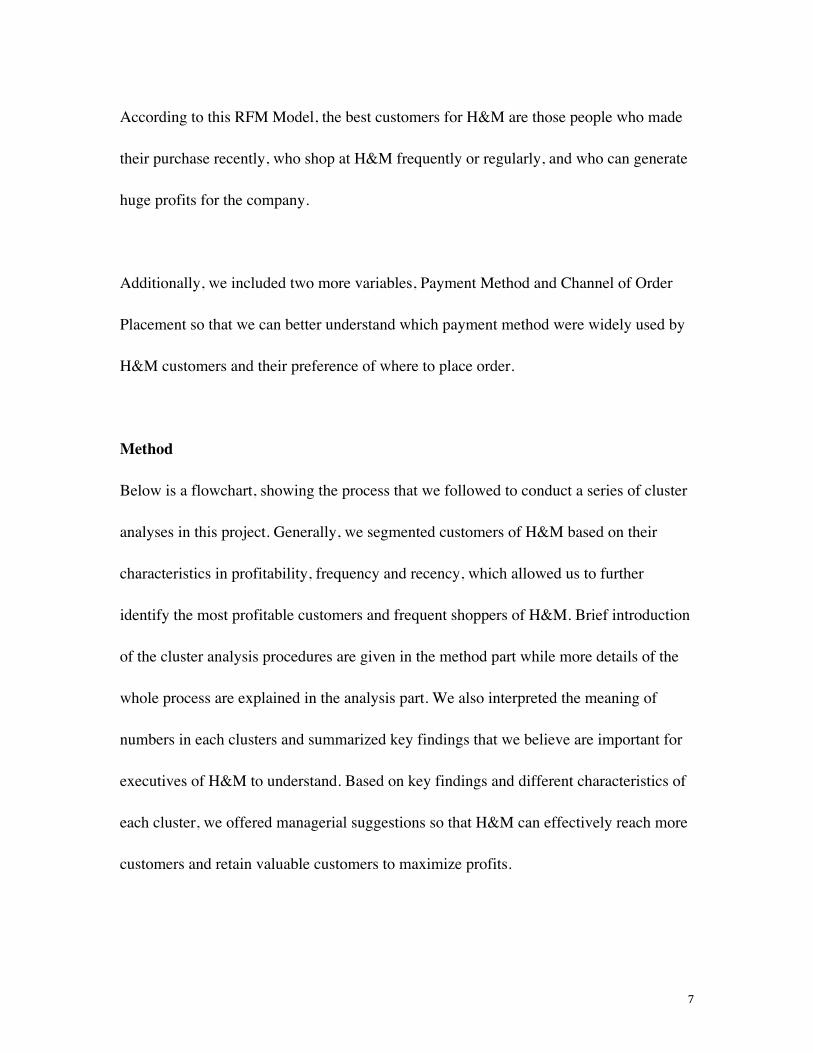
Below is a flowchart, showing the process that we followed to conduct a series of cluster
analyses in this project. Generally, we segmented customers of H&M based on their
characteristics in profitability, frequency and recency, which allowed us to further
identify the most profitable customers and frequent shoppers of H&M. Brief introduction
of the cluster analysis procedures are given in the method part while more details of the
whole process are explained in the analysis part. We also interpreted the meaning of
numbers in each clusters and summarized key findings that we believe are important for
executives of H&M to understand. Based on key findings and different characteristics of
each cluster, we offered managerial suggestions so that H&M can effectively reach more
customers and retain valuable customers to maximize profits.
8
Flowchart of The Cluster Analyses

9
The data we collected from H&M are transactional records that are useless for customer
segmentation. Therefore, we firstly aggregated transactional data into customer data based on
selected variables so that we could continue cluster analysis. Then, we calculated Z-scores for
our four selected variables as a process of data standardization. After that, we randomly split the
data set into a Calibration (60% of entire dataset) and a Validation (40% of entire dataset) sample
so that we could compare results from two independent samples to reduce the chance of missing
important customer clusters and ensure the accuracy of cluster analysis.
To further analyze the Calibration sample, we randomly selected 10% of the Calibration data as a
new small subset to conduct Hierarchical Cluster Analysis. Both Ward’s Method and Furthest
Neighbor Method were used to test which method was more effective in customer segmentations.
We decided to use Ward’s Method because it gave us clusters with similar size while Furthest
Neighbor Method produced too many outliers. In order to detect differences more clearly, we
adopted distance measures of Squared Euclidean to make variances between each customer even
bigger. After conducting several times of Hierarchical Cluster Analysis, we successfully
identified the optimal number of clusters (seven clusters) and created the initial seeds for
K-means Cluster Analysis. We repeated the aforementioned steps of cluster analysis with the 10%
of the Validation sample.
10
To determine whether results of the Calibration and Validation sample were consistent, we
compared the managerial implications of the optimal clusters from those two samples. When
looking into the optimal clusters, we found both Calibration sample and Validation sample had
one group of outliers. Therefore, we just ignored the impact of outliers in comparison of
managerial implications. Since the results from Calibration and Validation samples were
consistent, we conducted K-means Cluster Analysis on the entire data set and the result was
consistent with those of Calibration and Validation samples. Finally, we offered managerial
implications for each cluster based on their characteristics of recency, frequency and
profitability.
Analysis
Variable Identification and Data Aggregation
From the initial transactional data, we were able to determine four main variables that play
influential roles in understanding H&M customers. These factors included the customer’s total
revenue, total profit, months since last order and the number of orders placed. These variables
were critical to segment customers in the cluster analysis. After identifying these variables, we
performed data aggregation. In detail, we put the variable, customer order number, as break
variable, and put those variables and two additional variables (payment method and channels
where customers placed order) as aggregated variables. We outputted the result on a new SPSS
11
chart as a platform where we then performed the cluster analysis process. From there we
transformed these four variables into Z-score variables.
Hierarchical Cluster Analysis of Random Cases of Calibration
We randomly divided the customers data into two sample groups: Calibration and Validation.
We put 60% of population in the Calibration sample and the remaining 40% into the Validation
sample. Next, we randomly selected a 10% sample of the whole population, and selected cases
both in Calibration and 10% population as a new Calibration subset. Then, using Ward’s Method,
we started Hierarchical Cluster Analysis on these selected cases. The reason why we chose
Ward’s Method instead of Furthest Neighbor Method is mainly because there were too many
outliers in the outputs with Furthest Neighbor Method that influence our further analysis. Also,
we hope to segment customers into groups with similar size to make sure that most clusters are
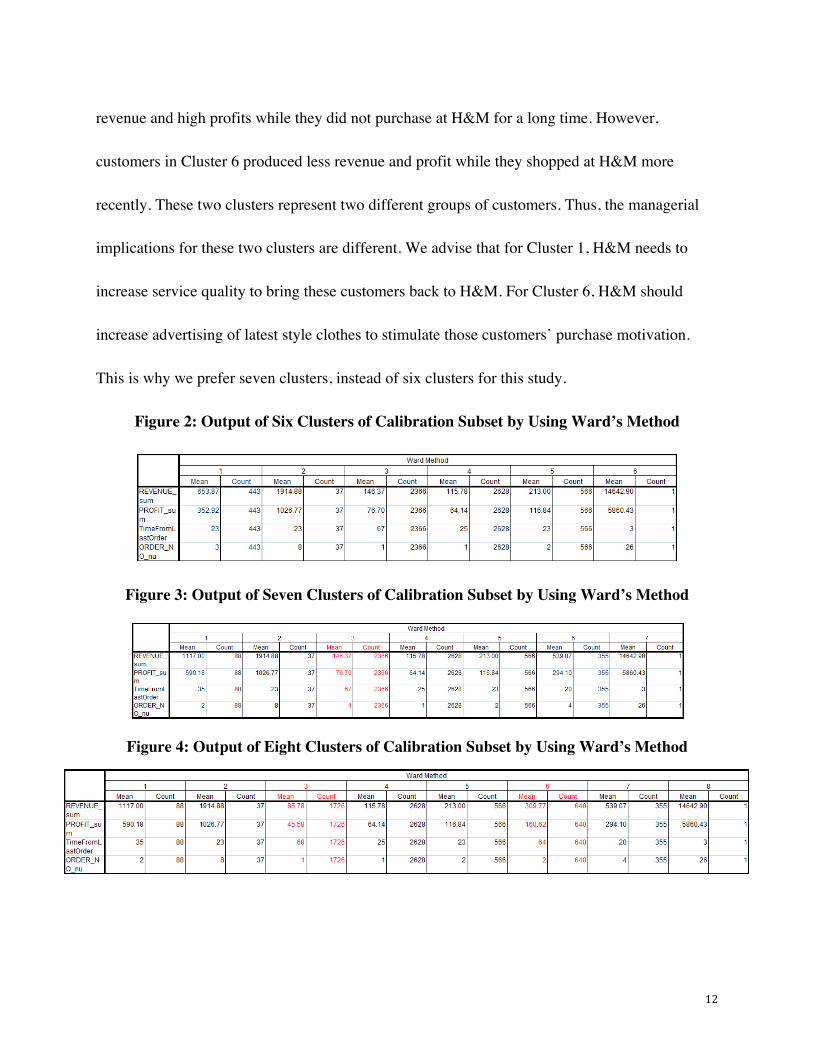
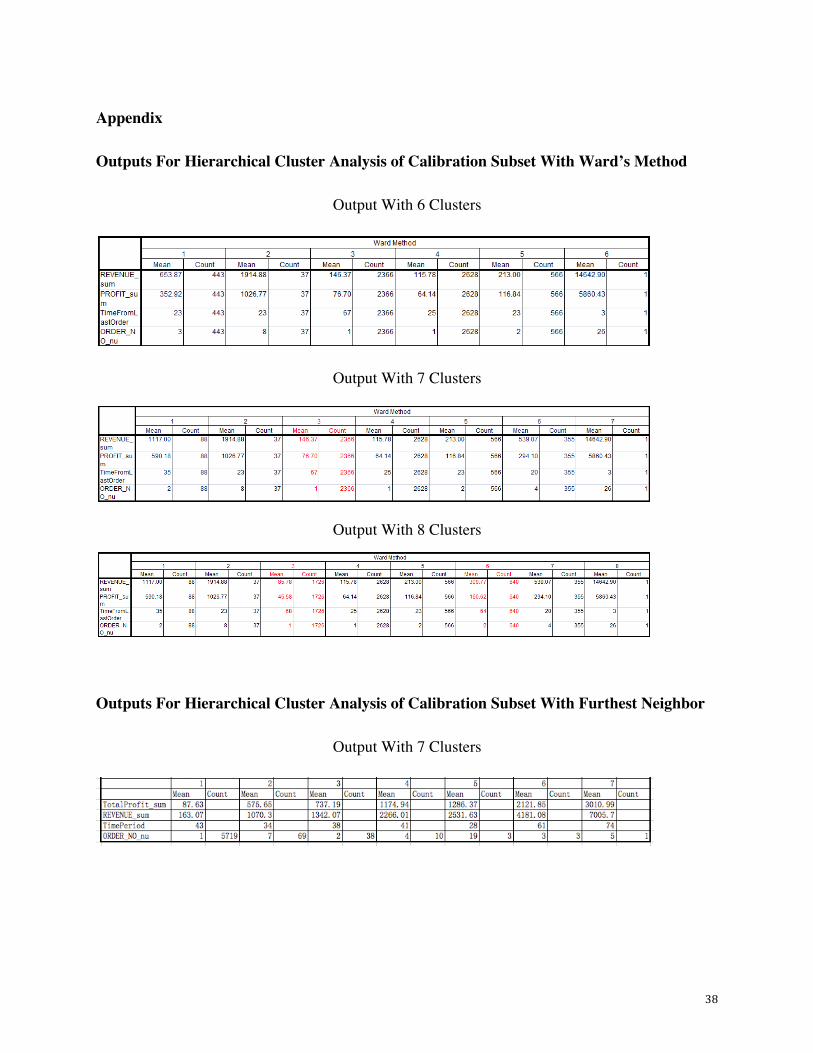
meaningful in our study. Figure 2, 3 & 4 are the three outputs of Hierarchical Cluster Analysis
on selected cases of Calibration. We believe seven clusters (Figure 3) are the optimal numbers as
our target output.
Why We Chose Seven Clusters?
Based on Figure 2, we find that Cluster 1 is divided into two clusters (Cluster 1 and Cluster 6 in
Figure 3). We believe seven clusters are better than six clusters because the Cluster 1 and Cluster
6 in Figure 2 are very different from each other. Customers in Cluster 1 generated relatively high
12
revenue and high profits while they did not purchase at H&M for a long time. However,
customers in Cluster 6 produced less revenue and profit while they shopped at H&M more
recently. These two clusters represent two different groups of customers. Thus, the managerial
implications for these two clusters are different. We advise that for Cluster 1, H&M needs to
increase service quality to bring these customers back to H&M. For Cluster 6, H&M should
increase advertising of latest style clothes to stimulate those customers’ purchase motivation.
This is why we prefer seven clusters, instead of six clusters for this study.
Figure 2: Output of Six Clusters of Calibration Subset by Using Ward’s Method
Figure 3: Output of Seven Clusters of Calibration Subset by Using Ward’s Method
Figure 4: Output of Eight Clusters of Calibration Subset by Using Ward’s Method
13
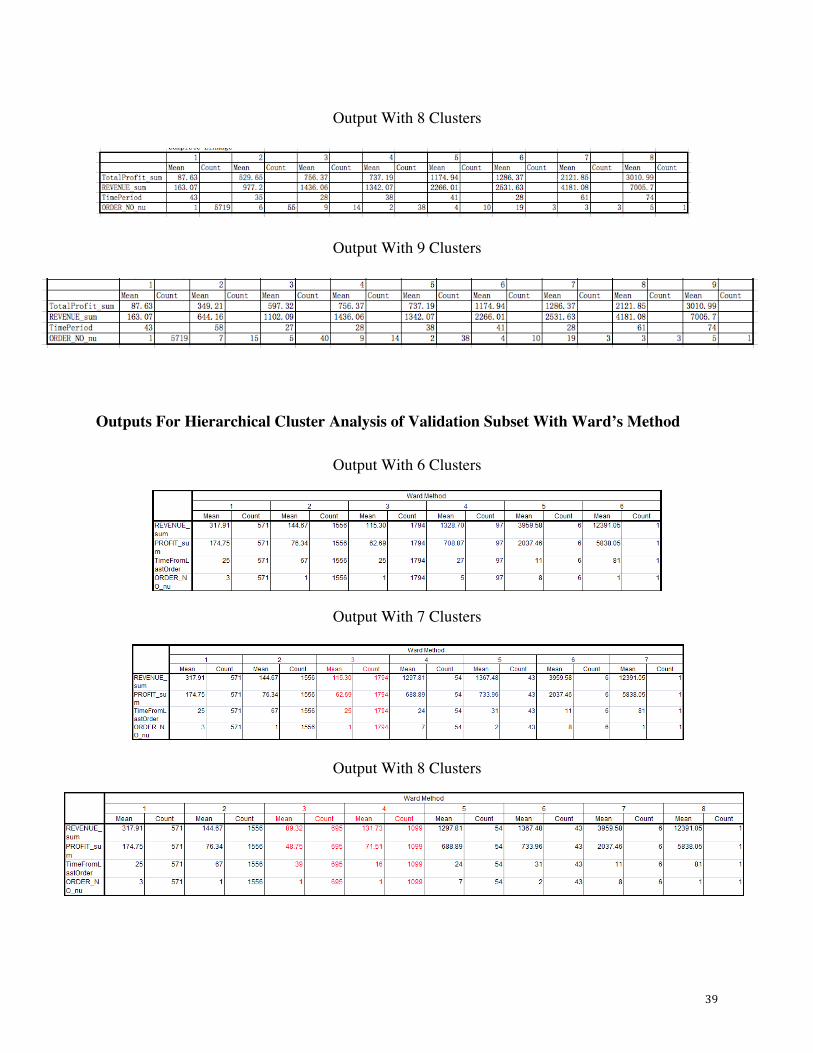
We also find that Cluster 3 in Figure 3 is divided into two clusters (Cluster 3 and Cluster 6 in
Figure 4). We consider that seven cluster is still better than eight clusters as there is no
significant difference between Cluster 3 and Cluster 6 in Figure 4. Customers in these two
clusters all created relatively low revenue and profit. According to their low recency and
frequency, they might have already left H&M and shop at other fast-fashion companies, such as
Zara or Uniqlo. The managerial implications for these two clusters are same. H&M has to make
them frequent shoppers, such as sending out coupons, advertising emails or discounts. As a result,
we insist that seven clusters are optimal numbers of clusters.
K-means Cluster Analysis of Calibration
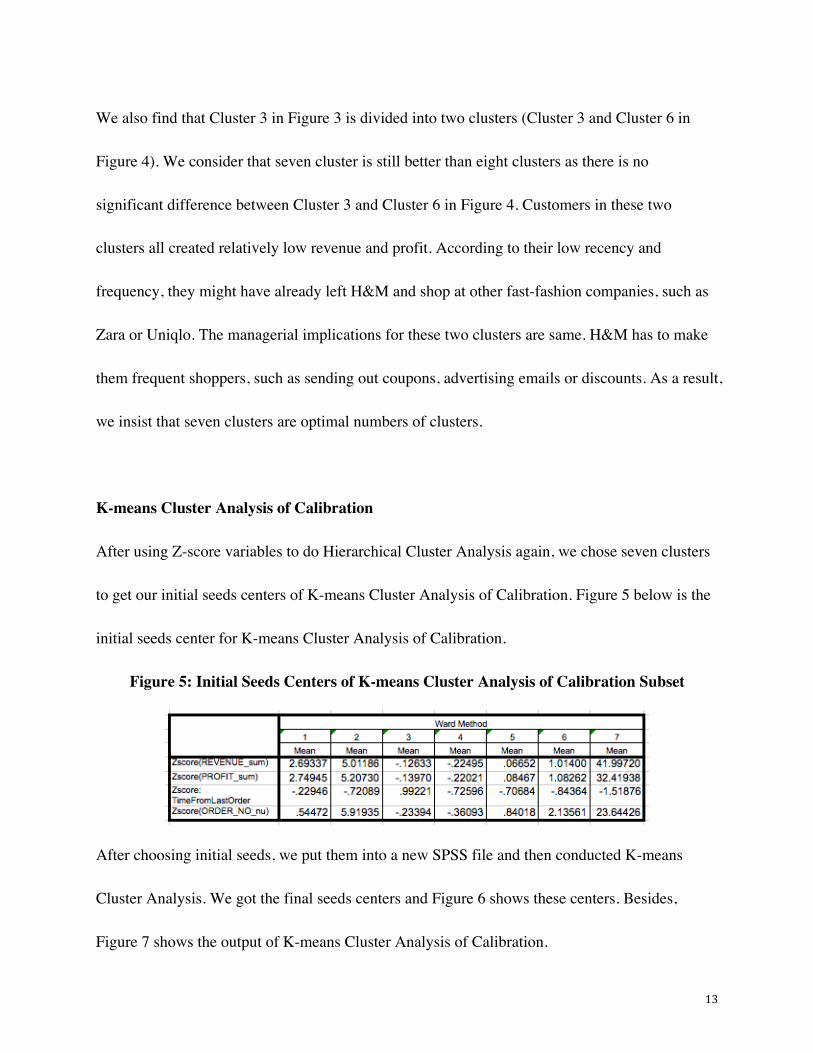
After using Z-score variables to do Hierarchical Cluster Analysis again, we chose seven clusters
to get our initial seeds centers of K-means Cluster Analysis of Calibration. Figure 5 below is the
initial seeds center for K-means Cluster Analysis of Calibration.
Figure 5: Initial Seeds Centers of K-means Cluster Analysis of Calibration Subset
After choosing initial seeds, we put them into a new SPSS file and then conducted K-means
Cluster Analysis. We got the final seeds centers and Figure 6 shows these centers. Besides,
Figure 7 shows the output of K-means Cluster Analysis of Calibration.
14
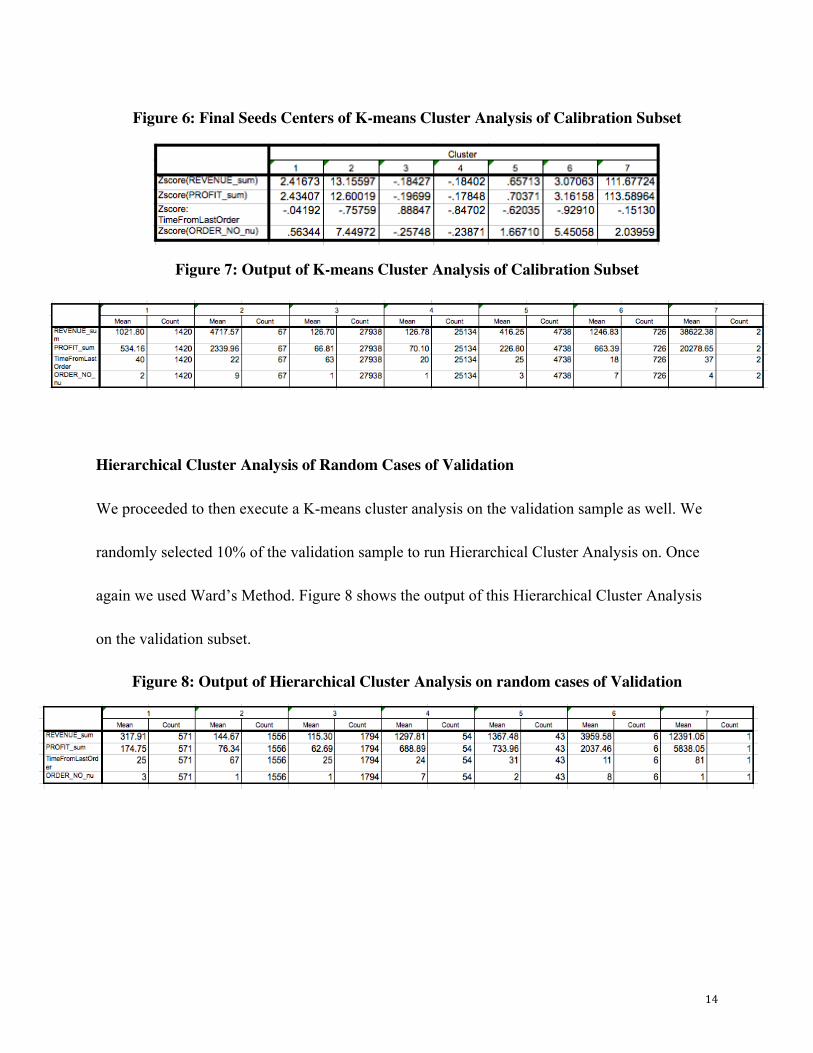
Figure 6: Final Seeds Centers of K-means Cluster Analysis of Calibration Subset
Figure 7: Output of K-means Cluster Analysis of Calibration Subset
Hierarchical Cluster Analysis of Random Cases of Validation
We proceeded to then execute a K-means cluster analysis on the validation sample as well. We
randomly selected 10% of the validation sample to run Hierarchical Cluster Analysis on. Once
again we used Ward’s Method. Figure 8 shows the output of this Hierarchical Cluster Analysis
on the validation subset.
Figure 8: Output of Hierarchical Cluster Analysis on random cases of Validation
15
K-means Cluster Analysis of Validation
We used Z-score variables to do Hierarchical Cluster Analysis again and chose the same number
of initial seeds, seven, as we did in the earlier analysis. Once we determined the initial centers,
we were able to perform the K-means Cluster Analysis on the Validation sample. Figure 9 shows
the initial seeds centers of K-means Cluster Analysis of Validation.
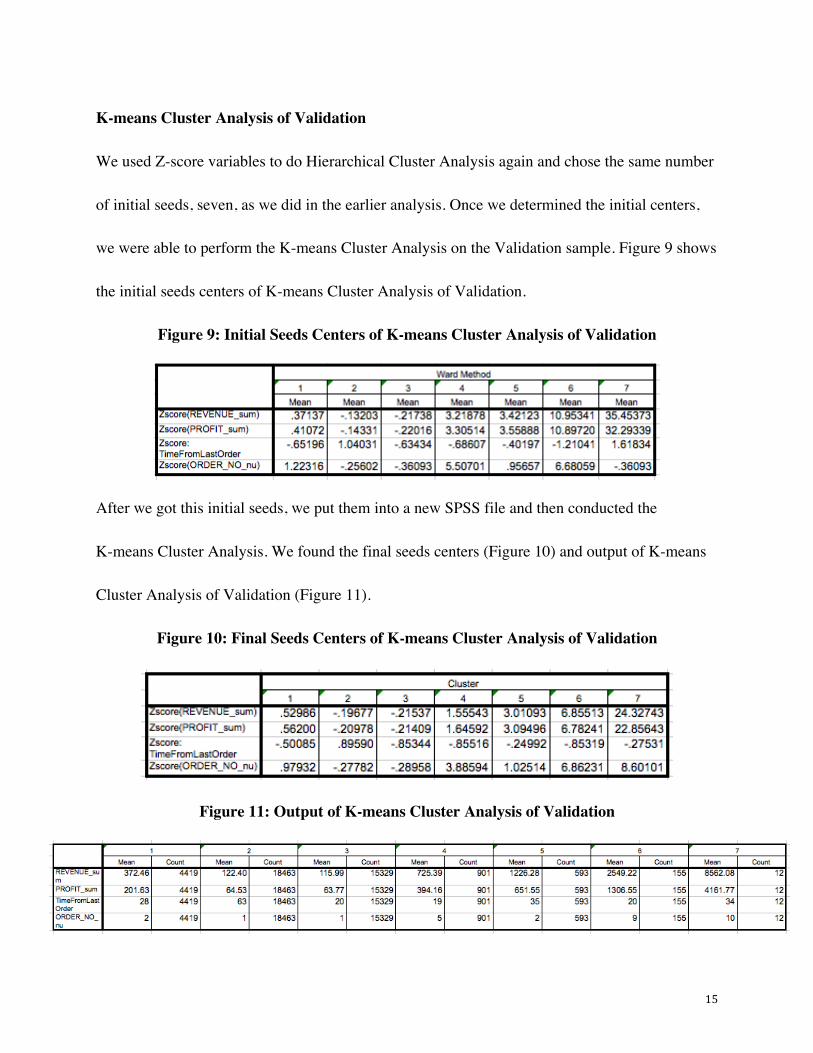
Figure 9: Initial Seeds Centers of K-means Cluster Analysis of Validation
After we got this initial seeds, we put them into a new SPSS file and then conducted the
K-means Cluster Analysis. We found the final seeds centers (Figure 10) and output of K-means
Cluster Analysis of Validation (Figure 11).
Figure 10: Final Seeds Centers of K-means Cluster Analysis of Validation
Figure 11: Output of K-means Cluster Analysis of Validation
16
Compare K-means Cluster Analysis Results of Calibration and Validation Samples
When we found the K-means Cluster Analysis results of Calibration and Validation sample, we
compared these two results and wanted to figure out whether or not the managerial implications
are similar. If managerial implications are similar, then we could continue to do K-means Cluster
Analysis for the whole data set. However, if managerial implications are completely different,
then we have to go back to check previous steps, find any mistakes, and repeat the process again.
Compare Outputs of Calibration and Validation Subsets
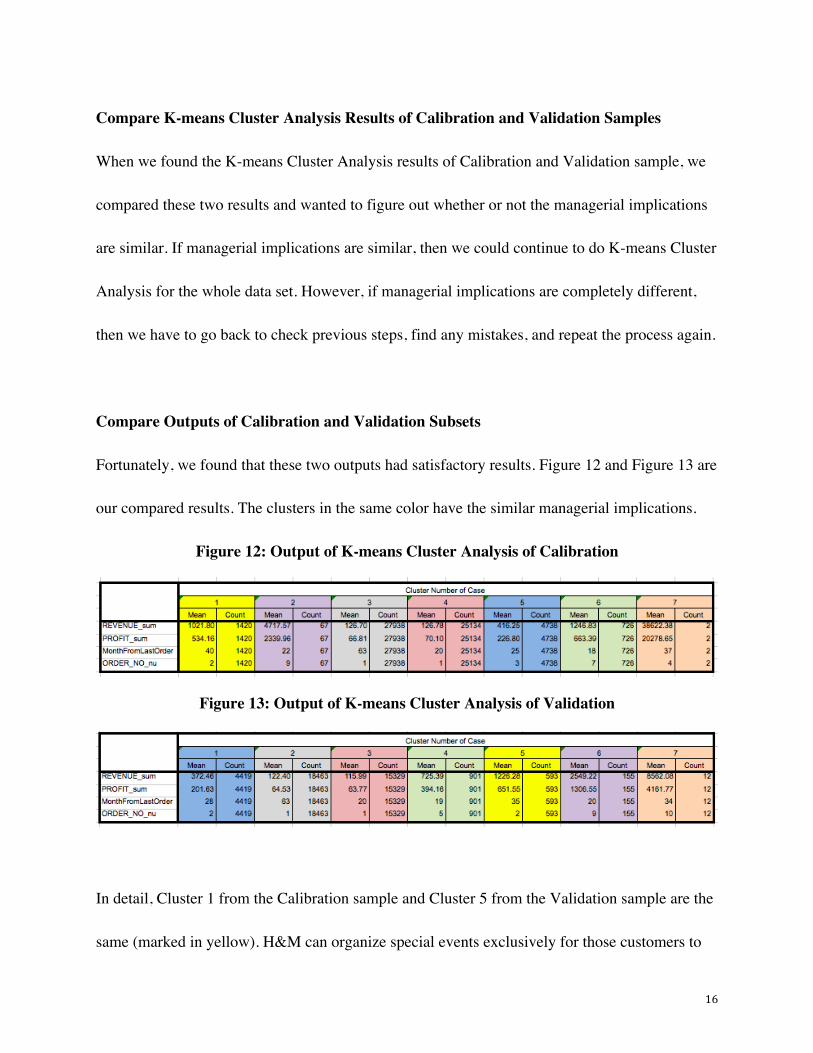
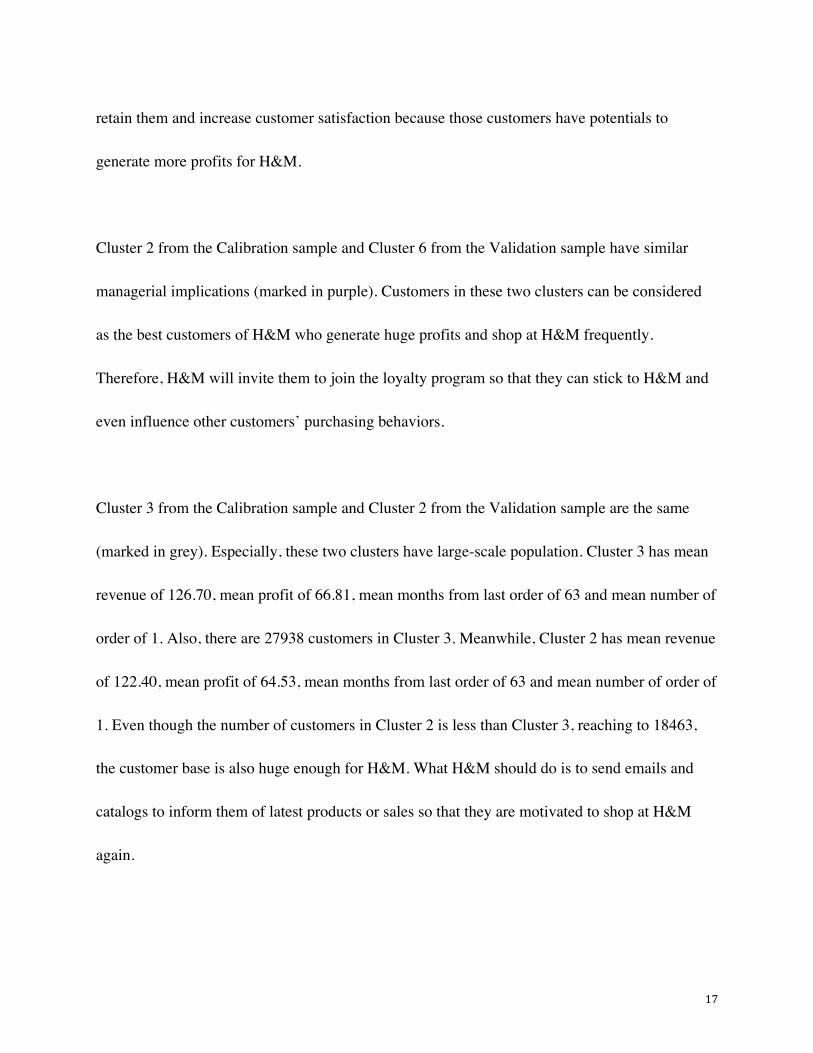
Fortunately, we found that these two outputs had satisfactory results. Figure 12 and Figure 13 are
our compared results. The clusters in the same color have the similar managerial implications.
Figure 12: Output of K-means Cluster Analysis of Calibration
Figure 13: Output of K-means Cluster Analysis of Validation
In detail, Cluster 1 from the Calibration sample and Cluster 5 from the Validation sample are the
same (marked in yellow). H&M can organize special events exclusively for those customers to
17
retain them and increase customer satisfaction because those customers have potentials to
generate more profits for H&M.
Cluster 2 from the Calibration sample and Cluster 6 from the Validation sample have similar
managerial implications (marked in purple). Customers in these two clusters can be considered
as the best customers of H&M who generate huge profits and shop at H&M frequently.
Therefore, H&M will invite them to join the loyalty program so that they can stick to H&M and
even influence other customers’ purchasing behaviors.
Cluster 3 from the Calibration sample and Cluster 2 from the Validation sample are the same
(marked in grey). Especially, these two clusters have large-scale population. Cluster 3 has mean
revenue of 126.70, mean profit of 66.81, mean months from last order of 63 and mean number of
order of 1. Also, there are 27938 customers in Cluster 3. Meanwhile, Cluster 2 has mean revenue
of 122.40, mean profit of 64.53, mean months from last order of 63 and mean number of order of
1. Even though the number of customers in Cluster 2 is less than Cluster 3, reaching to 18463,
the customer base is also huge enough for H&M. What H&M should do is to send emails and
catalogs to inform them of latest products or sales so that they are motivated to shop at H&M
again.
18
Cluster 4 from the Calibration sample and Cluster 3 from the Validation sample are the same
(marked in pink). Probably, they are new customers of H&M who shopped once but did not
make purchase recently at H&M. In order to attract those customers, H&M can promote the
membership cards to them and make them loyal customers.
H&M can use same market strategies to Cluster 5 from the Calibration sample and Cluster 1
from the Validation sample (marked in blue). For example, those customers should be rewarded
to spend more at H&M and they can get cash back on every dollar they spend at H&M.
For Cluster 6 from the Calibration sample and Cluster 4 from the Validation sample (marked in
green) who are all frequent shoppers of H&M, they will get coupons and special offers in their
birthday months.
Apparently, Cluster 7 from the Calibration sample and Cluster 7 from the Validation sample are
outliers in this project (marked in beige). Thus, we will ignore these two groups when comparing
the consistency of the Calibration and Validation samples since they have little impact on
H&M’s marketing strategies.
19
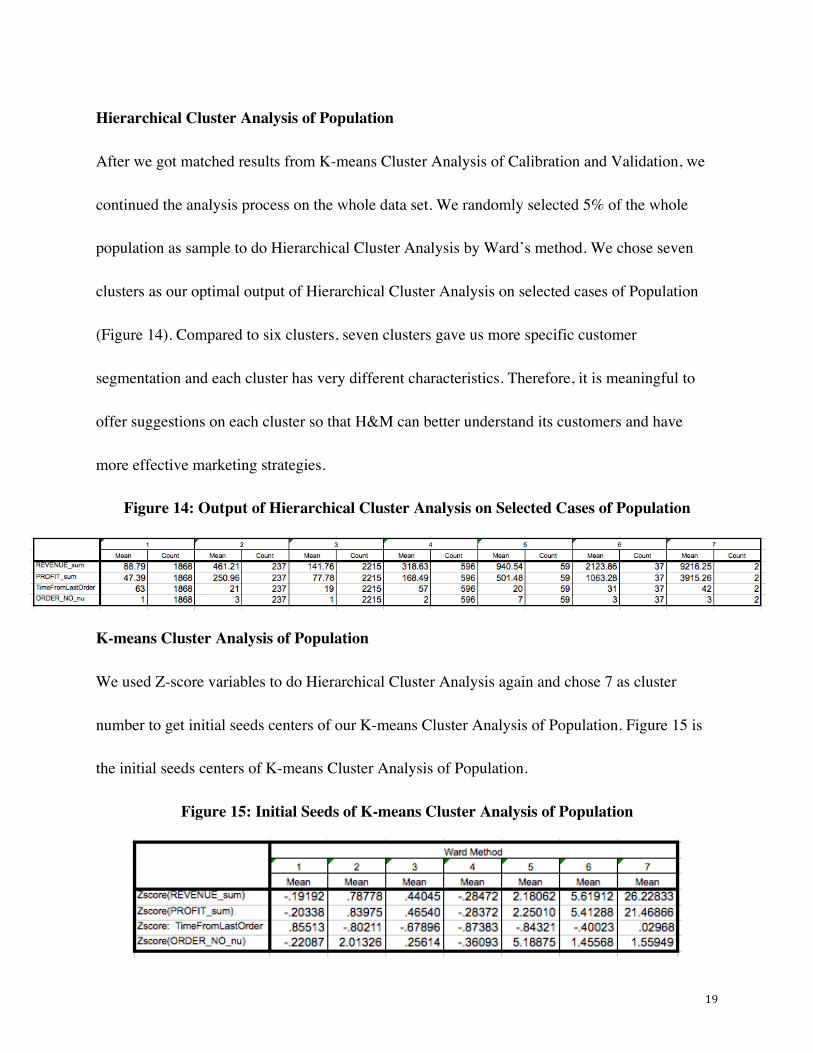
Hierarchical Cluster Analysis of Population
After we got matched results from K-means Cluster Analysis of Calibration and Validation, we
continued the analysis process on the whole data set. We randomly selected 5% of the whole
population as sample to do Hierarchical Cluster Analysis by Ward’s method. We chose seven
clusters as our optimal output of Hierarchical Cluster Analysis on selected cases of Population
(Figure 14). Compared to six clusters, seven clusters gave us more specific customer
segmentation and each cluster has very different characteristics. Therefore, it is meaningful to
offer suggestions on each cluster so that H&M can better understand its customers and have
more effective marketing strategies.
Figure 14: Output of Hierarchical Cluster Analysis on Selected Cases of Population
K-means Cluster Analysis of Population
We used Z-score variables to do Hierarchical Cluster Analysis again and chose 7 as cluster
number to get initial seeds centers of our K-means Cluster Analysis of Population. Figure 15 is
the initial seeds centers of K-means Cluster Analysis of Population.
Figure 15: Initial Seeds of K-means Cluster Analysis of Population
20
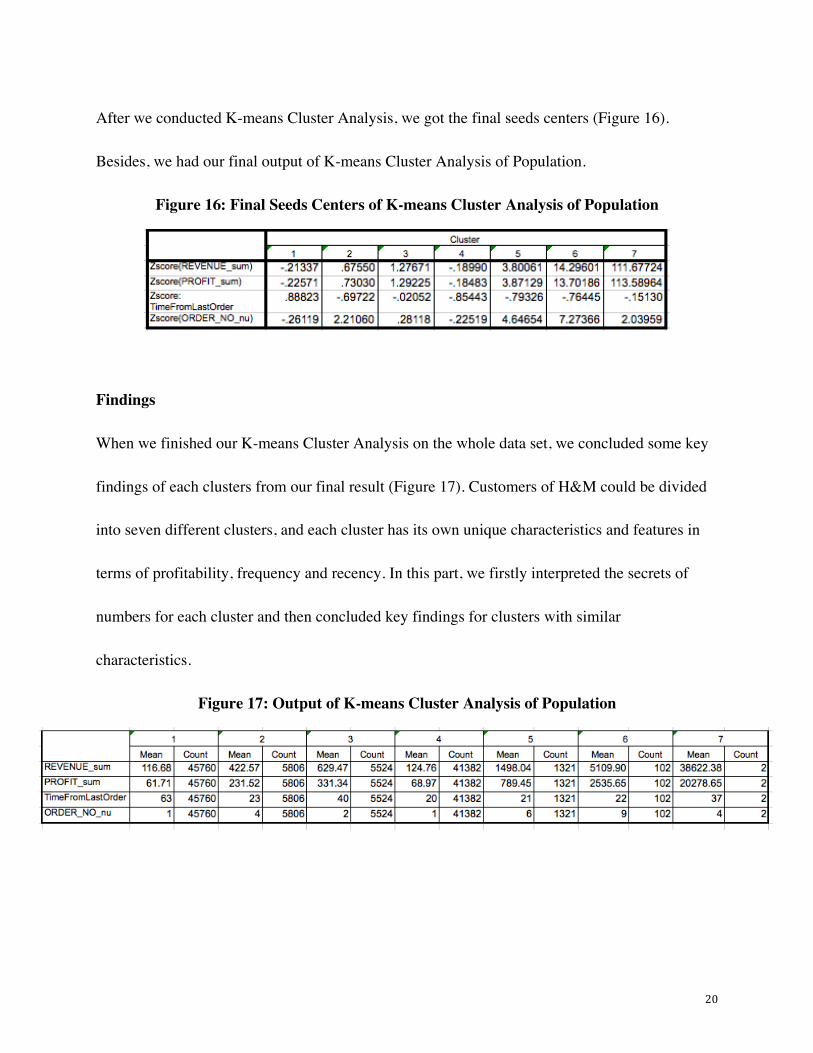
After we conducted K-means Cluster Analysis, we got the final seeds centers (Figure 16).
Besides, we had our final output of K-means Cluster Analysis of Population.
Figure 16: Final Seeds Centers of K-means Cluster Analysis of Population
Findings
When we finished our K-means Cluster Analysis on the whole data set, we concluded some key
findings of each clusters from our final result (Figure 17). Customers of H&M could be divided
into seven different clusters, and each cluster has its own unique characteristics and features in
terms of profitability, frequency and recency. In this part, we firstly interpreted the secrets of
numbers for each cluster and then concluded key findings for clusters with similar
characteristics.
Figure 17: Output of K-means Cluster Analysis of Population

21
In detail, Cluster 1 has the largest scale of customers among all seven clusters. These 45760
customers create an average of 116.68 for revenue and 61.71 for profits. Besides, their mean
months from the last order are 63 months and placed only 1 order on average.
The size of customers is not very big in cluster 2 with the number of 5524 customers. These
customers create 422.57 revenue and 231.52 profits on average. Besides, their mean months
from the last order are 23 months and mean the number of orders is 4.
For customers in cluster 3, the number of these customers is 5806. These customers average
create 629.47 for revenue and 331.34 for profits. Besides, their mean months from last order are
40 months and mean the number of orders is 2.
Cluster 4 is the second largest group among seven clusters. It has 41382 customers who generate
the average amount of 124.76 in revenue and 68.97 in profits. Moreover, their mean months
from last order is 20 months and also placed only 1 order.
For customers in cluster 5, the number of these customers is 1321. These customers average
create 1498.04 for revenue and 789.45 for profit. Besides, their mean months from last order are
21 months and the mean number of orders is 6.
22
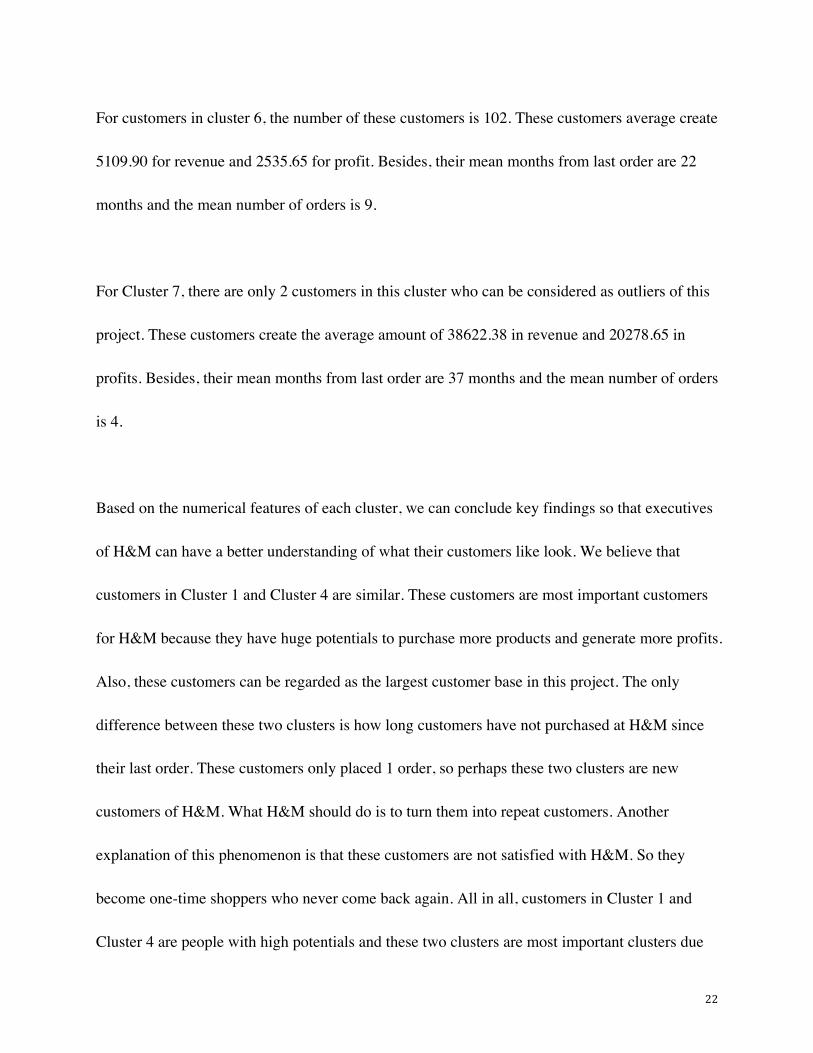
For customers in cluster 6, the number of these customers is 102. These customers average create
5109.90 for revenue and 2535.65 for profit. Besides, their mean months from last order are 22
months and the mean number of orders is 9.
For Cluster 7, there are only 2 customers in this cluster who can be considered as outliers of this
project. These customers create the average amount of 38622.38 in revenue and 20278.65 in
profits. Besides, their mean months from last order are 37 months and the mean number of orders
is 4.
Based on the numerical features of each cluster, we can conclude key findings so that executives
of H&M can have a better understanding of what their customers like look. We believe that
customers in Cluster 1 and Cluster 4 are similar. These customers are most important customers
for H&M because they have huge potentials to purchase more products and generate more profits.
Also, these customers can be regarded as the largest customer base in this project. The only
difference between these two clusters is how long customers have not purchased at H&M since
their last order. These customers only placed 1 order, so perhaps these two clusters are new
customers of H&M. What H&M should do is to turn them into repeat customers. Another
explanation of this phenomenon is that these customers are not satisfied with H&M. So they
become one-time shoppers who never come back again. All in all, customers in Cluster 1 and
Cluster 4 are people with high potentials and these two clusters are most important clusters due
23
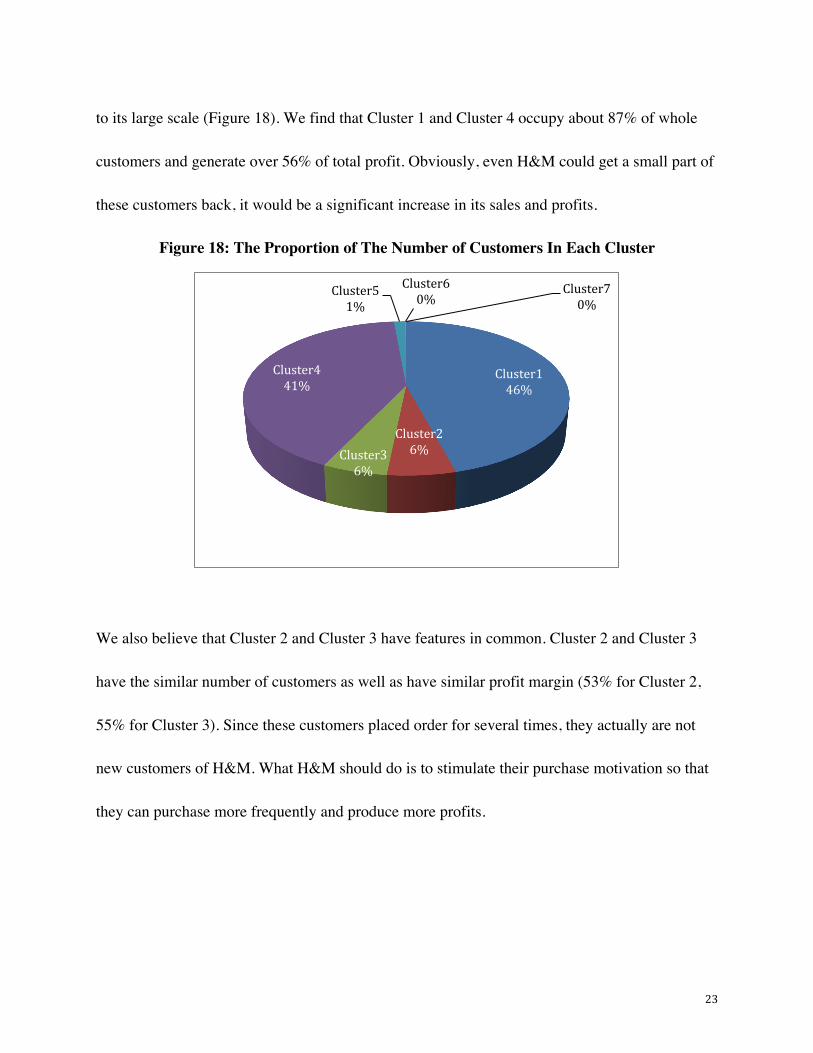
to its large scale (Figure 18). We find that Cluster 1 and Cluster 4 occupy about 87% of whole
customers and generate over 56% of total profit. Obviously, even H&M could get a small part of
these customers back, it would be a significant increase in its sales and profits.
Figure 18: The Proportion of The Number of Customers In Each Cluster
We also believe that Cluster 2 and Cluster 3 have features in common. Cluster 2 and Cluster 3
have the similar number of customers as well as have similar profit margin (53% for Cluster 2,
55% for Cluster 3). Since these customers placed order for several times, they actually are not
new customers of H&M. What H&M should do is to stimulate their purchase motivation so that
they can purchase more frequently and produce more profits.
Cluster146%
Cluster26%Cluster3
6%
Cluster441%
Cluster51%
Cluster60%
Cluster70%
24
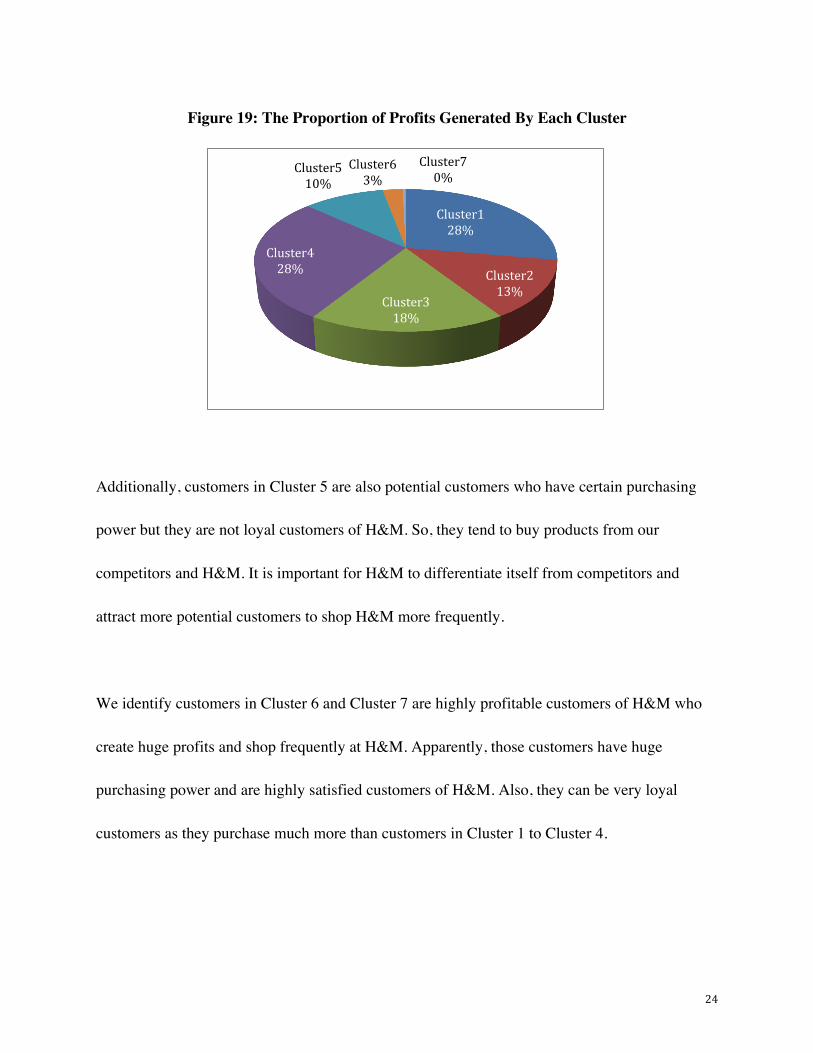
Figure 19: The Proportion of Profits Generated By Each Cluster
Additionally, customers in Cluster 5 are also potential customers who have certain purchasing
power but they are not loyal customers of H&M. So, they tend to buy products from our
competitors and H&M. It is important for H&M to differentiate itself from competitors and
attract more potential customers to shop H&M more frequently.
We identify customers in Cluster 6 and Cluster 7 are highly profitable customers of H&M who
create huge profits and shop frequently at H&M. Apparently, those customers have huge
purchasing power and are highly satisfied customers of H&M. Also, they can be very loyal
customers as they purchase much more than customers in Cluster 1 to Cluster 4.
Cluster128%
Cluster213%
Cluster318%
Cluster428%
Cluster510%
Cluster63%
Cluster70%
25
Managerial Implications
Based on key findings from the final result of K-means Cluster Analysis of the whole data set,
we would like to offer some managerial implications for each cluster. As Cluster 1 and Cluster 4
have similar characteristics, we have the same managerial implication for these two clusters. In
detail, we suggest that H&M should reward these customers to come back and spend more since
they have high potentials in purchasing. For example, H&M can establish the membership
program and invite these customers to become a member of H&M. Also, H&M should provide
discounts, such as 10% off for the entire store, for their first purchase after joining the
membership program. H&M can send emails to their members to inform them of latest events in
H&M. Furthermore, H&M should focus on improving the quality of its customer service. It
should include some unique services, such as return period extension so as to increase customer
satisfaction.
For customers in Cluster 2 and Cluster 3, we believe that H&M should attract and motivate these
customers to become frequent shoppers. In other words, H&M could provide promotions for
these customers to purchase more products. There are three promotional ideas we designed for
H&M to reach these customers. Initially, H&M should take advantage of the cross-promotion
strategy to encourage customers to spend more. For example, if customers buy jeans and
sweatshirts together, they only have to pay $90 while the actual price for those two would be
$120. Secondly, H&M can offer a money-back policy for those customers. For example,
26
customers can get 5% of their purchase money back to their membership accounts. The money in
membership accounts could be used for next purchase in all H&M stores. Thirdly, H&M will
provide 10% off if customers purchase more than $200 per order.
For Cluster 5, H&M must transform those capricious customers into loyal customers who prefer
H&M to other fast-fashion companies. A good way to increase customer loyalty is to create
strong connections with those customers. For instance, H&M can form online communities on
different social media so that customers can share feedback and ideas on products and service.
Also, H&M can hire famous fashion bloggers to write reviews for its products, which create
more channels for these customers to follow H&M.
Customers in Cluster 6 and Cluster 7 are highly profitable customers of H&M. In order to retain
these best customers, H&M should firstly establish the loyalty program to keep these profitable
customers to stick to H&M. Additionally, we recommend that H&M should interact with these
customers frequently and notice them with the latest news, such as sending emails to inform
them of new arrivals, best selling products, so that these customers have more motivation to
continuously purchase at H&M. Most valuable customers deserve best services. Therefore,
H&M could provide personalized service to maintain high customer satisfaction and customer
engagement. Customers who have high customer engagement are willing to refer new customers
to H&M and influence others’ purchasing experience at H&M.
27
Post-Hoc Analysis
After we get the optimal clusters from the final K-means Cluster Analysis, we performed the
Crosstabs Analysis on payment method and channel through which customers placed orders. We
believe the Post-Hoc analysis can help H&M better understand customers’ preferences of
payment methods and channels for their purchase.
Channel Analysis
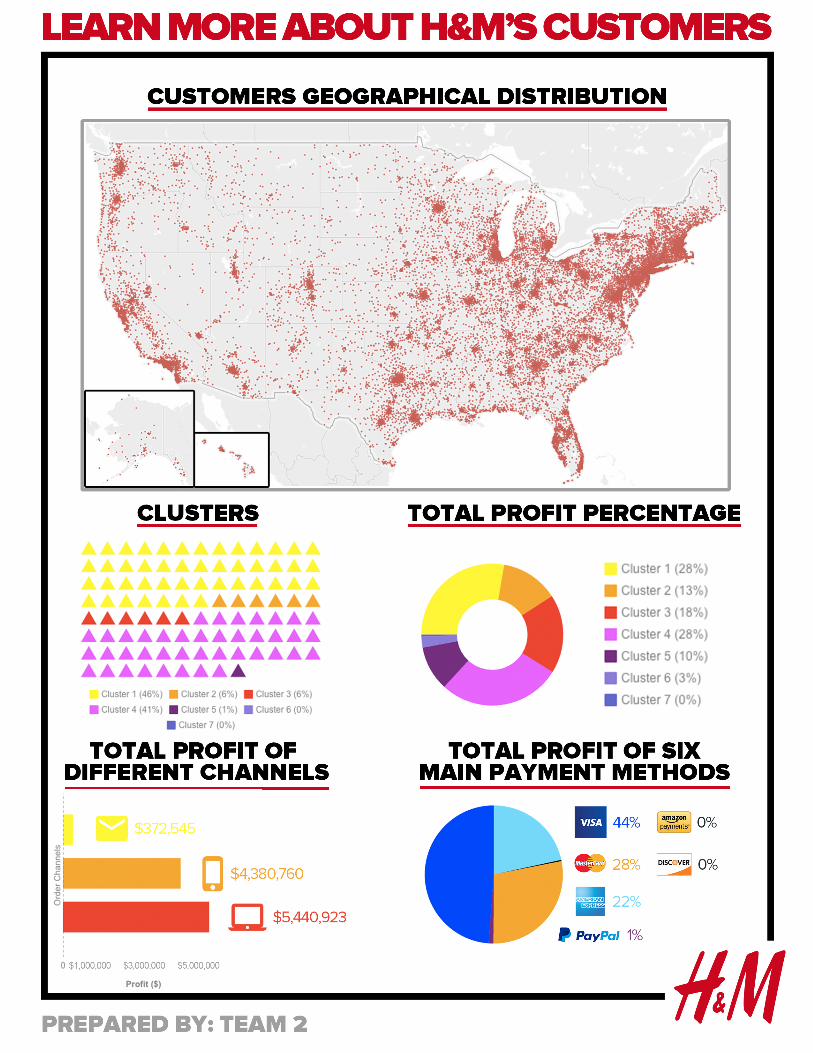
Based on the Figure 20, we find that the most popular channel through which customers tend to
place orders is web. If looking into the preferences of customers in different clusters, we notice
that group with different characteristics have different preferences for shopping channels. For
example, customers in Cluster 1 and Cluster 4 rely heavily on websites to make purchase. Since
we identify them as valuable customers with huge growth potentials, H&M can offer coupons on
their website to motivate these customers to spend more. Simultaneously, customers in Cluster 6
and 7 are highly profitable customers of H&M and they prefer to place orders on mobile Apps. It
is important for H&M to improve the design and functions of its mobile App so that customers
can have better shopping experiences via App. In addition, H&M can train its employees to
enhance service quality of live chat on website and mobile Apps to increase customer
satisfaction.
28
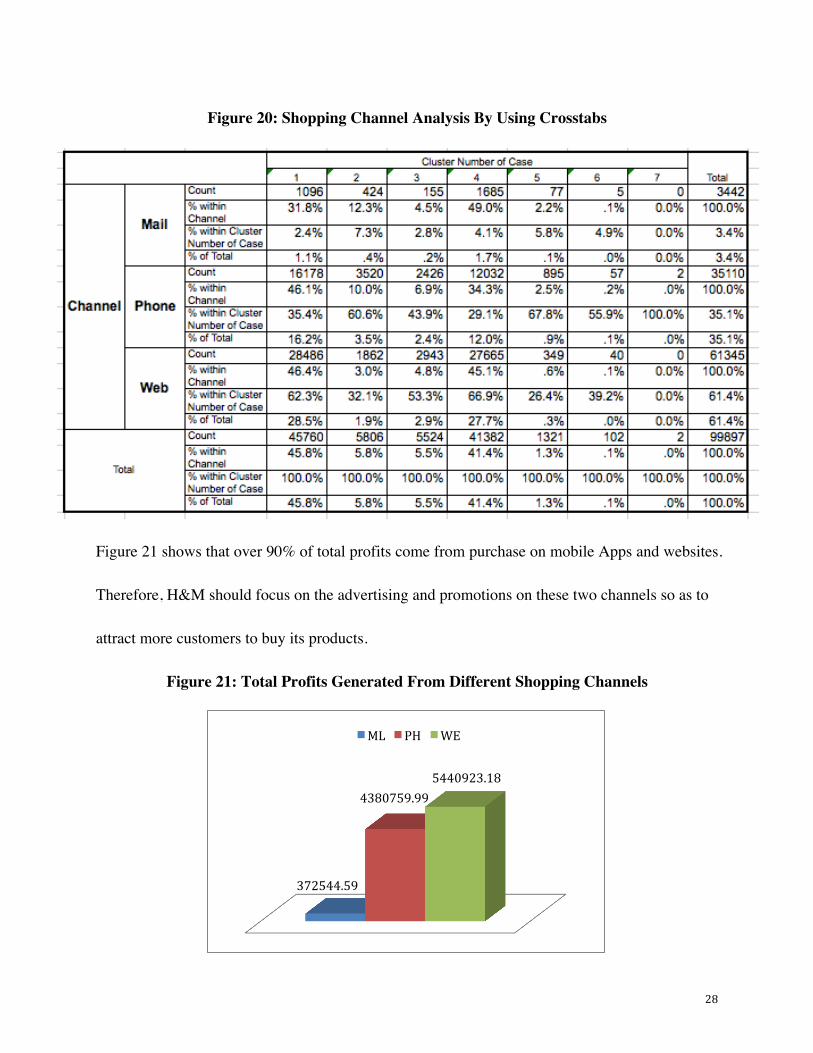
Figure 20: Shopping Channel Analysis By Using Crosstabs
Figure 21 shows that over 90% of total profits come from purchase on mobile Apps and websites.
Therefore, H&M should focus on the advertising and promotions on these two channels so as to
attract more customers to buy its products.
Figure 21: Total Profits Generated From Different Shopping Channels
372544.59
4380759.995440923.18
ML PH WE
29
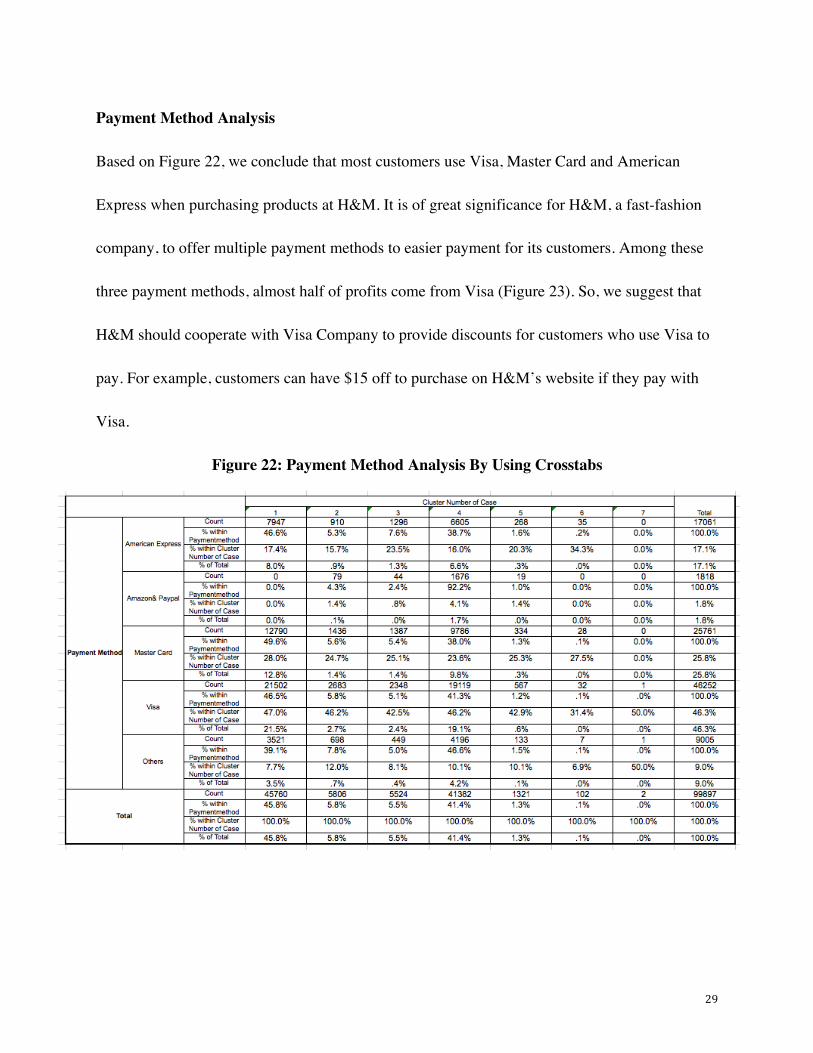
Payment Method Analysis
Based on Figure 22, we conclude that most customers use Visa, Master Card and American
Express when purchasing products at H&M. It is of great significance for H&M, a fast-fashion
company, to offer multiple payment methods to easier payment for its customers. Among these
three payment methods, almost half of profits come from Visa (Figure 23). So, we suggest that
H&M should cooperate with Visa Company to provide discounts for customers who use Visa to
pay. For example, customers can have $15 off to purchase on H&M’s website if they pay with
Visa.
Figure 22: Payment Method Analysis By Using Crosstabs

30
Figure 23: Total Profits Generated From Different Payment Methods
Conclusion
Through this research we were able to discover many interesting findings about H&M’s
customers. The first, and perhaps most important, finding about their customers is that just over
eighty seven thousand of them (about 88% of their total customers) have very similar buying
patterns. These customers have similar traits such as the average amount of revenue they brought
to H&M as well as the average months since last order is also over one and a half years. Perhaps
the most startling characteristic about this group is that the average number of orders for all of
these customers is one. This means that nearly 88% of H&M’s customers only order from H&M
once. This is a very telling sign of the average H&M customer. Even though these customers
shop at H&M so little, they still generate over ten million dollars of revenue for the company.
These customers have value and increasing the value of these customers will be a much more
cost effective way for H&M to increase sales rather than increasing their number of customers.
1999336.81
26204.52854.82
2610028.87
103845.84
4515507.53
AX AZ DC MC PY VI
31
H&M already has information on these current customers and now must use that information to
market their products at their target customers. The objective for these customers is clear and that
is to turn them into more frequent H&M shoppers. The first thing you notice about this group of
customers is the large size of it. Meaning that even if only a small percentage of customers
become repeat customers for H&M, for example 10%, this will still provide a huge sales increase
of nearly nine thousand more customers for H&M. To encourage these customers to become
repeat customers, H&M should develop a membership promotion for their customers. This
membership would be available to the customer for a set fee, then with their membership they
would be entitled to store discounts on the products they buy. A customer who joins the H&M
membership program will be much more likely to shop at their stores on a more frequent basis.
The second most influential group of customers for H&M is also the second largest group of
customers with over eleven thousand customers. These customers are responsible for almost six
million dollars in revenue and have had multiple orders from H&M before. H&M should reward
these customers for spending more than their other groups of customers. One way to reward
these customers for more spending is a deal where the percentage discounted from their order
correlates with the total amount of their order. For example, if a customer spends two hundred
and fifty dollars then they will receive twenty five percent off on their order or if they spend
three hundred dollars they receive thirty percent off. These deals would encourage more
32
spending at H&M every visit and could increase the average revenue for each of these
customers.
The final group of customers we determined to have potential for increased growth is defined as
follows. These customers bring an average revenue to H&M of almost fifteen hundred dollars
per customer, generating over four million dollars of revenue so far. This group has a high level
of disposable income and H&M must increase this group's number of orders and the total amount
of products in each order. This group appears to spend a lot of money on clothes shopping at
H&M. H&M must give these customers a reason to make more trips. By introducing these
customers to products H&M even before the customer gets to the store will accomplish two
things. First thing it will do is create customer value. So, the customer will be led to visit a store
or website because the customer will be searching for the specific item they liked. The second
thing it will do is that it will let the customer know that H&M has fresh merchandise that perhaps
the customer did not see on his or her last visit to H&M. Customers do not want to come back to
H&M if the merchandise is exactly the same as the last time they were there. Customers need
new reasons to motivate them to go to H&M again. By promoting H&M’s new products it will
encourage more store traffic and lead to increased sales as well.
33
Limitations
Even though we reasonably segmented customers into groups through a series of cluster analyses
with different methods, there are still some limitations of this project. Initially, we clustered
customers of H&M based on the RFM Model. The four main variables, Total Revenue, Total
Profits, Months From Last Order and Number of Orders, do help us understand the past
purchasing behaviors of customers and the customer profitability. However, those variables are
unable to reflect the customers’ potentials in purchase and development growth in the future.
Obviously, past purchasing behavior is only a hint of possible trends but future customer
behavior will be influenced by many other elements, such as age, education, income, etc.
Moreover, the main objective of this project is to identify most valuable customers. However, it
is hard to come to the conclusion that we can find the best customers by simply looking into
customer profitability and their frequency of purchase. For example, Customer Engagement
Value (CEV) is also one important model to evaluate total customer value. Based on CEV,
valuable customers can be people who will refer new customers to H&M, who can influence
other existing customers on their purchasing behavior or customer satisfaction, and who are
willing to offer feedback for H&M to improve its services.
Additionally, variables in this data file are not enough for us to investigate customers at an
individual level but more at a collective level. We summarized key findings and offered
34
managerial implications for the optimal clusters we selected. But those findings and suggestions
may appear less accurate and effective due to lack of detailed demographic information of
customers. The implications are made for each group of customers who have shared
characteristics in profitability, frequency and recency. Nevertheless, customer in each group may
also have completely different backgrounds, preferences or needs. So, we should combine past
purchasing behavior and customers’ demographic information together to offer more precise and
practical suggestions to H&M.
Therefore, further research is needed to increase the accuracy of key findings and improve the
effectiveness of managerial implications.
Future Research
The limitations of this research present many opportunities for future research. Future research
should investigate more in depth buying habits of their customer base. If H&M was able to
determine what these customers shopped for, they could then tailor specific promotions to fall in
line with what that specific customer might purchase. For example, you could determine whether
your customer is a thirty four year old woman who shops for her two sons at H&M or if your
customer is a fifty two year old man who buys his own clothes from H&M. This research would
allow H&M to target current customers much more effectively which would enable them to
potentially increase the amount of sales per customer from their current customer base. From
35
H&M’s perspective, if you know that your customer is a thirty four year old mother of two then
you will be able to send her promotions and deals related to boys clothing as well as send her
reminders that H&M carries women's clothing too and perhaps she should shop there for herself
as well. There would be many applications of this future research that could be highly beneficial
for H&M to pursue.
Future research should also consider exploring ways to track how much time customers spend in
the stores. Depending on how customers shop they might spend only ten minutes inside the store
or perhaps even an hour. Knowing what type of shopper your customer is can be an effective tool
when trying to market your product to your target customers. Some customers go to stores for
long periods of time, however they do not purchase much and are using the trip to the store as
more of a social outing. These customers are described as wandering customers. Wandering
customers may be most of your in store traffic, however they may produce very little in total
sales for H&M. Another type of customer is described as a need-based customer. These
customers do not browse the store but instead have a detailed idea of what they want and do not
side track from this mission. Even though need-based customers may only spend a short amount
of time inside the store, they might contribute greatly to the overall sales (Hunter, 2010). Future
research in this area could reveal what type of shoppers H&M’s customers are and present new
opportunities for them to retain customers and increase total sales.
36
References
Hinshaw, M. (2013). “5 Segmentation Lessons From CVS.” CMO. Webcast on July 09, 2013.
Accessed on November 09, 2015 on
http://www.cmo.com/articles/2013/7/8/_5_segmentation_less.html
Hudson, Katura. (2015). "Physical Store Beats Online as Preferred Purchase Destination for U.S.
Shoppers, According to PwC." PwC. Webcast on February 09, 2015. Accessed on
November 8, 2015 on
http://www.pwc.com/us/en/press-releases/2015/2015-us-total-retail-press-release.html
Hunter, Mark. (2010). “The Five Types of Shoppers.” The Sales Hunter. Webcast on October 08,
2010. Accessed on November 05, 2015 on
http://thesaleshunter.com/resources/articles/retail-sales-trends/the-five-types-of-shoppers/
Lesonsky, Rieva. (2014). "Study Shows Consumers Prefer Shopping in a Store, Not
Online." Small Business Trends. Webcast on August 20, 2014. Accessed on November 08,
2015 on http://smallbiztrends.com/2014/08/consumers-prefer-shopping-in-a-store.html
Optimove. (2013). “Customer Segmentation.” Optimove Learning Center. Webcast on July 20,
2015. Accessed on November 09, 2015 on
http://www.optimove.com/learning-center/customer-segmentation
Rosenblum, Paula. (2015). "Fast Fashion Has Completely Disrupted Apparel Retail." Forbes.
Webcast on May 21, 2015. Accessed on November 8, 2015 on
37
http://www.forbes.com/sites/paularosenblum/2015/05/21/fast-fashion-has-completely-disr
upted-apparel-retail/
Rouse, Margeret. (2005). “What Is RFM Analysis Definition.” Search Data Management.
Webcast on November 12, 2005. Accessed on November 02, 2015 on
http://searchdatamanagement.techtarget.com/definition/RFM-analysis.
Wikipedia. (2015). "H&M." Wikipedia. Webcast on November 08, 2015. Accessed on
November 08, 2015 on https://en.wikipedia.org/wiki/H%26M
38
Appendix
Outputs For Hierarchical Cluster Analysis of Calibration Subset With Ward’s Method
Output With 6 Clusters
Output With 7 Clusters
Output With 8 Clusters
Outputs For Hierarchical Cluster Analysis of Calibration Subset With Furthest Neighbor
Output With 7 Clusters
39
Output With 8 Clusters
Output With 9 Clusters
Outputs For Hierarchical Cluster Analysis of Validation Subset With Ward’s Method
Output With 6 Clusters
Output With 7 Clusters
Output With 8 Clusters
40
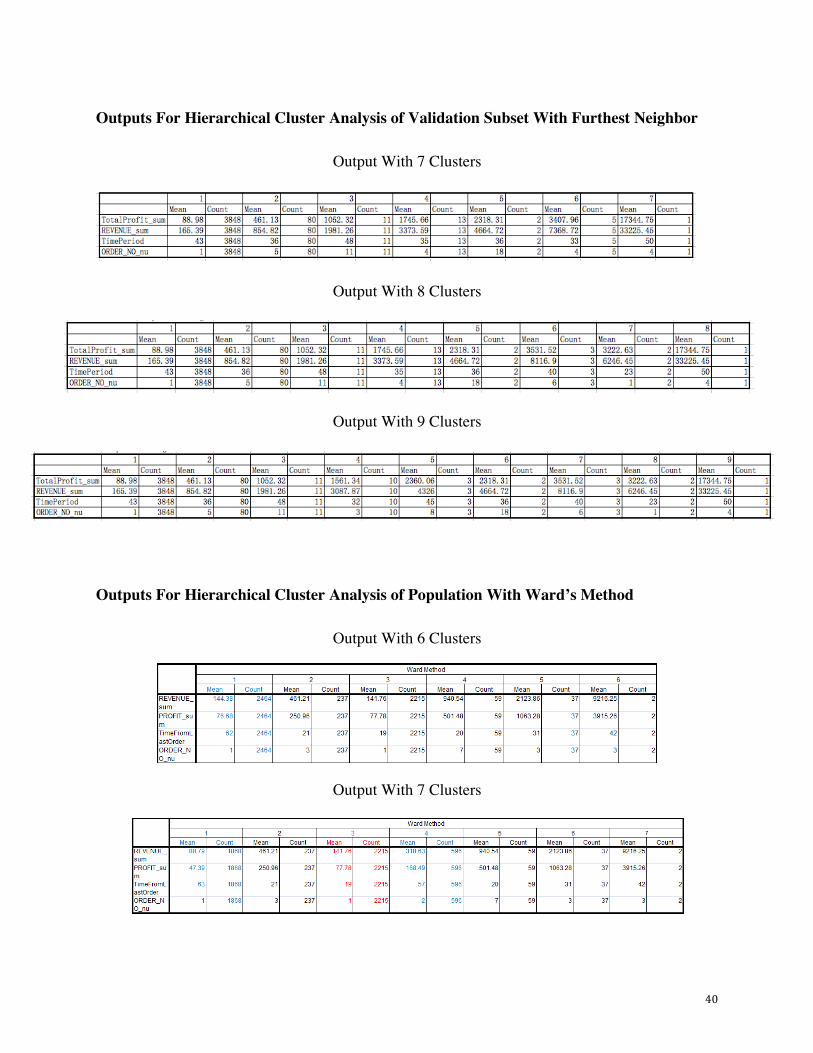
Outputs For Hierarchical Cluster Analysis of Validation Subset With Furthest Neighbor
Output With 7 Clusters
Output With 8 Clusters
Output With 9 Clusters
Outputs For Hierarchical Cluster Analysis of Population With Ward’s Method
Output With 6 Clusters
Output With 7 Clusters
41
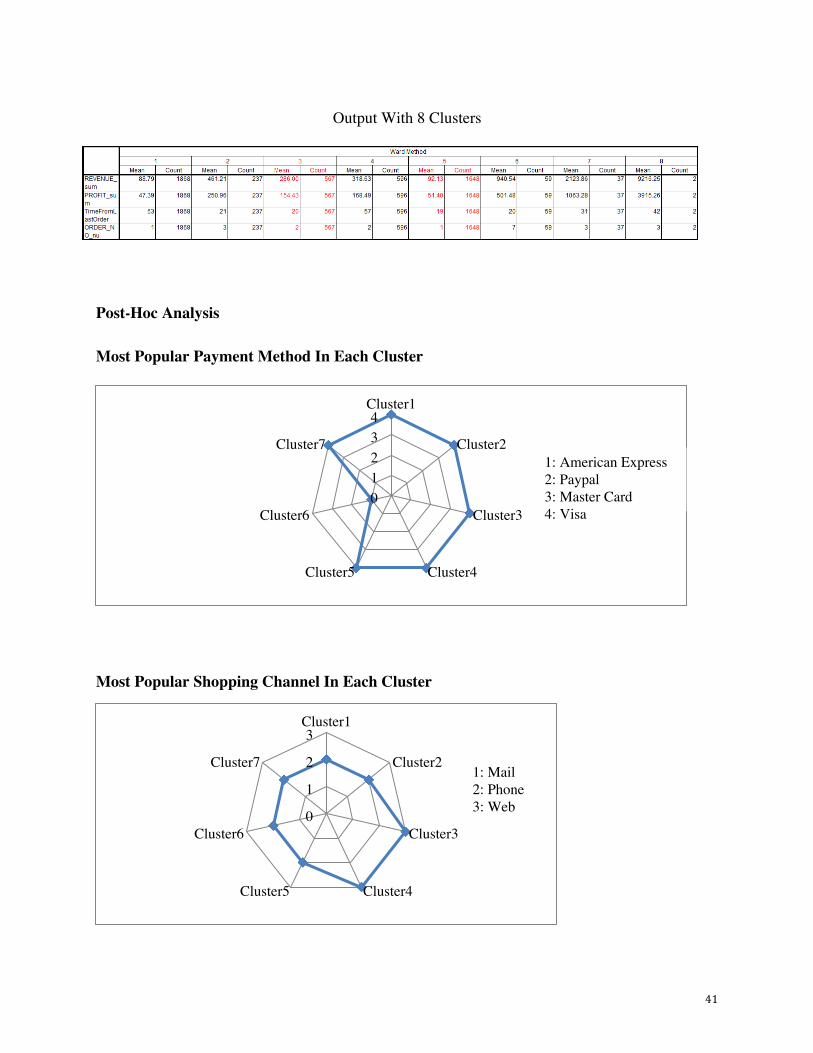
Output With 8 Clusters
Post-Hoc Analysis
Most Popular Payment Method In Each Cluster
Most Popular Shopping Channel In Each Cluster
01234
Cluster1
Cluster2
Cluster3
Cluster4Cluster5
Cluster6
Cluster71: American Express2: Paypal3: Master Card4: Visa
0
1
2
3Cluster1
Cluster2
Cluster3
Cluster4Cluster5
Cluster6
Cluster71: Mail2: Phone3: Web
42