executive board meeting 25 june 2008
DESCRIPTION
Executive Board meeting 25 June 2008. 1. Consumer prices 12-month change. Per cent. January 2004 – May 2008. CPI. 20 per cent trimmed mean. Weighted median. CPI-ATE 1). 1) CPI adjusted for tax changes and excluding energy products. 2. Source: Statistics Norway. - PowerPoint PPT PresentationTRANSCRIPT
Norges Bank
11
Executive Board meeting25 June 2008
Norges Bank
22
-2.5
0
2.5
5
2002 2003 2004 2005 2006 2007 2008
-2.5
0
2.5
5
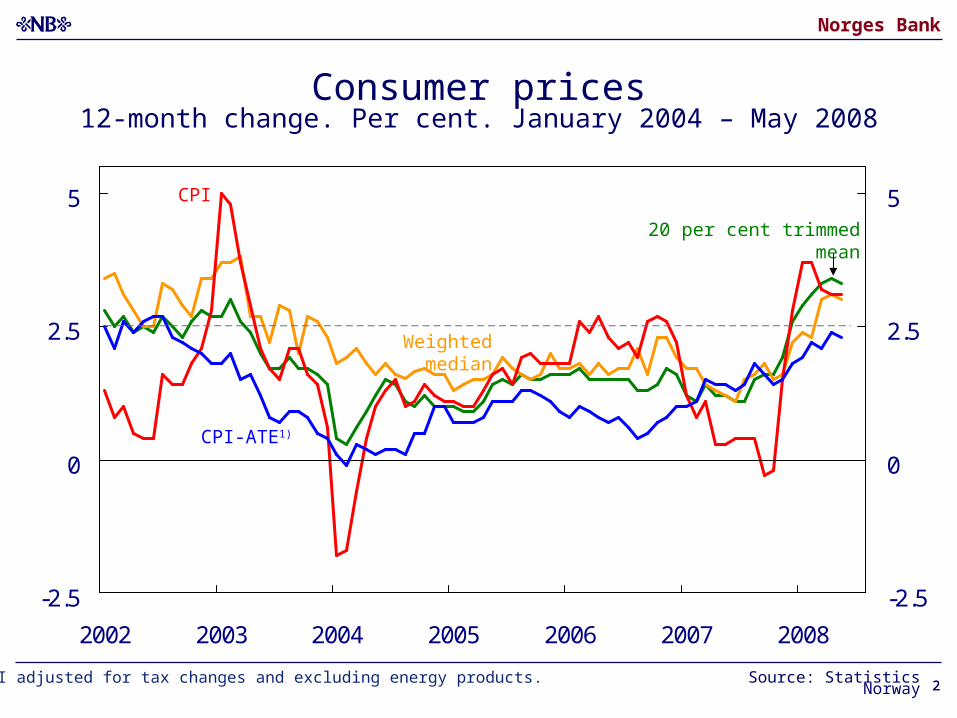
Source: Statistics Norway
Weighted median
CPI-ATE1)
20 per cent trimmed mean
CPI
Consumer prices12-month change. Per cent. January 2004 – May 2008
1) CPI adjusted for tax changes and excluding energy products.
Norges Bank
3
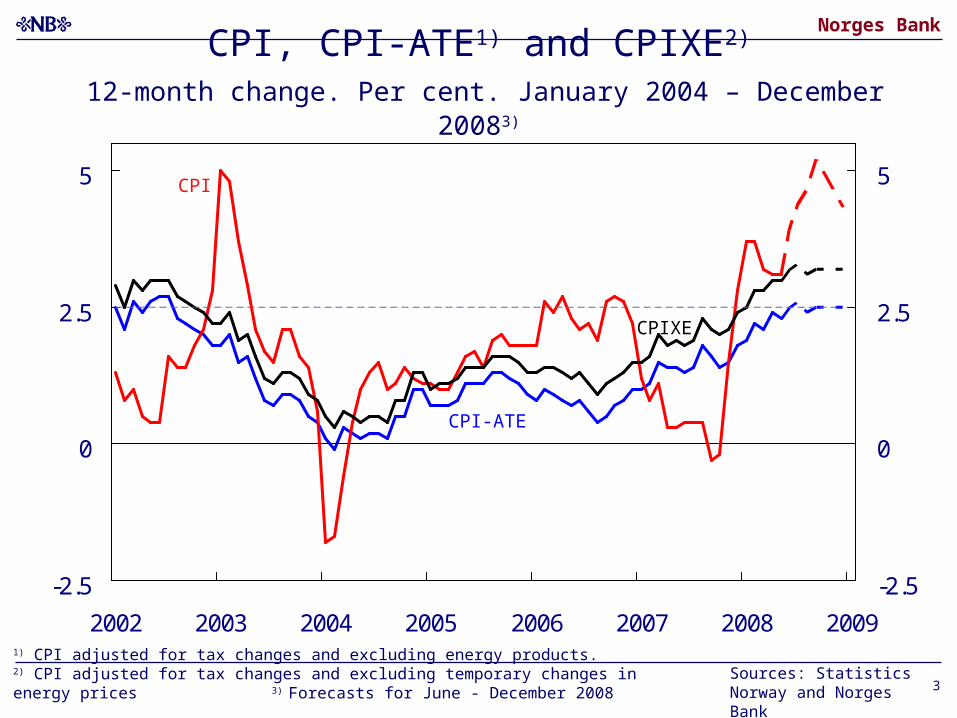
CPI, CPI-ATE1) and CPIXE2)
12-month change. Per cent. January 2004 – December 20083)
-2.5
0
2.5
5
2002 2003 2004 2005 2006 2007 2008 2009
-2.5
0
2.5
5
CPI-ATE
CPIXE
Sources: Statistics Norway and Norges Bank
CPI
1) CPI adjusted for tax changes and excluding energy products. 2) CPI adjusted for tax changes and excluding temporary changes in energy prices 3) Forecasts for June - December 2008
Norges Bank
4
-6
-4
-2
0
2
4
6
Jan-02 Jan-03 Jan-04 Jan-05 Jan-06 Jan-07 Jan-08
-6
-4
-2
0
2
4
6
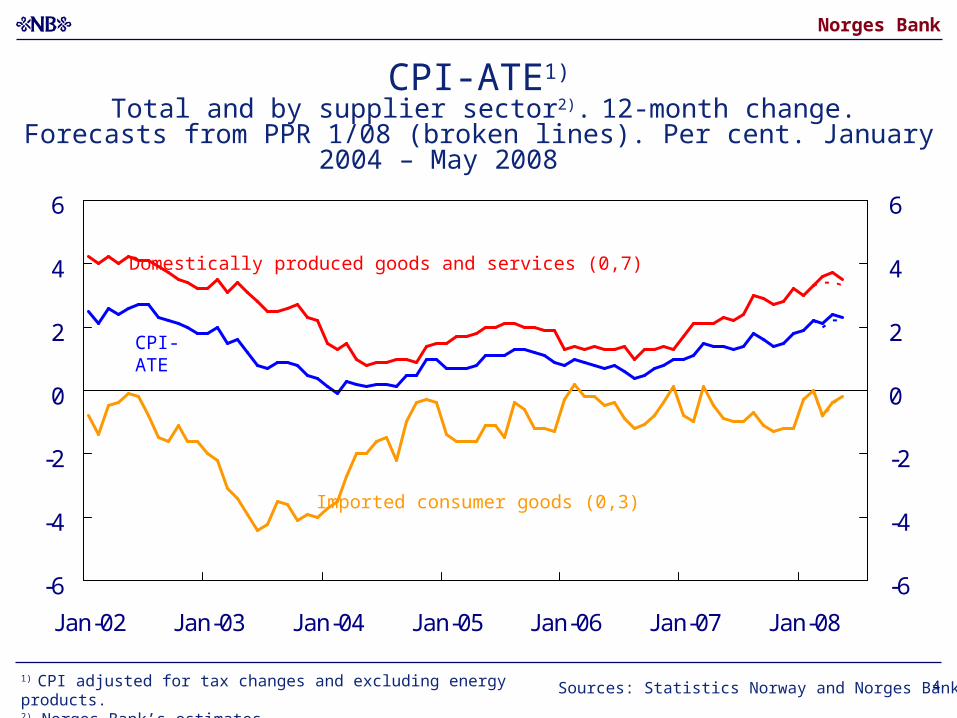
Domestically produced goods and services (0,7)
Imported consumer goods (0,3)
CPI-ATE
Sources: Statistics Norway and Norges Bank
CPI-ATE1)
Total and by supplier sector2). 12-month change.Forecasts from PPR 1/08 (broken lines). Per cent. January 2004 – May 2008
1) CPI adjusted for tax changes and excluding energy products.2) Norges Bank’s estimates.
Norges Bank
5
0.0
2.5
5.0
2002 2003 2004 2005 2006 2007 2008
0.0
2.5
5.0
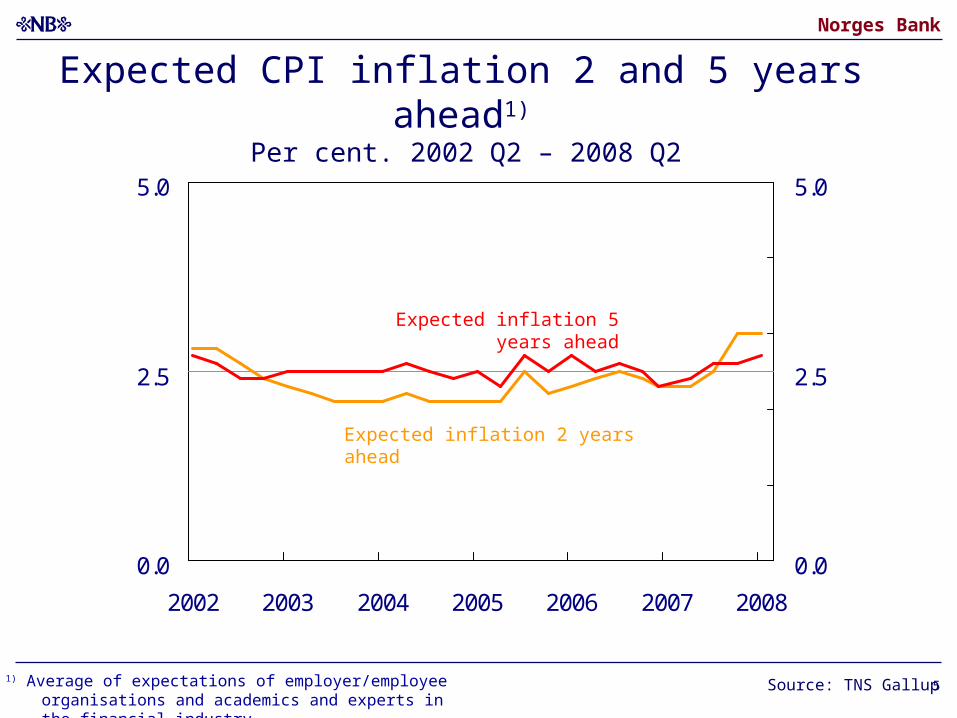
Expected inflation 2 years ahead
Expected inflation 5 years ahead
1) Average of expectations of employer/employee organisations and academics and experts in the financial industry
Expected CPI inflation 2 and 5 years ahead1)
Per cent. 2002 Q2 – 2008 Q2
Source: TNS Gallup
Norges Bank
6
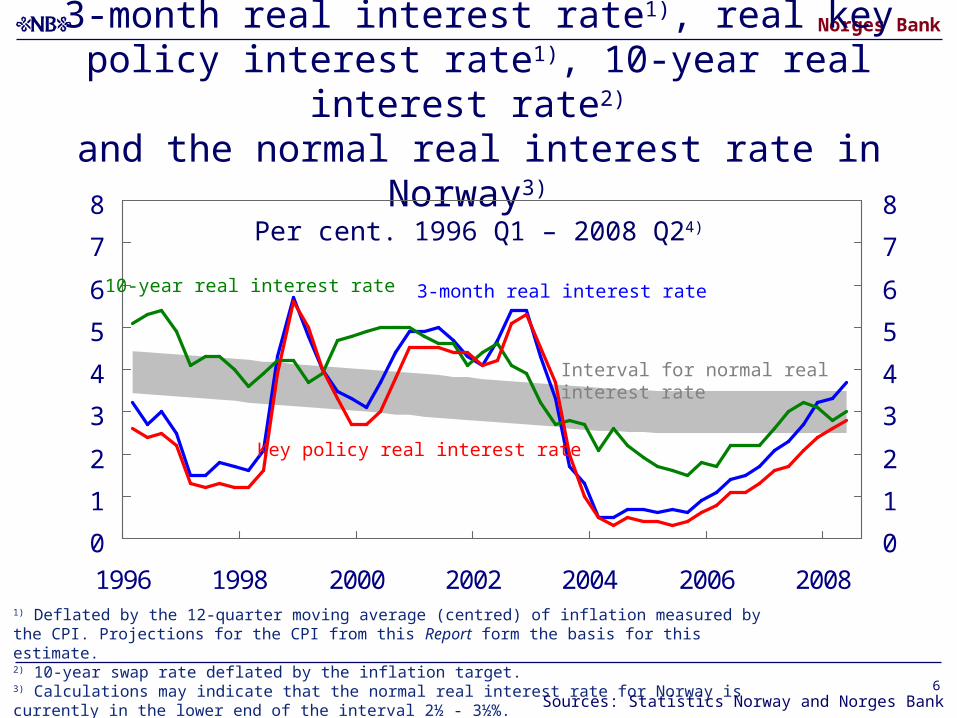
3-month real interest rate1), real key policy interest rate1), 10-year real interest rate2)
and the normal real interest rate in Norway3) Per cent. 1996 Q1 – 2008 Q24)
0
1
2
3
4
5
6
7
8
1996 1998 2000 2002 2004 2006 2008
0
1
2
3
4
5
6
7
8
1) Deflated by the 12-quarter moving average (centred) of inflation measured by the CPI. Projections for the CPI from this Report form the basis for this estimate. 2) 10-year swap rate deflated by the inflation target. 3) Calculations may indicate that the normal real interest rate for Norway is currently in the lower end of the interval 2½ - 3½%. 4) For 2008 Q2 the average of daily figures 1 April 2008 to 20 June 2008 is used.
Interval for normal real interest rate
Sources: Statistics Norway and Norges Bank
3-month real interest rate10-year real interest rate
Key policy real interest rate
Norges Bank
7
0
10
20
30
40
50
60
70
2005 2006 2007 2008
0
10
20
30
40
50
60
70
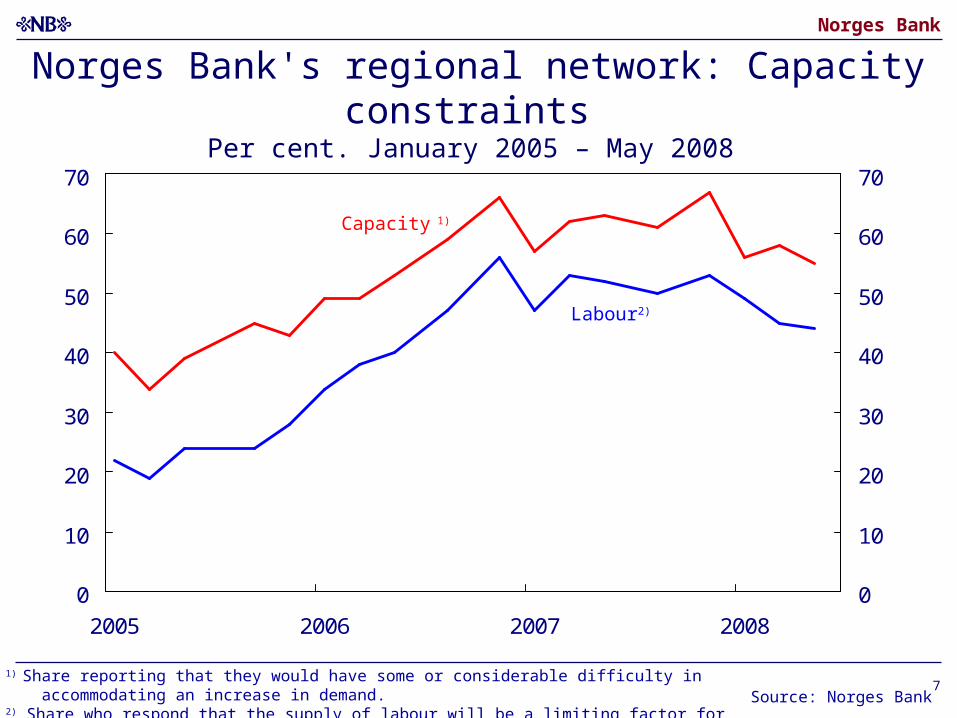
Norges Bank's regional network: Capacity constraints Per cent. January 2005 – May 2008
Capacity 1)
Labour2)
1) Share reporting that they would have some or considerable difficulty in accommodating an increase in demand.2) Share who respond that the supply of labour will be a limiting factor for output/turnover. Source: Norges Bank
Norges Bank
8
0
2
4
6
8
10
05 Q1 05 Q3 06 Q1 06 Q3 07 Q1 07 Q3 08 Q1 08 Q3
0
2
4
6
8
10
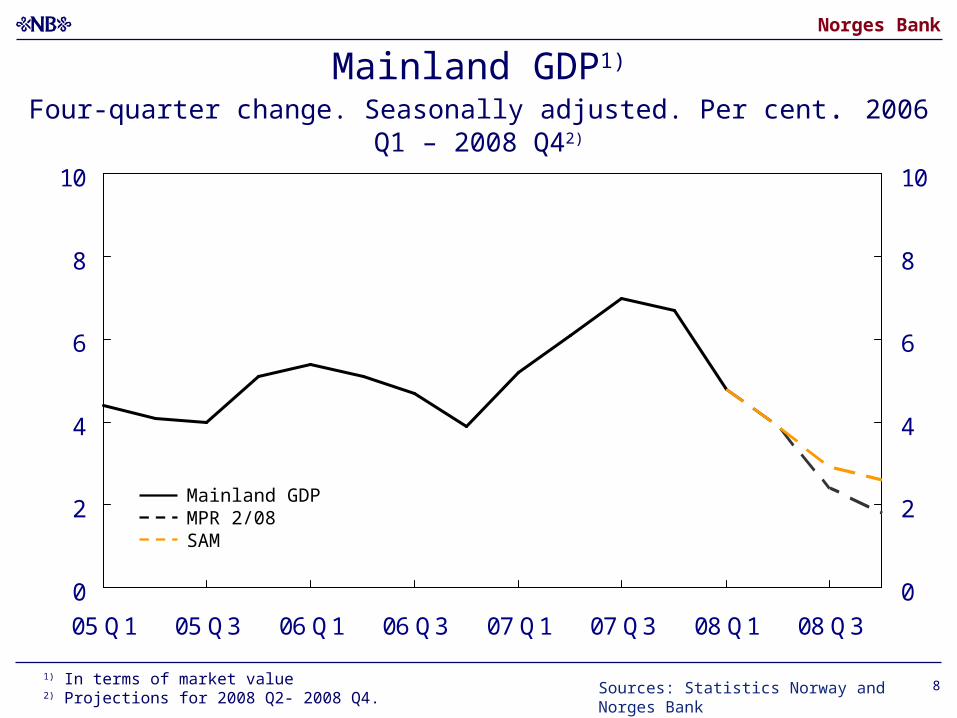
Mainland GDP1)
Four-quarter change. Seasonally adjusted. Per cent. 2006 Q1 – 2008 Q42)
SAMMPR 2/08Mainland GDP
Sources: Statistics Norway and Norges Bank1) In terms of market value2) Projections for 2008 Q2- 2008 Q4.
Norges Bank
9
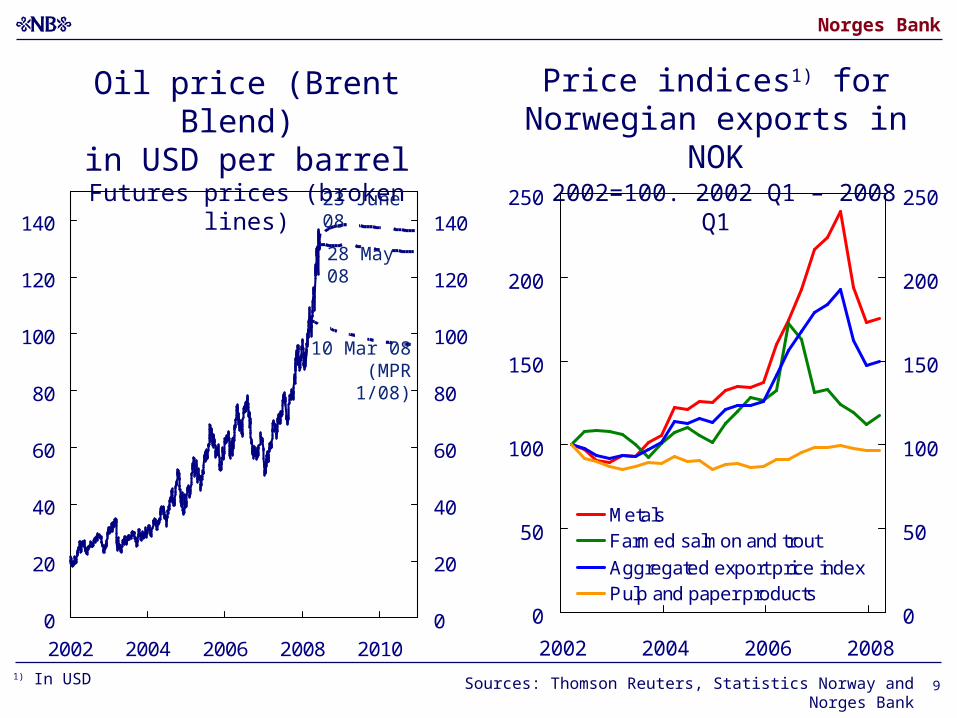
0
20
40
60
80
100
120
140
2002 2004 2006 2008 2010
0
20
40
60
80
100
120
140
1) In USD
23 June 08
Sources: Thomson Reuters, Statistics Norway and Norges Bank
10 Mar 08 (MPR 1/08)
0
50
100
150
200
250
2002 2004 2006 2008
0
50
100
150
200
250
MetalsFarmed salmon and trout
Aggregated export price indexPulp and paper products
28 May 08
Oil price (Brent Blend) in USD per barrel
Futures prices (broken lines)
Price indices1) for Norwegian exports in NOK
2002=100. 2002 Q1 – 2008 Q1
Norges Bank
10
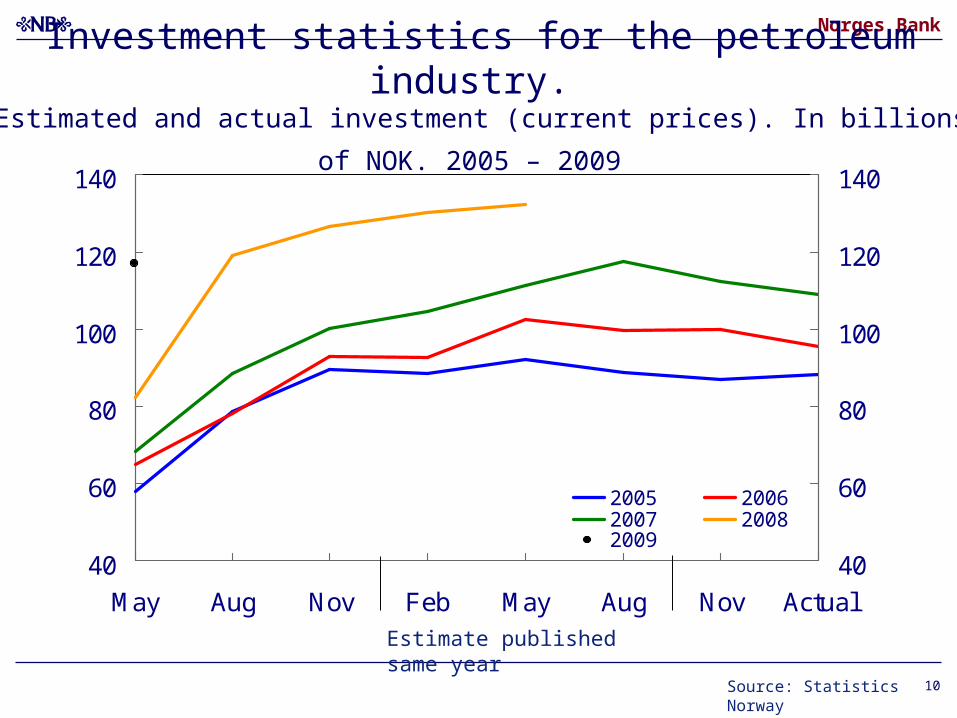
Investment statistics for the petroleum industry. Estimated and actual investment (current prices). In billions of NOK. 2005 – 2009
40
60
80
100
120
140
May Aug Nov Feb May Aug Nov Actual
40
60
80
100
120
140
2005 20062007 20082009
Source: Statistics Norway
Estimate published same year
Norges Bank
11
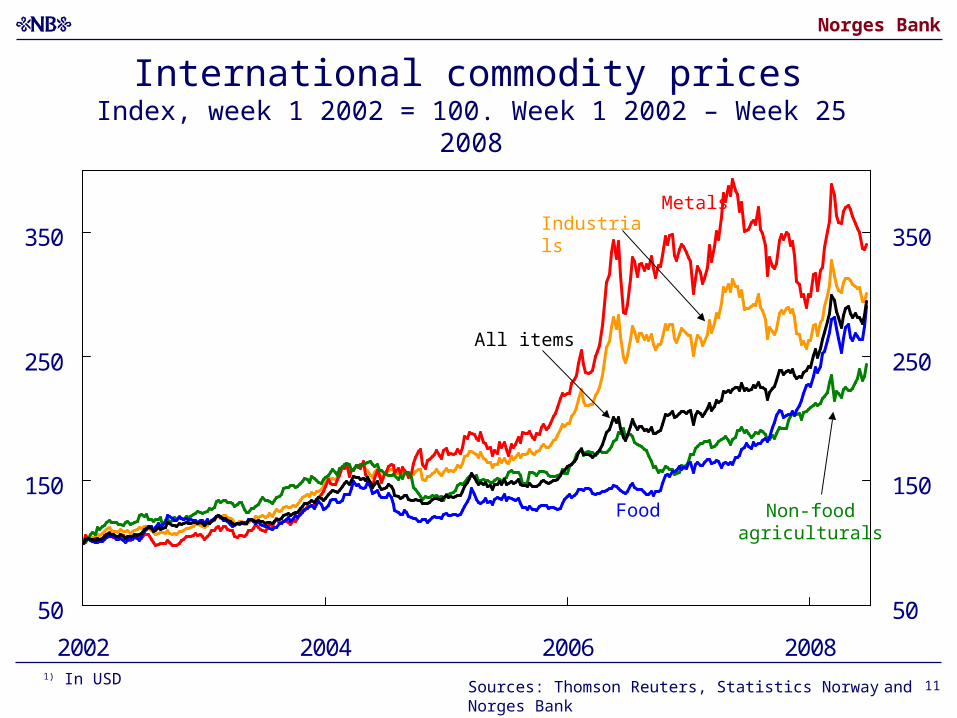
50
150
250
350
2002 2004 2006 2008
50
150
250
350
1) In USD
International commodity prices Index, week 1 2002 = 100. Week 1 2002 – Week 25 2008
Non-food agriculturals
Food
Industrials
All items
Metals
Sources: Thomson Reuters, Statistics Norway and Norges Bank
Norges Bank
12
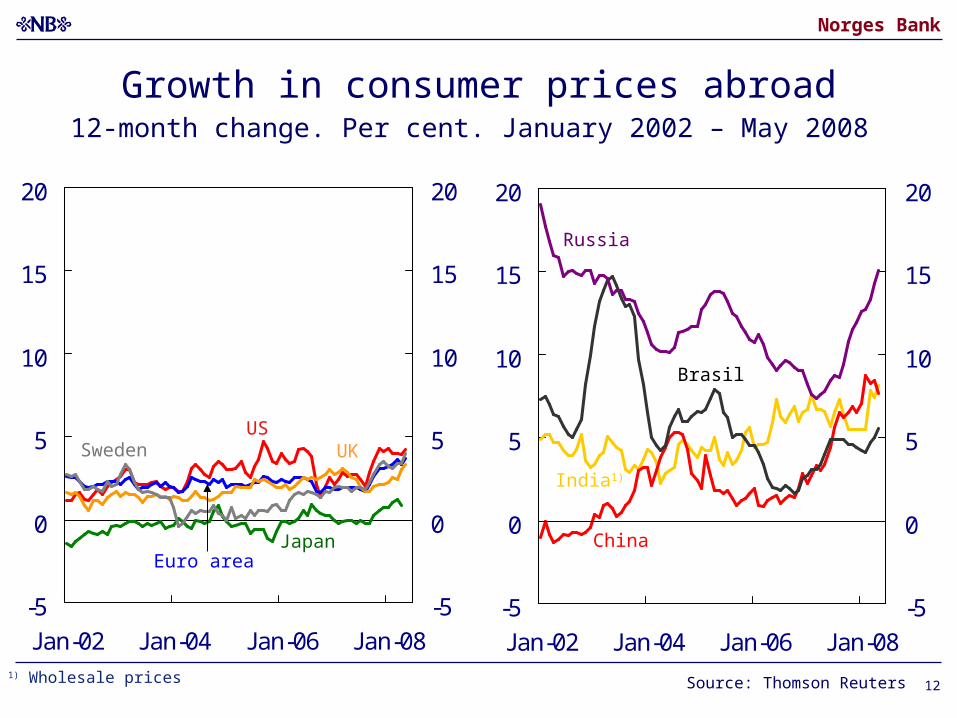
-5
0
5
10
15
20
Jan-02 Jan-04 Jan-06 Jan-08
-5
0
5
10
15
20
UK
Euro area
US
Japan
Sweden
Source: Thomson Reuters
-5
0
5
10
15
20
Jan-02 Jan-04 Jan-06 Jan-08
-5
0
5
10
15
20
Russia
Brasil
India1)
China
1) Wholesale prices
Growth in consumer prices abroad12-month change. Per cent. January 2002 – May 2008
Norges Bank
13
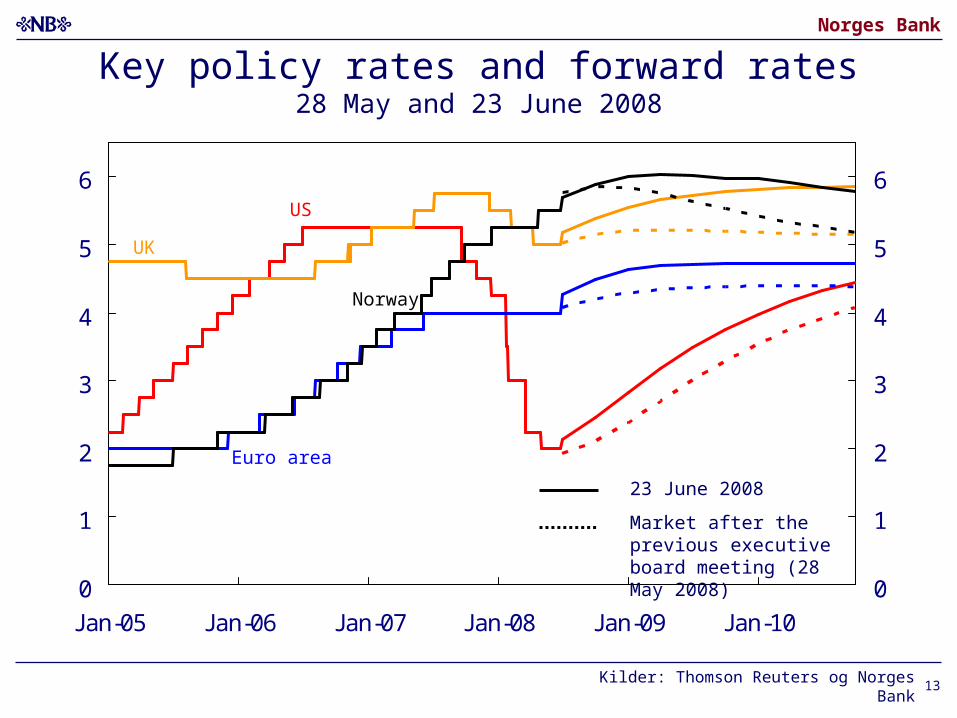
0
1
2
3
4
5
6
Jan-05 Jan-06 Jan-07 Jan-08 Jan-09 Jan-10
0
1
2
3
4
5
6
Kilder: Thomson Reuters og Norges Bank
Norway
US
Euro area
23 June 2008
Market after the previous executive board meeting (28 May 2008)
UK
Key policy rates and forward rates28 May and 23 June 2008

Norges Bank
14
85
88
91
94
97
100
103
2002 2003 2004 2005 2006 2007 2008 2009 2010
-1
0
1
2
3
4
5
28 May 2008
23 June 2008
23 June 2008
3-month interest rate differential and import-weighted exchange rate (I-44)1)
January 2002 – December 2011
I-44 (left-hand scale)
Weighted interest rate differential (right-hand scale)
1) A rising curve denotes an appreciation of the kroneSource: Thomson Reuters and Norges Bank
Norges Bank
15
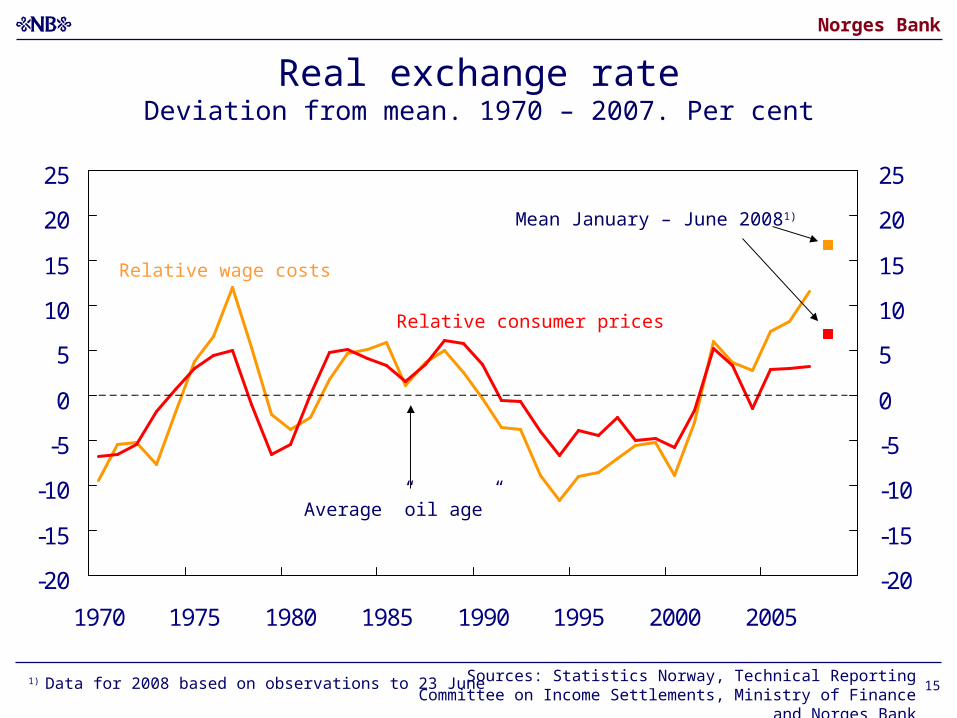
-20
-15
-10
-5
0
5
10
15
20
25
1970 1975 1980 1985 1990 1995 2000 2005
-20
-15
-10
-5
0
5
10
15
20
25
Mean January – June 20081)
Relative consumer prices
Relative wage costs
Real exchange rateDeviation from mean. 1970 – 2007. Per cent
Average ”oil age”
1) Data for 2008 based on observations to 23 June Sources: Statistics Norway, Technical Reporting Committee on Income Settlements, Ministry of Finance and Norges Bank
Norges Bank
16
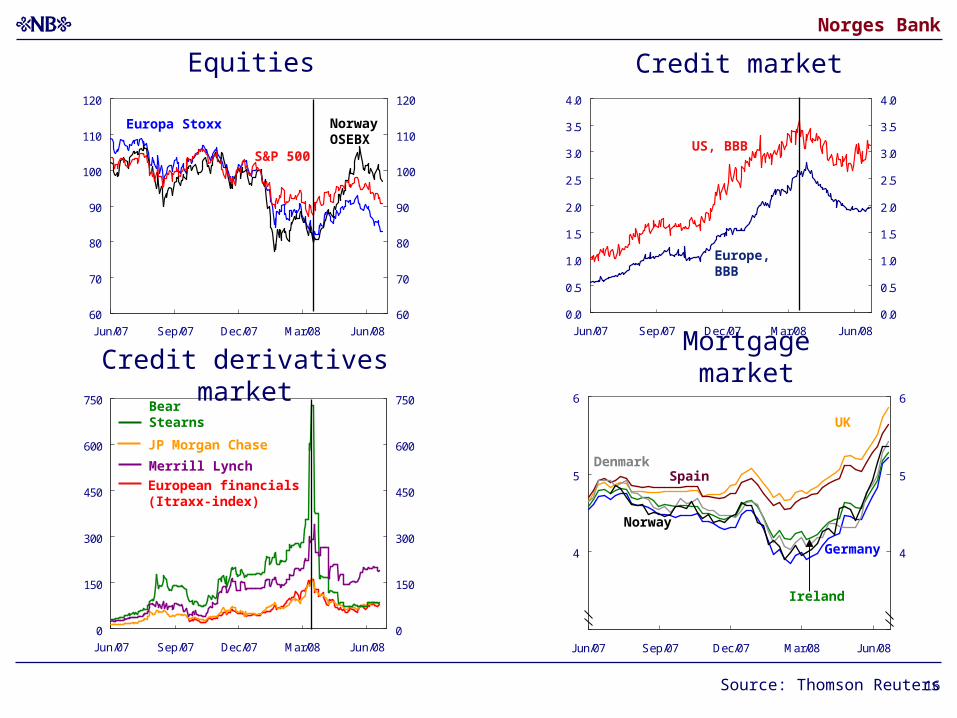
Mortgage market
60
70
80
90
100
110
120
Jun/07 Sep/07 Dec/07 Mar/08 Jun/08
60
70
80
90
100
110
120
0
150
300
450
600
750
Jun/07 Sep/07 Dec/07 Mar/08 Jun/08
0
150
300
450
600
750
0.0
0.5
1.0
1.5
2.0
2.5
3.0
3.5
4.0
Jun/07 Sep/07 Dec/07 Mar/08 Jun/08
0.0
0.5
1.0
1.5
2.0
2.5
3.0
3.5
4.0
Equities
Source: Thomson Reuters
Credit market
Credit derivatives market
Bear Stearns
European financials(Itraxx-index)
Merrill Lynch
JP Morgan Chase
Norway OSEBX
Europa Stoxx
S&P 500US, BBB
Europe, BBB
3
4
5
6
Jun/07 Sep/07 Dec/07 Mar/08 Jun/08
3
4
5
6
UK
Germany
SpainDenmark
Ireland
Norway
Norges Bank
17
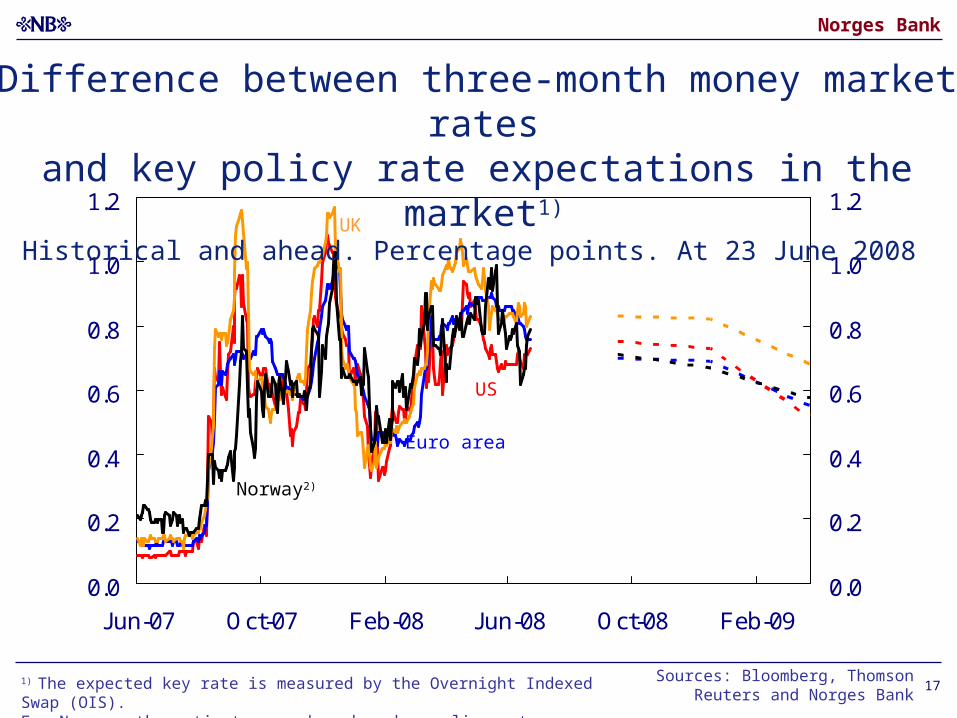
0.0
0.2
0.4
0.6
0.8
1.0
1.2
Jun-07 Oct-07 Feb-08 Jun-08 Oct-08 Feb-09
0.0
0.2
0.4
0.6
0.8
1.0
1.2
Norway2)
US
UK
Euro area
Difference between three-month money market rates and key policy rate expectations in the market1)
Historical and ahead. Percentage points. At 23 June 2008
1) The expected key rate is measured by the Overnight Indexed Swap (OIS). For Norway, the estimates are based on key policy rate expectations in the market.
Sources: Bloomberg, Thomson Reuters and Norges Bank
Norges Bank
18
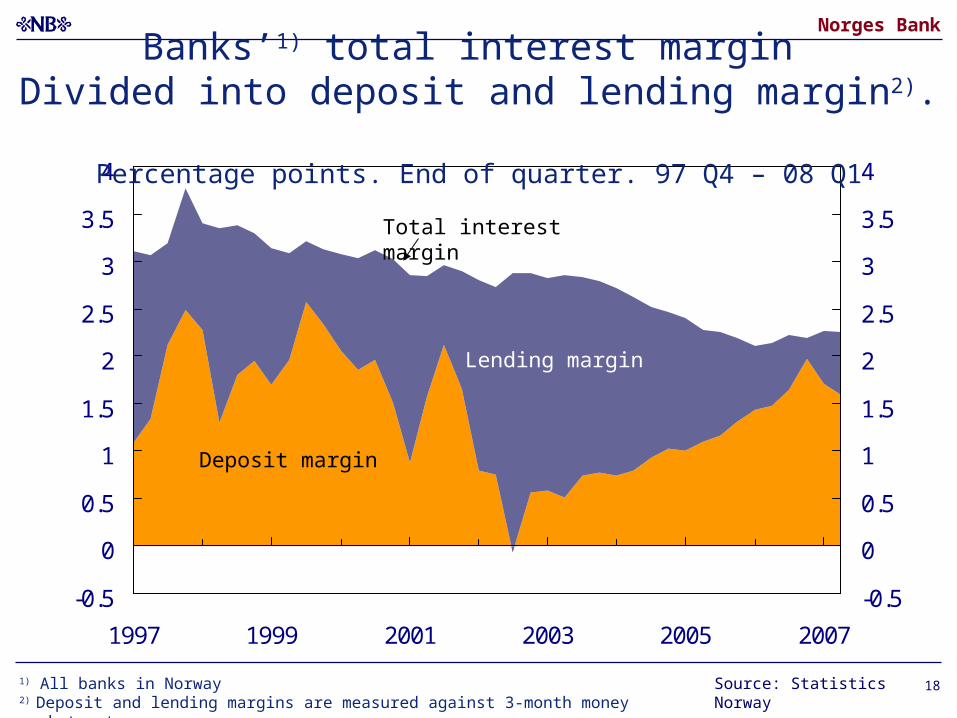
-0.5
0
0.5
1
1.5
2
2.5
3
3.5
4
1997 1999 2001 2003 2005 2007
-0.5
0
0.5
1
1.5
2
2.5
3
3.5
4
Source: Statistics Norway
Total interest margin
Lending margin
Deposit margin
Banks’1) total interest margin Divided into deposit and lending margin2).
Percentage points. End of quarter. 97 Q4 – 08 Q1
1) All banks in Norway2) Deposit and lending margins are measured against 3-month money market rates
Norges Bank
19
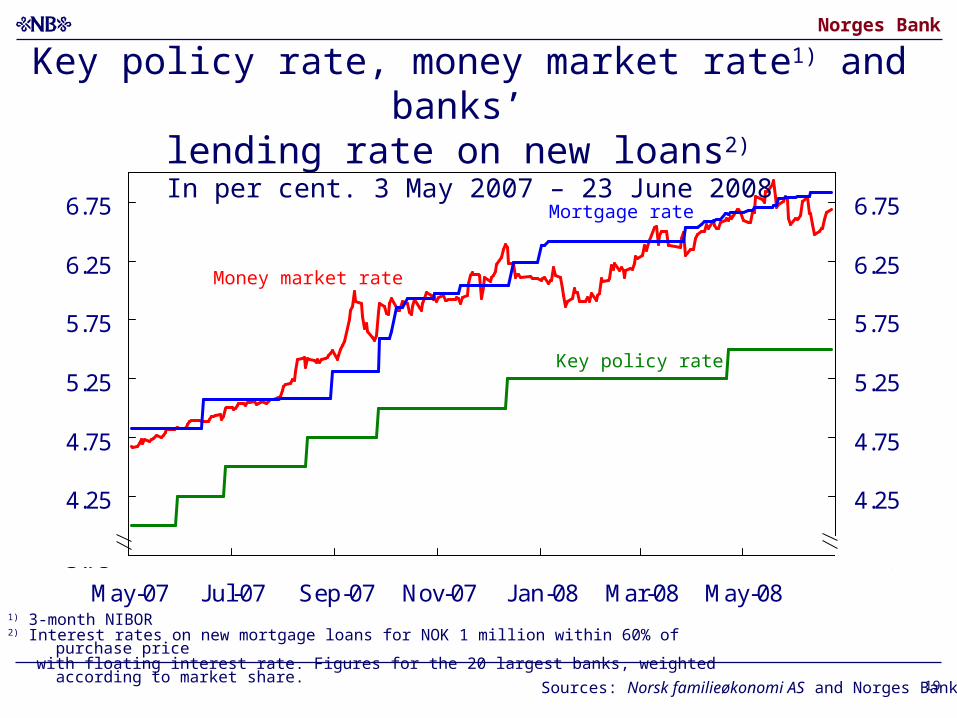
3.75
4.25
4.75
5.25
5.75
6.25
6.75
May-07 Jul-07 Sep-07 Nov-07 Jan-08 Mar-08 May-08
3.75
4.25
4.75
5.25
5.75
6.25
6.75
Key policy rate, money market rate1) and banks’ lending rate on new loans2)
In per cent. 3 May 2007 – 23 June 2008
Mortgage rate
Money market rate
Sources: Norsk familieøkonomi AS and Norges Bank
1) 3-month NIBOR2) Interest rates on new mortgage loans for NOK 1 million within 60% of purchase price with floating interest rate. Figures for the 20 largest banks, weighted according to market share.
Key policy rate
Norges Bank
20
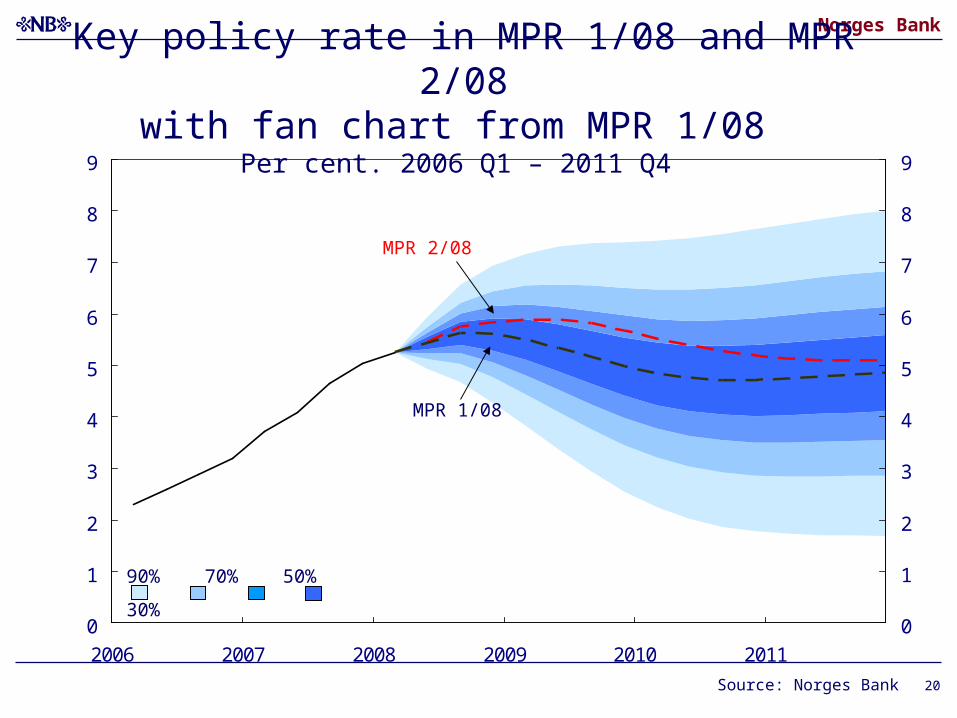
0
1
2
3
4
5
6
7
8
9
2006 2007 2008 2009 2010 2011
0
1
2
3
4
5
6
7
8
9
Source: Norges Bank
MPR 1/08
MPR 2/08
90% 70% 50% 30%
Key policy rate in MPR 1/08 and MPR 2/08with fan chart from MPR 1/08
Per cent. 2006 Q1 – 2011 Q4
Norges Bank
21
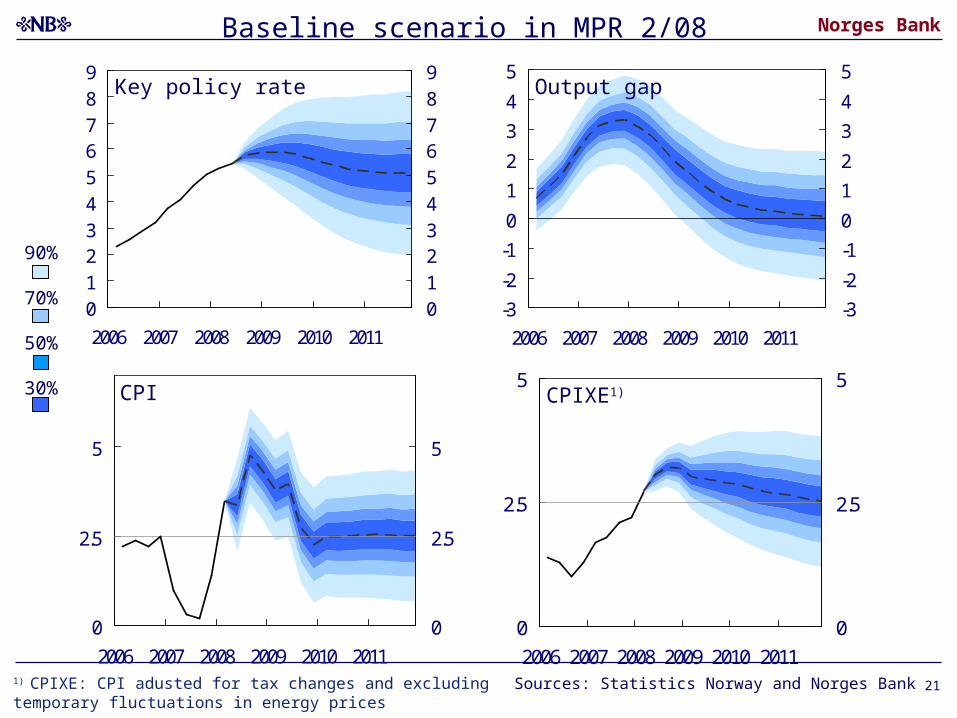
0
2.5
5
2006 2007 2008 2009 2010 20110
2.5
5
-3
-2
-1
0
1
2
3
4
5
2006 2007 2008 2009 2010 2011-3
-2
-1
0
1
2
3
4
5
0123456789
2006 2007 2008 2009 2010 20110123456789
0
2.5
5
2006 2007 2008 2009 2010 20110
2.5
5
90%
70%
50%
30%
Baseline scenario in MPR 2/08
Sources: Statistics Norway and Norges Bank
Output gap
CPIXE1)CPI
Key policy rate
1) CPIXE: CPI adusted for tax changes and excluding temporary fluctuations in energy prices
Norges Bank
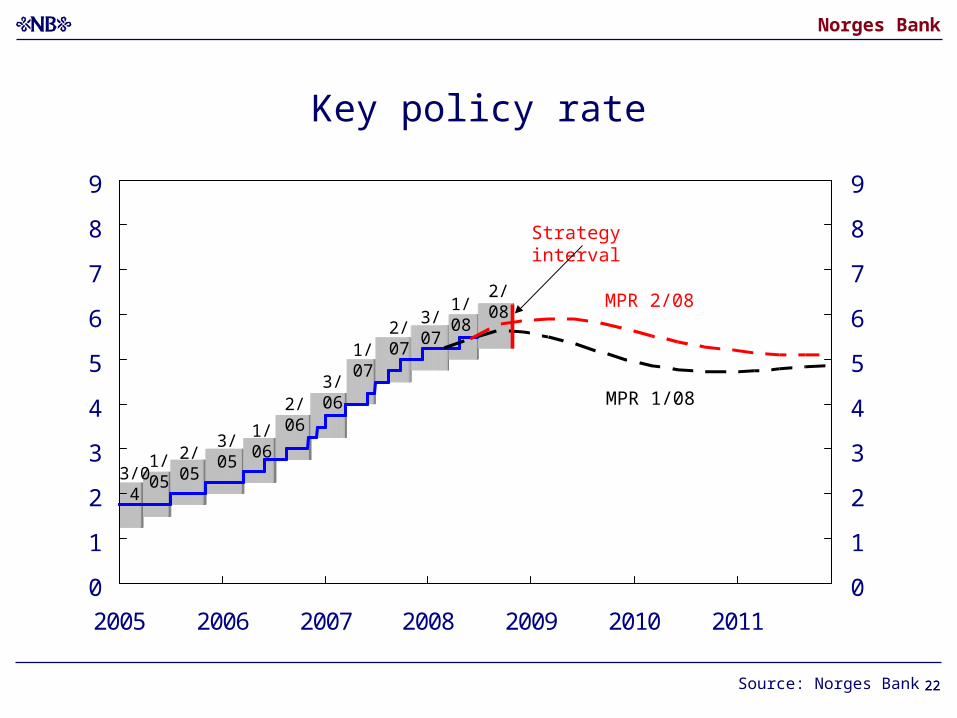
2222
Key policy rate
0
1
2
3
4
5
6
7
8
9
2005 2006 2007 2008 2009 2010 2011
0
1
2
3
4
5
6
7
8
9
Strategy interval
1/053/04
2/053/05 1/06
2/063/06
2/071/07
3/07MPR 2/081/08
MPR 1/08
2/08
Source: Norges Bank