exclusively presented by the ridge - cloud object … · exclusively presented by srs real estate...
TRANSCRIPT

EXCLUSIVELY PRESENTED BY
EXCLUSIVELY PRESENTED BY
Confidential Offering Memorandum
THE RIDGE12601 Tech Ridge Boulevard | Austin, TX

• INVESTMENT SUMMARY
• PROPERTY OVERVIEW
• PROPERTY PHOTOS
• RENT ROLL
• PROFIT & LOSS
• PROPERTY AERIAL
• SITE PLAN
• TENANT PROFILES
• SITE LOCATION MAP
• MARKET AERIAL
• AUSTIN OVERVIEW
• DEMOGRAPHIC SUMMARY
• CONFIDENTIALITY AND CONDITIONS OF SALE
• INFORMATION ABOUT BROKERAGE SERVICES
TABLE OF CONTENTS
FOR MORE INFORMATION, CONTACT:
Ryan HoffVice President, Investment [email protected]
SRS Real Estate Partners - Austin901 S. Mopac ExpresswayBuilding II, Suite 500Austin, TX 78746512.236.4600
THE RIDGE12601 Tech Ridge BoulevardAustin, TX 78753
3Exclusively Presented By SRS Real Estate Partners
INVESTMENT SUMMARY
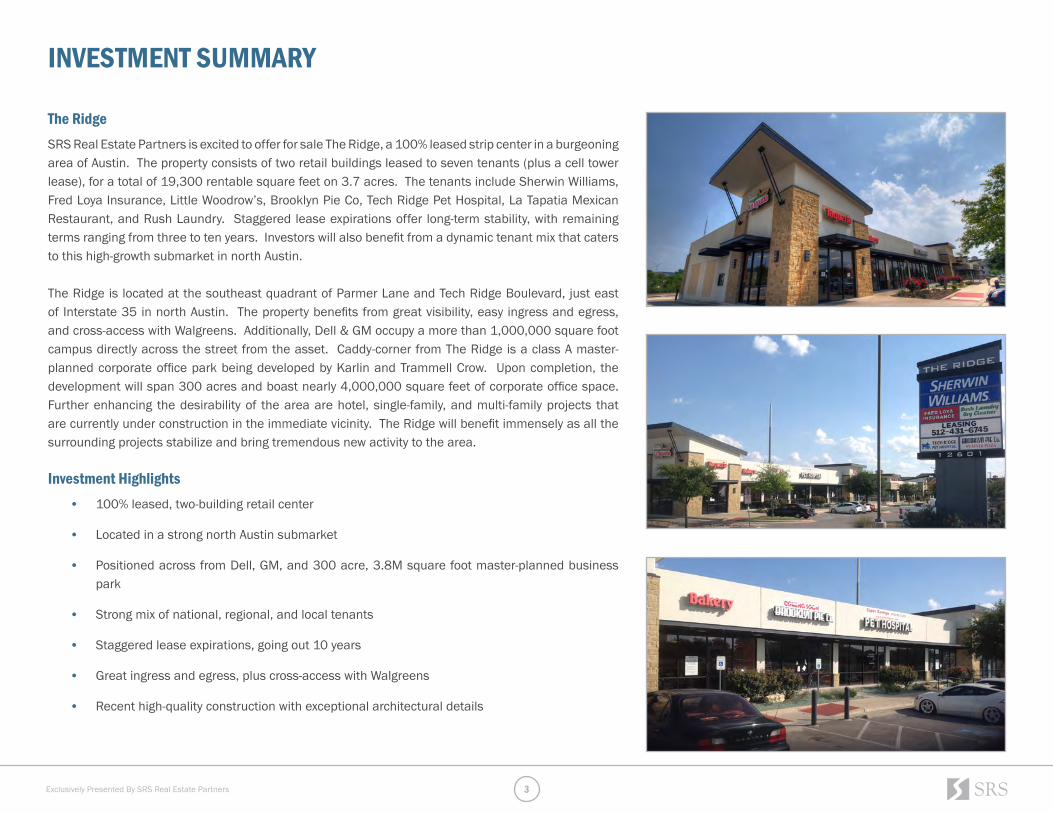
The RidgeSRS Real Estate Partners is excited to offer for sale The Ridge, a 100% leased strip center in a burgeoning area of Austin. The property consists of two retail buildings leased to seven tenants (plus a cell tower lease), for a total of 19,300 rentable square feet on 3.7 acres. The tenants include Sherwin Williams, Fred Loya Insurance, Little Woodrow’s, Brooklyn Pie Co, Tech Ridge Pet Hospital, La Tapatia Mexican Restaurant, and Rush Laundry. Staggered lease expirations offer long-term stability, with remaining terms ranging from three to ten years. Investors will also benefit from a dynamic tenant mix that caters to this high-growth submarket in north Austin.
The Ridge is located at the southeast quadrant of Parmer Lane and Tech Ridge Boulevard, just east of Interstate 35 in north Austin. The property benefits from great visibility, easy ingress and egress, and cross-access with Walgreens. Additionally, Dell & GM occupy a more than 1,000,000 square foot campus directly across the street from the asset. Caddy-corner from The Ridge is a class A master-planned corporate office park being developed by Karlin and Trammell Crow. Upon completion, the development will span 300 acres and boast nearly 4,000,000 square feet of corporate office space. Further enhancing the desirability of the area are hotel, single-family, and multi-family projects that are currently under construction in the immediate vicinity. The Ridge will benefit immensely as all the surrounding projects stabilize and bring tremendous new activity to the area.
Investment Highlights• 100% leased, two-building retail center
• Located in a strong north Austin submarket
• Positioned across from Dell, GM, and 300 acre, 3.8M square foot master-planned business park
• Strong mix of national, regional, and local tenants
• Staggered lease expirations, going out 10 years
• Great ingress and egress, plus cross-access with Walgreens
• Recent high-quality construction with exceptional architectural details

4Exclusively Presented By SRS Real Estate Partners
PROPERTY OVERVIEW
Property OverviewProperty Name: The Ridge
Address: 12601 Tech Ridge Boulevard, Austin, TX 78753
County: Travis
Building Size: 19,300 SF
Land Area: 3.706 Acres
Parking: 150 spaces (5 handicap)
Year Built: 2009
Price: $5,475,000 ($284 PSF)
Cap Rate: 7.14%
Tenants• Sherwin-Williams
• La Tapatia y Panaderia
• Dr. William M. Watson
• Rush Laundry
• Brooklyn Pie
• Little Woodrow’s
• Fred Loya Insurance Agency
• Dallas MTA, L.P. dba Verizon Wireless
Highlights The Ridge is a two-building retail center with cross access with Walgreens. It is currently 100% leased and positioned directly across the street from Dell and GM Campus, facilities with over 1,000,000 square feet combined. This property is conveniently located within walking distance of 1,000+ apartment units and single-family neighborhoods and caddy-corner from a 300 acre, 3.8M square foot master-planned business park. The Ridge is extremely well-constructed and meticulously managed.

5Exclusively Presented By SRS Real Estate Partners
PROPERTY PHOTOS

6Exclusively Presented By SRS Real Estate Partners
Tenant SuiteLeased
Space (SF)Lease
CommencementLease
ExpirationAnnual Base
Rent Rent Per SF Rent IncreasesRenewal Options
The Sherwin Williams Company 800 6000 12/20/2012 12/31/2022 $82,500 $13.75 1/1/2018 - $94,875 Three 5-Year
La Tapatia y Panaderia 100 2875 1/1/2010 12/31/2019 $63,250 $22.00 1/1/2016 - $67,587 Two 5-Year
1/1/2015 - $71,875
Dr. William M. Watson 400 2600 2/1/2009 1/31/2019 $52,000 $20.00 2/1/2016 - $53,300 Two 5-Year2/1/2017 - $54,6002/1/2018 - $55,900
Rush Laundry, LLC 1400 2595 4/1/2014 3/31/2024 $54,495 $21.00 4/1/2017 - $59,036 Two 5-Year4/1/2020 - $64,226
Brooklyn Pie 300 1300 10/9/2015 10/31/2025 $31,850 $24.50 $0.50 Annual Increases One 5-Year
Little Woodrow's 700 2875 11/1/2015 10/31/2025 $74,750 $26.00 Year 2 - $76,188 Two 5-YearYear 3 - $77,625
Years 4-5 - $79,063Years 6-8 - $83,375
Years 9-10 - $84,813
Fred Loya Insurance Agency, Inc 1200 1055 11/3/2014 11/30/2019 $23,368 $22.15 12/1/2015 - $24,159 One 5-Year12/1/2016 - $24,95112/1/2017 - $25,74212/1/2018 - $26,533
Dallas MTA, L.P. dba Verizon Wireless N/A 4/1/2008 3/31/2018 $17,250 Three 5-Year
Total 19,300 $399,463
RENT ROLL

7Exclusively Presented By SRS Real Estate Partners
Annualized Income (as of 11/1/15)
Base Rent 399,463CAM Recovery $45,886 Insurance Recovery $3,240 Property Tax Recovery* $96,874 Admin Fee Recovery $2,406 Management Fee Recovery $16,675 Sign Income $1,200
Total Additional Rent $166,281
TOTAL INCOME $565,744
Expenses (2015)
Property Tax* $96,874 Insurance $3,240 Property Mgmt Fees $19,594 Admin Fees $9,508 Utilities-Electric $8,696 Utilities-W/WW Meter Reads $844 Utilities-Irrigation $3,619 Janitorial Day Porter $2,928 Landscape Contract $6,900 Landscape Other $1,580 Trash Removal $2,870 R&M-Detention Pond $5,819 R&M-Electrical/Light $1,380 R&M-Pest Control $468 R&M-Signage/Graphics $600 R&M-Painting $250 R&M-Plumbing $540 R&M-Pressure Washing $622 R&M-Parking Lot Repairs $2,450 R&M-Roof $4,450 R&M-Property G&A $120 R&M-Fire & Life Safety $375 R&M-Other $1,375
Total Operating Expenses $175,102
NET OPERATING INCOME $390,642
PROFIT & LOSS
*Property Taxes have been adjusted to reflect the increased assessment for 2016.

8Exclusively Presented By SRS Real Estate Partners
PROPERTY AERIAL

9Exclusively Presented By SRS Real Estate Partners
SITE PLAN
10Exclusively Presented By SRS Real Estate Partners
Sherwin-WilliamsAbout: The Sherwin-Williams Company was founded by Henry Sherwin and Edward Williams in 1866. Today, they are a global leader in the manufacture, development, distribution and sale of paint, coatings and related products to professional, industrial, commercial, and retail customers
Locations: 4,279
Website: sherwin-williams.com
Little Woodrow’sAbout: Little Woodrow’s Neighborhood Bar is the beer lover’s place for the ultimate sports watching experience, featuring drink specials every day with over 100 beers and a full bar.
Locations: 15 (4 more coming soon)
Website: littlewoodrows.com
Brooklyn Pie Co.About: Feeding The Capital City authentic New York style pizza 7 days a week! Brooklyn Pie Co. pizzas contain only the finest ingredients, all natural and no preservatives. Dough is made daily with US #1, dark northern unbleached, naturally enriched wheat flour. Their Old World tomato sauce and fresh basil pesto are also made from scratch. Produce is hand-selected and cut daily to ensure freshness.
Locations: 6 (1 more coming soon)
Website brooklynpie.com
Fred Loya InsuranceAbout: Fred Loya Insurance is 18th Largest Hispanic Top 500 Owned and Operated Company in the United States. They are committed to providing fast, dependable service and competitive rates for general auto insurance, making them one of the fastest growing auto insurance groups in America.
Locations: 526
Website: fredloya.com
Tech Ridge Pet HospitalAbout: Tech Ridge Pet Hospital has been serving the dogs and cats of Northeast Austin and surrounding areas since 1983. Services focus on wellness care including veterinary evaluations, diagnostic tests, vaccinations, radiology, spaying/neutering, dentistry, general and orthopedic surgeries, and more.
Locations: 1
Website: techridgevet.com
Rush Laundry Dry CleanerAbout: Rush Laundry is a locally owned one-stop-shop for everything laundry. Featuring the latest in washing technology, they strive to create a friendly and clean environment where Austinites come to get their laundry, dry cleaning, and alterations done in one stop.
Locations: 1
Website: rushlaundry.com
TENANT PROFILES

11Exclusively Presented By SRS Real Estate Partners
SITE LOCATION MAPThe Ranch
Source: ©2015 Esri.
September 03, 2015
©2015 Esri Page 1 of 1
DowntownDowntown

12Exclusively Presented By SRS Real Estate Partners
MARKET AERIAL

13Exclusively Presented By SRS Real Estate Partners
Austin MSA With a great year-round climate, creative culture, countless outdoor activities, sporting events, and more fine restaurants and clubs per capita than any US city, Austin is a fantastic place to live, work, and play. Austin is set along the Balcones Escarpment, offering a unique landscape with coastal plains, dramatic cliffs, canyons, and rolling hills. As the “Live Music Capital of the World,” festivals like Austin City Limits and South by Southwest Music, Film, & Interactive Conference draw music, art, and technology lovers to Austin from all over the world. As for the economic impact of tourism associated with these events, it’s extraordinary. The 2014 South by Southwest Conference alone had a $315.3 million impact on Austin’s economy.
Fast Growing Population Named number two on Forbes’ list of America’s fastest-growing cities, Austin’s growth over the years is astounding. According to the Austin Chamber of Commerce, Austin’s population increased 37% from 2000 to 2010 and its growth averages three percent annually. Currently the City of Austin holds the 16th position of the nation’s largest regions with the Austin metropolitan area ranking 38th.
Austin MSA Population Projections: 2000 2020 2030 2040 2050
1,716,289 2,306,857 3,035,547 3,960,317 5,176,940
Austin MSA Projected Growth Rates: 2010-2020 2020-2030 2030-2040 2040-20501,716,289 2,306,857 3,035,547 3,960,317
Business & Employment Progressive and entrepreneurial, the Austin area delivers favorable business climates with a low tax burden and competitive regulatory environment. Austin’s workforce is smart, too. 40.5% of adults have at least a bachelor’s degree, a figure more than 11 points higher than the national average. Austin’s unemployment rates have consistently improved over recent years dropping from 6.6% in 2011 to 4.2% in 2014. The region’s largest employers include Austin Independent School District, City of Austin, Dell, IBM Corp., Seton Healthcare Family, and the University of Texas at Austin.
AUSTIN OVERVIEW
Austin’s skyline changes as the city continues to grows. Photo: Holly Brown Photography
Events like Austin City Limits, South by Southwest, and Formula 1 Racing add even more reasons for tourists to visit the already-popular Austin, Texas.
There’s always something to do in Austin - like swimming in spring-fed Barton Springs Pool or attending a University of Texas football game. Photos: PhotoPin

14Exclusively Presented By SRS Real Estate Partners
DEMOGRAPHIC SUMMARYExecutive SummaryThe Ridge Prepared by Esri12601 Tech Ridge Blvd, Austin, Texas, 78753 Latitude: 30.39874Rings: 1, 3, 5 mile radii Longitude: -97.66144
1 mile 3 miles 5 milesPopulation
2000 Population 7,145 65,550 178,0322010 Population 10,314 90,036 219,6532015 Population 11,533 97,312 234,2392020 Population 13,030 107,658 256,7302000-2010 Annual Rate 3.74% 3.22% 2.12%2010-2015 Annual Rate 2.15% 1.49% 1.23%2015-2020 Annual Rate 2.47% 2.04% 1.85%2015 Male Population 49.6% 50.2% 50.6%2015 Female Population 50.4% 49.8% 49.4%2015 Median Age 32.0 32.3 32.3
In the identified area, the current year population is 234,239. In 2010, the Census count in the area was 219,653. The rate of change since 2010 was 1.23% annually. The five-year projection for the population in the area is 256,730 representing a change of 1.85% annually from 2015 to 2020. Currently, the population is 50.6% male and 49.4% female.
Median Age
The median age in this area is 32.0, compared to U.S. median age of 37.9.Race and Ethnicity
2015 White Alone 45.4% 53.1% 57.7%2015 Black Alone 16.9% 14.5% 12.7%2015 American Indian/Alaska Native Alone 0.7% 0.8% 0.9%2015 Asian Alone 17.7% 11.5% 8.6%2015 Pacific Islander Alone 0.1% 0.1% 0.1%2015 Other Race 14.8% 16.0% 16.1%2015 Two or More Races 4.4% 4.1% 3.9%2015 Hispanic Origin (Any Race) 36.7% 39.8% 42.0%
Persons of Hispanic origin represent 42.0% of the population in the identified area compared to 17.6% of the U.S. population. Persons of Hispanic Origin may be of any race. The Diversity Index, which measures the probability that two people from the same area will be from different race/ethnic groups, is 81.7 in the identified area, compared to 63.0 for the U.S. as a whole.
Households2000 Households 2,523 26,212 70,7722010 Households 4,312 35,260 85,9312015 Total Households 4,805 38,007 91,4072020 Total Households 5,433 42,082 100,3402000-2010 Annual Rate 5.51% 3.01% 1.96%2010-2015 Annual Rate 2.08% 1.44% 1.18%2015-2020 Annual Rate 2.49% 2.06% 1.88%2015 Average Household Size 2.40 2.55 2.55
The household count in this area has changed from 85,931 in 2010 to 91,407 in the current year, a change of 1.18% annually. The five-year projection of households is 100,340, a change of 1.88% annually from the current year total. Average household size is currently 2.55, compared to 2.55 in the year 2010. The number of families in the current year is 52,905 in the specified area.
Data Note: Income is expressed in current dollarsSource: U.S. Census Bureau, Census 2010 Summary File 1. Esri forecasts for 2015 and 2020. Esri converted Census 2000 data into 2010 geography.
September 02, 2015
©2015 Esri Page 1 of 2
Highlight Within 3 miles of the Ridge the popluation approaches nearly 100,000 in 2015. Within 5 miles, the popluation more than doubles with 234,239 people.
Source: Esri, 2015

15Exclusively Presented By SRS Real Estate Partners
DEMOGRAPHIC SUMMARYExecutive SummaryThe Ridge Prepared by Esri12601 Tech Ridge Blvd, Austin, Texas, 78753 Latitude: 30.39874Rings: 1, 3, 5 mile radii Longitude: -97.66144
1 mile 3 miles 5 milesMedian Household Income
2015 Median Household Income $56,822 $52,000 $51,7262020 Median Household Income $66,047 $57,875 $57,8442015-2020 Annual Rate 3.05% 2.16% 2.26%
Average Household Income
2015 Average Household Income $66,640 $64,130 $64,5662020 Average Household Income $74,232 $71,738 $72,2282015-2020 Annual Rate 2.18% 2.27% 2.27%
Per Capita Income2015 Per Capita Income $27,203 $25,133 $25,2702020 Per Capita Income $30,352 $28,112 $28,3072015-2020 Annual Rate 2.21% 2.27% 2.30%
Households by IncomeCurrent median household income is $51,726 in the area, compared to $53,217 for all U.S. households. Median household income is projected to be $57,844 in five years, compared to $60,683 for all U.S. households
Current average household income is $64,566 in this area, compared to $74,699 for all U.S. households. Average household income is projected to be $72,228 in five years, compared to $84,910 for all U.S. households
Current per capita income is $25,270 in the area, compared to the U.S. per capita income of $28,597. The per capita income is projected to be $28,307 in five years, compared to $32,501 for all U.S. households Housing
2000 Total Housing Units 2,620 27,097 73,2282000 Owner Occupied Housing Units 1,760 13,362 32,7342000 Renter Occupied Housing Units 763 12,850 38,0382000 Vacant Housing Units 97 885 2,456
2010 Total Housing Units 4,814 37,703 93,1822010 Owner Occupied Housing Units 1,801 16,243 37,8432010 Renter Occupied Housing Units 2,511 19,017 48,0882010 Vacant Housing Units 502 2,443 7,251
2015 Total Housing Units 5,269 40,354 99,0402015 Owner Occupied Housing Units 1,864 16,424 37,9962015 Renter Occupied Housing Units 2,941 21,583 53,4112015 Vacant Housing Units 464 2,347 7,633
2020 Total Housing Units 5,971 44,566 108,4632020 Owner Occupied Housing Units 2,146 17,974 41,2822020 Renter Occupied Housing Units 3,287 24,108 59,0572020 Vacant Housing Units 538 2,484 8,123
Currently, 38.4% of the 99,040 housing units in the area are owner occupied; 53.9%, renter occupied; and 7.7% are vacant. Currently, in the U.S., 55.7% of the housing units in the area are owner occupied; 32.8% are renter occupied; and 11.6% are vacant. In 2010, there were 93,182 housing units in the area - 40.6% owner occupied, 51.6% renter occupied, and 7.8% vacant. The annual rate of change in housing units since 2010 is 2.75%. Median home value in the area is $214,507, compared to a median home value of $200,006 for the U.S. In five years, median value is projected to change by 1.76% annually to $234,107.
Data Note: Income is expressed in current dollarsSource: U.S. Census Bureau, Census 2010 Summary File 1. Esri forecasts for 2015 and 2020. Esri converted Census 2000 data into 2010 geography.
September 02, 2015
©2015 Esri Page 2 of 2
Highlight By 2020, it’s estimated that over 108,000 housing units will be within 5 miles of the Ridge.
Source: Esri, 2015
16Exclusively Presented By SRS Real Estate Partners
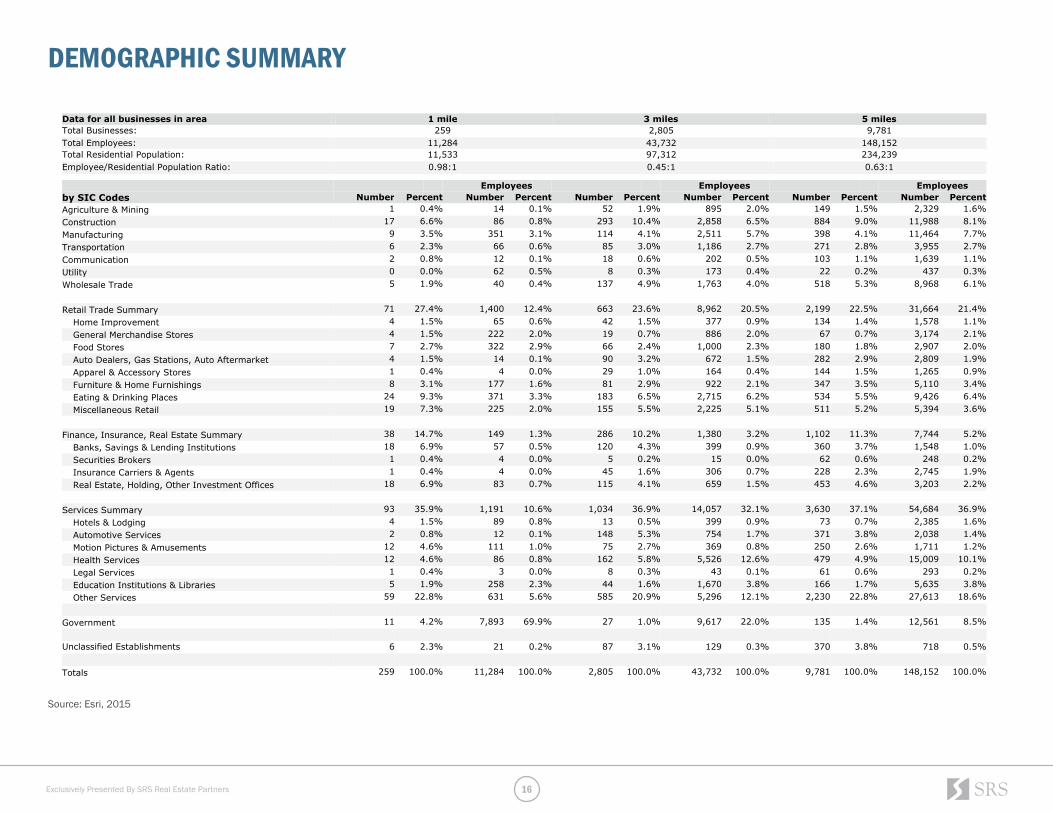
Business SummaryThe Ridge Prepared by Esri12601 Tech Ridge Blvd, Austin, Texas, 78753 Latitude: 30.39874Rings: 1, 3, 5 mile radii Longitude: -97.66144
Data for all businesses in area 1 mile 3 miles 5 milesTotal Businesses: 259 2,805 9,781Total Employees: 11,284 43,732 148,152Total Residential Population: 11,533 97,312 234,239Employee/Residential Population Ratio: 0.98:1 0.45:1 0.63:1
Employees Employees Employeesby SIC Codes Number Percent Number Percent Number Percent Number Percent Number Percent Number PercentAgriculture & Mining 1 0.4% 14 0.1% 52 1.9% 895 2.0% 149 1.5% 2,329 1.6%Construction 17 6.6% 86 0.8% 293 10.4% 2,858 6.5% 884 9.0% 11,988 8.1%Manufacturing 9 3.5% 351 3.1% 114 4.1% 2,511 5.7% 398 4.1% 11,464 7.7%Transportation 6 2.3% 66 0.6% 85 3.0% 1,186 2.7% 271 2.8% 3,955 2.7%Communication 2 0.8% 12 0.1% 18 0.6% 202 0.5% 103 1.1% 1,639 1.1%Utility 0 0.0% 62 0.5% 8 0.3% 173 0.4% 22 0.2% 437 0.3%Wholesale Trade 5 1.9% 40 0.4% 137 4.9% 1,763 4.0% 518 5.3% 8,968 6.1%
Retail Trade Summary 71 27.4% 1,400 12.4% 663 23.6% 8,962 20.5% 2,199 22.5% 31,664 21.4%Home Improvement 4 1.5% 65 0.6% 42 1.5% 377 0.9% 134 1.4% 1,578 1.1%General Merchandise Stores 4 1.5% 222 2.0% 19 0.7% 886 2.0% 67 0.7% 3,174 2.1%Food Stores 7 2.7% 322 2.9% 66 2.4% 1,000 2.3% 180 1.8% 2,907 2.0%Auto Dealers, Gas Stations, Auto Aftermarket 4 1.5% 14 0.1% 90 3.2% 672 1.5% 282 2.9% 2,809 1.9%Apparel & Accessory Stores 1 0.4% 4 0.0% 29 1.0% 164 0.4% 144 1.5% 1,265 0.9%Furniture & Home Furnishings 8 3.1% 177 1.6% 81 2.9% 922 2.1% 347 3.5% 5,110 3.4%Eating & Drinking Places 24 9.3% 371 3.3% 183 6.5% 2,715 6.2% 534 5.5% 9,426 6.4%Miscellaneous Retail 19 7.3% 225 2.0% 155 5.5% 2,225 5.1% 511 5.2% 5,394 3.6%
Finance, Insurance, Real Estate Summary 38 14.7% 149 1.3% 286 10.2% 1,380 3.2% 1,102 11.3% 7,744 5.2%Banks, Savings & Lending Institutions 18 6.9% 57 0.5% 120 4.3% 399 0.9% 360 3.7% 1,548 1.0%Securities Brokers 1 0.4% 4 0.0% 5 0.2% 15 0.0% 62 0.6% 248 0.2%Insurance Carriers & Agents 1 0.4% 4 0.0% 45 1.6% 306 0.7% 228 2.3% 2,745 1.9%Real Estate, Holding, Other Investment Offices 18 6.9% 83 0.7% 115 4.1% 659 1.5% 453 4.6% 3,203 2.2%
Services Summary 93 35.9% 1,191 10.6% 1,034 36.9% 14,057 32.1% 3,630 37.1% 54,684 36.9%Hotels & Lodging 4 1.5% 89 0.8% 13 0.5% 399 0.9% 73 0.7% 2,385 1.6%Automotive Services 2 0.8% 12 0.1% 148 5.3% 754 1.7% 371 3.8% 2,038 1.4%Motion Pictures & Amusements 12 4.6% 111 1.0% 75 2.7% 369 0.8% 250 2.6% 1,711 1.2%Health Services 12 4.6% 86 0.8% 162 5.8% 5,526 12.6% 479 4.9% 15,009 10.1%Legal Services 1 0.4% 3 0.0% 8 0.3% 43 0.1% 61 0.6% 293 0.2%Education Institutions & Libraries 5 1.9% 258 2.3% 44 1.6% 1,670 3.8% 166 1.7% 5,635 3.8%Other Services 59 22.8% 631 5.6% 585 20.9% 5,296 12.1% 2,230 22.8% 27,613 18.6%
Government 11 4.2% 7,893 69.9% 27 1.0% 9,617 22.0% 135 1.4% 12,561 8.5%
Unclassified Establishments 6 2.3% 21 0.2% 87 3.1% 129 0.3% 370 3.8% 718 0.5%
Totals 259 100.0% 11,284 100.0% 2,805 100.0% 43,732 100.0% 9,781 100.0% 148,152 100.0%Source: Copyright 2015 Infogroup, Inc. All rights reserved. Esri Total Residential Population forecasts for 2015.
September 03, 2015
©2015 Esri Page 1 of 2
Source: Esri, 2015
DEMOGRAPHIC SUMMARY

17Exclusively Presented By SRS Real Estate Partners
DEMOGRAPHIC SUMMARY
Source: Esri, 2015
Business SummaryThe Ridge Prepared by Esri12601 Tech Ridge Blvd, Austin, Texas, 78753 Latitude: 30.39874Rings: 1, 3, 5 mile radii Longitude: -97.66144
Businesses Employees Businesses Employees Businesses Employeesby NAICS Codes Number Percent Number Percent Number Percent Number Percent Number Percent Number PercentAgriculture, Forestry, Fishing & Hunting 0 0.0% 0 0.0% 2 0.1% 5 0.0% 10 0.1% 35 0.0%Mining 0 0.0% 0 0.0% 2 0.1% 20 0.0% 8 0.1% 112 0.1%Utilities 0 0.0% 62 0.5% 2 0.1% 140 0.3% 7 0.1% 187 0.1%Construction 19 7.3% 91 0.8% 308 11.0% 2,949 6.7% 931 9.5% 12,471 8.4%Manufacturing 10 3.9% 354 3.1% 126 4.5% 2,602 5.9% 423 4.3% 10,783 7.3%Wholesale Trade 5 1.9% 40 0.4% 133 4.7% 1,730 4.0% 504 5.2% 8,879 6.0%Retail Trade 45 17.4% 1,013 9.0% 464 16.5% 6,158 14.1% 1,607 16.4% 21,902 14.8%
Motor Vehicle & Parts Dealers 2 0.8% 14 0.1% 71 2.5% 619 1.4% 222 2.3% 2,619 1.8%Furniture & Home Furnishings Stores 3 1.2% 108 1.0% 30 1.1% 325 0.7% 120 1.2% 1,261 0.9%Electronics & Appliance Stores 4 1.5% 68 0.6% 52 1.9% 598 1.4% 215 2.2% 3,799 2.6%Bldg Material & Garden Equipment & Supplies Dealers 4 1.5% 65 0.6% 42 1.5% 377 0.9% 135 1.4% 1,582 1.1%Food & Beverage Stores 6 2.3% 307 2.7% 61 2.2% 955 2.2% 172 1.8% 2,816 1.9%Health & Personal Care Stores 5 1.9% 56 0.5% 32 1.1% 242 0.6% 108 1.1% 808 0.5%Gasoline Stations 2 0.8% 0 0.0% 18 0.6% 53 0.1% 60 0.6% 190 0.1%Clothing & Clothing Accessories Stores 3 1.2% 20 0.2% 42 1.5% 212 0.5% 184 1.9% 1,629 1.1%Sport Goods, Hobby, Book, & Music Stores 3 1.2% 47 0.4% 28 1.0% 1,495 3.4% 92 0.9% 2,205 1.5%General Merchandise Stores 4 1.5% 222 2.0% 19 0.7% 886 2.0% 67 0.7% 3,174 2.1%Miscellaneous Store Retailers 8 3.1% 104 0.9% 51 1.8% 347 0.8% 183 1.9% 1,622 1.1%Nonstore Retailers 1 0.4% 0 0.0% 18 0.6% 49 0.1% 48 0.5% 198 0.1%
Transportation & Warehousing 5 1.9% 64 0.6% 79 2.8% 1,194 2.7% 237 2.4% 3,887 2.6%Information 5 1.9% 35 0.3% 31 1.1% 494 1.1% 205 2.1% 5,265 3.6%Finance & Insurance 20 7.7% 65 0.6% 176 6.3% 745 1.7% 672 6.9% 4,652 3.1%
Central Bank/Credit Intermediation & Related Activities 18 6.9% 57 0.5% 125 4.5% 421 1.0% 378 3.9% 1,640 1.1%Securities, Commodity Contracts & Other Financial Investments & Other Related Activities
1 0.4% 4 0.0% 6 0.2% 18 0.0% 66 0.7% 267 0.2%Insurance Carriers & Related Activities; Funds, Trusts & Other Financial Vehicles
1 0.4% 4 0.0% 45 1.6% 306 0.7% 228 2.3% 2,745 1.9%Real Estate, Rental & Leasing 20 7.7% 84 0.7% 171 6.1% 781 1.8% 603 6.2% 3,575 2.4%Professional, Scientific & Tech Services 16 6.2% 212 1.9% 190 6.8% 1,892 4.3% 829 8.5% 10,609 7.2%
Legal Services 1 0.4% 3 0.0% 9 0.3% 46 0.1% 68 0.7% 358 0.2%Management of Companies & Enterprises 0 0.0% 0 0.0% 1 0.0% 5 0.0% 7 0.1% 41 0.0%Administrative & Support & Waste Management & Remediation Services
13 5.0% 73 0.6% 153 5.5% 2,145 4.9% 499 5.1% 8,653 5.8%Educational Services 8 3.1% 265 2.3% 63 2.2% 1,725 3.9% 221 2.3% 5,838 3.9%Health Care & Social Assistance 16 6.2% 183 1.6% 206 7.3% 6,002 13.7% 636 6.5% 17,622 11.9%Arts, Entertainment & Recreation 6 2.3% 99 0.9% 45 1.6% 313 0.7% 151 1.5% 1,361 0.9%Accommodation & Food Services 28 10.8% 473 4.2% 199 7.1% 3,140 7.2% 618 6.3% 11,873 8.0%
Accommodation 4 1.5% 89 0.8% 13 0.5% 399 0.9% 73 0.7% 2,385 1.6%Food Services & Drinking Places 25 9.7% 384 3.4% 187 6.7% 2,742 6.3% 546 5.6% 9,488 6.4%
Other Services (except Public Administration) 26 10.0% 257 2.3% 340 12.1% 1,933 4.4% 1,099 11.2% 7,069 4.8%Automotive Repair & Maintenance 1 0.4% 9 0.1% 116 4.1% 609 1.4% 292 3.0% 1,626 1.1%
Public Administration 11 4.2% 7,893 69.9% 27 1.0% 9,617 22.0% 136 1.4% 12,571 8.5%
Unclassified Establishments 6 2.3% 21 0.2% 88 3.1% 142 0.3% 376 3.8% 767 0.5%
Total 259 100.0% 11,284 100.0% 2,805 100.0% 43,732 100.0% 9,781 100.0% 148,152 100.0%Source: Copyright 2015 Infogroup, Inc. All rights reserved. Esri Total Residential Population forecasts for 2015.
September 03, 2015
©2015 Esri Page 2 of 2
18Exclusively Presented By SRS Real Estate Partners
CONFIDENTIALITY AND CONDITIONS OF SALE
This Offering Memorandum is not intended to constitute an offer, but is merely a solicitation of interest with respect to a possible sale of the Ridge located at 12601 Tech Ridge Boulevard, Austin, TX 78753.
This Offering Memorandum has been prepared by SRS Real Estate Partners, LLC and has been approved for distribution by the owner. Although effort has been made to provide accurate information, neither owner nor SRS can warrant or represent accuracy or completeness of the materials presented herein or in any other written or oral communications transmitted or made available to the purchaser. Many documents have been referred to in summary form and these summaries do not purport to represent or constitute a legal analysis of the contents of the applicable documents. Neither owner nor SRS represents that this offering summary is all inclusive or contains all of the information a purchaser may require.
All of the financial projections and/or conclusions presented herein are provided strictly for reference purposes and have been developed based upon assumptions and conditions in effect at the time the evaluations were undertaken. They do not purport to reflect changes in the economic performance of the property or the business activities of the owner since the date of preparation of this Offering Memorandum. The projected economic performance of the property, competitivesubmarket conditions, and selected economic and demographic statistics may have changed subsequent to the preparation of the package. Qualified purchasers are urged to inspect the property and undertake their own independent evaluation of the property, the market and the surrounding competitive environment.
Environmental matters can and do have dramatic impact not only on the physical conditions of a property but also on its economic performance and underlying value. If
such substances exist, special governmental approvals and permits may be required. Purchasers are encouraged to engage qualified professionals to determine whether hazardous or toxic substances or wastes, including asbestos, PCB’s, petrochemicals or other contaminants or conditions are present at the property. Neither SRS nor the owner performs or conducts investigations or analyses of environmental matters. It is the sole responsibility of qualified purchasers to review all applicable laws and regulations applying to either the existence, transportation or removal of hazardous materials and to prudently have an on site investigation and inspection of the property conducted. The cost and removal of hazardous materials may be substantial; therefore, SRS strongly encourages qualified purchasers to engage legal counsel and appropriate technical professionals if any of these conditions are discovered during the inspection. No person, firm or entity is authorized to make or submit offers on behalf of anyone or divulge or reproduce the contents of this executive summary or discuss the availability or the purchase of the property without first having registered in writing the name of the party receiving the material and received written authorization to proceed from SRS. The owner and SRS reserve the right, at their discretion, to reject any or all expressions of interest with any party at any time with or without notice. The Recipient is strictly prohibited from contacting the tenant or any affiliate regarding this offering without prior written authorization of Owner or SRS. The terms and conditions stated herein apply to all sections of the executive summary.
SRS is acting as exclusive disposition agent, and the owner reserves the right to withdraw the property from the market, to change the price and terms or sell the property at any time without notice being given.
Ryan HoffSRS Real Estate PartnersVice President, Investment Sales512.2360.4649 [email protected]

19Exclusively Presented By SRS Real Estate Partners
INFORMATION ABOUT BROKERAGE SERVICES
Approved By The Texas Real Estate Commission For Voluntary UseTexas law requires all real estate licensees to give the following information about brokerage services to prospective buyers, tenants, sellers and landlords.
Before working with a real estate broker, you should know that the duties of a broker depend on whom the broker represents. If you are a prospective seller or landlord (owner) or a prospective buyer or tenant (buyer), you should know that the broker who lists the property for sale or lease is the owner’s agent. A broker who acts as a subagent represents the owner in cooperation with the listing broker. A broker who acts as a buyer’s agent represents the buyer. A broker may act as an intermediary between the parties if the parties consent in writing. A broker can assist you in locating a property, preparing a contract or lease, or obtaining financing without representing you. A broker is obligated by law to treat you honestly.
If the broker represents the owner:The broker becomes the owner’s agent by entering into an agreement with the owner, usually through a written - listing agreement, or by agreeing to act as a subagent by accepting an offer of subagency from the listing broker. A subagent may work in a different real estate office. A listing broker or subagent can assist the buyer but does not represent the buyer and must place the interests of the owner first. The buyer should not tell the owner’s agent anything the buyer would not want the owner to know because an owner’s agent must disclose to the owner any material information known to the agent.
If the broker represents the buyer:The broker becomes the buyer’s agent by entering into an agreement to represent the buyer, usually through a written buyer representation agreement. A buyer’s agent can assist the owner but does not represent the owner and must place the interests of the buyer first. The owner should not tell a buyer’s agent anything the owner would not want the buyer to know because a buyer’s agent must disclose to the buyer any material information known to the agent.
If the broker acts as an intermediary:A broker may act as an intermediary between the parties if the broker complies with The Texas Real Estate License Act. The broker must obtain the written consent of each party to the transaction to act as an intermediary. The written consent must state who will pay the broker and, in conspicuous bold or underlined print, set forth the broker’s obligations as an intermediary. The broker is required to treat each party honestly and fairly and to comply with The Texas Real Estate License Act. A broker who acts as an intermediary in a transaction:(1) shall treat all parties honestly;(2) may not disclose that the owner will accept a price less that the asking price unless
authorized in writing to do so by the owner;(3) may not disclose that the buyer will pay a price greater than the price submitted in a written offer unless authorized in writing to do so by the buyer; and(4) may not disclose any confidential information or any information that a party specifically instructs the broker in writing not to disclose unless authorized in writing to disclose the information or required to do so by The Texas Real Estate License Act or a court order or if the information materially relates to the condition of the property.
With the parties’ consent, a broker acting as an intermediary between the parties may appoint a person who is licensed under The Texas Real Estate License Act and associated with the broker to communicate with and carry out instructions of one party and another person who is licensed under that Act and associated with the broker to communicate with and carry out instructions of the other party.
If you choose to have a broker represent you, you should enter into a written agreement with the broker that clearly establishes the broker’s obligationsand your obligations. The agreement should state how and by whom the broker will be paid. You have the right to choose the type of representation, if any, you wish to receive. Your payment of a fee to a broker does not necessarily establish that the broker represents you. If you have any questions regarding the duties and responsibilities of the broker, you should resolve those questions before proceeding.
Real estate licensee asks that you acknowledge receipt of this information about brokerage services for the licensee’s records.
Buyer, Seller, Landlord or Tenant Date
Texas Real Estate Brokers and Salespersons are licensed and regulated by the Texas Real Estate Commission (TREC). If you have a question or complaint regarding a real estate licensee, you should contact TREC at P.O. Box 12188, Austin, Texas 78711-2188, 512-936-3000 (http://www.trec.texas.gov)
10-10-11

SRSRE.COM