desirability and convenience study for maritime ... · desirability and convenience study for...
TRANSCRIPT
Desirability and Convenience Study
For Maritime Transportation Services WWW.P3.GOV.PR
November 2015
General Disclosure
This Desirability and Convenience Study (the “Study”) has been prepared pursuant to the requirements of Act no 29-2009, as amended, also known as the Puerto Rico Public-Private Partnerships Act (the “Act”). This Study seeks to determine whether it is advisable and convenient for the Commonwealth of Puerto Rico (the “Commonwealth”) to establish a Public-Private Partnership (“P3” or “PPP”) for the operation and maintenance of the public maritime transportation services currently provided by the Maritime Transportation Authority for Puerto Rico and the Municipal Islands (“MTA”) and the Puerto Rico Integrated Transit Authority (“PRITA” or “ATI” its Spanish acronym) within the San Juan Bay (“Metro Service”) and the Municipal Islands of Puerto Rico – Vieques and Culebra- (“Island Service”) and the operation of the maintenance base located in Isla Grande, San Juan (collectively the “Project”).
The Act was amended in December 2014 to incorporate a new and expedited mechanism to procure small scale P3 projects. This allows for the expedited review of projects with capital expenditures valued up to $55 million in the case of brownfields, and up to $100 million in the case of greenfields approved by the Puerto Rico Public Private Partnerships Authority Board of Directors. The Act created a Permanent Committee to oversee small scale P3 project, which will include state and municipal representatives. The Project is being evaluated as a small scale P3 project.
This Study was formulated according to the Act and the Desirability and Convenience Study General Guidelines and will be submitted before the Public-Private Partnerships Authority (the “Authority”) and the Small Scale P3 Project Permanent Committee (“Permanent Committee”) for evaluation and compliance with the Act. This Study was commissioned by MTA and PRITA under the supervision of the Authority and in consultation with its technical advisors, Steer Davies Gleave (“SDG”) and legal counsel Pietrantoni, Mendez & Alvarez LLC (“PMA”).
The Authority appointed KPMG LLP (“KPMG”) as its procurement and financial advisor for the Project. In this role, KPMG undertook a review of SDG’s inputs, assumptions and estimates contained herein, and where applicable, provided recommendations to MTA and PRITA for delivery and structure of the Project. This Study also contains the results of KPMG’s analysis of SDG’s technical inputs.
This Study is based on estimates, assumptions and market information obtained from sources believed to be reliable. Actual results may vary from those anticipated in this Study. Changes in the transit/maritime industry, state and federal laws, market conditions, and shifts in overall economic conditions or other factors may occur, that can alter the assumptions and conclusions presented in the Study. It is recommended that further analysis and due diligence be conducted in subsequent phases of the Project.
The Authority will continue to evaluate and analyze the desirability and convenience of the Project as a P3 as new information becomes available. The Authority will advise the Permanent Committee of any material changes.
The Authority does not make any representation or warranty whatsoever, including representations or warranties as to the accuracy or completeness of the information herein contained, including estimates, forecasts, or extrapolations. In addition, the Study includes certain projections and forward-looking statements provided by SDG with respect to the anticipated future performance based on inputs provided by MTA and PRITA. Such projections and forward-looking statements reflect various assumptions and are subject to significant business, economic and competitive uncertainties and contingencies, many of which are beyond the control of MTA, PRITA, and SDG. Accordingly, there can be no assurance that such projections and forward-looking statements will materialize. The actual results may vary from the anticipated results and such variations may be material. The Authority, MTA, PRITA, SDG, PMA and KPMG expressly disclaim any liability for any representations or warranties, expressed or implied, contained herein or for any omissions from this Study or any related matters.
The Act and the Authority’s regulations, as well as all applicable Puerto Rico and federal laws and regulations, will govern the dissemination of this Study.
TABLE OF CONTENTS
EXECUTIVE SUMMARY .............................................................................................................................. 1
PART A- PLANNING FUTURE SERVICE DELIVERY ............................................................................ 9
PART B- RISK ALLOCATION ANALYSIS .............................................................................................. 16
PART C- COST SAVINGS ANALYSIS....................................................................................................... 19
PART D- AFFORDABLITY ANALYSIS .................................................................................................... 23
CONCLUSION ............................................................................................................................................... 28
APPENDIX A: MTA FACILITIES AND VESSELS
APPENDIX B: SDG REVENUE PROJECTIONS
1
EXECUTIVE SUMMARY
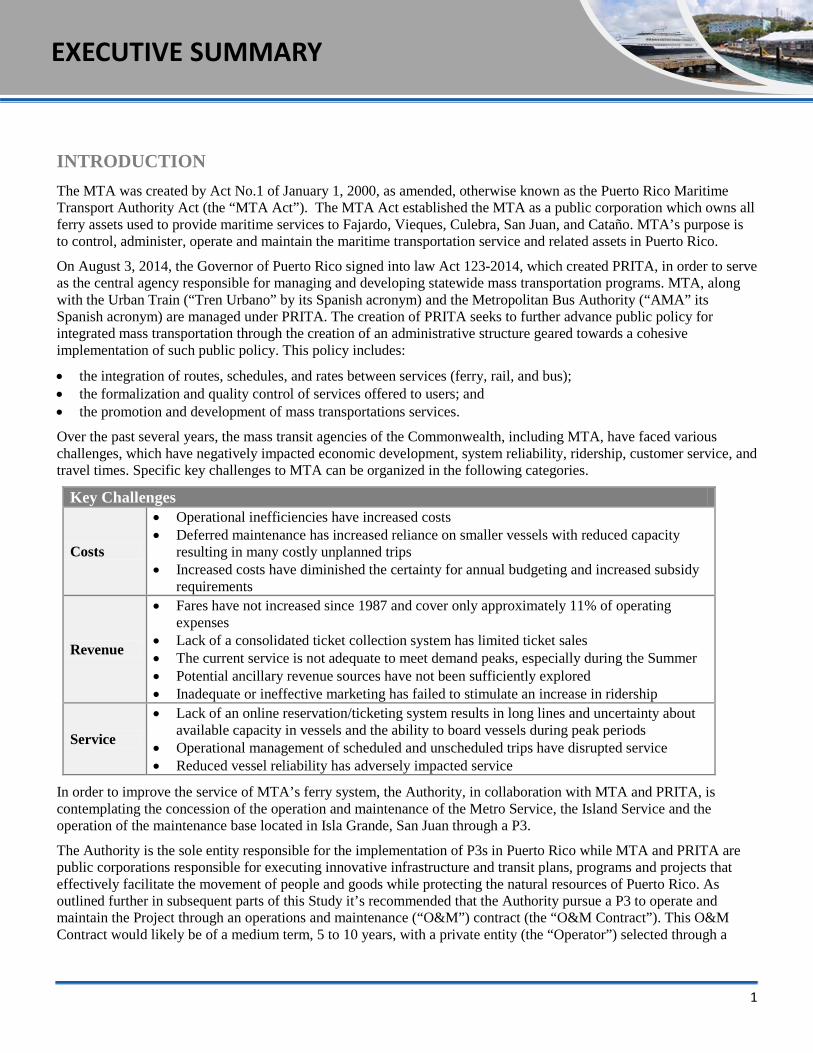
INTRODUCTION The MTA was created by Act No.1 of January 1, 2000, as amended, otherwise known as the Puerto Rico Maritime Transport Authority Act (the “MTA Act”). The MTA Act established the MTA as a public corporation which owns all ferry assets used to provide maritime services to Fajardo, Vieques, Culebra, San Juan, and Cataño. MTA’s purpose is to control, administer, operate and maintain the maritime transportation service and related assets in Puerto Rico.
On August 3, 2014, the Governor of Puerto Rico signed into law Act 123-2014, which created PRITA, in order to serve as the central agency responsible for managing and developing statewide mass transportation programs. MTA, along with the Urban Train (“Tren Urbano” by its Spanish acronym) and the Metropolitan Bus Authority (“AMA” its Spanish acronym) are managed under PRITA. The creation of PRITA seeks to further advance public policy for integrated mass transportation through the creation of an administrative structure geared towards a cohesive implementation of such public policy. This policy includes:
• the integration of routes, schedules, and rates between services (ferry, rail, and bus); • the formalization and quality control of services offered to users; and • the promotion and development of mass transportations services.
Over the past several years, the mass transit agencies of the Commonwealth, including MTA, have faced various challenges, which have negatively impacted economic development, system reliability, ridership, customer service, and travel times. Specific key challenges to MTA can be organized in the following categories.
Key Challenges
Costs
• Operational inefficiencies have increased costs • Deferred maintenance has increased reliance on smaller vessels with reduced capacity
resulting in many costly unplanned trips • Increased costs have diminished the certainty for annual budgeting and increased subsidy
requirements
Revenue
• Fares have not increased since 1987 and cover only approximately 11% of operating expenses
• Lack of a consolidated ticket collection system has limited ticket sales • The current service is not adequate to meet demand peaks, especially during the Summer • Potential ancillary revenue sources have not been sufficiently explored • Inadequate or ineffective marketing has failed to stimulate an increase in ridership
Service
• Lack of an online reservation/ticketing system results in long lines and uncertainty about available capacity in vessels and the ability to board vessels during peak periods
• Operational management of scheduled and unscheduled trips have disrupted service • Reduced vessel reliability has adversely impacted service
In order to improve the service of MTA’s ferry system, the Authority, in collaboration with MTA and PRITA, is contemplating the concession of the operation and maintenance of the Metro Service, the Island Service and the operation of the maintenance base located in Isla Grande, San Juan through a P3.
The Authority is the sole entity responsible for the implementation of P3s in Puerto Rico while MTA and PRITA are public corporations responsible for executing innovative infrastructure and transit plans, programs and projects that effectively facilitate the movement of people and goods while protecting the natural resources of Puerto Rico. As outlined further in subsequent parts of this Study it’s recommended that the Authority pursue a P3 to operate and maintain the Project through an operations and maintenance (“O&M”) contract (the “O&M Contract”). This O&M Contract would likely be of a medium term, 5 to 10 years, with a private entity (the “Operator”) selected through a
EXECUTIVE SUMMARY

2
competitive procurement process that will be compliant with the Federal Transit Administration (“FTA”) guidelines. It is anticipated that full risks related to the operation and maintenance of the ferry service will be transferred to an Operator, with compensation to the Operator sourced from existing public appropriations, applicable federal funding and Project revenues.
Parts A-D of the Study will detail and provide the methodology used to analyze the P3 contemplated by the Authority, PRITA, and MTA.
MTA’S OPERATIONS The MTA operates three scheduled ferry services with sixteen vessels in 5 terminals, running 7 days per week. Figures 1 and 2 show the current Metro and Island routes respectively. The services are split into two main categories: Metro Services and Island Services. The Metro Service operates between Old San Juan and Cataño in the San Juan Bay. The Island Service connects the islands of Vieques and Culebra to Fajardo on the main island. In addition to passenger services, the MTA also provides cargo and fuel transportation to the islands of Vieques and Culebra, as well as transportation for special events. MTA also operates a maintenance base as Isla Grande.
Figure 1: Metro Service
San Juan - Cataño
San Juan - Hato Rey
Maintenance Facility
3
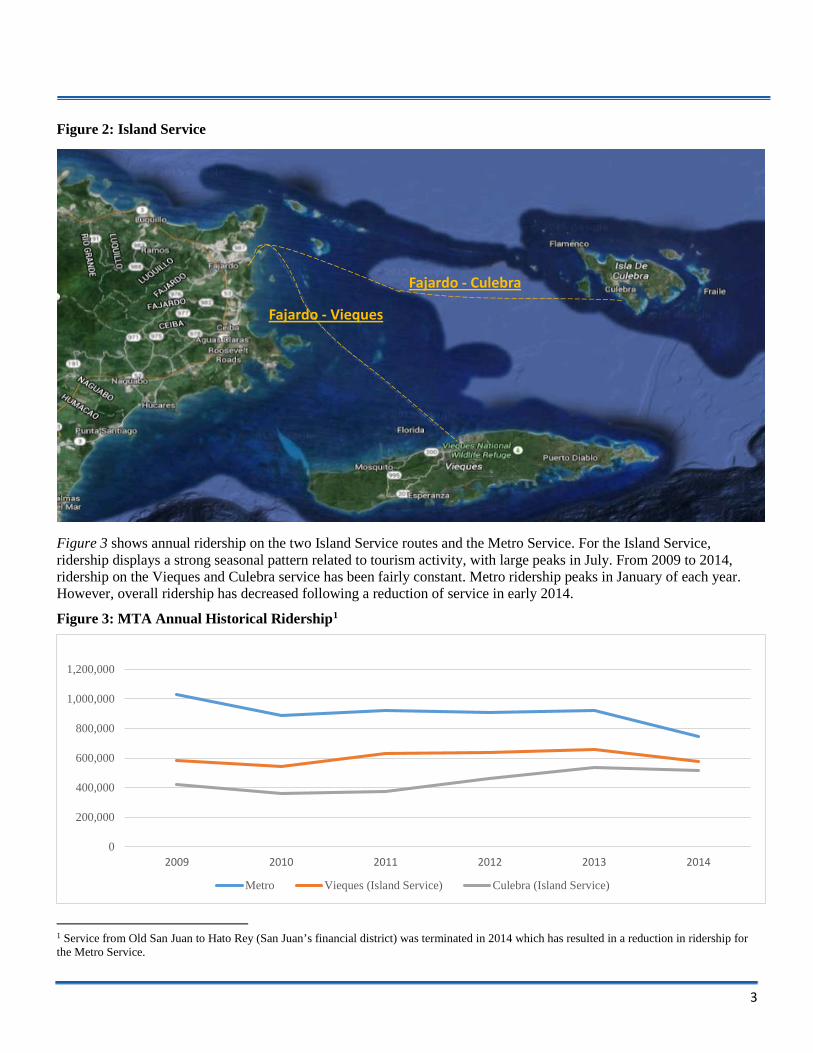
Figure 2: Island Service
Figure 3 shows annual ridership on the two Island Service routes and the Metro Service. For the Island Service, ridership displays a strong seasonal pattern related to tourism activity, with large peaks in July. From 2009 to 2014, ridership on the Vieques and Culebra service has been fairly constant. Metro ridership peaks in January of each year. However, overall ridership has decreased following a reduction of service in early 2014.
Figure 3: MTA Annual Historical Ridership1
1 Service from Old San Juan to Hato Rey (San Juan’s financial district) was terminated in 2014 which has resulted in a reduction in ridership for the Metro Service.
0
200,000
400,000
600,000
800,000
1,000,000
1,200,000
2009 2010 2011 2012 2013 2014
Metro Vieques (Island Service) Culebra (Island Service)
Fajardo - Vieques
Fajardo - Culebra

4
PLANNING FOR FUTURE SERVICE DELIVERY The Project goals established by the MTA and PRITA are to:
• Improve the quality of customer service; • Increase ridership of the Metro and Island Service; • Identify and introduce efficiencies in MTA’s operations by leveraging the private sector’s ferry operations
expertise; and • Increase revenues through improved ancillary services (i.e. food and beverages) not related to ticket fares in order
to reduce net public subsidies.
The expected benefits resulting from the implementation of the Project include:
• Enhance the customer experience and develop a user-friendly system for residents, tourist, and visitors; • Increase productivity due to increased availability of larger vessels; • Increase economic activity in areas adjacent to the terminals; • Increase tourist visits to the offshore islands; • Increase business for local firms involved in the Project’s operation and maintenance; • Increase operational and maintenance cost certainty; • Reduce Commonwealth subsidy; • Improve on time performance and reliability; and • Increase job creation and socioeconomic benefits for Puerto Rico.
Positive Benefit Cost Analysis Results
Part A: Planning for Future Service Delivery of this Study outlines the results of a benefit cost analysis that was conducted to compare the benefits of entering into a P3 O&M Contract versus keeping the current public sector operations (“Status Quo”). The analysis concluded that entering into a P3 O&M Contract would result in a Benefit Cost Ratio of 1.41 to 4.45. Any benefit cost ratio greater than one indicates a positive effect of a P3 delivery model and the Project’s Benefit Cost Ratio well surpasses the P3 Model cost benefit threshold.
Preferred P3 Model - P3 Operations and Maintenance Contract with Full Operational Risk Transfer
The positive results of the Benefit Cost Analysis has allowed MTA and PRITA to consider various delivery options to implement this Project. Based on the Project goals and objectives, a qualitative review has concluded that the Project should be delivered under a P3 O&M Contract with Full Operational Risk Transfer (“P3 Model”). Of the options considered, this option would enable maximum transfer of risk to the private sector with regard to costs and performance while excluding capital investment risk. Part B: Risk Allocation Analysis of the report defines all the risk items that are intended to be transferred to the private sector as part of the P3 Model. Part C: Cost Savings Analysis and Part D: Affordability Analysis of the report aims to quantify the cost savings and reduced net public subsidies associated with this particular P3 Model.

5
RISK ALLOCATION ANALYISIS A detailed analysis of risk allocation was considered in order to define the scope of work required by the Operator in a P3 Model. The objective of the risk allocation analysis is to allocate risks to the party most capable of managing them.
Most risk items will be allocated to or shared with the Operator. However, certain public policy issues such as the determination of fares and routes will be retained by the public sector. MTA and PRITA may consider alternative routes and fares in the near future. However, it is uncertain at the time of issuance of this Study that an alternative route or additional fares will be implemented and the timing of such change. A potential Operator will be required to satisfy all criteria outlined in an O&M Contract under the knowledge that current ferry routes and fares may change in the future. Parts C: Cost Savings Analysis and Part D: Affordability Analysis will quantify the cost savings and reduced net public subsidies of the defined P3 Model.
Based on precedent projects, the Project goals and objectives, and input from MTA, the allocation of risks under the P3 Model is summarized in Figure 4: P3 Delivery Risk Matrix.
2
2 The allocation of risk items are subject to change in subsequent phases of procurement. For example, fuel price risk has been initially identified as a public sector risk, however, this risk allocation may change based on market soundings and/or subsequent input from potential operators.
Risk Items Public Sector
Private Sector Shared
Labor Crew Management X Crew Members X Performance Reporting Monitor and Audit X FTA Required Reporting X Performance Reporting X Database Management X Routes and Schedules Ferry Route X Ferry Schedule X Consumables Fuel (volume) X Fuel (price) X Spare Parts/ Other Parts X Fare box and Ticketing Fare Setting X Integrated Ticketing System X Routine Maintenance/Repair Manufacturer Recommendations X Repairs X Mandatory/Regulatory Inspections X
Federal Compliance X Major Maintenance Capital Improvement Projects X Service Life Extension X Other Strategic Oversight X Security and Surveillance X Insurance X Force Majeure X Federal Approvals X
Figure 4: P3 Delivery Risk Matrix2

6
COST SAVINGS ANALYISIS A cost savings analysis was performed to determine the costs of the P3 Model compared to the Status Quo. Over the past 3 years, MTA’s O&M costs have averaged approximately $39.1 million. Most recently, MTA’s “requested” budget was $45.0 million. Figure 5 details MTA’s historic costs3.
The cost savings from operations and improved service are expected to come from the reduction of personnel fringe benefits, elimination of unscheduled trips, and natural attrition as described in more detail as follows:
• Cost savings from fringe benefits - The total value of fringe benefits (i.e. overtime, paid holidays, workers compensation, etc.) are currently estimated to be approximately 71.3% of the total annual salary of an employee. This is significantly higher than the prevailing maritime industry standard. Under a P3 Model, it is anticipated that the Operator will find efficiencies to align fringe benefits to approximately 30% of base salary (leaving base salary unchanged).
• Cost savings from the elimination of unscheduled trips - MTA often incurs in various additional unscheduled trips for the Island Services. These trips are attributed to many factors, including additional runs resulting from outages of large vessels, special events, and ad hoc trips. It is estimated that 624 unscheduled round-trips are sailed annually resulting in a significant use of resources. Under a P3 Model, most unscheduled trips would be eliminated based on increased operational efficiency and mandatory service schedules which are enforced through an O&M Contract. Subject to FTA approval, additional trips outside of mandatory service schedules may be arranged separately with the Operator.
• Cost savings from natural attrition - The size of the labor force currently at the maintenance base on Isla Grande is not efficiently optimized based on the number of vessels in the MTA Metro and Island Services fleet. Under a P3 Model, it is expected that the Operator will maintain all current staffing levels including the maintenance facility staff for the near term but allow for natural attrition during a 10-year period.
Based on cost savings from fringe benefits, elimination of unscheduled trips, and natural attrition, it is estimated that total first year cost savings are $4.0 million and $44.6 million over a 10-year term. Figure 6: Total Cost Savings from a Private Operator summarizes these cost savings.
It is expected that the Operator will be compensated with a management fee for running the maritime operations. The management fee is generally based on a percentage of the annual O&M Contract amount and can vary as part of a competitive procurement process and the types of risks the Operator is expected to take. Based on industry precedent, it is anticipated that the first year management fee for the
3Historical O&M costs from FY20010 to 2013 are from MTA audited financial statements. Historical O&M costs from FY2014 to 2015 are MTA’s requested funding for required level of services. MTA’s Fiscal Year (“FY”) starts in July 1 of each year, FY2013 costs do not include costs of additional vessel rentals.
Figure 6: Total Cost Savings from a Private Operator
Cost Savings ($millions) First Year Over 10-yr
Contract Term Fringe benefits 1.8 19.7 Elimination of unplanned trips 2.2 24.3
Natural Attrition 0.0 0.6 Total 4.0 44.6
Figure 5: Historic O&M Costs2
0.0
15.0
30.0
45.0
FY 2010 FY 2011 FY 2012 FY 2013 FY 2014 FY 2015
Payroll O&M

7
Project will range from $2.8 to $4.1 million and $30.1 to $45.1 million over 10-years. The Management Fee for this Project will likely be less than anticipated from cost savings generated without taking revenue into account.
The next section will focus on the additional revenues a private operator may be able to generate in a P3.
AFFORDABILITY ANALYSIS The assumptions included in this Study for the financial feasibility are based on analysis prepared by SDG. This assessment is subject to change in subsequent stages of the Project and the Authority will work closely with the Permanent Committee to analyze any changes and the impact to the financial feasibility of the Project. Additions to revenue can be achieved under the P3 Model through increases in ridership due to improved service and ancillary revenue from passenger cargo and concessions.
• Additional Revenues From Ridership - Positive change in service level is expected to result from the ability of a private operator to introduce or make available larger vessels more in-line with industry norms to serve peak periods of demand for the Island Service. Increasing the capacity of each trip by ensuring 90% availability of the larger vessels will satisfy demand for the Island Services, which may increase revenues by approximately $410,000 in the first year.
• Additional Revenues From Passenger Cargo - Additional passenger cargo revenue (coolers, surfboards, etc.) is expected to be generated based on a change in fee structure for passenger cargo. Eliminating costs for certain passenger cargo items but raising them on others may result in an increase in revenues of approximately $27,000 a year.
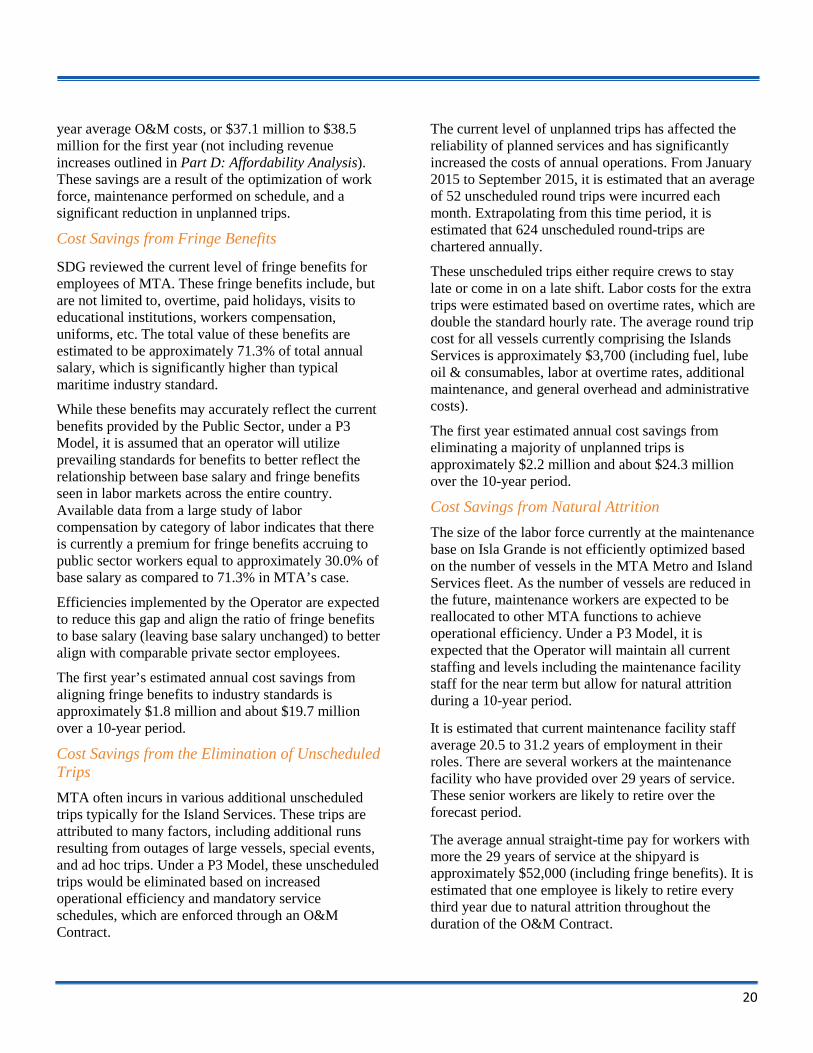
• Additional Revenues From Concessions - After conducting a passenger survey, it is estimated that 60% of passengers will spend on average $4.50 per trip on concessions (including sandwiches, soft drinks, beer and wine, sit-down dining). This results in an additional $290,000 in revenue from concessions in year 1 and $3.1 million over 10 years.
Over the term of the O&M Contract, the cost savings, management fee, and additional revenue will result in a lower net public subsidy for the Commonwealth. The net public subsidy under a P3 Model will range from a low of $32.9 million to a high of $34.2 million in the first year as compared to $34.9 million under the Status Quo scenario. The first year cost Net Public Savings (“NPS”) is estimated to be $622,000 to $2.0 million and $7.1 million to $22.1 million over 10 years.
Figure 7: Projected Net Public Subsidy ($millions)
P3 Model NPS Year 1 Year 2 Year 3 Year 4 Year 5 Year 6 Year 7 Year 8 Year 9 Year 10 Total Low 0.6 0.6 0.7 0.7 0.7 0.7 0.7 0.7 0.8 0.8 7.1 High 2.0 2.0 2.1 2.1 2.2 2.2 2.3 2.3 2.4 2.4 22.1
30.0
35.0
40.0
45.0
Year1
Year2
Year3
Year4
Year5
Year6
Year7
Year8
Year9
Year10
NPS - Public NPS - Private Low Case
30.0
35.0
40.0
45.0
Year1
Year2
Year3
Year4
Year5
Year6
Year7
Year8
Year9
Year10
NPS - Public NPS - Private High Case

8
Payment Mechanism
Three payment mechanisms were considered as part of this Study. These three mechanisms are the cost plus, fixed fee, and lowest public subsidy. Each payment mechanism has its own risk profile that the Authority has analyzed.
Of the three payment mechanism that were analyzed, the lowest public subsidy payment mechanism transfers the most risk to the private sector and aligns private sector incentives with public policy objectives. Based on input from KPMG and SDG, MTA, PRITA, and the Authority’s objectives of providing a predictable required subsidy, we understand that the lowest public subsidy payment mechanism may be the best suited for the Commonwealth.
CONCLUSION After extensive analysis, it is determined that a P3 is the most appropriate method for delivering maritime transportation services. Specifically, the use of an O&M Contract with full operational risk transfer is preferred. Thus, the P3 Model will help reduce costs, increase revenues and improve customer service.
It is important to note, that while the use of the P3 O&M delivery model would facilitate the transfer of key risks in the Project to improve the services, it is not anticipated that risks related to long-term capital investment will be able to be transferred to the private sector.
The key considerations of the Study are the following:
• Project Needs - Improving customer service, implementing operational efficiencies, increasing revenue and ultimately reducing public subsidy of maritime transportation are critical goals for the Project.
• Benefit Cost Analysis (“BCA”) - The BCA shows that benefits in utilizing a P3 Model to improve the service outweigh costs. The B/C ratio ranges from 1.41 to 4.45.
• Selected P3 Model - Based on the Project’s goals and objectives, the private sector model with full operating risk transfer was deemed the best suited P3 Model after a qualitative review.
• Risk Allocation - O&M risk allocation is based on the party best suited to manage the risk and the allocations suggested in this Study are based on market precedent.
• Workforce Optimization - Private sector approach is expected to seek to reduce costs of the operations at the maintenance facility through attrition.
• Fringe Benefits - MTA’s current level of fringe benefits is approximately 71.3% of annual salary as opposed to 30.0%, which is the prevailing level for private sector workers.
• Reduction in unplanned trips - Unplanned trips result in a significant cost to the MTA and a P3 Model will bring the discipline to adhere to scheduled trips.
• Management Fee - The Operator will require a fee for their efforts and the risks/responsibilities they will take. • Passenger Revenue - Increasing the availability of the largest vessels in the fleet may increase passenger revenue
for the Island Service. • Passenger Cargo - Rates have not increased in more than 28 years. Modest changes to passenger cargo rates or
fees may result in additional new revenues. • Concession Revenue - The Operator may have the ability to generate concession revenues (i.e. food and beverage)
on board or at terminals. • Payment Mechanism - Of the three payment mechanisms analyzed, the “Lowest Public Subsidy” model transfers
the most risk to the private sector and best aligns private sector incentives with public policy goals and objectives. • Net Public Subsidy - After combining the potential cost savings with the potential revenue enhancements in a P3,
the net public subsidy will be approximately $32.8 million to $34.2 million in year 1, which is well below current subsidy levels.
• Savings from the Operator - it is anticipated that the Operator will save approximately $622,000 to $2.0 million in year 1 and $7.1 million to $22.1 million over a 10-year period.
Based on the findings noted above, the Project is deemed ready to move to the procurement phase.
9
PART A- PLANNING FUTURE SERVICE DELIVERY
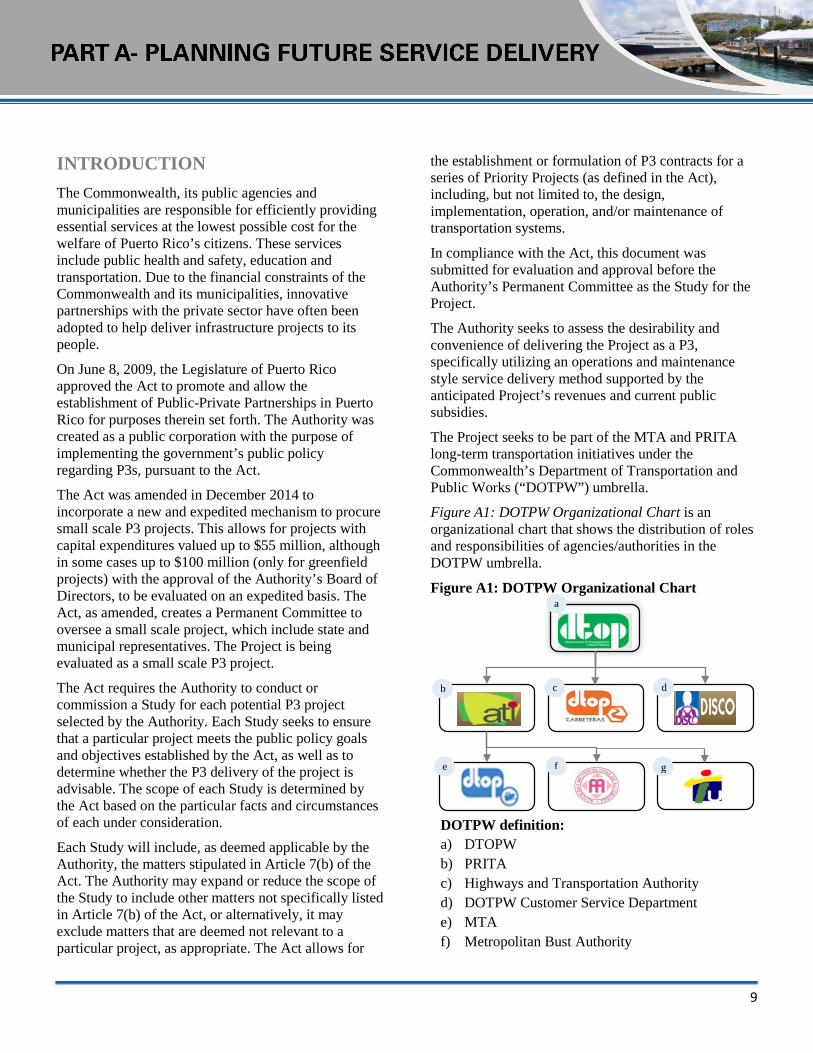
DOTPW definition: a) DTOPW b) PRITA c) Highways and Transportation Authority d) DOTPW Customer Service Department e) MTA f) Metropolitan Bust Authority
INTRODUCTION The Commonwealth, its public agencies and municipalities are responsible for efficiently providing essential services at the lowest possible cost for the welfare of Puerto Rico’s citizens. These services include public health and safety, education and transportation. Due to the financial constraints of the Commonwealth and its municipalities, innovative partnerships with the private sector have often been adopted to help deliver infrastructure projects to its people.
On June 8, 2009, the Legislature of Puerto Rico approved the Act to promote and allow the establishment of Public-Private Partnerships in Puerto Rico for purposes therein set forth. The Authority was created as a public corporation with the purpose of implementing the government’s public policy regarding P3s, pursuant to the Act.
The Act was amended in December 2014 to incorporate a new and expedited mechanism to procure small scale P3 projects. This allows for projects with capital expenditures valued up to $55 million, although in some cases up to $100 million (only for greenfield projects) with the approval of the Authority’s Board of Directors, to be evaluated on an expedited basis. The Act, as amended, creates a Permanent Committee to oversee a small scale project, which include state and municipal representatives. The Project is being evaluated as a small scale P3 project.
The Act requires the Authority to conduct or commission a Study for each potential P3 project selected by the Authority. Each Study seeks to ensure that a particular project meets the public policy goals and objectives established by the Act, as well as to determine whether the P3 delivery of the project is advisable. The scope of each Study is determined by the Act based on the particular facts and circumstances of each under consideration.
Each Study will include, as deemed applicable by the Authority, the matters stipulated in Article 7(b) of the Act. The Authority may expand or reduce the scope of the Study to include other matters not specifically listed in Article 7(b) of the Act, or alternatively, it may exclude matters that are deemed not relevant to a particular project, as appropriate. The Act allows for
the establishment or formulation of P3 contracts for a series of Priority Projects (as defined in the Act), including, but not limited to, the design, implementation, operation, and/or maintenance of transportation systems.
In compliance with the Act, this document was submitted for evaluation and approval before the Authority’s Permanent Committee as the Study for the Project.
The Authority seeks to assess the desirability and convenience of delivering the Project as a P3, specifically utilizing an operations and maintenance style service delivery method supported by the anticipated Project’s revenues and current public subsidies.
The Project seeks to be part of the MTA and PRITA long-term transportation initiatives under the Commonwealth’s Department of Transportation and Public Works (“DOTPW”) umbrella.
Figure A1: DOTPW Organizational Chart is an organizational chart that shows the distribution of roles and responsibilities of agencies/authorities in the DOTPW umbrella.
Figure A1: DOTPW Organizational Chart
DISCO2
a
b c d
e f g

10
Project Description and Need
MTA aims to maintain a reliable and efficient ferry system that effectively connects Culebra and Vieques to the main island of Puerto Rico and services the San Juan Metropolitan Region
The current ferry service can be characterized as:
• Uneconomic, requires some sort of subsidy or economic assistance;
• A lifeline service, highly essential; and • A catalyst for tourism and economic development
For various reasons, MTA has been challenged by the task of maintaining the ferry fleet in a state of good repair and providing consistent and reliable service desired by the people of the Commonwealth.
Metro Service
The Metropolitan Region of San Juan (comprised by the municipalities of Bayamón, Cataño, Guaynabo, San Juan, and Carolina) has seen vast change in the demands of its riders for mass transit since the establishment of the Tren Urbano, a rapid transit train, built in the mid 2000’s. The train has changed the dynamics of mass transportation in the Metropolitan Region. One of PRITA’s main goals is to effectively integrate all forms of mass transit in the Metro region with Tren Urbano as the anchor. The Project contemplates including the Metro Service in this objective by synchronizing its routes with the Tren Urbano and AMA bus services. The objective is to increase the Metro Service reliability, quality, and increase rider mobility efficiently.
Island Service
The residents in both, the islands of Vieques and Culebra, have no other mass transit option provided by the Commonwealth to reach the main island.
In order to effectively develop both islands to their social and economic potential, a reliable ferry service must be established to link residents, businesses, and tourists to the offshore islands and, most importantly, connect island residents to the essential services (i.e.
4 The alternative mode to reach the mainland is to fly, a far more expensive proposition ($34 - $200). 5 The Metro Service passengers were not surveyed due to cost and time constraints. As described later in this report, the Metro Service
health, education, and commercial services) that are provided in the main island as well as to safely transport island residents in the event of a storm or any other emergency event.
Passenger Demographic Overview
The Metro Service is primarily used by commuters to Old San Juan and by visitors to Old San Juan for leisure purposes. The Island Service serves two distinct markets: the first is island residents, for whom the ferries provide the only affordable travel option ($2.00 or $2.25 for Vieques or Culebra each way) to the main island of Puerto Rico4. The other market served is visitors, primarily but not exclusively from the main island of Puerto Rico.
An extensive survey was conducted to better understand the passenger market using the Vieques and Culebra (“Municipal Islands”) services5. Surveys were carried out between August 3, 2015 and August 10, 2015, yielding 1,200 completed surveys.
The survey results suggest that Municipal Island residents account for nearly one-third of passengers.
Figure A2: Islands Service Passenger Demographics
77% of non-residents traveling to the Municipal Islands are primarily doing so for vacation. Residents of the Municipal Islands traveling to the Puerto Rico mainland have varying reasons for doing so, including work, visiting relatives or friends, shopping, or personal business.
Overall, 77% of respondents identified themselves as Puerto Rican. Many of the visitors have family ties to Puerto Rico or the Municipal Islands. 44% of the
market is significantly easier to forecast than the Island Service. The technical consultants considered that an in-depth survey was not essential.
32%
68%
Island Residents
Non Island Residents

11
respondents were visitors living in the continental United States.
Household income for respondents who are visitors is significantly higher than for residents. For visitors, 32% have a household income over $50,000, while only 18% of residents do. The Island Service passengers who are Municipal Island residents are reflective of income levels of the Puerto Rican population as a whole, where only 17% of households have income levels over $50,000.
Figure A3: Median Household Income of Island Services Passengers
Travelers flying between the Municipal Islands and the main island of Puerto Rico were also surveyed for comparison. The air travel market was found to be quite distinct from ferry users. They generally have higher income levels than those using the ferries, but the most striking difference is where these users live. According to the sample of non-ferry users, they are overwhelmingly from outside of Puerto Rico. For this reason, the potential for these users to find the ferry option convenient is arguably limited.
Based on the results of the survey, the current operations of Metro and Island Services we can conclude that:
• Most travelers are Puerto Rico residents traveling on vacation with slightly higher income than island residents;
• Municipal Island residents have lower income than other users of the service and cannot afford other means of transportation;
• It’s rare for a non-Puerto Rico resident to use the ferry option; and
• Ridership may increase if service attracts non-residents on vacation or leisure.
Based on these conclusions, the Project aims to reach the following goals, objectives and benefits.
Project Goals and Objectives • Improve the quality of customer service; • Increase ridership of the Metro and Island Services; • Identify and introduce efficiencies in MTA’s
operations by leveraging the private sector’s ferry operations expertise;
• Increase resources for vessel maintenance to provide a potential for improving service levels and reliability for users; and
• Increase revenues through improved ancillary services (i.e. food and beverages) not related to ticket fare to reduce net public subsidies.
Project Expected Benefits The expected benefits resulting from the implementation of the Project include:
• Improved user-friendly experience for residents, tourists, and visitors, including on-line reservation system, reduced wait-times and additional services and amenities;
• Increased productivity due to increase availability of larger vessels;
• Increased economic activity in adjacent areas; • Increased tourist visits to the offshore islands; • Increased business for local firms involved in the
Project’s operation and maintenance; • Increased operational and maintenance cost
certainty; • Reduced Commonwealth subsidy; • Improved on time performance and reliability; and • Increased job creation and socioeconomic benefits
for Puerto Rico.
BENEFIT-COST ANALYSIS OF THE PROJECT Introduction and explanation of methodology
The methodology employed in the Project BCA compares the benefits of entering into a P3 O&M Contract for existing services and the Status Quo. The comparison is carried out by computing the benefit cost ratio (“B/C”), which compares the incremental benefits of the Project to the incremental costs associated with the Project. The BCA results conducted over the Project term will help inform the decision on pursing the Project
$0
$15,000
$30,000
$45,000
$60,000
Visitors Non-Puerto Rico
Visitors fromPuerto Rico
CulebraResidents
ViequesResidents

12
It is important to note that the current BCA is not a social economic BCA exercise which focuses on social benefits such as travel time savings or safety for passengers. The BCA is focused on the benefits of the net budgetary impacts to MTA and the Commonwealth. It is expected that the Project will result in:
• Considerable cost reductions by private operators which, through a competitive bidding process, may reduce costs even further;
• The potential for a greater use of larger vessels in the fleet which will increase ridership and fare revenue during the peak demand periods on the Island Service; and
• The potential for increased ancillary revenue.
Base Case and P3 Model Comparison The BCA was conducted with careful definition of the Base Case so as not to overstate (or understate) the Project’s benefits. In the current analysis, the following are expected to be implemented in both, the Base Case and P3:
• On-line ticketing for the Island Service, and • Rationalization of the ferry fleet, including
scrapping several outdated vessels.
An analysis of vessel sailings over the last four years makes it clear that there has been frequent need to take larger vessels out of service for maintenance and repairs, which has exacerbated the problem of excess demand during peak months. In order to increase the larger vessels availability, it is expected that the private sector will focus on improving O&M and vessel condition.
Passenger fares are assumed not to increase in either scenario. Maintaining fares at the current level for residents fulfills an important policy objective – maintaining essential transit service to the main island of Puerto Rico at a modest fare.
P3 Model Expected Benefits The following is a description of the expected benefits of the Project:
• A P3 structure is seen as one that can be the basis for a considerable reduction in the number of unscheduled trips on the Island Service that are funded out of the MTA budget.
Under conservative assumptions, a reduction in the cost of unscheduled trips being borne by the MTA would imply an annual cost savings to an operator of over $2.2 million in year 1 of the Project.
• As part of the Project, it is expected that existing MTA employees will transfer to the private operator. However, there is a potential to align fringe benefits with prevailing private sector benefits, generating a source of cost savings. A change in fringe benefits may result in a savings of $1.8 million in year 1 of the Project.
• Currently, the incidence of large vessels being forced out of service is significant. Aligning service reliability to broad industry norms (which will be stipulated in the O&M Contract) could be expected to increase seat availability at peak periods, which would increase ridership and revenue on Culebra and to a lesser extent, Vieques.
• Additionally, the Project permits the increased provision of amenities on vessels and at terminals, such as food and beverage vendors. 60% of survey respondents suggest they would avail themselves of such services. While the revenues are admittedly a partial transfer from other retail sources, the convenience for passengers is a real benefit, as is the potential for revenues that would reduce public sector subsidies.
Benefit-Cost - Analysis Results
Our analysis shows that the potential for operating cost savings, as well as increased service levels on the Culebra and Vieques services are considerable. We estimate that these potential savings would be incorporated into likely bids under a competitively procured P3 that would, in turn, generate real benefits to the Commonwealth. In particular, under conservative assumptions regarding operating cost savings, it is estimated that the Project would generate between $4.2 million and $13.4 million in benefits over

13
a ten-year horizon.6 This range is meant to encompass the cost savings from the expected range of bids submitted by potential Operators for the Project.
The costs of implementing the Project are comprised of the various consultants, a legal advisor, and other costs directly attributable to developing, procuring and overseeing the Project. These costs are generously estimated to total $3.0 million.
The B/C ratio is calculated by dividing total costs savings by Project implementation costs. Thus, for the current Project, the B/C ratio is between 1.41 and 4.45.
Theoretically, a B/C ratio greater than one (1) indicates the proposed Project is economically feasible since the annual benefits expected to improve the transit system surpass the costs of developing the Project. Under all analyzed scenarios, the B/C ratio exceeds one (1) and on this basis the Project is economically feasible.
Therefore, it is advisable that MTA and the Authority in conjunction with PRITA develop a framework to transfer the Metro and Island Services to a qualified private party through a P3 Model.
The following section will detail the methodology used to determine the Preferred Project Model.
PROJECT DELIVERY MODEL Project Delivery Model Comparison - Overview
The BCA has established that the Project will have a positive impact to the Commonwealth. Therefore, the next step is to determine the Preferred Delivery Model for the Project.
6 A nominal discount rate of 10% is used to reflect a private operator’s likely cost of capital. 7 Vessel repair risk is a reflection of the level of routine maintenance or preventive maintenance that will be transferred to
The approach used in this Study is representative of global best practices for evaluating project delivery options and determining the most appropriate option for the Project, considering both qualitative and quantitative factors.
In addition, methodologies utilized as part of this analysis are based on generally accepted principles developed in coordination with academic professionals, industry experts and government practitioners.
The delivery model options evaluated as part of this analysis include:
1. Status Quo (public sector model) – continued delivery of ferry service through a government agency or a non-commercial corporation.
2. Private Sector Operator with Full Operating Risk Transfer (P3 Model) – the private operator would contract with the government for service provision. Most operating risks would be transferred to the private sector. The public sector would retain fuel price risk, vessel ownership, vessel repairs risk7, and vessel acquisition responsibility. The key goal is to align an operator’s incentives with project goals and objectives over the medium term.
3. Private Sector Operator with Full Operating and Capital Investment Risk (P3 Model) – the private operator would contract with the government for service provision. Most operating risk would be assumed in whole by the private sector. The private sector would determine the appropriate requirements for the ferry service
the private operator. Failure to do routine maintenance which results in major maintenance is expected to be a risk borne by the Operator.
Private Sector Operator with Full Operating and Capital Investment Risk
(P3 Model) 10-20 year term
Status Quo (Public sector model)
Private Sector Operator with Full Operating Risk Transfer
(P3 Model) 5-10 year term
Public Private Risk Responsibility
Figure A4: Project Delivery Options Spectrum

14
based on service specifications and acquire the vessels. Under this model, in addition to the risks noted above, the private sector bears the additional risk associated with capital investment in vessel, terminals, and ports. The public sector specifies the service requirement in terms of minimum frequency and total capacity leaving it to the private sector operator to make all capital investments. The capital investment requirement will increase the duration of the contract to 10-20 years allowing the operator time to amortize its investment.
Figure A4: Project Delivery Options Spectrum illustrates the range of delivery models along a spectrum of risk transfer solutions.
Project Delivery Options Analysis - Methodology
The specific methodology for this analysis followed the following key activities:
• Identifying Project goals and objectives - A key initial task undertaken at the outset of the analysis was to engage in robust discussions with MTA and PRITA leadership to identify the key goals and objectives for the Project and procurement. These are used as the underlying principles that guide the subsequent parts of this Study and was used in the selection of the delivery model approach that appears best-suited to the Project.
• Qualitative review - In this phase of the analysis, the range of delivery models outlined above are evaluated against a first “screen” of Project goals and objectives outlined by MTA and PRITA. The outcome of this first-level delivery model screening is to select the Project Model that best achieves the established goals and objectives. Figure A5: Analysis Methodology- Qualitative and Quantitative Review demonstrates the two-phased process to evaluate the qualitative and quantitative aspects of each model. For purposes of this analysis, the Private Sector Operator with Full Operating Risk Transfer Model was identified as the preferred P3 Model best suited to meet those goals and objectives following the first-level qualitative screening. Part B: Risk Allocation Analysis will identify and analyze the
risks of Private Sector Operator with Full Operating Risk Transfer Model. The P3 Model was then compared on a quantitative basis to the Status Quo public sector delivery method as part of the second-level screening.
• Quantitative Review - The second-level
quantitative review process undertaken in connection with this analysis is focused on a cost savings analysis of the traditional public sector model against the P3 Model. Part C: Cost Savings Analysis quantifies cost savings achieved between the Status Quo and the Preferred P3 Model.
• Budget and Funding Analysis - In addition to providing an approach for determining the “best value” delivery solution for the Project, the Cost Savings Analysis also provides an approximation of all-in cost of the Project to the Commonwealth over the assumed contract term.
In an effort to identify sufficient funding for the Project, the analysis includes a high-level evaluation of MTA’s historical budgetary allocations in addition to expected future revenues. Part D: Affordability Analysis will address future budgetary allocations as well as the payment mechanisms the Authority is contemplating to fund the Project.
The outcome of these activities is used to provide insight into the final preferred delivery model for the Project that appears to provide the most advantages to the Commonwealth, with both qualitative and quantitative factors considered. In addition, the analysis provides a discussion of next steps and key takeaways for advancing the Project.

15
KEY CONSIDERATIONS /CONCLUSION • Project Need - Improving customer service,
implementing operational efficiencies, increasing revenue and ultimately reducing public subsidy of maritime transportation are critical goals for the Project.
• Competing Modes - Current passengers of the Island Service are mainly Puerto Rico residents with median incomes significantly less than Non-Puerto Rico residents thus making this system a lifeline service which needs to be improved.
• Additional Ridership - Non-resident tourists use alternative modes of transport resulting in lost opportunities to increase ridership. An improved service may result in additional ridership.
• Benefit Cost Analysis - The BCA shows that benefits in utilizing a P3 Model to improve the service outweigh costs. The B/C ratio ranges from 1.41 to 4.45.
• Selected P3 Model - Based on the Project’s goals and objectives, the Private Sector Model with Full Operating Risk Transfer was deemed the best suited P3 Model after a qualitative review.
Criteria: MTA and PRITA Goals and Objectives
Scre
en 1
: Qua
litat
ive
Rev
iew
Criteria: Cost Savings Analysis
Status Quo (Public Sector Model)
Private Sector Operator with Full Operating Risk Transfer
(P3 Model)
Private Sector Operator with Full Operating and Vessel Risk
(P3 Model)
Status Quo (Public Sector Model)
Private Sector Operator with Full Operating Risk Transfer
(P3 Model)
Scre
en 1
: Q
uant
itativ
e Re
view
Private Sector Operator with Full Operating Risk Transfer (P3 Model)
Procurement Fina
l Sel
ectio
n
Figure A5: Analysis Methodology - Qualitative and Quantitative Review

16
PART B- RISK ALLOCATION ANALYSIS
O&M P3 Delivery Risk Analysis
The Act promotes the establishment of P3s for the delivery of priority projects and, among other things, to foster the development, operations and maintenance of infrastructure facilities. The benefits of P3s include the allocation of risks of a given project between the public and private sector to the party who is best able to manage them, improving the services and functions of the government, fostering job creation and promoting the socioeconomic development and competitiveness of the country.
Pursuant to the Act, the Permanent Committee shall define all risks associated with delivering the Project as a P3.
P3s can take many forms, each of which presents a different risk profile to the public and private sectors. It is important to compare and detail all risks of the P3 delivery option for a given project to the traditional delivery method.
Under the proposed P3 Model, enabled by the Act, MTA assets shall be owned by MTA throughout and following the duration of the O&M Contract, and the Operator shall have no ownership interest therein. The private Operator shall perform its responsibilities under the O&M Contract as an independent contractor and shall not have any legal, equitable, tax, beneficial or other ownership or leasehold interest in MTA assets.
Risk Allocation and Risk Sharing
The objectives of risk allocation may vary depending on unique project goals, but certain fundamental tenets of sound risk allocation should always be observed, namely:
• To allocate risks to the party that is most capable of managing them in a cost-effective manner;
• To align risk mitigation with Project goals; • To share risks when deemed appropriate to
accomplish Project goals; and • To allocate risks when addressing customer-
oriented and other performance related goals.
Based on precedent transactions and input from market participants, the Authority believes a P3 Model with
8 The allocation of risk items are subject to change in subsequent phases of procurement. For example, fuel price risk has been initially identified as a public sector risk, however, this risk
full operating risk transfer can properly balance the risk allocation for the Project. This model has been used successfully in the U.S. and abroad for transportation projects, including ferry systems. Figure B1: P3 Delivery Risk Matrix illustrate all risk retained, allocated or shared with the private sector.
Examples of this model include: • Anderson Island Ferry: owned by Pierce
County, Washington • St. Johns River Ferry: owned by the City of
Jacksonville, Florida • Gees Bend Ferry: owned by Alabama DOT • Fundy Island Ferry: New Brunswick, Canada
Figure B1: P3 Delivery Risk Matrix8
Risk Items Public Sector
Private Sector Shared
Labor Crew Management X Crew Members X Performance Reporting Monitor and Audit X FTA Required Reporting X Performance Reporting X Database Management X Routes and Schedules Ferry Route X Ferry Schedule X Consumables Fuel (volume) X Fuel (price) X Spare Parts/ Other X Fare box and Ticketing Fare Setting X Integrated Ticketing System X Routine Maintenance/Repair Manufacturer Recommendations X Repairs X Mandatory/Regulatory Inspections X Federal Compliance X Major Maintenance Capital Improvement Projects X Service Life Extension X Other Strategic Oversight X Security and Surveillance X Insurance X Force Majeure X Federal Approvals X
allocation may change based on market soundings and/or subsequent input from potential operators.

17
Considerations of P3 Delivery Risks
Labor - Labor risk will be fully transferred to the private sector. Operational management as well as vessel crew members will be the responsibility of the Operator. A limited number of high-level strategic employees of MTA will be retained to provide O&M Contract management. These public sector employees will supervise holistic operational performance, retain knowledge transferred from the Operator, and enforce the terms outlined in the O&M Contract.
Performance Reporting - Various reports are currently generated off of data collected during operations of the ferry system. Reporting is critical in order to monitor operational performance and often mandated by the FTA in order to receive continued funding. The P3 Model intends to require the operator to maintain financial and operational data of ferry operations in databases compliant with FTA reporting requirements. PRITA will retain the responsibility for FTA reporting and will submit all FTA required reporting based on data supplied by the operator. MTA will also retain the right to oversee and audit any reports submitted by the operator.
Ferry Route and Schedule - During the course of the O&M Contract, it is anticipated that traffic patterns and regional demographics may change. The public sector intends to retain determination of all changes in ferry routes and schedules subject to FTA approval. However, MTA will seek input from the private operator to provide input and suggestions for potential changes in route and schedule to optimize revenue and ridership. MTA considers the private operator to be subject matter experts in daily ferry operations.
Consumables - The current ferry system consumes fuel, lube oil, filters, supplies, and spare parts as part of daily operations.
Fuel is currently procured through the Highway and Transportation Authority and allocated to MTA based on the volume required to run daily operations. MTA is looking to minimize the cost and volume of fuel consumed. Therefore, under a P3 Model, MTA would like to opt for the lowest cost and volume solution by considering suggestions and solutions provided by the private operator. The risk related to price, however, will likely have to remain a public sector risk based on market precedent. Trying to transfer commodity price risk over long periods of time may result in higher
costs to the Commonwealth (related to price contingencies) or not be accepted by Operators. The Authority believes it will be possible to transfer the risk related to the volume of fuel consumed (per distance or period) which will help mitigate the Commonwealth’s risk, at least in part, to total fuel cost.
The risk of lubricant, filters, and spare parts procurement will be retained by the private operator subject to availability and approval from the private sector and subject to FTA guidelines. The Operator shall be responsible for all financing (i.e. working capital), if any, required to meet this obligations under the O&M Contract.
Fare Box and Ticketing -The public sector will retain full control over fare policy. However, the Operator will be able to make suggestions related to fares in order to increase revenue and ridership.
The private sector will be obligated to make, at its own cost, the technology enhancements necessary to establish a reliable online ticketing and reservations system and implement a computerized fare collection system for the Metro region that will be fully integrated with PRITA system. The Operator shall also develop a new customer service center for the Metro region to be located at a Tren Urbano Center.
Routine Maintenance - MTA currently performs two types of routine maintenance: the maintenance recommended by manufactures of parts and machinery (based on miles and hours of operation) as well as maintenance required to achieve annual federal compliance. Mandatory/regulatory inspections should include, but not be limited to, the United States Coast Guard Certificate of Inspection. Both forms of routine maintenance will be required to be transferred to the private operator under a P3 Model.
Major Maintenance - Major Maintenance is currently classified as Strategic Capital Improvement Projects and Service Life Extension Maintenance.
The P3 Model allocates risks related to Strategic Capital Improvement Projects requiring large capital investment for public policy initiatives related to terminals, piers, and vessels to the public sector. The Operator will have the opportunity to provide input and suggestions for these projects, however the ultimate decision to proceed with and fund these projects will be the responsibility of MTA and PRITA.

18
Similarly, Major Maintenance Projects related to Service Life Extension Maintenance will be retained by the public sector. Please note, however, that these two types of Major Maintenance projects are a reflection of the level of routine maintenance or preventive maintenance that will be transferred to the private operator. Failure to do routine maintenance which results in major maintenance is expected to be a risk borne by the Operator.
Insurance - The operator will be required to get insurance to cover risks which are commercially insurable at a reasonable cost. MTA will be responsible for obtaining any insurance requirement that is not commercially obtainable by the Operator.
Other Risks - Other risks include security and surveillance, force majeure, strategic oversight and obtaining federal approvals.
Security and Surveillance under a P3 Model is to be maintained by the private sector. The Operator will be required to maintain a safe and secure operation which will be subject to review by MTA and PRITA.
Force Majeure is a shared risk on the occurrence of certain specified events outside the control of the parties. These events shall meet the condition of materially and adversely affecting the performance of the Operator’s obligations and that such events could not have been foreseen or avoided by the exercise of caution.
Risk related to strategic oversight of the maritime transportation services will be retained by the public sector. This includes long-term service planning, capital planning, etc.
All Federal Approvals necessary under the term of the P3 O&M Contract shall be the responsibility of the public sector. The Operator will be responsible for providing the MTA and PRITA any necessary information and/or data to support any federal approval process.
KEY CONSIDERATIONS /CONCLUSION • Selected Model - It was determined that a P3 with
full O&M risk transfer best aligns with the Project’s goals and objectives.
• Risk Allocation - O&M risk allocation is based on the party best suited to manage the risk. The risk allocations suggested in this Study are based on market precedent.

19
PART C- COST SAVINGS ANALYSIS
COST SAVINGS ANALYSIS In this Study, Part A: Planning for Future Service Delivery qualitatively analyzed the cost of the Status Quo and how it compares to the P3 Model (Private Operator with Full Operation and Maintenance Risk Transfer). This section aims to quantify the benefits of a 10-year P3 Model through cost savings achieved during the contracted term.
Summary of Current Public Ferry Operation Costs
Historical Costs (FY 2010 -2015)
MTA’s FY 2015 requested O&M budget was approximately $45 million. Over the past 3 years, O&M costs have averaged $39.1 million, with a low of $34.2 million and a high of $45.0 million. The variability is primarily the result of unplanned maintenance. As it can be seen in Figure C2, all costs, except Materials & Spare Parts, are very stable. The use of a P3 will likely result in maintenance being performed when scheduled, thereby minimizing volatility and improving reliability. The reduction in allocated funds coincides with the overall economic downturn of the Commonwealth during the past several years.
Figure C1: Historical O&M Costs9 ($millions)
9 Historical O&M costs from FY 20010 to 2013 are from MTA audited financial statements. Historical O&M costs from FY 2014 to 2015 are MTA's requested funding for required level of services. FY 2013 costs do not include costs of additional vessel rentals.
Figure C2: Detailed Historic O&M Costs6 ($millions)
Historical Costs
FY 2010
FY 2011
FY 2012
FY 2013
FY 2014
FY 2015
Payroll 18.5 18.2 21.3 21.0 19.2 20.2
Insurance 2.4 2.3 2.5 2.7 2.9 3.0
Professional Services 2.2 2.4 2.3 2.9 3.3 3.3
Miscellaneous & Utilities - - - - 1.2 2.1
Materials & Spare Parts 7.6 7.7 12.4 11.6 7.6 16.4
Total 30.8 30.7 38.5 38.2 34.2 45.0
Figure C3 details the three year average annual breakdown of MTA’s total operations and maintenance costs. From FY 2012 to 2013, Payroll has averaged to be $20.1 million and Materials & Spare Parts has averaged to be $11.8 million. These are MTA’s largest operations and maintenance costs amounting to 82% of the average annual budget. The P3 Model will be able to reduce these costs by implementing efficient labor practices and reducing the use of Materials & Spare Parts resulting from the reduction of unplanned trips.
Figure C3: FY 2013 to FY 2015 Average O&M Costs
DESCRIPTION OF PRIVATE FERRY OPERATOR COST SAVINGS Based on the current level of service, it is anticipated that the Operator could run the maritime operations at approximately $4.0 million annually below the three
0.0
15.0
30.0
45.0
FY 2010 FY 2011 FY 2012 FY 2013 FY 2014 FY 2015
Payroll O&M
52%
7% 8%3%
30%
Payroll
Insurance
Professional Services
Miscellaneous and Utilitiesand UtilitiesMaterials and Spare Parts
20
year average O&M costs, or $37.1 million to $38.5 million for the first year (not including revenue increases outlined in Part D: Affordability Analysis). These savings are a result of the optimization of work force, maintenance performed on schedule, and a significant reduction in unplanned trips.
Cost Savings from Fringe Benefits
SDG reviewed the current level of fringe benefits for employees of MTA. These fringe benefits include, but are not limited to, overtime, paid holidays, visits to educational institutions, workers compensation, uniforms, etc. The total value of these benefits are estimated to be approximately 71.3% of total annual salary, which is significantly higher than typical maritime industry standard.
While these benefits may accurately reflect the current benefits provided by the Public Sector, under a P3 Model, it is assumed that an operator will utilize prevailing standards for benefits to better reflect the relationship between base salary and fringe benefits seen in labor markets across the entire country. Available data from a large study of labor compensation by category of labor indicates that there is currently a premium for fringe benefits accruing to public sector workers equal to approximately 30.0% of base salary as compared to 71.3% in MTA’s case.
Efficiencies implemented by the Operator are expected to reduce this gap and align the ratio of fringe benefits to base salary (leaving base salary unchanged) to better align with comparable private sector employees.
The first year’s estimated annual cost savings from aligning fringe benefits to industry standards is approximately $1.8 million and about $19.7 million over a 10-year period.
Cost Savings from the Elimination of Unscheduled Trips MTA often incurs in various additional unscheduled trips typically for the Island Services. These trips are attributed to many factors, including additional runs resulting from outages of large vessels, special events, and ad hoc trips. Under a P3 Model, these unscheduled trips would be eliminated based on increased operational efficiency and mandatory service schedules, which are enforced through an O&M Contract.
The current level of unplanned trips has affected the reliability of planned services and has significantly increased the costs of annual operations. From January 2015 to September 2015, it is estimated that an average of 52 unscheduled round trips were incurred each month. Extrapolating from this time period, it is estimated that 624 unscheduled round-trips are chartered annually.
These unscheduled trips either require crews to stay late or come in on a late shift. Labor costs for the extra trips were estimated based on overtime rates, which are double the standard hourly rate. The average round trip cost for all vessels currently comprising the Islands Services is approximately $3,700 (including fuel, lube oil & consumables, labor at overtime rates, additional maintenance, and general overhead and administrative costs).
The first year estimated annual cost savings from eliminating a majority of unplanned trips is approximately $2.2 million and about $24.3 million over the 10-year period.
Cost Savings from Natural Attrition The size of the labor force currently at the maintenance base on Isla Grande is not efficiently optimized based on the number of vessels in the MTA Metro and Island Services fleet. As the number of vessels are reduced in the future, maintenance workers are expected to be reallocated to other MTA functions to achieve operational efficiency. Under a P3 Model, it is expected that the Operator will maintain all current staffing and levels including the maintenance facility staff for the near term but allow for natural attrition during a 10-year period.
It is estimated that current maintenance facility staff average 20.5 to 31.2 years of employment in their roles. There are several workers at the maintenance facility who have provided over 29 years of service. These senior workers are likely to retire over the forecast period.
The average annual straight-time pay for workers with more the 29 years of service at the shipyard is approximately $52,000 (including fringe benefits). It is estimated that one employee is likely to retire every third year due to natural attrition throughout the duration of the O&M Contract.

21
There are currently no cost savings anticipated for the first year through natural attrition, however there is an expected cost savings of $647,000 over a 10-year period.
Summary of Private Ferry Operation Costs Savings
Cost savings result from private sector practices in a competitive environment to optimize project O&M costs. Based on cost savings from fringe benefits, elimination of unscheduled trips, and natural attrition, it is estimated that total first year cost savings are approximately $4.0 million and about $44.6 million over a 10-year period.
Figure C4: Total Cost Savings From a Private Operator
Cost Savings ($millions) First Year Over 10-year
period Fringe benefits 1.8 19.7 Elimination of unplanned trips 2.2 24.3
Natural Attrition 0.0 0.6
Total 4.0 44.6
Figure C5: Projected Annual O&M Savings illustrates the total annual Project Cost Savings in a P3 Model.
Figure C5: Projected Annual O&M Savings ($millions)
Potential future Alternative Technical Concepts (“ATC”) provided by Private Sector
As part of the O&M procurement, PRITA, MTA and the Authority plan to engage in discussions with qualified proponents during the procurement process about potential operational and strategic improvements that can be made to the Metro and Island Services to improve the quality and minimize net public subsidy for the services.
MTA, PRITA, and the Authority will look to operators to provide innovative solutions that promote efficiencies, reduce risks, increase revenues, and/or reduce net public subsidy. Through a flexible contracting process known as Alternative Technical Concepts (“ATC”), contractors can submit innovative, cost-effective solutions that are equal to or better than the Commonwealth’s O&M criteria.
MTA, PRITA, and the Authority will then review ATC submissions during the procurement process and grant approval of the concept on a pass-fail basis. If the concept is acceptable, the proposer may incorporate this concept in its technical and price proposal. This process allows contractors to submit innovative concepts and solutions on a confidential manner.
MTA wishes to discuss examples, including recommendations, on future vessel purchases, terminal locations, onsite parking facilities, fuel procurement methodology, improvements to facility, marketing, advertising, and new commercial services offered to passengers.
Private Sector Management Fee
It is expected that the Operator be paid a management fee for running the maritime operations. The management fee is generally based on a percentage of the annual O&M Contract amount and can vary during the competitive procurement process and depending on the types of risks the Operator is expected to take. The Commonwealth will be evaluating management fee proposals in detail as this fee has a direct effect on actual cost savings achieved. The Authority, MTA, and PRITA’s objective is to minimize this fee for the Commonwealth. Based on industry precedent, it is anticipated that the first year management fee for this project will range from $2.8 million to $4.1 million and $30.1 million to $45.1 million over 10-years. The management fee for this Project is expected to be less
3.5
4.0
4.5
5.0
5.5
Year1
Year2
Year3
Year4
Year5
Year6
Year7
Year8
Year9
Year10

22
than the anticipated cost savings generated even without taking revenue into account.
KEY CONSIDERATIONS /CONCLUSION • Historic O&M Costs - Annual O&M costs have
averaged $39.1 million over the past 3 years with a high of $45.0 million in FY 2015 and a low of $34.2 million in FY 2014.
• Workforce Optimization - Private sector approach is expected to seek to reduce costs of the operations at the maintenance facility through attrition. There are no savings anticipated for the first year however there is an expected cost savings of $647,000 over a 10-year period.
• Fringe Benefits - MTA’s current level of fringe benefits are approximately 71.3% of annual salary as opposed to 30.0%, which is the prevailing level for private sector workers within the industry. Private ferry operations are expected to result in lower fringe benefit expenses of $1.8 million in year 1 and $19.7 million over a 10-year period.
• Reduction in unplanned trips - Unplanned trips result in a significant cost to the MTA and a P3 Model will bring the discipline to adhere to scheduled trips resulting in a saving of $2.2 million in year 1 and $24.3 million over 10 years. Subject to FTA approval, additional trips outside of mandatory service schedules may be arranged separately with the Operator.
• Management Fee - The Operator will require a management fee for their efforts and the risks/responsibilities they will take. The amount ranges from $2.8 million to $4.1 million in year 1 and $30.1 million to $45.1 million over 10 years.
• ATC - During the procurement process, the Authority and MTA would accept and evaluate proposed ATC’s which the proposer deems fit. ATCs may be used for concepts which reduce costs, increase revenues or improve customer service.
• Net Cost Savings - After taking into account the management fees, the net cost savings of a P3 Model range from negative $1.0 million to $1.2 million in year 1 and $3.2 million to $14.5 million over 10 years (not taking revenues into consideration).

23
PART D- AFFORDABLITY ANALYSIS
FUNDING ANALYSIS This section outlines historic funding and how future revenues may be enhanced through a P3. It will also discuss how the enhanced revenues, when combined with the cost savings outlined in Part C: Cost Savings Analysis, will help reduce the Commonwealth’s subsidy requirements for maritime transportation services.
Current Funding Sources and Requirements
Historically, the MTA has relied primarily on three primary sources of funding for the Project. The sources are listed below:
• Federal Grants - Historically, these grants have been provided by the FTA or the United States Department of Transportation (“USDOT”) and have been used for purchase, repair and heavy maintenance of vessels. This source tends to fluctuate over time depending on the maintenance requirements and life cycle cost required by individual vessels.
• MTA Revenues - sourced exclusively from ticket fares. Fares have not increased since 1987 making the service very affordable. Fare revenue and ridership have been very stable averaging $4.3 million over the last three years.
• Commonwealth General Fund - awarded on a yearly basis and appropriated by the Commonwealth’s Legislative Assembly. These funds are typically used to pay for operational expenses and capital expenditures. The Commonwealth retains the risk of fully funding operations to the extent other sources are insufficient. The Commonwealth is relied upon to close the funding gap. In addition to the primary sources of funding listed above, MTA has received non-recurring grants which are obtained under a specific program from the Federal Government or Commonwealth, as part of a one-time initiative for a specific purpose (i.e. economic development, earmarked funds, etc.). Over the last five years, MTA has received non-recurring grants from the following sources:
10 Historical O&M costs from 2009 to 2012 are from MTA audited financial statements. Historical O&M costs from 2013 to 2014 are MTA's requested funding for required level of services
• Federal American Reconstruction Act Funds (ARRA) - grants awarded under specific uses that are deemed acceptable by ARRA. These grants are non-recurring and MTA has fully used its allocation.
• Public Appropriations - special grants provided by the Commonwealth’s Legislative Assembly by a particular act or law.
Figure D1: MTA’s Historical Funding Sources details MTA’s historical funding sources from 2009 to 2014.
Figure D1: MTA’s Historical Funding Sources10 ($millions)
Potential sources of funding available for payment to a private operator are through the Commonwealth’s General Fund and MTA fare revenues. As part of the P3 procurement process, the Authority will be working with the Commonwealth to identify the proper source and level of funding to compensate the Operator under the P3 Model. The Operator will be incentivized through the contract to obtain additional federal grants to be used for major maintenance which could reduce the Operator’s costs of operations and maintenance.
The P3 Model aims to lower the annual subsidy required by the Commonwealth by achieving the following:
• Maximize the use of federal grants; • Increase ridership and MTA Revenues; and by • Providing a reduced and predictable required
subsidy from the Commonwealth.
0.0
15.0
30.0
45.0
FY 2010 FY 2011 FY 2012 FY 2013 FY 2014 FY 2015
Commonwealth Subsidy Federal GrantsMTA Revenues Federal ARRA

24
P3 Model Revenue Analysis Additional Revenues From Ridership
This section outlines the key assumptions used to determine revenue estimates. The additional revenues from ridership under the P3 Model does not assume any changes in fares nor a change in service levels for the Project.
As part of the P3 Model, fare policy and rate setting will remain with the Commonwealth. MTA, PRITA, and the Authority are currently exploring various fare setting regimes in order to minimize the total public subsidy required for the Project.
Service level change is an assumed result from the Operator bringing the availability of larger vessels up to industry norms and serving peak periods of demand for the Island Services. The P3 Model is intended to increase vessel maintenance, allowing the larger vessels to operate 90% of the time.
Based on a detailed analysis of past sailings by vessels in the fleet, it is clear that there has been a considerable variation of seat availability, especially for the Island Service. Increasing the capacity of each trip by ensuring 90% availability of the larger vessels will satisfy demand for the Culebra-Fajardo route that will, in turn, result in increased revenue.
The increase in service levels will lead to significant increases in revenues, particularly for the Fajardo-Culebra service where the constraints of available vessel capacity is felt strongest. The increased available capacity is expected to result in an initial jump in revenue starting July in 2016 of approximately $378,00011 per year for Culebra.
The Metro Services, in contrast, is not seen as a source of potential revenue increases due to capacity increases as there is no indication that capacity levels are acting as a constraint on ridership12.
11 The econometric model estimates increased revenues in the first year to be over $378,000 for Culebra and nearly $32,000 for Vieques. The large differential reflect the greater capacity constraint for the Culebra service. 12 This is in contrast to frequency which, as mentioned at the outset of this report, was reduced on the Metro Service with considerable effect on ridership in 2014.
Figure D2: MTA Historical and Forecast Revenues ($millions)13
Figure D2 shows projected MTA revenue through 2025. The P3 Model is assumed to take effect in Year 1. Revenue jumps up initially due to increased service capacity, and then grows modestly over time in line with economic growth.
Additional Ancillary Revenue
Passenger Cargo
Additional ancillary revenue is expected based on analysis performed by Advantage Business Consulting (“Advantage”)14. The economic analysis of a varied fee structure for passenger cargo (coolers, surfboards, etc.) on island services suggests that additional potential revenue may be generated.
Based on a review of fare structures at other (primarily leisure) ferry systems in the U.S. Virgin Islands and mainland U.S., Advantage finds that eliminating costs for certain passenger cargo items but raising them on others, results in an increase in revenues of approximately $27,000 a year.
The analysis is one that rests on industry benchmarks and is expected to be implemented as part of a P3 Model.
13 Historical revenue from FY2012 to 2013 are audited figures. Figures from FY2014 to 2015 are non-audited and based on MTA estimates. 14 Advantage Business Consulting, 2015. Revisión de Tarifas de Carga: Transportación Marítima: Fajardo-Vieques –Culebra. Informe final preparado para la Autoridad de Transporte Integrado.
0.0
2.0
4.0
6.0
Forecast
25
Concession Revenue
The analysis of potential concession revenues was based on the results of the passenger survey conducted by SDG.15 Among the various questions posed to respondents, there were several addressing the issue of concessions, currently not offered either at the terminal or on-board.
60% of respondents indicated that they were likely to purchase amenities such as food or drinks, either on-board or at the Fajardo terminal. Based on the expressed interest in various items (including sandwiches, soft drinks, beer and wine, sit-down dining), an estimate of $4.50 in purchases per passenger may be assumed. Assuming spending of $4.50 per trip of 60% of the passengers, yielded an estimated annual gross revenue of $2.9 million a year.
After assuming a 10% profit on concession revenue, the private sector may earn an additional $290,000 in year 1 and $3.1 million over a 10-year period, which would be included in the bid for the net subsidy of operations.
Figure D3 shows the projected operating expenditures and revenues for the Status Quo and the P3 Model.
The estimated public subsidy would be the O&M costs of a private operator plus all revenues generated from a
15 Surveys were carried out between August 3, 2015 and August 10, 2015. Most of the 1,200 completed surveys occurred on-board the ferries to or from Vieques or Culebra (76%); 11% occurred at terminals at Fajardo, Culebra or
private operator. It is also assumed that the private operator would collect a management fee to offset the costs of risk transfer as discussed earlier.
It is anticipated that the net public subsidy required by the private sector may fluctuate between $32.8 million to $34.2 million in year 1(including the management fee that is based on industry benchmarks.) The graph below shows the annual net public subsidy under a P3 Model versus the forecasted subsidy of the Status Quo. It is expected that the private operator will save approximately $622,000 to $1.9 million in year 1 and $7.1 million to $21.0 million over a 10-year period.
Figure D4 shows the annual projected Net Public Subsidy (high and low) as it compares with the current Public Subsidy
Vieques; 4% occurred at the Culebra or Vieques airport; and the remainder occurred at various locations on both islands.
Figure D3: Projected Operating Expenditure and Revenue ($millions)
30.0
35.0
40.0
45.0
FY2012
FY2013
FY2014
FY2015
Year 1Year 2Year 3Year 4Year 5
Historic Operating Expenses Public Operating ExpensesPrivate Operating Expenses
0.0
1.0
2.0
3.0
4.0
5.0
6.0
FY2012
FY2013
FY2014
FY2015
Year 1 Year 2 Year 3 Year 4 Year 5
Historic Revenue Public Revenue Private Revenue
Forecast Forecast

26
Potential Payment Mechanisms
Three payment mechanisms were considered as part of this Study. These three mechanisms are the Cost Plus, Fixed Fee, and Lowest Public Subsidy. Each payment mechanism has its own risk profile and the Authority together with its advisors have analyzed each option.
Figure D5 illustrates the spectrum of public subsidies and the predictability of each payment mechanism.
“Cost Plus” Private Sector Payment
• The private sector is reimbursed for actual operation and maintenance costs with a markup as a management fee.
• This model transfers the least amount of risk to the private sector but may be easier to procure and
quickly facilitate public policy goals. However, in this case, the Commonwealth retains significant risks around operating costs as there is no incentive to limit or reduce them.
“Fixed Fee” Private Sector Payment
• The private sector partner is selected based on the lowest fixed fee bid for a given term for a given scope of work defined by the public sector.
• This model may be supplemented with a revenue sharing arrangement to incentivize growth in ancillary revenues.
• This method begins to cap the Commonwealth’s costs and transfer risk to the private sector.
Figure D4: Projected Net Public Subsidy (“NPS”) ($millions)
NPS Savings Year 1 Year 2 Year 3 Year 4 Year 5 Year 6 Year 7 Year 8 Year 9 Year 10 Total Low 0.6 0.6 0.7 0.7 0.7 0.7 0.7 0.7 0.8 0.8 7.1 High 2.0 2.0 2.1 2.1 2.2 2.2 2.3 2.3 2.4 2.4 22.1
30.0
35.0
40.0
45.0
Year1
Year2
Year3
Year4
Year5
Year6
Year7
Year8
Year9
Year10
NPS - Public NPS - Private Low Case
30.0
35.0
40.0
45.0
Year1
Year2
Year3
Year4
Year5
Year6
Year7
Year8
Year9
Year10
NPS - Public NPS - Private High Case
Figure D5: Summary of Payment Mechanisms
Payment Mechanism Cost to the Commonwealth Revenue to the
Commonwealth Evaluation
Criteria Predictability of Public Subsidy
Cost Plus actual O&M cost plus (+) markup all project revenue markup low
Fixed Fee fixed O&M costs all project revenue O&M costs medium
Lowest Subsidy fixed O&M cost minus (-) all project revenue none public subsidy high

27
“Lowest Public Subsidy” Private Sector Payment
• The private sector partner is selected based on the lowest general fund public subsidy required for a given scope of work defined by the public sector. This directly accounts for both, limiting/reducing operational costs and increasing revenues.
• This payment mechanism will require the private operator to include not only cost assumptions into their fixed price bid, but also revenue assumptions.
• Of the three payment mechanisms analyzed, Lowest Public Subsidy transfers the most risk to the private sector and best aligns private sector incentives with public policy goals and objectives. Based on MTA, PRITA, and the Authority’s objectives of providing a predictable required subsidy, the Authority together with its advisors believe the Lowest Public Subsidy option may be the best suited for the Commonwealth.
KEY CONSIDERATIONS /CONCLUSION • Passenger Revenue - Increasing the availability of
the largest vessels in the fleet may increase passenger revenues for the Island Service by $410,000 per year.
• Passenger Cargo - Rates have not increased in more than 28 years. Modest changes to passenger cargo fees and rates may result in approximately $27,000 in new revenues in year 1 and $283,000 over a 10-year period. No changes to passenger fares are anticipated.
• Concession Revenue - The Operator may have the ability to generate concession revenues (i.e. food and beverage) on board or at terminals that may generate an additional $294,000 in revenues on year 1 and $3.1 million over a 10-year period.
• Total Revenue - Taken together, the P3 Model may help generate $730,000 in additional revenues in year 1 and $7.6 million over a 10-year period.
• Payment Mechanism - Of the three payment mechanisms analyzed, the “Lowest Public Subsidy” model transfers the most risk to the private sector and best aligns private sector incentives with public policy goals and objectives.
• Public Subsidy - As is typical for most public transportation projects, particularly ferries, the Project relies heavily on public subsidies in the
form of contributions from the Commonwealth’s general fund.
• Net Public Subsidy - After combining the cost savings with the revenue enhancements in a P3, the net public subsidy will be approximately $32.8 million to $34.2 million in year 1, which is well below current subsidy levels.
• Savings from the Operator - it is anticipated that the operator will save approximately $622,000 to $2.0 million in year 1 and $7.1 million to $22.1 million over a 10-year period.

28
CONCLUSION
CONCLUSION The Project delivered under an O&M Contract with full operational risk transfer is the preferred delivery method. This model will help the Commonwealth transfer significant risk to the private sector and significantly improve the Metro and Island Services by reducing delays, decreasing vessel non-operational time, and improving the overall quality of service.
While the use of the P3 O&M delivery model would facilitate the transfer of key risks in the Project to improve the services, it is not anticipated that risks related to capital investment will be able to be transferred to the private sector.
SUMMARY OF FINDINGS Planning for Future Service Delivery
• Project Need - Improving customer service, implementing operational efficiencies, increasing revenue and ultimately reducing public subsidy of maritime transportation are critical goals for the Project.
• Competing Modes - Current passengers of the Island Service are mainly Puerto Rico residents with median incomes significantly less than non-Puerto Rico residents, thus making this system a lifeline service which needs to be improved.
• Additional Ridership - Non-resident tourists use alternative modes of transport resulting in lost opportunities to increase ridership. An improved service may result in additional ridership.
• Benefit Cost Analysis - The BCA shows that benefits in utilizing a P3 Model to improve the service outweigh costs. The B/C ratio ranges from 1.41 to 4.45.
• Selected P3 Model - Based on the Project’s goals and objectives, the Private Sector Model with Full Operating Risk Transfer was deemed the best suited P3 Model after a qualitative review.
Risk Allocation Analysis
• Selected Model - It was determined that a P3 with full O&M risk transfer best aligns with the Project’s goals and objectives.
• Risk Allocation - O&M risk allocation is based on the party best suited to manage the risk. The risk allocations suggested in this Study are based on market precedent.
Cost Savings Analysis
• Historic O&M Costs - Annual O&M costs have averaged $39.1 million over the past 3 years with a high of $45.0 million in FY 2015 and a low of $34.2 million in FY 2014.
• Workforce Optimization - Private sector approach is expected to seek to reduce costs of the operations at the maintenance facility through attrition. There are no savings anticipated for the first year, however there is an expected cost savings of $647,000 over a 10-year period through natural attrition.
• Fringe Benefits - MTA’s current level of fringe benefits are approximately 71.3% of annual salary as opposed to 30.0%, which is the prevailing level for private sector workers within the industry. Private ferry operations are expected to result in lower fringe benefit expenses of $1.8 million in year 1 and $19.7 million over a 10-year period.
• Reduction in unplanned trips - Unplanned trips result in a significant cost to the MTA and a P3 Model will bring the discipline to adhere to scheduled trips resulting in a savings of $2.2 million in year 1 and $24.3 million over 10 years.
• Management Fee - The Operator will require a management fee for their efforts and the risks/responsibilities they will take. The amount ranges from $2.8 million to $4.1 million in year 1 and $30.1 million to $45.1 million over 10 years.
As outlined herein, this analysis concludes that the P3 O&M Delivery Model with Full Operating Risk Transfer appears to represent the most advantageous approach to delivering the Project as compared to the current method of delivery. This outcome has been derived based on a comprehensive evaluation of both qualitative and quantitative factors using broadly accepted methodological principles for delivery model comparisons from the US and globally.

29
• ATC - During the procurement process, the Authority and MTA would accept and evaluate proposed ATC’s which the proposer deems fit. ATCs may be used for concepts which reduce costs, increase revenues or improve customer service.
• Net Cost Savings - After taking into account the management fees, the net cost savings of a P3 Model ranges from negative $1.0 million to $1.2 million in year 1 and $3.2 million to $14.5 million over 10 years (not taking revenues into consideration).
Affordability Analysis
• Passenger Revenue - Increasing the availability of the largest vessels in the fleet may increase passenger revenues for the Island Service by $410,000 per year.
• Passenger Cargo - Rates have not increased in more than 28 years. Modest changes to passenger cargo fees and rates may result in approximately $27,000 in new revenues in year 1 and $283,000 over a 10 year period. No changes to passenger fares are anticipated.
• Concession Revenue - The Operator may have the ability to generate concession revenues (i.e. food and beverage) on board or at terminals that may generate an additional $294,000 in revenues on year 1 and $3.1 million over a 10-year period.
• Total Revenue - Taken together, the P3 Model may help generate $730,000 in additional revenues in year 1 and $7.6 million over a 10-year period.
• Payment Mechanism - Of the three payment mechanisms analyzed, the “Lowest Public Subsidy” model transfers the most risk to the private sector and best aligns private sector incentives with public policy goals and objectives.
• Public Subsidy - As is typical for most public transportation projects, particularly ferries, the Project relies heavily on public subsidies in the form of contributions from the Commonwealth’s general fund.
• Net Public Subsidy - After combining the cost savings with the revenue enhancements in a P3, the net public subsidy will be approximately $32.8 million to $34.2 million in year 1, which is well below current subsidy levels.
• Savings from the Operator - It is anticipated that the operator will save approximately $622,000 to $2.0 million in year 1 and $7.1 million to $22.1 million over a 10-year period.

30
NEXT STEPS
Below are the key next steps for the Project: • Conduct market outreach after issuance of the Study • Draft procurement documents • Commence procurement • Draft O&M Contract
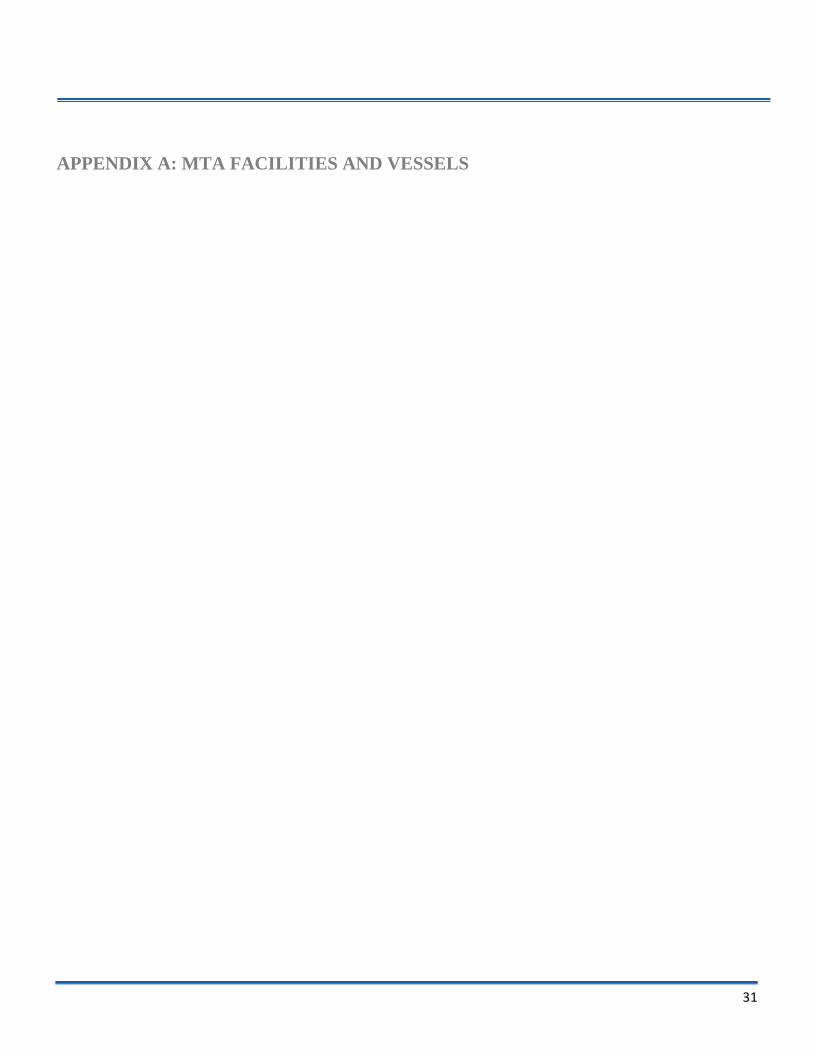
31
APPENDIX A: MTA FACILITIES AND VESSELS
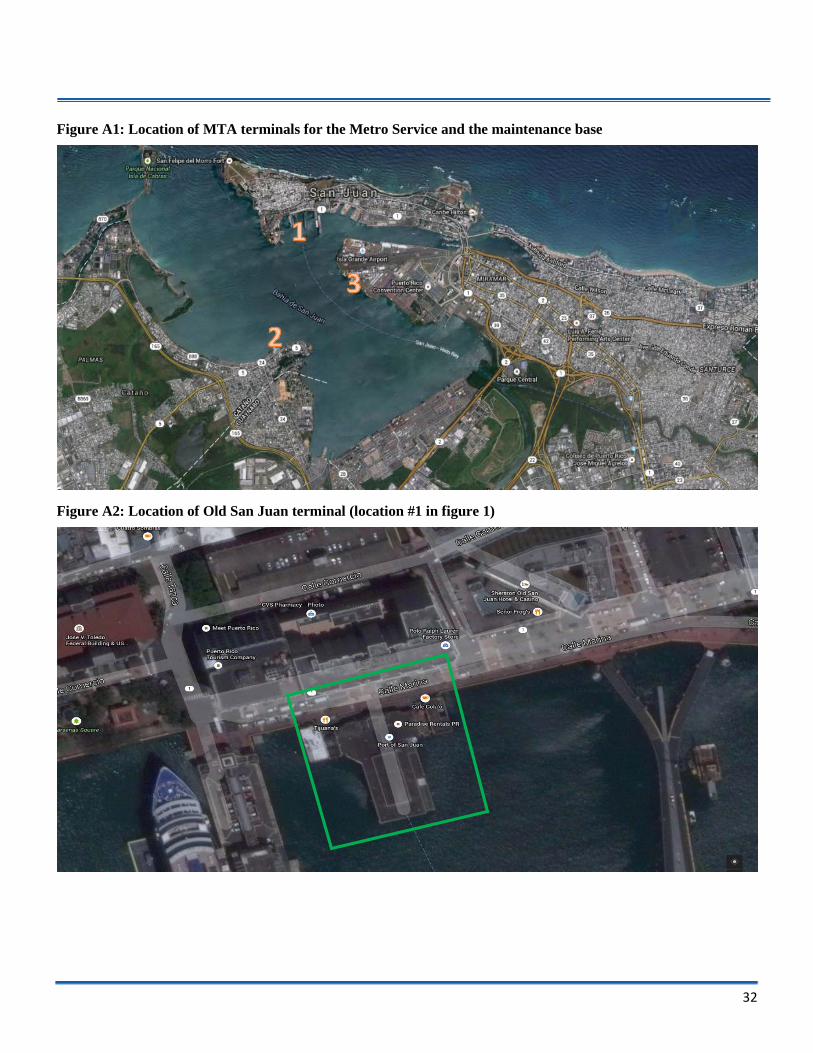
32
Figure A1: Location of MTA terminals for the Metro Service and the maintenance base
Figure A2: Location of Old San Juan terminal (location #1 in figure 1)
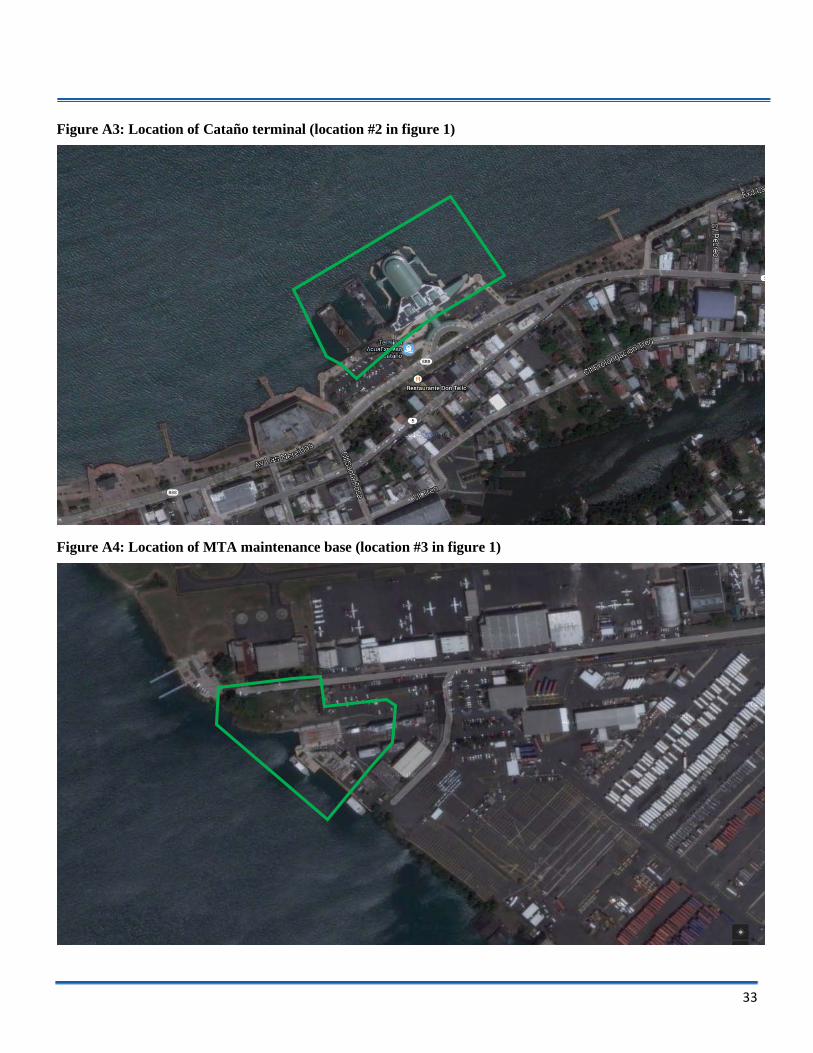
33
Figure A3: Location of Cataño terminal (location #2 in figure 1)
Figure A4: Location of MTA maintenance base (location #3 in figure 1)

34
Figure A5: Location of MTA terminals for the Island Service
Figure A6: Location of MTA terminal (location #5 in figure 5)
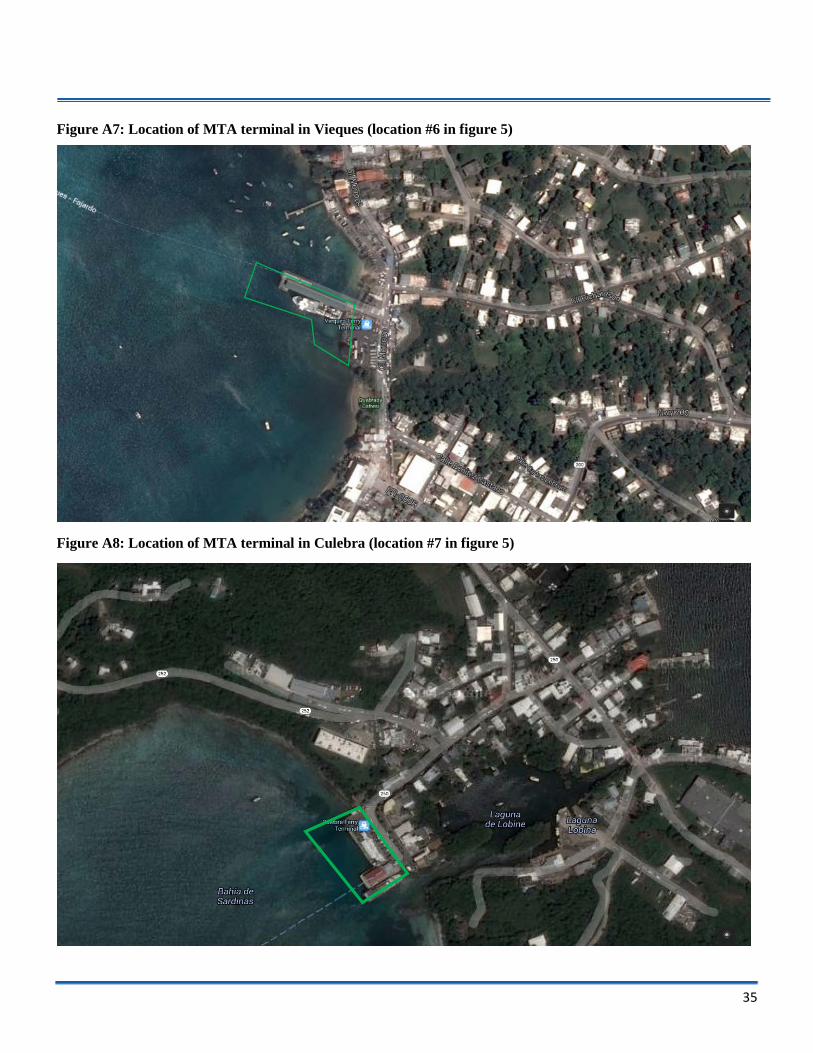
35
Figure A7: Location of MTA terminal in Vieques (location #6 in figure 5)
Figure A8: Location of MTA terminal in Culebra (location #7 in figure 5)

36
MTA has a total of 22 vessels; 11 for the Metro Service and 11 for the Island Service. Metro Service vessels: La Niña, La Danza, La Plena, La Salsa, Cristobal Colón, and Viejo San Juan are in the process of being disposed.
Figure A9: Vessel information for Island Service
Figure A10: Vessel information for Metro Service
Vessel Off. Number LOA (Ft.) Year Built Type Pass. Cap. Deck Cap. # M/E Brand M/E Model M/E Brand Transmission # Generators Brand Generators KW GeneratorsAtlantis 1063840 80 1998 Passenger 290 n.a. 4 Caterpillar 3412 ZF 2 n.a. n.a.Caribeña 1153441 89.5 2004 Passenger 236 n.a. 2 MTU 12V2000 Nicco (TwinDisc) 2 John Deere 40KW
Cayo Blanco 1221191 160 2009 Passenger 600 n.a. 4 MTU 12V4000 Twin Disc 2 John Deere 80KWCayo Largo 1212869 160 2008 Ferry 300 LT 300 4 MTU 12V4000 Twin Disc 2 John Deere 60KWCayo Norte 1033227 155 1995 Ferry 198 LT 197.6 4 Detroit 12V92 Twin Disc 2 Detroit 30KWCulebra II 1041850 150 1996 Passenger 523 n.a. 4 Detroit 16v92 Twin Disc 2 n.a. n.a.Fajardo II 1047275 95.0 1996 Passenger 272 n.a. 2 Detroit 16V92 Twin Disc 2 Perkins 40KW
Isla Bonita 1242571 180 2012 Ferry 355 LT 202.96 4 Cummins QS38 Twin Disc 2 John Deere 55KWIsleño 1157743 155 2004 Ferry 204 LT 197.6 4 MTU 12V2000 Twin Disc 2 Lugger 40KW
Santa María 965338 155 1990 Ferry 137 LT 197.6* 4 Detroit 12V92 Twin Disc 2 John Deere 40KWVieques II 1041579 150 1996 Passenger 523 n.a. 4 Detroit 16v92 Twin Disc 2 n.a. n.a.
Vessel Off. Number LOA (Ft.) Year Built Type Pass. Cap. Deck Cap. # M/E Brand M/E Model M/E Brand Transmission # Generators Brand Generators Brand Generators/motor KW Generators
Amelia 954592 R-75.4 1989 Passenger 146 3 2 Detroit 12V71 Twin Disc 5114 1 lima Perkins 35Covadonga 961359 R-75.4 1990 Passenger 146 3 2 Detroit 12V71 Twin Disc 5114 1 lima Perkins 35
Cristobal Colon 961259 R-75.4 1990 Passenger 146 3 2 Detroit 12V71 Twin Disc 5114 1 lima Perkins 35Viejo San Juan 959501 R-75.4 1990 Passenger 146 3 2 Detroit 12V71 Twin Disc 5114 1 lima Perkins 35
La Pinta 932498 R-83.8 1988 Passenger 146 3 2 Detroit 12V71 Twin Disc 514 1 n.a. John Deere n.a.La Nina 925559 R-83.8 1987 Passenger 146 3 2 Detroit 12V71 Twin Disc 514 1 n.a. John Deere n.a.
La Danza 1216036 R-45 2008 Passenger 49 3 2 Mercury f/t 300 n.a 0 0 0 0La Salsa 1216034 R-45 2008 Passenger 49 3 2 Mercury f/t 300 n.a 0 0 0 0La Plena 1212881 R-45 2008 Passenger 49 3 2 Mercury f/t 300 n.a 0 0 0 0
La Decima 1221847 R-45 2009 Passenger 49 3 2 cummins QLSM ZF 0 0 0 0La Princesa 1221854 R-70.4 2009 Passenger 146 3 2 MTU 8V2000 ZF 2 John Deere n.a n.a.

37
APPENDIX B: SDG REVENUE PROJECTIONS Assumptions and Analytical Approach
C1. Ridership and Revenue Models
The ridership and associated revenues for the Metro Service and Island Service were developed based on econometric models specifically developed for this analysis because each service displays differences in the type of market served (urban versus island/leisure) as well as differential growth trends.
As a result, separate ridership models were developed for Culebra to Fajardo, Vieques to Fajardo and the Metro Service to maximize the value of the available ridership data, which are based on monthly data going back to January 2011. Each model estimates the observed relationship between economic growth (in this case Total Nonfarm Employment in Puerto Rico) and service levels (calculated as the number of available vessels seats in each month).
The statistical results confirm that the relationships are statistically significant, and the models do well in explaining past ridership trends.
The actual magnitude of the effects of economic growth and service availability varies by service. For the Metro Service, there is no service level effect, and ridership growth is closely tied to employment growth. Every 10% increase in Nonfarm Employment results in a 12% increase in ridership. For Culebra, where certain sailings cannot accommodate all users, the effect of increasing service levels is particularly pronounced: 10% increase in seats available on vessels increases ridership by over 5%, and a 10% increase in Nonfarm Employment results in a nearly 15% increase in ridership.
For Vieques, the service level impact is significant but more modest, with a 10% increase in seats available on vessels increasing ridership by 0.6%, and a 10% increase in Nonfarm Employment results in a nearly 35% increase in ridership.
The estimated response to service levels changes figures importantly in the BCA, where a private operator would be expected to increase the availability of vessel capacity given the difficulty in meeting peak period passenger demand, especially during summer months.
The estimation of additional ridership under a private operator therefore involved generating service levels (in other words, vessel capacity or vessels seats) that would reflect observed industry norms for the given fleet. This primarily involves assuming vessel sailings by the larger boats in the Island Service that would reflect these norms. The estimated increase in passengers on the Vieques and Culebra routes is then estimated using the parameters from the econometric models.
The base growth in passengers on the three services (irrespective of service levels changes) is driven by forecasts for employment growth. Forecasts for Nonfarm Employment in Puerto Rico provided by Moody’s call for steady but low growth: to 2035, annual growth is on average about 0.2% a year. This low growth yields quite low growth for all services under assumptions of constant fares and service levels. For Island Service, revenues under a constant fare level are projected to decline in real terms annually by close to 2 per cent on average to 2026 reflecting the fact that inflation is expected to rise at a faster rate than the effect of Nonfarm Employment16.
There is similarly no fare or service increases assumed for Metro, and its revenues decline in real terms by close to 2 per cent per year.
16 If revenues were presented in nominal term, they would show a slow increase every year. In real terms, adjusting for inflation, revenues actually decline slowly every year.

38
C2. Cargo Revenues
The team relied on previous research carried out by Advantage Business Consulting (Advantage).17 The economic analysis of fare changes on the Island Service on passenger cargo (coolers, surfboards, etc.) suggested that potential revenue increases from changes in the fare structure could be expected.
Based on a review of fare structures at other (primarily leisure) ferry systems in the US Virgin Islands and mainland, Advantage finds that eliminating fares for certain items but raising them on others results in an increase in revenues of $27,000 a year.
The analysis is one that rests on observing benchmarks-namely other ferry systems – and attributing the observed trends to the Island Service.
C3. Concession Revenues
The analysis of potential concession revenues was based on the results of the passenger survey conducted by the consultant team.18 Among the various questions posed to respondents, there were several addressing the issue of concessions, currently not offered either at the terminal or on-board.
60% of respondents indicated they were likely to purchase amenities such as food or drinks either on-board or at the Fajardo terminal. Based on the expressed interest in various items (including sandwiches, soft drinks, beer and wine, sit-down dining), an estimate of $4.50 in purchases per passenger making a purchase was derived. Applying $4.50 to 60% of the passengers yielded estimated annual purchases of $2.9 million a year.
17 Advantage Business Consulting, 2015. Revisión de Tarifas de Carga: Transportación Marítima: Fajardo-Vieques –Culebra. Informe final preparado para la Autoridad de Transporte Integrado. 18 Surveys were carried out between August 3, 2015 and August 10, 2015. Most of the 1,200 completed surveys occurred on-board the ferries to or from Vieques or Culebra (76%); 11% occurred at terminals at Fajardo, Culebra or Vieques; 4% occurred at the Culebra or Vieques airport; and the remainder occurred at various locations on both islands.

39
Assuming that the operator would then be allowed to earn a 10% fee on these revenues, an annual profit of over $290,000 was derived. This figure is then included as part of the potential revenues that would be factored into any bid submitted by a potential operator of the Island and Metro services.
Figure C1: Interest in Amenities Reported by Respondents Using the Island Service
Source: Steer Davies Gleave
31%
14%15%
40%
Yes, I would buy foodor drinks at the terminal
Yes, I would buy foodor drinks on the ferry
Yes, I would buy foodor drinks both at theterminal and on theferry