examining the role of body image, body mass index, body ... · table 4 descriptive statistics for...
TRANSCRIPT

Copyright is owned by the Author of the thesis. Permission is given for a copy to be downloaded by an individual for the purpose of research and private study only. The thesis may not be reproduced elsewhere without the permission of the Author.
i
Examining the role of body image, body mass index,
body esteem, and perfectionism in anti-fat attitudes: A
comparison of gymnasium and non-gymnasium users
A thesis presented in partial fulfilment of the requirements for the degree of
Master of Science
in
Psychology
at Massey University, Albany,
New Zealand.
Kim Ironside
2016
ii
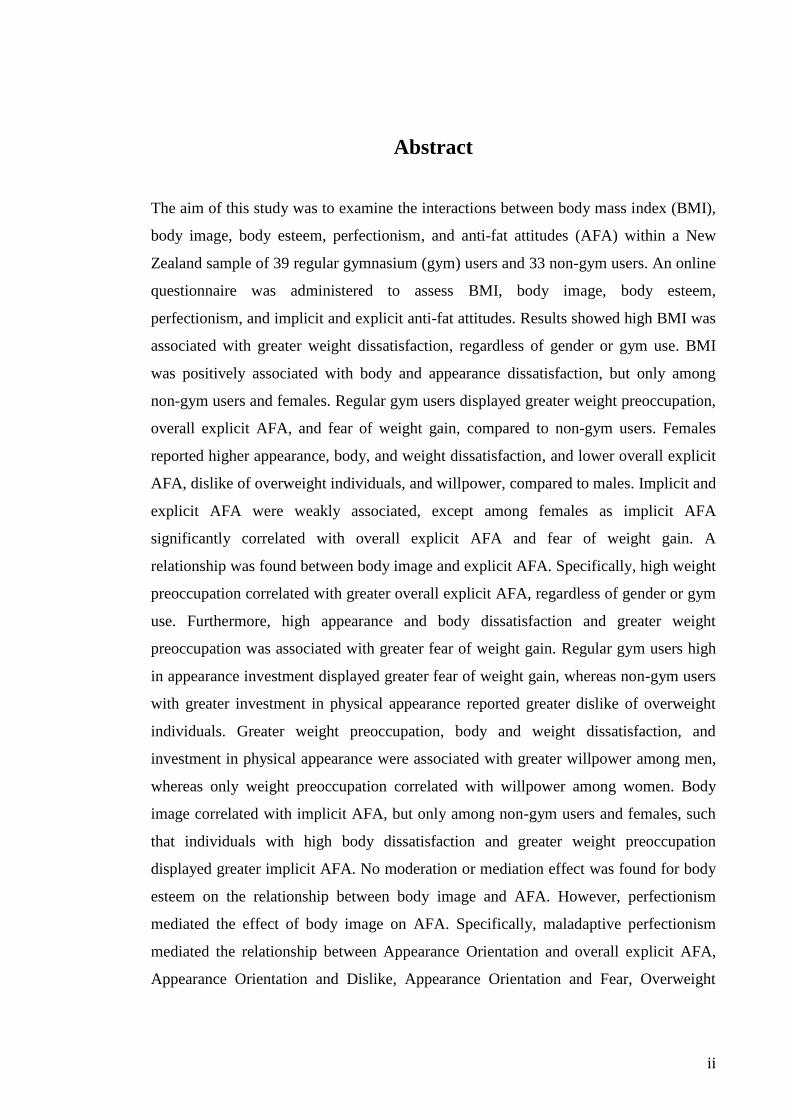
Abstract
The aim of this study was to examine the interactions between body mass index (BMI),
body image, body esteem, perfectionism, and anti-fat attitudes (AFA) within a New
Zealand sample of 39 regular gymnasium (gym) users and 33 non-gym users. An online
questionnaire was administered to assess BMI, body image, body esteem,
perfectionism, and implicit and explicit anti-fat attitudes. Results showed high BMI was
associated with greater weight dissatisfaction, regardless of gender or gym use. BMI
was positively associated with body and appearance dissatisfaction, but only among
non-gym users and females. Regular gym users displayed greater weight preoccupation,
overall explicit AFA, and fear of weight gain, compared to non-gym users. Females
reported higher appearance, body, and weight dissatisfaction, and lower overall explicit
AFA, dislike of overweight individuals, and willpower, compared to males. Implicit and
explicit AFA were weakly associated, except among females as implicit AFA
significantly correlated with overall explicit AFA and fear of weight gain. A
relationship was found between body image and explicit AFA. Specifically, high weight
preoccupation correlated with greater overall explicit AFA, regardless of gender or gym
use. Furthermore, high appearance and body dissatisfaction and greater weight
preoccupation was associated with greater fear of weight gain. Regular gym users high
in appearance investment displayed greater fear of weight gain, whereas non-gym users
with greater investment in physical appearance reported greater dislike of overweight
individuals. Greater weight preoccupation, body and weight dissatisfaction, and
investment in physical appearance were associated with greater willpower among men,
whereas only weight preoccupation correlated with willpower among women. Body
image correlated with implicit AFA, but only among non-gym users and females, such
that individuals with high body dissatisfaction and greater weight preoccupation
displayed greater implicit AFA. No moderation or mediation effect was found for body
esteem on the relationship between body image and AFA. However, perfectionism
mediated the effect of body image on AFA. Specifically, maladaptive perfectionism
mediated the relationship between Appearance Orientation and overall explicit AFA,
Appearance Orientation and Dislike, Appearance Orientation and Fear, Overweight
iii
Preoccupation and overall explicit AFA, and Overweight Preoccupation and Fear.
Directions for future research and implications within a fitness context are discussed.

iv
Acknowledgments
I would like to thank my supervisor Dr. Richard Fletcher for his guidance, support, and
encouragement throughout this thesis. Your valuable advice and feedback was greatly
appreciated.
Thank you to Harvey Jones and Malcolm Loudon for their time and assistance with the
development of the questionnaire and the Implicit Association Test.
I would also like to acknowledge all the participants who took part in this research
study. Thank you for offering your time as this thesis would have not been possible
without you.
Lastly, thank you to my family and Henry for your love, support, and encouragement
throughout the course of this thesis.
This project has been reviewed and approved by the Massey University Northern
Region Human Ethics Committee.

v
Table of Contents
Title Page........................................................................................................................... i
Abstract ............................................................................................................................ ii
Acknowledgements ......................................................................................................... iv
Table of Contents ............................................................................................................ v
List of Tables ................................................................................................................ viii
List of Figures .................................................................................................................. x
Introduction ..................................................................................................................... 1
Overview ................................................................................................................................... 1
Anti-Fat Attitudes, Body Image, Body Mass Index, Body Esteem, and Perfectionism ..... 2
Anti-Fat Attitudes .................................................................................................................. 2
Body Image ........................................................................................................................... 4
Body Mass Index ................................................................................................................... 6
Body Esteem ......................................................................................................................... 6
Perfectionism ......................................................................................................................... 8
Relationship between Body Image, Body Mass Index, Body Esteem, Perfectionism, and
Anti-Fat Attitudes .................................................................................................................. 10
Body Mass Index and Body Image ..................................................................................... 10
Body Image and Anti-Fat Attitudes .................................................................................... 11
Body Image, Perfectionism, and Anti-Fat Attitudes ........................................................... 12
Body Image and Perfectionism ....................................................................................... 12
Perfectionism and Anti-Fat Attitudes ............................................................................. 13
Body Image, Body Esteem, and Anti-Fat Attitudes ............................................................ 14
Body Image and Body Esteem ........................................................................................ 14
Body Esteem and Anti-Fat Attitudes .............................................................................. 15
Summary ................................................................................................................................ 16
Present Study ......................................................................................................................... 17
Rationale ............................................................................................................................. 17
Hypotheses .......................................................................................................................... 17
Methodology .................................................................................................................. 21
Research Design ..................................................................................................................... 21

vi
Participants ............................................................................................................................ 21
Procedure ............................................................................................................................... 22
Measures ................................................................................................................................. 23
Demographic Questionnaire ................................................................................................ 23
Multidimensional Body-Self Relations Questionnaire – Appearance Scales ..................... 23
Almost Perfect Scale-Revised ............................................................................................. 24
Anti-Fat Attitudes Scale ...................................................................................................... 25
Body-Esteem Scale ............................................................................................................. 26
Implicit Association Test .................................................................................................... 26
Data Analysis.......................................................................................................................... 31
Power Analysis .................................................................................................................... 31
D-algorithm ......................................................................................................................... 31
Descriptive Statistics ........................................................................................................... 32
Reliability Analysis ............................................................................................................. 32
Pearson’s Correlation .......................................................................................................... 32
Analysis of Variance (ANOVA) ......................................................................................... 32
T-Tests ................................................................................................................................. 33
Moderation and Mediation Analyses .................................................................................. 33
Results ............................................................................................................................ 34
Description of the Sample ..................................................................................................... 34
Descriptive Statistics .............................................................................................................. 34
Reliability Analysis ................................................................................................................ 46
Correlational Analyses .......................................................................................................... 47
Analysis of Variance (ANOVA) ............................................................................................ 55
T-Tests .................................................................................................................................... 61
Moderation Analyses ............................................................................................................. 63
Mediation Analyses................................................................................................................ 64
Discussion ....................................................................................................................... 70
Summary of Findings ............................................................................................................ 70
Relation to Previous Research .............................................................................................. 72
Limitations and Future Directions ....................................................................................... 76
Implications of the Present Study ........................................................................................ 77
Conclusion .............................................................................................................................. 78
References ...................................................................................................................... 80
Appendices ..................................................................................................................... 92

vii
APPENDIX A: Facebook Recruitment Post and Advertisement Flyer ............................ 92
APPENDIX B: Self-Report Online Questionnaire (Version Two) .................................... 93
APPENDIX C: Information Sheet ..................................................................................... 106
APPENDIX D: Implicit Association Test (Version One) ................................................. 109
APPENDIX E: Boxplots of explicit anti-fat attitudes between regular gym users and
non-gym users ...................................................................................................................... 118
APPENDIX F: Boxplots of implicit anti-fat attitudes between regular gym users and
non-gym users ...................................................................................................................... 119
APPENDIX G: Boxplots of explicit anti-fat attitudes between males and females ....... 120
APPENDIX H: Boxplots of implicit anti-fat attitudes between males and females ...... 121
APPENDIX I: PROCESS output for mediation effect of perfectionism on the
relationship between appearance orientation and explicit anti-fat attitudes ................. 122
APPENDIX J: PROCESS output for mediation effect of perfectionism on the
relationship between appearance orientation and dislike ................................................ 124
APPENDIX K: PROCESS output for mediation effect of perfectionism on the
relationship between appearance orientation and fear .................................................... 126
APPENDIX L: PROCESS output for mediation effect of maladaptive perfectionism
(discrepancy) on the relationship between appearance orientation and explicit anti-fat
attitudes ................................................................................................................................ 128
APPENDIX M: PROCESS output for mediation effect of maladaptive perfectionism
(discrepancy) on the relationship between appearance orientation and dislike ............ 130
APPENDIX N: PROCESS output for mediation effect of maladaptive perfectionism
(discrepancy) on the relationship between appearance orientation and fear ................ 132
APPENDIX O: PROCESS output for mediation effect of maladaptive perfectionism
(discrepancy) on the relationship between overweight preoccupation and explicit anti-
fat attitudes ........................................................................................................................... 134
APPENDIX P: PROCESS output for mediation effect of maladaptive perfectionism
(discrepancy) on the relationship between overweight preoccupation and fear ............ 136
viii
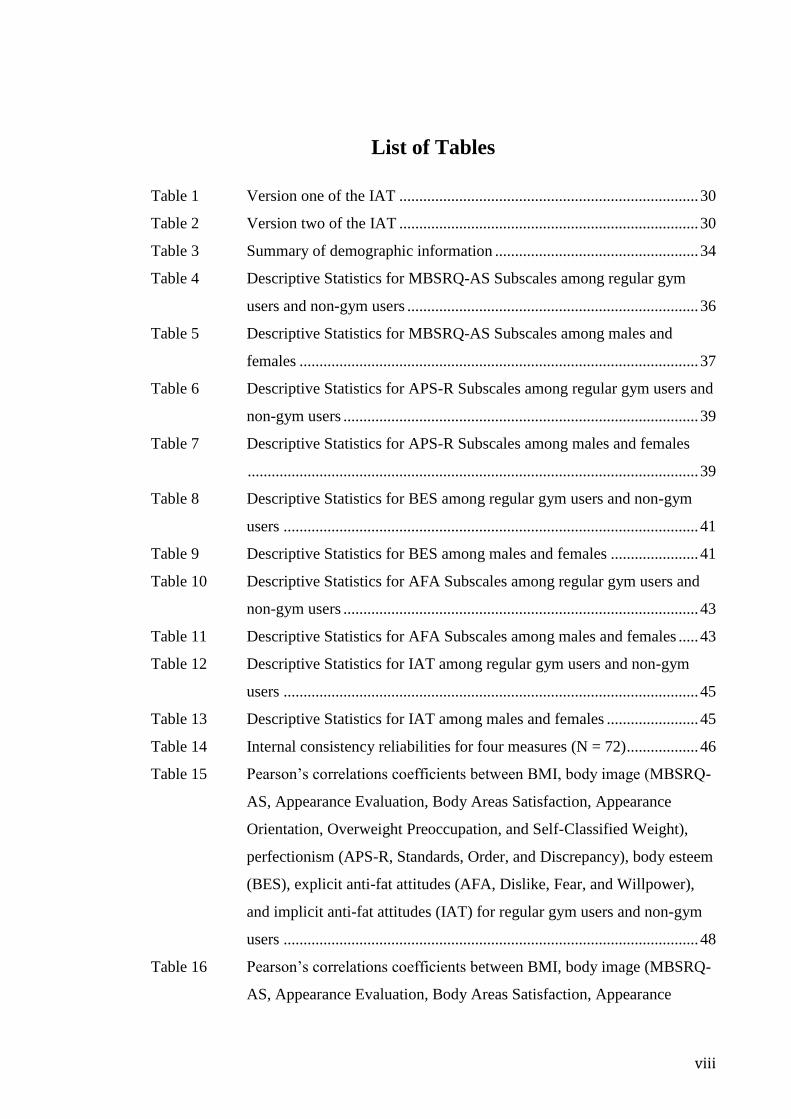
List of Tables
Table 1 Version one of the IAT ........................................................................... 30
Table 2 Version two of the IAT ........................................................................... 30
Table 3 Summary of demographic information ................................................... 34
Table 4 Descriptive Statistics for MBSRQ-AS Subscales among regular gym
users and non-gym users ......................................................................... 36
Table 5 Descriptive Statistics for MBSRQ-AS Subscales among males and
females .................................................................................................... 37
Table 6 Descriptive Statistics for APS-R Subscales among regular gym users and
non-gym users ......................................................................................... 39
Table 7 Descriptive Statistics for APS-R Subscales among males and females
................................................................................................................. 39
Table 8 Descriptive Statistics for BES among regular gym users and non-gym
users ........................................................................................................ 41
Table 9 Descriptive Statistics for BES among males and females ...................... 41
Table 10 Descriptive Statistics for AFA Subscales among regular gym users and
non-gym users ......................................................................................... 43
Table 11 Descriptive Statistics for AFA Subscales among males and females ..... 43
Table 12 Descriptive Statistics for IAT among regular gym users and non-gym
users ........................................................................................................ 45
Table 13 Descriptive Statistics for IAT among males and females ....................... 45
Table 14 Internal consistency reliabilities for four measures (N = 72) .................. 46
Table 15 Pearson’s correlations coefficients between BMI, body image (MBSRQ-
AS, Appearance Evaluation, Body Areas Satisfaction, Appearance
Orientation, Overweight Preoccupation, and Self-Classified Weight),
perfectionism (APS-R, Standards, Order, and Discrepancy), body esteem
(BES), explicit anti-fat attitudes (AFA, Dislike, Fear, and Willpower),
and implicit anti-fat attitudes (IAT) for regular gym users and non-gym
users ........................................................................................................ 48
Table 16 Pearson’s correlations coefficients between BMI, body image (MBSRQ-
AS, Appearance Evaluation, Body Areas Satisfaction, Appearance

ix
Orientation, Overweight Preoccupation, and Self-Classified Weight),
perfectionism (APS-R, Standards, Order, and Discrepancy), body esteem
(BES), explicit anti-fat attitudes (AFA, Dislike, Fear, and Willpower),
and implicit anti-fat attitudes (IAT) for males and females .................... 52
Table 17 One-way ANOVA summary table comparing regular gym users and
non-gym users to BMI, body image (MBSRQ-AS, Appearance
Evaluation, Body Areas Satisfaction, Appearance Orientation,
Overweight Preoccupation, and Self-Classified Weight), perfectionism
(APS-R, Standards, Order, and Discrepancy), body esteem (BES),
explicit anti-fat attitudes (AFA, Dislike, Fear, and Willpower), and
implicit anti-fat attitudes (IAT) ............................................................... 56
Table 18 One-way ANOVA summary table comparing regular gym users and
non-gym users to BMI, body image (MBSRQ-AS, Appearance
Evaluation, Body Areas Satisfaction, Appearance Orientation,
Overweight Preoccupation, and Self-Classified Weight), perfectionism
(APS-R, Standards, Order, and Discrepancy), body esteem (BES),
explicit anti-fat attitudes (AFA, Dislike, Fear, and Willpower), and
implicit anti-fat attitudes (IAT) ............................................................... 59
Table 19 Independent Samples T-Test for regular gym users and non-gym users
................................................................................................................. 61
Table 20 Independent Samples T-Test for males and females............................... 63
Table 21 Mediating effect of perfectionism on the relationship between body
image (MBSRQ-AS) and explicit anti-fat attitudes (AFA) (N = 72) ..... 64
Table 22 Mediating effect of maladaptive perfectionism on the relationship
between body image (MBSRQ-AS) and explicit anti-fat attitudes (AFA)
(N = 72) ................................................................................................... 66
x
List of Figures
Figure 1 Hypothesised model of the relationship between body mass index, body
image, and implicit/explicit anti-fat attitudes ......................................... 19
Figure 2 Hypothesised model of the moderating effect of body esteem on the
relationship between body image and implicit/explicit anti-fat attitudes
................................................................................................................. 19
Figure 3 Hypothesised model of the mediating effect of body esteem on the
relationship between body image and implicit/explicit anti-fat attitudes
................................................................................................................. 19
Figure 4 Hypothesised model of the moderating effect of perfectionism on the
relationship between body image and implicit/explicit anti-fat attitudes
................................................................................................................. 19
Figure 5 Hypothesised model of the mediating effect of perfectionism on the
relationship between body image and implicit/explicit anti-fat attitudes
................................................................................................................. 20
Figure 6 Representation of consistent and inconsistent trials used in the IAT...... 29
Figure 7 Mediating effect of perfectionism on the relationship between
Appearance Orientation and explicit anti-fat attitudes............................ 65
Figure 8 Mediating effect of perfectionism on the relationship between
Appearance Orientation and Dislike ....................................................... 65
Figure 9 Mediating effect of perfectionism on the relationship between
Appearance Orientation and Fear............................................................ 66
Figure 10 Mediating effect of maladaptive perfectionism on the relationship
between Appearance Orientation and explicit anti-fat attitudes ............. 67
Figure 11 Mediating effect of maladaptive perfectionism on the relationship
between Appearance Orientation and Dislike ......................................... 67
Figure 12 Mediating effect of maladaptive perfectionism on the relationship
between Appearance Orientation and Fear ............................................. 68
Figure 13 Mediating effect of maladaptive perfectionism on the relationship
between Overweight Preoccupation and explicit anti-fat attitudes ......... 68

xi
Figure 14 Mediating effect of maladaptive perfectionism on the relationship
between Overweight Preoccupation and Fear ......................................... 69
1
Introduction
Overview
Anti-fat attitudes toward overweight and obese individuals have consistently
been demonstrated across a number of educational (Crandall, 1994), occupational (Ding
& Stillman, 2005), and health settings (Chambliss, Finley, & Blair, 2004; O’Brien,
Hunter, & Banks, 2007; Robertson & Vohora, 2008). In Western culture, it is argued
that internalisation of the thin female ideal and muscular male ideal encourages anti-fat
attitudes, where overweight individuals are viewed as possessing undesirable physical
and social qualities (Klaczynski, Goold, & Mudry, 2004).
In particular, the presence of anti-fat bias is widespread within health and fitness
environments. Robertson and Vohora (2008) found both fitness professionals and
regular exercisers to display a strong implicit anti-fat bias towards overweight
individuals. Consequently, this can negatively impact interactions between overweight
gym users and fitness professionals. This was supported by Shapiro, King, and
Quinones (2007) who found fitness trainers were more likely to have lower training
expectations and lower success expectations for overweight trainees compared to
average weight trainees. It appeared that the overweight trainees picked up on these
subtle negative expectations, thus influencing them to perceive the quality of training as
being low compared to average weight trainees. Anti-fat attitudes have also been
demonstrated in educational health settings. Chambliss and colleagues (2004) examined
the presence of implicit and explicit anti-fat attitudes among exercise science students in
the U.S. Results showed a strong implicit anti-fat bias, as fat people were rated higher
on the lazy (versus motivated) and bad (versus good) attribute, compared to thin people.
A strong explicit anti-fat bias was also evident, as fat people were rated higher in
laziness, compared to thin people. However, there was no significant explicit anti-fat
bias when rating intelligence (very smart/very stupid). Furthermore, exercise science
students who displayed greater anti-fat bias appeared to endorse particular anti-fat
beliefs regarding personal controllability of weight, self-control of junk food
consumption, and physical coordination of overweight individuals.

2
Negative consequences associated with anti-fat bias toward overweight
individuals have been demonstrated within many fitness and health settings. Vartanian
and Novak (2011) found that greater experience of weight stigma was positively
associated with exercise avoidance and body dissatisfaction. Puhl and Heuer (2009)
explain that overweight individuals seeking access to exercise facilities may often avoid
gyms due to poor body image, low self-esteem and fear of receiving negative judgement
from others. In order to help reduce anti-fat attitudes within fitness environments, it is
important to understand factors that may underlie these prejudiced attitudes. This thesis
will examine the relationships between BMI, body image, body esteem, perfectionism,
and implicit and explicit anti-fat attitudes within a New Zealand sample of regular gym
users and non-gym users.
Anti-Fat Attitudes, Body Image, Body Mass Index, Body Esteem, and
Perfectionism
Anti-Fat Attitudes
Anti-fat attitudes are discriminatory beliefs and views about overweight and
obese individuals based on their weight (Pepper & Ruiz, 2007). It is argued that
individuals with strong anti-fat bias hold the belief that people are responsible for their
weight, thus perceive obesity as being a controllable condition (Crandall, 1994). Anti-
fat attitudes have shown to exist among fitness professionals, (Robertson & Vohora,
2008), fitness trainers (Shapiro et al., 2007) and exercise science students (Chambliss et
al., 2004). However, research examining anti-fat attitudes among regular gym users
appears limited, despite fitness centres being a likely commonplace for anti-fat bias to
exist.
Research assessing anti-fat bias typically employs measures that explore both
explicit and implicit discriminatory attitudes. Implicit anti-fat attitudes are negative
attitudes towards overweight and obese individuals which are unable to be consciously
retrieved and expressed, whereas explicit anti-fat attitudes are able to be consciously
retrieved and therefore directly expressed (Nosek, Greenwald, & Banaji, 2007). Self-
report measures are one of the most widely used tools for assessing explicit anti-fat
attitudes. Self-report questionnaires ask participants about their thoughts, feelings, and

3
attitudes, therefore obtaining direct information regarding a particular issue. However,
self-report measures are often criticised for being prone to social desirability bias, as
individuals may under-or-over report information in order to appear socially acceptable,
particularly when sensitive topics are being assessed such as anti-fat attitudes
(Teachman, Gapinski, Brownell, Rawlins, & Jeyaram, 2003).
In order to overcome limitations of explicit measures, researchers typically
employ implicit measures, which do not rely on introspection. The Implicit Association
Test (IAT) is the most common measure used to explore implicit anti-fat bias.
Greenwald, McGhee, and Schwartz (1998) developed the IAT in order to assess
automatic associations between target categories (e.g., ‘fat people’ or ‘thin people’) and
attribute categories (e.g., ‘good’ or ‘bad’). The IAT is a computer-based reaction time
task where participants are required to classify positive and negative word stimuli (e.g.,
wonderful, horrible) into the given target and/or attribute categories (e.g., ‘thin people’
and ‘good’ or ‘fat people’ and ‘bad’) presented at the top left and right side of the screen
(O’Toole, Barnes-Holmes, & Smyth, 2007). Participants are asked to categorise word
stimuli as quickly and as accurately as possible. An IAT effect is calculated by
comparing the response latencies produced in the consistent blocks (e.g., ‘thin people’
and ‘good’) to the inconsistent blocks (e.g., ‘thin people’ and ‘bad’). If response
latencies are faster in the consistent blocks compared to the inconsistent blocks, this
suggests presence of an implicit anti-fat bias. Although the IAT has been successfully
used to assess implicit anti-fat attitudes within fitness (Chambliss et al., 2004; O’Brien,
Hunter, & Banks, 2007; Robertson & Vohora, 2008) and non-fitness (O’Brien, Hunter,
Halberstadt, & Anderson, 2007; Schwartz, Vartanian, Nosek, & Brownell, 2006)
samples, it does possess several limitations. It is argued that the IAT only indicates an
individual’s relative preference for one target category over another, rather than
establishing the direction of an observed bias (De Houwer, 2002). For example, a
preference for ‘thin people’ over ‘fat people’ may be an indication of an anti-fat/pro-
slim bias, or it could indicate a neutral bias toward one group and a bias (anti-fat or pro-
thin) against/towards the other group (De Houwer, 2002). The IAT is also criticised on
whether associations found between target categories and negative attributes are
indicative of prejudice or familiarity of a stereotype (Whitley & Kite, 2013).
4
Generally, implicit anti-fat attitudes tend to be stronger than explicit anti-fat
attitudes and have shown to be better predictors of biased attitudes. Bessenoff and
Sherman (2000) found that the lexical decision task (implicit measure) better predicted
how far participants chose to sit from an overweight woman, compared to the explicit
self-report measure. Research examining the relationship between implicit and explicit
measures of anti-fat attitudes often display weak correlations (Hofmann, Gawronski,
Gschwendner, Le, & Schmitt, 2005; Robertson & Vohora, 2008; Teachman &
Brownell, 2001). Teachman and colleagues (2003) explain that the lack of relationship
could be due to the social desirability bias or due to negative implicit biases occurring
outside an individual’s awareness.
Body Image
More recently, research has begun to explore factors that may underlie anti-fat
bias. In particular, body image has been suggested to play a significant role in anti-fat
attitudes. Body image refers to how an individual perceives, thinks, and feels about his
or her body (Grogan, 2007). It is argued that body image is a multi-dimensional concept
as it embodies perceptual, affective, cognitive, evaluative, and behavioural aspects of an
individual’s appearance, weight, and body shape (Grogan, 2007). Research has shown
low body image satisfaction to be associated with high levels of depressive symptoms,
anxiety, stress, and mental health-related quality of life impairment, and low self-esteem
(Wilson, Latner, & Hayashi, 2013). Gender differences in body image appear to exist,
as females tend to display lower weight and body dissatisfaction, compared to males
(Paxton et al., 1991).
Within the fitness context, poor body image has been shown to be greater among
female exercisers compared to non-exercisers. For example, Imm and Pruitt (1991)
found that body shape dissatisfaction was greater among women who engaged in high
frequency exercise (engages in exercise for 6 or more hours per week), compared to
non-exercisers, despite not differing in body weight or body fat percentage. Research
has also demonstrated low body image to be significantly related to exercise centre
environments. Prichard and Tiggemann (2008) examined the relationships between
exercise type and body image outcomes among female fitness centre members in South
Australia. Results showed that women who spent more time exercising within fitness

5
centres reported higher levels of self-objectification and disordered eating, and lower
body esteem, compared to women who spent more time exercising outside fitness
centres. This supports the idea that exercise environments are objectifying, as
individuals’ bodies are constantly on display and the ideal body is greatly emphasised,
thus creating an atmosphere that facilitates self-surveillance (Prichard & Tiggemann,
2008). The relationship between poor body image and gym use has also been
demonstrated among men. Stapleton, McIntyre, and Bannatynne (2016) explored
differences in body image and eating pathology between male gym users and non-gym
users. It was found that males who engaged in exercise at fitness centres reported
significantly greater body dissatisfaction and eating pathology, compared to males not
engaging in exercise at fitness centres. It is evident from these studies that individuals
who engage in regular exercise, particularly within fitness environments such as gyms,
are more vulnerable to higher levels of body dissatisfaction, compared to non-exercisers
and non-gym users.
The assessment of body image typically employs self-report measures, which
assess affective, cognitive, and behavioural components of an individual’s body image
(Shroff, Calogero, & Thompson, 2009). Affective measures aim to assess body image
satisfaction through the use of body size estimation procedures. For example, figural
stimuli of silhouettes varying in size are often used to easily assess how an individual
perceives their current self compared to their ideal self. The difference between the two
judgments is used as an indication of body dissatisfaction. However, figural rating
scales have often been criticised for being unrealistic, such that changes from one
silhouette to the next are not proportionate or gradual, and lacking resemblance to
individuals’ actual body dimensions (Reel, 2013). In addition to visual instruments,
questionnaires are also employed to assess body image satisfaction such as the
Appearance Evaluation subscale of the Multidimensional Body Self-Relations
Questionnaire (Cash, 2000). Cognitive measures assess attitudes, thoughts and beliefs
regarding an individual’s physical appearance. For example, the Assessment of Body
Image Cognitive Distortions (Jakatdar, Cash, & Engle, 2006) is a 37-item self-report
questionnaire that measures eight types of distorted cognitions associated with one’s
physical appearance. Lastly, behavioural measures assess observational signs of body
image disturbance, such as body checking and avoidance of body image-related

6
situations. For example, the Body Checking Questionnaire (Reas, Whisenhunt,
Netemeyer, & Williamson, 2002) is a 23-item self-report questionnaire that assesses
how often an individual engages in body checking behaviours. Similar to explicit
measures of anti-fat attitudes, self-report questionnaires examining body image may be
prone to social desirability bias due to the sensitive nature of the topic.
Body Mass Index
Body mass index (BMI) is used as an estimation of body fat among adults, by
dividing an individual’s weight (kilograms) by the square of his or her height (metres2)
(World Health Organization, 2000). This calculation indicates whether an individual
classifies as being underweight (<18.5), healthy (18.5 – 24.9), overweight (25 – 29.9),
or obese (>30). A large amount of research has demonstrated negative physical and
psychological problems associated with obesity, including cardiovascular disease,
metabolic difficulties, body dissatisfaction, eating disorders, social bias, and weight
discrimination (World Health Organization, 2000).
Online questionnaires commonly use participants’ self-reported weight and
height to calculate BMI, particularly when objective measures of body fat are unable to
be administered, such as the use of callipers to measure skinfold thickness
(Summerfield & Ellis, 2014). Although BMI is inexpensive, non-invasive, and quick to
calculate, the measure does suffer from a few limitations. It is argued that BMI tends to
overestimate body fat among individuals with greater muscle mass, such as athletes, and
underestimate body fat among individuals with loss of muscle or bone mass, such as
older adults. This is due to the BMI not accounting for a number of factors including an
individual’s muscle mass, bone mass, frame size, gender, and ethnicity (Summerfield &
Ellis, 2014). Consequently, interpretations of BMI should be considered alongside other
indicators of health and fitness, such as an individuals’ diet, level of physical activity,
and waist circumference (Summerfield & Ellis, 2014).
Body Esteem
Body esteem is argued to be an aspect of self-esteem regarding how an
individual evaluates and feels about his or her physical appearance and body (Franzoi &

7
Shields, 1984). Research has shown that low body esteem is associated with symptoms
of depression, anxiety, and obsessive-compulsive disorder (Bohne, Keuthen, Wilhelm,
Deckersbach, & Jenike, 2002). Gender differences in body esteem have also been
demonstrated, such that men tend to show higher levels of body esteem compared to
women (Kamimura et al., 2014; Strelan & Hargreaves, 2005). Fredrickson and Roberts
(1997) explain that women are more susceptible to self-objectification as females are
often sexually objectified in Western societies where their value is based on physical
appearance. Consequently, females are lead to internalise this sociocultural belief, thus
resulting in self-objectification. Research has demonstrated a number of negative
psychological outcomes associated with self-objectification among European American
females, such as high levels of body surveillance and body shame and low body esteem
(McKinley, 1998).
Within the fitness population, research has shown low body esteem to be linked
to dysfunctional eating patterns. Vinkers, Evers, Adriaanse, and Ridder (2012) found
body esteem and eating disorder symptomatology to be positively associated among
female fitness centre members. Furthermore, appearance-motivated exercise was found
to partially mediate the relationship between body esteem and eating disorder
symptomatology, whereas health-related exercise did not mediate this relationship.
Furthermore, Prichard and Tiggemann (2008) showed low body esteem to be associated
with participation in cardio-based (versus weights-based and yoga-based) workout
classes and appearance-related (versus health/fitness and enjoyment/mood
improvement) reasons for exercise among female fitness centre members. It appears
that individuals within fitness population tend to display low level of body esteem,
particularly among those with appearance-related reasons for exercise, such as gym
users.
Similar to body image, the assessment of body esteem typically uses self-report
measures. Two of the most common tools used are the Body Esteem Scale (BES;
Franzoi & Shields, 1984) and the Body-Esteem Scale for Adolescents and Adults
(BESAA; Mendelson, Mendelson, & White, 2001). The BES is a multidimensional
questionnaire that assesses one’s level of satisfaction with 35 body parts and functions
using a 5-point Likert scale (1 = “have strong negative feelings” to 5 = “have strong
8
positive feelings”) (Franzoi & Shields, 1984). The BES is gender-specific, such that
each subscale represents a different dimension of body esteem specific to males or
females. In particular, Physical Attractiveness, Upper Body Strength, and Physical
Condition are specific to men, whereas Sexual Attractiveness, Weight Concern, and
Physical Condition are specific to women. The BESAA is a 23-item questionnaire that
assesses how an individual thinks and feels about their body and physical appearance
using a 5-point Likert scale (0 = “never” to 4 = “always”) (Mendelson et al., 2001). The
BESAA consists of three subscales including Appearance (how one generally feels
about their appearance), Weight (degree of satisfaction with one’s weight), and
Attribution (attributions of evaluations regarding one’s body and appearance to others).
The BESAA was validated based on a normative sample of adolescents and young
adults aged between 12-25 years, thus may not be suitable for use among older adults.
Similar to other self-report measures, the BES and the BESAA may be prone to social
desirability bias as participants may be inclined to under-or-over report sensitive
information.
Perfectionism
Perfectionism is defined as being a multidimensional construct, however a
number of theories have been proposed regarding the different dimensions of
perfectionism. Hewitt and Flett (1991) argued that perfectionism is comprised of
personal and social dimensions, which are reflected in the Multidimensional
Perfectionism Scale (HFMPS). The HFMPS is a 45-item measure that examines three
dimensions of perfectionism including self-oriented perfectionism (tendency to set high
personal standards, self-criticise, and to be motivated to attain perfection whilst
avoiding failure), other-oriented perfectionism (tendency to set unrealistic standards for
significant others, expect others to be perfect, and strictly evaluating others
performances), and socially prescribed perfectionism (tendency to believe others have
extremely high standards of them, think they are being strictly evaluated by others, and
experience pressure to meet others’ expectations). Frost, Marten, Lahart, and
Rosenblate’s (1990) also developed a measure of perfectionism called the
Multidimensional Perfectionism Scale (FMPS). The FMPS is a 35-item self-report
measure that assesses six dimensions of perfectionism. Concern over Mistakes assesses
negative reactions to mistakes and interpreting mistakes as failure. Personal Standards

9
refers to setting high personal standards and placing great importance on achieving
these standards. Parental Expectations assesses the belief that one’s parents set
extremely high goals. Parental Criticism refers to the belief that one’s parents are
excessively critical. Doubt about Actions assesses the tendency to feel dissatisfied with
projects. Lastly, Organisation refers to the importance of and preference for order and
organisation.
Since the development of the HFMPS and the FMPS, it has been argued that
perfectionism consists of both negative and positive aspects. Slaney, Rice, Mobley,
Trippi, and Ashby (2001) proposed that perfectionism encompasses both adaptive and
maladaptive features. Consequently, the 23-item Almost Perfect Scale-Revised (APS-R)
was developed in order to assess three dimensions of perfectionism including High
Standards (setting of high personal standards), Discrepancy (distress produced from the
discrepancy between performance and standards), and Order (degree of orderliness).
Slaney and colleagues (2001) explain that high scores on the High Standards and Order
subscales and a low score on the Discrepancy subscale suggest adaptive perfectionism,
whereas a high score on the Discrepancy subscale suggest maladaptive perfectionism.
Research has shown maladaptive perfectionism to be significantly associated
with depressive mood and adult attachment anxiety (Wei, Mallinckrodt, Russell, &
Abraham, 2004), low self-esteem (Ashby & Rice, 2002), and greater stress (Chang,
Banks, & Watkins, 2004), whereas adaptive perfectionism has been associated with
high self-esteem (Ashby & Rice, 2002) and greater positive affect and life satisfaction
(Chang et al., 2004). In fitness environments, maladaptive perfectionism has been found
to be positively associated with excessive exercise (Flett & Hewitt, 2005) and athletic
burnout (Appleton, Hall, & Hill, 2009). Conversely, a significant relationship has been
shown between adaptive perfectionism and better sport performance (Stoeber, Uphill, &
Hotham, 2009). A recent study conducted by Miller and Mesagno (2014) found exercise
dependence to be positively correlated with the self-oriented and socially prescribed
subscales from the HFMPS among regular exercisers. It is argued that individuals may
be inclined to engage in exercise in an attempt to attain perfectionism standards that are
imposed by the self and others (Miller & Mesagno, 2014).

10
The assessment of perfectionism typically employs self-report measures such as
the FMPS, the HFMPS, and the APS-R, as they are multidimensional, brief and easy to
administer. However, it is argued that the validity of these scales is often established by
examining the correlation with other self-report perfectionism scales that tend to overlap
in content (Egan, Wade, Shafran, & Antony, 2014). Consequently, high correlations
between the two measures are often demonstrated, thus it is evident that more
comprehensive validity studies are required. It is also argued that more research
examining the predictive validity of perfectionism scales is required in order to
determine whether self-report perfectionism scales predict perfectionistic behaviours
(Egan et al., 2014).
Relationship between Body Image, Body Mass Index, Body Esteem,
Perfectionism, and Anti-Fat Attitudes
Body Mass Index and Body Image
Within the current literature, a number of studies have found an association
between BMI and body image. Smith, Thompson, Raczynski, and Hilner (1999)
examined body image concerns in a population-based sample of black and white US
adults. BMI was found to significantly predict body dissatisfaction across all groups
(black men, black women, white men, and white women). Similarly, Yates, Edman, and
Aruguete (2004) found a positive relationship between BMI and body dissatisfaction
among white, Japanese, African-American, Filipino, Chinese, Hawaiian, and
multiethnic college students. However, this association appeared to be stronger among
females, compared to males.
Research examining gender differences in the relationship between BMI and
body image have consistently shown a positive association among females, such that
greater BMI predicts lower body satisfaction (Austin, Haines, & Veugelers, 2009;
Pingitore, Spring, & Garfield, 1997), whereas research among males appears to be
complex. Austin and colleagues (2009) demonstrated a U-shape relationship among
males, such that lower body satisfaction was reported among individuals with either low
or high BMI. It is argued that these results may reflect Western beauty ideals where
women strive toward a thin ideal and men strive for muscularity (Austin et al., 2009).
11
The relationship between BMI and body image also appears complex when
examining fitness sub-groups, such as athletes and regular exercisers. A study
conducted by Lim, Omar-Fauzee, and Rosli (2011) examined body dissatisfaction
among female athletes and non-athletes. Results showed no significant association
between BMI and body dissatisfaction was found for both groups. Lim and colleagues
(2011) explain that as the average BMI of the sample was low, a significant relationship
may not have been found, as females with lower BMI tend to be more satisfied with
their body weight and shape compared to females with greater BMI. Conversely, Davis
(1990) found BMI was a significant predictor of weight preoccupation and body
dissatisfaction among female non-exercisers but not among female exercisers. Instead,
subjective body shape significantly predicted weight preoccupation among the exercise
group, thus suggesting females who regularly exercise may place greater importance on
the perceptions of how they look rather than actual BMI in relation to body image
(Davis, 1990).
Body Image and Anti-fat Attitudes
Research examining the relationship between body image and anti-fat attitudes
has shown that individuals who demonstrate a high tendency to make physical
appearance comparisons are more likely to hold greater implicit and explicit anti-fat
attitudes than individuals with a lesser tendency to make physical appearance
comparisons (O’Brien, Hunter, Halberstadt, et al., 2007). It is argued that this increased
tendency to make appearance-related comparisons is common among individuals with
poor body image (O’Brien, Hunter, Halberstadt, et al., 2007). Anti-fat attitudes have
also been shown to be associated with body image concerns, such as body shame and
perceived body size. Himmelstein and Tomiyama (2015) found explicit anti-fat attitudes
to be positively associated with body shame and negatively associated with perceived
body size among both males and females.
Several theories have been proposed to explain the relationship between body
image and anti-fat attitudes. Festinger’s (1954) social comparison theory explains that
humans have a natural tendency to evaluate one’s attitudes, abilities, and attributes by
engaging in upward or downward comparisons to others. An upward comparison is
12
made when an individual compares him-or-herself to an individual who is perceived as
being physically superior. Consequently, this results in greater body dissatisfaction. In
contrast, a downward comparison involves comparing oneself to a physically inferior
other, which is often made when attempting to increase one’s low self-esteem and self-
regard. O’Brien, Hunter, Halberstadt and colleagues (2007) suggest that individuals
with poor body image may often attempt to increase their self-image by making
comparisons to those perceived as being physically inferior, such as overweight
individuals. Consequently, these downward comparisons may be accompanied with
anti-fat attitudes towards the inferior target (O’Brien, Hunter, Halberstadt, et al., 2007).
Ehrlich’s (1973) self-congruity principle proposes that discriminatory attitudes
displayed towards others may be a reflection of how individuals feel about themselves.
The principle of self-congruity has mostly been applied to self-esteem and prejudice,
such that individuals low in self-esteem tend to display negative attitude towards others
(Duckitt, 1992). However, the self-congruity principle appears to be a plausible theory
in explaining the relationship body image and anti-fat attitudes, such that implicit and
explicit prejudice towards overweight individuals arises due to negative feelings
regarding one’s own body image.
Body Image, Perfectionism, and Anti-Fat Attitudes
Body Image and Perfectionism
Research has shown a significant relationship exists between body image and
perfectionism. Wade and Tiggemann (2013) examined whether maladaptive and
adaptive dimensions of perfectionism were associated with weight and body size
dissatisfaction (discrepancy between current and desired BMI and the discrepancy
between current and ideal figural silhouettes, respectively) among females. Results
found both weight and body size dissatisfaction to be positively correlated with Concern
over Mistakes, Doubt about Actions, Parental Criticism, and Parental Expectations
subscales from the FMPS. It was found that desire for a lower BMI was associated with
higher levels of both adaptive (Organisation) and maladaptive (Concern over Mistakes)
perfectionism. Results also found that preference towards a thinner ideal was associated
with higher levels of both adaptive (Organisation) and maladaptive (Concern over
13
Mistakes and Doubt about Actions) perfectionism. Wade and Tiggemann (2013) explain
that adaptive perfectionism (Organisation) may only become problematic in the
presence of high levels of maladaptive perfectionism.
An association between perfectionism and low body image is also evident
among males. Grammas & Schwartz (2009) explored predictors of body dissatisfaction
among male university students. Results found socially prescribed perfectionism from
the HFMPS to significantly predict muscle and low body fat dissatisfaction. However,
self-oriented perfectionism and other-oriented perfectionism were not significant
predictors of muscle and low body fat dissatisfaction. Furthermore, no relationship was
found between perfectionism and height dissatisfaction, perhaps due to height being
viewed as uncontrollable (Grammas & Schwartz, 2009). These findings suggest that
men who perceive others as having extremely high standards of them and feel pressure
to meet such standards are more likely to be dissatisfied with muscularity and body fat,
compared to men with high personal standards.
Sociocultural theory proposes that the relationship between perfectionism and
low body image is influenced by the internalisation of Western body ideals of
muscularity and thinness for men and women, respectively (Thompson, Heinberg,
Altabe, & Tantleff-Dunn, 1999). Tissot and Crowther (2008) explain that individuals
high in socially prescribed perfectionism display a greater tendency to internalise
unrealistic body ideals that are encouraged by society due to having high personal
standards (self-oriented perfectionism). Consequently, individuals high in perfectionism
experience greater body dissatisfaction due to discrepancies between ideal and actual
body image (Bardone, Vohs, Abramson, Heatherton, & Joiner, 2000).
Perfectionism and Anti-Fat Attitudes
Research examining the relationship between perfectionism and anti-fat attitudes
appears limited. Rosewall (2009) explored the moderating effects of perfectionism,
anorectic cognitions, and explicit anti-fat attitudes on the relationship between media
information and internalisation of the thin ideal among female university students.
Although exploration of the relationship between perfectionism and anti-fat attitudes
was not central to the study, a positive relationship between maladaptive perfectionism
14
(consisting of Concern over Mistakes, Doubt over Actions, Parental Criticism, and
Parental Expectations subscales from the FMPS) and explicit anti-fat attitudes was
found.
A study conducted by Aruguete, Yates, Edman, & Sanders (2007) examined
associations between U.S. acculturation, eating pathology, self-loathing, explicit anti-fat
attitudes, body dissatisfaction, self-esteem, depression, perfectionism, and family
cohesion, among a sample of Filipino American children aged 12-19 years. Again, the
relationship between perfectionism and anti-fat attitudes was not of particular interest
within this study, however a positive correlation was reported between perfectionism
(consisting of Concern over Mistakes, Parental Expectations, and Parental Criticism
subscales from the FMPS) and explicit anti-fat attitudes. Based on these studies, it
appears that more research is required examining the relationship between
adaptive/maladaptive perfectionism and anti-fat attitudes as a significant relationship
appears to exist, such that a higher level of perfectionism is associated with greater
explicit anti-fat attitudes. Furthermore, it appears that no research to date has examined
the relationship between adaptive/maladaptive perfectionism and implicit anti-fat
attitudes.
Body Image, Body Esteem, and Anti-Fat Attitudes
Body Image and Body Esteem
A number of studies have demonstrated a relationship between body image and
body esteem. Tyler, Johnston, Dalton, and Foreyt (2008) examined the relationships
between weight and weight-related factors, including body dissatisfaction, body esteem,
and teasing, among a sample of African American girls. A significant relationship was
found between body dissatisfaction and body esteem, such that high weight/body shape
dissatisfaction was associated with low body esteem. A recent study conducted by
Karacan, Caglar, Gürsoy, and Yilmaz (2014) examined the relationship between body
dissatisfaction and dysfunctional eating attitudes in a sample of adolescent females with
and without polycystic ovary syndrome (PCOS). Body esteem was assessed using the
BESAA and figural rating scales were used to assess body dissatisfaction. Results
15
showed high body dissatisfaction was significantly associated with low body esteem
within both the PCOS and control group.
Most research has examined the relationship between body esteem and body
image among females, however associations are also evident among males. Davis and
Katzman (1997) explored the relationship between body esteem, weight dissatisfaction,
depression, and self-esteem among Chinese undergraduate students. It was found that
body esteem significantly correlated with weight dissatisfaction, such that both males
and females with low body esteem displayed higher levels of body dissatisfaction.
Body Esteem and Anti-Fat Attitudes
A few studies have explored the relationship between body esteem and anti-fat
attitudes, however research is still limited. O’Brien, Hunter, and Banks (2007)
examined the link between anti-fat attitudes and psychosocial predictors, including
investment in physical attributes and abilities, body esteem, and social dominance
orientation, among physical education (PE) and psychology university students enrolled
in either the first of second year of their degree. It was found that among year one PE
students, low body esteem (low physical attractiveness, low upper body strength, and
high weight concern) was associated with weaker implicit anti-fat attitudes. Conversely,
low body esteem (low physical attractiveness and low physical condition) was
associated with greater implicit anti-fat attitudes among year three PE students. No
significant relationship was found between body esteem and implicit anti-fat attitudes in
year one or year three psychology students. O’Brien, Hunter, and Banks (2007) suggest
that a significant link between body esteem and implicit anti-fat attitudes was found
among PE students but not psychology students, due to the former group exhibiting
greater investment in physical attributes.
Quinlan, Hoy, and Costanzo (2009) investigated the association between teasing
and psychosocial factors, including self-esteem, body esteem, depression, weight and
body concern, anti-fat attitudes, and participation and social involvement, among a
sample of adolescents recruited from a weight loss summer camp. Although the main
aim of the study was to explore the relationship between teasing and psychosocial
factors, results also reported significant correlations between the examined psychosocial

16
factors. Specifically, a negative relationship was found between body esteem and
explicit anti-fat attitudes, such that low body esteem was associated with greater explicit
anti-fat attitudes.
Summary
BMI has been associated with low body image, such that both males and
females with higher BMI experience greater body dissatisfaction. Generally, low body
image has been found to be greater among females, compared to males. Within the
fitness context, low body image has been associated with individuals who engage in
regular exercise, particularly within fitness centre environments. Poor body image has
been found to be positively associated with greater implicit and explicit anti-fat attitudes
and high maladaptive perfectionism.
A positive association between maladaptive perfectionism and explicit anti-fat
attitudes appears to exist among both males and females, however more research is
warranted. To date, it appears that no research has examined whether perfectionism is
associated with implicit anti-fat attitudes.
Research has shown a relationship between body esteem and body image among
clinical and non-clinical populations, such that low body esteem is associated with
greater weight/body shape dissatisfaction. Low body esteem has also been found to be
associated with greater implicit and explicit anti-fat attitudes, however research is
limited.
It is evident that body image and anti-fat attitudes are both related to
perfectionism and body esteem. However, it appears that no research has examined the
mediating/moderating role of body esteem and perfectionism in the relationship
between body image and anti-fat attitudes. If body esteem and/or perfectionism are
significant mediators/moderators, focussing on enhancing one’s body esteem and
reducing perfectionist tendencies may help diminish anti-fat attitudes.

17
Present Study
Rationale
This study aims to examine the relationships between BMI, body image, and
anti-fat attitudes and the mediating and moderating effects of body esteem and
perfectionism on the relationship between body image and implicit/explicit anti-fat
attitudes. These relationships will be explored among a sample of regular gym users and
non-gym users in New Zealand. A gym user sample was chosen, as anti-fat attitudes
(Robertson & Vohora, 2008; Shapiro et al., 2007) and body image issues (Imm & Pruitt,
1991; Prichard & Tiggemann, 2008; Stapleton et al., 2016) appear to be prevalent
within fitness populations.
Particularly within health and fitness environments, it is apparent that anti-fat
attitudes can have adverse effects on individuals who hold such attitudes (Himmelstein
& Tomiyama, 2015) and overweight individuals who are discriminated against (Puhl &
Heuer, 2009; Vartanian & Novak, 2011). Furthermore, research has shown body esteem
(Karacan et al., 2014; O’Brien, Hunter, & Banks, 2007; Quinlan et al., 2009; Tyler et
al., 2008) and perfectionism (Aruguete et al., 2007; Rosewall, 2009; Grammas &
Schwartz, 2009; Wade & Tiggemann, 2013) to be associated with both low body image
and anti-fat attitudes, however whether body esteem and perfectionism
moderates/mediates the relationship between body image and anti-fat attitudes has yet
to be examined. This study will contribute to the literature by identifying significant
factors, such as body image, body esteem, and perfectionism, which may underlie anti-
fat attitudes. By doing so, these factors can be either minimised or enhanced in order to
help reduce weight discrimination.
Hypotheses
Based on previous research, it was hypothesised:
1. Higher BMI will be associated with low body image.
2a. Low body image will be greater among regular gym users, compared to non-
gym users.
2b. Low body image will be greater among females, compared to males.
18
3a. Both implicit and explicit anti-fat attitudes will be greater among regular
gym users, compared to non-gym users.
3b. Both implicit and explicit anti-fat attitudes will be greater among females,
compared to males.
4. Low body image will be associated with greater implicit and explicit anti-fat
attitudes.
5. Implicit and explicit anti-fat attitudes will be weakly associated.
6. The effect of body image on implicit/explicit anti-fat attitudes will be
moderated by body esteem. Specifically, the relationship between low body
image and implicit/explicit anti-fat attitudes will be greater among
individuals with high body esteem.
7. The effect of body image on implicit/explicit anti-fat attitudes will be
mediated by body esteem.
8. The effect of body image on implicit/explicit anti-fat attitudes will be
moderated by perfectionism. Specifically, the relationship between low body
image and implicit/explicit anti-fat attitudes will be greater among
individuals high in maladaptive perfectionism.
9. The effect of body image on implicit/explicit anti-fat attitudes will be
mediated by perfectionism.
Figure 1 displays the hypothesised model of the relationship between BMI, body
image, and implicit/explicit anti-fat attitudes. Figure 2 shows the hypothesised
moderating effect of body esteem on the relationship between body image and
implicit/explicit anti-fat attitudes, whereas as Figure 3 displays the hypothesised
mediating effect of body esteem. Figure 4 displays the hypothesised moderating effect
of perfectionism on the relationship between body image and implicit/explicit anti-fat
attitudes, whereas as Figure 5 displays the hypothesised mediating effect of
perfectionism.

19
Figure 1. Hypothesised model of the relationship between body mass index, body
image, and implicit/explicit anti-fat attitudes.
Figure 2. Hypothesised model of the moderating effect of body esteem on the
relationship between body image and implicit/explicit anti-fat attitudes.
Figure 3. Hypothesised model of the mediating effect of body esteem on the
relationship between body image and implicit/explicit anti-fat attitudes.
Figure 4. Hypothesised model of the moderating effect of perfectionism on the
relationship between body image and implicit/explicit anti-fat attitudes.
20
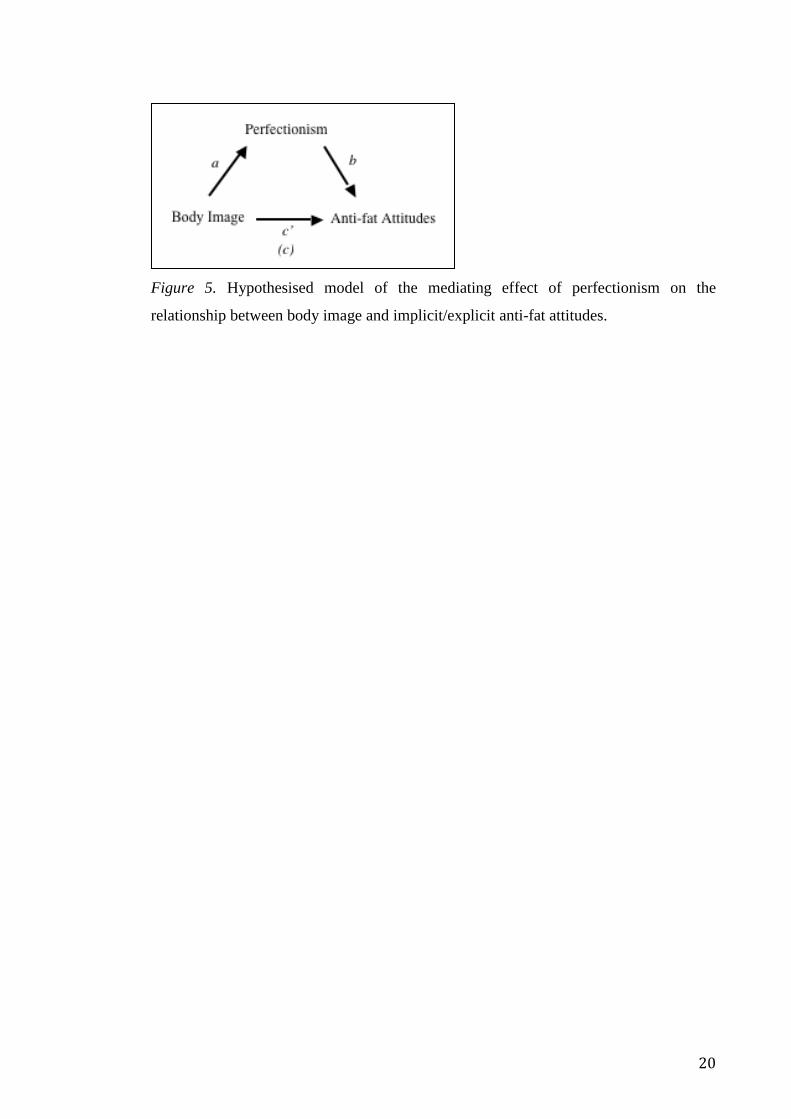
Figure 5. Hypothesised model of the mediating effect of perfectionism on the
relationship between body image and implicit/explicit anti-fat attitudes.

21
Methodology
Research Design
This cross-sectional quantitative study asked participants to complete an online
questionnaire, which was advertised using Facebook. Online surveys are a convenient
and cheap alternative to traditional pen-and-paper surveys, as it allows researchers to
quickly access populations of interest from various geographic locations, as well as
individuals who may feel uncomfortable with in person participation, particularly where
sensitive information is required from them (Wright, 2005). Online surveys also allow
participants to complete the questionnaire at their own convenience (Pedersen et al.,
2015). However, online surveys can be prone to self-selection bias as some individuals
may be more likely to participate than others (Wright, 2005). Furthermore, online
surveys that offer a reward in return for participation may attract individuals who fake
their eligibility in order to receive a potential incentive (Pedersen et al., 2015).
In terms of recruitment, Facebook is becoming a frequently used method for
obtaining research participants. On average, more than 2.5 million people use Facebook
per month in New Zealand (Pelea, 2015). Out of the New Zealand Facebook population,
54% are women and the dominant age group is 25-34 years old. The use of Facebook as
a recruitment method gives access to specific populations of interest through the use of
Facebook groups and pages. Similar to online surveys, Facebook is also able to reach
individuals who are geographically diverse. Although Facebook is popular among
younger individuals, access to the Internet and Facebook is lower among the older
population, thus the use of Facebook may lead to potential exclusion of older adults
(Pedersen et al., 2015).
Participants
Individuals were eligible for participation if they met the following criteria: (a)
were aged 18 years or older (to avoid any consent issues) and (b) were either a non-gym
user or a regular gym user. Regular gym users were classified as being individuals who
attend three or more 30-minute long gym sessions per week. This criterion was used
based on previous research that has examined anti-fat bias among regular exercisers
22
(Robertson & Vohora, 2008). Non-gym users were classified as being individuals who
do not attend a gym.
Both non-gym users and regular gym users were recruited through Facebook and
by word-of-mouth. Advertisement flyers were distributed on public Facebook pages of
44 gyms located around New Zealand and via a general Facebook status post (see
Appendix A). Each advertisement flyer was accompanied with the weblink for
participants to directly access the survey online. Ethical approval for the study was
granted by Massey University’s Human Ethics Committee.
Procedure
An online questionnaire was conducted to assess participants’ body image, body
esteem, perfectionism, and both implicit and explicit anti-fat attitudes (see Appendix B).
An online questionnaire, as opposed to a written questionnaire, was chosen for ease of
administration and recruitment of participants. Potential participants were able to access
the online questionnaire by clicking on the weblink advertised on Facebook. Upon
accessing the website, individuals were presented with an Information Sheet (see
Appendix C), which explained the nature of the study, what participation involved, and
contact information for support services. Once the Information Sheet was read,
individuals were asked to complete an eligibility questionnaire to ensure they met the
selection criteria. Once eligibility was determined, participants indicated their consent
by selecting the checkbox accompanied by an agreement to participate statement. After
consent was obtained, participants were asked to complete a short demographic
questionnaire before beginning the study questionnaire. The study questionnaire
consisted of one implicit measure (IAT) and four explicit measures (Multidimensional
Body-Self Relations Questionnaire – Appearance Scales, Almost Perfect Scale-Revised,
Anti-Fat Attitudes Scale, and Body-Esteem Scale). Administration of the IAT and
explicit assessment measures were counterbalanced to control for any order effects, thus
resulting in two versions of the study questionnaire (Nosek, Greenwald, & Banaji,
2005). Upon completion of the study questionnaire, participants were provided with
contact information for support services for those who may have had experienced any
psychological discomfort during participation. As a thank you for participation,
individuals were able to provide their email address to enter into the prize draw and/or

23
to receive a summary of the findings when the study has been completed. This section
of the survey was separate from the study questionnaire in order to maintain anonymity.
Measures
Demographic Questionnaire
Participants completed a short demographic questionnaire consisting of
questions regarding their age range group, gender, weight (kilograms) and height
(centimetres), number of gym sessions attended per week, and duration of exercise per
gym session.
Multidimensional Body-Self Relations Questionnaire – Appearance Scales
Cognitive, affective, and behavioural aspects of body image were assessed using
Cash’s (2000) Multidimensional Body-Self Relations Questionnaire – Appearance
Scales (MBSRQ-AS). The MBSRQ-AS was chosen based on its widespread use within
the body image literature and previous use among fitness populations (Michou &
Costarelli, 2011; Pickett, Lewis, & Cash, 2005). The MBSRQ-AS contains 34 items
relating to five different subscales. The Appearance Evaluation subscale assesses
feelings of physical attractiveness and satisfaction with one’s physical appearance (e.g.,
“I like my looks just the way they are”). A high score indicates greater feelings of
satisfaction with one’s appearance. The Appearance Orientation subscale measures
investment in one’s physical appearance (e.g., “Before going out in public, I always
notice how I look”). A high score indicates greater investment in one’s appearance. The
Overweight Preoccupation subscale measures presence of fat anxiety, weight vigilance,
and dieting and eating restraint behaviours (e.g., “I constantly worry about being or
becoming fat”). A high score indicates greater preoccupation with one’s weight and
related behaviours. The Self-Classified Weight subscale assesses perception of one’s
own weight (e.g., “I think I am very underweight”). A high score indicates lower
satisfaction with one’s weight. The Body Areas Satisfaction Subscale measures
satisfaction with specific areas of one’s body (e.g., “muscle tone”). A high score
indicates greater satisfaction with most areas of one’s body. Participants were asked to
answer each item using a 5-point Likert scale (ranging from 1 = “definitely disagree” to
5 = “definitely agree” or 1 = “very dissatisfied” to 5 = “very satisfied”).
24
Research examining the psychometric properties of the MBSRQ-AS, has
demonstrated strong evidence for its validity and reliability. Good internal consistency
scores have been established, based on a normative sample of U.S. adults aged 18 years
or older, for Appearance Evaluation (α = .88 and .88), Appearance Orientation (α = .88
and .85), Body Areas Satisfaction (α = .77 and .73), Overweight Preoccupation (α = .73
and .76), and Self-Classified Weight (α = .70 and .89), for males and females,
respectively (Cash, 2000). Research examining the validity of the MBSRQ-AS found
high correlations to other body image assessment measures, such as similarity between
the Appearance Orientation subscale and the Surveillance subscale from the Objectified
Body Consciousness Scale (McKinley & Hyde, 1996).
Almost Perfect Scale-Revised
Participants’ level of perfectionism was assessed using the Almost Perfect
Scale-Revised (APS-R; Slaney et al., 2001). The APS-R was chosen, as it is a brief
measure able to distinguish between adaptive and maladaptive perfectionism among
adults. The APS-R is a 23-item instrument that measures three dimensions of
perfectionism. The High Standards subscale assesses one’s personal standards (e.g., “I
have high expectations for myself”). The Discrepancy subscale measures distress
produced from the discrepancy between performance and standards (e.g., “I often feel
frustrated because I can’t meet my goals”). The Order subscale assesses one’s degree of
orderliness (e.g., “Neatness is important to me”). Participants were instructed to answer
each item using a 7-point Likert scale ranging from 1 = “strongly disagree” to 7 =
“strongly agree”. It is suggested that the higher the score on each subscale, the greater
the level of perfectionism. However, high scores on the High Standards and Order
subscales and a low score on the Discrepancy subscale indicate adaptive perfectionism,
whereas a high score on the Discrepancy subscale indicates maladaptive perfectionism.
Research evaluating the psychometric properties of the APS-R has demonstrated
favourable evidence for its use. Slaney and colleagues (2001) examined the use of the
APS-R among samples of U.S. college students. Results displayed high internal
consistency with Cronbach’s alpha scores for the Discrepancy, High Standards, and
Order subscales being .91, .85, and .82, respectively. The High Standards subscale
displayed good construct validity with the Self-Oriented Perfectionism subscale (.64)
from the HFMPS and with the Personal Standards subscale (.64) from the FMPS. The

25
Discrepancy subscale displayed good correlation with the Concern Over Mistakes (.55)
and Doubts About Actions (.62) subscales from the FMPS. Lastly, the Order subscale
significantly correlated with the Organisation subscale (.88) from the FMPS.
Anti-Fat Attitudes Scale
Participants’ explicit anti-fat attitudes were assessed using Crandall’s (1994) 13-
item Anti-Fat Attitudes (AFA) scale. The AFA scale was chosen, as it is a brief self-
report measure that is easily administered. The AFA scale is comprised of three
subscales. Dislike assesses one’s prejudice against overweight individuals (e.g., “I
dislike people who are overweight or obese”). Willpower measures beliefs about the
controllability of being overweight (e.g., “It is people’s own fault if they are
overweight”). Fear of Fat assesses personal concerns about weight gain (e.g., “I worry
about becoming fat”). Participants answered each item using a Likert scale (ranging
from 0 = “very strongly disagree” to 8 = “very strongly agree”). An average score
greater than zero on each of the three subscales indicates the presence of explicit anti-fat
attitudes; therefore a higher averaged score indicates stronger anti-fat attitudes.
Research evaluating the psychometric properties of the AFA scale has
demonstrated good reliability, with Cronbach’s alpha scores for the Dislike, Fear of Fat,
and Willpower subscales being .85, .84, and .79, respectively (O’Brien, Hunter, &
Banks, 2007). Research evaluating the validity of the AFA scale has shown good
construct validity for the Dislike and Willpower subscales. However, support for the
construct validity of the Fear of Fat scale appears to be lacking (Morrison, Roddy, &
Ryan, 2009). Crandall and colleagues (2001) conducted a cross-cultural study using
participants from Australia, India, Poland, Turkey, U.S., and Venezuela. Results
showed that the Dislike subscale positively correlated with scores on measures
assessing negative cultural value for fatness and the tendency to make judgments of
responsibility for being overweight. Furthermore, Crandall (1994) demonstrated that
measures assessing a personal worldview in which individuals believe in a just world
correlated positively with the Dislike and Willpower subscales but not the Fear of Fat
subscale.

26
Body-Esteem Scale
Participants’ body esteem was assessed using Franzoi and Shields’ (1984) 35-
item Body-Esteem Scale (BES). The BES was chosen, as it is a brief multidimensional
measure of body esteem for adults. The BES consists of three subscales for men
(Physical Attractiveness, Upper Body Strength, and Physical Condition) and three
subscales for women (Sexual Attractiveness, Weight Concern, and Physical Condition).
However, in order to assess gender differences, the six subscale scores were summed to
produce an overall BES score for each participant (McKinley, 1998). Participants
answered each item using a Likert scale (ranging from 1 = “have strong negative
feelings” to 5 = “have strong positive feelings”). A higher score indicates greater esteem
for one’s body.
Research evaluating the psychometric properties of the BES has demonstrated
favourable evidence for its reliability and validity. Franzoi and Shields (1984) examined
the use of the BES among a sample of 331 undergraduate males and 633 undergraduate
females. Results displayed good internal consistency for each of the male and female
subscales. For males, Cronbach’s alpha scores for the Physical Attractiveness, Upper
Body Strength, and Physical Condition subscales were .81, .85, and .86, respectively.
For females, Cronbach’s alpha scores for the Sexual Attractiveness, Weight Concern,
and Physical Condition subscales were .78, .87, and .82, respectively. Evidence
supporting the scale’s convergent validity has demonstrated a moderate correlation with
the Rosenberg Self-Esteem Scale. Furthermore, the BES displays good discriminant
validity, such that the Weight Concern subscale has shown to discriminate anorexic
females from non-anorexic females. For males, the Upper Body Strength subscale has
shown to discriminate male weightlifters from non-weightlifters.
Implicit Association Test
An Implicit Association Test (IAT) was administered to assess participants’
implicit anti-fat attitudes by measuring their response latency (time in milliseconds
between the start of the trial and a correct response) when making certain associations
(see Appendix D). The IAT was chosen for this study, as it is one of the most common
methods for assessing implicit anti-fat attitudes and for its ease of administration
(Robertson & Vohora, 2008).
27
The design of the IAT for this study was based on the generic computer-based
IAT procedure employed by O’Toole and colleagues (2007). Participants were asked to
classify word stimuli into target and/or attribute categories as quickly as possible. For
each trial, the first target and/or attribute category was presented at the top left of the
computer screen, the second target and/or attribute category was presented at the top
right of the screen, and word stimuli was presented in the centre of the screen.
Participants were instructed to categorise word stimuli by using the letters on their
computer keyboard. The letter ‘D’ was pressed to categorise the word stimuli into the
left category, whereas the letter ‘K’ was pressed to categorise the word stimuli to the
right category. When a correct response was given, the next trial (word) in the block
was presented. Each trial was separated with a 400 ms interval, which began once a
correct response was given. If the participant categorised the stimuli incorrectly, a red
‘X’ appeared on screen, which required the participant to press the appropriate response
key to continue to the next trial. Participants were given one practice trial in order to
familiarise themselves with the procedure. In this trial, participants were instructed to
categorise the word ‘triangle’ into either the two categories displayed on the left side of
the computer screen (‘animal’ or ‘shape’) or the right side of the screen (‘plant’ or
‘colour’). Once the correct response was obtained, the actual IAT began.
The IAT consisted of seven blocks in total. The first block of 24 trials instructed
participants to categorise word stimuli (fat, obese, large, slim, thin, skinny) into the
correct target category of ‘thin people’ (‘D’ key) or ‘fat people’ (‘K’ key). Each word
was presented four times. The second block of 24 trials instructed the participants to
categorise word stimuli (wonderful, joyful, excellent, terrible, nasty, horrible) relating to
the attribute category of ‘bad’ (‘D’ key) or ‘good’ (‘K’ key). Each word was presented
four times. The third block of 24 trials paired up the target and attribute categories, such
that on the left side of the computer screen ‘thin people’ and ‘bad’ (‘D’ key) were
shown together, whereas ‘fat people’ and ‘good’ (‘K’ key) were paired together on the
right side of the screen. Each word was presented twice. The fourth block repeated
block three but with 48 trials. Each word was presented four times. The fifth block was
similar to block one except the placement of the target categories were switched such
that ‘fat people’ (‘D’ key) was shown on the left side of the screen and ‘thin people’
(‘K’ key) was shown on the right of the screen. This block consisted of 48 trials, as it is

28
advised to double the number of trials in order to reduce any task order effect (Nosek et
al., 2005). Each word was presented eight times. In the sixth block of 24 trials, the
pairing of the target and attribute categories switch, such that ‘fat people’ and ‘bad’ (‘D’
key) were paired and ‘thin people’ and ‘good’ (‘K’ key) were paired together. Each
word was presented twice. The seventh block repeated block six but with 48 trials. Each
word was presented four times.
Generally, participants tend to classify word stimuli quicker when the positive
attribute category (‘good’) is paired with ‘thin people’ and when the negative attribute
category (‘bad’) is paired with ‘fat people’ (e.g., consistent blocks) compared to when
the negative attribute category (‘bad’) is paired with ‘thin people’ and when the positive
attribute category (‘good’) is paired with ‘fat people’ (e.g., inconsistent blocks) (see
Figure 6). This is due to the consistent blocks being congruent with an individual’s
automatic associations (O’Brien, Hunter, Halberstadt, et al., 2007).
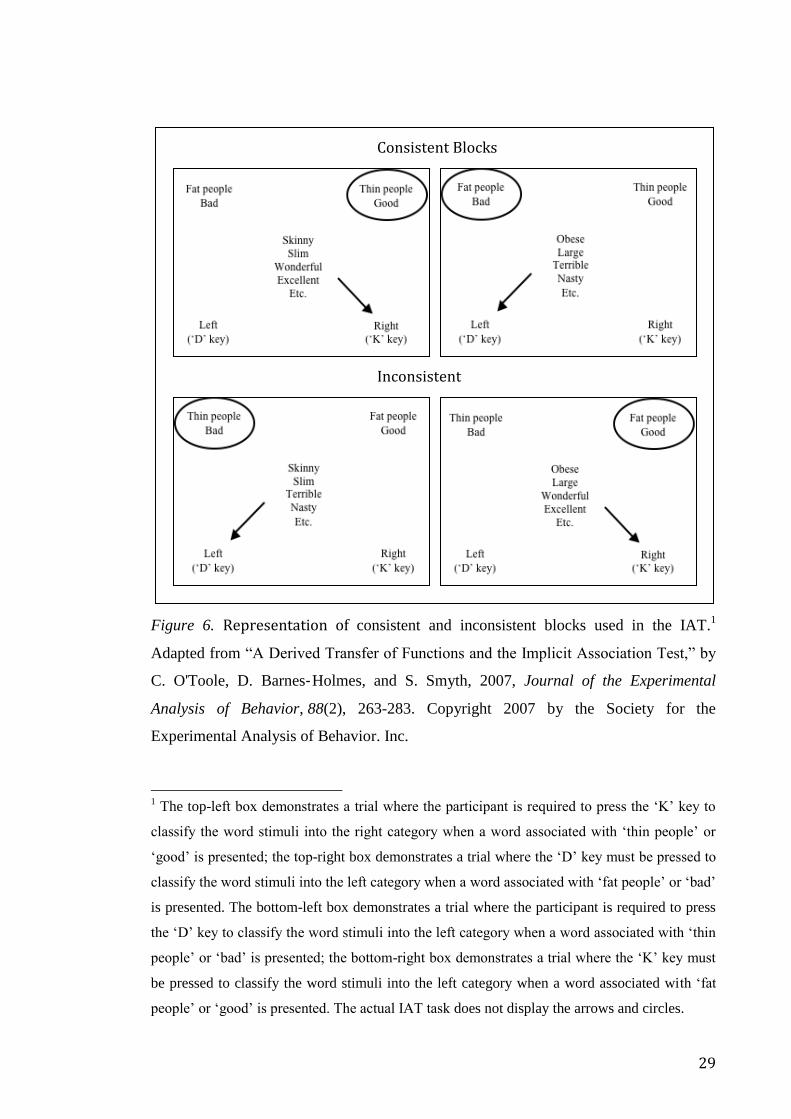
29
Figure 6. Representation of consistent and inconsistent blocks used in the IAT.1
Adapted from “A Derived Transfer of Functions and the Implicit Association Test,” by
C. O'Toole, D. Barnes‐Holmes, and S. Smyth, 2007, Journal of the Experimental
Analysis of Behavior, 88(2), 263-283. Copyright 2007 by the Society for the
Experimental Analysis of Behavior. Inc.
1 The top-left box demonstrates a trial where the participant is required to press the ‘K’ key to
classify the word stimuli into the right category when a word associated with ‘thin people’ or
‘good’ is presented; the top-right box demonstrates a trial where the ‘D’ key must be pressed to
classify the word stimuli into the left category when a word associated with ‘fat people’ or ‘bad’
is presented. The bottom-left box demonstrates a trial where the participant is required to press
the ‘D’ key to classify the word stimuli into the left category when a word associated with ‘thin
people’ or ‘bad’ is presented; the bottom-right box demonstrates a trial where the ‘K’ key must
be pressed to classify the word stimuli into the left category when a word associated with ‘fat
people’ or ‘good’ is presented. The actual IAT task does not display the arrows and circles.
Consistent Blocks
Inconsistent Blocks
Consistent Blocks

30
Blocks one, three, and four were counterbalanced with blocks five, six, and
seven, respectively, in order to reduce order effects (Greenwald, Nosek, and Banaji,
2003). Block two remained in the same position across all participants. Consequently,
there were two versions of the IAT, with each version representing the different
counterbalanced orderings (see Table 1 and Table 2). Word stimuli within blocks one,
two, and five were presented in a fully randomised order. For the combination blocks
(three, four, six, and seven) the order of words were presented randomly, with the
restriction that the trials alternated between target and attribute words (e.g., a target
word was never followed by another target word, but was always followed by an
attribute word, and same for attribute words). Participants’ response latencies were
recorded for all trials in each of the seven blocks.
Table 1. Version one of the IAT
Phase Block No. of trials Left key Right Key
Practice 1 24 Thin Fat
Practice 2 24 Bad Good
Practice 3 24 Thin + Bad Fat + Good
Test 4 48 Thin + Bad Fat + Good
Practice 5 48 Fat Thin
Practice 6 24 Fat + Bad Thin + Good
Test 7 48 Fat + Bad Thin + Good
Note. Critical blocks are indicated in bold. IAT = Implicit Association Test. Adapted
from “ Understanding and Using the Implicit Association Test: I. An Improved
Scoring Algorithm,” by A. G. Greenwald, B. A. Nosek, and M. R. Banaji, 2003,
Journal of Personality and Social Psychology, 85(2), 197-216. Copyright 2003 by the
American Psychological Association, Inc.
Table 2. Version two of the IAT
Phase Block No. of trials Left key Right key
Practice 5 48 Fat Thin
Practice 2 24 Bad Good
Practice 6 24 Fat + Bad Thin + Good
Test 7 48 Fat + Bad Thin + Good
Practice 1 24 Thin Fat
Practice 3 24 Thin + Bad Fat + Good
Test 4 48 Thin + Bad Fat + Good
Note. Critical blocks are indicated in bold. IAT = Implicit Association Test. Adapted
from “ Understanding and Using the Implicit Association Test: I. An Improved
Scoring Algorithm,” by A. G. Greenwald, B. A. Nosek, and M. R. Banaji, 2003,
Journal of Personality and Social Psychology, 85(2), 197-216. Copyright 2003 by the
American Psychological Association, Inc.
31
Research evaluating the psychometric properties of IAT measures has
demonstrated good predictive validity, such that IAT tasks are better at predicting
behaviour when measuring discrimination toward social groups compared to explicit
measures (Greenwald, Poehlman, Uhlmann, & Banaji, 2009). Furthermore, IAT
measures have shown satisfactory internal consistency with Cronbach’s alpha scores
ranging from .70 to .90 (Nosek et al., 2007).
Data Analysis
Power Analysis
Prior to data collection, a power analysis was conducted. A minimum of 31
participants in each of the four groups (regular gym users, non-gym users, males and
females) was determined based on an alpha of 0.05 and beta of 0.50 with 80% power.
D-algorithm
The D-algorithm was used to transform the IAT response latency data from each
participant into a D-score (Greenwald et al., 2003). The D score allows for the detection
of implicit anti-fat attitudes by calculating the difference in average response latency
between trials in blocks 3 and 4 to trials in blocks 6 and 7, and then dividing by the
standard deviation of all latencies for all four blocks. As recommended by Greenwald
and colleagues (2003), the following scoring procedure was used to calculate D-scores:
(1) exclude trials exceeding 10,000 ms; (2) exclude all data for a participant if more
than 10% of trials have latencies less than 300 ms; (3) calculate one ‘inclusive’ standard
deviation for all trials in blocks 3 and 6 and another standard deviation for all trials in
blocks 4 and 7; (4) calculate separate mean latency for trials in each of the four blocks
(3, 4, 6, and 7); (5) calculate two mean difference scores (Mean Block 6 – Mean Block 3 and
Mean block 7 – Mean block 4); (6) divide each difference score by its associated ‘inclusive’
standard deviation calculated in step 3; and (7) calculate the equal-weight average of the
two resulting ratios from step 6. The D score ranges from -2 to +2, where a positive D
score indicates stronger implicit anti-fat attitudes (e.g., stronger associations of negative
attributes with fat people compared with thin people) and a negative D score indicates
weaker implicit anti-fat attitudes. A D score of 0 indicates no difference in associations
with fat people compared with thin people.
32
Descriptive Statistics
All data analyses were performed using Statistical Package for the Social
Sciences (SPSS) software for Macintosh version 23. Recoding was used to reverse-
score all negatively worded items. Descriptive statistics were conducted for the
MBSRQ-AS subscales, APS-R subscales, BES, AFA subscales, and the IAT for each of
the four groups (regular gym users, non-gym users, males, and females).
Reliability Analysis
Reliability analyses were conducted for all subscales and total scales using
Cronbach’s alpha. When interpreting Cronbach’s alpha, George and Mallery (2003)
suggest applying the following criteria: α ≥ 0.9 = Excellent, 0.9 > α ≥ 0.8 = Good, 0.8 >
α ≥ 0.7 = Acceptable, 0.7 > α ≥ 0.6 = Questionable, 0.6 > α ≥ 0.5 = Poor, and 0.5 > α =
Unacceptable.
Pearson’s Correlation
Pearson’s correlation coefficients were used to assess relationships between
BMI, body image (MBSRQ-AS, Appearance Evaluation, Body Areas Satisfaction,
Appearance Orientation, Overweight Preoccupation, and Self-Classified Weight),
perfectionism (APS-R, Standards, Order, and Discrepancy), body esteem (BES),
explicit anti-fat attitudes (AFA, Dislike, Fear, and Willpower), and implicit anti-fat
attitudes (IAT) among regular gym users and non-gym users, and among males and
females.
Analysis of Variance (ANOVA)
Two one-way ANOVAs were performed to assess differences in BMI, body
image (MBSRQ-AS, Appearance Evaluation, Body Areas Satisfaction, Appearance
Orientation, Overweight Preoccupation, and Self-Classified Weight), perfectionism
(APS-R, Standards, Order, and Discrepancy), body esteem (BES), explicit anti-fat
attitudes (AFA, Dislike, Fear, and Willpower), and implicit anti-fat attitudes (IAT)
between regular gym users and non-gym users, and between males and females. One-
way ANOVAs were conducted prior to the independent t-tests in order to control for
Type 1 error.
33
T-Tests
Independent-sample t-tests were conducted comparing regular gym users and
non-gym users, and males and females to determine whether the groups differed in
BMI, body image (MBSRQ-AS, Appearance Evaluation, Body Areas Satisfaction,
Appearance Orientation, Overweight Preoccupation, and Self-Classified Weight),
perfectionism (APS-R, Standards, Order, and Discrepancy), body esteem (BES),
explicit anti-fat attitudes (AFA, Dislike, Fear, and Willpower), and implicit anti-fat
attitudes (IAT).
Moderation and Mediation Analyses
Hayes’ (2013) PROCESS macro for SPSS was used to assess the mediating and
moderating role of perfectionism and body esteem in the relationship between body
image and anti-fat attitudes. PROCESS employs the nonparametric bootstrap method
that estimates standard errors and confidence intervals based on a number of resamples
from a given sample (Preacher & Hayes, 2004). The bootstrap method was chosen, as
opposed to Baron and Kenny’s causal steps approach, as it produces greater statistical
power, and is better suited to smaller sample sizes (Preacher & Hayes, 2004). For all
analyses, coefficients, standard errors and 95% confidence intervals were calculated
based on 5000 bootstrap samples, as recommended by Hayes (2013). When testing for
mediation, if bootstrap confidence intervals do not include 0, then an indirect
(mediation) effect can be assumed with 95% confidence. All coefficients, direct,
indirect, and total effects produced from the mediation analyses are reported in
unstandardised form, as this is the recommended metric used for causal modelling
(Hayes, 2013).
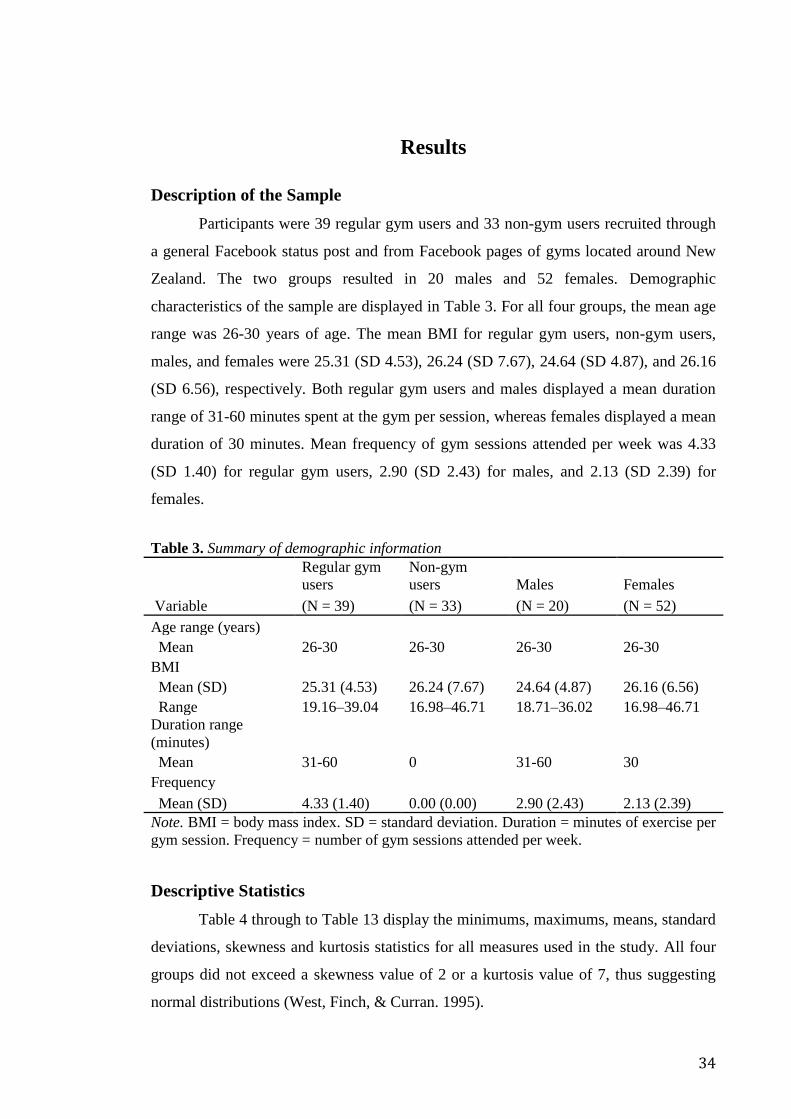
34
Results
Description of the Sample
Participants were 39 regular gym users and 33 non-gym users recruited through
a general Facebook status post and from Facebook pages of gyms located around New
Zealand. The two groups resulted in 20 males and 52 females. Demographic
characteristics of the sample are displayed in Table 3. For all four groups, the mean age
range was 26-30 years of age. The mean BMI for regular gym users, non-gym users,
males, and females were 25.31 (SD 4.53), 26.24 (SD 7.67), 24.64 (SD 4.87), and 26.16
(SD 6.56), respectively. Both regular gym users and males displayed a mean duration
range of 31-60 minutes spent at the gym per session, whereas females displayed a mean
duration of 30 minutes. Mean frequency of gym sessions attended per week was 4.33
(SD 1.40) for regular gym users, 2.90 (SD 2.43) for males, and 2.13 (SD 2.39) for
females.
Table 3. Summary of demographic information
Regular gym
users
Non-gym
users Males Females
Variable (N = 39) (N = 33) (N = 20) (N = 52)
Age range (years)
Mean 26-30 26-30 26-30 26-30
BMI
Mean (SD) 25.31 (4.53) 26.24 (7.67) 24.64 (4.87) 26.16 (6.56)
Range 19.16–39.04 16.98–46.71 18.71–36.02 16.98–46.71
Duration range
(minutes)
Mean 31-60 0 31-60 30
Frequency
Mean (SD) 4.33 (1.40) 0.00 (0.00) 2.90 (2.43) 2.13 (2.39)
Note. BMI = body mass index. SD = standard deviation. Duration = minutes of exercise per
gym session. Frequency = number of gym sessions attended per week.
Descriptive Statistics
Table 4 through to Table 13 display the minimums, maximums, means, standard
deviations, skewness and kurtosis statistics for all measures used in the study. All four
groups did not exceed a skewness value of 2 or a kurtosis value of 7, thus suggesting
normal distributions (West, Finch, & Curran. 1995).

35
MBSRQ-AS
Mean scores for the MBSRQ-AS subscales were higher among regular gym
users, compared to non-gym users, except for Self-Classified Weight, which was
slightly lower for non-gym users (see Table 4). Minimum and maximum values were
consistent between regular gym users and non-gym users, and similarly for males and
females.
Table 5 shows mean scores for Appearance Evaluation, Body Areas
Satisfaction, and Appearance Orientation were higher among males compared to
females, whereas females displayed higher means for Overweight Preoccupation and
Self-Classified Weight.

36
Table 4. Descriptive Statistics for MBSRQ-AS Subscales among regular gym users and non-gym users
Group Subscale Minimum Maximum Mean SD Skewness Kurtosis
Regular
gym users
Appearance
Evaluation
8 32 22.64 5.41 -0.66 0.60
Body Areas
Satisfaction
13 40 30.10 5.92 -0.64 0.51
Appearance
Orientation
26 57 41.46 7.25 0.23 0.07
Overweight
Preoccupation
5 18 11.56 3.34 -0.10 -0.24
Self-Classified
Weight
5 9 6.62 1.14 0.60 -0.39
Non-gym
users
Appearance
Evaluation
7 35 21.85 7.76 -0.43 -0.93
Body Areas
Satisfaction
17 44 30.09 7.40 -0.01 -0.95
Appearance
Orientation
25 56 40.70 7.97 0.07 -0.51
Overweight
Preoccupation
4 17 9.58 3.61 0.21 -1.05
Self-Classified
Weight
4 10 6.67 1.81 0.37 -0.82
Note. SD = standard deviation. MBSRQ-AS = Multidimensional Body-Self Relations Questionnaire – Appearance
Scales.
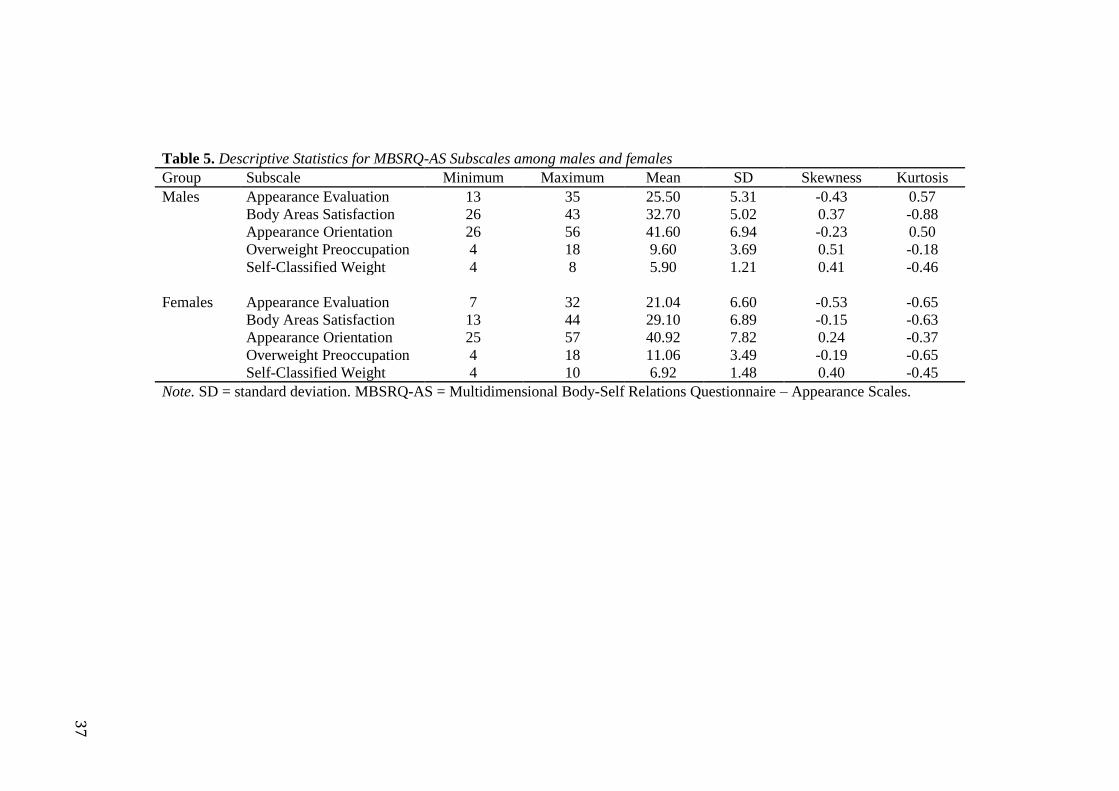
37
Table 5. Descriptive Statistics for MBSRQ-AS Subscales among males and females
Group Subscale Minimum Maximum Mean SD Skewness Kurtosis
Males Appearance Evaluation 13 35 25.50 5.31 -0.43 0.57
Body Areas Satisfaction 26 43 32.70 5.02 0.37 -0.88
Appearance Orientation 26 56 41.60 6.94 -0.23 0.50
Overweight Preoccupation 4 18 9.60 3.69 0.51 -0.18
Self-Classified Weight 4 8 5.90 1.21 0.41 -0.46
Females Appearance Evaluation 7 32 21.04 6.60 -0.53 -0.65
Body Areas Satisfaction 13 44 29.10 6.89 -0.15 -0.63
Appearance Orientation 25 57 40.92 7.82 0.24 -0.37
Overweight Preoccupation 4 18 11.06 3.49 -0.19 -0.65
Self-Classified Weight 4 10 6.92 1.48 0.40 -0.45
Note. SD = standard deviation. MBSRQ-AS = Multidimensional Body-Self Relations Questionnaire – Appearance Scales.

38
APS-R
Table 6 shows mean scores to be higher on all three APS-S subscales for regular
gym users compared to non-gym users. Minimum values for the Standards subscale
appeared to differ between regular gym users and non-gym users, with regular gym
users (Min = 22) displaying a relatively higher minimum value compared to non-gym
users (Min = 8) (see Table 6).
Mean scores for males were lower for Standards and Order but higher for
Discrepancy, compared to females (see Table 7). Males and females appeared to differ
on the Standards subscale, as females (Min = 21) displayed a higher minimum value
compared to males (Min = 8) (see Table 7).
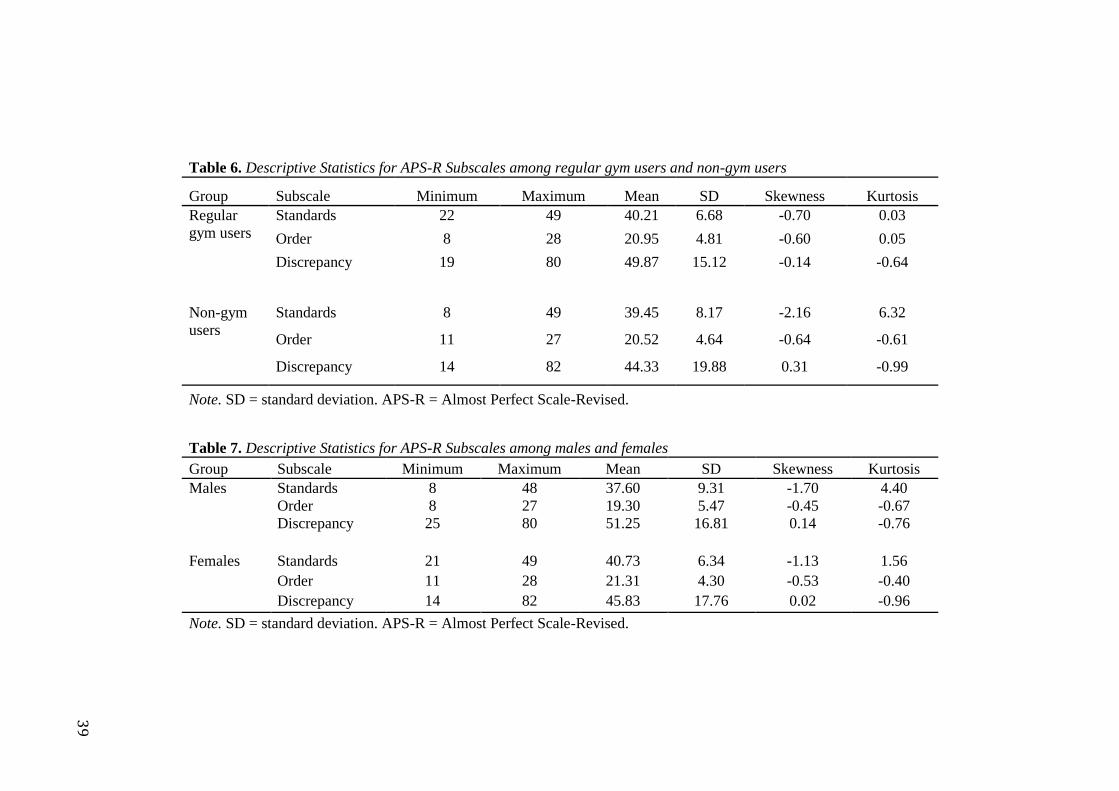
39
Table 6. Descriptive Statistics for APS-R Subscales among regular gym users and non-gym users
Group Subscale Minimum Maximum Mean SD Skewness Kurtosis
Regular
gym users
Standards 22 49 40.21 6.68 -0.70 0.03
Order 8 28 20.95 4.81 -0.60 0.05
Discrepancy 19 80 49.87 15.12 -0.14 -0.64
Non-gym
users
Standards 8 49 39.45 8.17 -2.16 6.32
Order 11 27 20.52 4.64 -0.64 -0.61
Discrepancy 14 82 44.33 19.88 0.31 -0.99
Note. SD = standard deviation. APS-R = Almost Perfect Scale-Revised.
Table 7. Descriptive Statistics for APS-R Subscales among males and females
Group Subscale Minimum Maximum Mean SD Skewness Kurtosis
Males Standards 8 48 37.60 9.31 -1.70 4.40
Order 8 27 19.30 5.47 -0.45 -0.67
Discrepancy 25 80 51.25 16.81 0.14 -0.76
Females Standards 21 49 40.73 6.34 -1.13 1.56
Order 11 28 21.31 4.30 -0.53 -0.40
Discrepancy 14 82 45.83 17.76 0.02 -0.96
Note. SD = standard deviation. APS-R = Almost Perfect Scale-Revised.

40
BES
Mean score for body esteem was higher among regular gym users (M = 119.13,
SD = 20.57) compared to non-gym users (M = 113.91, SD = 22.13), as shown in Table
8. Minimum and maximum values were consistent between regular gym users and non-
gym users.
Table 9 shows that males (M = 125.85, SD = 18.93) displayed a higher mean
score on the BES, compared to females (M = 113.23, SD = 21.29). Minimum value
between males and females appeared to be relatively higher for males, compared to
females (see Table 9).

41
Table 8. Descriptive Statistics for BES among regular gym users and non-gym users
Group Scale Minimum Maximum Mean SD Skewness Kurtosis
Regular
gym users
Body
Esteem
66 175 119.13 20.57 0.02 1.18
Non-gym
users
Body
Esteem
75 156 113.91 22.13 0.15 -0.76
Note. SD = standard deviation. BES = Body Esteem Scale.
Table 9. Descriptive Statistics for BES among males and females
Group Scale Minimum Maximum Mean SD Skewness Kurtosis
Males Body
Esteem
92 175 125.85 18.93 0.60 1.24
Females Body
Esteem
66 161 113.23 21.29 0.03 -0.33
Note. SD = standard deviation. BES = Body Esteem Scale.

42
AFA
Table 10 shows regular gym users displayed higher mean scores across all of the
AFA subscales compared to non-gym users. Minimum and maximum values for both
groups were comparable.
Table 11 reports mean scores for Dislike and Willpower were higher among
males, compared to females, whereas Fear was higher among females. Both gender
groups displayed similar minimum and maximum values.
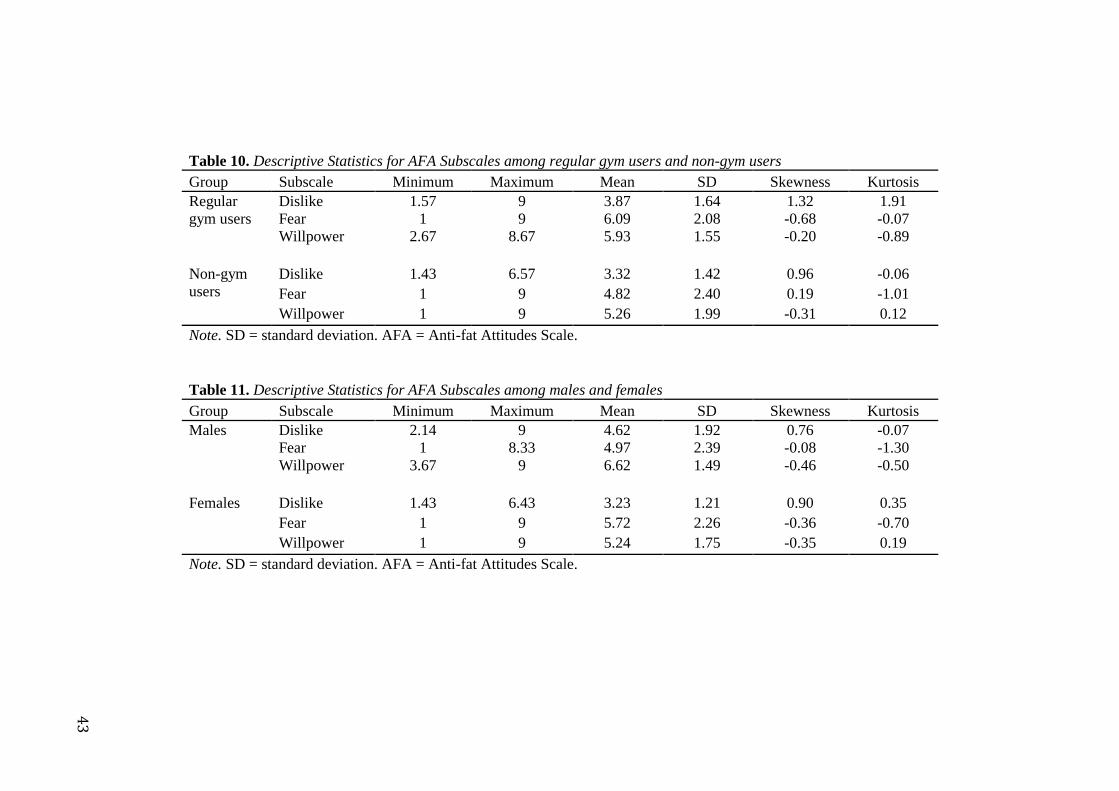
43
Table 10. Descriptive Statistics for AFA Subscales among regular gym users and non-gym users
Group Subscale Minimum Maximum Mean SD Skewness Kurtosis
Regular
gym users
Dislike 1.57 9 3.87 1.64 1.32 1.91
Fear 1 9 6.09 2.08 -0.68 -0.07
Willpower 2.67 8.67 5.93 1.55 -0.20 -0.89
Non-gym
users
Dislike 1.43 6.57 3.32 1.42 0.96 -0.06
Fear 1 9 4.82 2.40 0.19 -1.01
Willpower 1 9 5.26 1.99 -0.31 0.12
Note. SD = standard deviation. AFA = Anti-fat Attitudes Scale.
Table 11. Descriptive Statistics for AFA Subscales among males and females
Group Subscale Minimum Maximum Mean SD Skewness Kurtosis
Males Dislike 2.14 9 4.62 1.92 0.76 -0.07
Fear 1 8.33 4.97 2.39 -0.08 -1.30
Willpower 3.67 9 6.62 1.49 -0.46 -0.50
Females Dislike 1.43 6.43 3.23 1.21 0.90 0.35
Fear 1 9 5.72 2.26 -0.36 -0.70
Willpower 1 9 5.24 1.75 -0.35 0.19
Note. SD = standard deviation. AFA = Anti-fat Attitudes Scale.
44
IAT
Regular gym users (M = 0.17, SD = 0.66) displayed a higher mean D score for
the IAT, compared to non-gym users (M = -0.09, SD = 0.78), as shown in Table 12.
Minimum and maximum values were consistent between regular gym users and non-
gym users, and similarly for males and females.
Table 13 shows males (M = 0.00, SD = 0.66) demonstrated a slightly lower
mean IAT D score than females (M = 0.07, SD = 0.75).
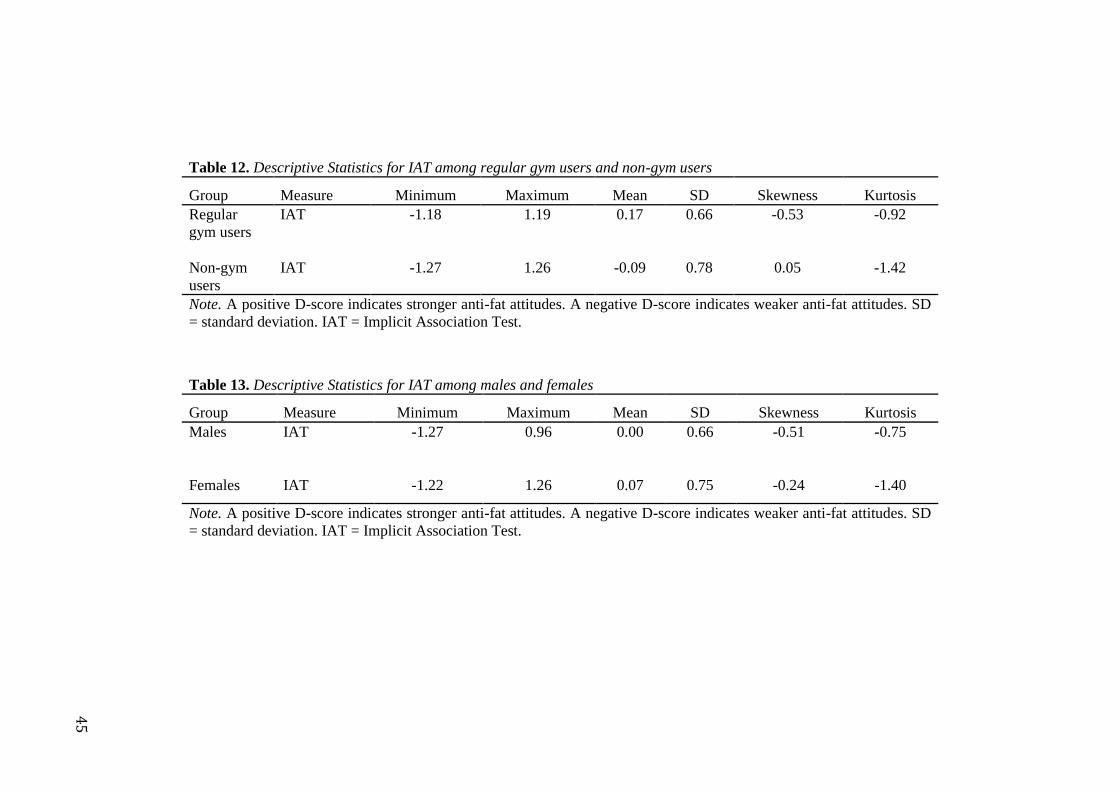
45
Table 12. Descriptive Statistics for IAT among regular gym users and non-gym users
Group Measure Minimum Maximum Mean SD Skewness Kurtosis
Regular
gym users
IAT -1.18 1.19 0.17 0.66 -0.53 -0.92
Non-gym
users
IAT -1.27 1.26 -0.09 0.78 0.05 -1.42
Note. A positive D-score indicates stronger anti-fat attitudes. A negative D-score indicates weaker anti-fat attitudes. SD
= standard deviation. IAT = Implicit Association Test.
Table 13. Descriptive Statistics for IAT among males and females
Group Measure Minimum Maximum Mean SD Skewness Kurtosis
Males IAT -1.27 0.96 0.00 0.66 -0.51 -0.75
Females IAT -1.22 1.26 0.07 0.75 -0.24 -1.40
Note. A positive D-score indicates stronger anti-fat attitudes. A negative D-score indicates weaker anti-fat attitudes. SD
= standard deviation. IAT = Implicit Association Test.
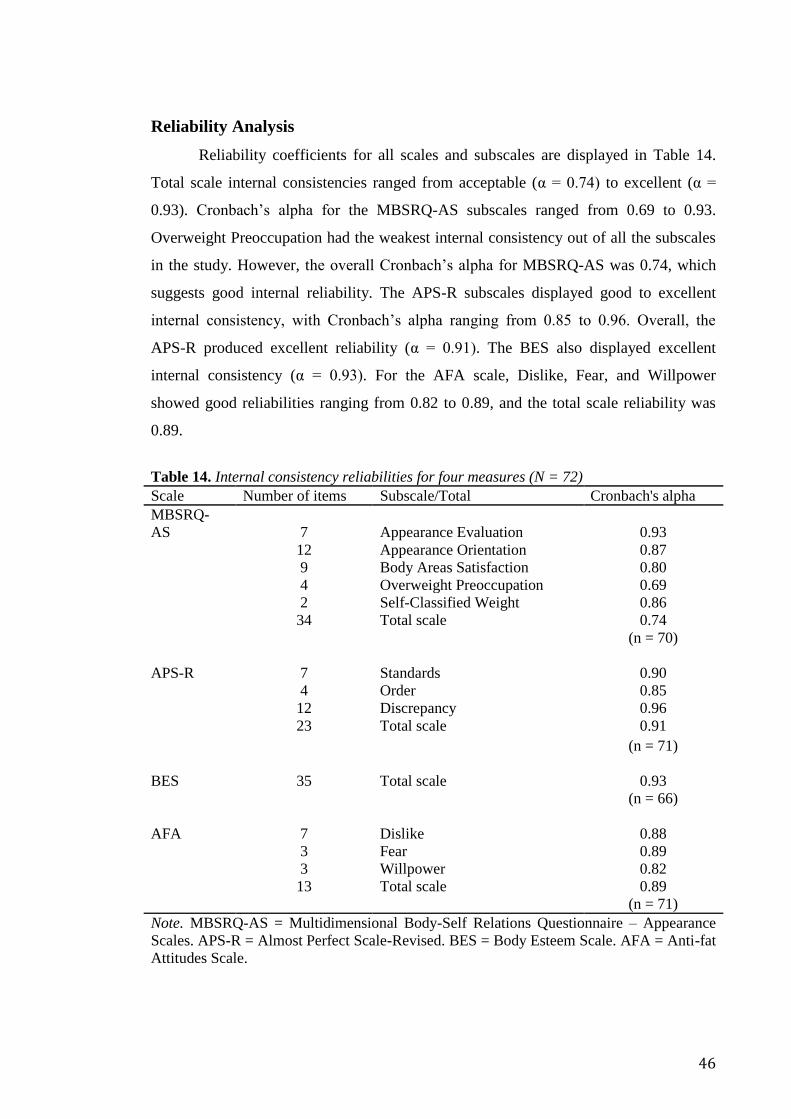
46
Reliability Analysis
Reliability coefficients for all scales and subscales are displayed in Table 14.
Total scale internal consistencies ranged from acceptable (α = 0.74) to excellent (α =
0.93). Cronbach’s alpha for the MBSRQ-AS subscales ranged from 0.69 to 0.93.
Overweight Preoccupation had the weakest internal consistency out of all the subscales
in the study. However, the overall Cronbach’s alpha for MBSRQ-AS was 0.74, which
suggests good internal reliability. The APS-R subscales displayed good to excellent
internal consistency, with Cronbach’s alpha ranging from 0.85 to 0.96. Overall, the
APS-R produced excellent reliability (α = 0.91). The BES also displayed excellent
internal consistency (α = 0.93). For the AFA scale, Dislike, Fear, and Willpower
showed good reliabilities ranging from 0.82 to 0.89, and the total scale reliability was
0.89.
Table 14. Internal consistency reliabilities for four measures (N = 72)
Scale Number of items Subscale/Total Cronbach's alpha
MBSRQ-
AS 7 Appearance Evaluation 0.93
12 Appearance Orientation 0.87
9 Body Areas Satisfaction 0.80
4 Overweight Preoccupation 0.69
2 Self-Classified Weight 0.86
34 Total scale 0.74
(n = 70)
APS-R 7 Standards 0.90
4 Order 0.85
12 Discrepancy 0.96
23 Total scale 0.91
(n = 71)
BES 35 Total scale 0.93
(n = 66)
AFA 7 Dislike 0.88
3 Fear 0.89
3 Willpower 0.82
13 Total scale 0.89
(n = 71)
Note. MBSRQ-AS = Multidimensional Body-Self Relations Questionnaire – Appearance
Scales. APS-R = Almost Perfect Scale-Revised. BES = Body Esteem Scale. AFA = Anti-fat
Attitudes Scale.

47
Correlational Analyses
Table 15 shows the correlation matrix of the Pearson correlations for each of the
variables in the study for regular gym users and non-gym users.

48
Table 15. Pearson’s correlations coefficients between BMI, body image (MBSRQ-AS, Appearance Evaluation, Body Areas Satisfaction, Appearance Orientation, Overweight
Preoccupation, and Self-Classified Weight), perfectionism (APS-R, Standards, Order, and Discrepancy), body esteem (BES), explicit anti-fat attitudes (AFA, Dislike, Fear,
and Willpower), and implicit anti-fat attitudes (IAT) for regular gym users and non-gym users
1 2 3 4 5 6 7 8 9 10 11 12 13 14 15 16 17
1. BMI — -.486** -.425* -.399* -0.25 0.171 .878** -0.196 0.048 -0.212 -0.194 -.443** 0.047 -0.319 0.134 0.171 -0.063
2. MBSRQ-AS 0.049 — .737** .715** .458** -0.325 -.592** 0.154 0.27 0.2 0.019 .788** 0.056 .391* -0.295 0.201 -0.108
3. Appearance
Evaluation -0.087 .639** — .938** -0.21 -.794** -.557** -0.077 0.175 0.038 -0.169 .844** -0.268 0.173 -.659** 0.068 -0.283
4. Body Areas
Satisfaction -0.094 .539** .730** — -0.252 -.762** -.573** -0.027 0.276 0.126 -0.174 .885** -0.276 0.147 -.628** 0.03 -.386*
5. Appearance
Orientation 0.09 .522** -0.192 -0.31 — .447** -0.223 0.294 0.086 0.175 0.261 -0.023 0.343 .345* 0.331 0.125 0.258
6. Overweight
Preoccupation 0.049 0.22 -0.295 -.441** .436** — 0.326 0.169 -0.179 0.084 0.247 -.575** .510** 0.059 .812** 0.128 .418*
7. Self-Classified
Weight .658*
* -0.061 -0.224 -0.142 -0.029 0.135 — -0.133 -0.046 -0.243 -0.077 -.578** 0.136 -0.294 0.297 0.158 0.086
8. APS-R 0.197 0.177 -0.183 -0.214 .482** 0.227 -0.023 — .420* .413* .875** 0.094 0.245 0.338 0.245 0.015 0.155
9. Standards 0.026 0.223 0.053 0.027 0.164 0.227 0.07 .585** — .435* -0.031 .413* -.373* -0.27 -0.302 -0.282 -0.283
10. Order 0.000 0.218 0.122 0.133 0.152 -0.019 -0.057 .491** .437** — 0.06 0.266 -0.182 0.059 -0.203 -0.206 0.113
11. Discrepancy 0.241 0.059 -0.297 -.329* .497** 0.197 -0.043 .868** 0.17 0.119 — -0.124 .477** .484** .452** 0.182 0.267
12. BES 0.187 .558** .629** .707** -0.107 -0.208 0.057 -0.083 0.043 0.125 -0.165 — -0.243 0.17 -.539** -0.02 -0.334
13. AFA 0.204 0.101 -0.277 -.394* .457** .487** 0.013 .506** 0.15 0.158 .533** -0.196 — .704** .791** .793** 0.325
14. Dislike 0.149 0.01 -0.009 -0.15 0.142 0.068 -0.18 .392* 0.052 0.055 .462** -0.052 .773** — 0.308 .497** 0.289
15. Fear 0.126 0.061 -.535** -.504** .584** .653** 0.127 .541** 0.204 0.296 .509** -0.302 .769** 0.298 — .355* 0.266
16. Willpower 0.216 0.176 -0.009 -0.214 0.282 .349* 0.054 0.207 0.069 -0.035 0.245 -0.062 .810** .599** .390* — 0.204
17. IAT -0.087 -0.18 -0.237 -0.21 -0.009 0.179 -0.002 0.171 0.21 0.024 0.118 -0.192 0.166 0.162 0.313 -0.149 —
Note. Regular gym users are presented in the lower half of the table and non-gym users are presented in the shaded upper half of the table. Significant correlations between
scales/subscales are indicated in bold. BMI = body mass index. MBSRQ-AS = Multidimensional Body-Self Relations Questionnaire – Appearance Scales. APS-R = Almost
Perfect Scale-Revised. BES = Body Esteem Scale. AFA = Anti-fat Attitudes Scale. IAT = Implicit Association Test.
** Correlation is significant at the 0.01 level (2-tailed).
* Correlation is significant at the 0.05 level (2-tailed).

49
Body Mass Index and Body Image
For both groups, a significant positive correlation was found between BMI and
Self-Classified Weight (Regular gym users, r = 0.658, p < 0.01; Non-gym users, r =
0.878, p < 0.01). Within both groups, BMI did not significantly correlate with
Appearance Orientation and Overweight Preoccupation.
BMI was negatively correlated with the MBSRQ-AS (r = -0.486, p < 0.01),
Appearance Evaluation (r = -0.425, p < 0.05), and Body Areas Satisfaction (r = -0.399,
p < 0.05) among non-gym users.
Body Image and Anti-Fat Attitudes
For both regular gym users and non-gym users, Overweight Preoccupation
positively correlated with the AFA scale (Regular gym users, r = 0.487, p < 0.01; Non-
gym users, r = 0.510, p < 0.01). Fear negatively correlated with Appearance Evaluation
within both groups (Regular gym users, r = -0.535, p < 0.01; Non-gym users, r = -
0.659, p < 0.01). Fear also showed a significant negative correlation with Body Areas
Satisfaction (Regular gym users, r = -0.504, p < 0.01; Non-gym users, r = -0.628, p <
0.01). Lastly, Fear positively correlated with Overweight Preoccupation for both regular
gym users and non-gym users (r = 0.653, p < 0.01; r = 0.812, p < 0.01, respectively).
Among regular gym users, the AFA scale negatively correlated with Body Areas
Satisfaction (r = -0.394, p < 0.05), and positively correlated with Appearance
Orientation (r = 0.457, p < 0.01). A positive correlation was found between Fear and
Appearance Orientation, which was significant among regular gym users (r = 0.584, p <
0.01). Regular gym users also displayed a significant positive correlation between
Willpower and Overweight Preoccupation (r = 0.349, p < 0.05). No significant
correlations were found between the MBSRQ-AS scale/subscales and the IAT among
regular gym users.
Among non-gym users, the MBSRQ-AS showed a significant positive
correlation with Dislike (r = 0.391, p < 0.05). A significant positive correlation was also
found between Appearance Orientation and Dislike among non-gym users (r = 0.345, p
< 0.05). A negative correlation was found between Body Areas Satisfaction and the
IAT, which was significant among non-gym users (r = -0.386, p < 0.05). The IAT also
positively correlated with Overweight Preoccupation among non-gym users (r = 0.418,
p < 0.05).
50
Body Image and Body Esteem
The MBSRQ-AS and the BES showed a significant positive correlation among
both regular gym users and non-gym users (r = 0.558, p < 0.01; r = 0.788, p < 0.01,
respectively). A significant positive correlation was also found between Appearance
Evaluation and the BES for both groups (Regular gym users, r = 0.629, p < 0.01; Non-
gym users r = 0.844, p < 0.01). Lastly, significant positive correlations were found for
Body Areas Satisfaction and the BES among both regular gym users and non-gym users
(r = 0.707, p < 0.01; r = 0.885, p < 0.01).
The BES was negatively correlated with Overweight Preoccupation (r = -0.575,
p < 0.01) and Self-Classified Weight (r = -0.578, p < 0.01), which were both significant
among non-gym users.
Body Esteem and Anti-fat Attitudes
Correlations between the BES and measures assessing explicit (AFA) anti-fat
attitudes were significant only among non-gym users, compared to regular gym users.
Specifically, a significant negative correlation was only found between the BES and
Fear (r = -0.539, p < 0.01). No significant correlations were found between the BES and
implicit (IAT) anti-fat attitudes among both regular gym users and non-gym users.
Body Image and Perfectionism
Correlations between the MBSRQ-AS scale/subscales and the APS-R
scale/subscales were significant only among regular gym users, compared to non-gym
users. For regular gym users, Appearance Orientation positively correlated with the
APS-R scale (r = 0.482, p < 0.01). Regular gym users also displayed a negative
correlation between Discrepancy and Body Areas Satisfaction (r = -0.329, p < 0.05),
and a positive correlation for Discrepancy and Appearance Orientation (r = 0.497, p <
0.01).
Perfectionism and Anti-fat Attitudes
For both regular gym users and non-gym users, Discrepancy positively
correlated with the AFA scale (Regular gym users, r = 0.533, p < 0.01; Non-gym users,
r = 0.477, p < 0.01). Discrepancy also showed a significant positive correlation with
Dislike within both groups (Regular gym users, r = 0.462, p < 0.01; Non-gym users, r =
51
0.484, p < 0.01). Lastly, Discrepancy and Fear demonstrated a significant positive
correlation among both regular gym users and non-gym users (r = 0.509, p < 0.01; r =
0.452, p < 0.01, respectively). No significant correlations were found between the APS-
R scale/subscales and the IAT among regular gym users and non-gym users.
Regular gym users showed a significant positive correlation between the AFA
scale and the APS-R scale (r = 0.506, p < 0.01). Dislike positively correlated with the
APS-R scale, which was significant among regular gym users (r = 0.392, p < 0.05).
Regular gym users also displayed a significant positive correlation between Fear and the
APS-R scale (r = 0.541, p < 0.01).
For non-gym users, a significant negative correlation was found between
Standards and the AFA scale (r = -0.373, p < 0.05).
Relationship between Implicit and Explicit Anti-fat Attitudes
No significant correlations were found between the IAT and the AFA
scale/subscales among both regular gym users and non-gym users.
Table 16 shows the correlation matrix of the Pearson correlations for each
of the variables in the study for males and females.
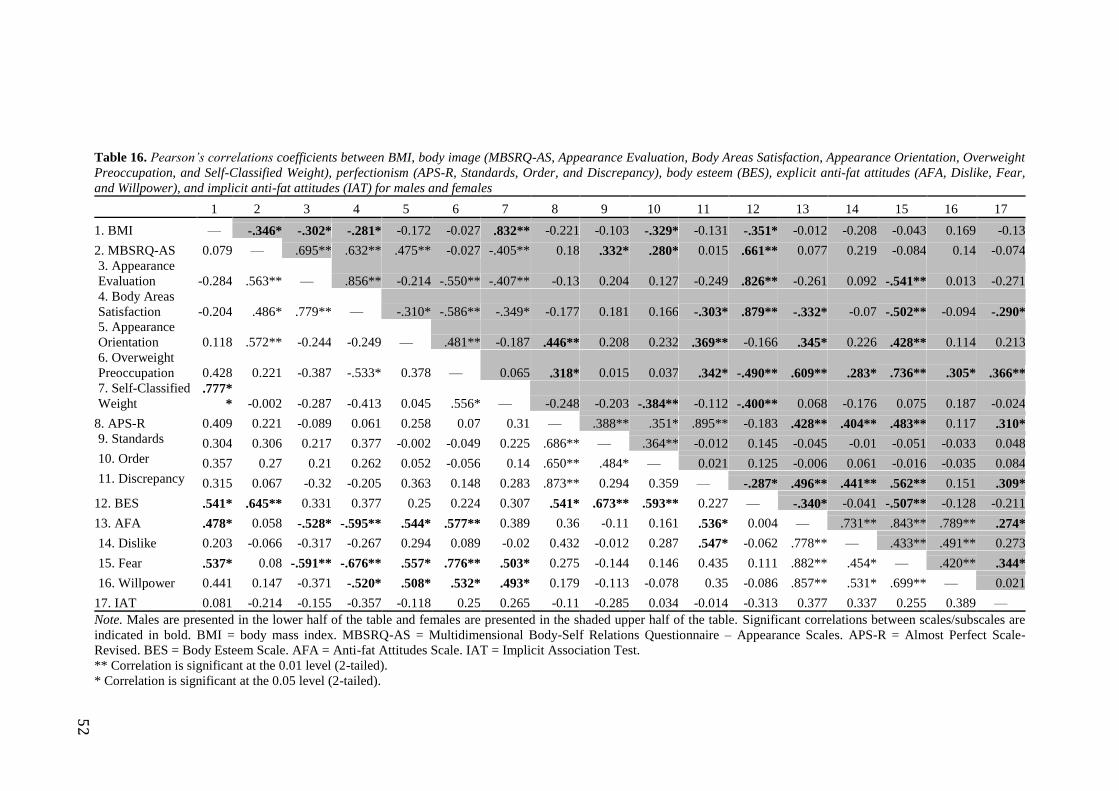
52
Table 16. Pearson’s correlations coefficients between BMI, body image (MBSRQ-AS, Appearance Evaluation, Body Areas Satisfaction, Appearance Orientation, Overweight
Preoccupation, and Self-Classified Weight), perfectionism (APS-R, Standards, Order, and Discrepancy), body esteem (BES), explicit anti-fat attitudes (AFA, Dislike, Fear,
and Willpower), and implicit anti-fat attitudes (IAT) for males and females
1 2 3 4 5 6 7 8 9 10 11 12 13 14 15 16 17
1. BMI — -.346* -.302* -.281* -0.172 -0.027 .832** -0.221 -0.103 -.329* -0.131 -.351* -0.012 -0.208 -0.043 0.169 -0.13
2. MBSRQ-AS 0.079 — .695** .632** .475** -0.027 -.405** 0.18 .332* .280* 0.015 .661** 0.077 0.219 -0.084 0.14 -0.074
3. Appearance
Evaluation -0.284 .563** — .856** -0.214 -.550** -.407** -0.13 0.204 0.127 -0.249 .826** -0.261 0.092 -.541** 0.013 -0.271
4. Body Areas
Satisfaction -0.204 .486* .779** — -.310* -.586** -.349* -0.177 0.181 0.166 -.303* .879** -.332* -0.07 -.502** -0.094 -.290*
5. Appearance
Orientation 0.118 .572** -0.244 -0.249 — .481** -0.187 .446** 0.208 0.232 .369** -0.166 .345* 0.226 .428** 0.114 0.213
6. Overweight
Preoccupation 0.428 0.221 -0.387 -.533* 0.378 — 0.065 .318* 0.015 0.037 .342* -.490** .609** .283* .736** .305* .366**
7. Self-Classified
Weight .777*
* -0.002 -0.287 -0.413 0.045 .556* — -0.248 -0.203 -.384** -0.112 -.400** 0.068 -0.176 0.075 0.187 -0.024
8. APS-R 0.409 0.221 -0.089 0.061 0.258 0.07 0.31 — .388** .351* .895** -0.183 .428** .404** .483** 0.117 .310*
9. Standards 0.304 0.306 0.217 0.377 -0.002 -0.049 0.225 .686** — .364** -0.012 0.145 -0.045 -0.01 -0.051 -0.033 0.048
10. Order 0.357 0.27 0.21 0.262 0.052 -0.056 0.14 .650** .484* — 0.021 0.125 -0.006 0.061 -0.016 -0.035 0.084
11. Discrepancy 0.315 0.067 -0.32 -0.205 0.363 0.148 0.283 .873** 0.294 0.359 — -.287* .496** .441** .562** 0.151 .309*
12. BES .541* .645** 0.331 0.377 0.25 0.224 0.307 .541* .673** .593** 0.227 — -.340* -0.041 -.507** -0.128 -0.211
13. AFA .478* 0.058 -.528* -.595** .544* .577** 0.389 0.36 -0.11 0.161 .536* 0.004 — .731** .843** .789** .274*
14. Dislike 0.203 -0.066 -0.317 -0.267 0.294 0.089 -0.02 0.432 -0.012 0.287 .547* -0.062 .778** — .433** .491** 0.273
15. Fear .537* 0.08 -.591** -.676** .557* .776** .503* 0.275 -0.144 0.146 0.435 0.111 .882** .454* — .420** .344*
16. Willpower 0.441 0.147 -0.371 -.520* .508* .532* .493* 0.179 -0.113 -0.078 0.35 -0.086 .857** .531* .699** — 0.021
17. IAT 0.081 -0.214 -0.155 -0.357 -0.118 0.25 0.265 -0.11 -0.285 0.034 -0.014 -0.313 0.377 0.337 0.255 0.389 —
Note. Males are presented in the lower half of the table and females are presented in the shaded upper half of the table. Significant correlations between scales/subscales are
indicated in bold. BMI = body mass index. MBSRQ-AS = Multidimensional Body-Self Relations Questionnaire – Appearance Scales. APS-R = Almost Perfect Scale-
Revised. BES = Body Esteem Scale. AFA = Anti-fat Attitudes Scale. IAT = Implicit Association Test.
** Correlation is significant at the 0.01 level (2-tailed).
* Correlation is significant at the 0.05 level (2-tailed).
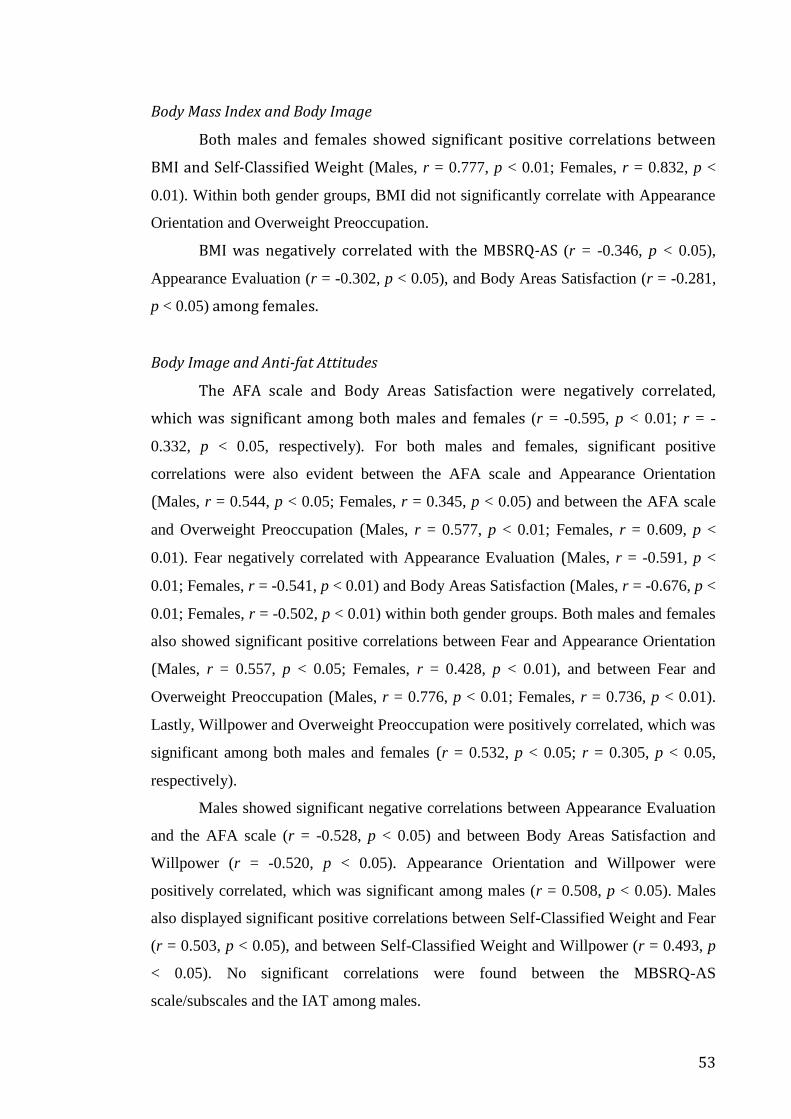
53
Body Mass Index and Body Image
Both males and females showed significant positive correlations between
BMI and Self-Classified Weight (Males, r = 0.777, p < 0.01; Females, r = 0.832, p <
0.01). Within both gender groups, BMI did not significantly correlate with Appearance
Orientation and Overweight Preoccupation.
BMI was negatively correlated with the MBSRQ-AS (r = -0.346, p < 0.05),
Appearance Evaluation (r = -0.302, p < 0.05), and Body Areas Satisfaction (r = -0.281,
p < 0.05) among females.
Body Image and Anti-fat Attitudes
The AFA scale and Body Areas Satisfaction were negatively correlated,
which was significant among both males and females (r = -0.595, p < 0.01; r = -
0.332, p < 0.05, respectively). For both males and females, significant positive
correlations were also evident between the AFA scale and Appearance Orientation
(Males, r = 0.544, p < 0.05; Females, r = 0.345, p < 0.05) and between the AFA scale
and Overweight Preoccupation (Males, r = 0.577, p < 0.01; Females, r = 0.609, p <
0.01). Fear negatively correlated with Appearance Evaluation (Males, r = -0.591, p <
0.01; Females, r = -0.541, p < 0.01) and Body Areas Satisfaction (Males, r = -0.676, p <
0.01; Females, r = -0.502, p < 0.01) within both gender groups. Both males and females
also showed significant positive correlations between Fear and Appearance Orientation
(Males, r = 0.557, p < 0.05; Females, r = 0.428, p < 0.01), and between Fear and
Overweight Preoccupation (Males, r = 0.776, p < 0.01; Females, r = 0.736, p < 0.01).
Lastly, Willpower and Overweight Preoccupation were positively correlated, which was
significant among both males and females (r = 0.532, p < 0.05; r = 0.305, p < 0.05,
respectively).
Males showed significant negative correlations between Appearance Evaluation
and the AFA scale (r = -0.528, p < 0.05) and between Body Areas Satisfaction and
Willpower (r = -0.520, p < 0.05). Appearance Orientation and Willpower were
positively correlated, which was significant among males (r = 0.508, p < 0.05). Males
also displayed significant positive correlations between Self-Classified Weight and Fear
(r = 0.503, p < 0.05), and between Self-Classified Weight and Willpower (r = 0.493, p
< 0.05). No significant correlations were found between the MBSRQ-AS
scale/subscales and the IAT among males.

54
Females showed a significant positive correlation between Dislike and
Overweight Preoccupation (r = 0.283, p < 0.05). Among females, the IAT negatively
correlated with Body Areas Satisfaction (r = -0.290, p < 0.05), and positively correlated
with Overweight Preoccupation (r = 0.366, p < 0.01).
Body Image and Body Esteem
Significant positive correlations were found between the MBSRQ-AS and the
BES for both males and females (r = 0.645, p < 0.01; r = 0.661, p < 0.01, respectively).
Among females, the BES positively correlated with Appearance Evaluation (r =
0.826, p < 0.01) and Body Areas Satisfaction (r = 0.879, p < 0.01), and negatively
correlated with Overweight Preoccupation (r = -0.490, p < 0.01) and Self-Classified
Weight (r = -0.400, p < 0.01).
Body Esteem and Anti-fat Attitudes
Correlations between the BES and measures assessing explicit (AFA) anti-fat
attitudes were significant only among females, compared to males. The BES negatively
correlated with the AFA scale (r = -0.340, p < 0.05) and Fear (r = -0.507, p < 0.01). No
significant correlations were found between the BES and implicit (IAT) anti-fat
attitudes among both males and females.
Body Image and Perfectionism
Correlations between the MBSRQ-AS scale/subscales and the APS-R
scale/subscales were significant only among females, compared to males. The MBSRQ-
AS positively correlated with both the Standards (r = 0.332, p < 0.05) and Order (r =
0.280, p < 0.05) subscales. Among females, the APS-R scale positively correlated with
Appearance Orientation (r = 0.446, p < 0.01) and Overweight Preoccupation (r = 0.318,
p < 0.05). Self-Classified Weight and Order displayed a significant negative correlation
for females (r = -0.384, p < 0.01). Lastly, Discrepancy negatively correlated with Body
Areas Satisfaction (r = -0.303, p < 0.05), and positively correlated with both
Appearance Orientation (r = 0.369, p < 0.01) and Overweight Preoccupation (r = 0.342,
p < 0.05) among females.
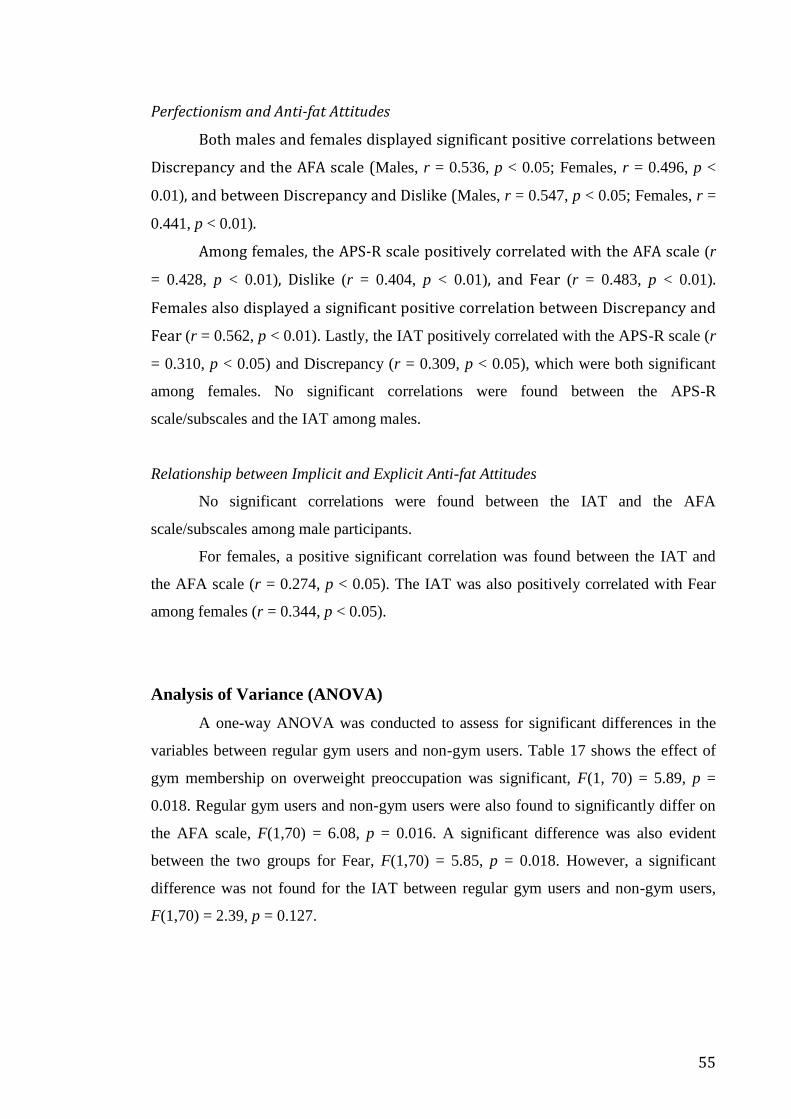
55
Perfectionism and Anti-fat Attitudes
Both males and females displayed significant positive correlations between
Discrepancy and the AFA scale (Males, r = 0.536, p < 0.05; Females, r = 0.496, p <
0.01), and between Discrepancy and Dislike (Males, r = 0.547, p < 0.05; Females, r =
0.441, p < 0.01).
Among females, the APS-R scale positively correlated with the AFA scale (r
= 0.428, p < 0.01), Dislike (r = 0.404, p < 0.01), and Fear (r = 0.483, p < 0.01).
Females also displayed a significant positive correlation between Discrepancy and
Fear (r = 0.562, p < 0.01). Lastly, the IAT positively correlated with the APS-R scale (r
= 0.310, p < 0.05) and Discrepancy (r = 0.309, p < 0.05), which were both significant
among females. No significant correlations were found between the APS-R
scale/subscales and the IAT among males.
Relationship between Implicit and Explicit Anti-fat Attitudes
No significant correlations were found between the IAT and the AFA
scale/subscales among male participants.
For females, a positive significant correlation was found between the IAT and
the AFA scale (r = 0.274, p < 0.05). The IAT was also positively correlated with Fear
among females (r = 0.344, p < 0.05).
Analysis of Variance (ANOVA)
A one-way ANOVA was conducted to assess for significant differences in the
variables between regular gym users and non-gym users. Table 17 shows the effect of
gym membership on overweight preoccupation was significant, F(1, 70) = 5.89, p =
0.018. Regular gym users and non-gym users were also found to significantly differ on
the AFA scale, F(1,70) = 6.08, p = 0.016. A significant difference was also evident
between the two groups for Fear, F(1,70) = 5.85, p = 0.018. However, a significant
difference was not found for the IAT between regular gym users and non-gym users,
F(1,70) = 2.39, p = 0.127.
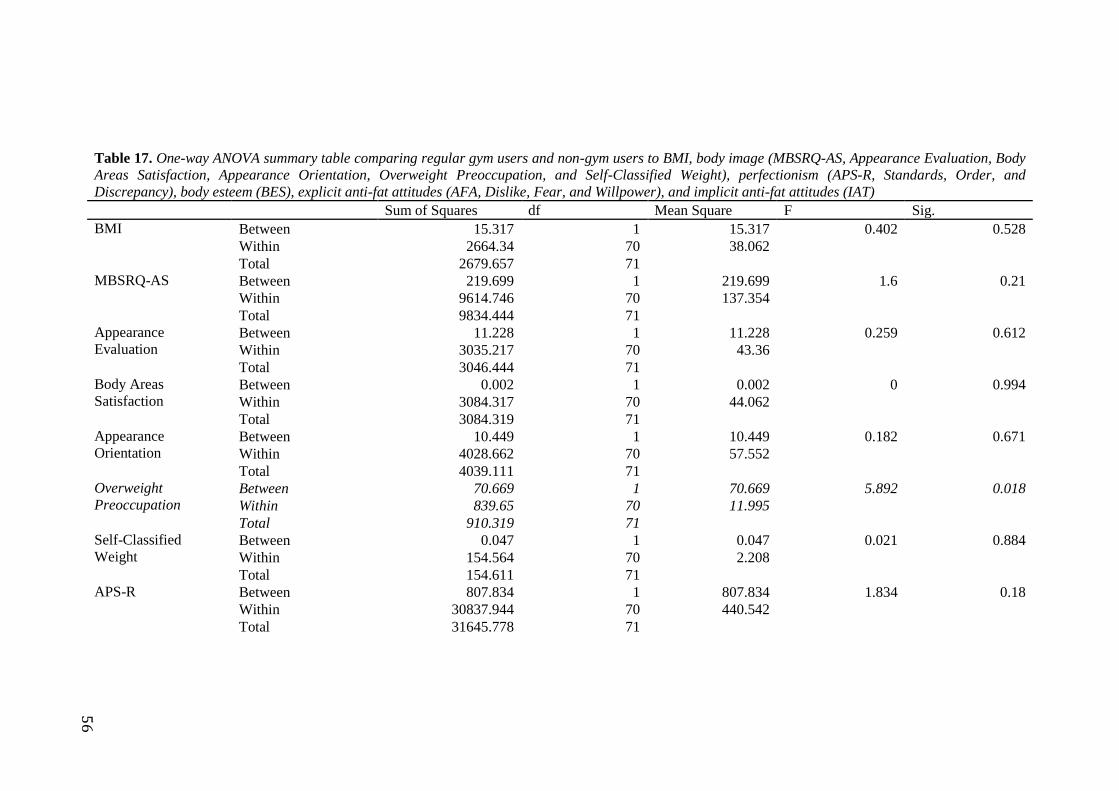
56
Table 17. One-way ANOVA summary table comparing regular gym users and non-gym users to BMI, body image (MBSRQ-AS, Appearance Evaluation, Body
Areas Satisfaction, Appearance Orientation, Overweight Preoccupation, and Self-Classified Weight), perfectionism (APS-R, Standards, Order, and
Discrepancy), body esteem (BES), explicit anti-fat attitudes (AFA, Dislike, Fear, and Willpower), and implicit anti-fat attitudes (IAT)
Sum of Squares df Mean Square F Sig.
BMI Between 15.317 1 15.317 0.402 0.528
Within 2664.34 70 38.062
Total 2679.657 71
MBSRQ-AS Between 219.699 1 219.699 1.6 0.21
Within 9614.746 70 137.354
Total 9834.444 71
Appearance
Evaluation Between 11.228 1 11.228 0.259 0.612
Within 3035.217 70 43.36
Total 3046.444 71
Body Areas
Satisfaction Between 0.002 1 0.002 0 0.994
Within 3084.317 70 44.062
Total 3084.319 71
Appearance
Orientation Between 10.449 1 10.449 0.182 0.671
Within 4028.662 70 57.552
Total 4039.111 71
Overweight
Preoccupation Between 70.669 1 70.669 5.892 0.018
Within 839.65 70 11.995
Total 910.319 71
Self-Classified
Weight Between 0.047 1 0.047 0.021 0.884
Within 154.564 70 2.208
Total 154.611 71
APS-R Between 807.834 1 807.834 1.834 0.18
Within 30837.944 70 440.542
Total 31645.778 71

57
Standards Between 10.07 1 10.07 0.184 0.669
Within 3828.541 70 54.693
Total 3838.611 71
Order Between 3.36 1 3.36 0.15 0.7
Within 1566.14 70 22.373
Total 1569.5 71
Discrepancy Between 548.308 1 548.308 1.799 0.184
Within 21331.692 70 304.738
Total 21880 71
BES Between 486.9 1 486.9 1.074 0.304
Within 31747.086 70 453.53
Total 32233.986 71
AFA Between 12.419 1 12.419 6.078 0.016
Within 143.035 70 2.043
Total 155.454 71
Dislike Between 5.521 1 5.521 2.31 0.133
Within 167.288 70 2.39
Total 172.809 71
Fear
Between 29.096 1 29.096 5.849 0.018
Within 348.231 70 4.975
Total 377.327 71
Willpower Between 8 1 8 2.572 0.113
Within 217.764 70 3.111
Total 225.764 71
IAT Between 1.218 1 1.218 2.385 0.127
Within 35.752 70 0.511
Total 36.97 71
Note. Significant group differences are italicised. BMI = body mass index. MBSRQ-AS = Multidimensional Body-Self Relations Questionnaire – Appearance
Scales. APS-R = Almost Perfect Scale-Revised. BES = Body Esteem Scale. AFA = Anti-fat Attitudes Scale. IAT = Implicit Association Test. Significance p
<0.05.

58
A one-way ANOVA was conducted to assess for significant differences in the
variables between males and females. Table 18 shows males and females significantly
differed in the MBSRQ-AS, F(1,70) = 4.28, p = 0.042. Significant differences were also
found for Appearance Evaluation, F(1,70) = 7.30, p = 0.009, Body Areas Satisfaction,
F(1,70) = 4.53, p = 0.037, and Self-Classified Weight, F(1,70) = 7.59, p = 0.007.
Results show the effect of gender on body esteem was significant, F(1,70) = 5.38, p =
0.023. When assessing anti-fat attitudes, a significant difference was found between
males and females for Dislike, F(1,70) = 13.50, p = 0.000, and Willpower, F(1,70) =
9.60), p = 0.003. However, no significant difference was found between the two groups
for the IAT, F(1,70) = 0.11, p = 0.744.
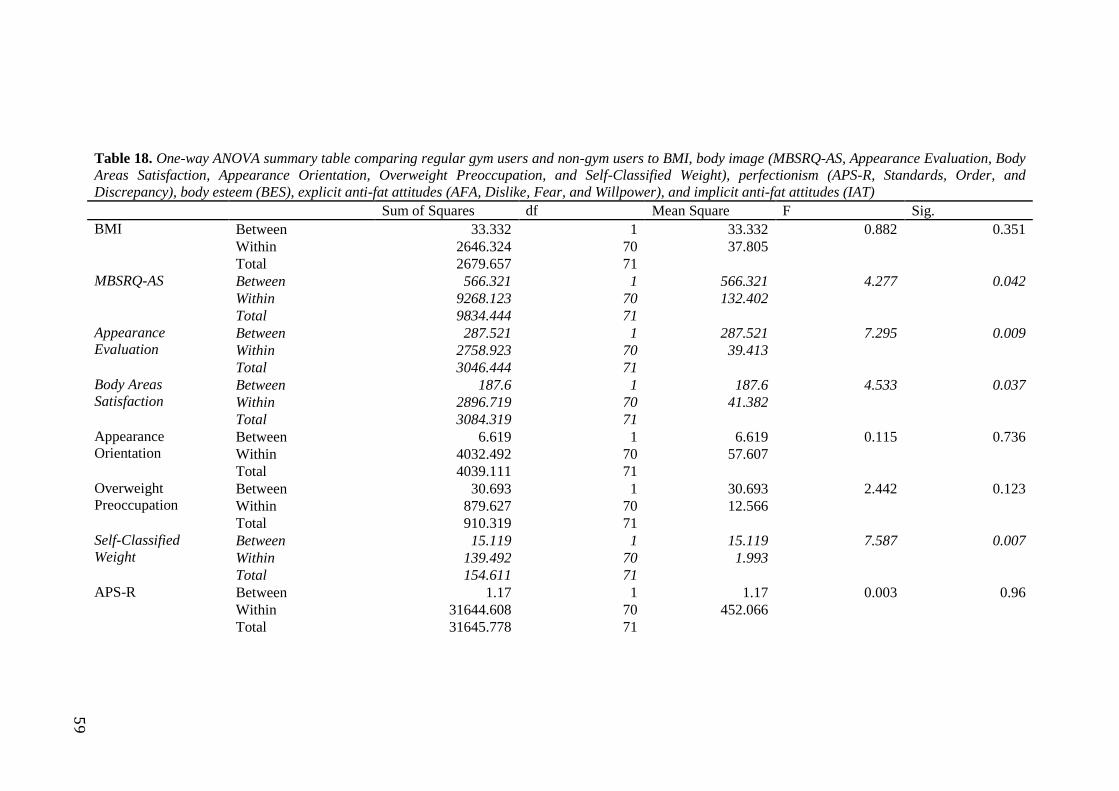
59
Table 18. One-way ANOVA summary table comparing regular gym users and non-gym users to BMI, body image (MBSRQ-AS, Appearance Evaluation, Body
Areas Satisfaction, Appearance Orientation, Overweight Preoccupation, and Self-Classified Weight), perfectionism (APS-R, Standards, Order, and
Discrepancy), body esteem (BES), explicit anti-fat attitudes (AFA, Dislike, Fear, and Willpower), and implicit anti-fat attitudes (IAT)
Sum of Squares df Mean Square F Sig.
BMI Between 33.332 1 33.332 0.882 0.351
Within 2646.324 70 37.805
Total 2679.657 71
MBSRQ-AS Between 566.321 1 566.321 4.277 0.042
Within 9268.123 70 132.402
Total 9834.444 71
Appearance
Evaluation Between 287.521 1 287.521 7.295 0.009
Within 2758.923 70 39.413
Total 3046.444 71
Body Areas
Satisfaction Between 187.6 1 187.6 4.533 0.037
Within 2896.719 70 41.382
Total 3084.319 71
Appearance
Orientation Between 6.619 1 6.619 0.115 0.736
Within 4032.492 70 57.607
Total 4039.111 71
Overweight
Preoccupation Between 30.693 1 30.693 2.442 0.123
Within 879.627 70 12.566
Total 910.319 71
Self-Classified
Weight Between 15.119 1 15.119 7.587 0.007
Within 139.492 70 1.993
Total 154.611 71
APS-R Between 1.17 1 1.17 0.003 0.96
Within 31644.608 70 452.066
Total 31645.778 71

60
Standards Between 141.58 1 141.58 2.681 0.106
Within 3697.031 70 52.815
Total 3838.611 71
Order Between 58.223 1 58.223 2.697 0.105
Within 1511.277 70 21.59
Total 1569.5 71
Discrepancy Between 424.808 1 424.808 1.386 0.243
Within 21455.192 70 306.503
Total 21880 71
BES Between 2300.205 1 2300.205 5.379 0.023
Within 29933.781 70 427.625
Total 32233.986 71
AFA Between 6.5 1 6.5 3.055 0.085
Within 148.954 70 2.128
Total 155.454 71
Dislike Between 27.935 1 27.935 13.497 0.000
Within 144.875 70 2.07
Total 172.809 71
Fear Between 8.153 1 8.153 1.546 0.218
Within 369.174 70 5.274
Total 377.327 71
Willpower Between 27.233 1 27.233 9.602 0.003
Within 198.531 70 2.836
Total 225.764 71
IAT Between 0.057 1 0.057 0.108 0.744
Within 36.914 70 0.527
Total 36.97 71
Note. Significant group differences are italicised. BMI = body mass index. MBSRQ-AS = Multidimensional Body-Self Relations Questionnaire – Appearance
Scales. APS-R = Almost Perfect Scale-Revised. BES = Body Esteem Scale. AFA = Anti-fat Attitudes Scale. IAT = Implicit Association Test. Significance p
<0.05.

61
T-Tests
As shown in Table 19, mean scores for Overweight Preoccupation were
significantly higher among regular gym users (M = 11.56, SD = 3.34) compared to non-
gym users (M = 9.58, SD = 3.61; t(70) = 2.43, p = 0.02). Regular gym users (M = 5.30,
SD = 1.38) displayed higher mean scores for the AFA scale, compared to non-gym
users (M = 4.47, SD = 1.49; t(70) = 2.47, p = 0.02) (see Appendix E). Mean scores for
Fear were also significantly higher among regular gym users (M = 6.09, SD = 2.08),
compared to non-gym users (M = 4.82, SD = 2.40; t(70) = 2.42, p = 0.02).
Mean IAT D score was higher among regular gym users (M = 0.17, SD = 0.66)
compared to non-gym users (M = -0.09, SD = 0.78; t(70) = 1.54, p = 0.13), however this
difference was statistically non-significant (see Appendix F).
Table 19. Independent Samples T-Test for regular gym users and non-gym users
Regular gym users Non-gym users t df
Sig.
(2-
tailed)
BMI 25.31 (4.53) 26.24 (7.67) -0.61 50 0.55
MBSRQ-AS 112.38 (11.10) 108.88 (12.41) 1.27 70 0.21
Appearance
Evaluation
22.64 (5.41) 21.85 (7.76) 0.49 56 0.62
Body Areas
Satisfaction
30.10 (5.92) 30.09 (7.40) 0.01 61 0.99
Appearance
Orientation
41.46 (7.25) 40.7 (7.97) 0.43 70 0.67
Overweight
Preoccupation
11.56 (3.34) 9.58 (3.61) 2.43 70 0.02
Self-Classified
Weight
6.62 (1.14) 6.67 (1.81) -0.14 52 0.89
APS-R 111.03 (19.39) 104.30 (22.75) 1.35 70 0.18
Standards 40.21 (6.68) 39.45 (8.17) 0.43 70 0.67
Order 20.95 (4.81) 20.52 (4.64) 0.39 70 0.70
Discrepancy 49.87 (15.12) 44.33 (19.88) 1.34 70 0.18
BES 119.13 (20.57) 113.91 (22.13) 1.04 70 0.30
AFA 5.30 (1.38) 4.47 (1.49) 2.47 70 0.02
Dislike 3.87 (1.64) 3.32 (1.42) 1.52 70 0.13
Fear 6.09 (2.08) 4.82 (2.40) 2.42 70 0.02
Willpower 5.93 (1.55) 5.26 (1.99) 1.60 70 0.11
IAT 0.17 (0.66) -0.09 (0.78) 1.54 70 0.13
Note. Significant group differences are italicised. BMI = body mass index. MBSRQ-AS =
Multidimensional Body-Self Relations Questionnaire – Appearance Scales. APS-R =
Almost Perfect Scale-Revised. BES = Body Esteem Scale. AFA = Anti-fat Attitudes
Scale. IAT = Implicit Association Test. Significance p <.05.

62
Table 20 shows males and females significantly differed on the MBSRQ-AS,
such that males (M = 115.3, SD = 10.21) displayed a higher mean score than females
(M = 109.04, SD = 11.95; t(70) = 2.07, p = 0.04). Significant differences were also
evident for Appearance Evaluation, Body Areas Satisfaction, and Self-Classified
Weight. A higher mean score for Appearance Evaluation was demonstrated among
males (M = 25.50, SD = 5.31) compared to females (M = 21.04, SD = 6.60; t(70) = 2.70,
p = 0.01). On average, males (M = 32.70, SD – 5.02) significantly scored higher on
Body Areas Satisfaction compared to females (M = 29.10, SD = 6.89; t(70) = 2.13, p =
0.04). For Self-Classified Weight, females (M = 6.92, SD = 1.47) displayed a
significantly higher mean score compared to males (M = 5.90, SD = 1.21; t(70) = -2.75, p
= 0.01). For the BES, a significant difference was found, such that males (M = 125.85,
SD = 18.93) displayed a higher mean score compared to females (M = 113.23, SD =
21.29; t(70) = 2.32, p = 0.02). Similar results were also found for the AFA scale, with
males displaying a higher mean score than females. Mean scores for the AFA scale
were significantly higher among males (M = 5.40, SD = 1.63) than females (M = 4.73,
SD = 1.39; t(70) = 1.75, p = 0.09) (see Appendix G). Males (M = 4.62, SD = 1.92) also
showed higher mean scores for Dislike, which significantly differed from females mean
scores (M = 3.23, SD = 1.21; t(25) = 3.01, p = 0.01). Mean scores for Willpower were
also significantly higher among males (M = 6.62, SD = 1.49) compared to females (M =
5.24, SD = 1.75; t(70) = 3.10, p = 0.00).
For the IAT, a higher mean D score was shown for females (M = 0.07, SD =
0.75) compared to males (M = 0.00, SD = 0.66; t(70) = -0.33, p = 0.74), however a
statistically significant difference between the groups was not evident (see Appendix
H).

63
Table 20. Independent Samples T-Test for males and females
Males Females t df
Sig.
(2-
tailed)
BMI 24.64 (4.87) 26.16 (6.56) -0.94 70 0.35
MBSRQ-AS 115.3 (10.21) 109.04 (11.95) 2.07 70 0.04
Appearance
Evaluation
25.50 (5.31) 21.04 (6.60) 2.70 70 0.01
Body Areas
Satisfaction
32.70 (5.02) 29.10 (6.89) 2.13 70 0.04
Appearance
Orientation
41.60 (6.94) 40.92 (7.82) 0.34 70 0.74
Overweight
Preoccupation
9.60 (3.69) 11.06 (3.49) -1.56 70 0.12
Self-Classified
Weight
5.90 (1.21) 6.92 (1.48) -2.75 70 0.01
APS-R 108.15 (24.63) 107.87 (19.86) 0.05 70 0.96
Standards 37.60 (9.31) 40.73 (6.34) -1.64 70 0.11
Order 19.30 (5.47) 21.31 (4.30) -1.64 70 0.11
Discrepancy 51.25 (16.81) 45.83 (17.76) 1.18 70 0.24
BES 125.85 (18.93) 113.23 (21.29) 2.32 70 0.02
AFA 5.40 (1.63) 4.73 (1.39) 1.75 70 0.09
Dislike 4.62 (1.92) 3.23 (1.21) 3.01 25 0.01
Fear 4.97 (2.39) 5.72 (2.26) -1.24 70 0.22
Willpower 6.62 (1.49) 5.24 (1.75) 3.10 70 0.00
IAT 0.00 (0.66) 0.07 (0.75) -0.33 70 0.74
Note. Significant group differences are italicised. BMI = body mass index. MBSRQ-AS =
Multidimensional Body-Self Relations Questionnaire – Appearance Scales. APS-R =
Almost Perfect Scale-Revised. BES = Body Esteem Scale. AFA = Anti-fat Attitudes
Scale. IAT = Implicit Association Test. Significance p <.05.
Moderation Analyses
Moderation analyses showed body esteem (BES) did not significantly moderate
the relationship between body image (MBSRQ-AS scale/subscales) and implicit (IAT)
or explicit (AFA) anti-fat attitudes.
Perfectionism (APS-R) was not found to significantly moderate the relationship
between body image (MBSRQ-AS scale/subscales) and implicit (IAT) or explicit (AFA
scale) anti-fat attitudes.
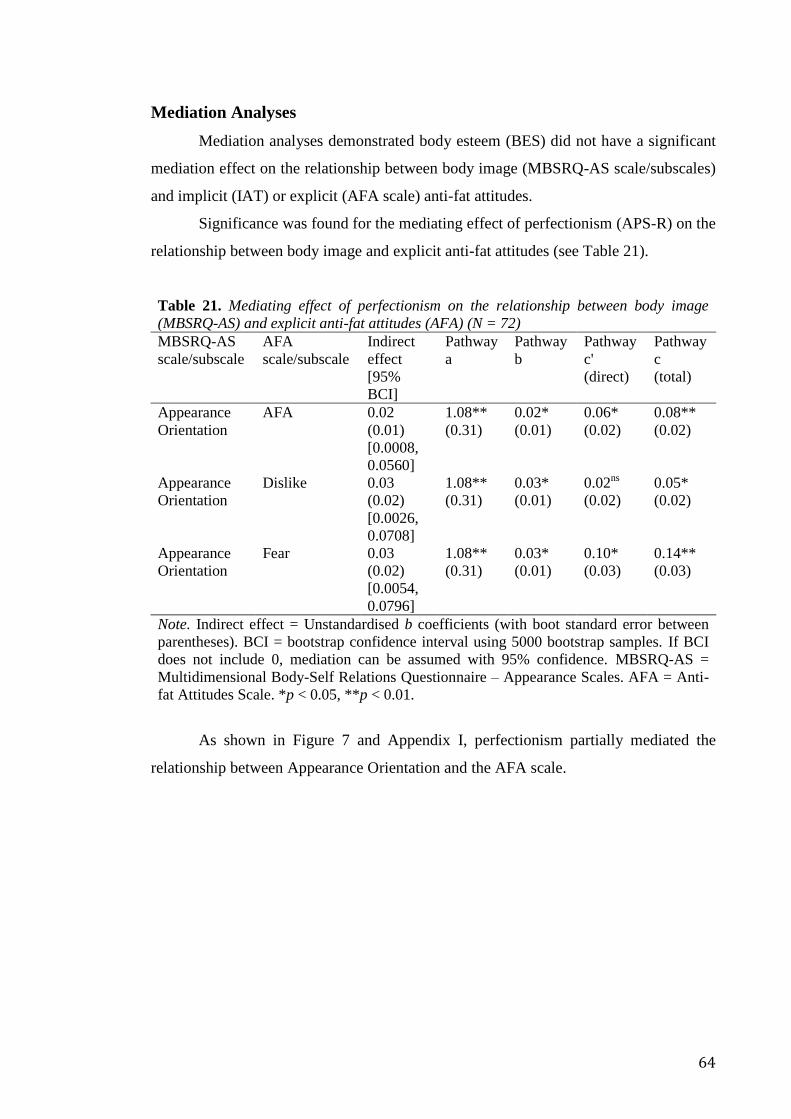
64
Mediation Analyses
Mediation analyses demonstrated body esteem (BES) did not have a significant
mediation effect on the relationship between body image (MBSRQ-AS scale/subscales)
and implicit (IAT) or explicit (AFA scale) anti-fat attitudes.
Significance was found for the mediating effect of perfectionism (APS-R) on the
relationship between body image and explicit anti-fat attitudes (see Table 21).
Table 21. Mediating effect of perfectionism on the relationship between body image
(MBSRQ-AS) and explicit anti-fat attitudes (AFA) (N = 72)
MBSRQ-AS
scale/subscale
AFA
scale/subscale
Indirect
effect
[95%
BCI]
Pathway
a
Pathway
b
Pathway
c'
(direct)
Pathway
c
(total)
Appearance
Orientation
AFA 0.02
(0.01)
[0.0008,
0.0560]
1.08**
(0.31)
0.02*
(0.01)
0.06*
(0.02)
0.08**
(0.02)
Appearance
Orientation
Dislike 0.03
(0.02)
[0.0026,
0.0708]
1.08**
(0.31)
0.03*
(0.01)
0.02ns
(0.02)
0.05*
(0.02)
Appearance
Orientation
Fear 0.03
(0.02)
[0.0054,
0.0796]
1.08**
(0.31)
0.03*
(0.01)
0.10*
(0.03)
0.14**
(0.03)
Note. Indirect effect = Unstandardised b coefficients (with boot standard error between
parentheses). BCI = bootstrap confidence interval using 5000 bootstrap samples. If BCI
does not include 0, mediation can be assumed with 95% confidence. MBSRQ-AS =
Multidimensional Body-Self Relations Questionnaire – Appearance Scales. AFA = Anti-
fat Attitudes Scale. *p < 0.05, **p < 0.01.
As shown in Figure 7 and Appendix I, perfectionism partially mediated the
relationship between Appearance Orientation and the AFA scale.

65
Figure 7. Mediating effect of perfectionism on the relationship between Appearance
Orientation and explicit anti-fat attitudes. *p < 0.05, **p < 0.01.
The second mediation analysis found perfectionism fully mediated the
relationship between Appearance Orientation and Dislike (see Figure 8 and Appendix
J).
Figure 8. Mediating effect of perfectionism on the relationship between Appearance
Orientation and Dislike. *p < 0.05, **p < 0.01.
As shown in Figure 9 and Appendix K, partial mediation was found for
perfectionism on the relationship between Appearance Orientation and Fear.

66
Figure 9. Mediating effect of perfectionism on the relationship between Appearance
Orientation and Fear. *p < 0.05, **p < 0.01.
Table 22 demonstrates the mediation effect of maladaptive perfectionism
(Discrepancy) on the relationship between body image and explicit anti-fat attitudes.
Table 22. Mediating effect of maladaptive perfectionism on the relationship between
body image (MBSRQ-AS) and explicit anti-fat attitudes (AFA) (N = 72)
MBSRQ-AS
scale/subscale
AFA
scale/subscale
Indirect
effect
[95%
BCI]
Pathway
a
Pathway
b
Pathway
c'
(direct)
Pathway
c
(total)
Appearance
Orientation
AFA 0.03
(0.01)
[0.0122,
0.0621]
0.86*
(0.26)
0.04**
(0.01)
0.05*
(0.02)
0.08**
(0.02)
Appearance
Orientation
Dislike 0.03
(0.01)
[0.0138,
0.0735]
0.86*
(0.26)
0.04**
(0.01)
0.01ns
(0.2)
0.05*
(0.02)
Appearance
Orientation
Fear 0.04
(0.02)
[0.0132,
0.0864]
0.86*
(0.26)
0.05**
(0.01)
0.09*
(0.03)
0.14**
(0.03)
Overweight
Preoccupation
AFA 0.04
(0.02)
[0.0098,
0.1000]
1.25*
(0.57)
0.03**
(0.01)
0.18**
(0.04)
0.22**
(0.04)
Overweight
Preoccupation
Fear 0.05
(0.03)
[0.0072,
0.1254]
1.25*
(0.57)
0.04**
(0.01)
0.43**
(0.05)
0.49**
(0.05)
Note. Indirect effect = Unstandardised b coefficients (with boot standard error between
parentheses). BCI = bootstrap confidence interval using 5000 bootstrap samples. If BCI
does not include 0, mediation can be assumed with 95% confidence. MBSRQ-AS =
Multidimensional Body-Self Relations Questionnaire – Appearance Scales. AFA = Anti-
fat Attitudes Scale. *p < 0.05, **p < 0.01.

67
As shown in Figure 10 and Appendix L, maladaptive perfectionism partially
mediated the relationship between Appearance Orientation and the AFA scale.
Figure 10. Mediating effect of maladaptive perfectionism on the relationship between
Appearance Orientation and explicit anti-fat attitudes. *p < 0.05, **p < 0.01.
The fifth mediation analysis found full mediation for the effect of maladaptive
perfectionism (Discrepancy) on the relationship between Appearance Orientation and
Dislike (see Figure 11 and Appendix M).
Figure 11. Mediating effect of maladaptive perfectionism on the relationship between
Appearance Orientation and Dislike. *p < 0.05, **p < 0.01.
As shown in Figure 12 and Appendix N, partial mediation was found for
maladaptive perfectionism (Discrepancy) on the relationship between Appearance
Orientation and Fear.

68
Figure 12. Mediating effect of maladaptive perfectionism on the relationship between
Appearance Orientation and Fear. *p < 0.05, **p < 0.01.
The seventh mediation analysis found maladaptive perfectionism (Discrepancy)
partially mediated the relationship between Overweight Preoccupation and the AFA
scale (see Figure 13 and Appendix O).
Figure 13. Mediating effect of maladaptive perfectionism on the relationship between
Overweight Preoccupation and explicit anti-fat attitudes. *p < 0.05, **p < 0.01.
Lastly, partial mediation was evident for the effect of maladaptive perfectionism
(Discrepancy) on the relationship between Overweight Preoccupation and Fear (see
Figure 14 and Appendix P).
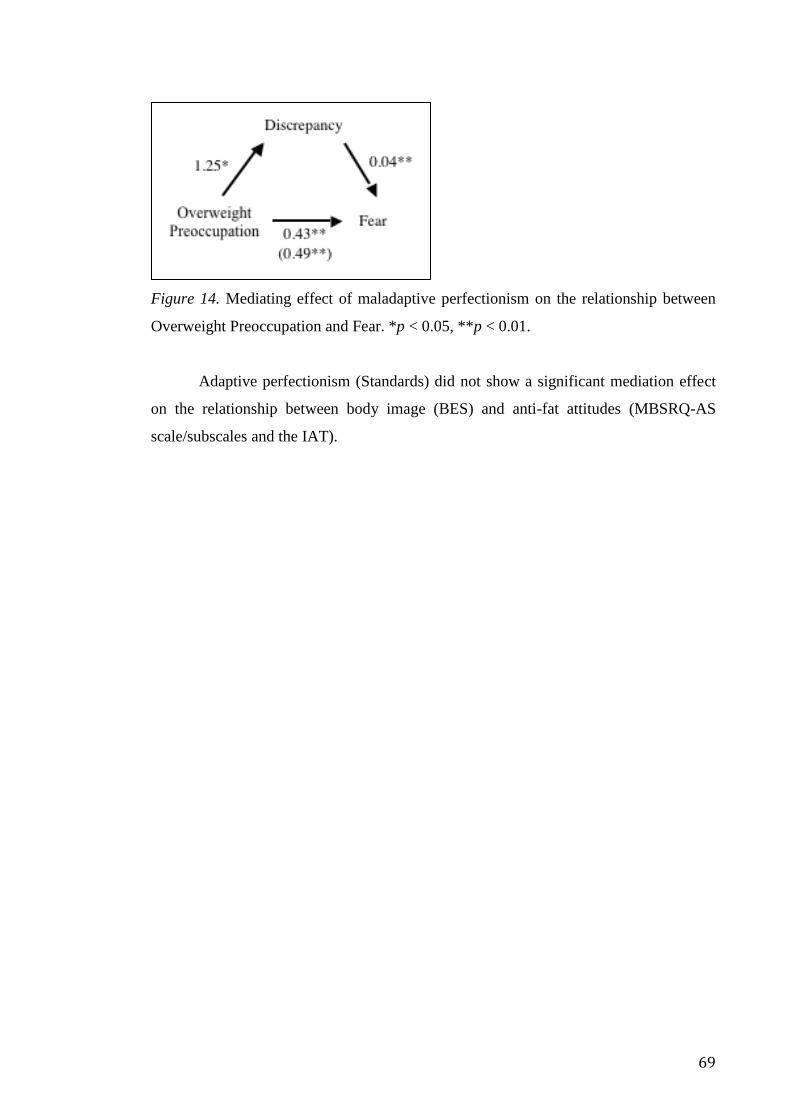
69
Figure 14. Mediating effect of maladaptive perfectionism on the relationship between
Overweight Preoccupation and Fear. *p < 0.05, **p < 0.01.
Adaptive perfectionism (Standards) did not show a significant mediation effect
on the relationship between body image (BES) and anti-fat attitudes (MBSRQ-AS
scale/subscales and the IAT).
70
Discussion
Summary of Findings
Higher BMI was associated with low body image, thus supporting hypothesis 1.
Specifically, significant correlations were found between BMI and Self-Classified
Weight within all four groups, such that higher BMI individuals displayed greater
weight dissatisfaction. However, BMI correlated with Appearance Evaluation and Body
Areas Satisfaction only among non-gym users and females, such that higher BMI
individuals reported greater appearance and body dissatisfaction. Interestingly, within
all four groups, BMI did not significantly correlate with Appearance Orientation and
Overweight Preoccupation.
Hypothesis 2a was supported, as low body image was greater among regular
gym users, compared to non-gym users. In particular, regular gym users displayed
significantly greater preoccupation with one’s weight and related behaviours, compared
to non-gym users. However, regular gym users and non-gym users did not significantly
differ in Appearance Evaluation, Body Areas Satisfaction, Appearance Orientation, and
Self-Classified Weight. In support of hypothesis 2b, low body image was greater among
females, compared to males. Specifically, females displayed significantly lower
MBSRQ-AS, Appearance Evaluation, and Body Areas Satisfaction scores and a higher
Self-Classified Weight score, therefore displaying less appearance, body, and weight
satisfaction, compared to men.
Hypothesis 3a was partially supported, as explicit anti-fat attitudes were
significantly greater among regular gym users, compared to non-gym users.
Specifically, regular gym users displayed significantly higher scores on the AFA scale
and the Fear subscale, therefore displaying greater overall explicit anti-fat attitudes and
greater fear of fat, compared to non-gym users. However, implicit anti-fat attitudes did
not significantly differ between the two groups. Hypothesis 3b was not supported, as
females did not display significantly greater explicit anti-fat attitudes, than males.
Conversely, AFA, Dislike, and Willpower scores were significantly higher among
71
males, compared to females. For implicit anti-fat attitudes, no significant gender
difference was found.
Low body image was associated with greater explicit anti-fat attitudes, thus
supporting hypothesis 4. Within both regular gym users and non-gym users, individuals
with greater weight preoccupation displayed greater explicit anti-fat attitudes.
Furthermore, individuals with greater appearance and body dissatisfaction and greater
preoccupation with one’s weight displayed greater personal concerns about weight gain.
A significant relationship was also found between low body image and implicit anti-fat
attitudes, but only among non-gym users. Specifically, high body dissatisfaction and
greater preoccupation with one’s weight was associated with greater implicit anti-fat
attitudes. Within both gender groups, individuals who displayed higher appearance and
body dissatisfaction, greater investment in one’s appearance, and greater preoccupation
with one’s weight reported greater personal concerns about weight gain. Furthermore,
men and women high in weight preoccupation displayed a stronger belief that obesity
results due to lack of willpower. However, the relationship between poor body image
and willpower was more apparent among males, as high body and weight dissatisfaction
and greater investment in physical appearance was significantly associated with
willpower among men, but not females. A significant relationship was also found
between low body image and implicit anti-fat attitudes, but only among females. In
particular, women high in body dissatisfaction and weight preoccupation demonstrated
greater implicit anti-fat attitudes.
Hypothesis 5 was partially supported, as implicit and explicit anti-fat attitudes
were weakly associated among regular gym users, non-gym users, and males. However,
significant correlations were found between the IAT and the AFA scale/subscales
among females. Specifically, women who displayed greater implicit anti-fat attitudes
reported greater explicit anti-fat attitudes, in particular greater personal concerns about
weight gain.
Body esteem did not significantly moderate the relationship between body
image and implicit/explicit anti-fat attitudes, thus hypothesis 6 was not supported.
Furthermore, hypothesis 7 was not supported, as no mediation effect was found
72
regarding the mediating role of body esteem in the relationship between body image
and implicit/explicit anti-fat attitudes.
Hypothesis 8 was not supported, as perfectionism did not moderate the
relationship between body image and implicit/explicit anti-fat attitudes. However,
perfectionism was found to mediate the relationship between body image and explicit
anti-fat attitudes but not implicit anti-fat attitudes, thus partially supporting hypothesis
9. In particular, maladaptive perfectionism was found to mediate the relationship
between Appearance Orientation and overall explicit anti-fat attitudes, Appearance
Orientation and Dislike, Appearance Orientation and Fear, Overweight Preoccupation
and overall explicit anti-fat attitudes, and Overweight Preoccupation and Fear.
Relation to Previous Research
In support of previous research (Pingitore, et al., 1997), a link between high
BMI and weight dissatisfaction was evident among both males and females. Similarly,
no differences appeared to exist between regular gym users and non-gym users, as high
BMI individuals within both groups displayed greater weight dissatisfaction. This
suggests that higher BMI individuals tend to experience greater weight dissatisfaction
regardless of whether or not they engage in regular gym exercise. Also consistent with
previous research, higher BMI individuals reported greater appearance and body
dissatisfaction among non-gym users (Davis, 1990) and females (Austin et al., 2009;
Smith et al., 1999; Yates et al., 2004). However, this relationship was not found among
males and regular gym users. It is possible that high BMI within males and regular gym
users reflects greater muscle mass, rather than body fat, therefore these individuals are
more likely to be satisfied with their appearance. Inconsistent with previous research
(Davis, 1990), BMI did not significantly predict Appearance Orientation or Overweight
Preoccupation. It is possible that participants may have provided inaccurate responses in
order to avoid appearing self-obsessed with their appearance or weight.
Results were consistent with current research examining body image within
fitness environments (Kennedy, Reis, Bane, & Stang, 1995), as regular gym users
displayed greater preoccupation with one’s weight and related behaviours, compared to
non-gym users. It is unsurprising that regular gym users are more vigilant about their

73
weight, as common motivations for exercise tend to be related to appearance and weight
(Kilpatrick, Hebert, & Bartholomew, 2005). Contrary to current research (Imm & Pruitt,
1991; Stapleton et al., 2016), regular gym users and non-gym users did not significantly
differ in appearance satisfaction, body satisfaction, investment in physical appearance,
and weight satisfaction. As the non-gym users criteria for this study only required
participants to not be attending a gym, rather than not engaging in any regular exercise,
it is possible that individuals who identified as non-gym users may have been engaging
in exercise outside of a gym. Consequently, significance may not have been found due
to the possibility of the two groups being similar in terms of engagement in regular
exercise. Consistent with current research (Paxton et al., 1991), females displayed
significantly lower appearance, body, and weight satisfaction, than males. However, no
significant gender differences were evident for investment in physical appearance and
weight preoccupation. This could be due to social desirability bias, such that females
underreported their investment in physical appearance and preoccupation with weight
due to the possibility of appearing self-obsessed.
In support of previous research examining anti-fat attitudes within fitness
samples (Robertson & Vohora, 2008; Shapiro et al., 2007), regular gym users displayed
significantly greater overall explicit anti-fat attitudes and fear of fat, compared to non-
gym users. It could be that the gym environment contributes towards the development
of fear of weight gain, due to the heavy emphasis on weight loss and obtainment of the
ideal body within fitness centres (Prichard & Tiggemann, 2008). Alternatively, gym
users may view fear of weight gain as being a significant motivator for engaging in
regular gym exercise, thus may feel more comfortable explicitly acknowledging such
fears. Conversely, non-gym users may be more likely to conceal fear of weight gain,
perhaps due to feelings of guilt about having such a fear but not doing anything about it,
such as joining a gym. This explanation seems plausible, as implicit anti-fat attitudes
did not significantly differ between the two groups. As the current literature suggests,
poor body image is associated with greater anti-fat attitudes (Himmelstein &
Tomiyama, 2015; O’Brien, Hunter, Halberstadt et al., 2007). Consequently, it seems
plausible to predict that females would display greater anti-fat attitudes due to women
displaying greater body image dissatisfaction, compared to males. However, the present
study did not reflect this. Conversely, males displayed greater explicit anti-fat attitudes,

74
compared to females. These findings were similar to those of O’Brien, Hunter,
Halberstadt, and colleagues (2007) who explain that females tend to be more empathic
towards overweight individuals, perhaps due to experiencing anti-fat bias to a greater
extent than males. Consequently, it could be that women in the present study may have
under-reported their explicit anti-fat attitudes, as no gender differences were evident for
implicit anti-fat attitudes.
Consistent with previous research, poor body image was associated with
greater explicit anti-fat attitudes (Himmelstein & Tomiyama, 2015; O’Brien,
Hunter, Halberstadt et al., 2007). Specifically, individuals high in weight
preoccupation and appearance and body dissatisfaction displayed greater fear of
weight gain, regardless of gender or whether they regularly exercised at a gym or
not. However, regular gym users highly invested in their physical appearance
reported greater fear of weight gain, whereas non-gym users displaying greater
investment in physical appearance reported greater dislike of overweight
individuals. One possible explanation for these findings is that individuals who are
highly invested in their appearance may engage in regular exercise due to being
fearful of potential weight gain. Males high in weight preoccupation, body and
weight dissatisfaction, and investment in physical appearance displayed a stronger
belief that weight is controllable (willpower), whereas only females high in weight
preoccupation displayed this association with willpower. These results may reflect
the idea that men who display greater efforts in maintaining an ideal physical
appearance and weight may expect others to do the same, thus failure to do so
results in anti-fat attitudes (O’Brien, Hunter, Halberstadt et al., 2007).
Interestingly, implicit anti-fat attitudes were significantly associated with high
body dissatisfaction and greater weight preoccupation, but only among non-gym
users and females. It is possible that non-gym users and women who are highly
dissatisfied with their body and highly preoccupied with their weight may hold
greater implicit anti-fat attitudes, particularly when no solution to resolve such
dissatisfaction is attempted, such as joining a gym or engaging in regular exercise.
Overall, these results displaying a link between poor body image and greater anti-
fat attitudes support Ehrlich’s (1973) principle of self-congruity, such that
discriminatory attitudes towards overweight individuals are a reflection of the
75
negative thoughts and feelings an individual holds regarding his or her own body
image.
In support of previous research (Bessenoff & Sherman, 2000; Hofmann et al.,
2005; Robertson & Vohora, 2008; Teachman & Brownell, 2001), implicit and explicit
anti-fat attitudes were weakly associated among regular gym users, non-gym users, and
males. In contrast, implicit anti-fat attitudes significantly correlated with the AFA scale
and the Fear subscale among females. Brochu and Morrison (2007) explain that
significant correlations between implicit and explicit anti-fat bias measures reflect the
perception that weight bias is socially acceptable. It could be that females in the present
study did not view weight discrimination as being a particularly sensitive topic, thus
were less motivated to conceal anti-fat attitudes when completing explicit measures.
In the present study, body esteem did not significantly mediate or moderate the
relationship between body image and implicit/explicit anti-fat attitudes. This suggests
that self-evaluations and feelings regarding one’s physical appearance and body did not
strengthen or explain the relationship between body image and anti-fat attitudes among
regular gym users and non-gym users. As this study examined only a specific domain of
self-esteem (body esteem), it is possible that global self-esteem (general feelings about
oneself) may moderate or mediate the relationship between body image and anti-fat
attitudes.
Perfectionism was not found to significantly moderate the relationship between
body image and implicit/explicit anti-fat attitudes, however a mediation effect was
evident. Specifically, discrepancy (maladaptive perfectionism) mediated the relationship
between Appearance Orientation and overall explicit anti-fat attitudes, Appearance
Orientation and Dislike, and Appearance Orientation and Fear. Furthermore,
discrepancy mediated the relationship between Overweight Preoccupation and overall
explicit anti-fat attitudes, and Overweight Preoccupation and Fear. One possible
explanation for these findings is that individuals who are highly invested in their
physical appearance (Appearance Orientation) or are highly preoccupied with their
weight (Overweight Preoccupation) tend to exhibit explicit anti-fat attitudes due to
setting high personal standards regarding one’s physical appearance and body

76
shape/weight. If an individual feels as if they are not attaining such standards, a high
level of discrepancy between performance and standards may arise. These individuals
may also project their high self-standards onto others, such as unrealistically expecting
others to also be heavily invested in and preoccupied with their appearance and weight.
Consequently, those who do not attain these imposed standards are discriminated
against, thus displaying anti-fat attitudes (O’Brien, Hunter, Halberstadt et al., 2007).
Interestingly, maladaptive perfectionism appears to only play a mediating role in the
relationship between body image and explicit anti-fat attitudes, but not implicit anti-fat
attitudes. It is possible that maladaptive perfectionism (discrepancy) only explains the
relationship between body image and explicit anti-fat attitudes due to an individuals’
distress, resulting from discrepancy between performance and standards, being a
conscious rather than unconscious experience.
Limitations and Future Directions
As with all correlational research, causation is unable to be inferred due to the
possibility of an unknown third variable influencing the apparent correlation between
two variables (Salazar, Crosby, & DiClemente, 2006). Furthermore, as this study was
cross-sectional, directionality cannot be established (Salazar et al., 2006). For example,
although poor body image significantly correlated with greater anti-fat attitudes, the
direction of which variable causes which cannot be determined. In order to overcome
such limitations, future research should consider the use of longitudinal studies due to
the ability of measuring directional changes in variables over time. Another limitation is
that non-gym users were not asked about whether they regularly exercise despite not
attending a gym. Consequently, it cannot be assumed that differences between regular
gym-users and non-gym users may be due to an individual’s level of engagement in
regular exercise. Future research could benefit from comparing gym users, non-gym
exercisers, and non-exercisers in order establish whether differences arise due to the
gym environment and/or engagement in regular exercise. Lastly, although body esteem
(specific domain of self-esteem) did not moderate or mediate the relationship between
body image and anti-fat attitudes, it would be interesting for future studies to examine
whether global self-esteem plays a significant moderating/mediating role in this
relationship.

77
Implications of the Present Study
The present study contributes to the current literature examining the relationship
between BMI, body image, and anti-fat attitudes within a fitness population. In
particular, it was shown that individuals with a higher BMI reported greater weight
dissatisfaction, regardless of whether they engaged in regular gym exercise. However,
significant group differences were evident such that both non-gym users and females
with a high BMI displayed greater dissatisfaction with their body and appearance,
whereas no significant association was found within regular gym users and males,
possibly due to high BMI within these groups reflecting greater muscle mass rather than
body fat. These findings may have implications for gym facilities, as it is important for
fitness professionals to be aware of body image issues that may accompany non-gym
users who are of a higher BMI that may be thinking about joining a gym. Furthermore,
being aware of such issues allows for fitness centres to organise specific health or
fitness classes that can help improve body image issues, such as female-only classes
that aim to improve appearance and body satisfaction.
The current study showed that regular gym users reported significantly greater
weight preoccupation, compared to non-gym users. This may be problematic as extreme
weight preoccupation is associated with excessive exercise (Davis, Brewer, & Ratusny,
1993), and has shown to be a significant risk factor in the development of eating
disorders (Phan & Tylka, 2006). It was also found that regular gym users displayed
significantly greater overall explicit anti-fat attitudes and fear of weight gain compared
to non-gym users. This could have negative implications for overweight individuals
who are thinking about joining a gym or for those who have just begun regular gym
exercise. Not only are overweight individuals dealing with possible weight
dissatisfaction, they are also vulnerable to receiving discrimination based on their
weight from other gym users, thus further impacting their low body image. It could be
beneficial for fitness centres to emphasise the health and psychological benefits of
regular exercise, rather than focussing on weight loss and attaining a specific body
ideal, which may be contributing towards weight preoccupation and fear of weight gain
among regular gym users.

78
It is clear that poor body image is associated with greater explicit anti-fat
attitudes. For example, both regular gym users and non-gym users who reported greater
weight preoccupation and higher appearance and body dissatisfaction displayed greater
fear of weight gain. Also, both men and women who displayed high appearance and
body dissatisfaction, greater investment in one’s appearance, and high preoccupation
with one’s weight reported greater concerns about weight gain. As Ehrlich (1973)
suggests, weight discrimination towards overweight individuals may be a reflection of
how the anti-fat individual negatively feels about their own body image. This may have
important implications, particularly within fitness settings, such that efforts can be made
towards enhancing an individual’s body image, which may in turn, minimise their anti-
fat attitudes, thus benefiting both the individual and those who are discriminated
against. For example, gyms could consider organising classes that aim to improve one’s
body image by challenging stereotypes of the ideal body, promoting healthy behaviours
and attitudes, and encouraging exercise that is not appearance-oriented (Vogel, 2002).
This study appears to be the first to examine the mediating role of perfectionism
in the relationship between body image and anti-fat attitudes. In particular, discrepancy
(maladaptive perfectionism) significantly mediated the relationship between
Appearance Orientation and overall explicit anti-fat attitudes, Appearance Orientation
and Dislike, Appearance Orientation and Fear, Overweight Preoccupation and overall
explicit anti-fat attitudes, and Overweight Preoccupation and Fear. This has significant
implications for clinicians, as it is important to acknowledge that an individuals’ level
of maladaptive perfectionism may be contributing towards body image issues they are
presenting with. Similarly, fitness classes that aim to enhance body image and minimise
anti-fat attitudes, should recognise the potential role of maladaptive perfectionism by
challenging unrealistically high personal standards that individuals may hold regarding
their body image.
Conclusion
The present study has contributed to the current literature of body image and
anti-fat bias by examining the relationships between BMI, body image, body esteem,
perfectionism, and anti-fat attitudes within regular gym users and non-gym users. High
BMI was significantly associated with greater body, weight, and appearance
79
dissatisfaction among females and non-gym users, whereas males and regular gym users
with high BMI only displayed greater weight dissatisfaction.
Regular gym users reported significantly higher weight preoccupation, greater
overall explicit anti-fat attitudes, and greater fear of weight gain, compared to non-gym
users. However, regular gym users did not display greater implicit anti-fat attitudes.
Similarly, no gender differences were found for implicit anti-fat attitudes. However,
males reported significantly higher overall explicit anti-fat attitudes, greater dislike of
overweight individuals, and a stronger belief that weight is controllable (willpower),
compared to females. Low body image (lower appearance, body, and weight
satisfaction) was significantly greater among females compared to males.
This study also found that low body image was significantly associated with
greater explicit anti-fat attitudes. In particular, regular gym users highly invested in
their physical appearance reported greater fear of weight gain, whereas non-gym
users highly invested in their physical appearance reported greater dislike of
overweight individuals. Furthermore, males who displayed high weight
preoccupation, high body and weight dissatisfaction, and high physical appearance
investment reported a stronger belief that weight is controllable (willpower),
whereas only females high in weight preoccupation displayed this association with
willpower. Only non-gym users and females high in body dissatisfaction and
weight preoccupation displayed an association with implicit anti-fat attitudes.
Implicit and explicit anti-fat attitudes were weakly associated, except among
females where implicit anti-fat attitudes significantly correlated with overall
explicit anti-fat attitudes and fear of weight gain.
Body esteem was not found to play a moderating or mediating role in the
relationship between body image and anti-fat attitudes. This study highlights the
potential mediating role of perfectionism, in particular discrepancy, on the relationship
between body image and explicit anti-fat attitudes. This suggests that an individuals’
level of maladaptive perfectionism may be important to consider when helping to
enhance one’s body image and minimise anti-fat attitudes, particularly among regular
gym users.

80
References
Appleton, P. R., Hall, H. K., & Hill, A. P. (2009). Relations between multidimensional
perfectionism and burnout in junior-elite male athletes. Psychology of Sport and
Exercise, 10(4), 457-465.
Aruguete, M. S., Yates, A., Edman, J. L., & Sanders, G. (2007). Eating and
acculturation in a Filipino American population on a small Hawaiian island.
North American Journal of Psychology, 9(2), 347-358.
Austin, S. B., Haines, J., & Veugelers, P. J. (2009). Body satisfaction and body weight:
Gender differences and sociodemographic determinants. BMC Public
Health, 9(1), 1-7.
Ashby, J. S., & Rice, K. G. (2002). Perfectionism, dysfunctional attitudes, and
self‐esteem: A structural equations analysis. Journal of Counseling and
Development, 80(2), 197-203.
Bardone, A. M., Vohs, K. D., Abramson, L. Y., Heatherton, T. F., & Joiner, T. E.
(2000). The confluence of perfectionism, body dissatisfaction, and low self-
esteem predicts bulimic symptoms: Clinical implications. Behavior Therapy,
31(2), 265-280.
Bessenoff, G. R., & Sherman, J. W. (2000). Automatic and controlled components of
prejudice toward fat people: Evaluation versus stereotype activation. Social
Cognition, 18(4), 329-353.
Bohne, A., Keuthen, N. J., Wilhelm, S., Deckersbach, T., & Jenike, M. A. (2002).
Prevalence of symptoms of body dysmorphic disorder and its correlates: A
cross-cultural comparison. Psychosomatics, 43(6), 486-490.
81
Brochu, P. M., & Morrison, M. A. (2007). Implicit and explicit prejudice toward
overweight and average-weight men and women: Testing their correspondence
and relation to behavioral intentions. The Journal of Social Psychology, 147(6),
681-706.
Cash, T. F. (2000). MBSRQ users' manual. (3rd ed.) Norfolk, VA: Old Dominion
University Press.
Chambliss, H. O., Finley, C. E., & Blair, S. N. (2004). Attitudes toward obese
individuals among exercise science students. Medicine and Science in Sports
and Exercise, 36(3), 468-474.
Chang, E. C., Banks, K. H, & Watkins, A. F. (2004). How adaptive and maladaptive
perfectionism relate to positive and negative psychological functioning: Testing
a stress-mediation model in black and white female college students. Journal of
Counseling Psychology, 51(1), 93-102.
Crandall, C. S. (1994). Prejudice against fat people: Ideology and self-interest. The
Journal of Personality and Social Psychology, 66(5), 882-894.
Crandall, C. S., D’Anello, S., Sakalli, N., Lazarus, E., Nejtardt, G. W., & Feather, N. T.
(2001). An attribution-value model of prejudice: Anti-fat attitudes in six nations.
Personality and Social Psychology Bulletin, 27(1), 30-37.
Davis, C. (1990). Body image and weight preoccupation: A comparison between
exercising and non-exercising women. Appetite, 15(1), 13-21.
Davis, C., Brewer, H., & Ratusny, D. (1993). Behavioral frequency and psychological
commitment: Necessary concepts in the study of excessive exercising. Journal
of Behavioral Medicine, 16(6), 611-628.
82
Davis, C., & Katzman, M. (1997). Charting new territory: Body esteem, weight
satisfaction, depression, and self-esteem among Chinese males and females in
Hong Kong. Sex Roles, 36(7-8), 449-459.
De Houwer, J. (2002). The Implicit Association Test as a tool for studying
dysfunctional associations in psychopathology: Strengths and limitations.
Journal of Behavior Therapy and Experimental Psychiatry, 33(2), 115-133.
Ding, V. J., & Stillman, J. A. (2005). An empirical investigation of discrimination
against overweight female job applicants. New Zealand Journal of Psychology,
34(3), 139-148.
Duckitt, J. H. (1992). The social psychology of prejudice. New York, NY: Praeger.
Egan, S. J., Wade, T. D., Shafran, R., & Antony, M. M. (2014). Cognitive-behavioral
treatment of perfectionism. New York, NY: The Guilford Press.
Ehrlich, H. J. (1973). The social psychology of prejudice: A systematic theoretical
review and propositional inventory of the American social psychological study
of prejudice. New York, NY: Wiley
Festinger, L. (1954). A theory of social comparison processes. Human Relations, 7(2),
117-140.
Flett, G. L., & Hewitt, P. L. (2005). The perils of perfectionism in sports and
exercise. Current Directions in Psychological Science, 14(1), 14-18.
Franzoi, S. L., & Shields, S. A. (1984). The Body Esteem Scale: Multidimensional
structure and sex differences in a college population. Journal of Personality
Assessment, 48(2), 173-178.
83
Fredrickson, B. L., & Roberts, T. A. (1997). Objectification theory: Toward
understanding women’s lived experiences and mental health risks. Psychology
of Women Quarterly, 21(2), 173-206.
Frost, R. O., Marten, P., Lahart, C., & Rosenblate, R. (1990). The dimensions of
perfectionism. Cognitive Therapy and Research, 14(5), 449-468.
George, D., & Mallery, P. (2003). SPSS for Windows step by step: A simple guide and
reference 18.0 update (11th ed.). Boston, MA: Allyn and Bacon.
Grammas, D. L., & Schwartz, J. P. (2009). Internalization of messages from society and
perfectionism as predictors of male body image. Body Image, 6(1), 31-36.
Greenwald, A. G., McGhee, D. E., & Schwartz, J. L. (1998). Measuring individual
differences in implicit cognition: The Implicit Association Test. Journal of
Personality and Social Psychology, 74(6), 1464-1480.
Greenwald, A. G., Nosek, B. A., & Banaji, M. R. (2003). Understanding and using the
Implicit Association Test: I. An improved scoring algorithm. Journal of
Personality and Social Psychology, 85(2), 197-216.
Greenwald, A. G., Poehlman, T. A., Uhlmann, E. L., & Banaji, M. R. (2009).
Understanding and using the Implicit Association Test: III. Meta-analysis of
predictive validity. Journal of Personality and Social Psychology, 97(1), 17-41.
Grogan, S. (2007). Body image: Understanding body dissatisfaction in men, women and
children (2nd ed.). London, UK: Routledge.
Hayes, A. F. (2013). Introduction to mediation, moderation, and conditional process
analysis: A regression-based approach. New York, NY: Guilford Press.
84
Hewitt, P. L., & Flett, G. L. (1991). Perfectionism in the self and social contexts:
Conceptualization, assessment, and association with psychopathology. Journal
of Personality and Social Psychology, 60(3), 456-470.
Himmelstein, M., & Tomiyama, A. J. (2015). It’s not you, it’s me: Self-perceptions,
antifat attitudes, and stereotyping of obese individuals. Social Psychological and
Personality Science, 6(7), 749-757.
Hofmann, W., Gawronski, B., Gschwendner, T., Le, H., & Schmitt, M. (2005). A meta-
analysis on the correlation between the Implicit Association Test and explicit
self-report measures. Personality and Social Psychology Bulletin, 31(10), 1369-
1385.
Imm, P. S., & Pruitt, J. (1991). Body shape satisfaction in female exercisers and
nonexercisers. Women and Health, 17(4), 87-96.
Jakatdar, T. A., Cash, T. F., & Engle, E. K. (2006). Body-image thought processes: The
development and initial validation of the assessment of body-image cognitive
distortions. Body Image, 3(4), 325–333.
Kamimura, A., Christensen, N., Al-Obaydi, S., Solis, S. P., Ashby, J., Greenwood, J. L.,
& Reel, J. J. (2014). The relationship between body esteem, exercise
motivations, depression, and social support among female free clinic
patients. Women's Health Issues, 24(6), 656-662.
Karacan, E., Caglar, G. S., Gürsoy, A. Y., & Yilmaz, M. B. (2014). Body satisfaction
and eating attitudes among girls and young women with and without polycystic
ovary syndrome. Journal of Pediatric and Adolescent Gynecology, 27(2), 72-77.
Kennedy, C., Reis, J., Bane, S., & Stang, J. (1995). A comparison of body image
perceptions of exercising and non-exercising college students. Wellness
Perspectives, 11(3), 3-16.
85
Kilpatrick, M., Hebert, E., & Bartholomew, J. (2005). College students' motivation for
physical activity: Differentiating men's and women's motives for sport
participation and exercise. Journal of American College Health, 54(2), 87-94.
Klaczynski, P. A., Goold, K. W., & Mudry, J. J. (2004). Culture, obesity stereotypes,
self-esteem, and the “thin ideal”: A social identity perspective. Journal of Youth
and Adolescence, 33(4), 307-317.
Lim, C. L. S., Omar-Fauzee, M. S., & Rosli, M. H. (2011). The body dissatisfaction
among female athletes and non-athletes in Malaysia. Journal of Asia Pacific
Studies, 2(1), 55-69.
McKinley, N. M. (1998). Gender differences in undergraduates' body esteem: The
mediating effect of objectified body consciousness and actual/ideal weight
discrepancy. Sex Roles, 39(1), 113-123.
McKinley, N. M., & Hyde, J. S. (1996). The objectified body consciousness scale:
Development and validation. Psychology of Women Quarterly, 20(2), 181-215.
Mendelson, B. K., Mendelson, M. J., & White, D. R. (2001). Body-esteem scale for
adolescents and adults. Journal of Personality Assessment, 76(1), 90-106.
Michou, M., & Costarelli, V. (2011). Disordered eating attitudes in relation to anxiety
levels, self-esteem and body image in female basketball players. Journal of
Exercise Science and Fitness, 9(2), 109-115.
Miller, K. J., & Mesagno, C. (2014). Personality traits and exercise dependence:
Exploring the role of narcissism and perfectionism. International Journal of
Sport and Exercise Psychology, 12(4), 368-381.
Morrison, T. G., Roddy, S., & Ryan, T. A. (2009). Methods for measuring attitudes
about obese people. In D. B. Allison & M. L. Baskin (Eds.), Handbook of
assessment methods for eating behaviors and weight-related problems:

86
Measures, theory, and research (2nd ed., pp. 79-114). Thousand Oaks, CA:
Sage Publications.
Nosek, B. A., Greenwald, A. G., & Banaji, M. R. (2005). Understanding and using the
Implicit Association Test: II. Method variables and construct validity.
Personality and Social Psychology Bulletin, 31(2), 166-180.
Nosek, B. A., Greenwald, A. G., & Banaji, M. R. (2007). The Implicit Association Test
at age 7: A methodological and conceptual review. In J. A. Bargh (Ed.),
Automatic processes in social thinking and behavior (pp. 265–292). New York:
Psychology Press.
O'Brien, K. S., Hunter, J. A., & Banks, M. (2007). Implicit anti-fat bias in physical
educators: Physical attributes, ideology and socialization. International Journal
of Obesity, 31(2), 308-314.
O’Brien, K. S., Hunter, J. A., Halberstadt, J., & Anderson, J. (2007). Body image and
explicit and implicit anti-fat attitudes: The mediating role of physical appearance
comparisons. Body Image, 4(3), 249-256.
O'Toole, C., Barnes‐Holmes, D., & Smyth, S. (2007). A derived transfer of functions
and the Implicit Association Test. Journal of the Experimental Analysis of
Behavior, 88(2), 263-283.
Paxton, S. J., Wertheim, E. H., Gibbons, K., Szmukler, G. I., Hillier, L., & Petrovich, J.
L. (1991). Body image satisfaction, dieting beliefs, and weight loss behaviors in
adolescent girls and boys. Journal of Youth and Adolescence, 20(3), 361-379.
Pedersen, E. R., Helmuth, E. D., Marshall, G. N., Schell, T. L., PunKay, M., & Kurz, J.
(2015). Using Facebook to recruit young adult veterans: Online mental health
research. JMIR Research Protocols, 4(2), e63.
87
Pelea, Z. (2015). New Zealand Facebook demographics and usage statistics
(infographic). Retrieved from
http://www.firstdigital.co.nz/blog/2015/09/16/new-zealand-facebook-
demographics-usage-statistics/
Pepper, A. C., & Ruiz, S. Y. (2007). Acculturation's influence on antifat attitudes, body
image and eating behaviors. Eating Disorders, 15(5), 427-447.
Phan, T., & Tylka, T. L. (2006). Exploring a model and moderators of disordered eating
with Asian American college women. Journal of Counseling Psychology, 53(1),
36-47.
Pickett, T. C., Lewis, R. J., & Cash, T. F. (2005). Men, muscles, and body image:
Comparisons of competitive bodybuilders, weight trainers, and athletically
active controls. British Journal of Sports Medicine, 39(4), 217-222.
Pingitore, R., Spring, B., & Garfield, D. (1997). Gender differences in body
satisfaction. Obesity Research, 5(5), 402-409.
Preacher, K. J., & Hayes, A. F. (2004). SPSS and SAS procedures for estimating
indirect effects in simple mediation models. Behavior Research Methods,
Instruments, and Computers, 36(4), 717-731.
Prichard, I., & Tiggemann, M. (2008). Relations among exercise type, self-
objectification, and body image in the fitness centre environment: The role of
reasons for exercise. Psychology of Sport and Exercise, 9(6), 855-866.
Puhl, R. M., & Heuer, C. A. (2009). The stigma of obesity: A review and update.
Obesity, 17(5), 941–964.
Quinlan, N. P., Hoy, M. B., & Costanzo, P. R. (2009). Sticks and stones: The effects of
teasing on psychosocial functioning in an overweight treatment‐seeking
sample. Social Development, 18(4), 978-1001.

88
Reas, D. L., Whisenhunt, B. L., Netemeyer, R., & Williamson, D. A. (2002).
Development of the Body Checking Questionnaire: A self‐report measure of
body checking behaviors. International Journal of Eating Disorders, 31(3), 324-
333.
Reel, J. J. (2013). Eating disorders: An encyclopedia of causes, treatment, and
prevention. Santa Barbara, CA: ABC-CLIO.
Robertson, N., & Vohora, R. (2008). Fitness vs. fatness: Implicit bias towards obesity
among fitness professionals and regular exercisers. Psychology of Sport and
Exercise, 9(4), 547-557.
Rosewall, J. M. (2009). Prevalence, correlates and moderators of eating pathology in
New Zealand women, adolescent and preadolescent girls (Doctoral dissertation,
University of Canterbury, Christchurch, New Zealand). Retrieved from
http://ir.canterbury.ac.nz/handle/10092/2223
Salazar, L. F., Crosby, R. A., & DiClemente, R. J. (2006). Choosing a research design.
In L. F. Salazar, R. A. Crosby & R. J. DiClemente (Eds.), Research methods in
health promotion (1st ed., pp. 75-106). San Francisco, CA: Jossey Bass.
Schwartz, M. B., Vartanian, L. R., Nosek, B. A., & Brownell, K. D. (2006). The
influence of one's own body weight on implicit and explicit anti‐fat bias.
Obesity, 14(3), 440-447.
Shapiro, J. R., King, E. B., & Quinones, M. A. (2007). Expectations of obese trainees:
How stigmatized trainee characteristics influence training effectiveness. Journal
of Applied Psychology, 92(1), 239-249.
Shroff, H. P., Calogero, R. M., & Thompson, J. K. (2009). Assessment of body image.
In D. B. Allison & M. L. Baskin (Eds.), Handbook of assessment methods for
89
eating behaviors and weight-related problems: Measures, theory, and research
(2nd ed., pp. 115-136). Thousand Oaks, CA: Sage Publications.
Slaney, R. B., Rice, K. G., Mobley, M., Trippi, J., & Ashby, J. S. (2001). The revised
almost perfect scale. Measurement and Evaluation in Counseling and
Development, 34(3), 130-145.
Smith, D. E., Thompson, J. K., Raczynski, J. M., & Hilner, J. E. (1999). Body image
among men and women in a biracial cohort: The CARDIA Study. International
Journal of Eating Disorders, 25(1), 71-82.
Stapleton, P., McIntyre, T., & Bannatyne, A. (2016). Body image avoidance, body
dissatisfaction, and eating pathology: Is there a difference between male gym
users and non–gym users? American Journal of Men's Health, 10(2), 100-109.
Stoeber, J., Uphill, M. A., & Hotham, S. (2009). Predicting race performance in
triathlon: The role of perfectionism, achievement goals, and personal goal
setting. Journal of Sport and Exercise Psychology, 31(2), 211-245.
Strelan, P., & Hargreaves, D. (2005). Reasons for exercise and body esteem: Men's
responses to self-objectification. Sex Roles, 53(7/8), 495-503.
Summerfield, L. M., & Ellis, S. K. (2014). Nutrition, exercise, and behavior: An
integrated approach to weight management (3rd ed.). Boston, MA: Cengage
Learning.
Teachman, B. A., & Brownell, K. D. (2001). Implicit anti-fat bias among health
professionals: Is anyone immune? International Journal of Obesity and Related
Metabolic Disorders, 25(10), 1525-1531.
Teachman, B. A., Gapinski, K. D., Brownell, K. D., Rawlins, M., & Jeyaram, S. (2003).
Demonstrations of implicit anti-fat bias: The impact of providing causal
information and evoking empathy. Health Psychology, 22(1), 68-78.
90
Thompson, J. K., Heinberg, L. J., Altabe, M. N., & Tantleff‐Dunn, S. (1999). Exacting
beauty: Theory, assessment and treatment of body image disturbance.
Washington, DC: American Psychological Association.
Tissot, A. M., & Crowther, J. H. (2008). Self-oriented and socially prescribed
perfectionism: Risk factors within an integrative model for bulimic
symptomatology. Journal of Social and Clinical Psychology, 27(7), 734-755.
Tyler, C., Johnston, C. A., Dalton, W. T., & Foreyt, J. P. (2008). Relationships between
weight and body dissatisfaction, body esteem, and teasing in African American
girls. Journal of Black Psychology, 35(1), 125-132.
Vartanian, L. R., & Novak, S. A. (2011). Internalized societal attitudes moderate the
impact of weight stigma on avoidance of exercise. Obesity, 19(4), 757-762.
Vinkers, C. D., Evers, C., Adriaanse, M. A., & de Ridder, D. T. (2012). Body esteem
and eating disorder symptomatology: The mediating role of appearance-
motivated exercise in a non-clinical adult female sample. Eating
Behaviors, 13(3), 214-218.
Vogel, A. (2002). Boosting body image in your classes. Retrieved from
http://www.ideafit.com/fitness-library/boosting-body-image-in-your-classes
Wade, T. D., & Tiggemann, M. (2013). The role of perfectionism in body
dissatisfaction. Journal of Eating Disorders, 1(2), 1-6.
Wei, M., Mallinckrodt, B., Russell, D. W., & Abraham, W. T. (2004). Maladaptive
perfectionism as a mediator and moderator between adult attachment and
depressive mood. Journal of Counseling Psychology, 51(2), 201-212.
West, S. G., Finch, J. F., & Curran, P. J. (1995). Structural equation models with
nonnormal variables: Problems and remedies. In R. H. Hoyle (Ed.), Structural
91
equation modeling: Concepts, issues and applications (pp. 56-75). Thousand
Oaks, CA: Sage.
Whitley, B. E., & Kite, M. E. (2013). Principles of research in behavioral science. (3rd
ed.). New York, NY: Routledge.
Wilson, R. E., Latner, J. D., & Hayashi, K. (2013). More than just body weight: The
role of body image in psychological and physical functioning. Body
Image, 10(4), 644-647.
World Health Organization. (2000). Obesity: Preventing and managing the global
epidemic (Report No. 894). Geneva, Switzerland: World Health Organization.
Wright, K. B. (2005). Researching internet-based populations: Advantages and
disadvantages of online survey research, online questionnaire authoring
software packages, and web survey services, 10(3), article 11. doi:
10.1111/j.1083-6101.2005.tb00259.x
Yates, A., Edman, J., & Aruguete, M. (2004). Ethnic differences in BMI and body/self-
dissatisfaction among Whites, Asian subgroups, Pacific Islanders, and African-
Americans. Journal of Adolescent Health, 34(4), 300-307.
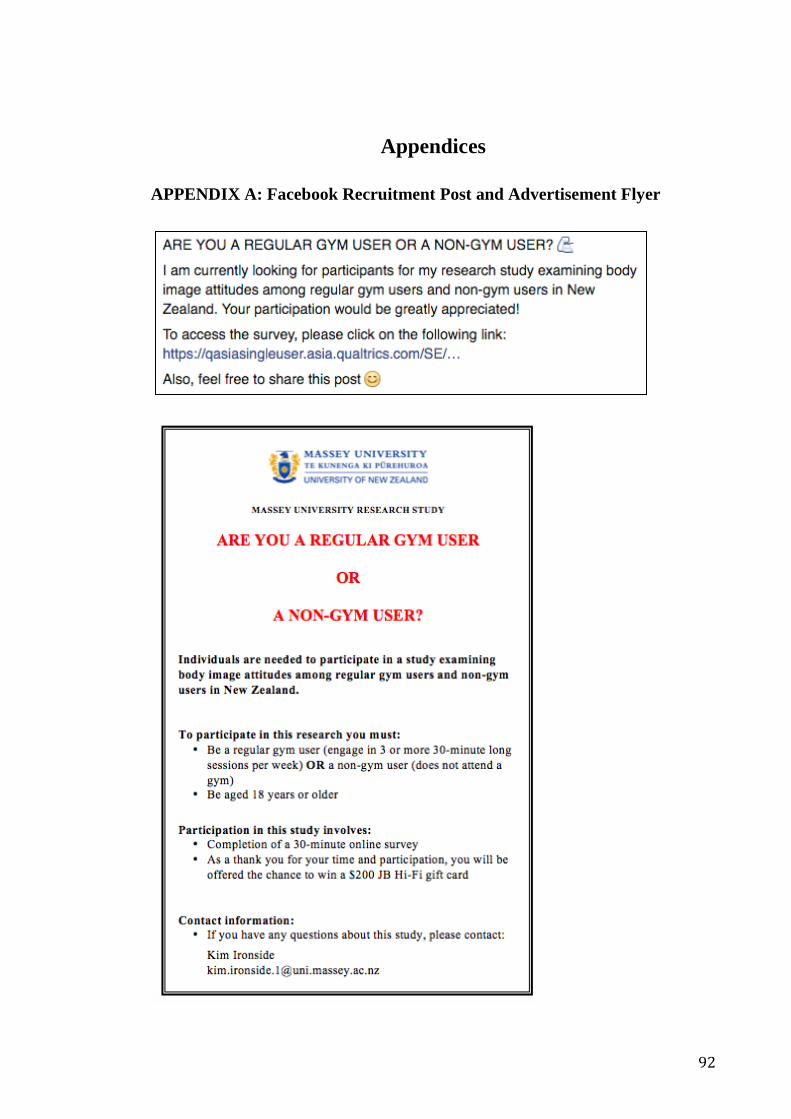
92
Appendices
APPENDIX A: Facebook Recruitment Post and Advertisement Flyer
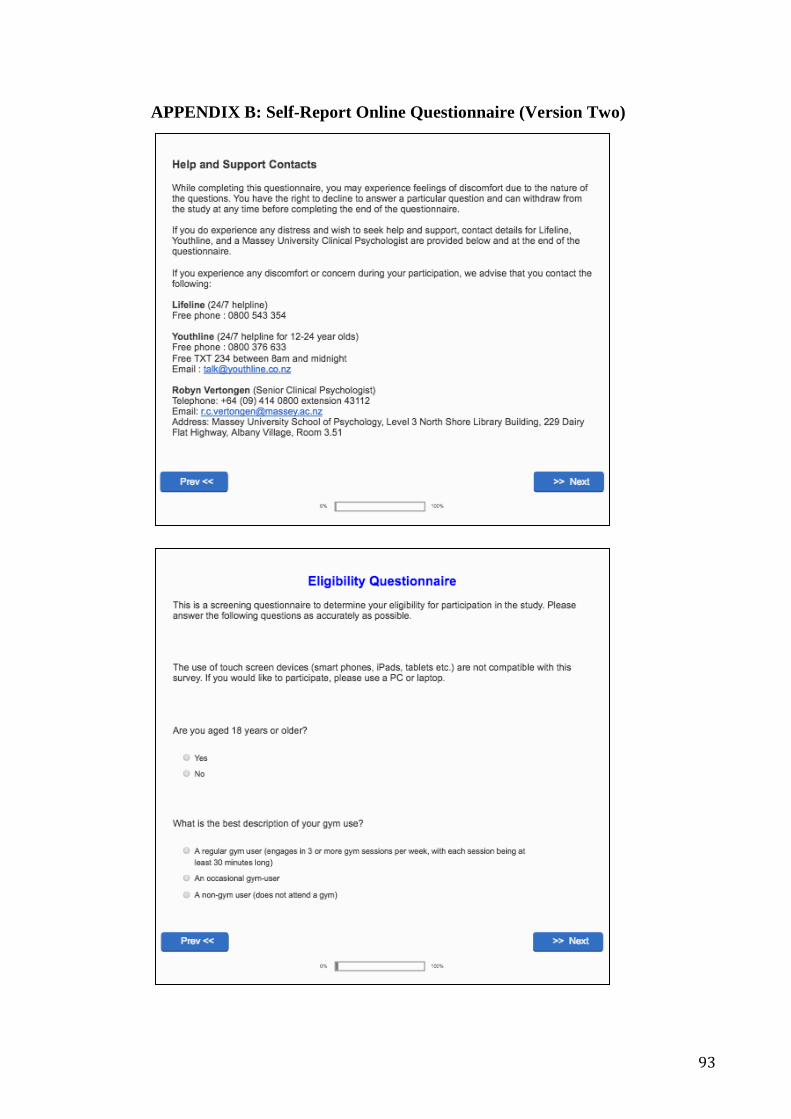
93
APPENDIX B: Self-Report Online Questionnaire (Version Two)
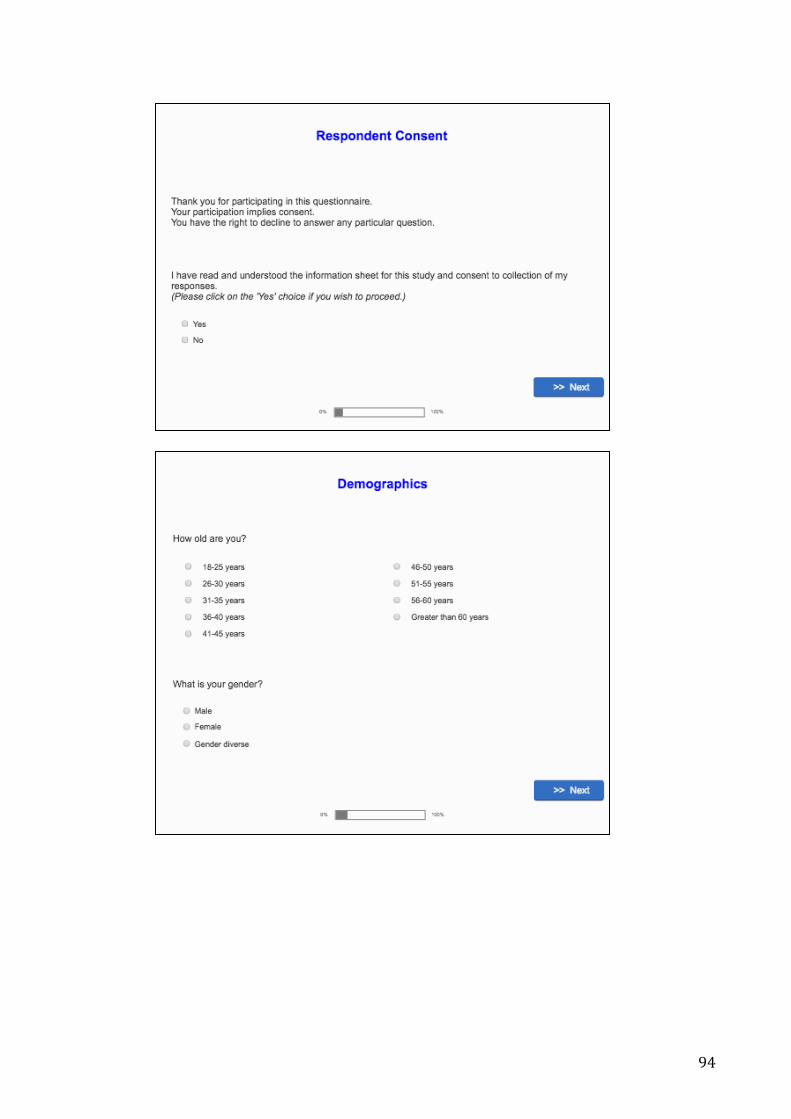
94

95

96

97
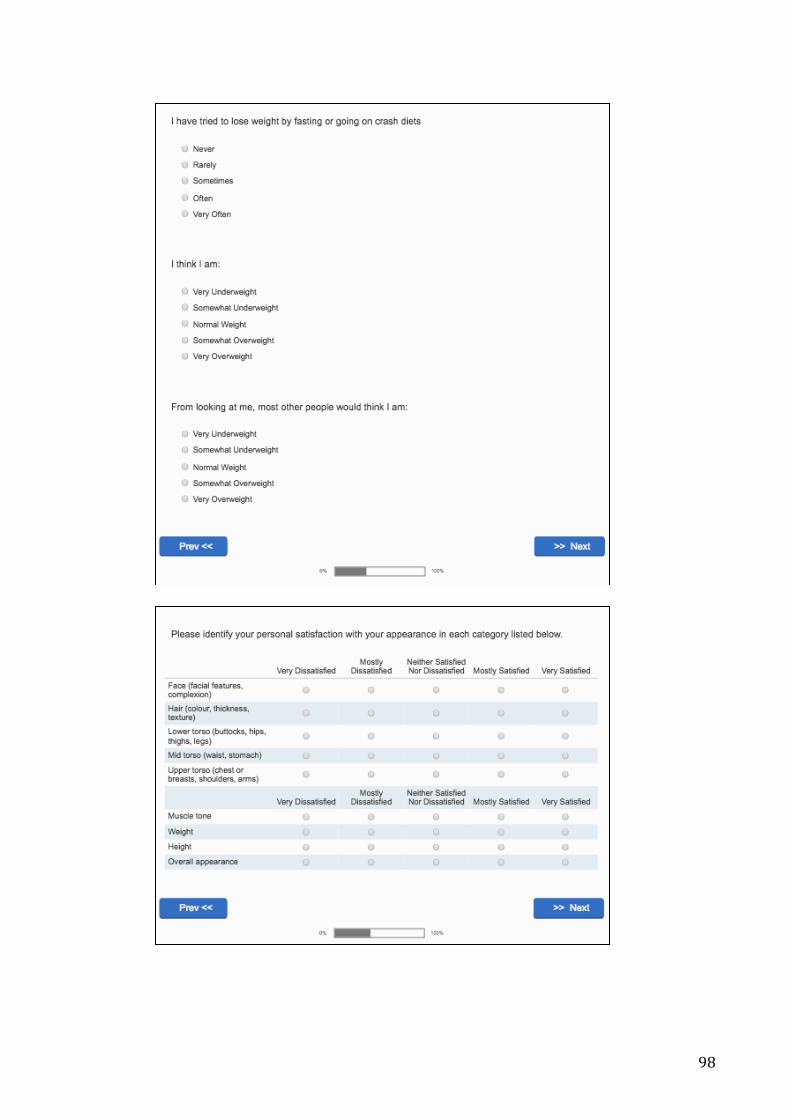
98

99
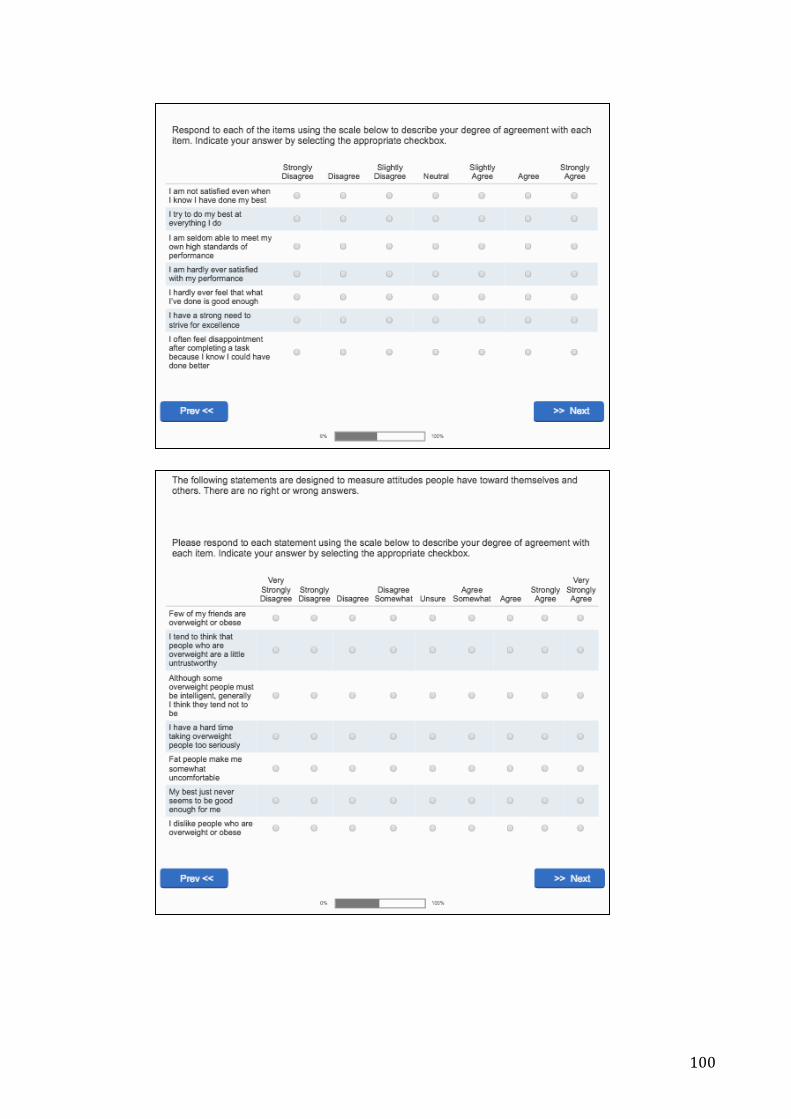
100

101

102

103
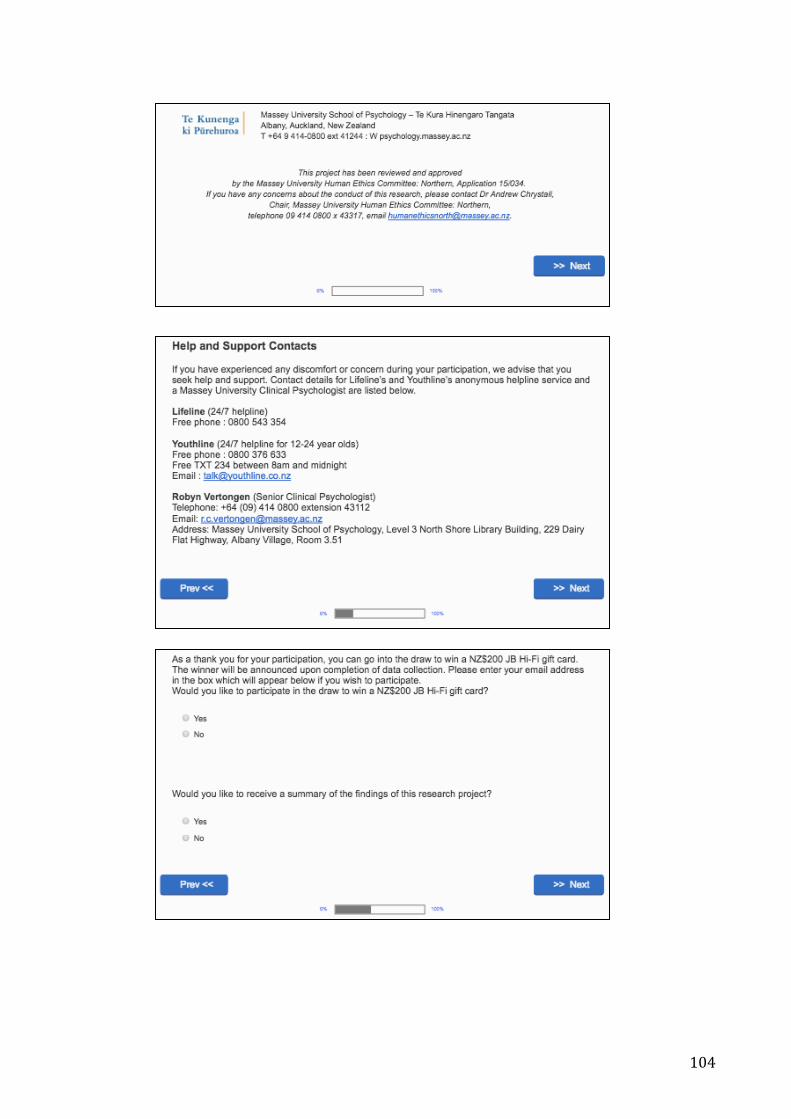
104

105
106
APPENDIX C: Information Sheet
Examining body image attitudes among regular gymnasium users and non-
gymnasium users
Information Sheet
Researcher’s Introduction My name is Kim Ironside and I am a Master of Science (Psychology) student at Massey University. I am interested in examining body image attitudes among regular gym users and non-gym users. This study is being conducted alongside Dr Richard Fletcher (supervisor) as part of my Master of Science in Psychology Thesis. Project Description and Invitation You are invited to participate in this research study, which will investigate how body image attitudes differ among regular gym users compared to non-gym users. This study will ask questions about your personal views and attitudes related to body image. If you choose to participate, your participation will be greatly appreciated and completely anonymous. Participant Identification and Recruitment Participants will be recruited via flyers advertised in gyms around Auckland and through Facebook. To ensure anonymity, no names will be collected in this questionnaire. In order to participate, you must be 18 years or older and you must be either a regular gym user (attend three or more 30-minute long sessions per week) or a non-gym user (does not attend a gym). An eligibility questionnaire will be used to select for such participants. A total of 62 participants or more is needed to produce useful findings. Participants will be given the option to enter themselves in the draw to win a NZ$200 JB Hi-Fi gift card by providing their email address at the end of the questionnaire. While completing the questionnaire, you may experience feelings of discomfort due to the nature of the questions. You have the right to decline to answer a particular question and can withdraw from the study at any time before completing the end of the questionnaire. If you do experience any distress and wish to seek help and support, contact details for Lifeline, Youthline, and a Clinical Psychologist are provided at the bottom of this Information page and at the beginning and end of the questionnaire. Project Procedures If you choose to participate, you will be asked to complete a short eligibility questionnaire. Those who meet the selection criteria will be asked to provide consent by selecting the checkbox before beginning the study questionnaire. The study questionnaire consists of around

107
110 questions and an implicit association test, which will take approximately 30 minutes to complete. Data Management Obtained data will be entered into a datasheet and analysed using statistical software. Entered data will be stored on a password-protected file and datasheet will be securely stored in the supervisor’s office. Data will be disposed of after 5 years. Findings from the analysed data will be used for my Masters Thesis and may be published in scientific journals. If you wish to access a summary of the project findings, please provide your email address after completing the questionnaire. Participant’s Rights You are under no obligation to accept this invitation. If you decide to participate, you have the right to:
Decline to answer any particular question;
Withdraw your data from the study anytime before completing the end of the questionnaire;
Ask any questions about the study at any time during participation;
Provide information on the understanding that your name will not be used unless you give permission to the researcher;
Be given access to a summary of the project findings when it is concluded.
Completion and return of the questionnaire implies consent. You have the right to decline to answer any particular question
Many thanks, Kim Ironside Contact information If you have any questions or queries regarding this project, please don’t hesitate to contact the following: Researcher Kim Ironside School of Psychology Massey University Albany, Auckland New Zealand Email: [email protected] Supervisor Dr Richard Fletcher Massey University School of Psychology Massey University Albany, Auckland New Zealand Telephone: +64 (09) 414 0800 ext. 43096 Email: [email protected] Help and Support Contacts While completing this questionnaire, you may experience feelings of discomfort due to the nature of the questions. You have the right to decline to answer a particular question and can withdraw from the study at any time before completing the end of the questionnaire. If you do experience any distress and wish to seek help and support, contact details for Lifeline, Youthline, and a Massey University Clinical Psychologist are provided below and at the end of the questionnaire.
108
If you experience any discomfort or concern during your participation, we advise that you contact the following: Lifeline (24/7 helpline) Free phone : 0800 543 354 Youthline (24/7 helpline for 12-24 year olds) Free phone : 0800 376 633 Free TXT 234 between 8am and midnight Email : [email protected] Robyn Vertongen (Senior Clinical Psychologist) Telephone: +64 (09) 414 0800 extension 43112 Email: [email protected] Address: Massey University School of Psychology, Level 3 North Shore Library Building, 229 Dairy Flat Highway, Albany Village, Room 3.51
This project has been reviewed and approved by the Massey University Human Ethics Committee: Northern, Application 15/034.
If you have any concerns about the conduct of this research, please contact Dr Andrew Chrystall,
Chair, Massey University Human Ethics Committee: Northern, telephone 09 414 0800 x 43317, email [email protected].
Massey University School of Psychology – Te Kura Hinengaro Tangata Albany, Auckland, New Zealand T +64 9 414-0800 ext 41244 : W psychology.massey.ac.nz

109
APPENDIX D: Implicit Association Test (Version One)

110
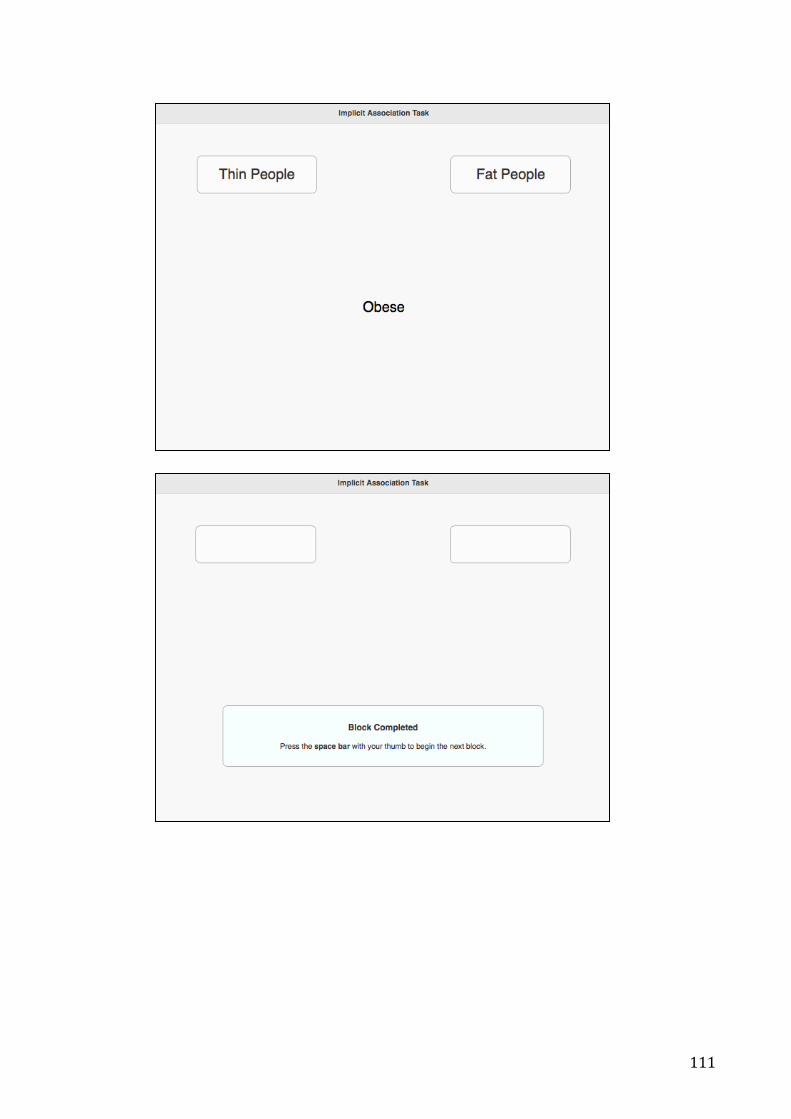
111

112

113
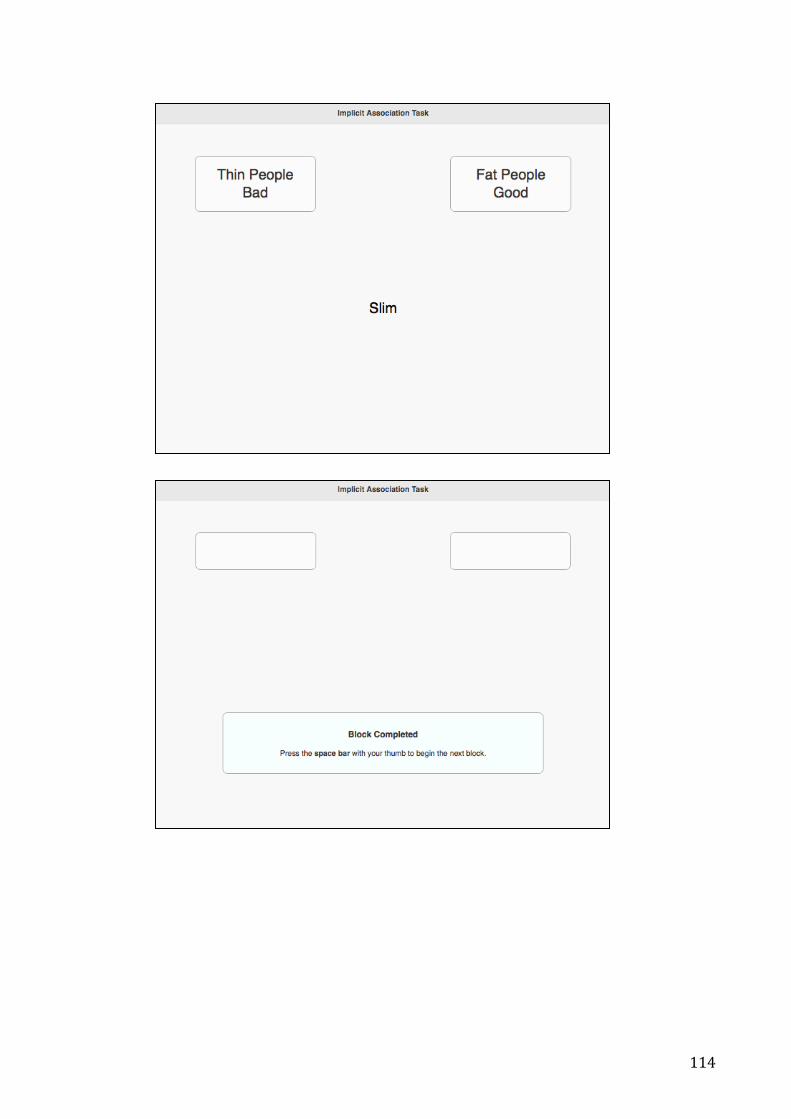
114
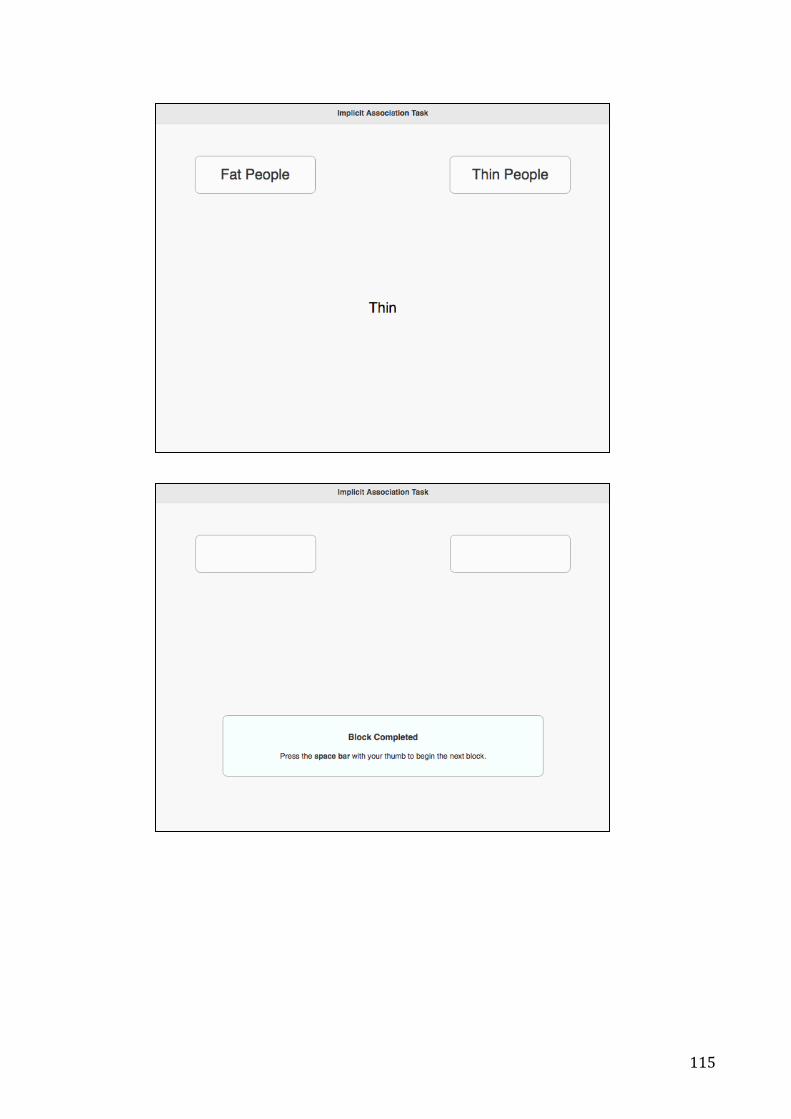
115
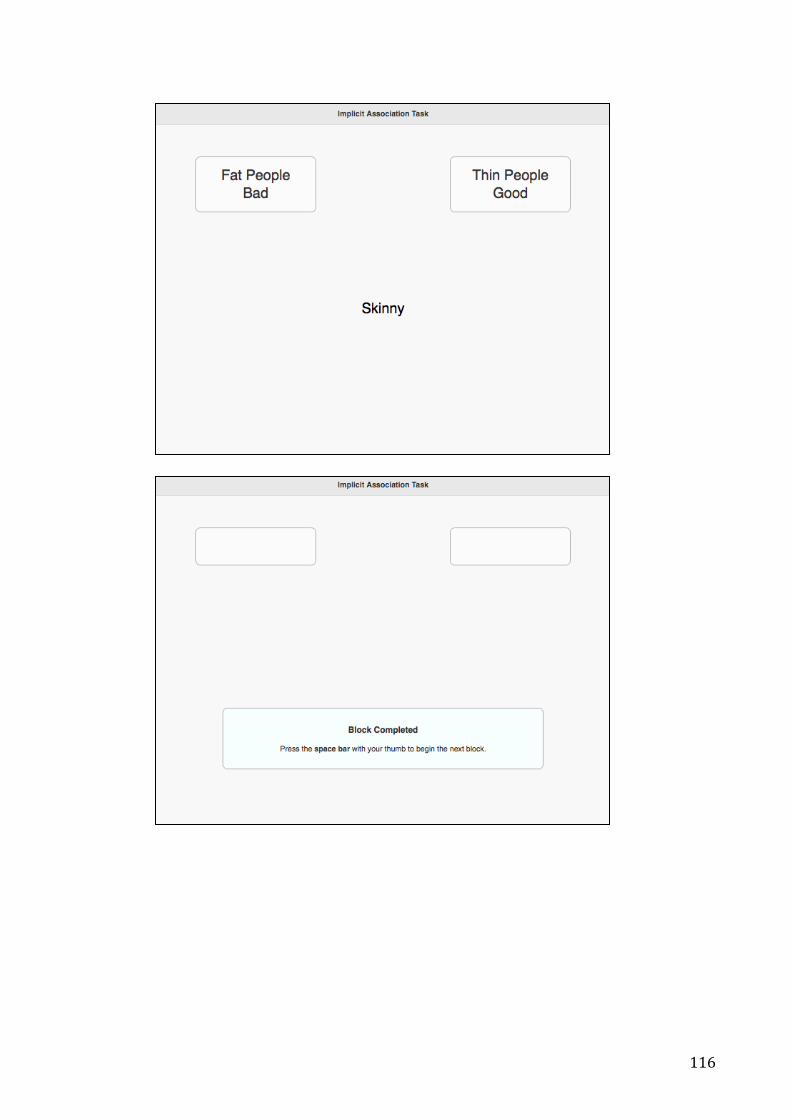
116

117

118
APPENDIX E: Boxplots of explicit anti-fat attitudes between regular gym
users and non-gym users
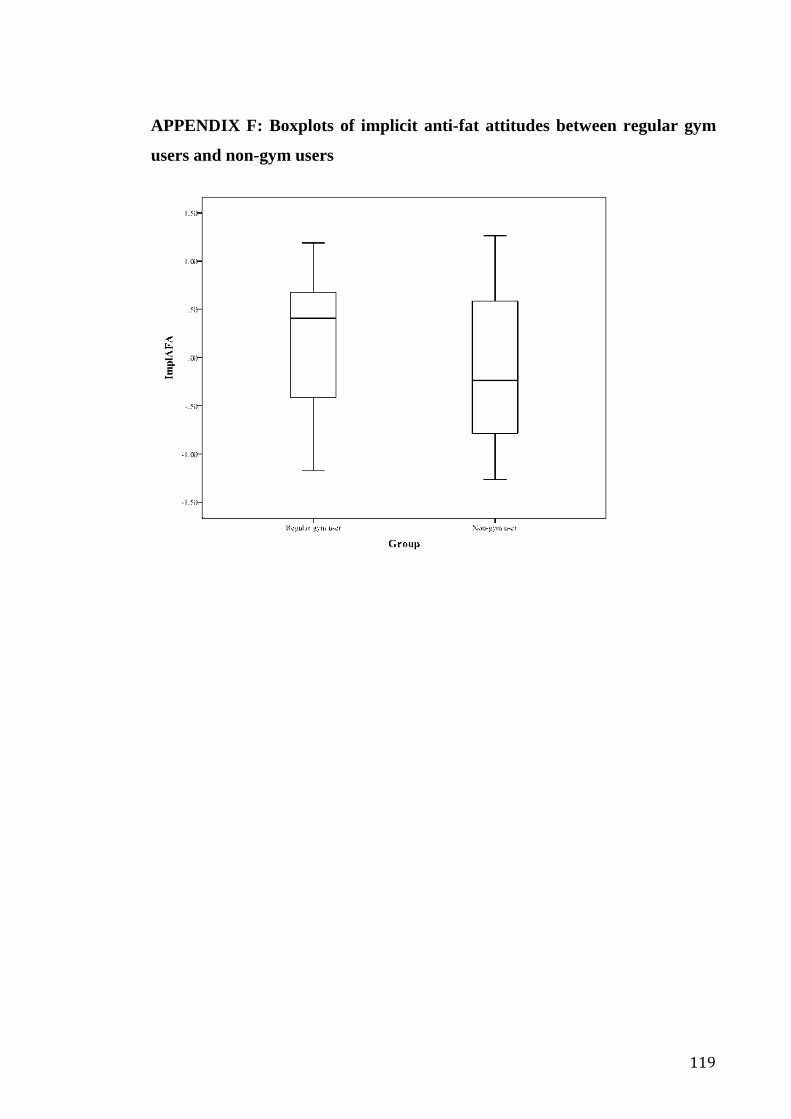
119
APPENDIX F: Boxplots of implicit anti-fat attitudes between regular gym
users and non-gym users

120
APPENDIX G: Boxplots of explicit anti-fat attitudes between males and
females
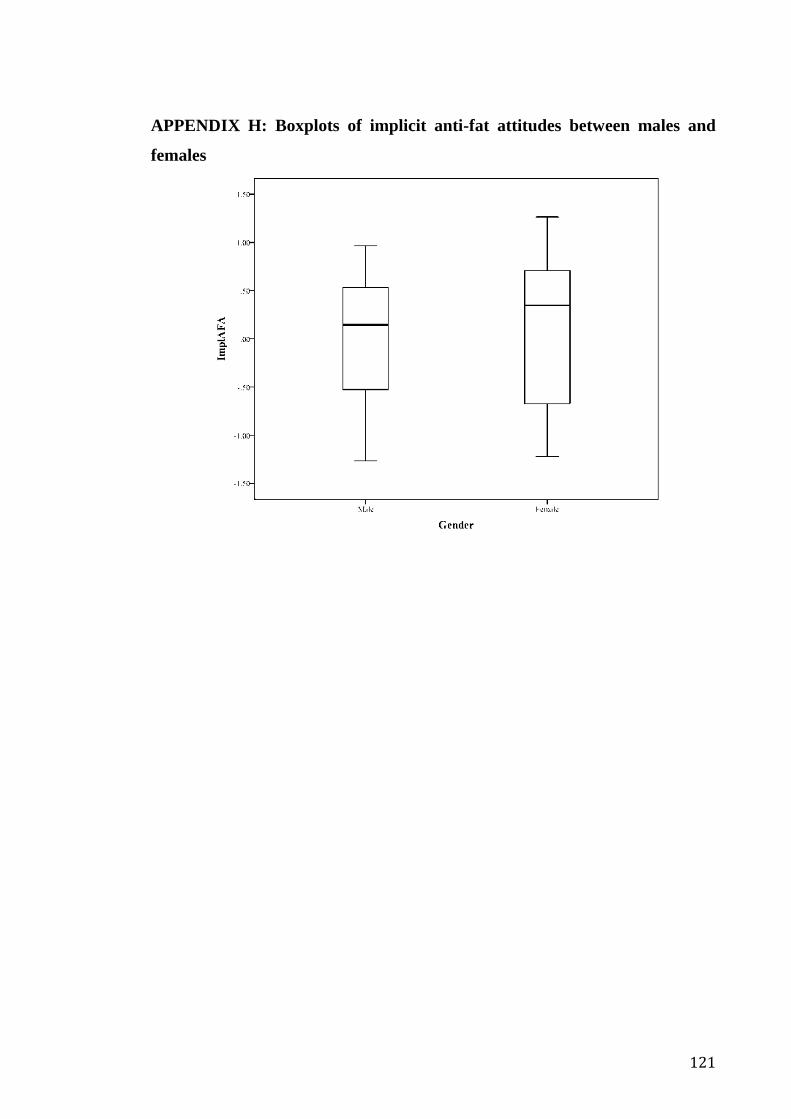
121
APPENDIX H: Boxplots of implicit anti-fat attitudes between males and
females

122
APPENDIX I: PROCESS output for mediation effect of perfectionism on
the relationship between appearance orientation and explicit anti-fat
attitudes
Run MATRIX procedure:
************** PROCESS Procedure for SPSS Release 2.15 *******************
Written by Andrew F. Hayes, Ph.D. www.afhayes.com
Documentation available in Hayes (2013). www.guilford.com/p/hayes3
**************************************************************************
Model = 4
Y = AFATotal
X = APPOR
M = APSTotal
Sample size
72
**************************************************************************
Outcome: APSTotal
Model Summary
R R-sq MSE F df1 df2
p
.3869 .1497 384.4023 12.3246 1.0000 70.0000
.0008
Model
coeff se t p LLCI ULCI
constant 63.4202 12.8914 4.9196 .0000 37.7090 89.1314
APPOR 1.0830 .3085 3.5106 .0008 .4677 1.6983
**************************************************************************
Outcome: AFATotal
Model Summary
R R-sq MSE F df1 df2
p
.4766 .2271 1.7412 10.1391 2.0000 69.0000
.0001
Model
coeff se t p LLCI ULCI
constant .4440 1.0065 .4411 .6605 -1.5640 2.4519
APSTotal .0200 .0080 2.4880 .0153 .0040 .0361
APPOR .0563 .0225 2.4984 .0149 .0113 .1012
************************** TOTAL EFFECT MODEL ****************************
Outcome: AFATotal
Model Summary
R R-sq MSE F df1 df2
p
.3972 .1578 1.8703 13.1157 1.0000 70.0000
.0006
Model
coeff se t p LLCI ULCI
constant 1.7133 .8992 1.9053 .0609 -.0802 3.5067
APPOR .0779 .0215 3.6216 .0006 .0350 .1208
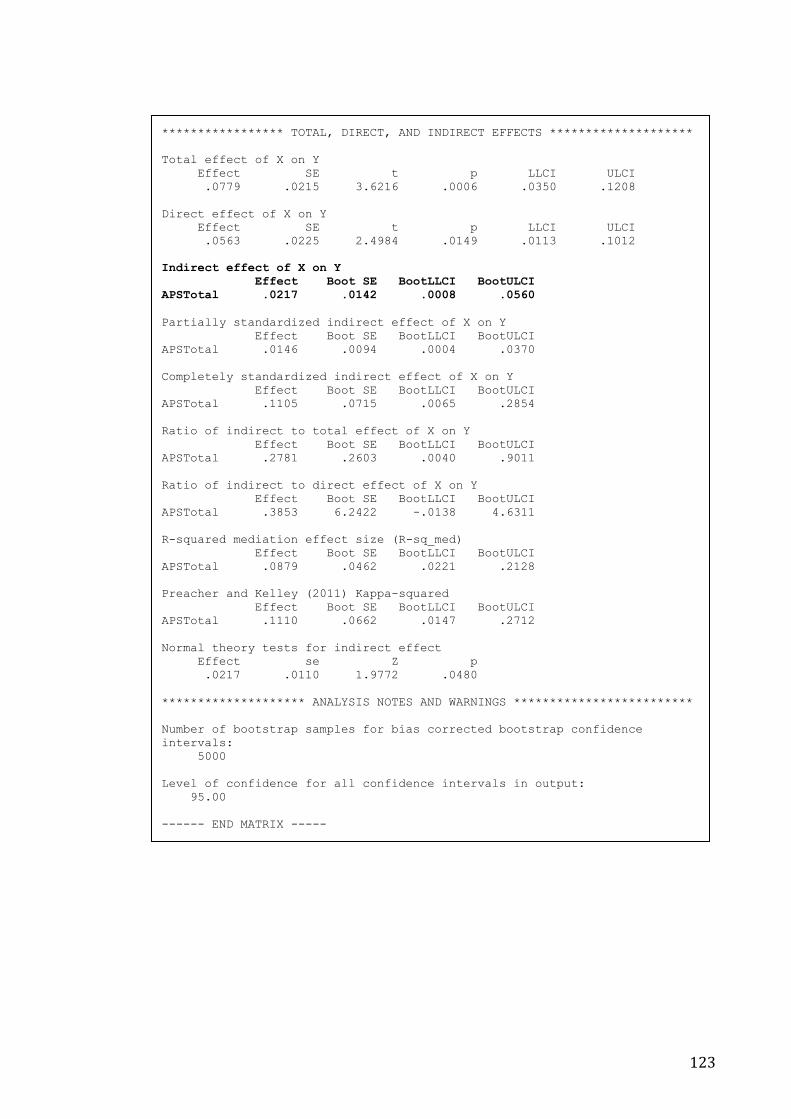
123
***************** TOTAL, DIRECT, AND INDIRECT EFFECTS ********************
Total effect of X on Y
Effect SE t p LLCI ULCI
.0779 .0215 3.6216 .0006 .0350 .1208
Direct effect of X on Y
Effect SE t p LLCI ULCI
.0563 .0225 2.4984 .0149 .0113 .1012
Indirect effect of X on Y
Effect Boot SE BootLLCI BootULCI
APSTotal .0217 .0142 .0008 .0560
Partially standardized indirect effect of X on Y
Effect Boot SE BootLLCI BootULCI
APSTotal .0146 .0094 .0004 .0370
Completely standardized indirect effect of X on Y
Effect Boot SE BootLLCI BootULCI
APSTotal .1105 .0715 .0065 .2854
Ratio of indirect to total effect of X on Y
Effect Boot SE BootLLCI BootULCI
APSTotal .2781 .2603 .0040 .9011
Ratio of indirect to direct effect of X on Y
Effect Boot SE BootLLCI BootULCI
APSTotal .3853 6.2422 -.0138 4.6311
R-squared mediation effect size (R-sq_med)
Effect Boot SE BootLLCI BootULCI
APSTotal .0879 .0462 .0221 .2128
Preacher and Kelley (2011) Kappa-squared
Effect Boot SE BootLLCI BootULCI
APSTotal .1110 .0662 .0147 .2712
Normal theory tests for indirect effect
Effect se Z p
.0217 .0110 1.9772 .0480
******************** ANALYSIS NOTES AND WARNINGS *************************
Number of bootstrap samples for bias corrected bootstrap confidence
intervals:
5000
Level of confidence for all confidence intervals in output:
95.00
------ END MATRIX -----

124
APPENDIX J: PROCESS output for mediation effect of perfectionism on
the relationship between appearance orientation and dislike
Run MATRIX procedure:
************** PROCESS Procedure for SPSS Release 2.15 *******************
Written by Andrew F. Hayes, Ph.D. www.afhayes.com
Documentation available in Hayes (2013). www.guilford.com/p/hayes3
**************************************************************************
Model = 4
Y = DISL
X = APPOR
M = APSTotal
Sample size
72
**************************************************************************
Outcome: APSTotal
Model Summary
R R-sq MSE F df1 df2
p
.3869 .1497 384.4023 12.3246 1.0000 70.0000
.0008
Model
coeff se t p LLCI ULCI
constant 63.4202 12.8914 4.9196 .0000 37.7090 89.1314
APPOR 1.0830 .3085 3.5106 .0008 .4677 1.6983
**************************************************************************
Outcome: DISL
Model Summary
R R-sq MSE F df1 df2
p
.3927 .1542 2.1183 6.2905 2.0000 69.0000
.0031
Model
coeff se t p LLCI ULCI
constant .0156 1.1101 .0140 .9889 -2.1991 2.2302
APSTotal .0252 .0089 2.8359 .0060 .0075 .0429
APPOR .0215 .0248 .8673 .3888 -.0280 .0711
************************** TOTAL EFFECT MODEL ****************************
Outcome: DISL
Model Summary
R R-sq MSE F df1 df2
p
.2359 .0556 2.3314 4.1240 1.0000 70.0000
.0461
Model
coeff se t p LLCI ULCI
constant 1.6113 1.0039 1.6050 .1130 -.3910 3.6136
APPOR .0488 .0240 2.0308 .0461 .0009 .0967
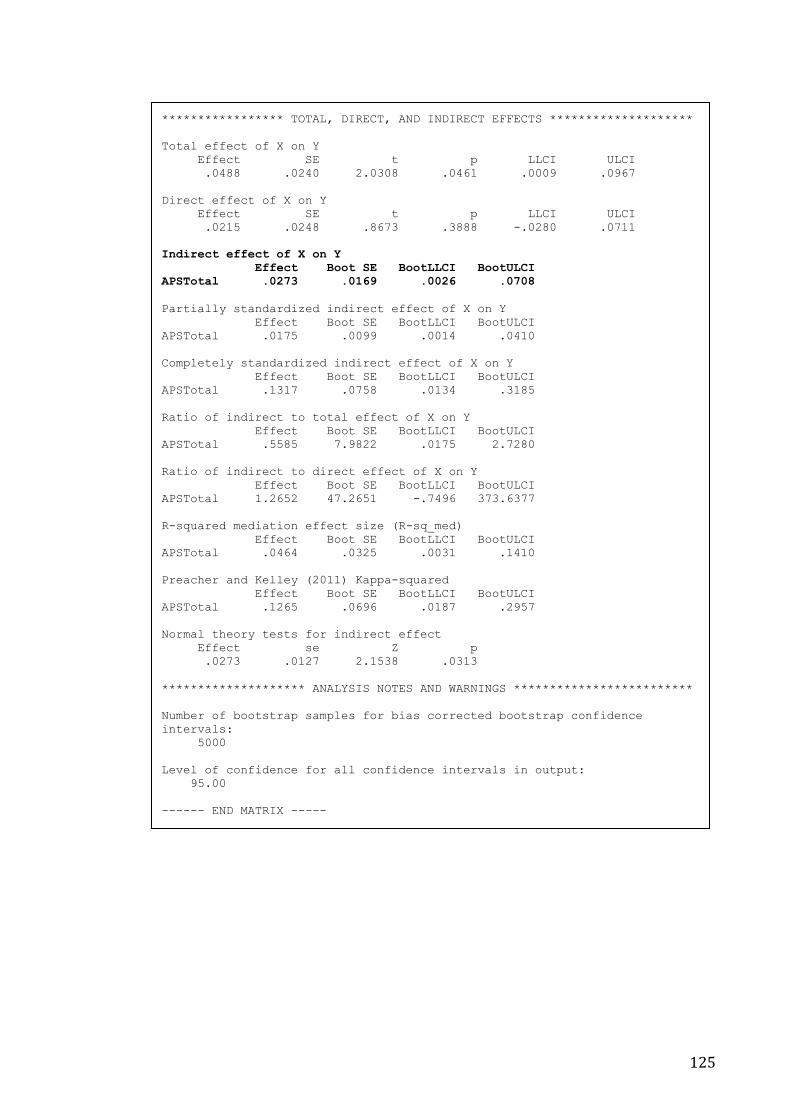
125
***************** TOTAL, DIRECT, AND INDIRECT EFFECTS ********************
Total effect of X on Y
Effect SE t p LLCI ULCI
.0488 .0240 2.0308 .0461 .0009 .0967
Direct effect of X on Y
Effect SE t p LLCI ULCI
.0215 .0248 .8673 .3888 -.0280 .0711
Indirect effect of X on Y
Effect Boot SE BootLLCI BootULCI
APSTotal .0273 .0169 .0026 .0708
Partially standardized indirect effect of X on Y
Effect Boot SE BootLLCI BootULCI
APSTotal .0175 .0099 .0014 .0410
Completely standardized indirect effect of X on Y
Effect Boot SE BootLLCI BootULCI
APSTotal .1317 .0758 .0134 .3185
Ratio of indirect to total effect of X on Y
Effect Boot SE BootLLCI BootULCI
APSTotal .5585 7.9822 .0175 2.7280
Ratio of indirect to direct effect of X on Y
Effect Boot SE BootLLCI BootULCI
APSTotal 1.2652 47.2651 -.7496 373.6377
R-squared mediation effect size (R-sq_med)
Effect Boot SE BootLLCI BootULCI
APSTotal .0464 .0325 .0031 .1410
Preacher and Kelley (2011) Kappa-squared
Effect Boot SE BootLLCI BootULCI
APSTotal .1265 .0696 .0187 .2957
Normal theory tests for indirect effect
Effect se Z p
.0273 .0127 2.1538 .0313
******************** ANALYSIS NOTES AND WARNINGS *************************
Number of bootstrap samples for bias corrected bootstrap confidence
intervals:
5000
Level of confidence for all confidence intervals in output:
95.00
------ END MATRIX -----
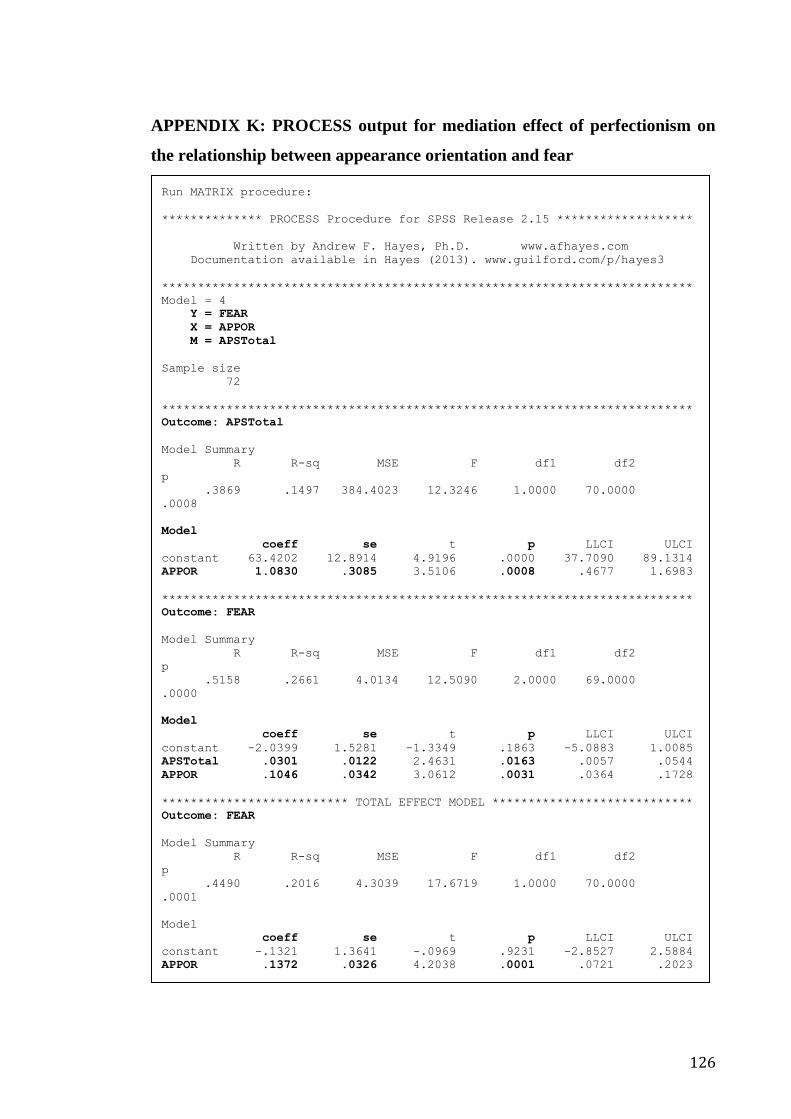
126
APPENDIX K: PROCESS output for mediation effect of perfectionism on
the relationship between appearance orientation and fear
Run MATRIX procedure:
************** PROCESS Procedure for SPSS Release 2.15 *******************
Written by Andrew F. Hayes, Ph.D. www.afhayes.com
Documentation available in Hayes (2013). www.guilford.com/p/hayes3
**************************************************************************
Model = 4
Y = FEAR
X = APPOR
M = APSTotal
Sample size
72
**************************************************************************
Outcome: APSTotal
Model Summary
R R-sq MSE F df1 df2
p
.3869 .1497 384.4023 12.3246 1.0000 70.0000
.0008
Model
coeff se t p LLCI ULCI
constant 63.4202 12.8914 4.9196 .0000 37.7090 89.1314
APPOR 1.0830 .3085 3.5106 .0008 .4677 1.6983
**************************************************************************
Outcome: FEAR
Model Summary
R R-sq MSE F df1 df2
p
.5158 .2661 4.0134 12.5090 2.0000 69.0000
.0000
Model
coeff se t p LLCI ULCI
constant -2.0399 1.5281 -1.3349 .1863 -5.0883 1.0085
APSTotal .0301 .0122 2.4631 .0163 .0057 .0544
APPOR .1046 .0342 3.0612 .0031 .0364 .1728
************************** TOTAL EFFECT MODEL ****************************
Outcome: FEAR
Model Summary
R R-sq MSE F df1 df2
p
.4490 .2016 4.3039 17.6719 1.0000 70.0000
.0001
Model
coeff se t p LLCI ULCI
constant -.1321 1.3641 -.0969 .9231 -2.8527 2.5884
APPOR .1372 .0326 4.2038 .0001 .0721 .2023
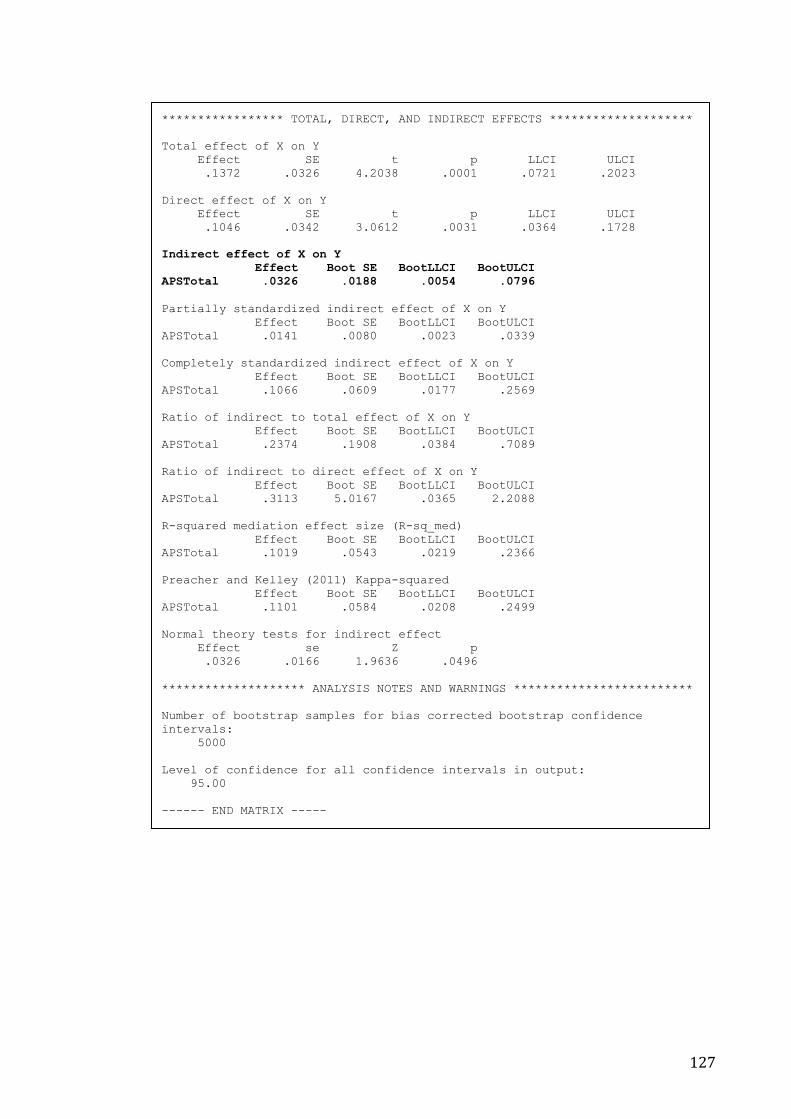
127
***************** TOTAL, DIRECT, AND INDIRECT EFFECTS ********************
Total effect of X on Y
Effect SE t p LLCI ULCI
.1372 .0326 4.2038 .0001 .0721 .2023
Direct effect of X on Y
Effect SE t p LLCI ULCI
.1046 .0342 3.0612 .0031 .0364 .1728
Indirect effect of X on Y
Effect Boot SE BootLLCI BootULCI
APSTotal .0326 .0188 .0054 .0796
Partially standardized indirect effect of X on Y
Effect Boot SE BootLLCI BootULCI
APSTotal .0141 .0080 .0023 .0339
Completely standardized indirect effect of X on Y
Effect Boot SE BootLLCI BootULCI
APSTotal .1066 .0609 .0177 .2569
Ratio of indirect to total effect of X on Y
Effect Boot SE BootLLCI BootULCI
APSTotal .2374 .1908 .0384 .7089
Ratio of indirect to direct effect of X on Y
Effect Boot SE BootLLCI BootULCI
APSTotal .3113 5.0167 .0365 2.2088
R-squared mediation effect size (R-sq_med)
Effect Boot SE BootLLCI BootULCI
APSTotal .1019 .0543 .0219 .2366
Preacher and Kelley (2011) Kappa-squared
Effect Boot SE BootLLCI BootULCI
APSTotal .1101 .0584 .0208 .2499
Normal theory tests for indirect effect
Effect se Z p
.0326 .0166 1.9636 .0496
******************** ANALYSIS NOTES AND WARNINGS *************************
Number of bootstrap samples for bias corrected bootstrap confidence
intervals:
5000
Level of confidence for all confidence intervals in output:
95.00
------ END MATRIX -----
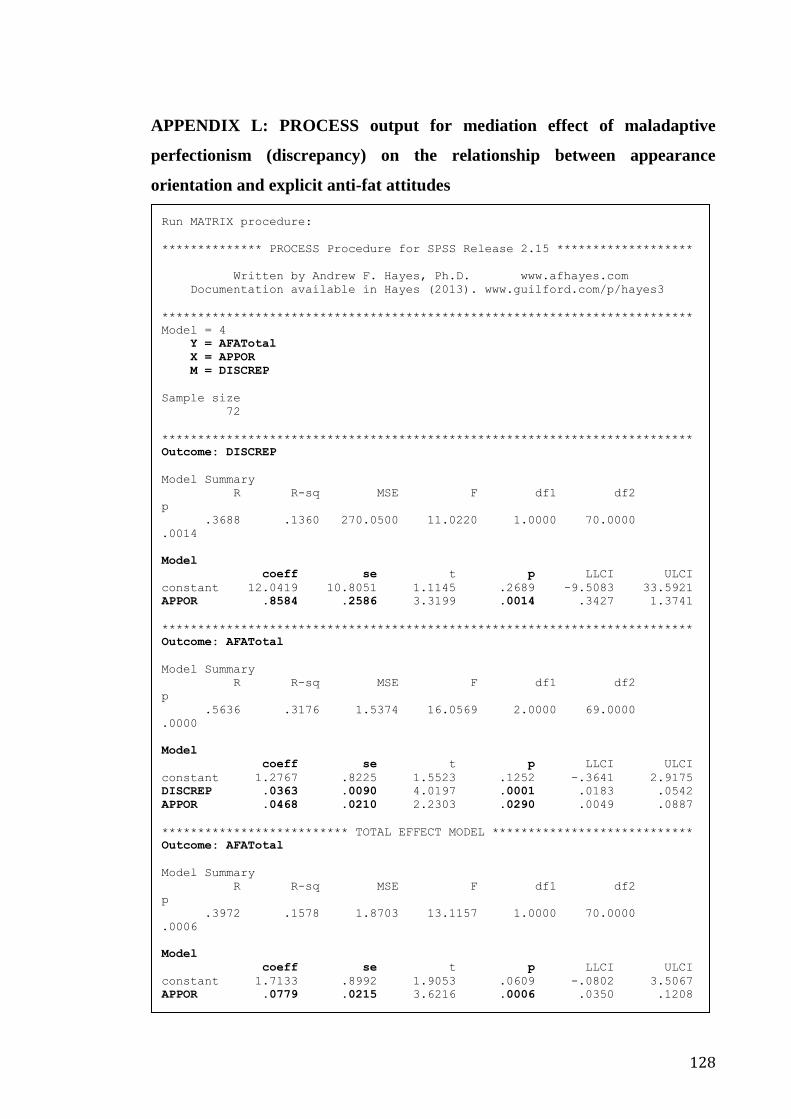
128
APPENDIX L: PROCESS output for mediation effect of maladaptive
perfectionism (discrepancy) on the relationship between appearance
orientation and explicit anti-fat attitudes
Run MATRIX procedure:
************** PROCESS Procedure for SPSS Release 2.15 *******************
Written by Andrew F. Hayes, Ph.D. www.afhayes.com
Documentation available in Hayes (2013). www.guilford.com/p/hayes3
**************************************************************************
Model = 4
Y = AFATotal
X = APPOR
M = DISCREP
Sample size
72
**************************************************************************
Outcome: DISCREP
Model Summary
R R-sq MSE F df1 df2
p
.3688 .1360 270.0500 11.0220 1.0000 70.0000
.0014
Model
coeff se t p LLCI ULCI
constant 12.0419 10.8051 1.1145 .2689 -9.5083 33.5921
APPOR .8584 .2586 3.3199 .0014 .3427 1.3741
**************************************************************************
Outcome: AFATotal
Model Summary
R R-sq MSE F df1 df2
p
.5636 .3176 1.5374 16.0569 2.0000 69.0000
.0000
Model
coeff se t p LLCI ULCI
constant 1.2767 .8225 1.5523 .1252 -.3641 2.9175
DISCREP .0363 .0090 4.0197 .0001 .0183 .0542
APPOR .0468 .0210 2.2303 .0290 .0049 .0887
************************** TOTAL EFFECT MODEL ****************************
Outcome: AFATotal
Model Summary
R R-sq MSE F df1 df2
p
.3972 .1578 1.8703 13.1157 1.0000 70.0000
.0006
Model
coeff se t p LLCI ULCI
constant 1.7133 .8992 1.9053 .0609 -.0802 3.5067
APPOR .0779 .0215 3.6216 .0006 .0350 .1208

129
***************** TOTAL, DIRECT, AND INDIRECT EFFECTS ********************
Total effect of X on Y
Effect SE t p LLCI ULCI
.0779 .0215 3.6216 .0006 .0350 .1208
Direct effect of X on Y
Effect SE t p LLCI ULCI
.0468 .0210 2.2303 .0290 .0049 .0887
Indirect effect of X on Y
Effect Boot SE BootLLCI BootULCI
DISCREP .0311 .0123 .0122 .0621
Partially standardized indirect effect of X on Y
Effect Boot SE BootLLCI BootULCI
DISCREP .0210 .0080 .0080 .0393
Completely standardized indirect effect of X on Y
Effect Boot SE BootLLCI BootULCI
DISCREP .1586 .0604 .0610 .3038
Ratio of indirect to total effect of X on Y
Effect Boot SE BootLLCI BootULCI
DISCREP .3993 .2303 .1428 1.0242
Ratio of indirect to direct effect of X on Y
Effect Boot SE BootLLCI BootULCI
DISCREP .6648 12.8097 .1415 8.4677
R-squared mediation effect size (R-sq_med)
Effect Boot SE BootLLCI BootULCI
DISCREP .1086 .0464 .0349 .2217
Preacher and Kelley (2011) Kappa-squared
Effect Boot SE BootLLCI BootULCI
DISCREP .1622 .0588 .0636 .2987
Normal theory tests for indirect effect
Effect se Z p
.0311 .0124 2.5139 .0119
******************** ANALYSIS NOTES AND WARNINGS *************************
Number of bootstrap samples for bias corrected bootstrap confidence
intervals:
5000
Level of confidence for all confidence intervals in output:
95.00
------ END MATRIX -----
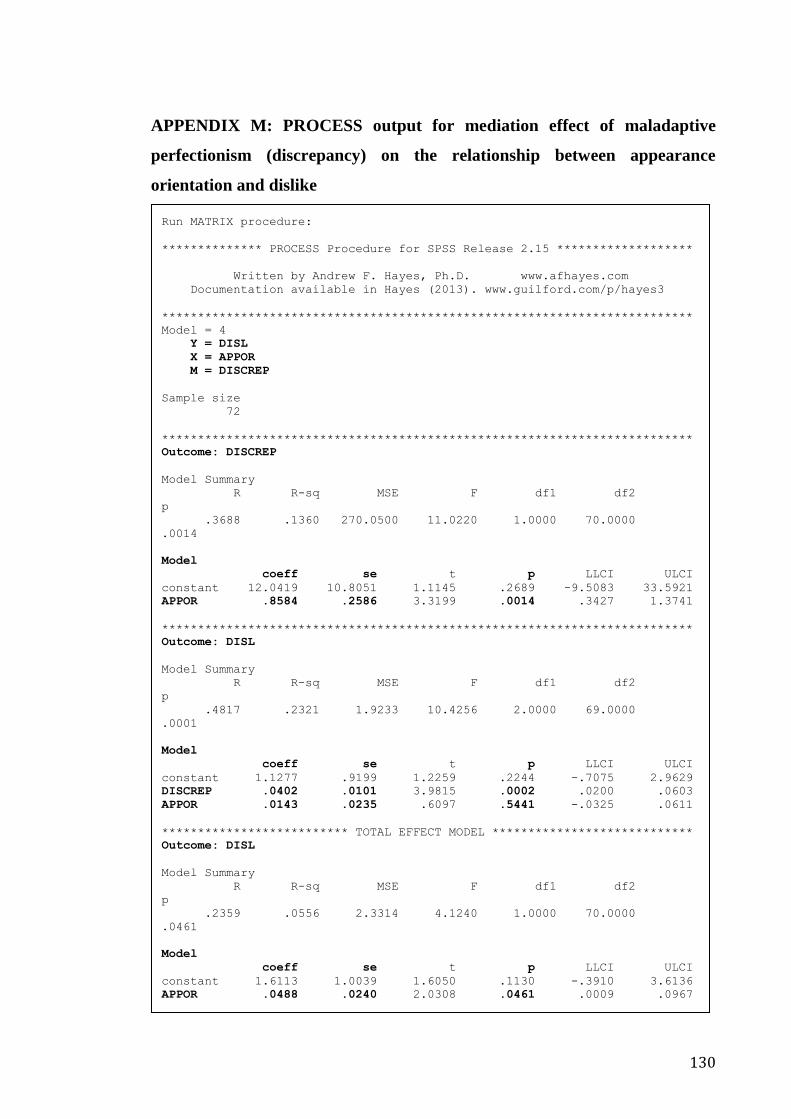
130
APPENDIX M: PROCESS output for mediation effect of maladaptive
perfectionism (discrepancy) on the relationship between appearance
orientation and dislike
Run MATRIX procedure:
************** PROCESS Procedure for SPSS Release 2.15 *******************
Written by Andrew F. Hayes, Ph.D. www.afhayes.com
Documentation available in Hayes (2013). www.guilford.com/p/hayes3
**************************************************************************
Model = 4
Y = DISL
X = APPOR
M = DISCREP
Sample size
72
**************************************************************************
Outcome: DISCREP
Model Summary
R R-sq MSE F df1 df2
p
.3688 .1360 270.0500 11.0220 1.0000 70.0000
.0014
Model
coeff se t p LLCI ULCI
constant 12.0419 10.8051 1.1145 .2689 -9.5083 33.5921
APPOR .8584 .2586 3.3199 .0014 .3427 1.3741
**************************************************************************
Outcome: DISL
Model Summary
R R-sq MSE F df1 df2
p
.4817 .2321 1.9233 10.4256 2.0000 69.0000
.0001
Model
coeff se t p LLCI ULCI
constant 1.1277 .9199 1.2259 .2244 -.7075 2.9629
DISCREP .0402 .0101 3.9815 .0002 .0200 .0603
APPOR .0143 .0235 .6097 .5441 -.0325 .0611
************************** TOTAL EFFECT MODEL ****************************
Outcome: DISL
Model Summary
R R-sq MSE F df1 df2
p
.2359 .0556 2.3314 4.1240 1.0000 70.0000
.0461
Model
coeff se t p LLCI ULCI
constant 1.6113 1.0039 1.6050 .1130 -.3910 3.6136
APPOR .0488 .0240 2.0308 .0461 .0009 .0967
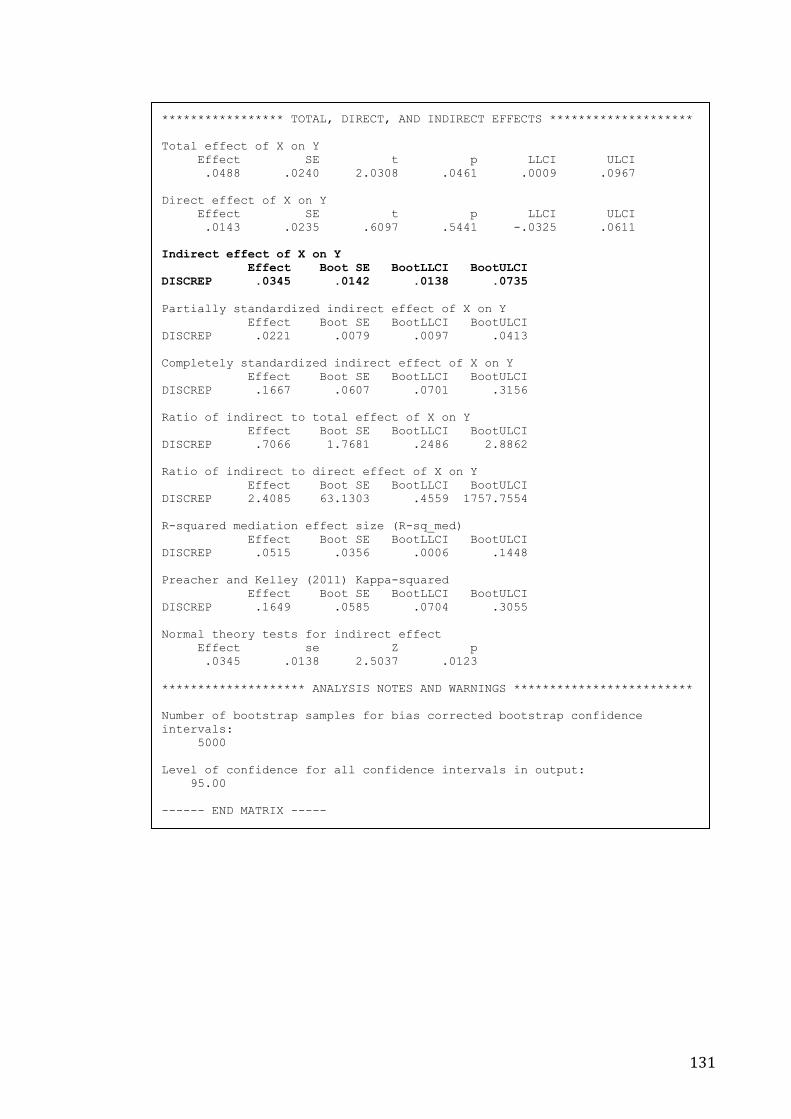
131
***************** TOTAL, DIRECT, AND INDIRECT EFFECTS ********************
Total effect of X on Y
Effect SE t p LLCI ULCI
.0488 .0240 2.0308 .0461 .0009 .0967
Direct effect of X on Y
Effect SE t p LLCI ULCI
.0143 .0235 .6097 .5441 -.0325 .0611
Indirect effect of X on Y
Effect Boot SE BootLLCI BootULCI
DISCREP .0345 .0142 .0138 .0735
Partially standardized indirect effect of X on Y
Effect Boot SE BootLLCI BootULCI
DISCREP .0221 .0079 .0097 .0413
Completely standardized indirect effect of X on Y
Effect Boot SE BootLLCI BootULCI
DISCREP .1667 .0607 .0701 .3156
Ratio of indirect to total effect of X on Y
Effect Boot SE BootLLCI BootULCI
DISCREP .7066 1.7681 .2486 2.8862
Ratio of indirect to direct effect of X on Y
Effect Boot SE BootLLCI BootULCI
DISCREP 2.4085 63.1303 .4559 1757.7554
R-squared mediation effect size (R-sq_med)
Effect Boot SE BootLLCI BootULCI
DISCREP .0515 .0356 .0006 .1448
Preacher and Kelley (2011) Kappa-squared
Effect Boot SE BootLLCI BootULCI
DISCREP .1649 .0585 .0704 .3055
Normal theory tests for indirect effect
Effect se Z p
.0345 .0138 2.5037 .0123
******************** ANALYSIS NOTES AND WARNINGS *************************
Number of bootstrap samples for bias corrected bootstrap confidence
intervals:
5000
Level of confidence for all confidence intervals in output:
95.00
------ END MATRIX -----

132
APPENDIX N: PROCESS output for mediation effect of maladaptive
perfectionism (discrepancy) on the relationship between appearance
orientation and fear
Run MATRIX procedure:
************** PROCESS Procedure for SPSS Release 2.15 *******************
Written by Andrew F. Hayes, Ph.D. www.afhayes.com
Documentation available in Hayes (2013). www.guilford.com/p/hayes3
**************************************************************************
Model = 4
Y = FEAR
X = APPOR
M = DISCREP
Sample size
72
**************************************************************************
Outcome: DISCREP
Model Summary
R R-sq MSE F df1 df2
p
.3688 .1360 270.0500 11.0220 1.0000 70.0000
.0014
Model
coeff se t p LLCI ULCI
constant 12.0419 10.8051 1.1145 .2689 -9.5083 33.5921
APPOR .8584 .2586 3.3199 .0014 .3427 1.3741
**************************************************************************
Outcome: FEAR
Model Summary
R R-sq MSE F df1 df2
p
.5723 .3276 3.6773 16.8056 2.0000 69.0000
.0000
Model
coeff se t p LLCI ULCI
constant -.7360 1.2720 -.5786 .5647 -3.2736 1.8016
DISCREP .0501 .0139 3.5956 .0006 .0223 .0780
APPOR .0942 .0325 2.9011 .0050 .0294 .1589
************************** TOTAL EFFECT MODEL ****************************
Outcome: FEAR
Model Summary
R R-sq MSE F df1 df2
p
.4490 .2016 4.3039 17.6719 1.0000 70.0000
.0001
Model
coeff se t p LLCI ULCI
constant -.1321 1.3641 -.0969 .9231 -2.8527 2.5884
APPOR .1372 .0326 4.2038 .0001 .0721 .2023
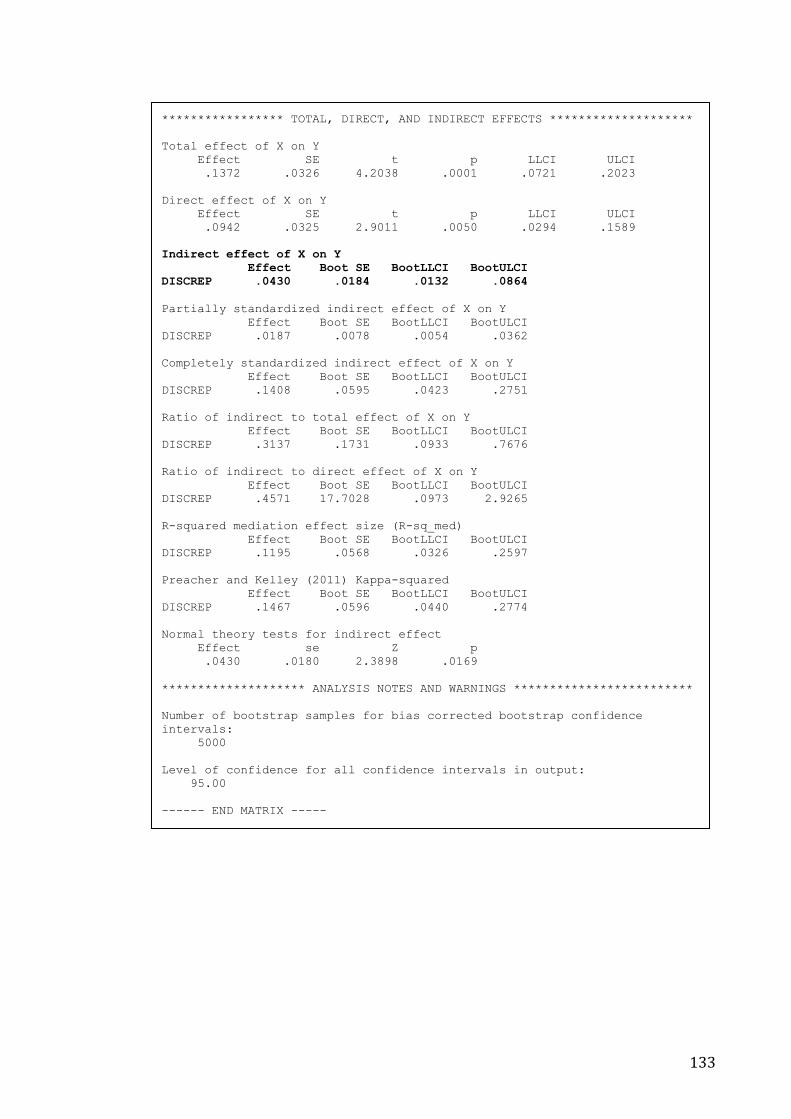
133
***************** TOTAL, DIRECT, AND INDIRECT EFFECTS ********************
Total effect of X on Y
Effect SE t p LLCI ULCI
.1372 .0326 4.2038 .0001 .0721 .2023
Direct effect of X on Y
Effect SE t p LLCI ULCI
.0942 .0325 2.9011 .0050 .0294 .1589
Indirect effect of X on Y
Effect Boot SE BootLLCI BootULCI
DISCREP .0430 .0184 .0132 .0864
Partially standardized indirect effect of X on Y
Effect Boot SE BootLLCI BootULCI
DISCREP .0187 .0078 .0054 .0362
Completely standardized indirect effect of X on Y
Effect Boot SE BootLLCI BootULCI
DISCREP .1408 .0595 .0423 .2751
Ratio of indirect to total effect of X on Y
Effect Boot SE BootLLCI BootULCI
DISCREP .3137 .1731 .0933 .7676
Ratio of indirect to direct effect of X on Y
Effect Boot SE BootLLCI BootULCI
DISCREP .4571 17.7028 .0973 2.9265
R-squared mediation effect size (R-sq_med)
Effect Boot SE BootLLCI BootULCI
DISCREP .1195 .0568 .0326 .2597
Preacher and Kelley (2011) Kappa-squared
Effect Boot SE BootLLCI BootULCI
DISCREP .1467 .0596 .0440 .2774
Normal theory tests for indirect effect
Effect se Z p
.0430 .0180 2.3898 .0169
******************** ANALYSIS NOTES AND WARNINGS *************************
Number of bootstrap samples for bias corrected bootstrap confidence
intervals:
5000
Level of confidence for all confidence intervals in output:
95.00
------ END MATRIX -----
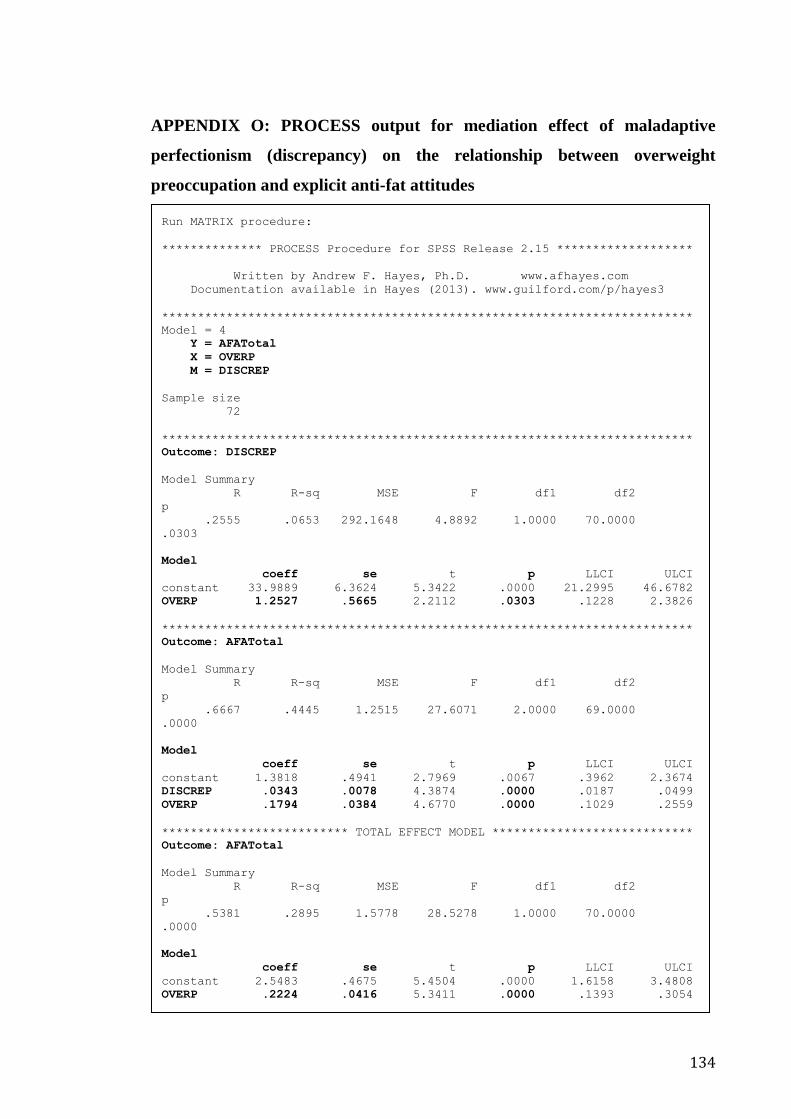
134
APPENDIX O: PROCESS output for mediation effect of maladaptive
perfectionism (discrepancy) on the relationship between overweight
preoccupation and explicit anti-fat attitudes
Run MATRIX procedure:
************** PROCESS Procedure for SPSS Release 2.15 *******************
Written by Andrew F. Hayes, Ph.D. www.afhayes.com
Documentation available in Hayes (2013). www.guilford.com/p/hayes3
**************************************************************************
Model = 4
Y = AFATotal
X = OVERP
M = DISCREP
Sample size
72
**************************************************************************
Outcome: DISCREP
Model Summary
R R-sq MSE F df1 df2
p
.2555 .0653 292.1648 4.8892 1.0000 70.0000
.0303
Model
coeff se t p LLCI ULCI
constant 33.9889 6.3624 5.3422 .0000 21.2995 46.6782
OVERP 1.2527 .5665 2.2112 .0303 .1228 2.3826
**************************************************************************
Outcome: AFATotal
Model Summary
R R-sq MSE F df1 df2
p
.6667 .4445 1.2515 27.6071 2.0000 69.0000
.0000
Model
coeff se t p LLCI ULCI
constant 1.3818 .4941 2.7969 .0067 .3962 2.3674
DISCREP .0343 .0078 4.3874 .0000 .0187 .0499
OVERP .1794 .0384 4.6770 .0000 .1029 .2559
************************** TOTAL EFFECT MODEL ****************************
Outcome: AFATotal
Model Summary
R R-sq MSE F df1 df2
p
.5381 .2895 1.5778 28.5278 1.0000 70.0000
.0000
Model
coeff se t p LLCI ULCI
constant 2.5483 .4675 5.4504 .0000 1.6158 3.4808
OVERP .2224 .0416 5.3411 .0000 .1393 .3054

135
***************** TOTAL, DIRECT, AND INDIRECT EFFECTS ********************
Total effect of X on Y
Effect SE t p LLCI ULCI
.2224 .0416 5.3411 .0000 .1393 .3054
Direct effect of X on Y
Effect SE t p LLCI ULCI
.1794 .0384 4.6770 .0000 .1029 .2559
Indirect effect of X on Y
Effect Boot SE BootLLCI BootULCI
DISCREP .0430 .0216 .0098 .1000
Partially standardized indirect effect of X on Y
Effect Boot SE BootLLCI BootULCI
DISCREP .0291 .0141 .0065 .0647
Completely standardized indirect effect of X on Y
Effect Boot SE BootLLCI BootULCI
DISCREP .1040 .0498 .0239 .2277
Ratio of indirect to total effect of X on Y
Effect Boot SE BootLLCI BootULCI
DISCREP .1933 .0975 .0460 .4533
Ratio of indirect to direct effect of X on Y
Effect Boot SE BootLLCI BootULCI
DISCREP .2397 .1731 .0482 .8292
R-squared mediation effect size (R-sq_med)
Effect Boot SE BootLLCI BootULCI
DISCREP .1134 .0583 .0174 .2496
Preacher and Kelley (2011) Kappa-squared
Effect Boot SE BootLLCI BootULCI
DISCREP .1194 .0532 .0278 .2423
Normal theory tests for indirect effect
Effect se Z p
.0430 .0222 1.9349 .0530
******************** ANALYSIS NOTES AND WARNINGS *************************
Number of bootstrap samples for bias corrected bootstrap confidence
intervals:
5000
Level of confidence for all confidence intervals in output:
95.00
------ END MATRIX -----

136
APPENDIX P: PROCESS output for mediation effect of maladaptive
perfectionism (discrepancy) on the relationship between overweight
preoccupation and fear
Run MATRIX procedure:
************** PROCESS Procedure for SPSS Release 2.15 *******************
Written by Andrew F. Hayes, Ph.D. www.afhayes.com
Documentation available in Hayes (2013). www.guilford.com/p/hayes3
**************************************************************************
Model = 4
Y = FEAR
X = OVERP
M = DISCREP
Sample size
72
**************************************************************************
Outcome: DISCREP
Model Summary
R R-sq MSE F df1 df2
p
.2555 .0653 292.1648 4.8892 1.0000 70.0000
.0303
Model
coeff se t p LLCI ULCI
constant 33.9889 6.3624 5.3422 .0000 21.2995 46.6782
OVERP 1.2527 .5665 2.2112 .0303 .1228 2.3826
**************************************************************************
Outcome: FEAR
Model Summary
R R-sq MSE F df1 df2
p
.8167 .6670 1.8209 69.1092 2.0000 69.0000
.0000
Model
coeff se t p LLCI ULCI
constant -1.1098 .5959 -1.8622 .0668 -2.2987 .0791
DISCREP .0425 .0094 4.5084 .0000 .0237 .0614
OVERP .4323 .0463 9.3455 .0000 .3400 .5246
************************** TOTAL EFFECT MODEL ****************************
Outcome: FEAR
Model Summary
R R-sq MSE F df1 df2
p
.7543 .5689 2.3236 92.3872 1.0000 70.0000
.0000
Model
coeff se t p LLCI ULCI
constant .3361 .5674 .5924 .5555 -.7955 1.4678
OVERP .4856 .0505 9.6118 .0000 .3849 .5864
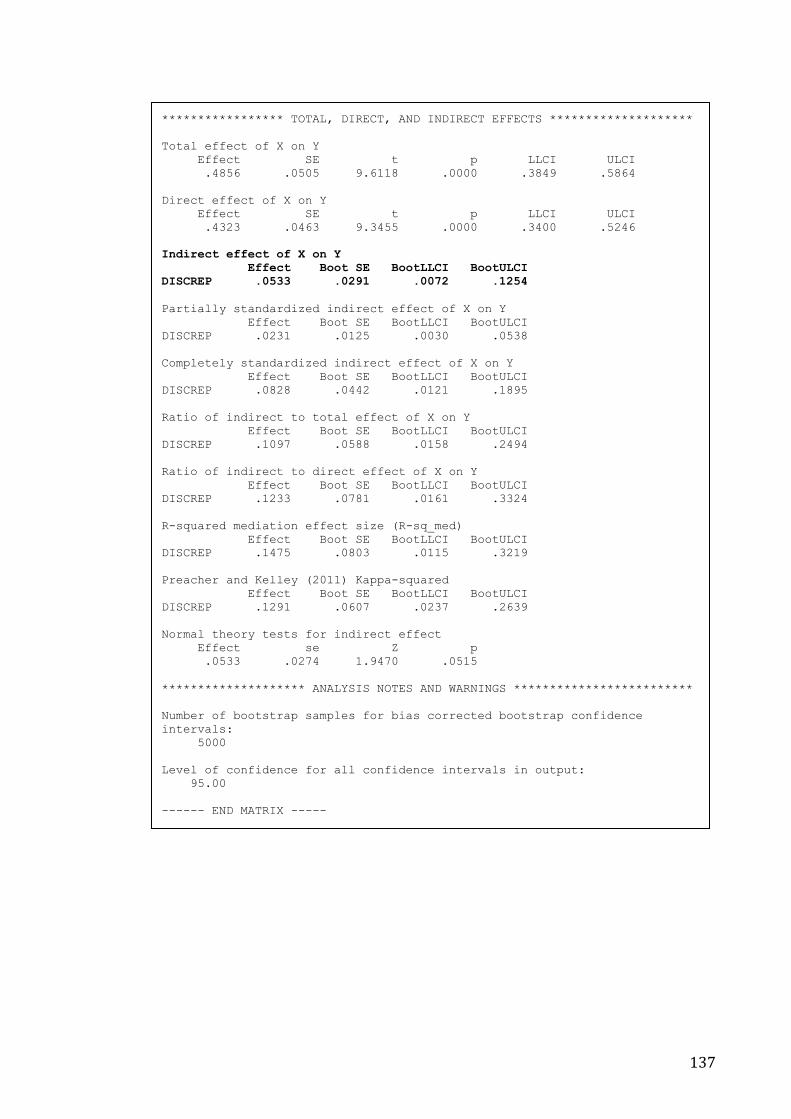
137
***************** TOTAL, DIRECT, AND INDIRECT EFFECTS ********************
Total effect of X on Y
Effect SE t p LLCI ULCI
.4856 .0505 9.6118 .0000 .3849 .5864
Direct effect of X on Y
Effect SE t p LLCI ULCI
.4323 .0463 9.3455 .0000 .3400 .5246
Indirect effect of X on Y
Effect Boot SE BootLLCI BootULCI
DISCREP .0533 .0291 .0072 .1254
Partially standardized indirect effect of X on Y
Effect Boot SE BootLLCI BootULCI
DISCREP .0231 .0125 .0030 .0538
Completely standardized indirect effect of X on Y
Effect Boot SE BootLLCI BootULCI
DISCREP .0828 .0442 .0121 .1895
Ratio of indirect to total effect of X on Y
Effect Boot SE BootLLCI BootULCI
DISCREP .1097 .0588 .0158 .2494
Ratio of indirect to direct effect of X on Y
Effect Boot SE BootLLCI BootULCI
DISCREP .1233 .0781 .0161 .3324
R-squared mediation effect size (R-sq_med)
Effect Boot SE BootLLCI BootULCI
DISCREP .1475 .0803 .0115 .3219
Preacher and Kelley (2011) Kappa-squared
Effect Boot SE BootLLCI BootULCI
DISCREP .1291 .0607 .0237 .2639
Normal theory tests for indirect effect
Effect se Z p
.0533 .0274 1.9470 .0515
******************** ANALYSIS NOTES AND WARNINGS *************************
Number of bootstrap samples for bias corrected bootstrap confidence
intervals:
5000
Level of confidence for all confidence intervals in output:
95.00
------ END MATRIX -----