examining our assumptions- · even in competent rock selected for predictable mechanical...
TRANSCRIPT

1
Primary funding is provided by
The SPE Foundation through member donations and a contribution from Offshore Europe
The Society is grateful to those companies that allow their professionals to serve as lecturers
Additional support provided by AIME
Society of Petroleum Engineers
Distinguished Lecturer Programwww.spe.org/dl
Society of Petroleum Engineers
Distinguished Lecturer Programwww.spe.org/dl
Examining Our Assumptions-
Have Oversimplifications Jeopardized Our
Ability to Design Optimal Fracture
Treatments?
Mike [email protected]
Portions published in
SPE 119143 & 128612
2
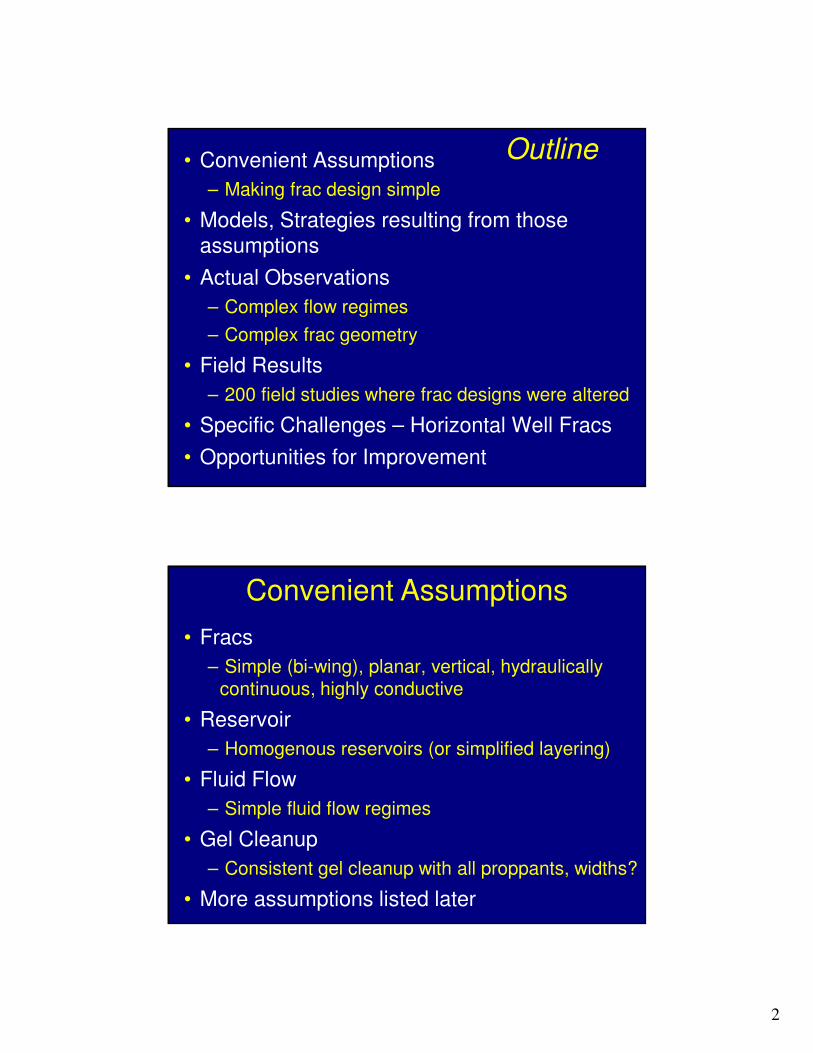
• Convenient Assumptions
– Making frac design simple
• Models, Strategies resulting from those
assumptions
• Actual Observations
– Complex flow regimes
– Complex frac geometry
• Field Results
– 200 field studies where frac designs were altered
• Specific Challenges – Horizontal Well Fracs
• Opportunities for Improvement
Outline
• Fracs
– Simple (bi-wing), planar, vertical, hydraulically continuous, highly conductive
• Reservoir
– Homogenous reservoirs (or simplified layering)
• Fluid Flow
– Simple fluid flow regimes
• Gel Cleanup
– Consistent gel cleanup with all proppants, widths?
• More assumptions listed later
Convenient Assumptions

3
Why Fracture Stimulate?
Top View
Side View
Unstimulated Wells:
Require high reservoir
permeability for sufficient
hydrocarbon flow
Hydraulic Fractures:
Accumulate hydrocarbons
over enormous area,
achieving economic
flowrates from low
permeability formations
Figures not to scale!
Some operators have placed 28 stages with 3 perf clusters per stage.
Initiate 80 transverse fracs?!
High gas velocity!Tremendous pressure drop
SPE 128612
Increased Reservoir Contact –
Multiple Transverse Fracs

4
• Adequate reservoir contact (frac length)
• Adequate flow capacity (conductivity)
Design Goals
for Simple, Planar Fracture
7
Simple approach to optimize length and
conductivity
Dimensionless Fracture Conductivity (FCD) a ratio of the flow capacity of the fracture
and the formation
kf * wf
kf
wfkform
xf
kform * xfFCD =
8

5
0.1 0.2 0.5 1 2 5 10 20 50 1000.01
0.02
0.03
0.05
0.1
0.2
0.3
0.5
1
Fcd = (Kp)(Wf) / (Xf)(Kf)
rw' /
Xf
Prats, M.: "Effect of Vertical Fractures on Reservoir Behavior-Incompressible Fluid Case," paper SPE 1575-G
Fcd = (Kf)(Wf) / (Xf)(Kform)
Fra
ctu
re E
ffe
ctive
ne
ss
Conductivity Ratio
Common Fcd target
Analytic Solution to Optimize Simplistic Frac
Assumptions:
•Simple, planar, vertical fracs
•Similar flow regime in frac and reservoir
•Consistent wellbore/frac connectivity
Gridded Numerical Simulation
SPE 110093
Even sophisticated 3d models frequently
presume planar fracs with hydraulic continuity
10 SPE 124843

6
Intuitive (but faulty) “proof” that fracs are infinitely conductive
If my formation
looks like this...
Doesn’t this provide
infinite
conductivity?
Proppant thin section courtesy of Stim-Lab11
• Analytic Solutions, Numerical Models and
Intuition
• Generally presume
– simplistic flow,
– simplistic geometry,
– perfect wellbore-to-fracture communication,
– hydraulic continuity throughout frac
Common Assumptions
12
7
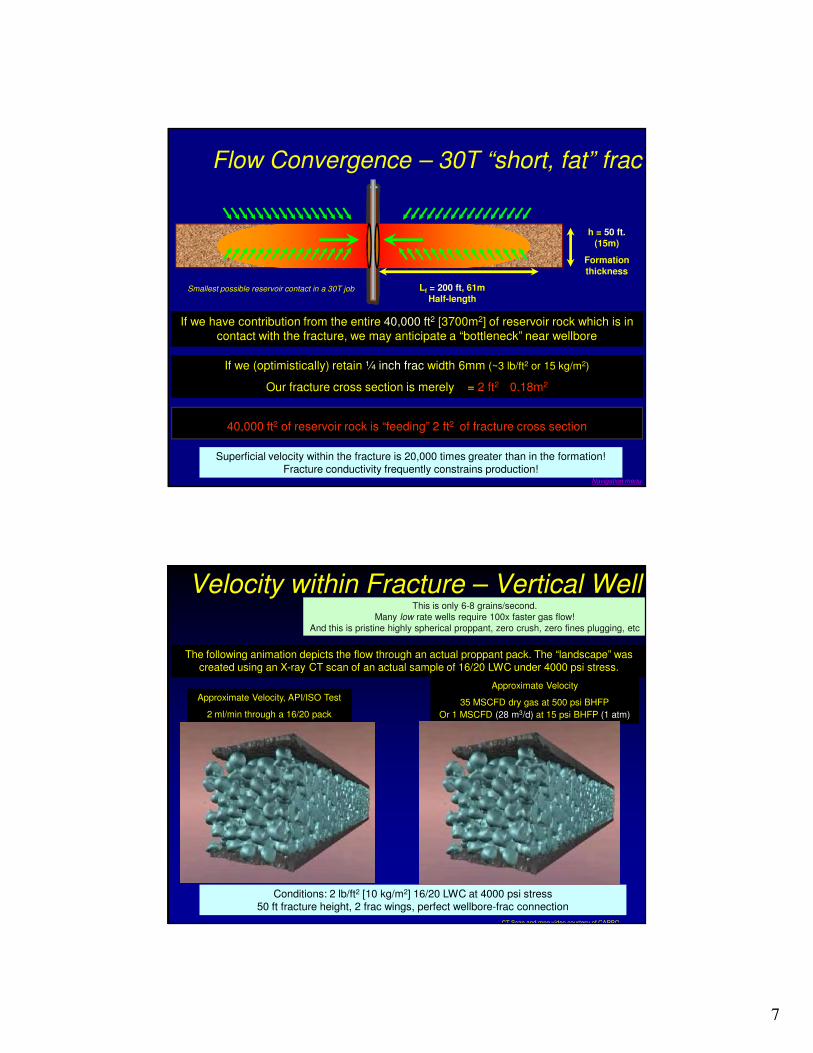
Flow Convergence – 30T “short, fat” frac
If we have contribution from the entire 40,000 ft2 [3700m2] of reservoir rock which is in
contact with the fracture, we may anticipate a “bottleneck” near wellbore
If we (optimistically) retain ¼ inch frac width 6mm (~3 lb/ft2 or 15 kg/m2)
Our fracture cross section is merely = 2 ft2 0.18m2
40,000 ft2 of reservoir rock is “feeding” 2 ft2 of fracture cross section
Superficial velocity within the fracture is 20,000 times greater than in the formation!Fracture conductivity frequently constrains production!
h = 50 ft.
(15m)
Formation
thickness
Lf = 200 ft, 61m
Half-lengthSmallest possible reservoir contact in a 30T job
Navigation menu
Velocity within Fracture – Vertical Well
Conditions: 2 lb/ft2 [10 kg/m2] 16/20 LWC at 4000 psi stress50 ft fracture height, 2 frac wings, perfect wellbore-frac connection
The following animation depicts the flow through an actual proppant pack. The “landscape” was created using an X-ray CT scan of an actual sample of 16/20 LWC under 4000 psi stress.
Approximate Velocity, API/ISO Test
2 ml/min through a 16/20 pack
Approximate Velocity
35 MSCFD dry gas at 500 psi BHFP
Or 1 MSCFD (28 m3/d) at 15 psi BHFP (1 atm)
This is only 6-8 grains/second.
Many low rate wells require 100x faster gas flow!
And this is pristine highly spherical proppant, zero crush, zero fines plugging, etc
CT Scan and mpg video courtesy of CARBO
8
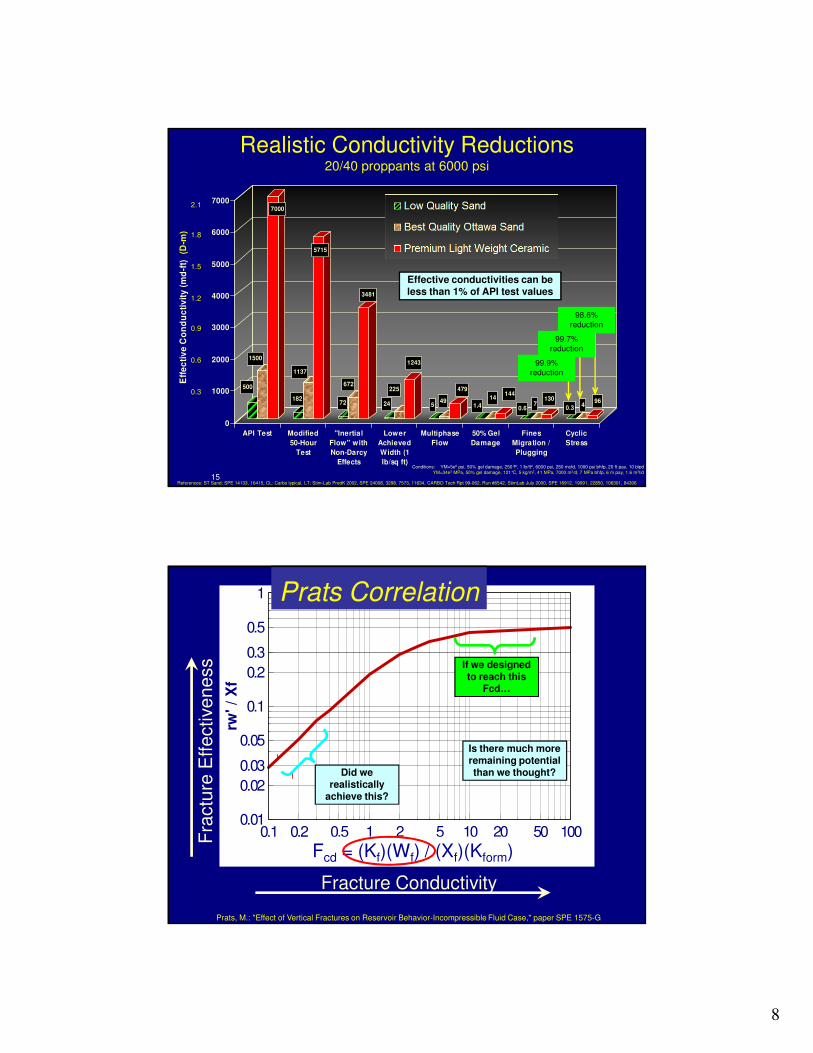
500
1500
7000
182
1137
5715
72
672
3481
24
225
1243
549
479
1.4
14144
0.67
130
0.3 496
0
1000
2000
3000
4000
5000
6000
7000
Eff
ec
tiv
e C
on
du
cti
vit
y (
md
-ft)
(D
-m)
API Test Modified
50-Hour
Test
"Inertial
Flow" with
Non-Darcy
Effects
Lower
Achieved
Width (1
lb/sq ft)
Multiphase
Flow
50% Gel
Damage
Fines
Migration /
Plugging
Cyclic
Stress
Chinese Sand
Jordan Sand
CarboLITE
Realistic Conductivity Reductions 20/40 proppants at 6000 psi
0.3
0.6
0.9
1.2
2.1
1.5
1.8
0.0001 D-m
0.001 D-m
0.029 D-m
Conditions: YM=5e6 psi, 50% gel damage, 250°F, 1 lb/ft2, 6000 psi, 250 mcfd, 1000 psi bhfp, 20 ft pay, 10 blpd
YM=34e3 MPa, 50% gel damage, 121°C, 5 kg/m2, 41 MPa, 7000 m3/d, 7 MPa bhfp, 6 m pay, 1.6 m3l/d
References: ST Sand: SPE 14133, 16415, CL: Carbo typical, LT: Stim-Lab PredK 2002, SPE 24008, 3298, 7573, 11634, CARBO Tech Rpt 99-062, Run #6542, StimLab July 2000, SPE 16912, 19091, 22850, 106301, 84306
Effective conductivities can be less than 1% of API test values
99.9%
reduction
99.7%
reduction
98.6%
reduction
15
0.1 0.2 0.5 1 2 5 10 20 50 1000.01
0.02
0.03
0.05
0.1
0.2
0.3
0.5
1
Fcd = (Kp)(Wf) / (Xf)(Kf)
rw' /
Xf
Prats Correlation
Prats, M.: "Effect of Vertical Fractures on Reservoir Behavior-Incompressible Fluid Case," paper SPE 1575-G
Fcd = (Kf)(Wf) / (Xf)(Kform)
Fra
ctu
re E
ffe
ctive
ne
ss
Fracture Conductivity
If we designed to reach this
Fcd…
Did we realistically
achieve this?
Is there much more remaining potential than we thought?

9
Off by 100-fold?!
• Even in simple, continuous, planar fracs
–Even if we carefully arrange proppant with perfectly uniform distribution, with lab-grade fluids, perfect breakers, limit test to 50 hours, etc.
• Pressure losses are generally 50 to 1000 times higher than suggested by advertised data
• Concern #1
Flow regimes are complex within propped fracs –oversimplifications may mislead us.
17
SPE 128612
Is our frac geometry assumption valid?
18
Do we envision these
proportions?
Fracs are very narrow
ribbons, massively long!

10
Pollard (2005) Northeast Ship Rock Dike, New Mexico19
Relatively simple, extremely wide fracture
Extends 9500 feet at surface, average width
exceeding 7 feet!
Pollard (2005) Northeast Ship Rock Dike20
Outcrop actually comprised of >30 discrete
echelon segments separated by intact host rock

11
• Mineback studies
– 22 CBM minebacks in 6 states; dozens in Australia
• Surprising complexity, gel residue, discontinuous
proppant
– Less apparent conductivity than predicted by models
References: Bureau of Mines Rpt 9083, Diamond and Oyler, SPE 22395, Diamond CBM Symposium 11/87, Lambert OGJ 10/9/89, SPE 15258. Dozens in Australia (Jeffrey 124919, 28079,
119351, 63031)
Are Hydraulic Fracs Simple Planes?
21
Top View
Even in competent rock selected for predictable mechanical properties…
• 6 perforations on lower side of hole (plus 6 on top)
• 5 separate fractures initiated from the 6 lower perforations
Warpinski, Sandia Labs. Nevada Test Site, Hydraulic Fracture Mineback22
12
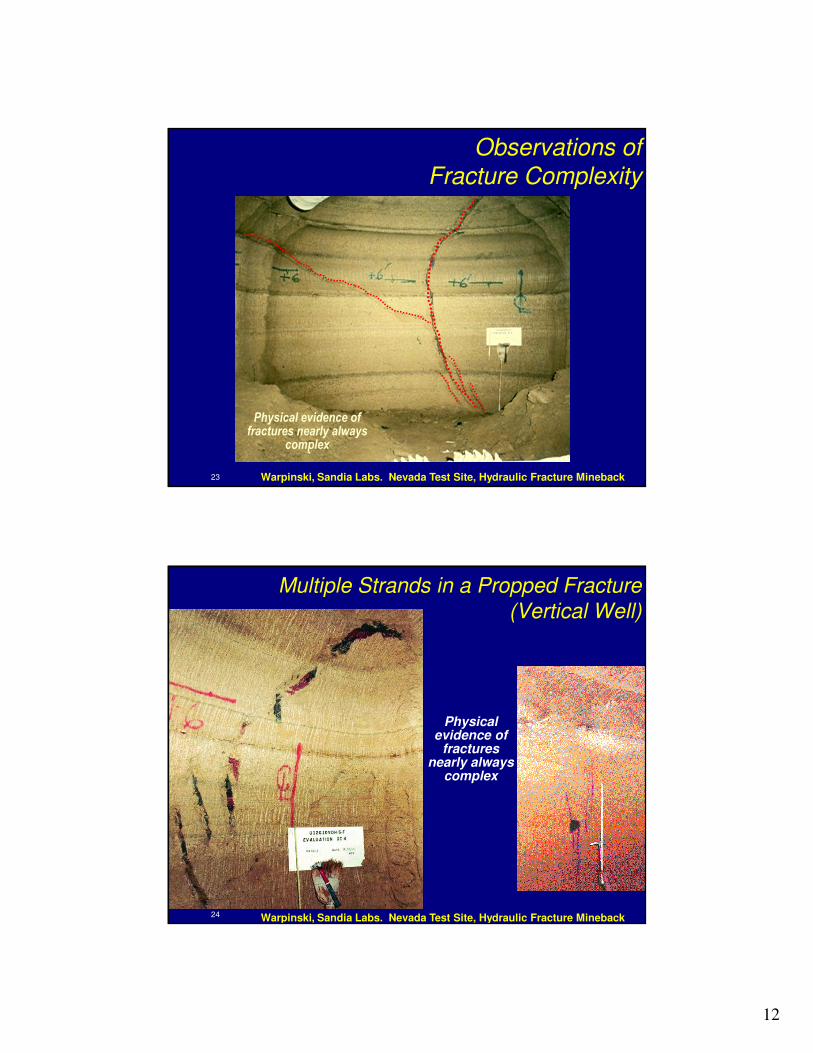
Warpinski, Sandia Labs. Nevada Test Site, Hydraulic Fracture Mineback
Observations of
Fracture Complexity
Physical evidence of fractures nearly always
complex
23
Physical evidence of
fractures nearly always
complex
Multiple Strands in a Propped Fracture
(Vertical Well)
Warpinski, Sandia Labs. Nevada Test Site, Hydraulic Fracture Mineback24

13
Mesaverde MWX test, SPE 22876
Physical evidence of fractures nearly always
complex
Multiple Strands in a Propped Fracture(Vertical Well)
� 7100 ft TVD [2160m]
� 32 Fracture Strands Over 4 Ft Interval
� HPG gel residue on all surfaces
� Gel glued some core together (>6 yrs elapsed post-frac!)
� All observed frac sand (20/40 RCS) pulverized <200 mesh
� A second fractured zone with 8 vertical fractures in 3 ft interval observed 60 feet away (horizontally)25
Physical evidence of fractures nearly always complex
NEVADA TEST SITEHYDRAULIC FRACTURE
MINEBACK
Vertical Complexity
Due To Joints
26

14
Woodford Shale OutcropSome reservoirs
pose challenges to
effectively breach
and prop through all
laminations
Navigation menuPhoto Courtesy of Halliburton
Is complexity solely attributed to “rock fabric”?
Many other examples! [TerraTek, Baker, Weijers, CSM FAST consortium]
Unconsolidated 200 mesh sand, 35 lb XLG,Flow � SPE 63233
Chudnovsky, Univ of Ill, Chicago
28

15
-2000
-1800
-1600
-1400
-1200
-1000
-800
-600
-400
-200
0
200
400
600
800
1000
1200
1400
1600
1800
2000
2200
2400
2600
2800
3000
-3500
-3300
-3100
-2900
-2700
-2500
-2300
-2100
-1900
-1700
-1500
-1300
-1100
-900
-700
-500
-300
-100
100
300
500
700
900
1100
1300
1500
West-East (ft)
So
uth
-No
rth
(ft
)
1st Stage 2nd Stage
Observation Well
Treatment Well
3000’ x 2900’
Fractures Can be Enormous Features
= First Stage Perf Clusters
= 2nd Stage Initial Perf Clusters
= Revised 2nd Stage Perf Clusters
� Box covers 9 million ft2
[~200 acre land area]
� Arguably� 10 to 100 million ft2 of
fracture surface area! [reservoir contact]
29
Complexity?
• Concern #2
On every scale that we investigate, fractures
are more complex than the simplified frac
geometry we presume in our models
30

16
Does this degree of complexity matter?
• Interesting industry dialogue
– Are these examples anomalous or “worst case”?
– Do we need any more precise info for fracture propagation theory?
• The concern evaluated here is not
propagation modeling, it is fluid flow and
production optimization
31
Range of Fracture Complexity
Simple Fracture Complex Fracture
Very Complex Fracture Network
Pro:
Complex fracs increase
the reservoir contact
(beneficial in nano-
Darcy shales?)
Con:
Complex fracs
complicate the flow path,
and provide less
cumulative conductivity
than simple, wider
fractures [SPE 115769]
SPE 7744132

17
Frac Optimization Implications
Simple Fracture
Reducing Reservoir
Perm by 10,000 only
reduces conductivity
requirement by 10
(k1/4)
Optimal Frac Conductivity
proportional to reservoir perm
SPE 11576933
Large Network
• Offset wells (blue)
loaded with frac fluid
• After unloading fluid,
several offset wells
permanently stimulated
by treatment!
Fractures Intersecting Offset Wellbores
-3000
-2500
-2000
-1500
-1000
-500
0
500
1000
1500
-1000 -500 0 500 1000 1500 2000 2500 3000
West-East (ft)
So
uth
-No
rth
(ft
)
Observation
Well
Barnett Shale
SPE 77441
Evidence frac’ed into offset wellsMicroseismic mapping
Slurry to surface
Increased watercut
Solid radioactive tracer (logging)
Noise in offset monitor well
Observed in
Tight sandstone (Piceance, Jonah, Cotton
Valley, Codell)
High perm sandstone (Prudhoe)
Shale (Barnett)
Dolomite (Middle Bakken)
Chalk (Dan)
Often EUR, “pulse tests” “interference
tests” fail to indicate sustained hydraulic
connectivity!34

18
Lack of Hydraulic Connection?
• Possible Explanations
– Poor gel cleanup – gel plugged regions
• But does not satisfactorily explain slickwater results
– Extremely low frac conductivity
• Probable
– Discontinuous frac – lack of hydraulic continuity
• Probable
35
Frac Width – with CrossLinked Gel
wf
Diffuse slurry
Low concentration
Diffuse slurry
Modest concentration
TSO + high concentration
We don’t envision thick
filtercakes in very tight rock,
but it doesn’t take much to
damage a narrow frac!
2 ppa [240 kg/m3] sand slurry is
about 1 part solids to 7 parts liquid.
Final frac width could be ~1/7th the
pumping width!Navigation menu

19
Uniform Packing
Arrangement?
Is this ribbon laterally
extensive and
continuous for
hundreds or
thousands of feet?
Pinch out, proppant
pillars, irregular
distribution?
37
Concern #3
• Fracs may provide imperfect hydraulic
continuity
– Vertical
– Lateral
38
20
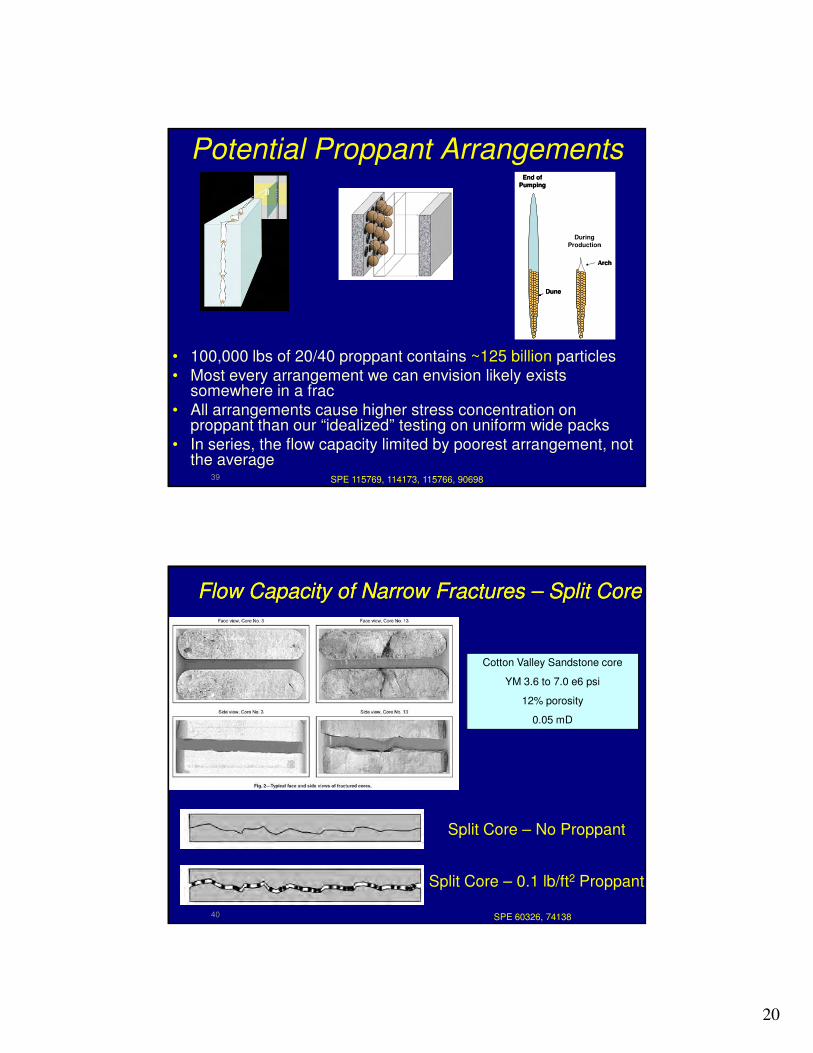
Potential Proppant ArrangementsEnd of
Pumping
During
Production
Dune
Arch
End of
Pumping
During
Production
Dune
Arch
• 100,000 lbs of 20/40 proppant contains ~125 billion particles
• Most every arrangement we can envision likely exists somewhere in a frac
• All arrangements cause higher stress concentration on proppant than our “idealized” testing on uniform wide packs
• In series, the flow capacity limited by poorest arrangement, not the average
SPE 115769, 114173, 115766, 9069839
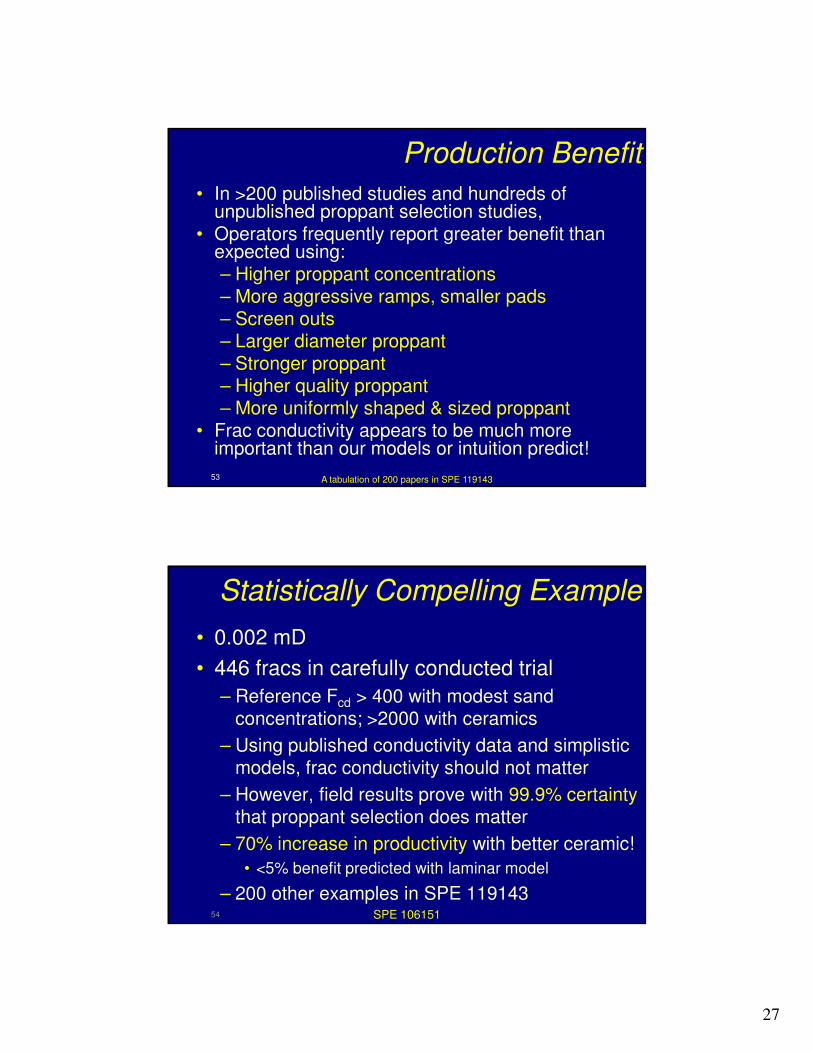
Flow Capacity of Narrow Fractures – Split Core Flow Capacity of Narrow Fractures – Split Core
Cotton Valley Sandstone core
YM 3.6 to 7.0 e6 psi
12% porosity
0.05 mD
SPE 60326, 74138
Split Core – No Proppant
Split Core – 0.1 lb/ft2 Proppant
40

21
0.1
1
10
100
1000
10000
0 2000 4000 6000 8000
Closure Stress, psi
Refe
ren
ce
Co
nd
uctivity,
md-f
t
2x to 3x
difference in flow capacity between sand
and bauxite at 4000 psi.
Large frac width [2.0 lb/ft2] between honed core2.0 lb/sq ft bauxite
2.0 lb/sq ft Jordan sand
Behavior of Proppant In Various ConcentrationsBehavior of Proppant In Various Concentrations
14 MPa 28 MPa 41 MPa
Adapted from SPE 60326, 74138, 11914341
0.1
1
10
100
1000
10000
0 2000 4000 6000 8000
Closure Stress, psi
Re
fere
nce C
on
ductivity, m
d-f
t
10x difference in
flow capacity between sand and bauxite at
4000 psi.
1.0 lb/sq ft bauxite
1.0 lb/sq ft Jordan sand
Intermediate frac width [1.0 lb/ft2] between split core
Behavior of Proppant In Various ConcentrationsBehavior of Proppant In Various Concentrations
14 MPa 28 MPa 41 MPa
Adapted from SPE 60326, 74138, 11914342

22
Behavior of Proppant In Various ConcentrationsBehavior of Proppant In Various Concentrations
14 MPa 28 MPa 41 MPa
Adapted from SPE 60326, 74138, 11914343
0.1
1
10
100
1000
10000
0 2000 4000 6000 8000
Closure Stress, psi
Re
fere
nce
Co
nd
uctivity, m
d-f
t
0.1
1
10
100
1000
10000
0 2000 4000 6000 8000
Closure Stress, psi
Re
fere
nce
Co
nd
uctivity, m
d-f
t
14 MPa 28 MPa 41 MPa
100x difference
in flow capacity between sand and bauxite at
4000 psi.
Aligned Fracture –no proppant
0.1 lb/sq ft bauxite
0.1 lb/sq ft Jordan sand
Narrow fracs [0.1 lb/ft2] between split core
Concern #4:
Proppants may not
behave as we
traditionally report
Assumptions• Flow Complexity, Frac Geometry, etc
– All challenge ability to provide adequate conductivity
• Other Omissions:– Stress concentration on irregularly distributed proppant
– Gel cleanup is more thorough in high conductivity fracs
– Wider fracs are less damaged by• Filtercake, cyclic stress, fines plugging
– Higher porosity fracs less damaged by• Filtercake, fines plugging
– All proppants degrade over time – but at different rates
– Not all proppants are thermally stable
44
Hypothesis: Conductivity may be more important than our traditional models and conventional wisdom predict

23
Field Evidence of Inefficient Fracs• Lack of competition in wells connected by frac
• Steep production declines– Surprisingly limited drainage areas often don’t
correspond to mapped fracture extent
• Infill Drilling– Often successful on surprisingly close spacing
• Well Testing– Disappointing frac lengths and/or low apparent
conductivity
• Field trials– Refrac results
– Where operators experimented with increased frac conductivity
45
Shouldn’t complexities be obvious from production data?
SPE 106151 Fig 13 – Production can be matched with a variety of fracture and reservoir parameters46
0
200
400
600
800
1000
1200
1400
1600
1800
2000
0 100 200 300 400 500 600
Production Days
Sta
ge
Pro
du
ction
(m
cfd
)
0
20
40
60
80
100
120
140
160
180
200
Cu
mu
lative
Pro
du
ction
(M
Mscf)
Actual Production Data

24
Shouldn’t complexities be obvious from production data?
SPE 106151 Fig 13 – Production can be matched with a variety of fracture and reservoir parameters47
0
200
400
600
800
1000
1200
1400
1600
1800
2000
0 100 200 300 400 500 600
Production Days
Sta
ge
Pro
du
ction
(m
cfd
)
0
20
40
60
80
100
120
140
160
180
200
Cu
mu
lative
Pro
du
ction
(M
Mscf)
Actual production data
Long Frac, Low Conductivity 500' Xf, 20 md-ft, 0.5 uD perm, 23 Acres 4:1 aspect ratio
Shouldn’t complexities be obvious from production data?
SPE 106151 Fig 13 – Production can be matched with a variety of fracture and reservoir parameters48
0
200
400
600
800
1000
1200
1400
1600
1800
2000
0 100 200 300 400 500 600
Production Days
Sta
ge
Pro
du
ction
(m
cfd
)
0
20
40
60
80
100
120
140
160
180
200
Cu
mu
lative
Pro
du
ction
(M
Mscf)
Actual production data
Long Frac, Low Conductivity
Medium Frac, Low Conductivity
500' Xf, 20 md-ft, 0.5 uD perm, 23 Acres 4:1 aspect ratio
100' Xf, 20 md-ft, 5 uD perm, 11 Acres 4:1 aspect ratio

25
Shouldn’t complexities be obvious from production data?
SPE 106151 Fig 13 – Production can be matched with a variety of fracture and reservoir parameters49
0
200
400
600
800
1000
1200
1400
1600
1800
2000
0 100 200 300 400 500 600
Production Days
Sta
ge
Pro
du
ction
(m
cfd
)
0
20
40
60
80
100
120
140
160
180
200
Cu
mu
lative
Pro
du
ction
(M
Mscf)
Actual production data
Long Frac, Low Conductivity
Medium Frac, Low Conductivity
Short Frac, High Conductivity, Reservoir Boundaries
500' Xf, 20 md-ft, 0.5 uD perm, 23 Acres 4:1 aspect ratio
100' Xf, 20 md-ft, 5 uD perm, 11 Acres 4:1 aspect ratio
50' Xf, 6000 md-ft, 10 uD perm, 7 Acres 4:1 aspect ratio
• History matching of production is surprisingly non-unique.
• Too many “knobs” available to tweak
• We can always blame it on the geology
Removing the Uncertainty
• If we require a production match of two different frac designs, we remove many degrees of freedom – lock in all the “reservoir knobs”!
– Attempt to explain the production results from initial frac AND refrac [~100 published trials]
– Require simultaneous match of two different frac designs in same reservoir! [200+ trials]
50

26
Field Studies Documenting Production Impact
with Increased Fracture Conductivity>200 published studies identified,
authored by >150 companies
SPE 119143 tabulates over 200 field studies
Oil wells, gas wells, lean and rich condensateCarbonate, Sandstone, Shale, and Coal
Well Rates Well Depths
1 to 25,000 bopd 100 to 20,000 feet0.25-100 MMSCFD
51
Dataset Limitations
• Intentional– Eliminated most field examples with dramatic fluid
rheology changes
– Are production gains attributed to proppant transport (frac length), differing gel cleanup, differing frac heights?
• Unintentional– It’s just my literature review. Certainly I missed some
excellent papers
• Publication Bias– Industry rarely publishes failures
– Nonetheless I summarize 10 examples of “exceptions to the rule”
A tabulation of 200 papers in SPE 11914352
27
Production Benefit
• In >200 published studies and hundreds of unpublished proppant selection studies,
• Operators frequently report greater benefit than expected using:– Higher proppant concentrations – More aggressive ramps, smaller pads– Screen outs– Larger diameter proppant– Stronger proppant– Higher quality proppant– More uniformly shaped & sized proppant
• Frac conductivity appears to be much more important than our models or intuition predict!
A tabulation of 200 papers in SPE 11914353
Statistically Compelling Example
• 0.002 mD
• 446 fracs in carefully conducted trial
– Reference Fcd > 400 with modest sand concentrations; >2000 with ceramics
– Using published conductivity data and simplistic models, frac conductivity should not matter
– However, field results prove with 99.9% certaintythat proppant selection does matter
– 70% increase in productivity with better ceramic!
• <5% benefit predicted with laminar model
– 200 other examples in SPE 119143SPE 10615154

28
• SPE 4677, Smith: High prop concentrations and screenouts beneficial:
– New Mexico: Lea County
– Texas: Crane, Howard, Midland, Gaines, Yoakum Counties
– Colorado, Arizona, Utah
• SPE 24307, Hower: recompleting nitroglycerin fracs in Mesaverde in San Juan Basin, NM
• SPE 77675, Vincent: Refrac SJB CBM wells with better proppant
• SPE 67206, Logan: Morrow formation, SE NM. High conductivity fracs increased well #1 80->600 mcfd; well #2 400->3500 mcfd
• SPE 20708, Ely: high proppant concentrations, larger volumes, forced closure
– SE New Mexico
– Several Texas fields including Ector County
• World Oil, Mar, 1990, Smith: Rio Arriba County, NM Mesaverde: sand to 12 ppg, “very favorable” production response
• SPE 27933, Hailey: Granite Wash, Mendota: isolation and restim of individual layers
W TX, NM, Permian Examples (1 of 3)
Field examples customized for each
audience
• SPE 6440, Cooke: 17 field tests, TX and Miss with bauxite instead of sand or acidized completions. Significant gains in all wells
• SPE 13817, Pauls: Olmos. Refracs at 12 ppg gave 13-fold increase
• SPE 7912, Logan: SW TX (Webb Cty). Refracs with larger diameter proppant and high proppant concentration yielded 620% increases
• SPE 3298, Coulter: Crockett Cty TX. Canyon Sand gas production more sustained with higher proppant concentrations
• SPE 117538, Blackwood: Sutton Cty, TX, Canyon Sand: ELWC provided 60% higher IP and ~40% superior cumulative production in 1st 3 years compared to Brady sand.
• SPE 14371, Britt: Andrews and Ector Counties, TX: Increasing sand concentration from 2 ppg to 6 ppg improved production 160%
• SPE 11930, Illseng: Anton Clearfork (near Lubbock) Initial wells stimulated with low sand concentrations resulted in steep decline. 100 wells treated near 14 ppg gave sustained rates and 100-day payouts
W TX, NM, Permian Examples (2 of 3)
Field examples customized for each
audience

29
• SPE 24011, Fleming: Mitchell County TX, Middle Clearforkdolomite: more aggressive concentrations, larger diameter sand (up to 8/16!) 32 refracs >200% ROR
• SPE 4118, Holditch: Devonian, Wilcox, Hosston including Pecos CtyTX. High viscosity gels and increased prop concentration
• SPE 20134, Kolb: Crane, Upton Counties, dolomite. Acid jobs failed to provide long term stimulation. Refracs with sand, then up to 10 ppg refracs
• SPE 22834, Olson: Devonian, Crane County TX: 2 ppg sand refractured with 5 ppg ceramics. 2x to 8x increase in oil rates
• SPE 23995, Blauer: Midland Basin, Spraberry/Dean. Larger, more aggressive fractures showed greater long-term production and greater EUR
Maybe conductivity matters even in this part of the world?
W TX, NM, Permian Examples (3 of 3)
Field examples customized for each
audience
But what about Horizontal Wells?
58

30
Intersection of Wellbore and Fracture
Vertical Wells: Typically benefit greatly from improved conductivity
200 field studies - SPE 119143
Horizontal Well with Longitudinal Frac:
Uncemented or fully perforated liner
Good connection, fluid only needs to travel ½ the pay height within the frac.
proppant conductivity requirements are trivial – almost anything will be fine
Intersection of Wellbore and FractureCemented Liner
Horizontal Well
Cemented liner with limited perforationsFluid travels shorter distances within the frac, but there is significant flow
convergence around perfs.
Proppant conductivity requirements are a considerationLyco selected RCS for this completion style (SPE 90697)

31
Intersection of Wellbore and Fracture
What if the fracs are NOT longitudinal?
Horizontal Well with Transversely Intersecting Frac:
(Orthogonal, perpendicular, transverse, imperfectly aligned)
Oil/gas must travel hundreds/thousands of feet within fracture, and converge around a
very small wellbore – high velocity within frac!
Horrible Connection; Enormous fluid velocity and near-wellbore proppant characteristics are key!
In a small fat frac (160 ft Xf, 100 ft h, .4” w), the surface area of the frac is 1 million times greater than the
intersection with an 8” wellbore. Velocity can be 1,000,000 times greater in the frac than in the formation! [SPE 101821]
Velocity within Transverse Fracture
Conditions: 2 lb/ft2 [10 kg/m2] 16/20 LWC at 4000 psi stress1 transverse frac
The following animation depicts the flow through an actual proppant pack. The “landscape” was created using an X-ray CT scan of an actual sample of 16/20 LWC under 4000 psi stress.
Approximate Velocity, API/ISO Test
2 ml/min through a 16/20 pack
Approximate Velocity
20 SCFD (0.5m3/d) at 15 psi BHFP (1 atm)
Or 600 SCFD dry gas at 500 psi BHFP
Or 6 mcfd at 5000 psi BHFP
.mpg video format courtesy of CARBO
This is only 6-8 grains/second.
Many wells require 100-10,000x faster gas flow!
And this is pristine highly spherical proppant, zero crush, zero fines plugging, single phase, etc

32
More Stages?
Courtesy Karen Olson, BP
In some reservoirs, operators have pumped 28 stages, with 3 perf clusters per stage.
84 entry points!
Question: Are we convinced we “touch more rock” with more stages, or are we simply redistributing our investment, placing it nearer the wellbore with more entry points?
If you increase intersection by 84-fold, you decrease velocity by 84 fold and reduce pressure losses by 842 or >7000 fold!
However, operators are understandably reluctant to be aggressive on toe stages!
Summary (1 of 3)• The world is complex. We must make simplifying
assumptions:– Mathematically convenient to describe fractures as
simple, vertical features with uniform proppant distribution and continuity
– Published “reference conductivity” data are often presumed to provide reasonable estimates of flow capacity
– Simplified reservoir descriptions (minimal layering, predictable drainage boundaries) simplifies modeling efforts
– Handy to assume same flow regime in reservoir and in fracture
• These assumptions are demonstrably false (at least imperfect)
64

33
Summary (2 of 3)• Pressure losses within uniformly propped fractures
are ~100-times higher than predicted by simplistic models
• Reservoirs contain heterogeneities (boundaries, laminations, anisotropy, lenticular bodies, etc) that increase the need for laterally and vertically continuous fractures
• Frac geometry is often complex• Not all fracs demonstrate sustained hydraulic
continuity• Introducing any degree of fracture complexity
increases our need to design more conductive fractures
• We are not making offsetting errors!! All our assumptions are erring the same direction!!
65
Summary (3 of 3)
• 200 field studies
– tremendous opportunities to improve the
productive potential of hydraulically fractured
wells
– simplistic models fail to recognize that
potential
• It will be much easier to double well productivity than to cut well costs by another 50%!
66

34
• Recognize that tools are imperfect
– Improve them where easy
– Compensate for their shortcomings
• Frac Complexity
– Touches more rock (good!)
– Challenges our ability to provide adequately conductive frac (bad)
• Conductivity
– You need more than you think!
• Be willing to listen to the production data
– Especially when the results violate your intuition!
• There is always a better frac design!
– Don’t be limited by your tools or imagination!
Recommendations
68
Society of Petroleum Engineers
Distinguished Lecturer Programwww.spe.org/dl 68
Your Feedback is Important
Enter your section in the DL Evaluation Contest by completing the evaluation form for this presentation or
go online at:
http://www.spe.org/events/dl/dl_evaluation_contest.php

35
SPE 119143
Examining Our Assumptions-
Have Oversimplifications Jeopardized Our
Ability to Design Optimal Fracture
Treatments?
Mike [email protected]