examining food consumption in japan under life-cycle...
TRANSCRIPT

EXAMINING FOOD CONSUMPTION IN JAPAN UNDER LIFE-CYCLE
HYPOTHESIS: IMPLICATION FROM CROSS-SECTIONAL DATA
Mauricio V. L. Bittencourt1
Ratapol P. Teratanavat2
Wen S. Chern3
Selected Paper prepared for presentation at the American Agricultural Economics
Association Annual Meeting, Denver, Colorado, July 1-4, 2004
Copyright 2004 by Bittencourt, Teratanavat, and Chern. All rights reserved. Readers may make verbatim copies of this document for non-commercial purposes by any means, provided that this copyright notice appears on all such copies.
1 Ph.D. Candidate. Department of Agricultural, Environmental, and Development Economics. The Ohio State University. Federal University of Parana, Brazil (UFPR), with a fellowship from CAPES Foundation (Brazil). [email protected] 2 Ph.D. Candidate and Graduate Research Associate. Department of Agricultural, Environmental, and Development Economics. The Ohio State University. [email protected] 3 Professor. Department of Agricultural, Environmental, and Development Economics. The Ohio State University. [email protected]

EXAMINING FOOD CONSUMPTION IN JAPAN UNDER LIFE-CYCLE
HYPOTHESIS: IMPLICATION FROM CROSS-SECTIONAL DATA
Abstract
This study estimates a cross-sectional model through a theoretically consistent Almost Ideal Demand
System (AIDS) to examine the economic and demographic determinants of food consumption patterns in
Japan over life-cycle periods. Results show key factors that explain such behavior, including family size,
number of children, lifestyle and health concern.
JEL Classification: C31, D12, E21, J10, Q11 Keywords: Japanese Food Consumption, Life-Cycle Hypothesis, AIDS Model, Cross-Sectional Data

1
EXAMINING FOOD CONSUMPTION IN JAPAN UNDER LIFE-CYCLE
HYPOTHESIS: IMPLICATION FROM CROSS-SECTIONAL DATA4
Introduction
The objectives of this study are to verify structural differences in food consumption of Japanese
households at different life-cycle periods and to examine factors that may contribute to such demand
changes using cross-sectional data. This study follows the underlying concept of life-cycle hypothesis
(LCH), focusing on the intertemporal allocation of consumption over life spans. It presents an analysis of
Japanese demand for selected food commodities including fish, meat, milk, eggs, vegetables, and fruits.
The study contains an econometric estimation of the expenditure share equations for these foods through
an Almost Ideal Demand System (AIDS) specification with the presence of demographic variables. The
test of structural changes, the analysis of the effects of demographic characteristics, and the estimation of
expenditure and price elasticities are conducted from a random sample of 1,281 households.
The assertion of LCH is that people smooth their consumption over time and stabilize their
marginal utility of wealth with no binding liquidity constraints (Browning, 1987). The time path of
consumption for an individual is independent of time path of income even though an individual faces
different constraints at any periods of his/ her life (Deaton, 1992). The main assumption under this
hypothesis is that each household is maximizing his/her utility, which is a function of consumption,
subjected to a lifetime budget constraint. An individual will choose consumption levels in each period,
not necessary to be the same for all periods, to ensure that the marginal utility of consumption is constant
or smooth over time (Attfield and Browning, 1985).
Several studies tested LCH and confirmed the existence of this hypothesis in different
commodities. Browning (1987) examined consumption patterns of food, alcoholic beverage, and tobacco
and investigated whether LCH holds across households. The study used multi-period cross-sectional data
4 The authors would like to thank Kang Ernest Liu for his comments on an earlier version of this paper.
2
with different observations to test whether consumption of alcoholic beverages and tobacco changes as
family composition changes. The paper reported having children in households does not significantly
decrease consumption of these goods, which supports LCH in this particular context. Blundell, Browning,
and Meghir (1994) applied micro data to analyze factors influencing household allocation of goods within
periods and over lifetime. Under LCH, they suggested that the relationship between marginal utility of
wealth and expenditure on any individual goods depends on the shape of Engel Curves, the extent of
substitution between goods, the demographic composition of households, and the labor market status of
the household. Controlling such factors is sufficient to eliminate the excess sensitivity of consumption
growth to predictable income growth.
This study focuses on the test of structural changes in food consumption and on the examination
of potential factors contributing to such changes for Japanese households. While most studies, dealing
with LCH, use times-series data, this study applies cross-sectional data, enabling us to capture the income
and price effects and the effects of various demographic characteristics on food demand. The demand
model is estimated for six food commodities including fish, meat, milk, eggs, vegetables, and fruits.
These food items are chosen to avoid the durability problem in the LCH analysis, as suggested by
Hayashi (1985), where some goods are not easily defined as durable or perishable. In our study, food
items chosen reflect exactly perishable features of the Japanese food consumption.
Previous Studies
Many studies tested structural changes for food consumption at different time periods and
investigated determinants of such changes under the life-cycle perspective (Cortez, 1994; Cook, 1993;
Chalfant and Alston, 1988; Davis et al., 1983). Factors that contribute to structural differences of food
demand in different time periods can be divided to economic and non-economic factors. The economic
factors include the responses to changes in food expenditure, household income, and prices. The response
levels, which are measured by price and expenditure elasticities, may vary over time. Thus, the estimated
elasticities may not be used to predict consumption patterns at different periods because the

3
responsiveness of elderly people observed in the current period may not be the same as the responsiveness
of today's younger people in the future period.
Non-economic factors have been the main focus by researchers to explain the changes in
consumer behavior over lifetime. Such factors include family size and composition, residential location,
and lifestyle. These factors can be used to predict such structural differences at different point in time
because the structure of such demographic characteristics follows a similar pattern over time. Cook
(1993) discussed differences in spending pattern by age and reported that spending on dairy products
generally decreased with age (younger households are the one most likely to have small children) while
spending on vegetables and fruits were higher in the older group. Davis et al. (1983) examined the impact
of selected socioeconomic characteristics on aggregate and group food expenditure patterns using
logarithmic functional form. They found that household income, family size, and Food Stamp Program
participation have strong positive impacts on food expenditures.
Blundell and Walker (1984) examined the effect of variation in demographic characteristics, such
as the number and ages of dependent children, on the expenditure and time allocation decisions of
households. They found that young children have a significant impact on marginal budget shares. For
instance, during the age between 20 and 40 years old, an individual is in the early stage of his/her career
and just starts to have a family. The consumption of this group may be influenced by how many children
the household has and by total household income. As people get older, they move up to higher level in
their career with higher income and their children start to become independent and have their own job.
Their consumption decision may be determined only by themselves without taken into account child
factors.
Kokoski (1986) investigated the effect of demographic characteristics on structural differences of
food consumption and found that different demographic groups have different price and income
responsiveness, using cross-sectional data. Deaton and Paxson (1998) evaluated the relationship of aging,
income and health between men and women under the life-cycle perspective, where they concluded that
changes in the relationship between income and health status are main factors in explaining structural

4
changes in food consumption. Kim and Chern (1999) examined the Japanese consumption pattern of fats
and oils, using translog and AIDS demand models and focusing on the impact of health risk information
associated with fat and cholesterol on the demand for various fats and oils. Their results imply that
lifestyle and health concerns are also factors that explain changes in consumption in different periods.
The same cross-sectional data has been used in several studies. Taniguchi and Chern (2000)
examined the income and price elasticities of rice demand by applying different demand models such as
Working-Lesser and LA/AIDS model. The results showed that the expenditure elasticity of rice is
positive and close to one. Also, the own price elasticity for rice is highly elastic and rice consumption is
sensitive to changes in the prices of meat and fish. Even though this study provided the descriptive
statistics of food consumption and demographic decomposition, no emphasis was placed on differences in
demand structures for different demographic groups such as income classes or age groups. They,
however, pointed out that estimated expenditure and price elasticities are invariant with income levels.
Tokoyama et al. (2002) analyzed overall trends in Japanese food consumption patterns. They
found that elderly households have a smaller expenditure elasticity than younger households, implying
that older people do not change their consumption patterns as much as younger people when food
expenditures increase. Also, their study showed that expenditure and price elasticities become less
sensitive as household size becomes larger. The study concluded that recent trends of westernization,
preferences in convenience, and preferences in healthy foods have a strong explanatory power for the
changing patterns of Japanese food consumption. In addition, demographic structures such as age, family
size, and number of working people in households have significant impacts on food consumption.
In this paper, our focus is on life-cycle patterns of consumption, looking at the co-movements of
consumption, expenditures and demographic variables. Since these variables are all determined jointly by
the same household, looking at any pair in isolation may be misleading. The direct testing of the LCH is
not possible due to data limitation. Since panel data is not available, where information such as asset
holdings or expected future income are present, cross sectional data employed here can only be used to
assess the presence of LCH through inferences from estimates of the demand system and structural

5
change tests. The formal test of structural changes of food consumption will be conducted across age
groups. This study will identify both economic and non-economic factors that may contribute to lifetime
changes on food consumption across households. The demographic variables, as non-economic factors,
are important to explain the presence of structural changes across different age groups, contributing to the
verification, or not, of the LCH in the Japanese food consumption. Price and food expenditure elasticities,
as economic factors, are important to gain useful information to predict the consumption behavior of the
today’s young people in the future under the LCH. The results of this study will help us understand
consumers’ behavior on food consumption in different periods of their lives and factors affecting food
budget allocation over lifetime, following the life-cycle hypothesis.
Data and Descriptive Statistics
The study uses data from a Japanese household survey conducted in 1997 by the Statistics
Bureau, Management and Coordination Agency in Japan. This monthly survey database provides daily
average information on household expenditures, prices, and quantity purchased for various food
categories. The information on food budget share is obtained by dividing particular food expenditure by
total food expenditure. A sample of 1,281 observations is included in this study; only those households
that report positive consumption levels on the selected food items are included in the sample5.
Household income and demographic variables such as family size, age and composition are
related to the life-cycle hypothesis (Pollak and Wales, 1981). We also consider several other demographic
characteristics, including the number of children in households and residential location. According to the
survey, there are five income classes, in which class 1 represents lowest income group and class 5
represents highest income group6. The survey includes only those households that have two or more
5 There was a relatively small percentage of household reported no spending on these food items during the survey period; 2.6% (fish), 1.9% (meat), 7.6% (milk), 5.3% (eggs), 0.2% (vegetables), and 6.1% (fruits). These observations are excluded from the study in order to avoid zero truncated problems. The AIDS model with all observations (available upon request) is very similar to the model without these observations shown in the tables. 6 According to the survey, household income is classified into five different levels. Class 1 represents households with annual income less than 4,020,000 Yen; Class 2 is between 4,020,000 and 5,680,000 Yen; Class 3 is between
6
members, but no more than eight people. Children in households are divided into three groups: age less
than 6 years old, between 6 and 12 years old, and older than 12 years old. The residential locations are
categorized as large cities or metropolitan areas (more than 1 million people), medium size cities
(between 50,000 to 1 million people), and small towns and villages (less than 50,000 people).
Data is divided into three groups based on the age of the primary householder, including age less
than 41 years old, between 41 and 60 years old, and over 60 years old, in order to test the effect of social-
demographic differences. The first group includes households with age less than 41 years old,
representing young families with small children and lower income levels (60 percent of observations in
this group are in income classes 2 and 3). The second group includes households aged between 41 and 60
years old, representing middle-age families, in which their children start to grow up and are in primary
and/or high school. The income of second group is higher than the first group, in which more than 57
percent of observations are in income classes 4 and 5. In addition, people in this group are likely to be at
the peak of their career, as compared to other groups. The last group represents households aged over 60
years, in which their income levels tend to decline because of the retirement and the only source of
income may be from their past savings or pensions. Most households in this age group are in income
classes 1, 2, and 3. Children in this group have grown up and are likely to become independent.
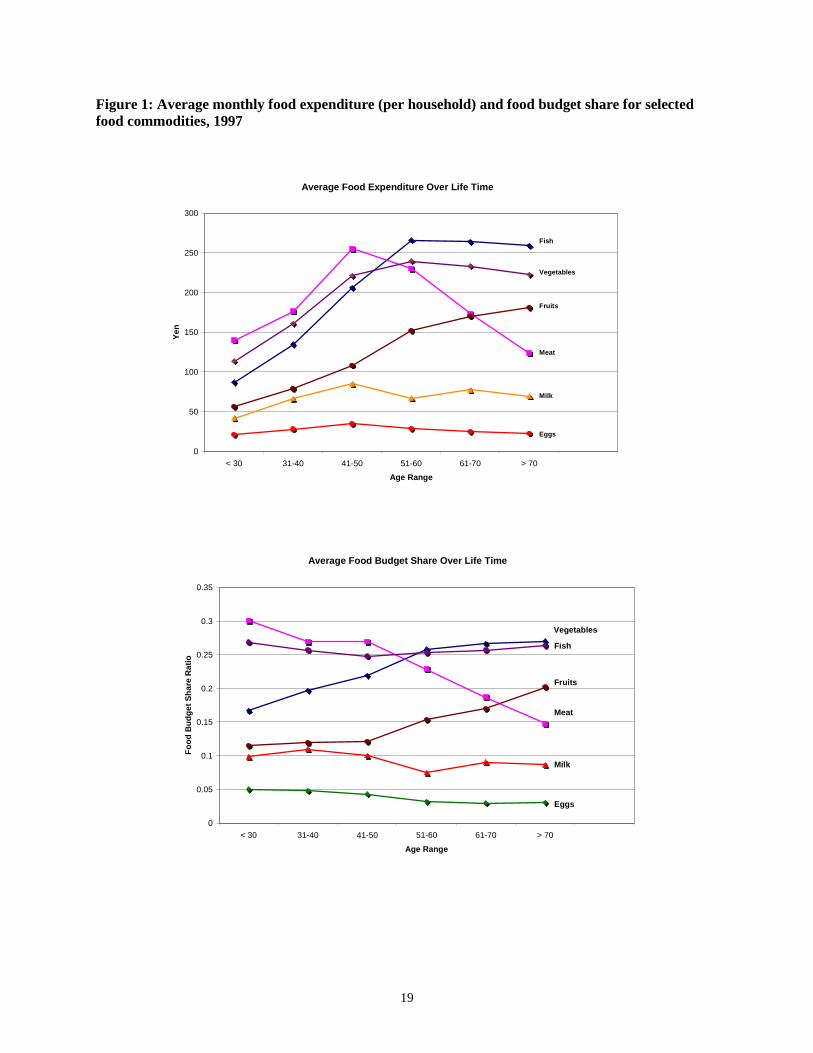
Figure 1 shows that different age groups tend to have different spending patterns for food
consumption. There is similarity in the consumption of fish, vegetables and fruits. Japanese households
increase their consumption on these foods significantly, as they become older. The consumption levels
reach the highest level at the age around 50 and 60 years old and stabilize afterward. The meat
consumption, however, has a different pattern over age. The consumption has an increasing trend until the
age between 40 and 50 years old and then declines sharply once people become older. The figure shows
that milk and egg consumption are relatively constant across age groups. The budget share plot illustrates
that Japanese households tend to change their budget allocation, as they become older, particularly for
5,680,000 and 7,450,000 Yen; Class 4 is between 7,450,000 and 9,900,000 Yen; and, Class 5 is between 9,900,000 Yen and higher.

7
meat, vegetables, and fruits, while maintaining almost the same spending proportion on fish, milk, and
eggs. People tend to allocate more of their food expenditure on vegetables and fruits whereas a budget
share on meat is declining, as people become older. The stabilized and/or smaller consumption of food at
retirement age is not surprising, since the elderly faces important changes such as lower labor supply,
higher mortality risk, smaller family size, and reduced health status (Browning and Crossley, 2001).
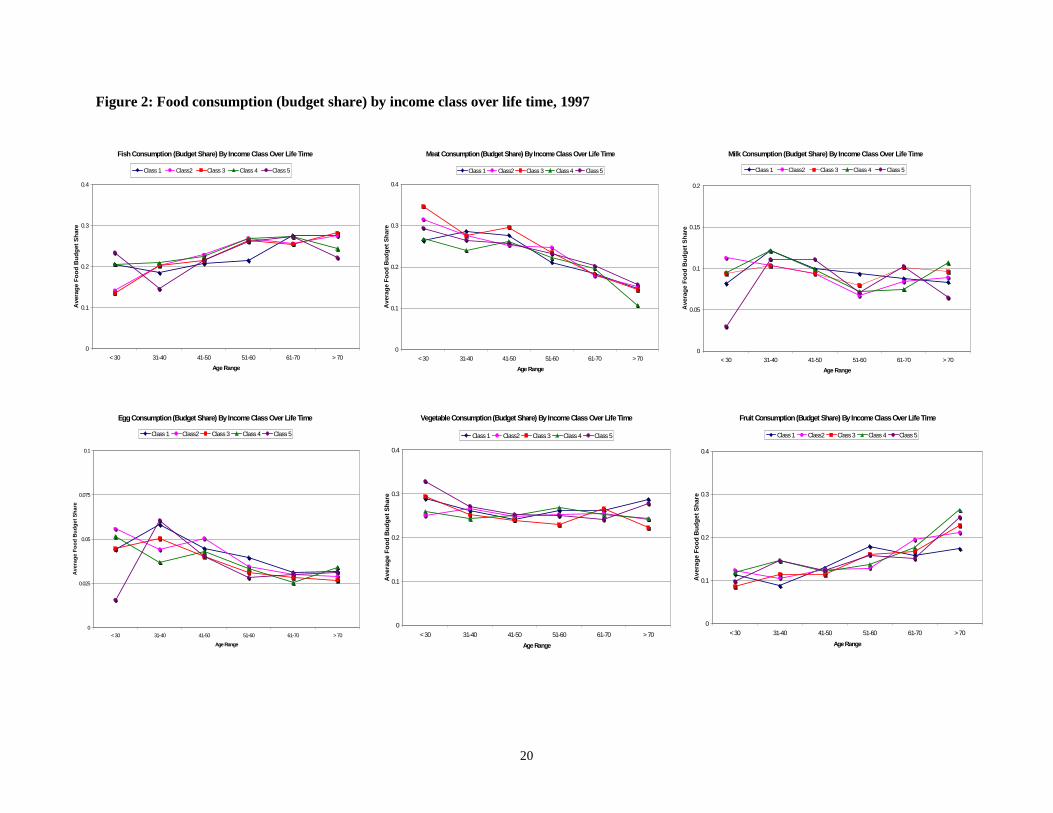
The plot in the figure 2 illustrates different food budget shares for five income classes at various
age groups, allowing the examination of income effects on food consumption/spending over lifetime.
Each income class has similar food spending pattern, in which Japanese tends to spend more, relative to
their total food expenditures, on fish and fruits and less on meat when they are older. There is no clear
distinction from the plot among different income levels on food consumption. The result may imply that
the changes in consumption pattern over time do not depend on income level, followed by the existence
of the life-cycle hypothesis. It is our main interest to examine further with more systematic approaches,
based on the demand model in the later part, if the life-cycle hypothesis can be applicable and/or is
consistent with the Japanese consumption behavior.
The descriptive statistics for these selected food items and demographic variables for each age
group are shown in table 1. The analysis provides consistent results in the average food expenditure and
the food budget share with the basic plot of food consumption in figure 1. In summary, from younger to
older age, households spend more on fish, vegetables, and fruits, maintain relatively constant expenditure
levels on milk and eggs, and decrease their meat expenditure. Elderly people have higher food budget
allocated for fish and fruits, constant allocation for milk, eggs, and vegetables, and smaller allocation for
meat. The prices are relatively constant across age group (except for fish and meat) because they
supposedly faced the same market prices.
The social demographic characteristics of Japanese households at different ages are plotted in
figure 3. The household income increases as household heads become older and declines after the age of
60 years old whereas the Engel coefficient, which is the ratio of food to total expenditures, suggests that
older people have higher budget allocation for food. The descriptive statistics in table 1 show that the

8
average household income is increasing when people become older. The highest income level is reached
at the age between 41 and 60 years old, which is the group of people who have been working for a long
period of time. Once they are retired, the household income is likely to drop because their income sources
may be limited to part-time works, pensions, and their savings.
Approximately 70 percent of Japanese households in all ages are located in the suburb area or
mediums sized cities while 20 percent reside in the large cities and about 10 percent live in small towns or
villages. Considering the proportion of income classes across age groups, almost 60 percent of
households in the age group less than 41 years old have their income in classes 2 and 3. The household
income levels tend to shift upward to classes 4 and 5 when people become older aging between 41 and 60
years old. Once they are in the retirement age, their income class move down to classes 1 and 2.
The average number of people in households decreases, as household heads become older.
Households in the younger age tend to have a larger family size than the older group. This is consistent
with the reported number of children in the household. In the first age group (less than 41 years old),
almost every household has at least one child aged less than 12 years. In the second age group, the age of
children in the household moves up to be aged between 6 and 18 years. The statistics implies that
Japanese tend to start a family at the early age and have children during the mid 20s and 30s. Once they
become older at age over 40 years old, their children start to grow up. At the retirement age, elderly
people are likely to live only with their spouse whereas their children move out and live by themselves.
The statistics shows that only few households in the oldest age group reported that their children aged
below 18 years, if any, still stay with them.
Methodology
The underlying assumption for this study is that there is a two-stage budget decision, where the
direct utility function is weakly separable and Japanese consumers allocate expenditure first to broad
commodity groups and then to goods and services within each group. This assumption enables budget
allocations within each group to be determined solely by within-group relative prices and group

9
expenditures. Therefore, we can study the demand properties individually for each group of goods
without lost of generality. Fish, meat, milk, eggs, vegetables and fruits are foods in the sub-group to be
investigated7. The total group expenditure is derived by the total amount given by the purchases for these
six food items only.
The demand model used in this study is the nonlinear Almost Ideal Demand System (AIDS)
model developed by Deaton and Muellbauer (1980), which allows a flexible approximation to general
preference structure. This model has been used extensively in many demand studies because it satisfies
demand properties, including adding-up restriction, homogeneity, symmetry and negativity which can be
imposed, Engel curves that are linear in the log of total expenditures, and exact aggregability (Asche and
Wessells, 1997; Lewbel, 1989).
The method of demographic translation is used to incorporate demographic variables into the
demand system. It redefines the original demand system as a function of the demographic profiles of
households. The model with demographic variables is still theoretical plausible, meaning that the
modified model can still be derived from a well-behaved utility function (Pollak and Wales, 1980). The
AIDS model with demographic variables can be expressed as follows:
+∑
=+∑
=+=
*log
6
1)(log
5
1*
P
xij ipijk kDikiiw βγδα i, j = 1,2,…,6
where iw is budget share for good i, kD is demographic variable k, ip is price of good i, x is total food
expenditure, and P* is AIDS price index. ijiki γδα ,,* , and iβ are parameters to be estimated. The
AIDS price index (P*) is a non-linear function of prices, and it can be interpreted as the log income
required to attain the subsistence utility. It can be expressed as:
∑ ∑∑= = =
++=6
1
6
1
6
10
* loglog21loglog
i i jjiijii pppP γαα i, j = 1,2,…,6
7 To avoid this problem, Deaton (1974) included a constant in the models to represent the other important commodity groups that were not specified in the models. But in this case, Deaton had many different groups of
10
where 0α is the log expenditure at the subsistence level when all prices are normalized at one.
In the AIDS model, the adding up, symmetry, and homogeneity restrictions are imposed in order
to reduce the numbers of parameters to be estimated. By imposing the adding up restriction (∑=
=6
10
iiw ),
this demand model contains five equations from fish to vegetables, by dropping the equation for fruits.
Those parameters for the excluded equation can be derived from the following
conditions ∑∑∑===
∀===6
1
6
1
6
1
* 0,0,1i
iji
ii
i jand γβα . The imposition of the symmetry restriction implies
that jiij γγ = . As for the homogeneity restriction, ijγ is estimated for j =1, 2, ..., 5 and then
−= ∑
=
5
16
jiji γγ because of the homogeneity imposition
=∑
=
6
10
jijγ for each demand equation i. The
Iterative Seemingly Unrelated Regression Model (ISUR) is applied to estimate coefficients for this AIDS
model.
Results and Discussion
Tests of Structural Changes
The likelihood ratio test i.e., the Chow test, is used to investigate structural differences for a
group of selected foods and each individual food commodity, respectively, across age groups, as shown in
table 2. The exception is the structural differences in fruit consumption because this equation is left out
whereas its parameter estimates are derived from those demand restrictions. The hypothesis to be tested is
that consumption patterns across age groups are not different using the test of structural change. The
rejection of the hypothesis implies that different age groups have different food consumption patterns,
which can be an indicator of the presence of LCH in the Japanese food consumption.
goods that were separated to be estimated under different demand system specifications, which it is not the case in our study because we have only a six good analysis.
11
According to table 2, the null hypothesis of no structural changes for the whole demand system
was rejected across age groups. These results imply that, considering all selected food items together,
there are structural changes in consumption patterns from younger to older households, which are
important results under the LCH. Considering each food item individually, the test of structural change of
fish consumption shows that different consumption patterns exist between people aged less than 41 years
and those who are older than 41 years old. The result is consistent with the descriptive statistics and the
basic plot previously discussed. Different age groups have different consumption patterns for meat. The
result follows the plots showing the increase in meat consumption from the fist age group to the second
group and the decrease in meat consumption from the second group to the last group.
The milk consumption of households in the younger age (less than 41 years old) and the middle
age (between 41 and 60 years old) has a similar pattern. The significant difference in milk consumption is
shown between people before and after retirement age (after 60 years old). People in the younger age
have a different egg consumption pattern from those in the older age but no difference is found between
the second and the last age group. Egg consumption tends to be lower by older people than those in
younger ages. A weak result of structural differences exists for vegetables consumption among
households aged between 41 and 60 years and households aged more than 60 years. The results in this
section confirm the LCH, since consumers at different ages seemed to maximize different utility functions
when they choose among different food items to consume.
Effects of Demographic Variables
There is no strong evidence showing significant effects of income classes on consumption pattern
for the most part of income class coefficients in all system results, which can be considered as a weak
response for the LCH. Most of parameter estimates are not statistically significant at 5 percent level, as
shown in table 3. People in the same age group with different income levels tend to have similar
consumption patterns for all selected foods. This can imply that income constraint is not a key factor for

12
making their available budget allocation among these food items. If this constraint is binding or plays a
main role in the LCH, people in different income classes should have different consumption patterns.
However, stronger evidence is needed to support this hypothesis. Again, this result is consistent with the
simple plot of different food consumption across income classes presented earlier. Browning and Crossley
(2001) found that absence of high correlation between consumption and income is not a sign that the LCH
does not hold. It can be just a special case of LCH, keeping in mind that smoothing consumption does not
mean constant consumption.
Considering the regression results for fish, the estimated coefficients of family size change from
positive to negative when households become older. Parameter estimates of residential location are
significant only for the oldest age group. Of those over 60 years old, households living in large cities tend
to consume less fish than those living in small towns or villages. Number of children in household is
likely to have a negative impact on consumption levels. Surprisingly, households with children are likely
to consume less fish. The number of children under age of 6 years old has significant influence on fish
consumption in the young households, while the number of children in school ages is a significant factor
to those households in the middle age (between 41 and 60 years old). Number of children in the
household does not have any influence on fish consumption of households in the oldest age group, which
can be explained by the fact that people in this age live by themselves with no children in the family.
Thus, their consumption will depend solely on their own choices and needs.
With respect to meat demand, households with more people tend to consume more in the older
age groups while the household size has little or no effect in the youngest age group. Residential location
seems to have no effect on meat and milk consumption across age groups. However, the number of
children tends to have a significant effect on both foods. It seems reasonable that consumption of meat
and milk is high for people with children or teenagers. Once children become more independent and live
on their own, as in the case of older households (more than 60 years old), the consumption of meat and
milk decreases.

13
Family size and residential location are the main demographic variables to explain egg
consumption for all three age groups, with positive and significant coefficients in all estimates for family
size, and negative and significant coefficients for the large city variable for the first two age groups. For
vegetables demand, once again family size and location are the only important demographic variables to
explain their consumption for the younger (between 41 and 60 years old) and older (more than 60 years
old) households. The results show that demographic characteristics such as household composition do not
have strong effects on consumption pattern across age groups for eggs and vegetables. The structural
differences in these food items may be explained by the fact that people in older ages are more concerned
about their health and thus decrease their egg consumption and increase their fruit and vegetable
consumption.
It is shown that differences through the life-cycle obtained from the structural change tests can be
explained by the results from demographic variables that we discussed in this section. Non-economic
factors such as location, household size and household composition are accounted partially to explain the
pattern of consumption compatible with the LCH. The joint effect of consumer’s preference and health
concerns may also be responsible for such differences; this effect, nevertheless, cannot be tested using the
available data.
Effects of Prices and Food Expenditure
The effects of expenditure and prices on food demand, as measured by expenditure and price
elasticities, may contribute to changing patterns of food consumption across age groups. Information
contained in these elasticity estimates may be used to predict consumers’ behavior over time with panel
data. With the availability of only cross sectional data, the usefulness of such information is limited to the
present analysis under the LCH. However, it is our attempt to predict the future behavior of consumers
using the present elasticity results with some caution.

14
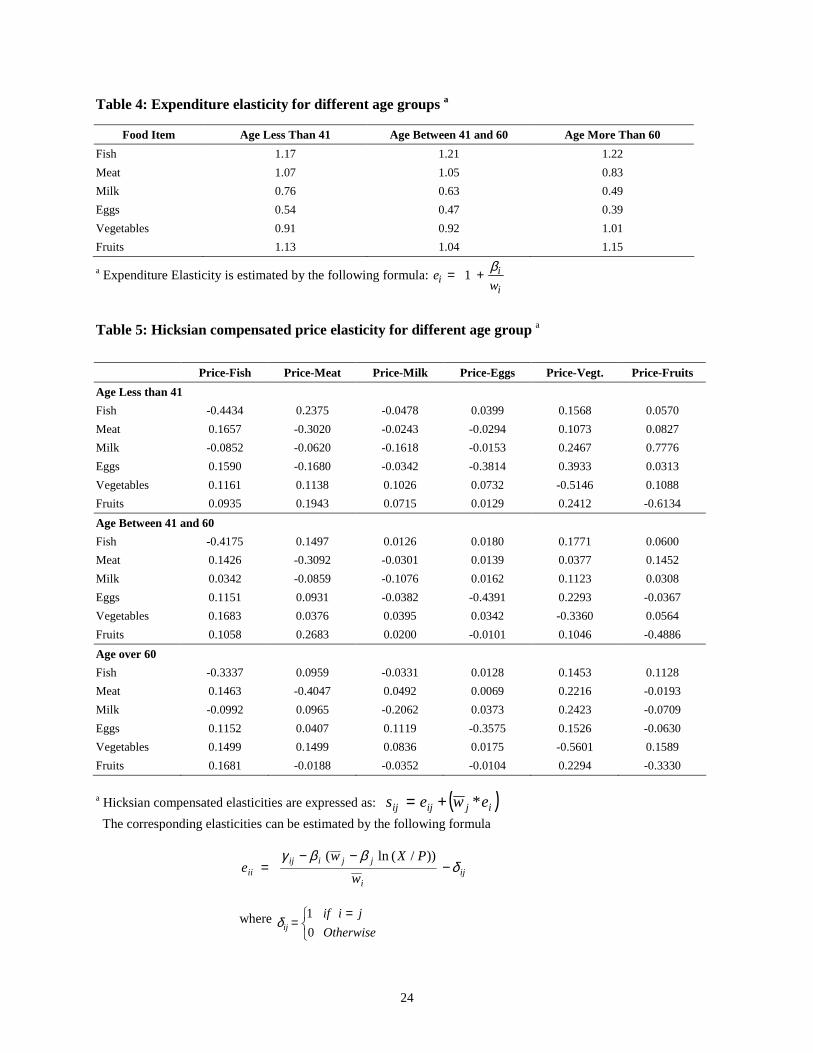
The expenditure elasticities of selected foods in this study show that, on average, fish, fruits, and,
in some degree, meat, tend to be expenditure elastic goods for all age groups analyzed (table 4)8. The
others are more expenditure inelastic (necessity) goods, where eggs have the smallest elasticity, mainly
for the oldest age group. An increase in income is likely to have a more significant impact on fish, fruits,
and vegetables than on milk and egg consumption. As people become older, more food expenditure will
be allocated for fish, vegetables, and fruits and less for meat, milk, and eggs.
The Hicksian compensated price elasticities can give the substitutability effects among all food
items, and they show that all selected food items are essential for the Japanese consumers, with low own-
price elasticity (table 5). An increase in price by 1 percent of these food items will decrease the
consumption by 0.1 to 0.6 percent. The cross-price elasticities show that, for all age groups, fish and meat
are substitutes. Fish seems to be a substitute for all foods, except for milk in the first and last age groups
(less than 41 and over 60 years old). In general, meat is shown to be a complement food for milk and eggs
for the first two age groups. Vegetables seem to be substitutes for all foods across all age groups. The
results are very similar to those found by Taniguchi and Chern (2000).
It is noted (table 5) that there are some distinct patterns of price responsiveness across age groups.
In general, the own-price elasticities tend to be more sensitive as people become older, except for fish,
eggs, and fruits. The substitution elasticities also tended to be higher as consumers become older,
especially for fish and meat. For eggs and vegetables, the substitution elasticities decreased across age
groups and for milk and fruits there were some elasticities that increased and other decreased across age
groups. These results emphasize our previous assertions that different utility functions are used by
consumers in each age group, which seems to be a reasonable result from LCH. With cross-section data in
this study, nonetheless, a conclusion cannot be drawn if the future responsiveness to changes in food
expenditure and prices for households will be the same as the current responsiveness estimated in our
analysis. It may not be reasonable to assume that, 20 years from now, households in the first age
8 Taniguchi and Chern (2000) and Chern et al., (2003) obtained similar results for the same food items.
15
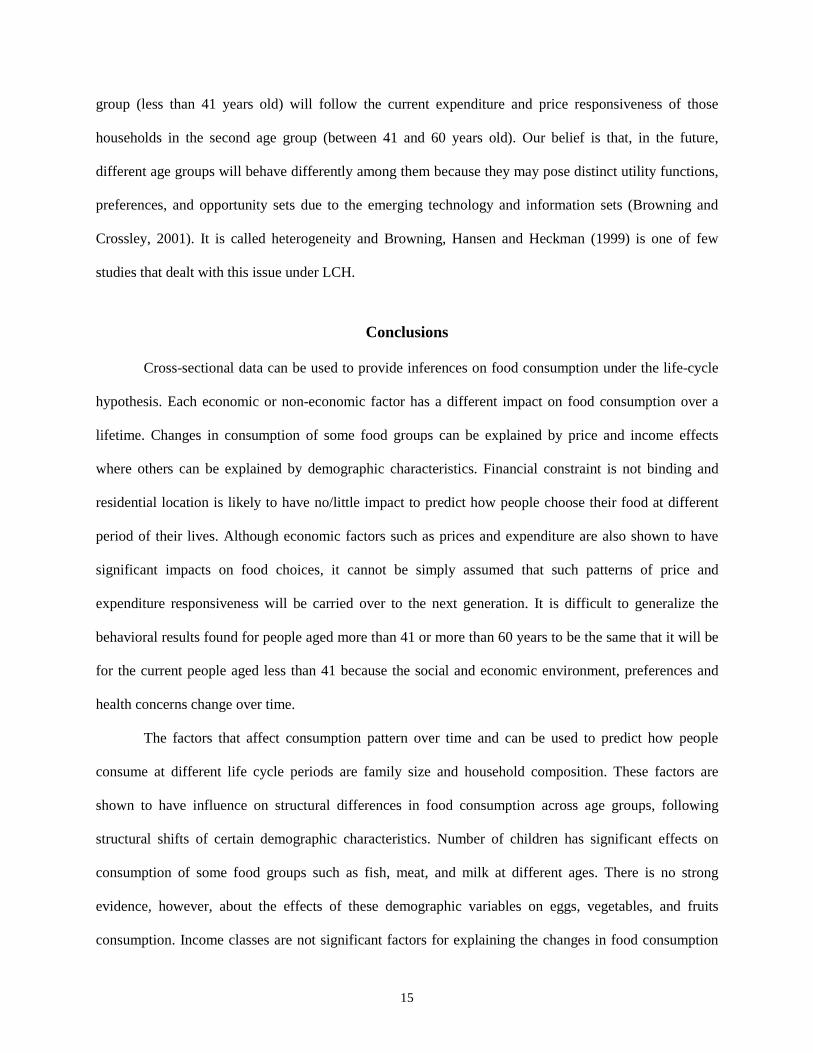
group (less than 41 years old) will follow the current expenditure and price responsiveness of those
households in the second age group (between 41 and 60 years old). Our belief is that, in the future,
different age groups will behave differently among them because they may pose distinct utility functions,
preferences, and opportunity sets due to the emerging technology and information sets (Browning and
Crossley, 2001). It is called heterogeneity and Browning, Hansen and Heckman (1999) is one of few
studies that dealt with this issue under LCH.
Conclusions
Cross-sectional data can be used to provide inferences on food consumption under the life-cycle
hypothesis. Each economic or non-economic factor has a different impact on food consumption over a
lifetime. Changes in consumption of some food groups can be explained by price and income effects
where others can be explained by demographic characteristics. Financial constraint is not binding and
residential location is likely to have no/little impact to predict how people choose their food at different
period of their lives. Although economic factors such as prices and expenditure are also shown to have
significant impacts on food choices, it cannot be simply assumed that such patterns of price and
expenditure responsiveness will be carried over to the next generation. It is difficult to generalize the
behavioral results found for people aged more than 41 or more than 60 years to be the same that it will be
for the current people aged less than 41 because the social and economic environment, preferences and
health concerns change over time.
The factors that affect consumption pattern over time and can be used to predict how people
consume at different life cycle periods are family size and household composition. These factors are
shown to have influence on structural differences in food consumption across age groups, following
structural shifts of certain demographic characteristics. Number of children has significant effects on
consumption of some food groups such as fish, meat, and milk at different ages. There is no strong
evidence, however, about the effects of these demographic variables on eggs, vegetables, and fruits
consumption. Income classes are not significant factors for explaining the changes in food consumption

16
pattern over a lifetime. However, residential location can affect fish, meat, eggs, and vegetables
consumption at different ages. Other variables such as education level and fertility could also be
important to capture structural changes across age groups in future studies. The results shown are
coherent to what would be expected from LCH.
Changes in food consumption across age groups may also be explained by different lifestyle and
health concerns. Older people may be more concerned about their health and thus, more selective on
dietary intakes by consuming more healthy foods with high vitamin and minerals and less cholesterol,
such as fish, vegetables, and fruits while eating less meat products. Even though this factor may
contribute to such structural differences of food consumption at different ages, this study does not have
enough information to examine such impacts.
As pointed out by Watts (1958), cross-section data does not allow the verification of the real
relationship across different “generations” given by three different age groups9. It is so because the
experience of a generation is, at least partially, unique, since it differs from that of other generations in
events and situations, and also differs in terms of the timing of these events relative to the life-cycle. The
consequence of the generalization from the use of cross-section data depends on a ceteris paribus
assumption about the experience of different generations or age groups.
This study represents only an attempt to investigate the Japanese food consumption under LCH.
The most interesting finding is that the food consumption pattern in Japan can be explained by economic
(price, income) and demographic factors (household composition, family size, residential location) under
the life-cycle hypothesis. As the households become older, they change their food consumption pattern
influenced by economic, demographic, and other factors such as lifestyle and health.
9 Weil (1994) also emphasizes the interrelationships among generations of households.

17
References Asche, F., and C.R. Wessells. "On Price Indices in the Almost Ideal Demand System." American Journal
of Agricultural Economics 79(November 1997):1182-85. Attfield, C. L., and M. Browning. "A Differential Demand System, Rational Expectations and the Life-
cycle Hypothesis." Econometrica 53(January 1985):31-48. Blundell, R, M. Browning, and C. Meghir. "Consumer Demand and the Life-Cycle Allocation of
Household Expenditures." The Review of Economic Studies 61(January 1994):57-80. Blundell, R., and I. Walker. "A Household Production Specification of Demographic Variables in
Demand Analysis." The Economic Journal 94(Supplement 1984):59-68. Browning, M. "Eating, Drinking, and Testing the Lifecycle Hypothesis." The Quarterly Journal of
Economics 102(May 1987):329-46. Browning, M. and Crossley, T. "The Life-Cycle Model of Consumption and Saving". Journal of
Economic Perspectives 15(March 2001):3-22. Browning, M., Hansen, L. and Heckman, J. "Micro Data and General Equilibrium Models". In Handbook
of Macroeconomics, Vol. IA. John Taylor and Michael Woodford, eds. Amsterdam, New York and Oxford: Elsevier Science, North Holland, chapter 8, 1999.
Chalfant, J.A. and J.M. Alston. "Accounting for Changes in Tastes". Journal of Political Economy
96(2)(1988):391-408. Chern, W.S., K. Ishibashi, K. Taniguchi, and Y. Tokoyama. "Analysis of the Food Consumption of
Japanese Households". Food and Agriculture Organization of the United Nations (FAO), Economic and Social Development Paper, No. 152. Rome, 2003.
Cook, A.K. "Changes in Japanese Food Consumption". In Understanding the Japanese Food and
Agrimarket: A Multifaceted Opportunity. O'Rourke A.D. (eds). Food Products Press, 1994. Cortez, R.A. "Taste Changes in the Demand for Food by Demographic Groups in the United States: A
Non-parametric Empirical Analysis." Ph.D. Dissertation. University of Minnesota. 1994. Davis, C.G., M. Moussie, J.S. Dinning, and G.J. Christakis. "Socioeconomic Determinants of Food
Expenditure Patterns among Racially Different Low- Income Households: An Empirical Analysis." Western Journal of Agricultural Economics 8(December 1983):183-196.
Deaton, A. S., and J. Muellbauer. "An almost Ideal Demand System." The American Economic Review
70(March 1980):312-26. Deaton, A.S. Understanding Consumption. Clarendon Press, Oxford, 1992. Deaton, A. S., and C Paxson. "Aging and Inequality in Income and Health." The American Economic
Review 88(February 1998):248-53. Hayashi, F. "The Permanent-Income Hypothesis and Consumption Durability: Analysis Based on
Japanese Panel Data." The Quarterly Journal of Economics 100(4)(1985):1083-113.

18
Kim S.R. and W.S. Chern. "Alternative Measures of Health Information and Demand for Fats and Oils in
Japan." The Journal of Consumer Affairs 33(Summer 1999):92-109. Kokoski, M.F. "An Empirical Analysis of Intertemporal and Demographic Variations in Consumer
Preferences." American Journal of Agricultural Economics (November 1986): 894-907. Lewbel, A. "Nesting the AIDS and Translog Demand Systems." International Economic Review
30(2)(1989):349-356. Pollak, R.A. and T.J. Wales. "Comparison of the Quadratic Expenditure System and Translog Demand
System with Alternative Specifications of Demographic Effects." Econometrica 48 (April 1980):595-612.
Pollak, R.A. and T.J. Wales. "Demographic Variables in Demand Analysis." Econometrica 49
(6)(1981):1533-51. Taniguchi, K. and Chern W. "Income Elasticity of Rice Demand in Japan and its Implications: Cross
Sectional Data Analysis." Selected paper. 2000 Annual American Agricultural Economics Association.
Tokoyama, Y., S. Takagi, K. Ishibashi, and W.S. Chern. "Recent Food Consumption Pattern of Japanese
Households: Driving Forces Behind Westernization." Selected paper. 2002 Annual Meeting American Agricultural Economics Association.
Watts, H. "Long-Run Income Expectations and Consumer Savings." In Studies in Household Economic
Behavior, Dernburg, T.et al. (eds.). Yale University Press, 1958. Weil, D. "The Saving of the Elderly in Micro and Macro Data." The Quarterly Journal of Economics
109(1)(1994):55-81.
19
Figure 1: Average monthly food expenditure (per household) and food budget share for selected food commodities, 1997
Average Food Expenditure Over Life Time
0
50
100
150
200
250
300
< 30 31-40 41-50 51-60 61-70 > 70
Age Range
Yen
Fish
Milk
Meat
Fruits
Vegetables
Eggs
Average Food Budget Share Over Life Time
0
0.05
0.1
0.15
0.2
0.25
0.3
0.35
< 30 31-40 41-50 51-60 61-70 > 70
Age Range
Food
Bud
get S
hare
Rat
io
Vegetables
Eggs
Milk
Meat
Fruits
Fish
20
Figure 2: Food consumption (budget share) by income class over life time, 1997
Fish Consumption (Budget Share) By Income Class Over Life Time
0
0.1
0.2
0.3
0.4
< 30 31-40 41-50 51-60 61-70 > 70
Age Range
Ave
rage
Foo
d B
udge
t Sha
re
Class 1 Class2 Class 3 Class 4 Class 5
Meat Consumption (Budget Share) By Income Class Over Life Time
0
0.1
0.2
0.3
0.4
< 30 31-40 41-50 51-60 61-70 > 70
Age Range
Ave
rage
Foo
d B
udge
t Sha
re
Class 1 Class2 Class 3 Class 4 Class 5
Milk Consumption (Budget Share) By Income Class Over Life Time
0
0.05
0.1
0.15
0.2
< 30 31-40 41-50 51-60 61-70 > 70
Age Range
Ave
rage
Foo
d B
udge
t Sha
re
Class 1 Class2 Class 3 Class 4 Class 5
Egg Consumption (Budget Share) By Income Class Over Life Time
0
0.025
0.05
0.075
0.1
< 30 31-40 41-50 51-60 61-70 > 70
Age Range
Ave
rage
Foo
d B
udge
t Sha
re
Class 1 Class2 Class 3 Class 4 Class 5
Vegetable Consumption (Budget Share) By Income Class Over Life Time
0
0.1
0.2
0.3
0.4
< 30 31-40 41-50 51-60 61-70 > 70
Age Range
Ave
rage
Foo
d B
udge
t Sha
re
Class 1 Class2 Class 3 Class 4 Class 5
Fruit Consumption (Budget Share) By Income Class Over Life Time
0
0.1
0.2
0.3
0.4
< 30 31-40 41-50 51-60 61-70 > 70
Age Range
Ave
rage
Foo
d B
udge
t Sha
re
Class 1 Class2 Class 3 Class 4 Class 5

21
Figure 3: Social-demographic characteristics of Japanese households at different ages, 1997
Household Income and Food Expenditure Ratio
5,371,207
6,729,205
8,104,693
9,032,047
6,452,934
5,199,118
0.372
0.349
0.312
0.291
0.283
0.229
3,000,000
4,000,000
5,000,000
6,000,000
7,000,000
8,000,000
9,000,000
10,000,000
< 30 31-40 41-50 51-60 61-70 > 70
Age Range
Yen
0.100
0.150
0.200
0.250
0.300
0.350
0.400
Food
to T
otal
Exp
endi
ture
Rat
io
Household Income Food to Total Expenditure Ratio
Average Number of Family Members in Household
2.88
3.95 4.04
3.22
2.62
2.39
2
3
4
5
< 30 31-40 41-50 51-60 61-70 > 70
Age Range
Children Composition in Households
0
0.2
0.4
0.6
0.8
1
< 30 31-40 41-50 51-60 61-70 > 70
Age Range
Ave
rage
Num
ber o
f Chi
ldre
n In
A H
ouse
hold
Aged 5 and Under Age Between 6 and 12 Age Between 13 and 18
Location Distribution of Household At Different Ages
0%
20%
40%
60%
80%
100%
< 30 31-40 41-50 51-60 61-70 > 70
Age Range
Large Cities with Population More than a Million
Towns and Villages
Medium Size Cities Such as Suburb Areas

22
Table 1: Sample means for different food items and demographic variables
Variables Age Less Than 41 years
Age Between 41 and 60 years
Age More Than 60 years
(N = 317) (N = 620) (N = 344) Fish 126.71 235.58 262.24 Meat 170.13 243.58 158.25 Milk 62.32 76.55 74.89 Eggs 26.94 31.70 24.14 Vegetables 153.19 230.56 230.13
Monthly Food Expenditure per Household (Yen)
Fruits 73.88 128.32 173.33 Fish 1.77 1.85 1.98 Meat 1.53 1.78 1.96 Milk 0.20 0.21 0.23 Eggs 0.28 0.28 0.29 Vegetables 0.41 0.42 0.42
Price (Yen/ 100g; except for milk, Yen/ 100 ml)
Fruits 0.50 0.49 0.58 Fish 19.21% 23.83% 26.73% Meat 27.51% 25.00% 17.52% Milk 10.79% 8.81% 8.92% Eggs 4.82% 3.74% 2.97% Vegetables 25.94% 25.07% 25.89%
Budget Share
Fruits 11.71% 13.52% 17.94% Demographic Characteristics Household Annual Income (Yen) 6,488,707 8,555,597 6,081,163 Age of Householder 34.53 50.22 68.49 Income Class 1 Annual Income less than 4,020,000 Yen 12.93% 11.13% 34.59% Income Class 2 Between 4,020,000 and 5,680,000 Yen 30.59% 12.10% 25.00% Income Class 3 Between 5,680,000 and 7,450,000 Yen 28.39% 19.52% 17.44% Income Class 4 Between 7,450,000 and 9,900,000 Yen 19.55% 27.42% 9.88% Income Class 5 Higher than 9,900,000 Yen 8.52% 29.83% 13.08% Large City Population more than 1 million 17.03% 18.39% 18.31% Medium Sized City Population between 50,000 and 1 million 70.97% 66.45% 67.15% Small Town and Villages Population less than 50,000 11.98% 15.16% 14.53%
Household Sizes Numbers of people in a household 3.77 3.65 2.56
Children under 6 Numbers of children aged less than 6 years in a household 0.81 0.10 0.03
Children between 6-12 Numbers of children aged between 6 and 12 years in a household 0.72 0.36 0.04
Children between 12-18 Numbers of children aged between 12 and 18 years in a household 0.12 0.52 0.03

23
Table 2: Statistics for structural differences across age groups Age Less Than 41 vs.
Age Between 41 and 60 Age Less Than 41 vs. Age More Than 60
Age Between 41 and 60 vs. Age More Than 60
Likelihood Ratio Test a The group of five food commodities 4037.6* 209.8* 3,827.8*
Chow Test b
Fish 1.827* 1.508 0.743 Meat 2.814* 6.237* 3.401* Milk 1.090 1.599* 2.085* Eggs 1.873* 1.847* 0.868 Vegetables 1.115 0.976 2.246* Note: * indicates that the hypothesis that there is no structural change between different age groups is rejected at 95% confidence. a Critical Chi-Squared value is 28.87 (df = 18, 5 %) b Critical F-Value is 1.57 (df = 18, >300).
Table 3: Parameter estimates of demographic characteristics for six food commodities
Fish Meat Milk Demographic
Characteristics Age Less Than 41
Age Between
41 and 60
Age Over 60
Age Less Than 41
Age Between
41 and 60
Age Over 60
Age Less Than 41
Age Between
41 and 60
Age Over 60
Income Class 2 -0.0133 0.0368* -0.0218 -0.0023 0.0031 -0.0034 0.0062 -0.0217* 0.0049 Income Class 3 -0.0133 0.0134 -0.0241 -0.0114 0.007 -0.0049 0.0094 -0.0023 0.0248* Income Class 4 -0.0099 0.0178 -0.0139 -0.0667* -0.0178 0.0073 0.0356* 0.0001 0.0207 Income Class 5 -0.0781* 0.0081 -0.0075 -0.0287 -0.0202 -0.0065 0.0303* 0.0117 0.0292* Family size 0.0217* -0.0076 -0.0186* -0.0094 0.0101* 0.0392* -0.0093 0.0046 -0.0061 Large City -0.0246 -0.0208 -0.0585* -0.0129 0.0002 -0.0402* 0.0184 0.0031 -0.0148 Medium Sized City -0.0045 -0.0159 -0.0304 -0.0333 -0.0039 -0.0209 0.0176 0.0107 -0.0213* Children under 6 -0.0293* -0.0059 0.0068 -0.0045 0.0111 -0.0634* 0.0318* -0.0006 0.0444* Children between 6-12 -0.0149 -0.0228* -0.0084 -0.0025 0.0111* -0.0698* 0.0134 0.0172* 0.0358* Children between 12-18 -0.0245 -0.0194* -0.012 0.0543* 0.0343* 0.0679* 0.013 0.0075* -0.0013
Eggs Vegetables Fruits Demographic
Characteristics Age Less Than 41
Age Between
41 and 60
Age Over 60
Age Less Than 41
Age Between
41 and 60
Age Over 60
Age Less Than 41
Age Between
41 and 60
Age Over 60
Income Class 2 -0.0019 0.0029 -0.0017 0.0047 -0.0061 -0.0163 0.0066 -0.015 0.0383 Income Class 3 -0.0004 -0.0002 -0.0013 0.0072 -0.0078 -0.0173 0.0085 -0.0101 0.0228 Income Class 4 -0.0082 -0.0003 -0.0018 0.0058 0.0119 -0.0267 0.0434 -0.0117 0.0144 Income Class 5 0.0054 -0.0017 0.0015 0.0208 0.0036 -0.0291 0.0503 -0.0015 0.0124 Family size 0.0082* 0.0025* 0.0056* -0.0121* -0.0017 0.007 0.0009 -0.0079 -0.0271 Large City -0.0105* -0.0053* 0.0028 0.0419* 0.0076 0.0797* -0.0123 0.0152 0.031 Medium Sized City -0.0067 -0.0038 -0.0027 0.0485 -0.0017 0.0757* -0.0216 -0.0146 -0.0004 Children under 6 -0.0041 -0.0028 -0.0089 0.0033 0.0156 -0.0043 0.0028 -0.0174 0.0254 Children between 6-12 0.0003 0.0011 -0.0113* 0.0054 -0.0067 0.0016 -0.0017 0.0001 0.0521 Children between 12-18 -0.0059 0.0029* -0.0003 -0.0049 -0.0082 -0.0111 -0.032 -0.0171 -0.0432 Note: * indicates statistically significant coefficient at 90% confidence.
24
Table 4: Expenditure elasticity for different age groups a
Food Item Age Less Than 41 Age Between 41 and 60 Age More Than 60 Fish 1.17 1.21 1.22 Meat 1.07 1.05 0.83 Milk 0.76 0.63 0.49 Eggs 0.54 0.47 0.39 Vegetables 0.91 0.92 1.01 Fruits 1.13 1.04 1.15
a Expenditure Elasticity is estimated by the following formula: i
ii w
e β+= 1
Table 5: Hicksian compensated price elasticity for different age group a Price-Fish Price-Meat Price-Milk Price-Eggs Price-Vegt. Price-Fruits Age Less than 41 Fish -0.4434 0.2375 -0.0478 0.0399 0.1568 0.0570 Meat 0.1657 -0.3020 -0.0243 -0.0294 0.1073 0.0827 Milk -0.0852 -0.0620 -0.1618 -0.0153 0.2467 0.7776 Eggs 0.1590 -0.1680 -0.0342 -0.3814 0.3933 0.0313 Vegetables 0.1161 0.1138 0.1026 0.0732 -0.5146 0.1088 Fruits 0.0935 0.1943 0.0715 0.0129 0.2412 -0.6134 Age Between 41 and 60 Fish -0.4175 0.1497 0.0126 0.0180 0.1771 0.0600 Meat 0.1426 -0.3092 -0.0301 0.0139 0.0377 0.1452 Milk 0.0342 -0.0859 -0.1076 0.0162 0.1123 0.0308 Eggs 0.1151 0.0931 -0.0382 -0.4391 0.2293 -0.0367 Vegetables 0.1683 0.0376 0.0395 0.0342 -0.3360 0.0564 Fruits 0.1058 0.2683 0.0200 -0.0101 0.1046 -0.4886 Age over 60 Fish -0.3337 0.0959 -0.0331 0.0128 0.1453 0.1128 Meat 0.1463 -0.4047 0.0492 0.0069 0.2216 -0.0193 Milk -0.0992 0.0965 -0.2062 0.0373 0.2423 -0.0709 Eggs 0.1152 0.0407 0.1119 -0.3575 0.1526 -0.0630 Vegetables 0.1499 0.1499 0.0836 0.0175 -0.5601 0.1589 Fruits 0.1681 -0.0188 -0.0352 -0.0104 0.2294 -0.3330
a Hicksian compensated elasticities are expressed as: ( )ijijij ewes *+= The corresponding elasticities can be estimated by the following formula
iji
jjiijii w
PXwe δ
ββγ−
−−=
))/(ln(
where
=
=Otherwise
jiifij 0
1δ

25
Appendix 1: Parameter estimates of the AIDS model for age group less than 41 a
Fish Meat Milk Eggs Vegetables Fruits Alpha -0.1571* 0.0458 0.3887* 0.2112* 0.4745* 0.0368 (0.084) (0.094) (0.063) (0.024) (0.073) Beta 0.0332* 0.0203 -0.0258* -0.0218* -0.0212* 0.0152 (0.013) (0.014) (0.008) (0.003) (0.011) Gamma (fish) 0.0618* -0.0122 -0.0236* 0.0037 -0.0145 -0.0153 (0.013) (0.011) (0.007) (0.003) (0.009) Gamma (meat) 0.1133* -0.0325* -0.0181* -0.0387* 0.0117 (0.018) (0.010) (0.004) (0.013) Gamma (milk ) 0.0739* -0.0110* -0.0054 -0.0014 (0.012) (0.005) (0.010) Gamma (eggs) 0.0240* 0.0031 -0.0017 (0.004) (0.005) Gamma (vegetables) 0.0553* 0.0002 (0.016) Gamma (fruits) 0.0299 Income Class 2 -0.0133 -0.0023 0.0062 -0.0019 0.0047 0.0066 (0.019) (0.021) (0.012) (0.005) (0.016) Income Class 3 -0.0133 -0.0114 0.0094 -0.0004 0.0072 0.0085 (0.019) (0.022) (0.013) (0.005) (0.017) Income Class 4 -0.0099 -0.0667* 0.0356* -0.0082 0.0058 0.0434 (0.021) (0.024) (0.014) (0.005) (0.019) Income Class 5 -0.0781* -0.0287 0.0303* 0.0054 0.0208 0.0503 (0.026) (0.028) (0.014) (0.007) (0.022) Family size 0.0217* -0.0094 -0.0093 0.0082* -0.0121 0.0009 (0.013) (0.014) (0.008) (0.003) (0.010) Large City -0.0246 -0.0129 0.0184 -0.0105* 0.0419* -0.0123 (0.023) (0.025) (0.015) (0.006) (0.019) Medium Sized City -0.0045 -0.0333 0.0176 -0.0067 0.0485* -0.0216 (0.002) (0.021) (0.012) (0.005) (0.015) Children under 6 -0.0293* -0.0045 0.0318* -0.0041 0.0033 0.0028 (0.015) (0.016) (0.010) (0.004) (0.012) Children between 6-12 -0.0149 -0.0025 0.0134 0.0003 0.0054 -0.0017 (0.014) (0.015) (0.009) (0.004) (0.011) Children between 12-18 -0.0245 0.0543* 0.0130 -0.0059 -0.0049 -0.0320 (0.019) (0.022) (0.012) (0.005) (0.016) R2 0.168 0.169 0.196 0.316 0.145 Adj. R2 0.129 0.131 0.159 0.284 0.106 Sum Squared Residual 3.105 3.765 1.351 0.214 2.165 a The figure in parenthesis is the standard error. Since the symmetry restriction is imposed, only upper triangular of these parameter estimates is reported. * indicates statistically significant coefficient at 90% confidence.

26
Appendix 2: Parameter estimates of the AIDS model for age group between 41 and 60 a
Fish Meat Milk Eggs Vegetables Fruits Alpha -0.1699* -0.0393 0.3936* 0.1903* 0.4869* 0.1384 (0.069) (0.069) (0.044) (0.015) (0.059) Beta 0.0511* 0.0137 -0.0323* -0.0196* -0.0189* 0.0059 (0.010) (0.010) (0.006) (0.002) (0.009) Gamma (fish) 0.0611* -0.0295* -0.0048 0.0034 -0.0098 -0.0203 (0.012) (0.009) (0.007) (0.003) (0.008) Gamma (meat) 0.1087* -0.0261* -0.0037 -0.0512* 0.0018 (0.013) (0.007) (0.003) (0.009) Gamma (milk ) 0.0626* -0.0069 -0.0171* -0.0077 (0.008) (0.003) (0.007) Gamma (eggs) 0.0165* -0.0037 -0.0055 (0.002) (0.003) Gamma (vegetables) 0.1098* -0.0189 (0.012) Gamma (fruits) -0.0506 Income Class 2 0.0368* 0.0031 -0.0217* 0.0029 -0.0061 -0.0150 (0.018) (0.018) (0.011) (0.004) (0.016) Income Class 3 0.0134 0.0070 -0.0023 -0.0002 -0.0078 -0.0101 (0.016) (0.017) (0.010) (0.001) (0.014) Income Class 4 0.0178 -0.0178 0.0001 -0.0003 0.0119 -0.0117 (0.016) (0.016) (0.009) (0.003) (0.013) Income Class 5 0.0081 -0.0202 0.0117 -0.0017 0.0036 -0.0015 (0.016) (0.016) (0.010) (0.003) (0.014) Family size -0.0076 0.0101* 0.0046 0.0025* -0.0017 -0.0079 (0.006) (0.006) (0.003) (0.001) (0.005) Large City -0.0208 0.0002 0.0031 -0.0053 0.0076 0.0152 (0.015) (0.015) (0.009) (0.003) (0.013) Medium Sized City -0.0159 -0.0039 0.0107 -0.0038 -0.0017 -0.0146 (0.013) (0.012) (0.007) (0.002) (0.011) Children under 6 -0.0059 0.0111 -0.0006 -0.0028 0.0156 -0.0174 (0.015) (0.014) (0.009) (0.003) (0.013) Children between 6-12 -0.0228* 0.0111 0.0172* 0.0011 -0.0067 0.0001 (0.008) (0.008) (0.005) (0.001) (0.007) Children between 12-18 -0.0194* 0.0343* 0.0075* 0.0029* -0.0082 -0.0171 (0.007) (0.007) (0.004) (0.001) (0.006) R2 0.164 0.195 0.188 0.281 0.143 Adj. R2 0.145 0.176 0.169 0.264 0.123 Sum Squared Residual 7.188 7.071 2.681 0.282 5.185 a The figure in parenthesis is the standard error. Since the symmetry restriction is imposed, only upper triangular of these parameter estimates is reported. * indicates statistically significant coefficient at 90% confidence.

27
Appendix 3: Parameter estimates of the AIDS model for age group over than 60 a
Fish Meat Milk Eggs Vegetables Fruits Alpha -0.2076* 0.2269* 0.5284* 0.1673* 0.2063* 0.0787 (0.104) (0.088) (0.065) (0.018) (0.092) Beta 0.0593* -0.0294* -0.0454* -0.0180* 0.0051 0.0284 (0.014) (0.012) (0.008) (0.002) (0.013) Gamma (fish) 0.0796* -0.0078 -0.0120 0.0037 -0.0327* -0.0308 (0.018) (0.012) (0.009) (0.003) (0.011) Gamma (meat) 0.0669* -0.0173 -0.0081* -0.0054 -0.0284 (0.014) (0.009) (0.003) (0.011) Gamma (milk ) 0.0470* -0.0056* 0.0003 -0.0124 (0.011) (0.003) (0.008) Gamma (eggs) 0.0157* -0.0024 -0.0033 (0.002) (0.003) Gamma (vegetables) 0.0467* -0.0064 (0.015) Gamma (fruits) -0.0813 Income Class 2 -0.0218 -0.0034 0.0049 -0.0017 -0.0163 0.0383 (0.017) (0.014) (0.010) (0.003) (0.015) Income Class 3 -0.0241 -0.0049 0.0248* -0.0013 -0.0173 0.0228 (0.019) (0.017) (0.012) (0.003) (0.017) Income Class 4 -0.0139 0.0073 0.0207 -0.0018 -0.0267 0.0144 (0.024) (0.021) (0.014) (0.004) (0.021) Income Class 5 -0.0075 -0.0065 0.0292* 0.0015 -0.0291 0.0124 (0.023) (0.020) (0.014) (0.004) (0.021) Family size -0.0186* 0.0392* -0.0061 0.0056* 0.0070 -0.0271 (0.011) (0.009) (0.006) (0.002) (0.009) Large City -0.0585* -0.0402* -0.0148 0.0028 0.0797* 0.031 (0.024) (0.020) (0.014) (0.003) (0.021) Medium Sized City -0.0304* -0.0209 -0.0213* -0.0027 0.0757* -0.0004 (0.019) (0.017) (0.012) (0.003) (0.017) Children under 6 0.0068 -0.0634* 0.0444* -0.0089 -0.0043 0.0254 (0.045) (0.038) (0.026) (0.007) (0.039) Children between 6-12 -0.0084 -0.0698* 0.0358* -0.0113* 0.0016 0.0521 (0.035) (0.030) (0.021) (0.006) (0.031) Children between 12-18 -0.0120 0.0679* -0.0013 -0.0003 -0.0111 -0.0432 (0.040) (0.034) (0.023) (0.006) (0.035) R2 0.192 0.174 0.201 0.304 0.103 Adj. R2 0.158 0.139 0.167 0.274 0.065 Sum Squared Residual 4.881 3.528 1.688 0.127 3.743 a The figure in parenthesis is the standard error. Since the symmetry restriction is imposed, only upper triangular of these parameter estimates is reported. * indicates statistically significant coefficient at 90% confidence.