postwar private consumption patterns of japanese ... · postwar private consumption patterns of...
TRANSCRIPT

Postwar Private Consumption Patternsof Japanese Households:
The Role of Consumer Durables
Atsushi Maki
247
A U S T R A L I A – J A P A N R E S E A R C H C E N T R E
PACIFIC ECONOMIC PAPERS
NO. 262, DECEMBER 1996

Private Postwar Consumption Patternsof Japanese Households:
The Role of Consumer Durables
Atsushi MakiFaculty of Business and Commerce
Keio University
A U S T R A L I A – J A P A N R E S E A R C H C E N T R E
PACIFIC ECONOMIC PAPER NO. 262
DECEMBER 1996

ii
© Australia–Japan Research Centre 1996
This work is copyright. Apart from those uses which may be permitted under the
Copyright Act 1968 as amended, no part may be reproduced by any process
without written permission.
Pacific Economic Papers are published under the direction of the Research
Committee of the Australia–Japan Research Centre. The opinions expressed are
those of the author(s) and do not necessarily reflect the views of the Centre.
The Australia–Japan Research Centre is part of the Economics Division of the
Research School of Pacific and Asian Studies, The Australian National Univer-
sity, Canberra.
ISSN 0728 8409
ISBN 0 86413 203 4
Australia–Japan Research Centre
Research School of Pacific and Asian Studies
The Australian National University
Canberra ACT 0200
Telephone: (61 6) 249 3780
Facsimile: (61 6) 249 0767
Email: [email protected]
URL: http://coombs.anu.edu.au/SpecialProj/AJRC/ajrcpage.html
Edited by Judy Kelly and Gary Anson
Typeset by Minni Reis

iii
CONTENTS
List of tables and figures ................................................................................... vi
Introduction ........................................................................................................ 1
A higher standard of living .................................................................................. 4
Overall trends in consumption patterns ............................................................... 6
The role of consumer durables in the high economic growth era ....................... 8
Investment–saving balance and data on the household saving rate ................... 13
Conclusion ........................................................................................................ 14
Appendix ........................................................................................................... 16
Notes ................................................................................................................. 18
References ......................................................................................................... 20

iv
TABLES
Table 1 Population and number of households ........................................ 5
Table 2 Essential goods and services in 1960 and 1970 .......................... 7
Table 3 The stimulus of purchasing consumer durables ........................... 9
Table 4 Prices for automobiles and TV sets, and financialassets for households, 1953–80 ................................................ 11
FIGURES
Figure 1 Diffusion of consumer durables ................................................ 12
Figure 2 Contents of saving..................................................................... 15

1
ABSTRACT
In Japan in the 1950s and 1960s the economic objectives for consumers, corpora-tions and the government coincided. Consumers wanted to improve their standardof living, corporations tried to increase their productivity through modernisationand industrialisation and the government attempted to foster a new economicsystem to rebuild the devastated economy after the Second World War and tomaintain employment security. The desire to purchase consumer durables forhouseholds was significant in stimulating development and the role of consumerdurables was important in stimulating investment and the supply of financialcapital through household savings. The government had to channel such savingsto corporations in order to increase domestic supply and to satisfy the desire ofhouseholds to purchase consumer durables to increase the standard of living.
POSTWAR CONSUMPTION PATTERNS OF JAPANESE HOUSE-HOLDS: THE ROLE OF CONSUMER DURABLES
Introduction
Recently, Japanese economic power has grown apace in world commodity and financial
markets. Japan’s balance-of-payments has been in surplus since 1985 and it is presently the
largest asset-holding country in the world. The rapid emergence of the Japanese economy is one
of the more striking developments in the international economy since the Second World War.
Japan’s phenomenal economic growth after the Second World War is referred to as the
‘Japanese miracle’. After the Second World War, the Japanese economy was in ruins. About
25 per cent of its capital stock was destroyed, and Japan had to absorb huge numbers of
repatriates. At that time, the most important economic policies of the Japanese government were
recovery of the capital stock and maintaining employment security for the swollen labour force.
To promote industrial production in the 1950s, the Japanese government implemented the
Preferential Production Plan and devised industrial policy based on negotiations between the
government (mainly the Ministry of International Trade and Industry), corporate management
and labour union leaders.
Japanese monetary policy as instigated by the Ministry of Finance and the Bank of Japan
created favourable conditions for Japan’s economic recovery. The characteristics of the

2
Japanese financial system after the Second World War through to the 1980s include a low
interest rate policy, establishment of short-term and long-term lending institutions, distinctions
between the activities of commercial and trust banks and security companies and, lastly, foreign
exchange controls by the government and a system of collateral security in borrowing money
from financial institutions.
Through a combination of industrial and monetary policy, the government created a quasi-
closed economy. Despite the government’s low interest rate policy, financial funds held by
households did not move abroad due to the foreign exchange controls that the government
imposed. Imports of final products were restricted, especially before 1965, by the government’s
protectionist policies and regulations. On the other hand, the Japanese government promoted
exports of quality goods such as steel, automobiles and electrical appliances.
In the initial period of recovery, households supplied funds to industry as loans through
financial institutions. This indirect finance system, relying on bank loans rather than bond or
equity markets, characterised the post-Second World War Japanese economy. The financial
institutions attracted deposits from the household sector at government-mandated low interest
rates and lent funds to corporations. The corporations had the advantage of access to a large
amount of low cost investment funds in the domestic market. At this time, the government
imposed strict foreign exchange controls in order to control import and investment flows.
Through such economic policies, the government sought to promote exports and facilitate the
importation of natural resources.
Japanese economic growth followed the pattern of ‘modern economic growth’ proposed
by Kuznets (1966). Industrialisation, urbanisation and technological innovation were three
factors crucial to modern economic growth. Kuznets (1966) wrote in relation to changes in the
patterns of consumer spending due to modern economic growth that:
Urban life, with the anonymity of its dense population masses, with the detachment
from earlier roots of the large immigrant component, and with the ease of
observation and imitation of consumption patterns, may facilitate higher consump-
tion levels by permitting greater play of the demonstration effect and by increasing
sensitivity to new consumer goods. Here again the effects may be reflected in the
trends in consumer expenditures relative to those of savings and capital formation,
and in some components of total consumer expenditures more than others …

3
Technological changes, the main source of modern economic growth, affect
consumer goods by the creation of new types and by major changes in the old. Even
in the case of food, modern canning, freezing, etc. are new processes that affect the
total demand for food and its distribution among various categories and this must
be reflected in the processing of the PTD component (processing, transportation,
and distribution). Such technological changes are even more conspicuous when
they lead to entirely new consumer goods — synthetic fiber textiles, household
electrical appliances, radio and television sets, passenger cars, airplane transpor-
tation, and the like. The relative technological impact on consumer goods and on
capital goods is difficult to measure, but this is not important in the present
connection. However, it is important to recognise the continuous and far-reaching
effect of technological changes on consumer goods — as would be revealed by a
brief glance at the variety of consumer goods used in recently developed countries
and resulting from relatively recent technological progress. (Kuznets 1966, pp.274–
7).
Economic progress since the Second World War has led to more rapid changes in the socio-
economic structure of Japanese households compared with the experience of the United States
or Europe. The phenomena of industrialisation and urbanisation, together with technological
innovation, have contributed to the increase in living standards of Japanese households in a
relatively short period. After the Second World War the Japanese economy passed through three
distinct phases: a period of recovery in the 1950s after the economic destruction wrought by the
Second World War, rapid economic growth in the 1960s and the early half of the 1970s, and
stable economic growth in the 1980s after the two oil shocks in 1973–74 and 1979–80. This
paper focuses mainly on the first two phases.
In a series of works, Kuznets stressed the impact of structural changes in the industrial
sector. Applying the Kuznets’ hypothesis of modern economic growth, the present paper
discusses population growth and per capita GNP growth in the Japanese economy after the
Second World War. The focus is on the movements in consumption patterns and consumer
durables and how these led to structural change in the industrial sector.
In Japan in the 1950s and 1960s, the economic objectives for consumers, corporations and
the government coincided. Consumers wanted to improve their standard of living, corporations
tried to increase their productivity through modernisation and industrialisation, and the
4
government attempted to foster a new economic system through industrial and monetary policies
aimed at rebuilding the war-devastated economy and to maintain employment security.
Kuznets’s main economic criteria for modern economic growth are steady population
growth and a rise in per capita GNP where the rise in GNP is faster than that of population
growth. Section 2 discusses living conditions in Japanese households after the Second World
War, focusing on changes in GNP, per capita GNP, population and family composition of the
household. Section 3, focusing on household behaviour, discusses the overall movement of
consumption patterns. Section 4 presents various reasons for the high rate of saving the Japanese
household sector maintained and explains how this was influenced by the decision to purchase
consumer durables. I also elucidate the reasons which stimulated high levels of household
savings and how these led to an increase in domestic investment. In considering Japan’s
economic growth, it is important to consider increases in both national supply capacity and
domestic demand. Section 5 discusses the balance of investment and savings and their growth
from the household standpoint and introduces data on the household savings rate. Section 6
presents some conclusions.
A higher standard of living
The word ‘miracle’ has been used frequently in relation to Japanese economic development
since the 1950s.1 The Long Term Estimates of the National Accounts from 1955 to 1969,
compiled by the Economic Planning Agency, reports that the growth rate of the nominal GNP
from 1955 to 1970 was 15.7 per cent per annum and that of the real GNP was 10.0 per cent.
A growth rate of 10 per cent means that after five years the economy increases 1.6 times
compared to the base year, 2.6 times after ten years, and 4.2 times after fifteen years.
Although the era of high economic growth in the 1960s and 1970s lasted only fifteen years,
economic growth quadrupled.2 Following the oil shocks of 1973–74 and 1979–80, the growth
rate of real GNP levelled at 4 per cent per annum.
In 1955 per capita GNP stood at ¥94,000, rising to ¥1,329,000 in 1975, a fourteen-fold
increase during that period. After correcting for price increases, the real level of expansion in
the same period was 410 per cent. The average growth rate of real per capita GNP for the 21
years from 1955 to 1975 was 7 per cent.
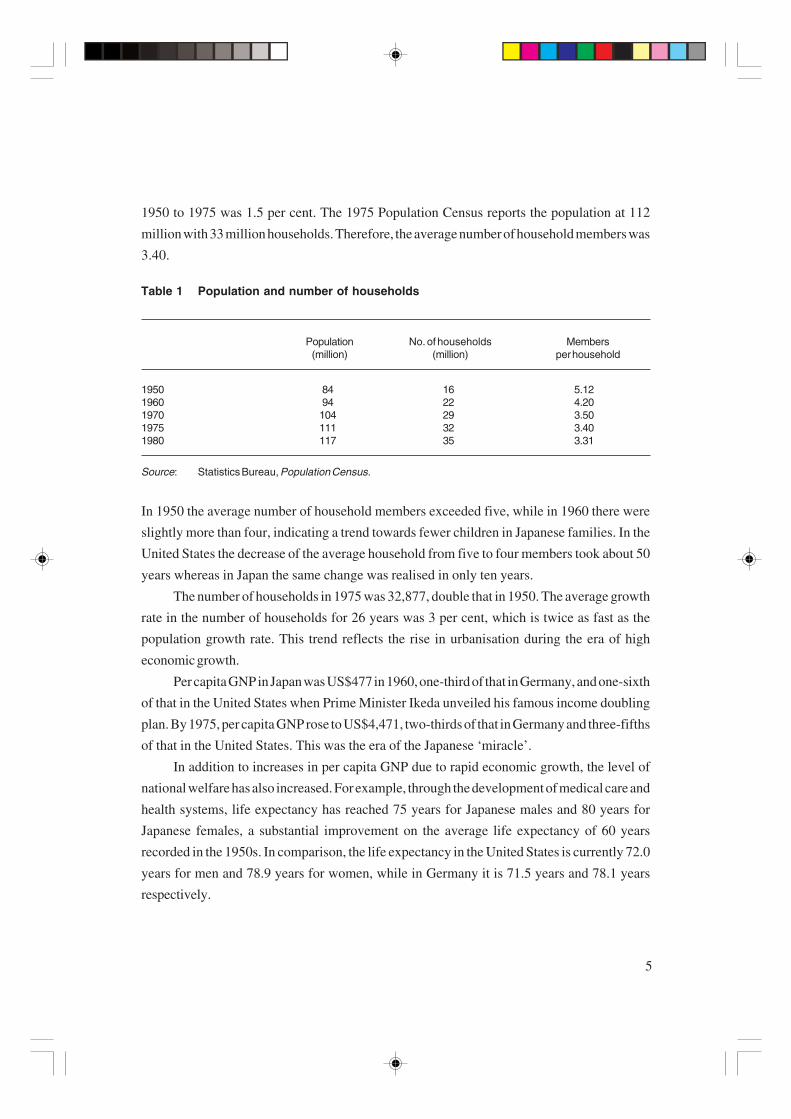
Table 1 indicates population size between 1950 and 1980 inclusive, with variations in the
number of households and household members. The average growth rate of population from
5
1950 to 1975 was 1.5 per cent. The 1975 Population Census reports the population at 112
million with 33 million households. Therefore, the average number of household members was
3.40.
Table 1 Population and number of households
Population No. of households Members(million) (million) per household
1950 84 16 5.121960 94 22 4.201970 104 29 3.501975 111 32 3.401980 117 35 3.31
Source: Statistics Bureau, Population Census.
In 1950 the average number of household members exceeded five, while in 1960 there were
slightly more than four, indicating a trend towards fewer children in Japanese families. In the
United States the decrease of the average household from five to four members took about 50
years whereas in Japan the same change was realised in only ten years.
The number of households in 1975 was 32,877, double that in 1950. The average growth
rate in the number of households for 26 years was 3 per cent, which is twice as fast as the
population growth rate. This trend reflects the rise in urbanisation during the era of high
economic growth.
Per capita GNP in Japan was US$477 in 1960, one-third of that in Germany, and one-sixth
of that in the United States when Prime Minister Ikeda unveiled his famous income doubling
plan. By 1975, per capita GNP rose to US$4,471, two-thirds of that in Germany and three-fifths
of that in the United States. This was the era of the Japanese ‘miracle’.
In addition to increases in per capita GNP due to rapid economic growth, the level of
national welfare has also increased. For example, through the development of medical care and
health systems, life expectancy has reached 75 years for Japanese males and 80 years for
Japanese females, a substantial improvement on the average life expectancy of 60 years
recorded in the 1950s. In comparison, the life expectancy in the United States is currently 72.0
years for men and 78.9 years for women, while in Germany it is 71.5 years and 78.1 years
respectively.

6
The rapid rise in per capita GNP translated into an enormous increase in Japanese
households’ consumption levels. Households can now afford many kinds of goods and services
which were either unavailable or unaffordable after the Second World War.
Overall trends in consumption patterns
In Japan higher living standards are reflected by two trends: labour-saving devices which have
replaced much manual domestic labour and the shift from home duties to external services, such
as laundromats or take-away food.
With the proliferation of labour-saving devices, housewives’ working hours have
decreased and leisure hours have increased. Simultaneously, corporation advertising has
increased consumers’ knowledge about a variety of commodities and services, stimulating them
to purchase goods of steadily improving quality at decreasing prices.
Engel’s coefficient, indicating the ratio between expenditure on food and on total
consumption, decreased during the 1950s and 1960s, and the shift in diet from cereals to fish,
meat and vegetables, indicates that eating habits had become ‘Westernised’. The expenditure
on take-away food increased rapidly due to income growth and a desire for buying services
instead of resorting to home production. Usually, Engel’s law is verified in the cross-sectional
data. However, because of the enormous increase in income during the era of high economic
growth, the decrease in the budgetary allocation for food in the time series data is also evident
among Japanese households.
In addition to the decrease of Engel’s coefficient in the 1950s and 1960s, the change of
consumption patterns, reflecting the changes in essential goods and services as defined by the
theory, is also observed in the consumer behaviour of Japanese households. Maki (1983)
analysed consumer behaviour for Japanese households from the 1950s to the mid-1970s using
a complete demand system called the linear expenditure system (LES), which includes family
size and consumer trends in addition to total expenditure and prices.
The series of consumption and expenditure data published in the Family Income and
Expenditure Survey (FIES) compiled by the Statistics Bureau was used for the analysis. The
data covers all households in cities with a population of 50,000 or more except for one-person
households and households engaged in agriculture, forestry and fishing. This means that the data
covers mainly households which comprise workers and individual proprietors.
Table 2, drawn from Maki (1983), indicates essential goods and services in 1960 and
1970, respectively.3, 4 Items which were in demand in 1960, but were regarded in 1970 as no

7
longer essential, are marked by a single asterisk, in the left-hand column in Table 2. These
include the following six items: barley and other cereals (item 2), bread (item 3), fuel and light,
excluding gas (item 35), cloth and thread (item 40), shoes and footwear (item 42) and stationery
and writing supplies (item 53). On the other hand, there were eight items or services which
became indispensable in 1970, marked by two asterisks in the right-hand column of Table 2.
These were meat (item 8), non-alcoholic beverages (item 21), repairs and maintenance (item
Table 2 Essential goods and services in 1960 and 1970
1960 1970
FoodRice (item 1) Rice (item 1)Barley and other cereals (item 2) *Bread (item 3) *Noodles and others (item 4) Noodles and others (item 4) Meat (item 8) **Leafy vegetables (item 10) Leafy vegetables (item 10)Root vegetables (item 11) Root vegetables (item 11)Other vegetables (item 12) Other vegetables (item 12)Processed food (item 14) Processed food (item 14)Condiments (item 15) Condiments (item 15)Cakes and candies (item 16) Cakes and candies (item 16)Fruits (item 17) Fruits (item 17)
Non-alcoholic beverages (item 21) **HousingWater (item 25) Repairs and maintenance (item 24) **Tableware (item 26) Water (item 25) Tableware (item 26)
Fuel and lightGas (item 34) Electricity (item 33) **Fuel and light, excluding gas (item 35) * Gas (item 34)
ClothingCloth and thread (item 40) * Japanese clothing (item 36) **Shoes and footwear (item 42) * Shirts and underwear (item 38) **Other clothing (item 45) Other clothing (item 45)
Miscellaneous goods and servicesMedical care (item 46) Medical care (item 46)Toilet tissue (item 47) Toilet tissue (item 47)Detergent laundry (item 48) Detergent laundry (item 48)
User-operated transportation (item 51) **Stationery and writingsupplies (item 53) * Reading and recreation (item 57) **Miscellaneous (item 59) Miscellaneous (item 59)
Source: Maki (1983).

8
24), electricity (item 33), Japanese clothing (item 36), shirts and underwear (item 38), user-
operated transportation (item 51) and reading and recreation (item 57).
The change in Japanese consumption patterns was dependent not only on the supply
structure of corporations in this period but also on the rapid increase in income, the change of
relative prices of goods to services due to industrialisation, the decrease in family size due to
urbanisation, and habit formation in consumer preferences.
Changes to the list of essential goods between 1960 and 1970 testify to the rapid change
in Japanese consumption patterns during this short space of time. In the food categories, the fact
that barley and other cereals (item 2) and bread (item 3) vanished from the menu for essential
goods, and meat (item 8) and non-alcoholic beverages (item 21) appeared as essential items,
reflects the improvement in eating habits due to economic growth while the appearance of
repairs and maintenance (item 24) in housing during 1970 indicates the accumulation of
consumer durables during these eleven years.5
Demand for coal and charcoal from the fuel and light category (item 35), ceased while
demand for electricity (item 33) surfaced in 1970. The demand for electricity is linked with the
growth in electrical goods. The change from cloth and thread (item 40) to shirts and underwear
(item 38) indicates the shift of consumer behaviour to the purchase of finished products. This
change resulted from mass production, reduced commodity prices and the change of marketing
channels.
Finally, some interesting variations appeared under miscellaneous goods and services.
The fact that user-operated transportation (item 51) and reading and recreation (item 57)
became indispensable indicates the improvement in household standards of living from 1960
to 1970.
The 23 essential goods and services in 1960 are subsistence-oriented while the data for
1970 show marked improvement in eating habits and greater recreational opportunities,
reflecting an overall improvement of household living standards due to economic growth.
The role of consumer durables in the high economic growth era
This section clarifies the characteristics of household consumption and savings related to the
purchasing of consumer durables after the Second World War. Japanese households aspired to
the lifestyle prevailing in the United States. Since the 1950s, through radio, TV, movies,
newspapers and magazines which popularised the US way of life, Japanese households gained

9
knowledge about consumer durables such as refrigerators, washing machines, vacuum cleaners
and automobiles. Japanese households also wanted to improve their diet.
The change in consumption patterns is revealing. In 1952, the growth rate of radios was
67.6 per cent, that of electric fans 2.8 per cent, and that of refrigerators only 1 per cent. 1953
is generally accepted as the first year of home electrification when Japanese households aspired
to buy washing machines, vacuum cleaners and refrigerators, calling them the ‘three Jingi’.6
Before explaining the growth of consumer durables, the stimulus to households’ purchase of
consumer durables is explained in Table 3 by journalistic catch-phrases or the corporate
advertisements used in the 1950s and 1960s.
Table 3 The stimulus of purchasing consumer durables
1953 The first year of home electrification‘The three Jingi’ (TV sets, refrigerators and washing machines) or (refrigerators, vacuumcleaners and washing machines)
1959 Private transportation
1966 Second electric appliances boom‘3Cs’ (colour TV sets, coolers [air conditioners] and cars)
1968 ‘New 3Cs’ (cottages, central heating and cookers (electric ovens))
Note: Achievement of the ‘new 3Cs’ is still a target for most Japanese households even in the 1990s.
Source: Weekly Asahi (1988, 1990).
Due to the catch-phrases coined by journalists and corporations, Japanese households identified
the desirable consumer durables and sought to realise their dreams by increasing their savings.
This was mainly because of the immature financial market and liquidity constraints caused by
a system of collateral security in which money was borrowed from financial institutions.7
It is useful to describe one aspect of the liquidity constraints connected with capital
market imperfections. For the household, there are two kinds of assets, human and material
assets. Human assets are obtained from present and future income, and non-human assets
consist of financial and real assets.
With ideal capital markets, human and non-human assets can be readily substituted.
When households want to buy expensive consumer durables, there is no difference between

10
borrowing against future income and non-human assets: the characteristics of human and non-
human assets are identical.
Commercial banks usually discriminate between human and non-human assets for
mortgage loans and this occurred during the transition period in the 1950s and 1960s. From the
viewpoint of uncertainty, human assets are a high risk compared with non-human assets because
of defaults arising from unemployment or death in the household. This means that uncertainty
is more pronounced in future labour income streams than present non-human assets.
Such capital market imperfection generates liquidity constraints for households. Liquid-
ity constraints contribute to delays between the desire to purchase consumer durables and the
realisation of such purchases. The accumulation of financial assets occurs between the desire
to purchase consumer durables and the realisation of the purchase. However, during the 1950s
and 1960s delays were limited because of the price decrease due to technological innovations
fuelled by new investment and also because of the economies of scale on the supply side and
greater household income.
In April 1959 Emperor Akihito and Empress Michiko were married. Producers of black
and white TV sets found that consumers were eager to buy them. One week before the marriage,
the number of TV owners exceeded two million. Live TV coverage of the ceremony accelerated
the distribution of black and white TV sets. In 1960 domestic (Toshiba) colour TV sets were
sold for ¥420,000, which was about 90 per cent of the disposable average annual income for
a household. The Tokyo Olympics were held in 1964. During the games, colour TV sets with
large screens were installed at the corners of busy shopping districts such as the Ginza (Tokyo)
and Umeda (Osaka), stimulating a boom in sales of colour TV sets.
The 1960s featured a proliferation of electrical appliances in Japanese households. Black
and white TV sets, refrigerators, washing machines and vacuum cleaners became popular and
the rate of distribution was very high. This occurred when the income of Japanese households
reached a level sufficient to purchase these kinds of consumer durables.8 However, it took time
for the increased use of more expensive consumer durables such as automobiles due to
insufficient household income and financial assets.
The normal price (namely, sales price divided by disposable income) of automobiles and
colour TV sets, and the level of financial assets for households, are indicated in Table 4.9
The price in 1955 for automobiles, though they were not a new product, was about two
and a half times the average annual income of households. After eight years, the price and annual
income ratio was below unity (0.98), and in 1971 it became half the annual income. In the 1970s

11
many cars were imported from the United States. These were a status symbol, their size and
image indicating wealth. US cars did not suit Japanese traffic conditions and, therefore, were
not intended for a large number of Japanese households.
Table 4 Prices for automobiles and TV sets, and financial assets for households,1953–80
Automobiles B&W TVs Colour TVs Financialassets
1953 — 175,000 (0.63) — —1954 — 125,000 (0.41) — —1955 800,000 (2.57) 89,500 (0.28) — —1956 — 79,800 (0.24) — —1957 675,000 (1.88) 76,500 (0.21) — —1958 767,000 (1.99) 66,500 (0.17) — —1959 695,000 (1.69) 60,000 (0.14) — 275,9001960 — 51,000 (0.11) 420,000 (0.93) 297,3001961 — 46,500 (0.09) — 396,5001962 — 52,000 (0.09) 198,000 (0.35) 365,4001963 583,000 (0.98) — 230,000 (0.39) 507,2001964 — — 178,000 (0.27) 560,6001965 — 48,900 (0.06) — 658,9001966 — — — 711,9001967 560,000 (0.80) — 159,000 (0.18) 777,5001968 — 42,800 (0.04) 148,000 (0.15) 873,6001969 — — 131,000 (0.12) 1094,9001970 — — 108,000 (0.08) 1262,3001971 694,000 (0.50) — 95,000 (0.06) 1419,1001972 — — 93,000 (0.06) 1730,4001973 743,000 (0.41) — 89,800 (0.04) 1935,3001974 817,000 (0.36) 39,800 (0.01) 105,000 (0.04) 2252,0001975 833,000 (0.32) — 92,800 (0.03) 2636,0001976 960,000 (0.34) — — 3151,0001977 — — — 3486,0001978 — — 87,800 (0.02) 3722,0001979 989,000 (0.28) — — 4023,0001980 — — — 4734,000
Notes: Automobile makes: 1953–58: Datsun1959–70: Nissan Bluebird, 4-door sedan1971–79: Nissan Bluebird 4-door deluxe sedan
Parentheses in the table show the price and annual income ratio.
Source: Weekly Asahi (1990).
12
On the other hand, colour TVs were a new product and had no competition. Because of
technological advances, colour TV was superior to black and white TV and movies. As
innovation proceeded quickly and prices fell rapidly, there was no room left in the Japanese
colour TV market for US and European corporations.
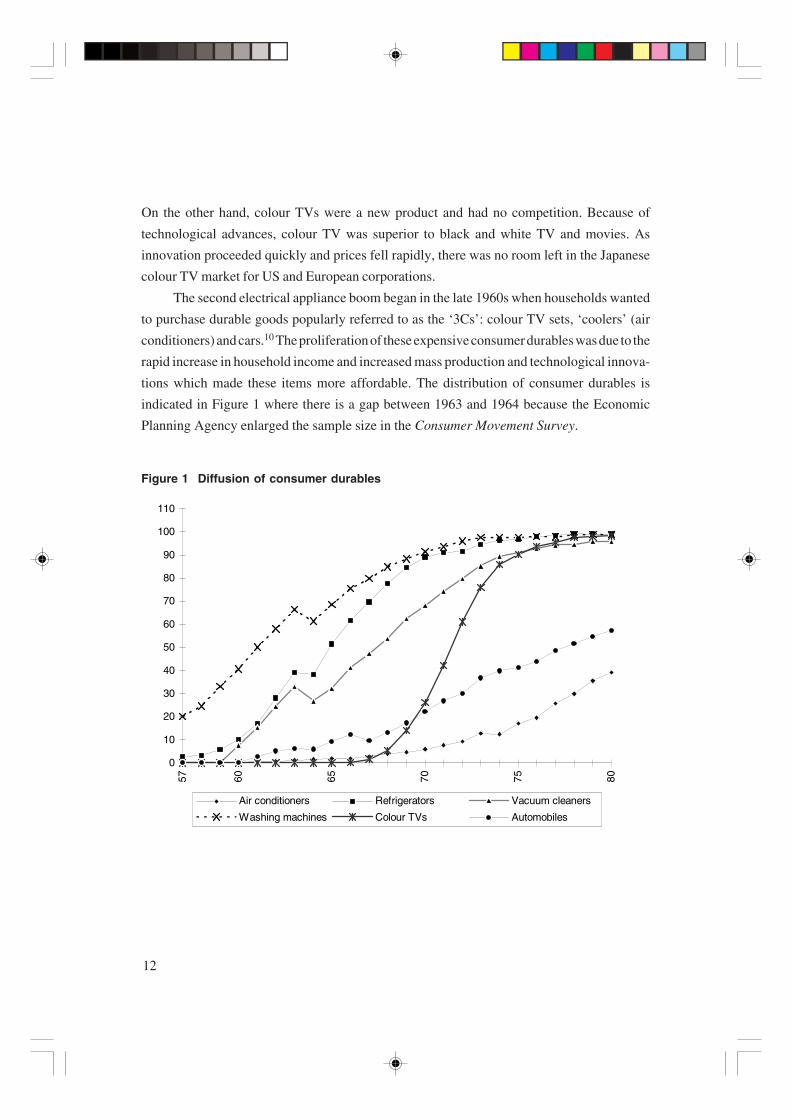
The second electrical appliance boom began in the late 1960s when households wanted
to purchase durable goods popularly referred to as the ‘3Cs’: colour TV sets, ‘coolers’ (air
conditioners) and cars.10 The proliferation of these expensive consumer durables was due to the
rapid increase in household income and increased mass production and technological innova-
tions which made these items more affordable. The distribution of consumer durables is
indicated in Figure 1 where there is a gap between 1963 and 1964 because the Economic
Planning Agency enlarged the sample size in the Consumer Movement Survey.
Figure 1 Diffusion of consumer durables
0
10
20
30
40
50
60
70
80
90
100
110
57 60 65 70 75 80
Air conditioners Refrigerators Vacuum cleaners
Washing machines Colour TVs Automobiles

13
By 1970, the growth rate of refrigerators and washing machines was over 90 per cent. By
1975, over 95 per cent of households had refrigerators, vacuum cleaners, washing machines and
colour TVs. On the other hand, the growth rate of air conditioners and automobiles was not as
rapid as other consumer durables due to the high price/income ratio and, in the case of cars,
because of the inadequate transportation network in Japan. Considering the relatively high
prices of consumer durables and the number of households, expenditure on consumer durables
contributed significantly to an increase in domestic demand.
What is the relationship between the household savings rate and the growth rate of
consumer durables? As indicated in Table 4, the level of financial assets for households was low
in the 1950s and 1960s, totalling ¥275,900 (about US$766) in 1959. If households wanted to
purchase durable goods, they had to save and accumulate funds. Consumer finance for
commodities and services, excluding mortgage loans for housing, began in 1960. However, due
to the low level of financial assets, the credit capacity of households was limited. Therefore,
when households wanted to purchase consumer durables, they faced liquidity constraints, which
stimulated saving. Between the 1950s and 1960s, consumer durables were new products for
Japanese households and households were eager to purchase them. Therefore, due to liquidity
constraints, the amount of excess-saving was considerable.11
Investment–saving balance and data on the household saving rate
Literature on the Japanese economic miracle suggests that the high rate of saving played a
critical role in facilitating rapid economic growth. Ito (1992) emphasised that one of the main
factors contributing to rapid economic growth after the Second World War was the high level
of investment facilitated by the high level of saving.
However, the investment and savings units are different from each other. The investment
unit is corporations. Based on profit maximisation they sought increases in productivity. To
increase productivity, corporations introduced research and development (R&D) investment
and technological innovation and stimulated expansion. On the other hand, the main savings unit
in the quasi-closed economy was households.
One of the objectives of households is to improve their standard of living through utility
maximisation. To improve their standard of living after the 1950s, they wanted to purchase
consumer durables such as refrigerators, TV sets, vacuum cleaners, air conditioners and
automobiles.

14
Consumer durables exert two effects on the investment and savings balance. Corporations
affect the investment for consumer durables and, due to the existence of liquidity constraints,
there is a stimulus to accumulate financial assets in order to purchase expensive consumer
durables in the future.
The household savings rate after the Second World War has been published in the Family
Income and Expenditure Survey (FIES), compiled by the Statistics Bureau since 1951. The
household savings rate of workers’ households in urban areas was only 2.0 per cent in 1951,
4.3 per cent in 1952, 5.8 per cent in 1953, 7.4 per cent in 1954, and 9.2 per cent in 1955, rapidly
increasing to 11.8 per cent by 1956.
During the period of economic take-off in Japan, households saved at a high rate compared
to the increase in disposable income, and therefore the household savings rate increased
sharply.12 Consumer durables were almost all new products for households and many kinds of
consumer durables appeared in the market annually. Because of the excess-savings due to
liquidity constraints during the time lag between accumulating financial assets and purchasing
consumer durables, corporations easily obtained funds through financial institutions at a lower
rate compared with world capital markets.
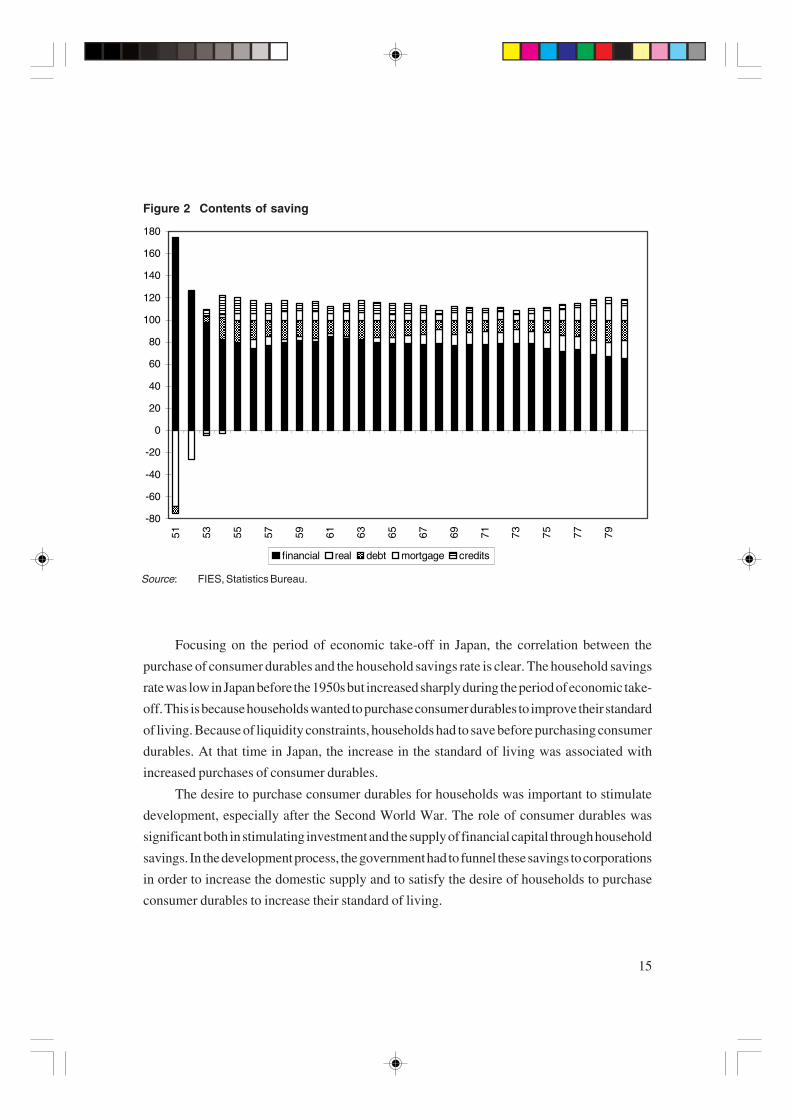
Because of the liquidity constraints faced by households, the rate of debt repayment was
low. In Figure 2, savings are broken down into increases in financial and real assets and
decreases in debt. Decreases in debt are divided into two categories: decreases in mortgage
loans for housing, and decreases in loans for credits and instalments. Repayment of debt for
credit and instalments represent a small percentage in this category. It is clear from Figure 2 that
household saving patterns were strongly influenced by liquidity constraints.
Conclusion
This paper considered the importance of consumer demand in the development process. While
most development theories focus on the supply side, especially innovations in technology and
the quality of human capital, equally important is the innovation of society as a whole through
a desire to improve standards of living.
In the 1950s and 1960s the objectives of the industrial sector and consumers coincided in
Japan; the former sought modernisation and industrialisation and the latter sought an improve-
ment in standards of living through the purchase of expensive consumer durables. Due to the
existence of liquidity constraints, consumers had to save before purchasing consumer durables.
As a result, households supplied investment funds to industries through financial institutions.
15
Figure 2 Contents of saving
Focusing on the period of economic take-off in Japan, the correlation between the
purchase of consumer durables and the household savings rate is clear. The household savings
rate was low in Japan before the 1950s but increased sharply during the period of economic take-
off. This is because households wanted to purchase consumer durables to improve their standard
of living. Because of liquidity constraints, households had to save before purchasing consumer
durables. At that time in Japan, the increase in the standard of living was associated with
increased purchases of consumer durables.
The desire to purchase consumer durables for households was important to stimulate
development, especially after the Second World War. The role of consumer durables was
significant both in stimulating investment and the supply of financial capital through household
savings. In the development process, the government had to funnel these savings to corporations
in order to increase the domestic supply and to satisfy the desire of households to purchase
consumer durables to increase their standard of living.
Source: FIES, Statistics Bureau.
-80
-60
-40
-20
0
20
40
60
80
100
120
140
160
180
51 53 55 57 59 61 63 65 67 69 71 73 75 77 79
financial real debt mortgage credits

16
Appendix: Classification of total expenditure into fifty-nine items
Food categories
Cereals: Rice (item 1), Barley and other cereals (item 2), Bread (item 3), Noodles and others
(item 4)
Dishes: Fresh fish (item 5), Shellfish (item 6), Dried and salted fish (item 7), Meat (item
8), Milk and eggs (item 9), Leafy vegetables (cabbage, spinach, lettuce, etc.) (item 10), Root
vegetables (potatoes, carrots, onions, etc.) (item 11), Other vegetables (string beans, pumpkin,
cucumbers, etc.) (item 12), Dried vegetables and seaweed (item 13), Processed food (item 14),
Condiments (item 15)
Table luxuries: Cakes and candies (item 16), Fruits (item 17), Sake and shochu (item 18),
Beer (item 19), Other alcoholic beverages (whiskey, wine, etc.) (item 20), Non-alcoholic
beverages (item 21)
Food away from home (item 22)
Housing categories
Rent (item 23), Repairs and maintenance (item 24), Water (item 25), Tableware (item 26),
Kitchen utensils (item 27), Electrical appliances (bulbs, cooking appliances and heating
appliances) (item 28), Radio and television receivers (item 29), Electromotive appliances
(washing machines, refrigerators, vacuum cleaners, electric fans and air conditioners) (item
30), Furniture (item 31), Other furniture and utensils (sewing machines, etc.) (item 32)
Fuel and light categories
Electricity (item 33), Gas (item 34), Other fuel and light (fuel oil, coal, and liquid propane) (item
35)
Clothing categories
Japanese clothing (kimono, obi, etc.) (item 36), Western clothing (suits, dress, etc.) (item 37),
Shirts and underwear (item 38), Gloves and socks (item 39), Cloth and thread (item 40),
Bedding (item 41), Shoes and other footwear (item 42), Umbrellas (item 43), Hats, bags and

17
accessories (item 44), Other clothing (sports outfits, cleaning, costume and rental formal wear)
(item 45)
Miscellaneous goods and services
Medical care (item 46), Toilet paper (item 47), Laundry detergent (item 48), Other toilet care
(toilet articles, preparations, barbershops, beauty parlours, and baths) (item 49), Public
transportation, and telephone and telegram (item 50), User-operated transportation (item 51),
Education (item 52), Stationery and writing supplies (item 53), Reading (books, newspapers
and magazines) (item 54), Admission and broadcast licences (item 55), Recreational goods
(film, flowers, toys, records and musical instruments) (item 56), Other reading and recreation
(travelling costs, religious and welfare activities) (item 57), Tobacco (item 58), Other
miscellaneous goods and services (item 59).
18
Notes
* An earlier version of this paper was presented at the Third Europe–Japan HistoryConference held at Kyoto University in March 1996. I am grateful for comments fromBrian Girvin, Richard Griffiths, Ryutaro Komiya and Toshiaki Tachibanaki.
1 A variety of factors contributed to rapid economic growth in Japan after the SecondWorld War, including: destruction of capital goods and stocks during the Second WorldWar, subsequent plant modernisation and the introduction of borrowed technology fromthe United States; effective industrial policies; cheaper energy, especially petroleum;the GATT and IMF systems of free trade and a weak yen; large domestic markets;ensured access to the US market; younger managers and political leaders after theSecond World War; the quality control (QC) system; and a stable political system.
2 If the rate of economic growth is 1 per cent, it takes 140 years to quadruple the level inthe base year. If it is 3 per cent, then it takes about 50 years to quadruple the level in thebase year.
3 The observation period is from 1958 to 1974. Consumption is measured on a householdbasis, and data for the family size are obtained by the FIES. Total expenditure isobtained as the sum of 59 expenditures. The classification of 59 expenditures isindicated in the Appendix.
4 The LES has the following theoretical characteristics: if the price of the item is inelastic,then the item is classified as necessary and indispensable; and, if the price of the itemis elastic, then the item is classified as a luxury and is dispensable (for more detail, seeMaki [1983]).
5 Barley and other cereals (item 2) became inferior to rice and other dishes. Meat (item8) which was a luxury item in 1960 became an essential item in 1970.
6 ‘The three Jingi’ concept derives from the three Japanese imperial objects: the sword,the mirror and the jewel. Another version of the three Jingi in the late 1950s denotedwashing machines, refrigerators and TV sets.
7 Following Hayashi (1987), there are three kinds of liquidity constraints: cash-in-advance constraints; quantity constraints on the amount of borrowing (credit rationing);and the case in which the loan rate available to consumers is higher than the rate at whichthey can lend (for a discussion of differential interest rates, see Maki [1993]).
8 Other consumer durables such as shavers, electric pots and electric rice ball steamersalso sold well in the stores.
9 The financial assets distribution forms the shape of log-normal distribution; mode,median and mean (average) are different. Because of the characteristics of assetdistribution, most households have less than the average amount of financial assets.

19
10 The year 1959 represented the start of private transportation (called family motorisa-tion). The catch-phrase ‘3Cs’ appeared in 1966. The catch-phrase ‘new 3Cs’ — that is,cottages, central heating and cookers (electric ovens), appeared in 1968. Achievementof the ‘new 3Cs’ is still a target for most Japanese households, even in the 1990s.
11 Even so, the substitution effect would come into play. For example, savings foremergencies would decrease in place of capital for consumer durables.
12 During the high growth era, the Japanese government decreased the income tax rate forhouseholds almost every year. This is one of the reasons, in addition to the high real GNPgrowth rates, that disposable income for households increased every year.

20
References
Hayashi, Fumio (1987) ‘Tests for liquidity constraints: a critical survey and some newobservations’, Advances in Econometrics, Fifth World Congress
Horioka, Charles (1990) ‘Why is Japan’s household saving rate so high?: A literary survey’Journal of the Japanese and International Economies 4, pp. 49–92
Ito, Takatoshi (1992) The Japanese Economy Cambridge: MIT Press
Kuznets, Simon (1966) Modern Economic Growth: Rate, Structure, and Spread New Havenand London: Yale University Press
Maki, Atsushi (1983) Consumer Preferences and the Measurement of Demand Yohikaku:Tokyo
—— (1993) ‘Liquidity constraints: A cross-section analysis of the housing purchase behaviorof Japanese households’ Review of Economics and Statistics, 75, pp. 429–37
Weekly Asahi (1988) Chronological Table of Prices I Tokyo: Asahi
—— (1990) Chronological Table of Prices II Tokyo: Asahi

21
Previous Pacific Economic Papers
261 East Asia and Eastern Europe trade linkages and issuesJocelyn Horne, November 1996
260 National choiceWang Gungwu, October 1996
259 Australia’s export performance in East AsiaPeter Drysdale and Weiguo Lu, September 1996
258 Public infrastructure and regional economic development: evidence from ChinaWeiguo Lu, August 1996
257 Regional variations in diets in JapanPaul Riethmuller and Ruth Stroppiana, July 1996
256 Japanese FDI in Australia in the 1990s: manufacturing, financial services andtourismStephen Nicholas, David Merrett, Greg Whitwell, William Purcell with Sue Kimberley,June 1996
255 From Osaka to Subic: APEC’s challenges for 1996Andrew Elek, May 1996
254 NAFTA, the Americas, AFTA and CER: reinforcement or competition for APEC?Richard H. Snape, April 1996
253 Changes in East Asian food consumption: some implications for Australian irrigatedagriculturePhilip Taylor and Christopher Findlay, March 1996
252 Behaviour of Pacific energy markets: the case of the coking coal trade with JapanRichard J. Koerner, February 1996
251 Intra-industry trade and the ASEAN free trade areaJayant Menon, January 1996
250 China and East Asia trade policy, volume 3:China and the world trade systemVarious authors, December 1995 (special volume)
249 China and East Asia trade policy, volume 2:Regional economic integration and cooperationVarious authors, November 1995 (special volume)

248 China and East Asia trade policy, volume 1:East Asia beyond the Uruguay RoundVarious authors, October 1995 (special volume)
247 The question of access to the Japanese marketPeter Drysdale, September 1995
246 The Asia factor in US–Japan relationsUrban C. Lehner, August 1995
245 ASEAN’s new role in the Asia Pacific region: can it be a driving force of widerregional economic cooperation?Jiro Okamoto, July 1995
244 Dollar shortage — Yen shortage?Heinz W. Arndt, June 1995
243 The dynamics of employment, wages and output: a comparative study of Koreaand JapanFrancis In and Arlene Garces, May 1995
242 On exports and economic growth: further evidenceLigang Song and Tina Chen, April 1995
241 US trade policy towards the Asia Pacific region in the 1990sJohn Kunkel, March 1995
240 A simple model of main bank monitoring in JapanLuke Gower, February 1995
239 The impact of economic reform on technical efficiency: a suggested method ofmeasurementPeter Drysdale, K. P. Kalirajan and Shiji Zhao, January 1995
238 Price flexibility in Japan, 1970–92: a study of price formation on the distributionchannelKenn Ariga and Yasushi Ohkusa, December 1994
237 Political economy of the large-scale retail store law: transforming ‘impediments’ toentering the Japanese retail industryTerada Takashi, November 1994
236 A microeconomic model of Japanese enterprise bargainingAkira Kawaguchi, October 1994
235 Building a multilateral security dialogue in the PacificLiu Jiangyong, September 1994

234 Changing patterns of world trade and development: the experience from the 1960s tothe 1980sLigang Song, August 1994
233 Taiwan’s industry policy during the 1980s and its relevance to the theory of strategictradeHeather Smith, July 1994
232 Why is Japanese working time so long? Wage working time contract modelsAkira Kawaguchi, June 1994
231 Japanese multinationals in Australian manufacturingDiane Hutchinson and Stephen Nicholas, May 1994
230 Food processors, retailers and restaurants: their place in the Japanese food sectorPaul Riethmuller, April 1994
229 Korea’s industry policy during the 1980sHeather Smith, March 1994
228 Individual characteristics and garment consumption in JapanYiping Huang and Weiguo Lu, February 1994
227 The US–Japan global partnership: expectations and realitiesAurelia George, January 1994
226 Lessons from the fuss about Japanese beef trade liberalisationHiroshi Mori, December 1993
227 The US–Japan global partnership: expectations and realitiesAurelia George, January 1994
226 Lessons from the fuss about Japanese beef trade liberalisationHiroshi Mori, December 1993
225 FDI and other contractual arrangements in the Australian beef industry: the Japaneseresponse to domestic market liberalisationJulian B. Morison, November 1993
224 Asia Pacific Economic Cooperation and Australia–Japan relations: a JapaneseperspectiveMasatoshi Inouchi and Takashi Terada, October 1993
223 Japanese direct foreign investment in Australia in comparative perspectivePeter Drysdale, September 1993
222 Exchange rate changes and export pricing behaviour in JapanPremachandra Athukorala and Jayant Menon, August 1993

221 General revenue grants and the flypaper effect: the Japanese caseKiyohito Hanai, July 1993
220 Information services, private bureaucracies and Japan’s comparative advantageHans-Jürgen Engelbrecht, June 1993
219 Australia–Japan business cooperation committees: forging channels of communicationMayumi Kamada, May 1993
218 Processing and product development systems in the Japanese wool textile and apparelindustryShigeru Asaba and Takahiro Fujimoto, April 1993
217 The challenge of the appreciating yen and Japanese corporate responseDilip Das, March 1993
216 ‘The outlier’: Chinese steel industry development and prospects for tradeLintong Feng, Christopher Findlay, Hugh Richardson and Yanrui Wu, February 1993
215 GATT negotiations and the opening of Japan’s rice market: a two-level game approachAurelia George and David Rapkin, January 1993
214 China and the international trading systemPeter Drysdale and Andrew Elek, December 1992
Annual subscription rate for twelve issues:Individuals $A60.00Institutions $A100.00
Cost for single issues:$A15.00$A10.00 (Students)
All prices include postage
Available from: Publications DepartmentAustralia–Japan Research CentreResearch School of Pacific and Asian StudiesThe Australian National UniversityCanberra ACT 0200, AustraliaFacsimile: (61 6) 249 0767Telephone: (61 6) 249 3780E-mail: [email protected]