examination of the potential of the seismic dilatometer
TRANSCRIPT
Examination of the Potential of the Seismic Dilatometer(SDMT) to Estimate In Situ Stiffness Decay Curves
in Various Soil TypesS. Amoroso, P. Monaco, B.M. Lehane, D. Marchetti
Abstract. This paper illustrates the use of the seismic dilatometer (SDMT) to assess the decay of in-situ stiffness withstrain level in different soil types. The approach adopted in this study relies on the ability of the SDMT to provide routinelyat each test depth both a small strain stiffness (G0 from VS) and a working strain stiffness (constrained modulus MDMT
derived from the usual DMT interpretation). At various test sites, working strain DMT moduli are compared with referencestiffness decay curves back-figured from (i) the behavior observed under a full-scale test embankment (at Treporti) orfootings (in Texas), (ii) from laboratory tests (at L’Aquila, Fucino plain and Po plain) and (iii) various combinations of in-situ and laboratory testing techniques (Western Australia). Typical ranges of the shear strains �DMT associated with workingstrain DMT moduli are inferred to assist construction of stiffness - strain decay curves for different soil types.Keywords: seismic dilatometer, in situ stiffness decay curves, working strain stiffness, small strain stiffness.
1. Introduction
Methods for deriving stiffness decay curves (G-�curves or similar, G = shear modulus, � = shear strain) fromin situ tests have been proposed by various Authors e.g.Robertson & Ferrera (1993) and Fahey (1998) used the un-load-reload (u-r) cycles from self-boring pressuremetertests; Mayne et al. (1999) and Marchetti et al. (2008) em-ployed the SDMT; Elhakim & Mayne (2003) and Mayne(2003) adopted the seismic cone tests (SCPTs) whileLehane & Fahey (2004) combined the SCPT and DMT.
The seismic dilatometer (SDMT) is the combinationof the flat dilatometer (DMT) with an add-on seismic mod-ule for the measurement of the shear wave velocity VS. Theapproach adopted in this study relies on the ability of theSDMT to provide routinely, at each test depth, both thestiffness at small strains (the small strain shear modulus G0
obtained from the shear wave velocity VS as G0 = � VS
2) andthe stiffness at operative strains (as represented by the con-strained modulus MDMT obtained by the usual DMT interpre-tation). The potential for these two stiffness values toprovide guidance when selecting the G-� curve of a soil ele-ment is examined.
2. Flat Dilatometer Test (DMT)The flat dilatometer, introduced by Marchetti (1980),
consists of a steel blade having a thin, expandable, circularsteel membrane mounted on one face. When at rest, themembrane is flush with the surrounding flat surface of theblade. The blade is connected, by an electro-pneumatic
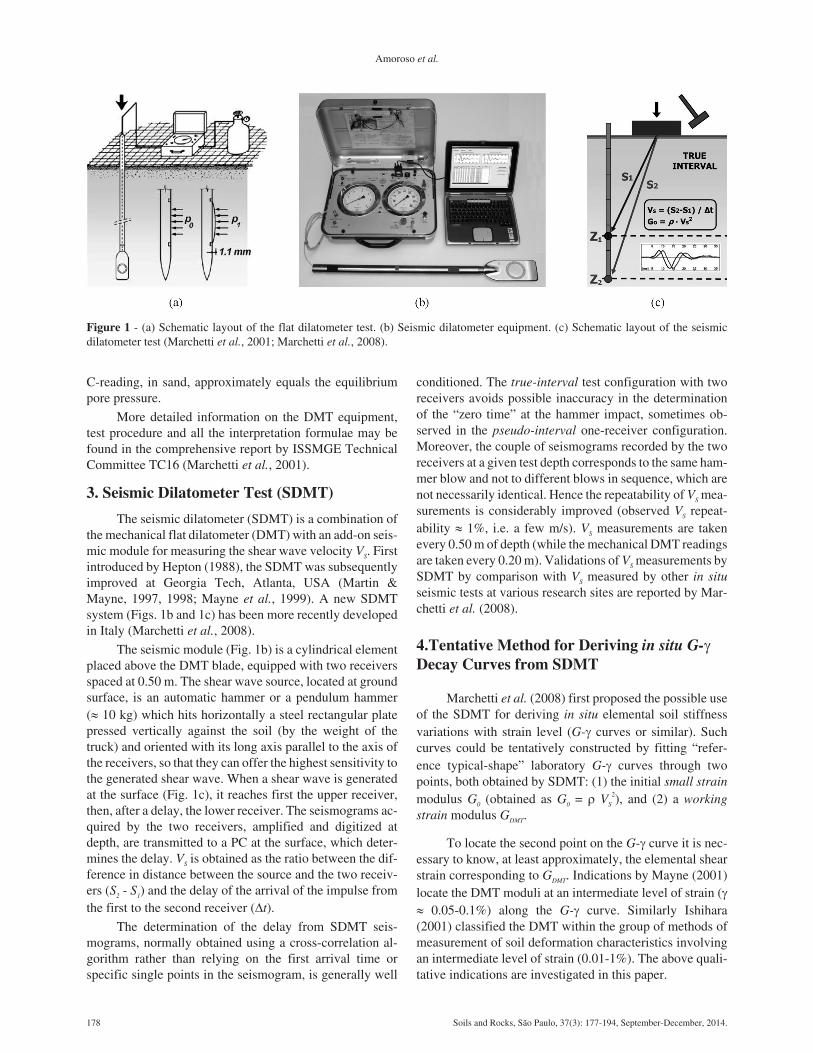
tube running through the insertion rods, to a control unit onthe surface (Figs. 1a and 1b). The control unit is equippedwith pressure gauges, an audio-visual signal, a valve forregulating gas pressure (provided by a tank) and ventvalves. The blade is advanced into the ground using com-mon field equipment, i.e. penetrometers normally used forthe cone penetration test (CPT) or drill rigs.
The test starts by inserting the dilatometer into theground. When the blade has advanced to the desired testdepth, the penetration is stopped. The operator inflates themembrane and takes, in about 30 sec, two readings: the Apressure, required to just begin to move the membrane(“lift-off” pressure), and the B pressure, required to expandthe membrane center of 1.1 mm against the soil. A thirdreading C (“closing pressure”) can also optionally be takenby slowly deflating the membrane soon after B is reached.The blade is then advanced to the next test depth, with adepth increment of typically 20 cm.
The interpretation proceeds as follows. First the fieldreadings are used to derive the DMT intermediate parame-ters material index ID, horizontal stress index KD, dilato-meter modulus ED. Then ID, KD, ED are used, by means ofcommonly used correlations, to estimate the constrainedmodulus M, the undrained shear strength su, the in situ earthpressure coefficient K0 (clays), the overconsolidation ratioOCR (clays), the friction angle �’ (sands), the bulk unitweight �. Consolidation and permeability coefficients maybe estimated by performing dissipation tests. The
Soils and Rocks, São Paulo, 37(3): 177-194, September-December, 2014. 177
Sara Amoroso, Researcher, Department of Seismology and Tectonophysics, Istituto Nazionale di Geofisica e Vulcanologia, Italy. e-mail: [email protected] Monaco, Assistant Professor, Department of Civil, Architectural and Environmental Engineering, University of L’Aquila, Italy. e-mail: [email protected] M. Lehane, Winthrop Professor, School of Civil, Environmental and Mining Engineering, University of Western Australia, Western Australia. e-mail:[email protected] Marchetti, Engineer, Studio Prof. Marchetti, Italy. e-mail: [email protected] on March 2, 2014; Final Acceptance on December 15, 2014; Discussion open until April 30, 2015.
C-reading, in sand, approximately equals the equilibriumpore pressure.
More detailed information on the DMT equipment,test procedure and all the interpretation formulae may befound in the comprehensive report by ISSMGE TechnicalCommittee TC16 (Marchetti et al., 2001).
3. Seismic Dilatometer Test (SDMT)
The seismic dilatometer (SDMT) is a combination ofthe mechanical flat dilatometer (DMT) with an add-on seis-mic module for measuring the shear wave velocity VS. Firstintroduced by Hepton (1988), the SDMT was subsequentlyimproved at Georgia Tech, Atlanta, USA (Martin &Mayne, 1997, 1998; Mayne et al., 1999). A new SDMTsystem (Figs. 1b and 1c) has been more recently developedin Italy (Marchetti et al., 2008).
The seismic module (Fig. 1b) is a cylindrical elementplaced above the DMT blade, equipped with two receiversspaced at 0.50 m. The shear wave source, located at groundsurface, is an automatic hammer or a pendulum hammer(� 10 kg) which hits horizontally a steel rectangular platepressed vertically against the soil (by the weight of thetruck) and oriented with its long axis parallel to the axis ofthe receivers, so that they can offer the highest sensitivity tothe generated shear wave. When a shear wave is generatedat the surface (Fig. 1c), it reaches first the upper receiver,then, after a delay, the lower receiver. The seismograms ac-quired by the two receivers, amplified and digitized atdepth, are transmitted to a PC at the surface, which deter-mines the delay. VS is obtained as the ratio between the dif-ference in distance between the source and the two receiv-ers (S2 - S1) and the delay of the arrival of the impulse fromthe first to the second receiver (�t).
The determination of the delay from SDMT seis-mograms, normally obtained using a cross-correlation al-gorithm rather than relying on the first arrival time orspecific single points in the seismogram, is generally well
conditioned. The true-interval test configuration with tworeceivers avoids possible inaccuracy in the determinationof the “zero time” at the hammer impact, sometimes ob-served in the pseudo-interval one-receiver configuration.Moreover, the couple of seismograms recorded by the tworeceivers at a given test depth corresponds to the same ham-mer blow and not to different blows in sequence, which arenot necessarily identical. Hence the repeatability of VS mea-surements is considerably improved (observed VS repeat-ability � 1%, i.e. a few m/s). VS measurements are takenevery 0.50 m of depth (while the mechanical DMT readingsare taken every 0.20 m). Validations of VS measurements bySDMT by comparison with VS measured by other in situseismic tests at various research sites are reported by Mar-chetti et al. (2008).
4.Tentative Method for Deriving in situ G-�Decay Curves from SDMT
Marchetti et al. (2008) first proposed the possible useof the SDMT for deriving in situ elemental soil stiffnessvariations with strain level (G-� curves or similar). Suchcurves could be tentatively constructed by fitting “refer-ence typical-shape” laboratory G-� curves through twopoints, both obtained by SDMT: (1) the initial small strainmodulus G0 (obtained as G0 = � VS
2), and (2) a workingstrain modulus GDMT.
To locate the second point on the G-� curve it is nec-essary to know, at least approximately, the elemental shearstrain corresponding to GDMT. Indications by Mayne (2001)locate the DMT moduli at an intermediate level of strain (�� 0.05-0.1%) along the G-� curve. Similarly Ishihara(2001) classified the DMT within the group of methods ofmeasurement of soil deformation characteristics involvingan intermediate level of strain (0.01-1%). The above quali-tative indications are investigated in this paper.
178 Soils and Rocks, São Paulo, 37(3): 177-194, September-December, 2014.
Amoroso et al.
Figure 1 - (a) Schematic layout of the flat dilatometer test. (b) Seismic dilatometer equipment. (c) Schematic layout of the seismicdilatometer test (Marchetti et al., 2001; Marchetti et al., 2008).
As suggested by Marchetti et al. (2008), a workingstrain shear modulus GDMT can be derived from the con-strained modulus MDMT provided by the usual DMT inter-pretation (Marchetti, 1980, Marchetti et al., 2001). As afirst approximation, by referring to linear elasticity:
G MDMT DMT��
�1 2
2 1
( )
(1)
where = Poisson’s ratio. E.g. assuming a typical drained of 0.2 (noting that MDMT is a drained modulus), the workingstrain shear modulus may be obtained from Eq. 1 asGDMT = 0.375 MDMT. It should be noted that correlations be-tween the DMT parameters (ED and KD) and MDMT proposedby Marchetti (1980) are based on the assumption that MDMT
represents a reasonable estimate of the “operative” ordrained working strain modulus (i.e. the modulus that,when introduced into the linear elasticity formulae, pro-vides realistic estimates of the settlement of a shallow foun-dation under working loads). This assumption is supportedby the good agreement observed in a large number of welldocumented comparisons between measured and DMT-predicted settlements or moduli (see Monaco et al., 2006;Marchetti et al., 2008).
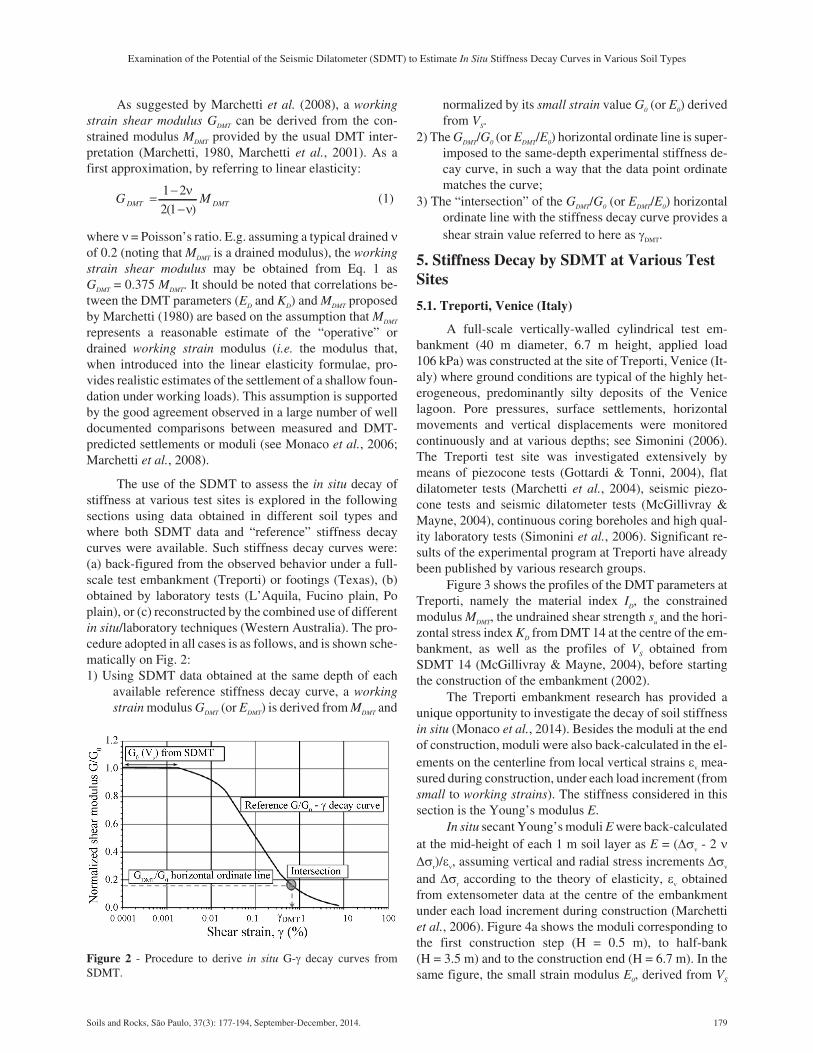
The use of the SDMT to assess the in situ decay ofstiffness at various test sites is explored in the followingsections using data obtained in different soil types andwhere both SDMT data and “reference” stiffness decaycurves were available. Such stiffness decay curves were:(a) back-figured from the observed behavior under a full-scale test embankment (Treporti) or footings (Texas), (b)obtained by laboratory tests (L’Aquila, Fucino plain, Poplain), or (c) reconstructed by the combined use of differentin situ/laboratory techniques (Western Australia). The pro-cedure adopted in all cases is as follows, and is shown sche-matically on Fig. 2:1) Using SDMT data obtained at the same depth of each
available reference stiffness decay curve, a workingstrain modulus GDMT (or EDMT) is derived from MDMT and
normalized by its small strain value G0 (or E0) derivedfrom VS.
2) The GDMT/G0 (or EDMT/E0) horizontal ordinate line is super-imposed to the same-depth experimental stiffness de-cay curve, in such a way that the data point ordinatematches the curve;
3) The “intersection” of the GDMT/G0 (or EDMT/E0) horizontalordinate line with the stiffness decay curve provides ashear strain value referred to here as �DMT.
5. Stiffness Decay by SDMT at Various TestSites
5.1. Treporti, Venice (Italy)
A full-scale vertically-walled cylindrical test em-bankment (40 m diameter, 6.7 m height, applied load106 kPa) was constructed at the site of Treporti, Venice (It-aly) where ground conditions are typical of the highly het-erogeneous, predominantly silty deposits of the Venicelagoon. Pore pressures, surface settlements, horizontalmovements and vertical displacements were monitoredcontinuously and at various depths; see Simonini (2006).The Treporti test site was investigated extensively bymeans of piezocone tests (Gottardi & Tonni, 2004), flatdilatometer tests (Marchetti et al., 2004), seismic piezo-cone tests and seismic dilatometer tests (McGillivray &Mayne, 2004), continuous coring boreholes and high qual-ity laboratory tests (Simonini et al., 2006). Significant re-sults of the experimental program at Treporti have alreadybeen published by various research groups.
Figure 3 shows the profiles of the DMT parameters atTreporti, namely the material index ID, the constrainedmodulus MDMT, the undrained shear strength su and the hori-zontal stress index KD from DMT 14 at the centre of the em-bankment, as well as the profiles of VS obtained fromSDMT 14 (McGillivray & Mayne, 2004), before startingthe construction of the embankment (2002).
The Treporti embankment research has provided aunique opportunity to investigate the decay of soil stiffnessin situ (Monaco et al., 2014). Besides the moduli at the endof construction, moduli were also back-calculated in the el-ements on the centerline from local vertical strains v mea-sured during construction, under each load increment (fromsmall to working strains). The stiffness considered in thissection is the Young’s modulus E.
In situ secant Young’s moduli E were back-calculatedat the mid-height of each 1 m soil layer as E = (��v - 2 ��r)/v, assuming vertical and radial stress increments ��v
and ��r according to the theory of elasticity, v obtainedfrom extensometer data at the centre of the embankmentunder each load increment during construction (Marchettiet al., 2006). Figure 4a shows the moduli corresponding tothe first construction step (H = 0.5 m), to half-bank(H = 3.5 m) and to the construction end (H = 6.7 m). In thesame figure, the small strain modulus E0, derived from VS
Examination of the Potential of the Seismic Dilatometer (SDMT) to Estimate In Situ Stiffness Decay Curves in Various Soil Types
Soils and Rocks, São Paulo, 37(3): 177-194, September-December, 2014. 179
Figure 2 - Procedure to derive in situ G-� decay curves fromSDMT.
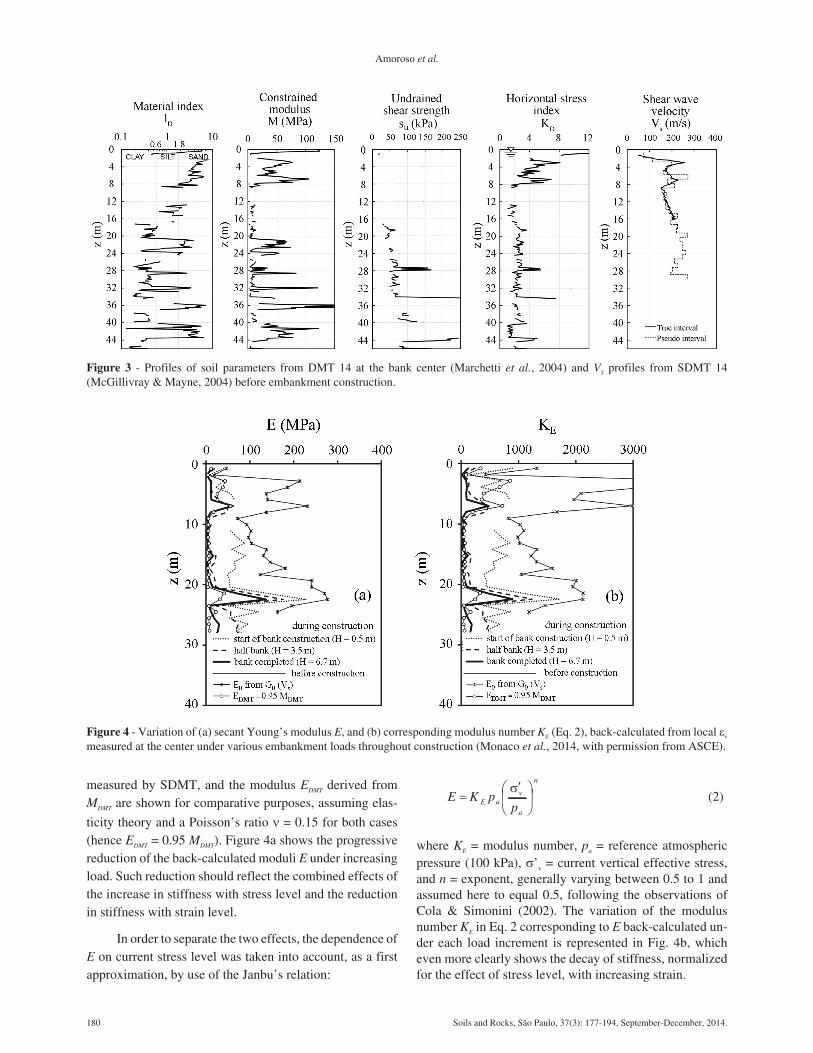
measured by SDMT, and the modulus EDMT derived fromMDMT are shown for comparative purposes, assuming elas-
ticity theory and a Poisson’s ratio = 0.15 for both cases(hence EDMT = 0.95 MDMT). Figure 4a shows the progressivereduction of the back-calculated moduli E under increasingload. Such reduction should reflect the combined effects ofthe increase in stiffness with stress level and the reductionin stiffness with strain level.
In order to separate the two effects, the dependence ofE on current stress level was taken into account, as a firstapproximation, by use of the Janbu’s relation:
E K ppE a
v
a
n
��
��
�
��
�(2)
where KE = modulus number, pa = reference atmosphericpressure (100 kPa), �’v = current vertical effective stress,and n = exponent, generally varying between 0.5 to 1 andassumed here to equal 0.5, following the observations ofCola & Simonini (2002). The variation of the modulusnumber KE in Eq. 2 corresponding to E back-calculated un-der each load increment is represented in Fig. 4b, whicheven more clearly shows the decay of stiffness, normalizedfor the effect of stress level, with increasing strain.
180 Soils and Rocks, São Paulo, 37(3): 177-194, September-December, 2014.
Amoroso et al.
Figure 3 - Profiles of soil parameters from DMT 14 at the bank center (Marchetti et al., 2004) and VS profiles from SDMT 14(McGillivray & Mayne, 2004) before embankment construction.
Figure 4 - Variation of (a) secant Young’s modulus E, and (b) corresponding modulus number KE (Eq. 2), back-calculated from local v
measured at the center under various embankment loads throughout construction (Monaco et al., 2014, with permission from ASCE).
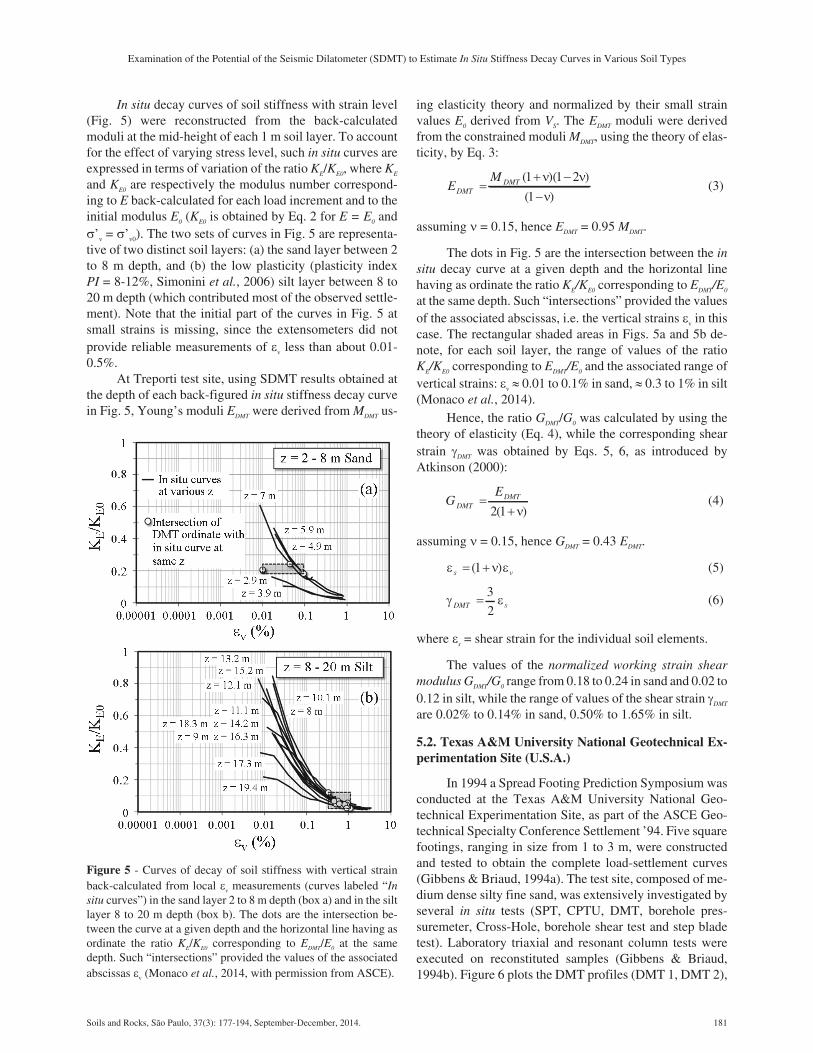
In situ decay curves of soil stiffness with strain level(Fig. 5) were reconstructed from the back-calculatedmoduli at the mid-height of each 1 m soil layer. To accountfor the effect of varying stress level, such in situ curves areexpressed in terms of variation of the ratio KE/KE0, where KE
and KE0 are respectively the modulus number correspond-ing to E back-calculated for each load increment and to theinitial modulus E0 (KE0 is obtained by Eq. 2 for E = E0 and�’v = �’v0). The two sets of curves in Fig. 5 are representa-tive of two distinct soil layers: (a) the sand layer between 2to 8 m depth, and (b) the low plasticity (plasticity indexPI = 8-12%, Simonini et al., 2006) silt layer between 8 to20 m depth (which contributed most of the observed settle-ment). Note that the initial part of the curves in Fig. 5 atsmall strains is missing, since the extensometers did notprovide reliable measurements of v less than about 0.01-0.5%.
At Treporti test site, using SDMT results obtained atthe depth of each back-figured in situ stiffness decay curvein Fig. 5, Young’s moduli EDMT were derived from MDMT us-
ing elasticity theory and normalized by their small strainvalues E0 derived from VS. The EDMT moduli were derivedfrom the constrained moduli MDMT, using the theory of elas-ticity, by Eq. 3:
EM
DMTDMT�
� �
�
( )( )
( )
1 1 2
1
(3)
assuming = 0.15, hence EDMT = 0.95 MDMT.
The dots in Fig. 5 are the intersection between the insitu decay curve at a given depth and the horizontal linehaving as ordinate the ratio KE/KE0 corresponding to EDMT/E0
at the same depth. Such “intersections” provided the valuesof the associated abscissas, i.e. the vertical strains v in thiscase. The rectangular shaded areas in Figs. 5a and 5b de-note, for each soil layer, the range of values of the ratioKE/KE0 corresponding to EDMT/E0 and the associated range ofvertical strains: v � 0.01 to 0.1% in sand, � 0.3 to 1% in silt(Monaco et al., 2014).
Hence, the ratio GDMT/G0 was calculated by using thetheory of elasticity (Eq. 4), while the corresponding shearstrain �DMT was obtained by Eqs. 5, 6, as introduced byAtkinson (2000):
GE
DMTDMT��2 1( )
(4)
assuming = 0.15, hence GDMT = 0.43 EDMT.
s v� �( )1 (5)
� DMT s�3
2(6)
where s = shear strain for the individual soil elements.
The values of the normalized working strain shearmodulus GDMT/G0 range from 0.18 to 0.24 in sand and 0.02 to0.12 in silt, while the range of values of the shear strain �DMT
are 0.02% to 0.14% in sand, 0.50% to 1.65% in silt.
5.2. Texas A&M University National Geotechnical Ex-perimentation Site (U.S.A.)
In 1994 a Spread Footing Prediction Symposium wasconducted at the Texas A&M University National Geo-technical Experimentation Site, as part of the ASCE Geo-technical Specialty Conference Settlement ’94. Five squarefootings, ranging in size from 1 to 3 m, were constructedand tested to obtain the complete load-settlement curves(Gibbens & Briaud, 1994a). The test site, composed of me-dium dense silty fine sand, was extensively investigated byseveral in situ tests (SPT, CPTU, DMT, borehole pres-suremeter, Cross-Hole, borehole shear test and step bladetest). Laboratory triaxial and resonant column tests wereexecuted on reconstituted samples (Gibbens & Briaud,1994b). Figure 6 plots the DMT profiles (DMT 1, DMT 2),
Examination of the Potential of the Seismic Dilatometer (SDMT) to Estimate In Situ Stiffness Decay Curves in Various Soil Types
Soils and Rocks, São Paulo, 37(3): 177-194, September-December, 2014. 181
Figure 5 - Curves of decay of soil stiffness with vertical strainback-calculated from local v measurements (curves labeled “Insitu curves”) in the sand layer 2 to 8 m depth (box a) and in the siltlayer 8 to 20 m depth (box b). The dots are the intersection be-tween the curve at a given depth and the horizontal line having asordinate the ratio KE/KE0 corresponding to EDMT/E0 at the samedepth. Such “intersections” provided the values of the associatedabscissas v (Monaco et al., 2014, with permission from ASCE).
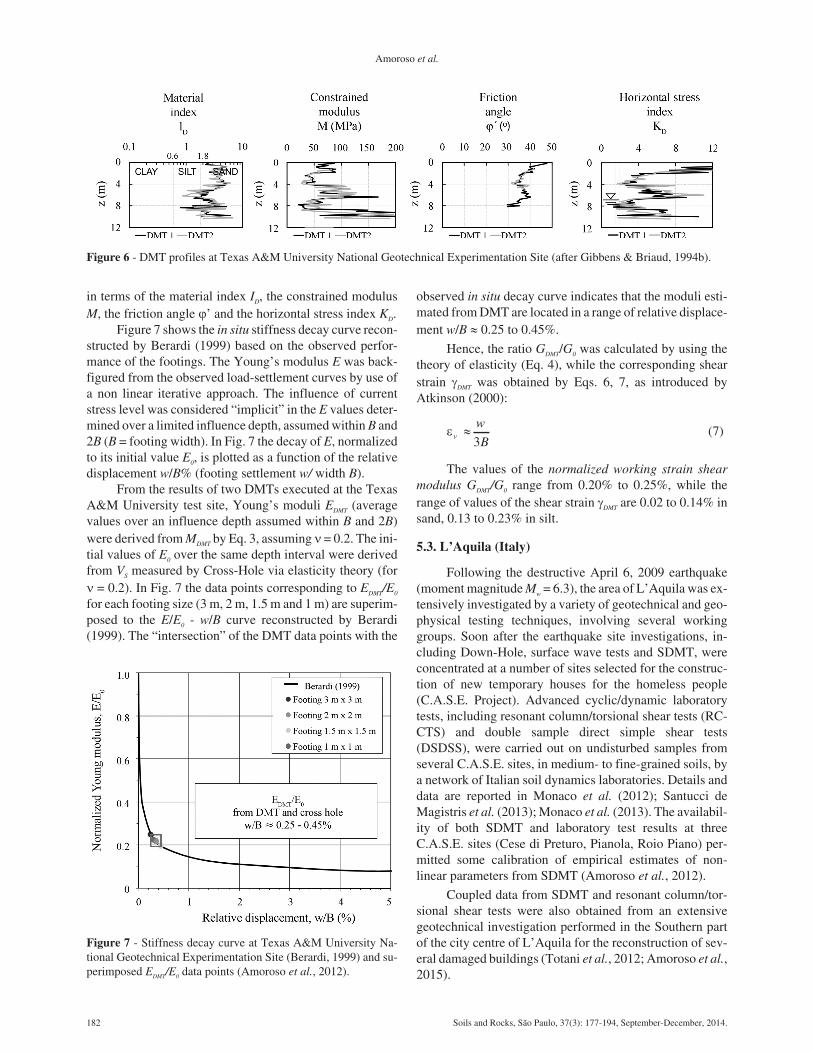
in terms of the material index ID, the constrained modulusM, the friction angle �’ and the horizontal stress index KD.
Figure 7 shows the in situ stiffness decay curve recon-structed by Berardi (1999) based on the observed perfor-mance of the footings. The Young’s modulus E was back-figured from the observed load-settlement curves by use ofa non linear iterative approach. The influence of currentstress level was considered “implicit” in the E values deter-mined over a limited influence depth, assumed within B and2B (B = footing width). In Fig. 7 the decay of E, normalizedto its initial value E0, is plotted as a function of the relativedisplacement w/B% (footing settlement w/ width B).
From the results of two DMTs executed at the TexasA&M University test site, Young’s moduli EDMT (averagevalues over an influence depth assumed within B and 2B)were derived from MDMT by Eq. 3, assuming = 0.2. The ini-tial values of E0 over the same depth interval were derivedfrom VS measured by Cross-Hole via elasticity theory (for = 0.2). In Fig. 7 the data points corresponding to EDMT/E0
for each footing size (3 m, 2 m, 1.5 m and 1 m) are superim-posed to the E/E0 - w/B curve reconstructed by Berardi(1999). The “intersection” of the DMT data points with the
observed in situ decay curve indicates that the moduli esti-mated from DMT are located in a range of relative displace-ment w/B � 0.25 to 0.45%.
Hence, the ratio GDMT/G0 was calculated by using thetheory of elasticity (Eq. 4), while the corresponding shearstrain �DMT was obtained by Eqs. 6, 7, as introduced byAtkinson (2000):
v
w
B�
3(7)
The values of the normalized working strain shearmodulus GDMT/G0 range from 0.20% to 0.25%, while therange of values of the shear strain �DMT are 0.02 to 0.14% insand, 0.13 to 0.23% in silt.
5.3. L’Aquila (Italy)
Following the destructive April 6, 2009 earthquake(moment magnitude Mw = 6.3), the area of L’Aquila was ex-tensively investigated by a variety of geotechnical and geo-physical testing techniques, involving several workinggroups. Soon after the earthquake site investigations, in-cluding Down-Hole, surface wave tests and SDMT, wereconcentrated at a number of sites selected for the construc-tion of new temporary houses for the homeless people(C.A.S.E. Project). Advanced cyclic/dynamic laboratorytests, including resonant column/torsional shear tests (RC-CTS) and double sample direct simple shear tests(DSDSS), were carried out on undisturbed samples fromseveral C.A.S.E. sites, in medium- to fine-grained soils, bya network of Italian soil dynamics laboratories. Details anddata are reported in Monaco et al. (2012); Santucci deMagistris et al. (2013); Monaco et al. (2013). The availabil-ity of both SDMT and laboratory test results at threeC.A.S.E. sites (Cese di Preturo, Pianola, Roio Piano) per-mitted some calibration of empirical estimates of non-linear parameters from SDMT (Amoroso et al., 2012).
Coupled data from SDMT and resonant column/tor-sional shear tests were also obtained from an extensivegeotechnical investigation performed in the Southern partof the city centre of L’Aquila for the reconstruction of sev-eral damaged buildings (Totani et al., 2012; Amoroso et al.,2015).
182 Soils and Rocks, São Paulo, 37(3): 177-194, September-December, 2014.
Amoroso et al.
Figure 6 - DMT profiles at Texas A&M University National Geotechnical Experimentation Site (after Gibbens & Briaud, 1994b).
Figure 7 - Stiffness decay curve at Texas A&M University Na-tional Geotechnical Experimentation Site (Berardi, 1999) and su-perimposed EDMT/E0 data points (Amoroso et al., 2012).
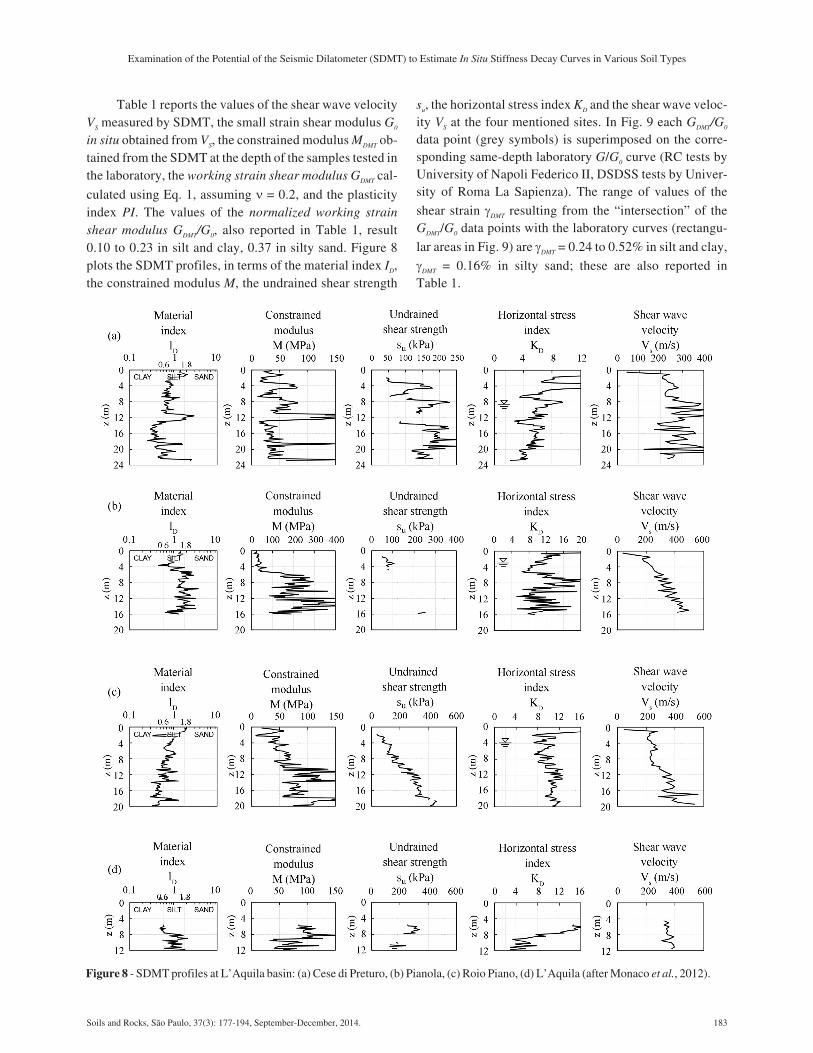
Table 1 reports the values of the shear wave velocityVS measured by SDMT, the small strain shear modulus G0
in situ obtained from VS, the constrained modulus MDMT ob-tained from the SDMT at the depth of the samples tested inthe laboratory, the working strain shear modulus GDMT cal-
culated using Eq. 1, assuming = 0.2, and the plasticityindex PI. The values of the normalized working strainshear modulus GDMT/G0, also reported in Table 1, result0.10 to 0.23 in silt and clay, 0.37 in silty sand. Figure 8plots the SDMT profiles, in terms of the material index ID,the constrained modulus M, the undrained shear strength
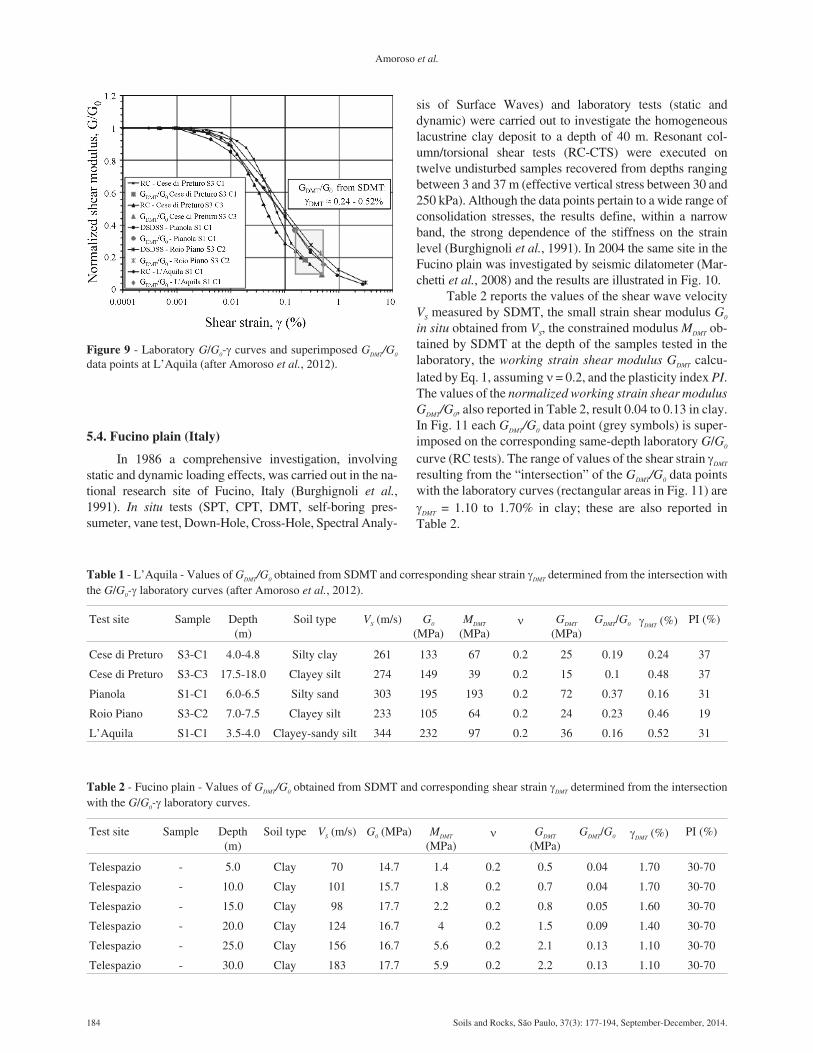
su, the horizontal stress index KD and the shear wave veloc-ity VS at the four mentioned sites. In Fig. 9 each GDMT/G0
data point (grey symbols) is superimposed on the corre-sponding same-depth laboratory G/G0 curve (RC tests byUniversity of Napoli Federico II, DSDSS tests by Univer-sity of Roma La Sapienza). The range of values of the
shear strain �DMT resulting from the “intersection” of theGDMT/G0 data points with the laboratory curves (rectangu-
lar areas in Fig. 9) are �DMT = 0.24 to 0.52% in silt and clay,
�DMT = 0.16% in silty sand; these are also reported inTable 1.
Examination of the Potential of the Seismic Dilatometer (SDMT) to Estimate In Situ Stiffness Decay Curves in Various Soil Types
Soils and Rocks, São Paulo, 37(3): 177-194, September-December, 2014. 183
Figure 8 - SDMT profiles at L’Aquila basin: (a) Cese di Preturo, (b) Pianola, (c) Roio Piano, (d) L’Aquila (after Monaco et al., 2012).
5.4. Fucino plain (Italy)
In 1986 a comprehensive investigation, involvingstatic and dynamic loading effects, was carried out in the na-tional research site of Fucino, Italy (Burghignoli et al.,1991). In situ tests (SPT, CPT, DMT, self-boring pres-sumeter, vane test, Down-Hole, Cross-Hole, Spectral Analy-
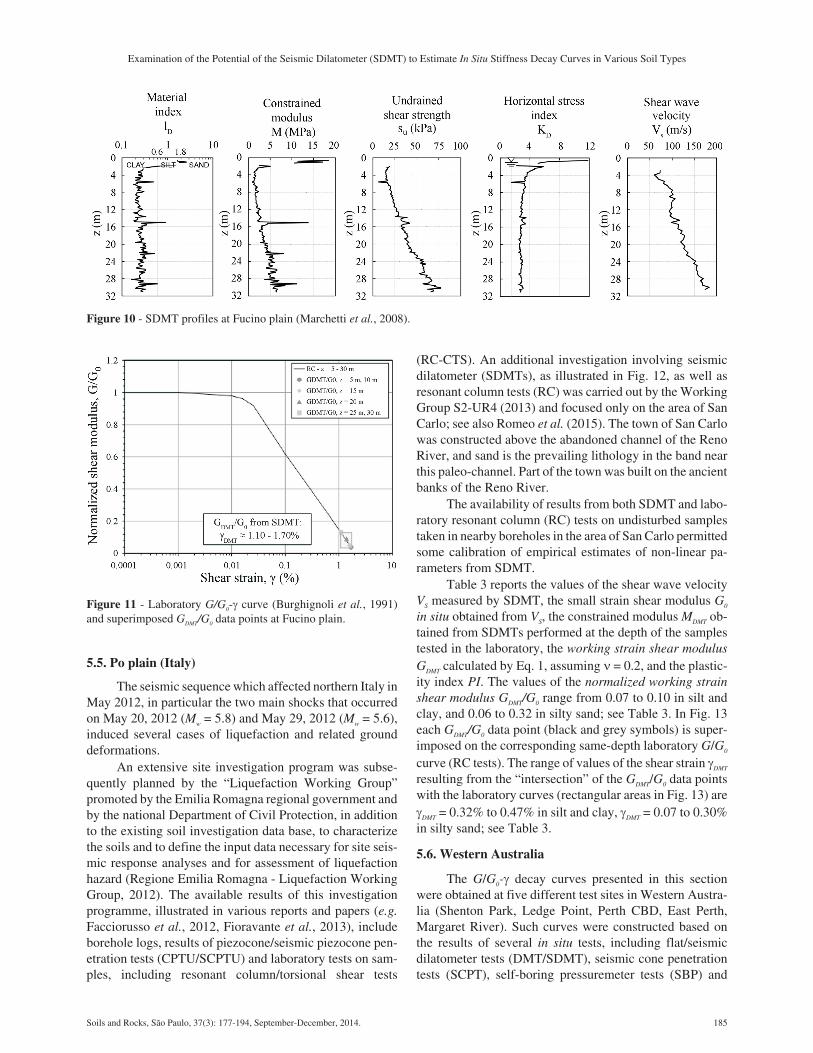
sis of Surface Waves) and laboratory tests (static anddynamic) were carried out to investigate the homogeneouslacustrine clay deposit to a depth of 40 m. Resonant col-umn/torsional shear tests (RC-CTS) were executed ontwelve undisturbed samples recovered from depths rangingbetween 3 and 37 m (effective vertical stress between 30 and250 kPa). Although the data points pertain to a wide range ofconsolidation stresses, the results define, within a narrowband, the strong dependence of the stiffness on the strainlevel (Burghignoli et al., 1991). In 2004 the same site in theFucino plain was investigated by seismic dilatometer (Mar-chetti et al., 2008) and the results are illustrated in Fig. 10.
Table 2 reports the values of the shear wave velocityVS measured by SDMT, the small strain shear modulus G0
in situ obtained from VS, the constrained modulus MDMT ob-tained by SDMT at the depth of the samples tested in thelaboratory, the working strain shear modulus GDMT calcu-lated by Eq. 1, assuming = 0.2, and the plasticity index PI.The values of the normalized working strain shear modulusGDMT/G0, also reported in Table 2, result 0.04 to 0.13 in clay.In Fig. 11 each GDMT/G0 data point (grey symbols) is super-imposed on the corresponding same-depth laboratory G/G0
curve (RC tests). The range of values of the shear strain �DMT
resulting from the “intersection” of the GDMT/G0 data pointswith the laboratory curves (rectangular areas in Fig. 11) are�DMT = 1.10 to 1.70% in clay; these are also reported inTable 2.
184 Soils and Rocks, São Paulo, 37(3): 177-194, September-December, 2014.
Amoroso et al.
Table 1 - L’Aquila - Values of GDMT/G0 obtained from SDMT and corresponding shear strain �DMT determined from the intersection withthe G/G0-� laboratory curves (after Amoroso et al., 2012).
Test site Sample Depth(m)
Soil type VS (m/s) G0
(MPa)MDMT
(MPa) GDMT
(MPa)GDMT/G0 �DMT (%) PI (%)
Cese di Preturo S3-C1 4.0-4.8 Silty clay 261 133 67 0.2 25 0.19 0.24 37
Cese di Preturo S3-C3 17.5-18.0 Clayey silt 274 149 39 0.2 15 0.1 0.48 37
Pianola S1-C1 6.0-6.5 Silty sand 303 195 193 0.2 72 0.37 0.16 31
Roio Piano S3-C2 7.0-7.5 Clayey silt 233 105 64 0.2 24 0.23 0.46 19
L’Aquila S1-C1 3.5-4.0 Clayey-sandy silt 344 232 97 0.2 36 0.16 0.52 31
Table 2 - Fucino plain - Values of GDMT/G0 obtained from SDMT and corresponding shear strain �DMT determined from the intersectionwith the G/G0-� laboratory curves.
Test site Sample Depth(m)
Soil type VS (m/s) G0 (MPa) MDMT
(MPa) GDMT
(MPa)GDMT/G0 �DMT (%) PI (%)
Telespazio - 5.0 Clay 70 14.7 1.4 0.2 0.5 0.04 1.70 30-70
Telespazio - 10.0 Clay 101 15.7 1.8 0.2 0.7 0.04 1.70 30-70
Telespazio - 15.0 Clay 98 17.7 2.2 0.2 0.8 0.05 1.60 30-70
Telespazio - 20.0 Clay 124 16.7 4 0.2 1.5 0.09 1.40 30-70
Telespazio - 25.0 Clay 156 16.7 5.6 0.2 2.1 0.13 1.10 30-70
Telespazio - 30.0 Clay 183 17.7 5.9 0.2 2.2 0.13 1.10 30-70
Figure 9 - Laboratory G/G0-� curves and superimposed GDMT/G0
data points at L’Aquila (after Amoroso et al., 2012).
5.5. Po plain (Italy)
The seismic sequence which affected northern Italy inMay 2012, in particular the two main shocks that occurredon May 20, 2012 (Mw = 5.8) and May 29, 2012 (Mw = 5.6),induced several cases of liquefaction and related grounddeformations.
An extensive site investigation program was subse-quently planned by the “Liquefaction Working Group”promoted by the Emilia Romagna regional government andby the national Department of Civil Protection, in additionto the existing soil investigation data base, to characterizethe soils and to define the input data necessary for site seis-mic response analyses and for assessment of liquefactionhazard (Regione Emilia Romagna - Liquefaction WorkingGroup, 2012). The available results of this investigationprogramme, illustrated in various reports and papers (e.g.Facciorusso et al., 2012, Fioravante et al., 2013), includeborehole logs, results of piezocone/seismic piezocone pen-etration tests (CPTU/SCPTU) and laboratory tests on sam-ples, including resonant column/torsional shear tests
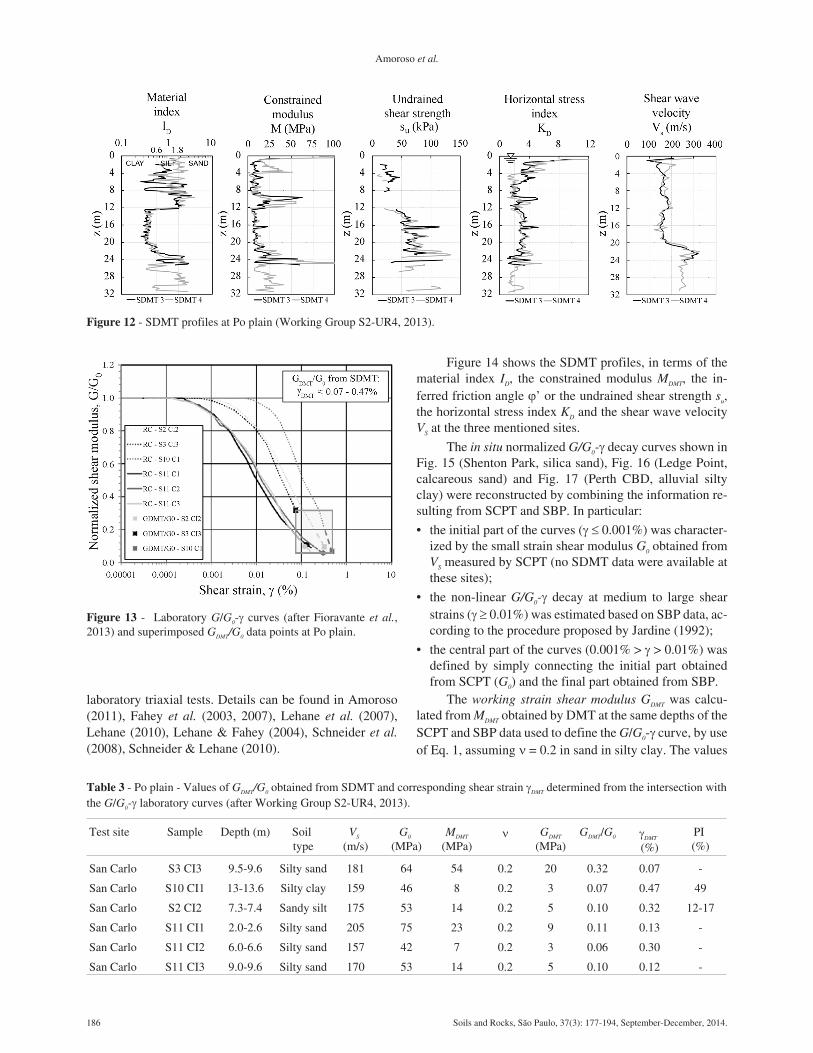
(RC-CTS). An additional investigation involving seismicdilatometer (SDMTs), as illustrated in Fig. 12, as well asresonant column tests (RC) was carried out by the WorkingGroup S2-UR4 (2013) and focused only on the area of SanCarlo; see also Romeo et al. (2015). The town of San Carlowas constructed above the abandoned channel of the RenoRiver, and sand is the prevailing lithology in the band nearthis paleo-channel. Part of the town was built on the ancientbanks of the Reno River.
The availability of results from both SDMT and labo-ratory resonant column (RC) tests on undisturbed samplestaken in nearby boreholes in the area of San Carlo permittedsome calibration of empirical estimates of non-linear pa-rameters from SDMT.
Table 3 reports the values of the shear wave velocityVS measured by SDMT, the small strain shear modulus G0
in situ obtained from VS, the constrained modulus MDMT ob-tained from SDMTs performed at the depth of the samplestested in the laboratory, the working strain shear modulusGDMT calculated by Eq. 1, assuming = 0.2, and the plastic-ity index PI. The values of the normalized working strainshear modulus GDMT/G0 range from 0.07 to 0.10 in silt andclay, and 0.06 to 0.32 in silty sand; see Table 3. In Fig. 13each GDMT/G0 data point (black and grey symbols) is super-imposed on the corresponding same-depth laboratory G/G0
curve (RC tests). The range of values of the shear strain �DMT
resulting from the “intersection” of the GDMT/G0 data pointswith the laboratory curves (rectangular areas in Fig. 13) are�DMT = 0.32% to 0.47% in silt and clay, �DMT = 0.07 to 0.30%in silty sand; see Table 3.
5.6. Western Australia
The G/G0-� decay curves presented in this sectionwere obtained at five different test sites in Western Austra-lia (Shenton Park, Ledge Point, Perth CBD, East Perth,Margaret River). Such curves were constructed based onthe results of several in situ tests, including flat/seismicdilatometer tests (DMT/SDMT), seismic cone penetrationtests (SCPT), self-boring pressuremeter tests (SBP) and
Examination of the Potential of the Seismic Dilatometer (SDMT) to Estimate In Situ Stiffness Decay Curves in Various Soil Types
Soils and Rocks, São Paulo, 37(3): 177-194, September-December, 2014. 185
Figure 10 - SDMT profiles at Fucino plain (Marchetti et al., 2008).
Figure 11 - Laboratory G/G0-� curve (Burghignoli et al., 1991)and superimposed GDMT/G0 data points at Fucino plain.
laboratory triaxial tests. Details can be found in Amoroso(2011), Fahey et al. (2003, 2007), Lehane et al. (2007),Lehane (2010), Lehane & Fahey (2004), Schneider et al.(2008), Schneider & Lehane (2010).
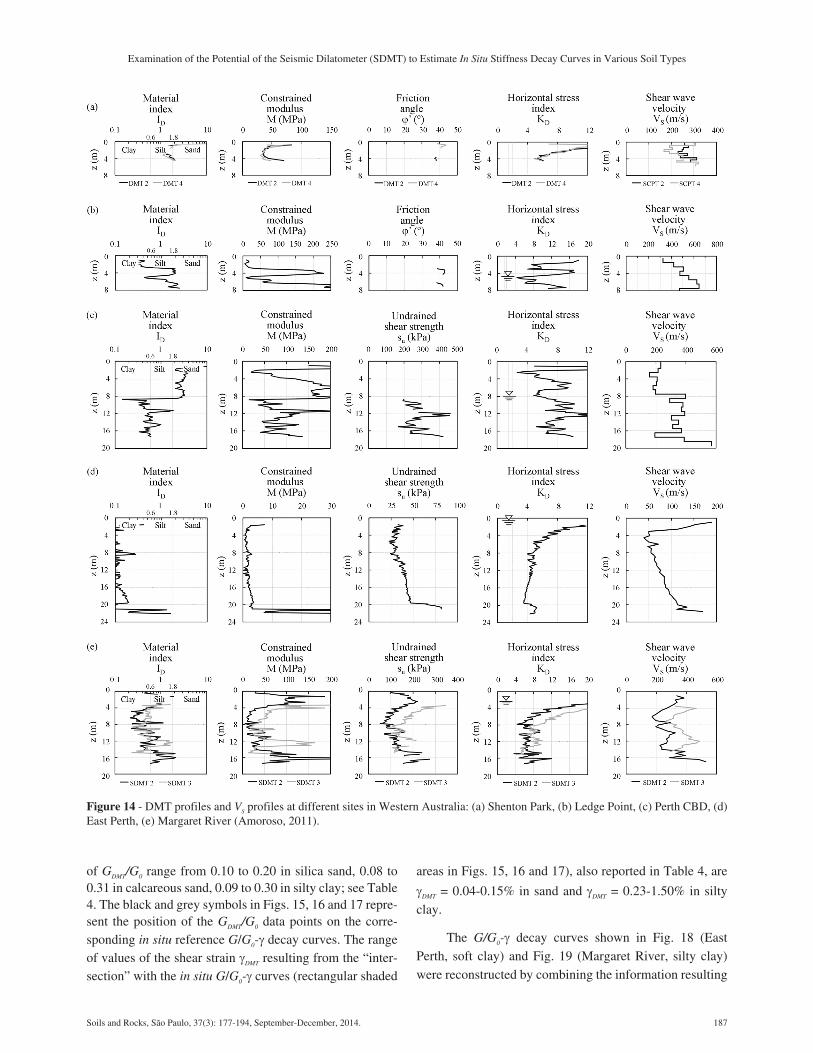
Figure 14 shows the SDMT profiles, in terms of thematerial index ID, the constrained modulus MDMT, the in-ferred friction angle �’ or the undrained shear strength su,the horizontal stress index KD and the shear wave velocityVS at the three mentioned sites.
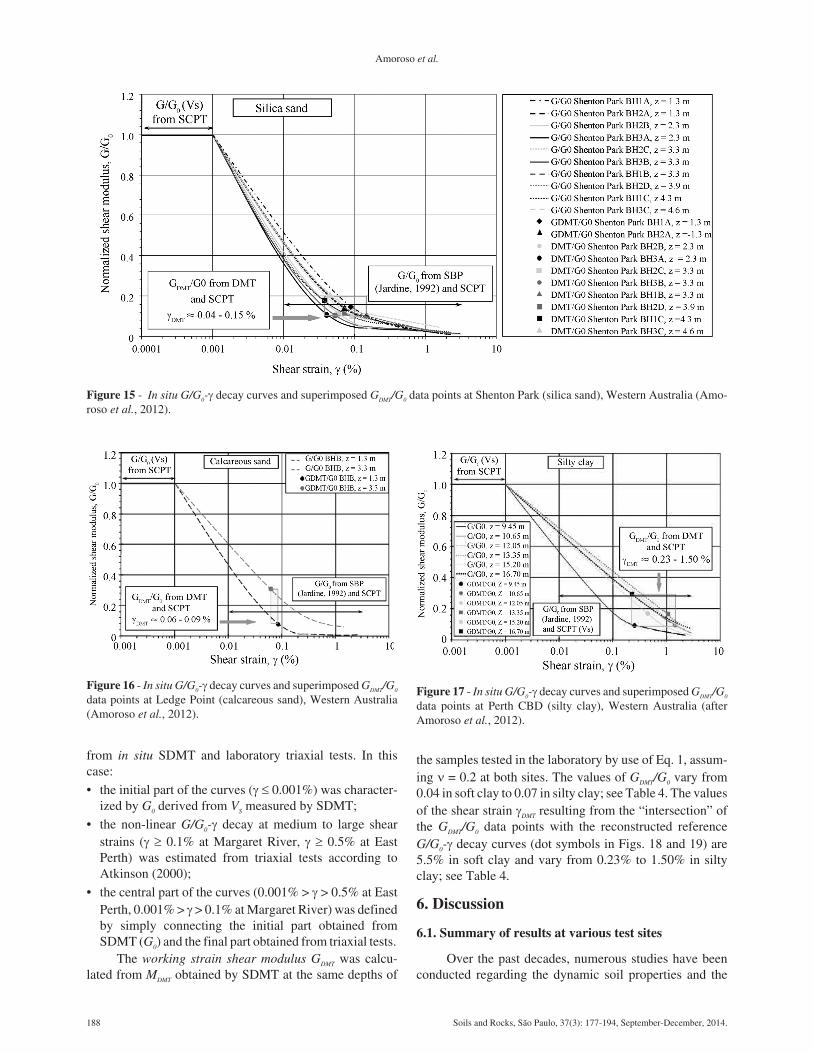
The in situ normalized G/G0-� decay curves shown inFig. 15 (Shenton Park, silica sand), Fig. 16 (Ledge Point,calcareous sand) and Fig. 17 (Perth CBD, alluvial siltyclay) were reconstructed by combining the information re-sulting from SCPT and SBP. In particular:
• the initial part of the curves (� � 0.001%) was character-ized by the small strain shear modulus G0 obtained fromVS measured by SCPT (no SDMT data were available atthese sites);
• the non-linear G/G0-� decay at medium to large shearstrains (� � 0.01%) was estimated based on SBP data, ac-cording to the procedure proposed by Jardine (1992);
• the central part of the curves (0.001% > � > 0.01%) wasdefined by simply connecting the initial part obtainedfrom SCPT (G0) and the final part obtained from SBP.
The working strain shear modulus GDMT was calcu-lated from MDMT obtained by DMT at the same depths of theSCPT and SBP data used to define the G/G0-� curve, by useof Eq. 1, assuming = 0.2 in sand in silty clay. The values
186 Soils and Rocks, São Paulo, 37(3): 177-194, September-December, 2014.
Amoroso et al.
Figure 12 - SDMT profiles at Po plain (Working Group S2-UR4, 2013).
Table 3 - Po plain - Values of GDMT/G0 obtained from SDMT and corresponding shear strain �DMT determined from the intersection withthe G/G0-� laboratory curves (after Working Group S2-UR4, 2013).
Test site Sample Depth (m) Soiltype
VS
(m/s)G0
(MPa)MDMT
(MPa) GDMT
(MPa)GDMT/G0 �DMT
(%)PI(%)
San Carlo S3 CI3 9.5-9.6 Silty sand 181 64 54 0.2 20 0.32 0.07 -
San Carlo S10 CI1 13-13.6 Silty clay 159 46 8 0.2 3 0.07 0.47 49
San Carlo S2 CI2 7.3-7.4 Sandy silt 175 53 14 0.2 5 0.10 0.32 12-17
San Carlo S11 CI1 2.0-2.6 Silty sand 205 75 23 0.2 9 0.11 0.13 -
San Carlo S11 CI2 6.0-6.6 Silty sand 157 42 7 0.2 3 0.06 0.30 -
San Carlo S11 CI3 9.0-9.6 Silty sand 170 53 14 0.2 5 0.10 0.12 -
Figure 13 - Laboratory G/G0-� curves (after Fioravante et al.,2013) and superimposed GDMT/G0 data points at Po plain.
of GDMT/G0 range from 0.10 to 0.20 in silica sand, 0.08 to0.31 in calcareous sand, 0.09 to 0.30 in silty clay; see Table4. The black and grey symbols in Figs. 15, 16 and 17 repre-sent the position of the GDMT/G0 data points on the corre-sponding in situ reference G/G0-� decay curves. The rangeof values of the shear strain �DMT resulting from the “inter-section” with the in situ G/G0-� curves (rectangular shaded
areas in Figs. 15, 16 and 17), also reported in Table 4, are
�DMT = 0.04-0.15% in sand and �DMT = 0.23-1.50% in siltyclay.
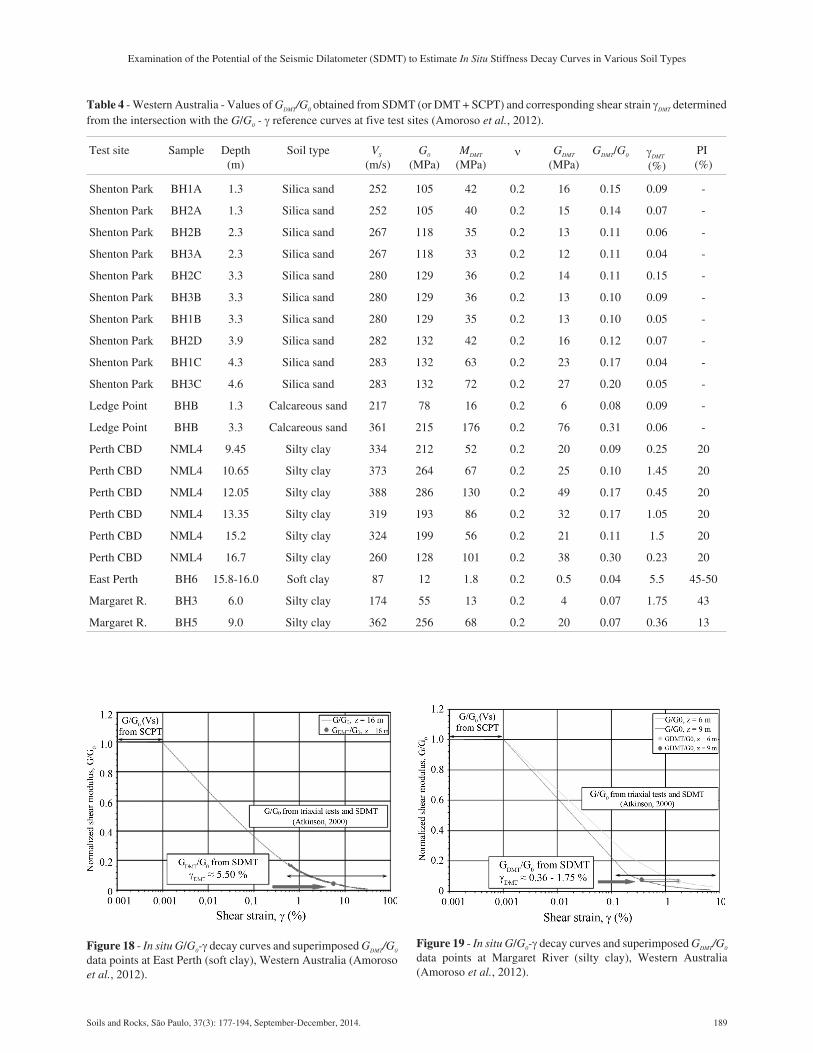
The G/G0-� decay curves shown in Fig. 18 (EastPerth, soft clay) and Fig. 19 (Margaret River, silty clay)were reconstructed by combining the information resulting
Examination of the Potential of the Seismic Dilatometer (SDMT) to Estimate In Situ Stiffness Decay Curves in Various Soil Types
Soils and Rocks, São Paulo, 37(3): 177-194, September-December, 2014. 187
Figure 14 - DMT profiles and VS profiles at different sites in Western Australia: (a) Shenton Park, (b) Ledge Point, (c) Perth CBD, (d)East Perth, (e) Margaret River (Amoroso, 2011).
from in situ SDMT and laboratory triaxial tests. In thiscase:• the initial part of the curves (� � 0.001%) was character-
ized by G0 derived from VS measured by SDMT;• the non-linear G/G0-� decay at medium to large shear
strains (� � 0.1% at Margaret River, � � 0.5% at EastPerth) was estimated from triaxial tests according toAtkinson (2000);
• the central part of the curves (0.001% > � > 0.5% at EastPerth, 0.001% > � > 0.1% at Margaret River) was definedby simply connecting the initial part obtained fromSDMT (G0) and the final part obtained from triaxial tests.
The working strain shear modulus GDMT was calcu-lated from MDMT obtained by SDMT at the same depths of
the samples tested in the laboratory by use of Eq. 1, assum-ing = 0.2 at both sites. The values of GDMT/G0 vary from0.04 in soft clay to 0.07 in silty clay; see Table 4. The valuesof the shear strain �DMT resulting from the “intersection” ofthe GDMT/G0 data points with the reconstructed referenceG/G0-� decay curves (dot symbols in Figs. 18 and 19) are5.5% in soft clay and vary from 0.23% to 1.50% in siltyclay; see Table 4.
6. Discussion
6.1. Summary of results at various test sites
Over the past decades, numerous studies have beenconducted regarding the dynamic soil properties and the
188 Soils and Rocks, São Paulo, 37(3): 177-194, September-December, 2014.
Amoroso et al.
Figure 15 - In situ G/G0-� decay curves and superimposed GDMT/G0 data points at Shenton Park (silica sand), Western Australia (Amo-roso et al., 2012).
Figure 16 - In situ G/G0-� decay curves and superimposed GDMT/G0
data points at Ledge Point (calcareous sand), Western Australia(Amoroso et al., 2012).
Figure 17 - In situ G/G0-� decay curves and superimposed GDMT/G0
data points at Perth CBD (silty clay), Western Australia (afterAmoroso et al., 2012).
Examination of the Potential of the Seismic Dilatometer (SDMT) to Estimate In Situ Stiffness Decay Curves in Various Soil Types
Soils and Rocks, São Paulo, 37(3): 177-194, September-December, 2014. 189
Figure 18 - In situ G/G0-� decay curves and superimposed GDMT/G0
data points at East Perth (soft clay), Western Australia (Amorosoet al., 2012).
Figure 19 - In situ G/G0-� decay curves and superimposed GDMT/G0
data points at Margaret River (silty clay), Western Australia(Amoroso et al., 2012).
Table 4 - Western Australia - Values of GDMT/G0 obtained from SDMT (or DMT + SCPT) and corresponding shear strain �DMT determinedfrom the intersection with the G/G0 - � reference curves at five test sites (Amoroso et al., 2012).
Test site Sample Depth(m)
Soil type VS
(m/s)G0
(MPa)MDMT
(MPa) GDMT
(MPa)GDMT/G0 �DMT
(%)PI(%)
Shenton Park BH1A 1.3 Silica sand 252 105 42 0.2 16 0.15 0.09 -
Shenton Park BH2A 1.3 Silica sand 252 105 40 0.2 15 0.14 0.07 -
Shenton Park BH2B 2.3 Silica sand 267 118 35 0.2 13 0.11 0.06 -
Shenton Park BH3A 2.3 Silica sand 267 118 33 0.2 12 0.11 0.04 -
Shenton Park BH2C 3.3 Silica sand 280 129 36 0.2 14 0.11 0.15 -
Shenton Park BH3B 3.3 Silica sand 280 129 36 0.2 13 0.10 0.09 -
Shenton Park BH1B 3.3 Silica sand 280 129 35 0.2 13 0.10 0.05 -
Shenton Park BH2D 3.9 Silica sand 282 132 42 0.2 16 0.12 0.07 -
Shenton Park BH1C 4.3 Silica sand 283 132 63 0.2 23 0.17 0.04 -
Shenton Park BH3C 4.6 Silica sand 283 132 72 0.2 27 0.20 0.05 -
Ledge Point BHB 1.3 Calcareous sand 217 78 16 0.2 6 0.08 0.09 -
Ledge Point BHB 3.3 Calcareous sand 361 215 176 0.2 76 0.31 0.06 -
Perth CBD NML4 9.45 Silty clay 334 212 52 0.2 20 0.09 0.25 20
Perth CBD NML4 10.65 Silty clay 373 264 67 0.2 25 0.10 1.45 20
Perth CBD NML4 12.05 Silty clay 388 286 130 0.2 49 0.17 0.45 20
Perth CBD NML4 13.35 Silty clay 319 193 86 0.2 32 0.17 1.05 20
Perth CBD NML4 15.2 Silty clay 324 199 56 0.2 21 0.11 1.5 20
Perth CBD NML4 16.7 Silty clay 260 128 101 0.2 38 0.30 0.23 20
East Perth BH6 15.8-16.0 Soft clay 87 12 1.8 0.2 0.5 0.04 5.5 45-50
Margaret R. BH3 6.0 Silty clay 174 55 13 0.2 4 0.07 1.75 43
Margaret R. BH5 9.0 Silty clay 362 256 68 0.2 20 0.07 0.36 13
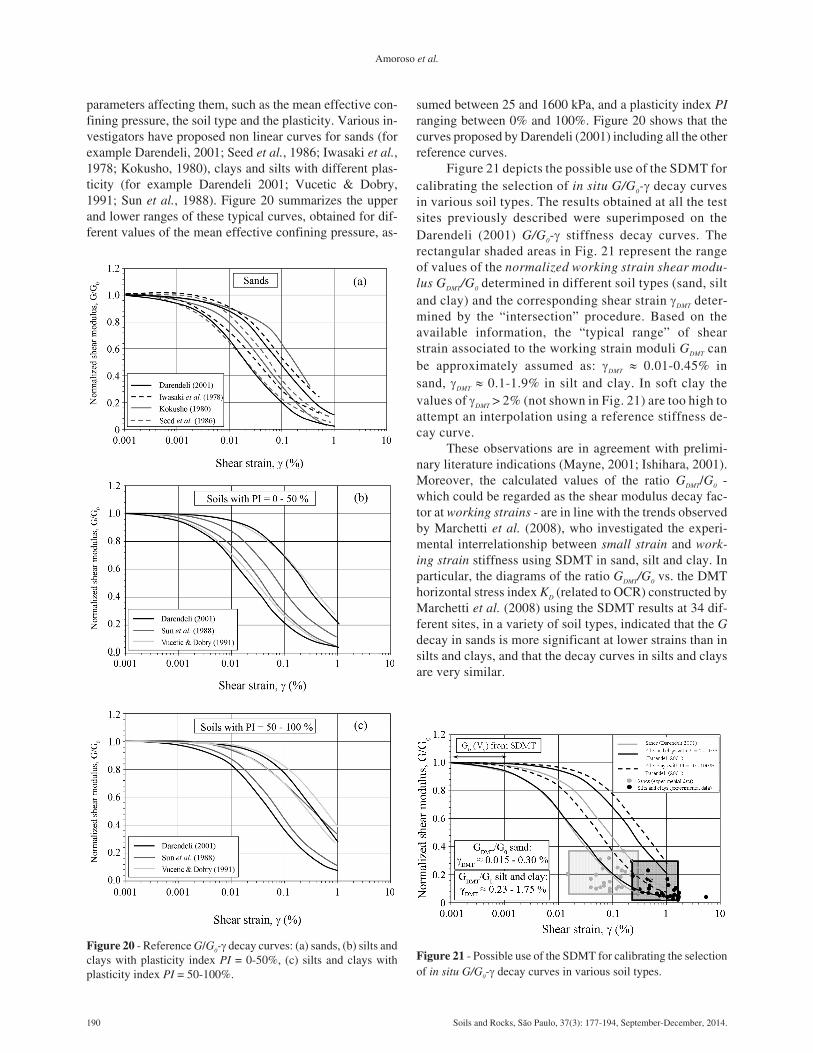
parameters affecting them, such as the mean effective con-fining pressure, the soil type and the plasticity. Various in-vestigators have proposed non linear curves for sands (forexample Darendeli, 2001; Seed et al., 1986; Iwasaki et al.,1978; Kokusho, 1980), clays and silts with different plas-ticity (for example Darendeli 2001; Vucetic & Dobry,1991; Sun et al., 1988). Figure 20 summarizes the upperand lower ranges of these typical curves, obtained for dif-ferent values of the mean effective confining pressure, as-
sumed between 25 and 1600 kPa, and a plasticity index PIranging between 0% and 100%. Figure 20 shows that thecurves proposed by Darendeli (2001) including all the otherreference curves.
Figure 21 depicts the possible use of the SDMT forcalibrating the selection of in situ G/G0-� decay curvesin various soil types. The results obtained at all the testsites previously described were superimposed on theDarendeli (2001) G/G0-� stiffness decay curves. Therectangular shaded areas in Fig. 21 represent the rangeof values of the normalized working strain shear modu-lus GDMT/G0 determined in different soil types (sand, siltand clay) and the corresponding shear strain �DMT deter-mined by the “intersection” procedure. Based on theavailable information, the “typical range” of shearstrain associated to the working strain moduli GDMT canbe approximately assumed as: �DMT � 0.01-0.45% insand, �DMT � 0.1-1.9% in silt and clay. In soft clay thevalues of �DMT > 2% (not shown in Fig. 21) are too high toattempt an interpolation using a reference stiffness de-cay curve.
These observations are in agreement with prelimi-nary literature indications (Mayne, 2001; Ishihara, 2001).Moreover, the calculated values of the ratio GDMT/G0 -which could be regarded as the shear modulus decay fac-tor at working strains - are in line with the trends observedby Marchetti et al. (2008), who investigated the experi-mental interrelationship between small strain and work-ing strain stiffness using SDMT in sand, silt and clay. Inparticular, the diagrams of the ratio GDMT/G0 vs. the DMThorizontal stress index KD (related to OCR) constructed byMarchetti et al. (2008) using the SDMT results at 34 dif-ferent sites, in a variety of soil types, indicated that the Gdecay in sands is more significant at lower strains than insilts and clays, and that the decay curves in silts and claysare very similar.
190 Soils and Rocks, São Paulo, 37(3): 177-194, September-December, 2014.
Amoroso et al.
Figure 20 - Reference G/G0-� decay curves: (a) sands, (b) silts andclays with plasticity index PI = 0-50%, (c) silts and clays withplasticity index PI = 50-100%.
Figure 21 - Possible use of the SDMT for calibrating the selectionof in situ G/G0-� decay curves in various soil types.
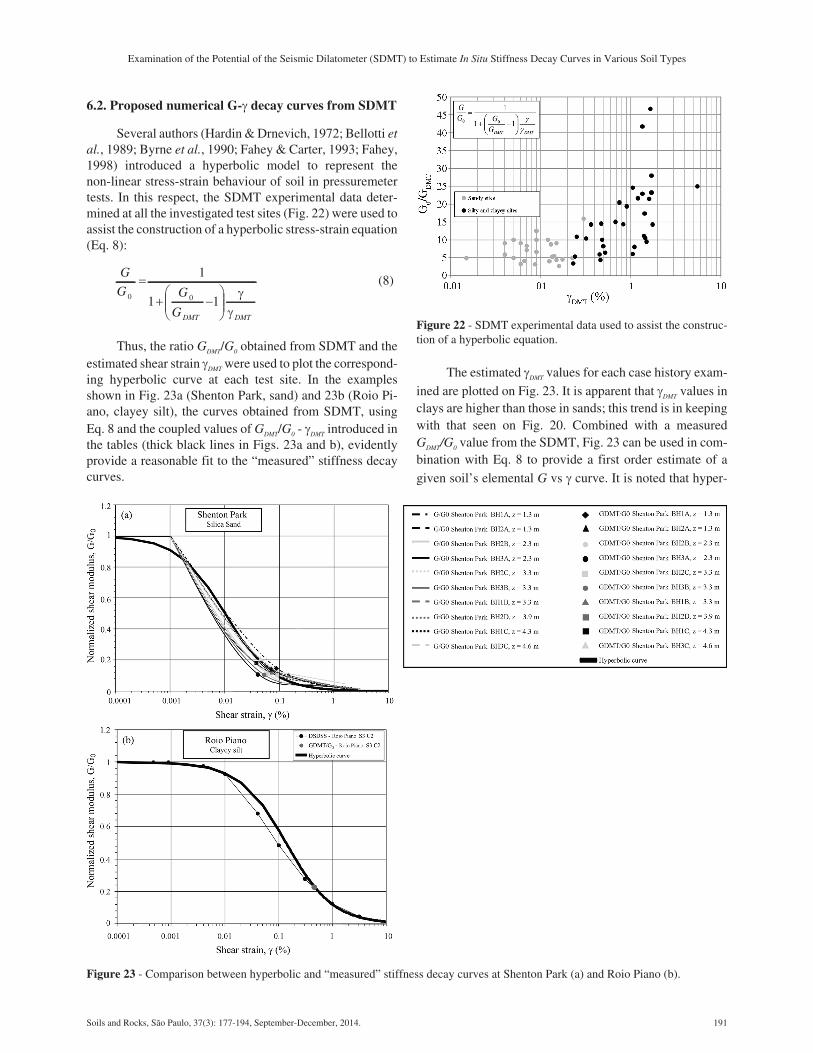
6.2. Proposed numerical G-� decay curves from SDMT
Several authors (Hardin & Drnevich, 1972; Bellotti etal., 1989; Byrne et al., 1990; Fahey & Carter, 1993; Fahey,1998) introduced a hyperbolic model to represent thenon-linear stress-strain behaviour of soil in pressuremetertests. In this respect, the SDMT experimental data deter-mined at all the investigated test sites (Fig. 22) were used toassist the construction of a hyperbolic stress-strain equation(Eq. 8):
G
G G
G DMT DMT
0 0
1
1 1
�
� �
���
�
���
�
�
(8)
Thus, the ratio GDMT/G0 obtained from SDMT and theestimated shear strain �DMT were used to plot the correspond-ing hyperbolic curve at each test site. In the examplesshown in Fig. 23a (Shenton Park, sand) and 23b (Roio Pi-ano, clayey silt), the curves obtained from SDMT, usingEq. 8 and the coupled values of GDMT/G0 - �DMT introduced inthe tables (thick black lines in Figs. 23a and b), evidentlyprovide a reasonable fit to the “measured” stiffness decaycurves.
The estimated �DMT values for each case history exam-
ined are plotted on Fig. 23. It is apparent that �DMT values inclays are higher than those in sands; this trend is in keepingwith that seen on Fig. 20. Combined with a measuredGDMT/G0 value from the SDMT, Fig. 23 can be used in com-bination with Eq. 8 to provide a first order estimate of a
given soil’s elemental G vs � curve. It is noted that hyper-
Examination of the Potential of the Seismic Dilatometer (SDMT) to Estimate In Situ Stiffness Decay Curves in Various Soil Types
Soils and Rocks, São Paulo, 37(3): 177-194, September-December, 2014. 191
Figure 23 - Comparison between hyperbolic and “measured” stiffness decay curves at Shenton Park (a) and Roio Piano (b).
Figure 22 - SDMT experimental data used to assist the construc-tion of a hyperbolic equation.
bolic G vs � curves have been seen to be particularly rele-vant for dynamic/cyclic applications.
7. Conclusions
The results presented in this paper support the possi-ble use of the SDMT to assess the decay of in situ stiffnesswith strain level and to address the selection of elementalG-� curves in various soil types. This potential stems fromthe ability of the SDMT to provide routinely, at each testdepth, both a small strain stiffness (G0 from VS) and a work-ing strain stiffness GDMT (derived via standard DMT corre-lations). “Reference typical-shape” laboratory G-� curvesmay be tentatively fitted through these two stiffness values.A significant premise of this approach is that, to locate thesecond point on the G-� curve, it is necessary to know (atleast approximately) the shear strain �DMT corresponding toworking strain modulus GDMT.
Typical ranges of �DMT in different soil types have beeninferred from the “intersection” of the SDMT data pointswith same-depth reference stiffness decay curves - back-figured from the observed field behavior under full-scaleloading, or obtained by cyclic/dynamic laboratory tests orreconstructed by the combined use of different in situ/labo-ratory techniques - at various test sites.
Based on the available information, �DMT is typicallyabout 0.1% in sand, about 0.5 to 1.0% in silt and clay andgreater than 2% in soft clay. The proposed hyperbolic rela-tionship, together with an estimate of �DMT from Fig. 21, canprovide a useful first order estimate of a soil’s G-� degrada-tion curve.
Acknowledgments
Special thanks to Prof. Silvano Marchetti for provid-ing the initial ideas for this study, and for his precious andcontinuous suggestions to support this research. Specialthanks also to Prof. Martin Fahey for offering his knowl-edge and experience to critically approach the presentstudy.
References
Amoroso, S. (2011) G-� decay curves by seismic dilato-meter (SDMT). PhD Dissertation, Department of Struc-tural, Water and Soil Engineering, University ofL’Aquila, L’Aquila, 480 p.
Amoroso, S.; Monaco, P. & Marchetti, D. (2012) Use of theSeismic Dilatometer (SDMT) to estimate in situ G-� de-cay curves in various soil types. Coutinho, R. & Mayne,P.W. (eds) Proc. 4th Int. Conf. on Geotechnical andGeophysical Site Characterization, ISC’4, Porto de Ga-linhas, Brazil, v. 1, p. 489-497.
Amoroso, S.; Totani, F.; Totani, G. & Monaco, P. (2015)Local seismic response in the Southern part of the his-toric centre of L’Aquila. Engineering Geology for Soci-ety and Territory - Urban Geology, Sustainable Plan-
ning and Landscape Exploitation, Springer Interna-tional Publishing, v. 5:XVIII, p. 1097-1100.
Atkinson, J.H. (2000) Non-linear soil stiffness in routinedesign. Géotechnique, v. 50:5, p. 487-508.
Bellotti, R.; Ghionna, V.; Jamiolkowski, M.; Robertson,P.K. & Peterson, R.W. (1989) Interpretation of modulifrom self-boring pressumeter tests in sand. Géotechni-que, v. 39, p. 269-292.
Berardi, R. (1999) Non linear elastic approaches in founda-tion design. Jamiolkowski, M.; Lancellotta R. & LoPresti D.C.F. (eds) Pre-Failure Deformation Character-istics in Geomaterials. Balkema, Rotterdam, p. 733-739.
Burghignoli, A.; Cavalera, L.; Chieppa, V.; Jamiolkowski,M.; Mancuso, C.; Marchetti, S.; Pane, V.; Paoliani, P.;Silvestri, F.; Vinale, F. & Vittori, E. (1991) Geotechni-cal characterization of Fucino clay. Proc. X ECSMFE,Firenze, v. 1, p. 27-40.
Byrne, P.M.; Salgado, F.M. & Howie, J.A. (1990) Rela-tionship between the unload shear modulus from pres-sumeter tests and the maximum shear modulus forsands. Proc. 3rd International Symposium on Pressu-meters, ISP3, Oxford, p. 231-241.
Cola, S. & Simonini, P. (2002) Mechanical behaviour ofsilty soils of the Venice lagoon as a function of theirgrading properties. Can. Geotech. J., v. 39:4, p. 879-893.
Darendeli, M.B. (2001) Development of a New Family ofNormalized Modulus Reduction and Material DampingCurves. PhD Dissertation, University of Texas.
Elhakim, A.F. & Mayne, P.W. (2003) Derived stress-strain-strength of clays from seismic cone tests. Proc.3rd Int. Symp. Deform. Charact. Geomaterials, Lyon,v. 1, p. 81-87.
Facciorusso, J.; Madiai, C. & Vannucchi, G. (2012) Ris-posta sismica locale e pericolosità sismica di liquefa-zione a San Carlo e Mirabello (FE). University of Flor-ence, 3 October 2012 (in Italian),http://ambiente.regione.emilia-romagna.it/geologia/temi/sismica/liquefazione-gruppo-di-lavoro/RAPPORTO_RSL_LIQ_ott_2012_UNIFI.pdf/at_download/file/RAPPORTO_RSL_LIQ_ott_2012_UNIFI.pdf.
Fahey, M. & Carter, J.P. (1993) A finite element study ofthe pressuremeter test in sand using a non-linear elasticplastic model. Can. Geotech. J., v. 30, p. 348-362.
Fahey, M. (1998) Deformation and in situ stress measure-ment. Robertson P.K. & Mayne P.W. (eds) Proc. 1st Int.Conf. on Site Characterization, Atlanta, v. 1, p. 49-68.
Fahey, M.; Lehane, B.M. & Stewart, D. (2003) Soil stiff-ness for shallow foundation design in the Perth CBD.Australian Geomechanics, v. 38:3, p. 61-90.
Fahey M.; Schneider, J.A. & Lehane, B.M. (2007) Self-boring pressuremeter testing in Spearwood dune sands.Australian Geomechanics, v. 42:4, p. 57-71.
192 Soils and Rocks, São Paulo, 37(3): 177-194, September-December, 2014.
Amoroso et al.
Fioravante, V.; Giretti, D.; Abate, G.; Aversa, S.; Boldini,D.; Capilleri, P.P.; Cavallaro, A.; Chamlagain, D.;Crespellani, T.; Dezi, F.; Facciorusso, J.; Ghinelli, A.;Grasso, S.; Lanzo, G.; Madiai, C.; Massimino, M.R.;Maugeri, M.; Pagliaroli, A.; Rainieri, C.; Tropeano, G.;Santucci De Magistris, F.; Sica, S.;Silvestri, F. & Van-nucchi, G. (2013) Earthquake geotechnical engineeringaspects of the 2012 Emilia-Romagna earthquake (Italy).Proc. 7th Int. Conf. on Case Histories in GeotechnicalEngineering, Chicago, Paper No. EQ-5.
Gibbens, R.M. & Briaud, J.L. (1994a) Test and predictionresults for five large spread footings on sand. Geotech-nical Special Publication, ASCE, v. 41, p. 92-128.
Gibbens, R.M. & Briaud, J.L. (1994b) Data and predictionrequest for the spread footing prediction event (at theoccasion of the ASCE Spec. Conf. Settlement ‘94).Geotechnical Special Publication, ASCE, v. 41, p. 11-85.
Gottardi, G. & Tonni, L. (2004) A comparative study ofpiezocone tests on the silty soils of the Venice lagoon(Treporti Test Site). Viana da Fonseca A. & MayneP.W. (eds) Proc. 2nd International Conference on SiteCharacterization, Porto, v. 2, p. 1643-1649.
Hardin, B. O. & Drnevich, V. P. (1972) Shear modulus anddamping in soils: design equations and curves. J. SoilMech. and Found. Div., ASCE, v. 98:SM7, p. 667-692.
Hepton, P. (1988) Shear wave velocity measurements dur-ing penetration testing. Proc. Penetration Testing in theUK, ICE, p. 275-278.
Ishihara, K. (2001) Estimate of relative density from in-situpenetration tests. Rahardjo P.P. & Lunne T. (eds). Proc.Int. Conf. on In Situ Measurement of Soil Properties andCase Histories, Bali, p. 17-26.
Iwasaki, T.; Tatsuoka, F. & Takagi, Y. (1978) Shear moduliof sands under cyclic torsional shear loading. Soils andFoundations, v. 18:1, p. 39-56.
Jardine, R.J. (1992) Non-linear stiffness parameters fromundrained pressuremeter tests. Can. Geotech. J.,v. 29:3, p. 436-447.
Kokusho, T. (1980) Cyclic triaxial test of dynamic soilproperties for wide strain range. Soils and Foundations,v. 20:2, p. 45-60.
Lehane, B.M. & Fahey, M. (2004) Using SCPT and DMTdata for settlement prediction in sand. Viana da FonsecaA. & Mayne P.W. (eds) Proc. 2nd Int. Conf. on SiteCharacterization, Porto, v. 2, p. 1673-1679.
Lehane, B.M.; Mathew, G. & Stewart, D. (2007) A labora-tory investigation of the upper horizons of thePerth/Guildford formation in Perth CBD. AustralianGeomechanics, v. 42:3, p. 87-100.
Lehane, B.M. (2010) Shallow foundation performance in acalcareous sand. Proc 2nd Int. Symposium on Frontiersin Offshore Geotechnics, ISFOG-2, Perth, p. 427-432.
Marchetti, S. (1980) In Situ Tests by Flat Dilatometer. J.Geotech. Engrg. Div., ASCE, v. 106:GT3, p. 299-321.
Marchetti, S.; Monaco, P.; Totani, G. & Calabrese, M.(2001) The Flat Dilatometer Test (DMT) in Soil Inves-tigations - A Report by the ISSMGE Committee TC16.Proc. 2nd Int. Conf. on the Flat Dilatometer, Washing-ton D.C., p. 7-48.
Marchetti, S.; Monaco, P.; Calabrese, M. & Totani, G.(2004) DMT-predicted vs measured settlements under afull-scale instrumented embankment at Treporti (Ven-ice, Italy). Viana da Fonseca A. & Mayne P.W. (eds)Proc. 2nd Int. Conf. on Site Characterization, Porto,v. 2, p. 1511-1518.
Marchetti, S.; Monaco, P.; Calabrese, M. & Totani, G.(2006) Comparison of moduli determined by DMT andbackfigured from local strain measurements under a40 m diameter circular test load in the Venice area.Failmezger R.A. & Anderson J.B. (eds) Proc. 2nd Int.Conf. on the Flat Dilatometer, Washington D.C.,p. 220-230.
Marchetti, S.; Monaco, P.; Totani, G. & Marchetti, D.(2008) In Situ tests by seismic dilatometer (SDMT).Laier, J.E.; Crapps D.K. & Hussein M.H. (eds) FromResearch to Practice in Geotechnical Engineering. Geo-technical Special Publication, ASCE, v. 180, p. 292-311.
Martin, G.K. & Mayne, P.W. (1997) Seismic flat dilato-meter tests in Connecticut Valley Varved clay. Geo-tech. Testing J., ASTM, v. 20:3, p. 357-361.
Martin, G.K. & Mayne, P.W. (1998) Seismic flat dila-tometer in Piedmont residual soils. Robertson P.K. &Mayne P.W. (eds) Proc. 1st Int. Conf. on Site Charac-terization, Atlanta, v. 2, p. 837-843.
Mayne, P.W.; Schneider, J.A. & Martin, G.K. (1999)Small- and large-strain soil properties from seismic flatdilatometer tests. Jamiolkowski, M.; Lancellotta R. &Lo Presti D.C.F. (eds) Pre-failure Deformation Charac-teristics in Geomaterials. Balkema, Rotterdam, p. 419-427.
Mayne, P.W. (2001) Stress-strain-strength-flow parame-ters from enhanced in-situ tests. Rahardjo P.P. & LunneT. (eds), Proc. Int. Conf. on In Situ Measurement of SoilProperties and Case Histories, Bali, p. 27-47.
Mayne, P.W. (2003) Class “A” footing response predictionfrom seismic cone tests. Proc. 3rd Int. Symp. Deform.Charact. Geomaterials, Lyon, v. 1, p. 883-888.
McGillivray, A. & Mayne, P.W. (2004) Seismic piezoconeand seismic flat dilatometer tests at Treporti. Viana daFonseca A. & Mayne P.W. (eds) Proc. 2nd Int. Conf. onSite Characterization, Porto, v. 2, p. 1695-1700.
Monaco, P.; Totani, G. & Calabrese, M. (2006) DMT-predicted vs observed settlements: a review of the avail-able experience. Failmezger R.A. & Anderson J.B.(eds) Proc. 2nd Int. Conf. on the Flat Dilatometer,Washington D.C., p. 244-252.
Monaco, P.; Totani, G.; Barla, G.; Cavallaro, A.; Costanzo,A.; D’Onofrio, A.; Evangelista, L.; Foti, S.; Grasso, S.;
Examination of the Potential of the Seismic Dilatometer (SDMT) to Estimate In Situ Stiffness Decay Curves in Various Soil Types
Soils and Rocks, São Paulo, 37(3): 177-194, September-December, 2014. 193
Lanzo, G.; Madiai, C.; Maraschini, M.; Marchetti, S.;Maugeri, M.; Pagliaroli, A.; Pallara, O.; Penna, A.;Saccenti, A.; Santucci de Magistris, F.; Scasserra, G.;Silvestri, F.; Simonelli, A.L.; Simoni, G.; Tommasi, P.;Vannucchi, G. & Verrucci, L. (2012) Geotechnical as-pects of the L’Aquila earthquake. Sakr M.A. & AnsalA. (eds) Special Topics in Advances in EarthquakeGeotechnical Engineering, Chapter 1. Springer Sci-ence+Business Media B.V.
Monaco, P.; Totani, G.; Amoroso, S.; Totani, F. & Mar-chetti, D. (2013) Site characterization by seismic dila-tometer (SDMT) in the city of L’Aquila. Rivista Ita-liana di Geotecnica, v. XLVII:3, p. 8-22.
Monaco P.; Amoroso S.; Marchetti S.; Marchetti D.; TotaniG.; Cola S. & Simonini P. (2014) Overconsolidationand Stiffness of Venice Lagoon Sands and Silts fromSDMT and CPTU. J. Geotech. Geoenviron. Eng.,ASCE, v. 140:1, p. 215-227.
Regione Emilia Romagna - Liquefaction Working Group(2012) Primo rapporto sugli effetti della liquefazioneosservati a S. Carlo, frazione di S. Agostino (Provinciadi Ferrara). 25 June 2012 (in Italian),http://ambiente.regione.emilia-romagna.it/geologia/temi/sismica/liquefazione-gruppo-di-lavoro/rapporto_sancarlo.pdf/at_download/file/rapporto_sancarlo.pdf.
Robertson, P.K. & Ferrera, R.S. (1993) Seismic and pres-suremeter testing to determine soil modulus. Predictivesoil mechanics, Wroth Memorial Symposium, p. 562-580.
Romeo, R. W.; Amoroso, S.; Facciorusso, J.; Lenti, L.;Madiai, C.; Martino, S.; Monaco, P.; Rinaldis, D. &Totani, F. (2015) Soil liquefaction during the Emilia,2012 seismic sequence: investigation and analysis. En-gineering Geology for Society and Territory - UrbanGeology, Sustainable Planning and Landscape Exploi-tation, Springer International Publishing, v. 5:XVIII,p. 1107-1110.
Santucci de Magistris, F.; d’Onofrio, A.; Evangelista, L.;Foti, S.; Maraschini, M.; Monaco, P.; Amoroso, S.;Totani, G.; Lanzo G.; Pagliaroli, A.; Madiai, C.; Si-moni, G. & Silvestri, F. (2013) Geotechnical character-ization of the Aterno valley for site response analyses.Rivista Italiana di Geotecnica, v. XLVII:3, p. 23-43.
Schneider, J.A.; Fahey, M. & Lehane, B.M. (2008) Charac-terization of an unsaturated sand deposit by in situ test-ing. Proc. 3rd Int. Conf. on Site Characterization,p. 633-638.
Schneider, J.A. & Lehane, B.M. (2010) Evaluation of conepenetration test data from a calcareous sand dune. Proc.2nd Int. Symp. on Penetration Testing, HuntingtonBeach, CA.
Seed, H.B.; Wong, R.T.; Idriss, I.M. & Tokimatsu, K.(1986) Moduli and damping factors for dynamic analy-ses of cohesionless soils. Journal of the Soil Mechanicsand Foundations Division, ASCE, v. 112:SM11,p. 1016-1032.
Simonini, P. (2004) Characterization of the Venice lagoonsilts from in-situ tests and the performance of a test em-bankment. Viana da Fonseca A. & Mayne P.W. (eds)Proc. 2nd Int. Conf. on Site Characterization, Porto,v. 1, p. 187-207.
Simonini, P.; Ricceri, G. & Cola, S. (2006) Geotechnicalcharacterization and properties of the Venice lagoonheterogeneous silts. Proc. 2nd Int Workshop on Charac-terization and Engineering Properties of Natural Soils,Singapore, v. 4, p. 2289-2328.
Sun, J.I.; Golesorkhi, R. & Seed H.B. (1988) DynamicModuli and Damping Ratio for Cohesive Soils. Report,UCB/EERC-88/15, University of California at Berkley,48 p.
Totani, G.; Totani, F.; Monaco, P.; Tallini, M.; Del Mo-naco, F. & Zia, G. (2012) Site investigations and geo-technical problems in the Southern part of the historiccentre of L’Aquila. Maugeri M. & Soccodato C. (eds)Proc. 2nd Int. Conf. on Performance-Based Design inEarthquake Geotechnical Engineering, Taormina, Italy,Paper No. 2.13, p. 315-328 (CD-ROM).
Vucetic, M. & Dobry, R. (1991) Effect of soil plasticityoncyclic response. Journal of Geotechnical Engineering,ASCE, v. 120:7, p. 585-594.
Working Group S2-UR4 (2013) Analysis of the liquefac-tion phenomena in the area of San Carlo by seismicdilatometer (SDMT). Project S2-2012 INGV-DPC, De-liverable D8.1 - Annex 3, Rev. 1.1, Sept. 2013https://docs.google.com/file/d/0B60wsWaPpDL4RVMzb01ETU8zT2s/edit?usp=sharing.
194 Soils and Rocks, São Paulo, 37(3): 177-194, September-December, 2014.
Amoroso et al.