frontespizio the seismic dilatometer. stress history ... · the seismic dilatometer. stress...
TRANSCRIPT

Silvano MarchettiUniversity of L'Aquila, Italy
The seismic dilatometer. Stress History, liquefaction, settlements.
Frontespizio
CTICS-ABMS Singeo 2013
24 April 2013 Rio de Janeiro

In the last decades : massive migration from lab
testing to insitu testing. Often today in situ testing is
the major part of an investigation.
In situ : Fast, economical, reproducible, informative,
many data, reduced scatter, cost much less than
sampling & testing….
True in Sand : Recovering samples is difficult. Field
tests method of choice - state-of-practice.
Caution : lab remains fundamental for research
FROM LAB TO INSITU TESTING

Some are too slow, some expensive or difficult to run
etc.. Which ones to use ?
2009 Mayne et al. : many in situ tests

“in this fast-paced world, direct-push… SCPT and SDMT should
serve as the basis … in routine daily site investigations…”
Robertson (ISC4 2012) “use direct-push multi-measurement in-situ
devices, such as SCPT and SDMT” abandon SPT crude, unreliable
Mlynarek (ISC 2012) : in many countries CPTU and SDMT/ DMT are
becoming basic methods for evaluating subsoil properties. Howie 2012…
Direct push CPT/DMT increasingly recommended everyday practice
This presentation : describes DMT, results, eng. applications
Mayne et al. SOA 17th ICSMGE Egypt 2009Mayne P.W. Georgia Institute of Technology, Atlanta, USACoop M.R. Imperial College, London, UKSpringman S.M. Swiss Federal Inst. of Technology, Zurich, CHHuang A.B. National Chiao Tung Univ., Taiwan, ChinaZornberg J.G. University of Texas, Austin, USA

DMT components DMT pushed by a truckmounted penetrometer

Small inexpensive pushing machines
Use same rigs used for pushing CPT. But many
more insertion methods : no need of 2 cm/sec

Blade can also be inserted
by a drill rig, used as a
penetrometer for pushing
Blade can also be
driven by SPT
hammer (though quasi
static preferable)

����
����
����
pushrod
Pushrod
Drill
rod
pushrod
����
����
Drill
rod
Pushrod
����
Drill rig :“SCIACCA” METHOD
DMT pushed by a drill rig, using it as a penetrometer. Lateral exit of cable is above ground (all needed : 3 adaptors)

Nearly liquid soils : highly
accurate due to the “balance of
zero” method
Hard soils (e.g. Cu 800 kPa),
weak rock: OK but need strong
push - heavy truck
Robust, can safely
withstand 25 tonSuitable for penetrable
soils (sand, silt, clay)
LIMITS
Clays Cu=2-4 kPa up to 1 MPa (marl)
Moduli M=0.5 to 400 Mpa

DMTBLADE

� � �
REDUCTION FORMULAE
in ����TC16 (2001) issmge
po, p1 ���� Id, Kd, Ed
���� Soil parameters
(M, Cu …)
HOW DMT WORKS (mechanical)

DMT FORMULAE
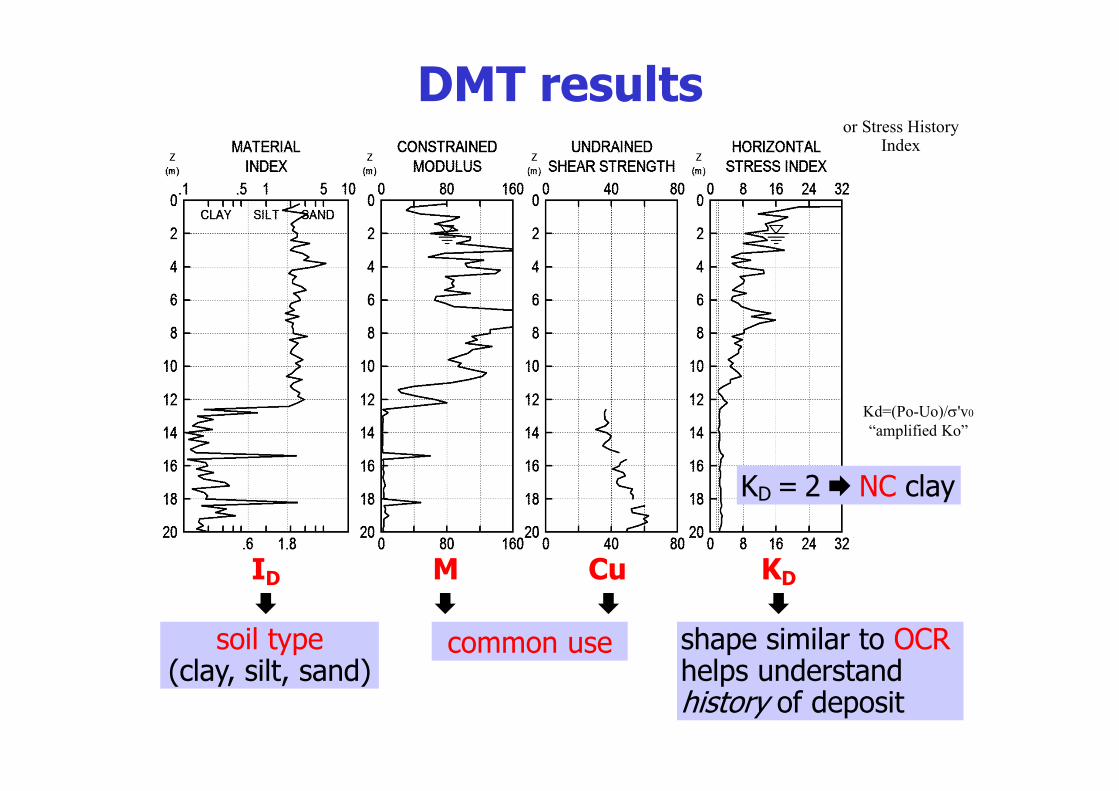
DMT results
KD = 2� NC clay
ID�
M Cu� �
KD
�
soil type(clay, silt, sand)
common use shape similar to OCRhelps understand history of deposit
Kd=(Po-Uo)/σ'v0
“amplified Ko”
or Stress History Index

SEISMIC DILATOMER : DMT with the
addition of a seismic module (tube) ����Vs
Vs from delay of pulse2 receivers vs 1 receiver:
Same blowTrigger not criticalNo mitical 1st arrivalDelay well conditioned
Amplified + digitiz at depth
SDMT
Operator independentInterpreter independent
Much faster & economicalthan Down hole – X hole
No hole/ no samples, no grouting pipes (supervisionfor voids? Stop for cement..) Same day

SeismicDilatometer

Seismograms SDMT at Fucino
Delay well conditioned ���� Cross correlation
(no first arrival) Repeatability of Vs 1-2 %
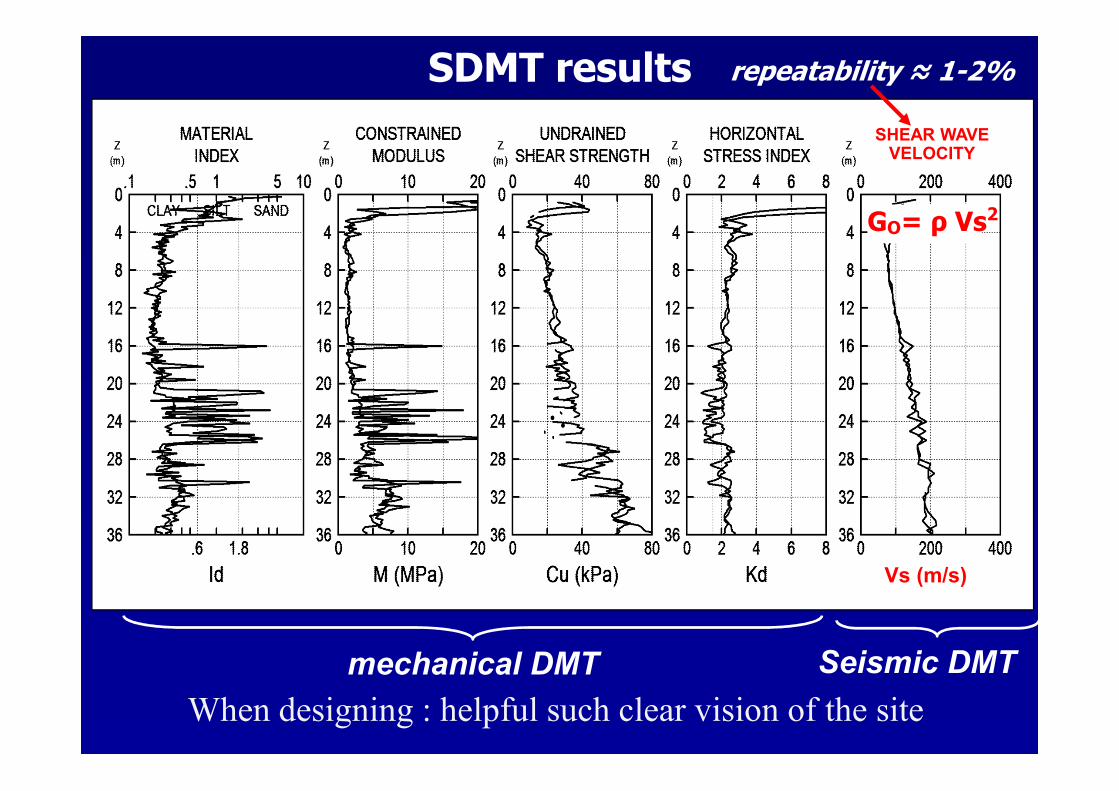
Vs (m/s)
SHEAR WAVEVELOCITY
mechanical DMT Seismic DMT
SDMT results
GO= ρ Vs2
repeatability ≈ 1-2%
When designing : helpful such clear vision of the site

STANDARDS
EUROCODE 7 (1997). Standard Test Method, European Committee
for Standardization, Part 3: Design Assisted by Field Testing, Section
9: Flat Dilatometer Test (DMT), 9 pp.
ASTM (2002). Standard Test Method D6635-01, American Society for
Testing and Materials. The standard test method for performing the
Flat Dilatometer Test (DMT), 14 pp.
TC16 (2001). “The DMT in soil Investigations”, a report by the
ISSMGE Technical Committee tc16 on Ground Property,
Characterization from in-situ testing, 41 pp.
ASTM (2011) – Standard Test Method D7400 – 08, “Standard Test
Methods for Downhole Seismic Testing“, 11 pp.
Diffusion : DMT used in 50 countries (200 DMT in US)

Main SDMT applications
� Kd indicator of Stress History (prelim. capability)
� Settlements of shallow foundations
� Compaction control
� Slip surface detection in OC clay
� Quantify σ'h relaxation behind a landslide (or diaphragm
wall upon excavation)
� Laterally loaded piles
� Diaphragm walls “springs” for design
� FEM input parameters
� Liquefability evaluation
� Seismic design (NTC08, Eurocode 8)
� In situ G-γ decay curves

Effects of Stress History on CPT and DMTLee 2011, Eng. Geology – ≈≈≈≈ 30 CC in sand
Effect of stress history on
normalized Qc (x 1.10-1.15)Effect of stress history on
Kd (x 1.30-2.50)
A key parameter by DMT is Kd.Kd a powerful indicator of Stress History

PRESTRAINING CYCLESsimulate AGING (grain slippage)
CC TEST N. 216 IN TICINO SAND
Jamiolkowski (ISC'98 Atlanta) applied prestraining cycles in
calibration chamber. Found : KD (DMT) 3 to 7 times more sensitive to AGING than penetration resistance
KD + 20 %
qD + 3 %
DMT far more sensitive to SH & aging

DMT MORE REACTIVE TO STRESS HISTORY
MDMT
MDMTQc Qc
BEFORE AFTERConfirmed in
the field …
Jendeby 92
Measured in a
loose sandfill
Qc & Mdmt
before-after
compaction
���� OCR in sand
NC : M/Qc ≈ 5-12 OC : M/Qc ≈ 12-24

MDMT before-after compaction
Resonant vibro-compaction technique
Van Impe, De Cock, Massarsch,
Mengé, New Delhi (1994)
COMPACTION (impose SH) produces a MDMT%
increase ≈≈≈≈ twice the Qc% increase
Schmertmann (1986) DYNAMIC COMPACTION of
sand site. MDMT % increase ≈≈≈≈ twice% increase in Qc.
Jendeby (1992) monitored DEEP COMPACTION in a
sand fill by VIBROWING. MDMT increase ≈≈≈≈ twiceincrease in qc.
Pasqualini & Rosi (1993) VIBROFLOTATION job :
"DMT clearly detected improvement even in layers where
benefits were undetected by CPT".
Ghent group (1993) before-after CPTs DMTs to evaluate
effects (±∆σ±∆σ±∆σ±∆σh , Dr) by PILE (Atlas) INSTALLATION
"DMTs before-after installation demonstrate more clearly
[than CPT] beneficial effects of Atlas installation".
bar

Data shown indicate Kd as an effective Stress History indicator (interesting : not many SH tools – sand)
Jamiolkowski (Isopt-1,‘88,1) : “without Stress History, impossible to select reliable E (or M) from Qc”(also Terzaghi, Leonards, Schmertmann…)
Yoshimi (1975) “… upon initial loading the NC sand specimens were >six times more compressible than the prestressed sand” hence imperative SH to characterize compressibility of sand
Application #1 DMT : predict settlements (operative modulus)
Mdmt= Ed x Rm(Kd, Id) (combines Ed with Stress History)
Settlement predictions by DMT

Reliability confirmed by a large
number case histories favourable
comparisons measured vs DMT-
predicted settlements - or moduli
Cruz (2010), Vargas (2009), Bullock (2008), Monaco (2006), Lehane
& Fahey (2004), Mayne (2001, 2004), Failmezger (1999, 2000, 2001),
Crapps & Law Engineering (2001), Tice & Knott (2000), Woodward
(1993), Iwasaki et al. (1991), Hayes (1990), Mayne & Frost (1988),
Schmertmann (1986,1988), Steiner (1994), Leonards (1988),
Lacasse (1986)……………
(see > 40 papers at ISC4-2012).
by Boussinesq
zM
SDMT
vDMT ∆
∆=∑−
σ1
Settlement predictions by DMT
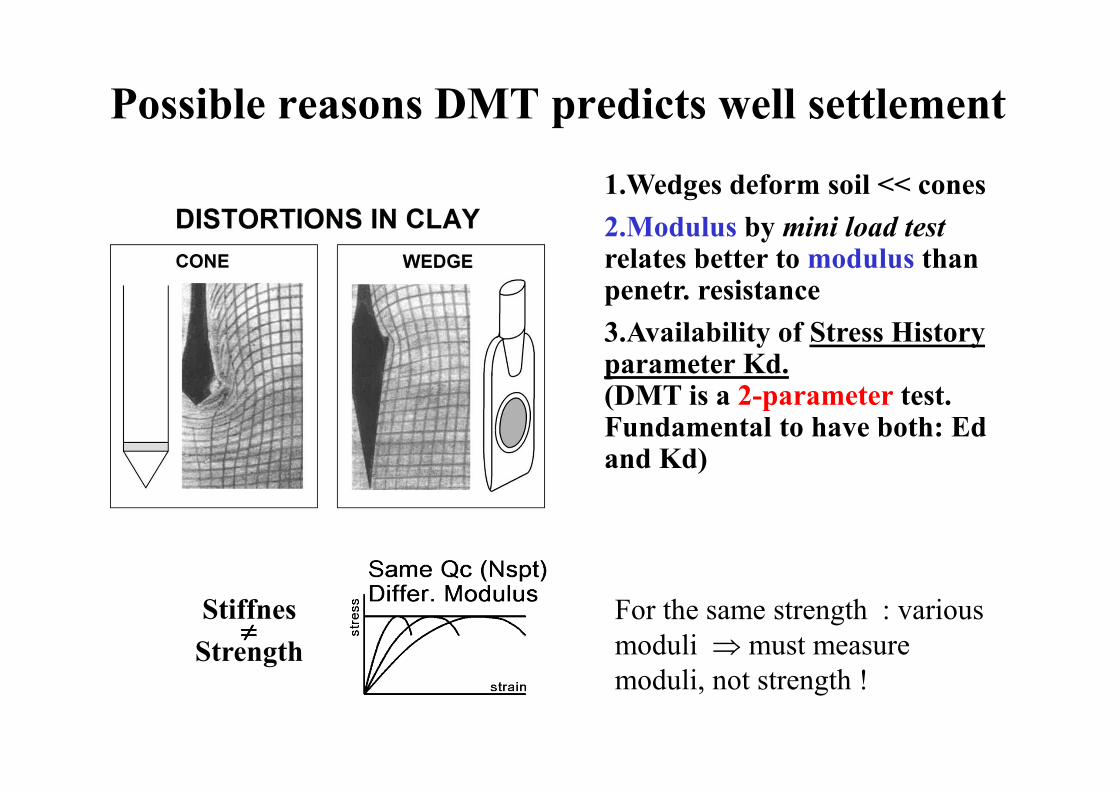
1.Wedges deform soil << cones
2.Modulus by mini load testrelates better to modulus than penetr. resistance
3.Availability of Stress History parameter Kd.(DMT is a 2-parameter test. Fundamental to have both: Ed and Kd)
Stiffnes≠≠≠≠
Strength
Possible reasons DMT predicts well settlement
For the same strength : various
moduli ⇒ must measure
moduli, not strength !

•Jamiolkowski et al. (S. Francisco 1985) "Reliable predictions of
sand liquefiability...require…some new in situ device [other than
CPT or SPT], more sensitive to effects of past STRESS-STRAIN
HISTORIES”
•Leon et al. (ASCE GGE 2006) South Carolina sands. “Ignoring
AGING and evaluating CRR from in situ tests insensitive to aging
(SPT, CPT, VS) underestimated CRR by a large 60 %”
•Monaco & Schmertmann (ASCE GGE 2007) Disregarding
AGING ≈≈≈≈ omitting a primary parameter in the correlation
predicting CRR
Stress history/aging also necessary
for liquefiability

Robertson & Wride (1998)���� CRR by CPT adequate for low-risk projects. For high-risk : estimate CRR by more than one method
Youd & Idriss 2001 (NCEER Workshops )���� use 2 or more tests for a more reliable evaluation of CRR
Idriss & Boulanger (2004)���� the allure of relying on a single approach (e.g. CPT-only) should be avoided
Is probably the reason of high scatter in the
CPT-liquefaction correlations
Scatter is reason why v. cautious recommendations on
CRR by CPT
Lack of Stress History ≈≈≈≈ omission of a primary parameter ⇒⇒⇒⇒ scatter

•Liquefiability needs SH-aging
Kd is sensitive to SH-aging
•Yu (2004), Robertson (2012) found correlations Kd-ψψψψ(ψψψψ State Parameter, close proxy of liquefiability)
���� reinforce expectation good Kd-CRR.
���� expect “good” Kd-CRR
WHY EXPECT A “GOOD” Kd-CRR
Note : ψψψψ alone is incomplete indicator of resistance to liquefaction
(lacks structure, stress history, aging).
Two identical sites of same “e” (hence same ψψψψ) - but the second prestressed : same ψψψψ , but the second higher CRR (and higher Kd)
Kd , being related to ψψψψ, but at the same time incorporating StressHistory and aging, possibly uniquely well correlated with CRR

Translation done by Tsai (2009).
He first determined a Kd-Qc1 correlation by running side-by-side CPT-DMT in loose saturated clean sand.
Then used said Kd-Qc1 correlation to replace Qc1 with Kd in Youd & Idriss, thereby obtaining a correlation CRR-Kd.
Innovations : Tsai cut out elusive Dr, a parasitic parameter, difficult to estimate in situ (Qc1, Kd easily measured).
Have seen various reasons for expecting goodKd-CRR.But how to translate the large experimental base behind Qc1-CRR? (e.g. Youd & Idriss 2001).

Youd & Idriss 2001
Tsai translated the CRR-Qc database
into CRR-Kd
qc1 = f(Kd)
Tsai ran side-by-side CPT-DMT
obtain parallel profiles of Qc1-Kd⇓⇓⇓⇓
Qc1=f(Kd)
(but scatter)Replace qc1 with Kd
Thus : obtain CRR-Kd

At first sight one might consider
doubtful the resulting Kd-CRR
correlation, being based on the highly
dispersed Qc1-Kd correlation.
Not so. The scatter is just natural, is the consequence of Kd
reacting to factors unfelt by Qc1. E.g. for a same Qc1, there
can be many Kd - depending if the site has had Stress History.
Scatter is healthy. If there was no scatter : Qc1 and Kd contain
the same information, i.e. Qc1 reactive to SH as Kd. Not so.
Scatter of the Qc1-Kd relation

Explain dispersions of
intercorrelations Qcn Kd CRR

High scatter in Kd-Qcn is good news
The more the scatter, the higher is the possible
accuracy gain in predicting CRR by moving from
predicting CRR based on parameters scarcely
sensitive to Stress History to predicting CRR
based on KD >>sensitive to Stress History.
Translation occurs via the average : eliminates that part of scatter due to the insensitivity of Qc1 to Stress History.

A legitimate question
Is it possible to translate the consensus Qcn - CRR into a
KD - CRR correlation better than its source?
To answer this question, a clarifying similitude may be
the following.
If two telescopes of different sharpness look at the
Milky Way, the average curve is the same.
Then, once the sharper telescope has been calibrated,
so as it sees the same AVERAGE, the sharper telescope
may be used to obtain a sharper vision.

A numerical example
1.5 6
In Tsai’s sites one finds the same Qcn= 90
in a Kd= 2.4 sand and in a Kd = 5 sand
For Qcn= 90 : Youd CRR = 0.15
For Kd= 2.4 CRR = 0.10
For Kd= 5 CRR = 0.22
⇒ 0.15 (youd) -33% +47%
∴∴∴∴ CRR predicted by Qcn varies considerably depending
on Stress History - unknown to the designer

Recent correlations (clean sand)
•Converge to a central narrow band
•There is a limit to the usefulness
of small refinements
•All recent curves predict CRR in a
relatively narrow range, with a
fraction dispersion of the Qcn
predictions in numerical example
•Obtaining +datapoints faster, due
to better resolution expected for
CRR=f(Kd)
•Qcn : controversy. Sand with same
Qcn could liquefy/ not. Depends on
unknown Stress History
to Jnl Asce Apr 2013t

DMT : Normaliz. exponent n = 1
Qcn = [(qc - σσσσ v )/ pa ] (pa / σσσσ'v )n
n = 1 a welcome simplification - cuts out
iterative procedure to determine Qcn and n,
an additional soil unknown
Arching : laterally
suspended floating
ring reduces σ'v at
tip level ⇒, less
than linear qc(z)
No arching : side ratio ≈6

Liquefaction : SDMT 2 independent estimates of CRR
Light earthquakes
CRR from VsSDMT
Andrus and Stokoe 2000
Monaco (2007) "Evaluating Liquefaction Potential by Seismic Dilatometer (SDMT) accounting for
Aging/Stress History" 4th Int. Conf. Earthquake Geotechn. Eng. - Thessaloniki
Strong earthquakes
CRR from KdDMT
Monaco 2005
VS
KD
CRR Cyclic Resistance Ratio for Seed & Idriss (1971) simplified procedure

Jamiolkowski 1992Soils & Foundations
SDMT provides two independent CRR estimates
From Kd From Vs
Sometimes different CRR. We consider more reliable CRR(Kd)
Waves produce strains too small
to initiate trend to dilate/
contract (essence of liquefaction)
Vs insensitive to Stress History:
Vs measured on sand specimens
in the calibration chamber
during loading and unloading
In cemented sands CRR(Vs) usually higher (optimistic) …(cementation
increases Vs) . But strong earthquakes may destroy weak bonding.
CRR from Vs possibly ok in cemented sands if light earthquakes expected –
(bonding preserved).

KD reflects Stress History
Stress History crusts –clearly evidenced by KD but "unfelt" by VS �
suggests lesser ability of VS to profile SH hence liquefiability
MATERIAL
INDEX
CONSTRAINED
MODULUS
UNDRAINED
SHEAR STRENGTH
HORIZONTAL
STRESS INDEX
SHEAR WAVE
VELOCITY
CLAY SILT SAND
Vs (m/s)KD
KD crustCatania
Sand
crust?

HARA (1973) YOKOTA et al. (1981) TATSUOKA (1977) SEED & IDRISS (1970) ATHANASOPOULOS (1995) CARRUBBA & MAUGERI (1988)
0.05 to 0.1%
HARA (1973) YOKOTA et al. (1981) TATSUOKA (1977) SEED & IDRISS (1970) ATHANASOPOULOS (1995) CARRUBBA & MAUGERI (1988)
0.05 – 0.1 %
Maugeri (1995)
Mayne (2001)Ishihara (2001)
SDMT provides Go (small strain modulus) & Mdmt (working
strain modulus). Two points of the G-γ curve. May help select
the design G-γ curve. (Mayne & Martin 1999)
More info
- Marchetti et al (2008) in Schmertmann Volume
- Lehane & Fahey (2004) Porto ISC-2 – non linear settlement analysis
from in situ tests

SEAFLOOR DILATOMETER
WATERDEPTH 0 to 100 m
PUSH CAPACITY 7 ton
Max test depth is the depth penetrable with 7 ton push.
7 ton ballast(built locally)
Shippedby air(50 Kg)
4bolts

DMT-KD method � Verify if an OC clay slope contains ACTIVE (or old QUIESCENT) SLIP SURFACES(Totani et al. 1997)
Old slip surface may reactivate ! – Øresidual
0 2
10
20
30
D
1. SLIDING
K (DMT) 2=
3. RECONSOLIDATION(NC STATE)
4. INSPECT D PROFILEK
2. REMOULDING
Detecting slip surfaces in clay slopes
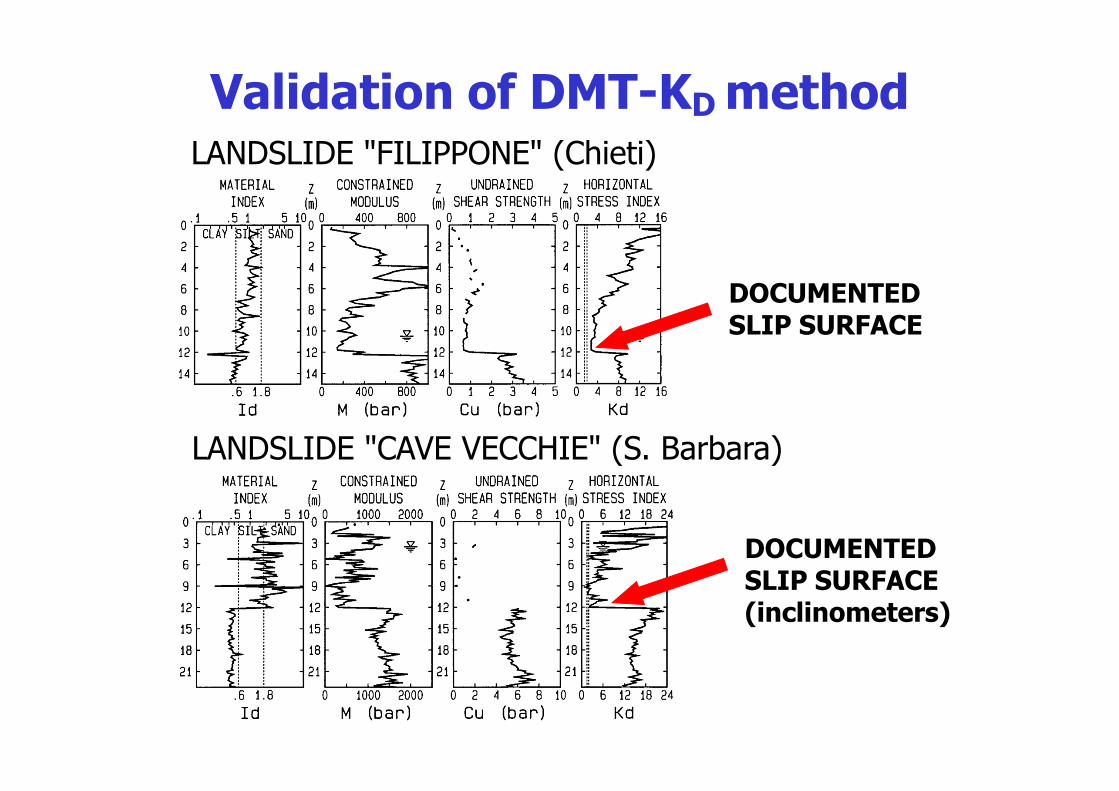
LANDSLIDE "FILIPPONE" (Chieti)
LANDSLIDE "CAVE VECCHIE" (S. Barbara)
DOCUMENTED SLIP SURFACE
DOCUMENTED SLIP SURFACE(inclinometers)
Validation of DMT-KDmethod

SS. N. 83 “Marsicana”
Gioia dei Marsi (2006)
Bloccata da dissesto
Miniera di lignite S. Barbara
(San Giovanni Valdarno)

When doing SDMT : get Id Kd Ed (M) GoDiagram : results of 34 sites various soils & geography.
Permits to estimate Vs (Go) from mechanical-DMT data
•No point today. Vs direct
However :
May provide rough Vs in
previous sites DMT.
Estimates of expected Vs.

VS predicted by mechanical DMT (L'Aquila)

CPT +fast, +economical, +widespread. Important advantages.
But Been (SOA “CPT Interpretation” at CPT 2010 Los Angeles)
“If purpose is parameters CPT cannot be used in isolation - must be
supplemented by lab /other methods. CPT can easily mislead in terms
of soil type, strength and particularly modulus”.
Also Robertson 1986 : “CPT predictions of settlements may be in
large error” (Terzaghi and Peck 1967, Schmertmann 1970, Jamiolkowski et al.
1988, Leonards 1988, Schnaid 2009….)
⇒⇒⇒⇒ CPT unable to provide SOA settlements predictions - a well
known weakness of CPT (Powell etc. ..).
CONCLUSIONS 1+Authors : for everyday practice use direct push CPT, DMT

DMT : Slower than CPT, but still very fast
Is a genuine two-parameter test, one of which is Kd,
sensitive to stress history and aging
Use of Kd :
1. reduces scatter in estimating settlements and CRR
2. permits a more economical design, as Kd reflects
the benefits – otherwise ignored unused - of SH on
settlement and liquefaction behavior.
Practical : Any operator gets same results. No need
highly skilled workers. Short training time.
CONCLUSIONS 2

CONCLUSIONS 3
Migrating from Nspt to Qcn for predicting CRR and
settlements had the merit of eliminating that part of
scatter due to the poor repeatability of the SPT.
Using KD permits to reduce even that part of scatter
due to the scarce ability of conical tips to distinguish
between freshly deposited sands and prestressed or
aged sands.

END
Thank you