evidence on entrepreneurs in the united states: …denardim/research/denardidoctorkrane.pdf ·...
TRANSCRIPT
18 4Q/2007, Economic Perspectives
Evidence on entrepreneurs in the United States: Data from the 1989–2004 Survey of Consumer Finances
Mariacristina De Nardi, Phil Doctor, and Spencer D. Krane
Mariacristina De Nardi is a senior economist, Phil Doctor is a senior associate economist, and Spencer D. Krane is a vice president and economic advisor in the Economic Research Department at the Federal Reserve Bank of Chicago. The authors thank Gene Amromin, Marco Bassetto, Craig Furfine, and Kevin Moore for helpful comments.
Introduction and summary
A country’s national saving rate is a crucial determinant of its ability to accumulate capital and generate growth; hence, it is an important determinant of the country’s future prosperity. Another important determinant of a country’s prosperity is innovation—the ability to gen-erate new goods and services and provide existing ones in a more efficient manner. Accordingly, it is vital to study the households that are savers, as well as the managers of the businesses that are innovators. In this article, we consider the behavior of a group of in-dividuals who play both roles in the U.S. economy— entrepreneurs.
First, entrepreneurs accumulate capital. As noted by Quadrini (1999, 2000), on average, entrepreneurs save a good deal more than other households: Even though households headed by entrepreneurs make up only 7–8 percent of the population, they own nearly one-third of the wealth in the United States.
Second, entrepreneurial risk-taking is thought to be an important way that individuals with skills, ideas, and business savvy introduce new products, technolo-gies, and business strategies into the economy. This is the entrepreneur described by economists such as Schumpeter (1934) and Knight (1921). Such individ-uals are willing to put their financial well-being on the line in risky business ventures, with the expectation of earning large returns and expanding their wealth.
A third important feature of entrepreneurship is that the business owner’s personal skills and financial resources are much more closely linked to the opera-tions and performance of the firm than is the case with owners of widely held publicly traded corporations. Most shareholders of public firms have little say in the management of the business; and because their risk exposure is limited to the value of their shares, their personal portfolios are irrelevant to the assessment of the firm’s creditworthiness. In contrast, entrepreneurs’
relationships with their businesses are anything but at arm’s length. As managers, they make all of the day-to-day decisions about the firms’ operations. As owners, they reap most of the rewards of success, but in many cases, their personal assets help finance the business and are at risk if the business fails. This means that there is a fundamental and bi-directional link between entre-preneurial households’ portfolios and the performance of their businesses.
In this article, we present a number of stylized facts that can help us understand the roles that entre-preneurs play in the U.S. economy. First, we construct an empirical counterpart to Schumpeter and Knight’s notion of the entrepreneur in the context of the infor-mation collected by the Federal Reserve Board’s Survey of Consumer Finances (SCF).
Second, we use the SCF data to document a num-ber of facts about entrepreneurs and the businesses that they run. We show that entrepreneurs, as a group, are very rich. They account for about 30 percent of the households in the top decile of the wealth distri-bution in the United States. They also earn more in-come than others, though the disparity is not as great as it is for wealth. They hold about as much total net wealth relative to their income as other rich people. Entrepreneurs also fall into two demographic catego-ries that have more wealth than the population as a whole; that is, they are more educated and less likely to be a minority than the general population. Looking at their businesses, we see entrepreneurs operating in
19Federal Reserve Bank of Chicago
a wide range of industries. We also find large changes in the legal organization of their firms over time, with more of them being organized as less risky limited li-ability entities.
Third, we shed light on how entrepreneurs’ success in business affects their personal wealth. The vast majori-ty of entrepreneurs start their own businesses as opposed to buying or inheriting them—an indication that the businesses’ performance reflects the entrepreneurs’ personal skills. We also find a great deal of dispersion in measures of the businesses’ success, such as firm size, income, and rates of return, and we find that rich entrepreneurs with large businesses have owned their firms for longer than others. In combination, these facts indicate that entrepreneurs can face very large risks in their business ventures, but successful ones can earn huge returns and become very wealthy.
Fourth, we turn the tables and look at the role of entrepreneurial wealth in supporting the operations of the business. Some households and firms are liquidity-constrained—that is, they cannot borrow as much as they would like to or can only borrow at higher interest rates than other market participants. Liquidity constraints cause households to save more in order to finance large expected expenditures or to have a precautionary buf-fer to insure against unexpected shocks. We find evi-dence that entrepreneurs face liquidity constraints: Many report having been turned down for credit, and many provide personal loans to their businesses or pledge personal assets as collateral to secure loans for their firms. But we also present some evidence that these borrowing constraints may have fallen over time.
Finally, we document that entrepreneurial house-holds appear to be less risk averse than other compa-rable households. Despite large variation in the returns to their business ventures, relative to other rich house-holds, they do not have higher net worth (relative to income), they tie up a large portion of their wealth in their business ventures, and they carry much more debt. In addition, entrepreneurs’ responses to attitudi-nal questions suggest that they are more willing to take risks in order to achieve high financial returns.
Who are the entrepreneurs and how do we measure them?
It is difficult to define what an entrepreneur is and to determine the best empirical counterpart to that defi-nition (see Gentry and Hubbard, 2004). We think of entrepreneurs as people who actively manage their own businesses and invest their own wealth in them. Our entrepreneurs are not simply managers, because managers may not have risked a personal investment stake in the firm. Nor are our entrepreneurs simply
investors, because investors may not have a key active role in the decision-making of the firm. Finally, our entrepreneurs are not people simply working on their own because they can’t find a suitable job at another firm.
Our unit of observation is the household. We classi-fy entrepreneurs as those households in which the head declares being self-employed as a primary job, own-ing a business (or a share of one), and having an active management role in the firm. We refer to these house-holds as self-employed business owners, or SEBs.1
By requiring the respondent to be self-employed, we exclude people who have a full-time wage-earn-ing job and are running a business as a hobby. By re-quiring that the entrepreneur manages the firm, we help reduce the reverse causation between business owner-ship and wealth—that is, we likely eliminate many people who simply are rich and acquire a business as a passive investment. Finally, by requiring that the entrepreneur has an investment stake in the business, we also likely exclude those who are self-employed only because their outside wage opportunities are very poor.
We investigate the characteristics of the SEBs using six waves of the Survey of Consumer Finances: 1989, 1992, 1995, 1998, 2001, and 2004.2 The SCF is well suited for this exercise. First, one of the primary purposes of the SCF is to measure household balance sheets: Accordingly, the survey has been designed to capture comprehensive information about the value of assets and liabilities as accurately as possible. Sec-ond, since the distribution of wealth is highly skewed in the U.S., with a small fraction of the population hold-ing much of the wealth, the SCF oversamples wealthy households in order to better measure economy-wide aggregates. Because SEBs are disproportionately wealthy, the SCF will sample more SEBs than other surveys that sample according to standard demographic prob-ability weights. Each of the six SCF waves we consid-er contains between 565 and 930 SEBs; this is a large number when compared with other data sets, such as the University of Michigan’s Panel Study of Income Dynamics, or PSID. (See the appendix for details.)
Third, in addition to wealth, the survey contains a wide range of detailed information on income, em-ployment, borrowing activity, business history, and demographic characteristics.3 It also records respon-dents’ subjective attitudes toward saving and risk.
One drawback of the SCF is that it is a series of cross-sectional surveys as opposed to a panel that fol-lows individual households over time. Accordingly, we do not have data on the flow of savings. Instead, following standard practice, we study the wealth of the household, which is the accumulated flow of its past savings (where savings are broadly measured to
20 4Q/2007, Economic Perspectives
TaBlE 1
Wealth and income of SEBs and others 1989 1992 1995 1998 2001 2004
SEBpercentageoftotalWealth 33.1 31.3 29.2 30.6 30.8 31.9Income 21.3 17.3 14.0 17.9 17.9 18.3 Medianwealth (2004 dollars) SEBs 388,704 274,726 262,421 384,235 487,850 536,000Others 60,139 56,399 63,606 72,318 79,728 80,600 Median income (2004 dollars) SEBs 68,841 67,475 52,927 70,492 85,403 79,069Others 36,715 33,738 35,285 37,596 40,511 41,075 Medianratioofwealthtoincome SEBs 5.7 4.8 5.1 4.7 6.2 6.5Others 1.5 1.5 1.6 1.8 1.8 1.9 Medianratioofwealth(excludingbusinessnetequity)toincome SEBs 2.6 2.3 2.7 2.6 3.4 3.5Others 1.5 1.5 1.5 1.7 1.7 1.8
Note:SEBmeansself-employedbusinessowner.Source:Authors’calculationsbasedondatafromtheBoardofGovernorsoftheFederalReserveSystem,Survey of Consumer Finances.
include capital gains and losses) plus any inherited wealth. The lack of a panel also prevents us from ana-lyzing linkages between entrepreneurial behavior, business failure, and the process of taking successful firms public. This means our analysis is susceptible to two types of “survivor bias.” The first bias is that our sample does not allow us to identify individuals who are no longer entrepreneurs because their past busi-nesses ventures failed. The second bias is that we do not capture those entrepreneurs who have successful-ly taken their businesses public. This first bias would leave our SEB sample with households that are more successful than the entire population of people who have undertaken entrepreneurial activity; the second would push us toward underestimating entrepreneurial performance. While there is no way to quantify these biases with our data, the first is likely more relevant for younger and smaller businesses, while the second is likely more relevant for older and larger firms.
Entrepreneurs are rich and what else?
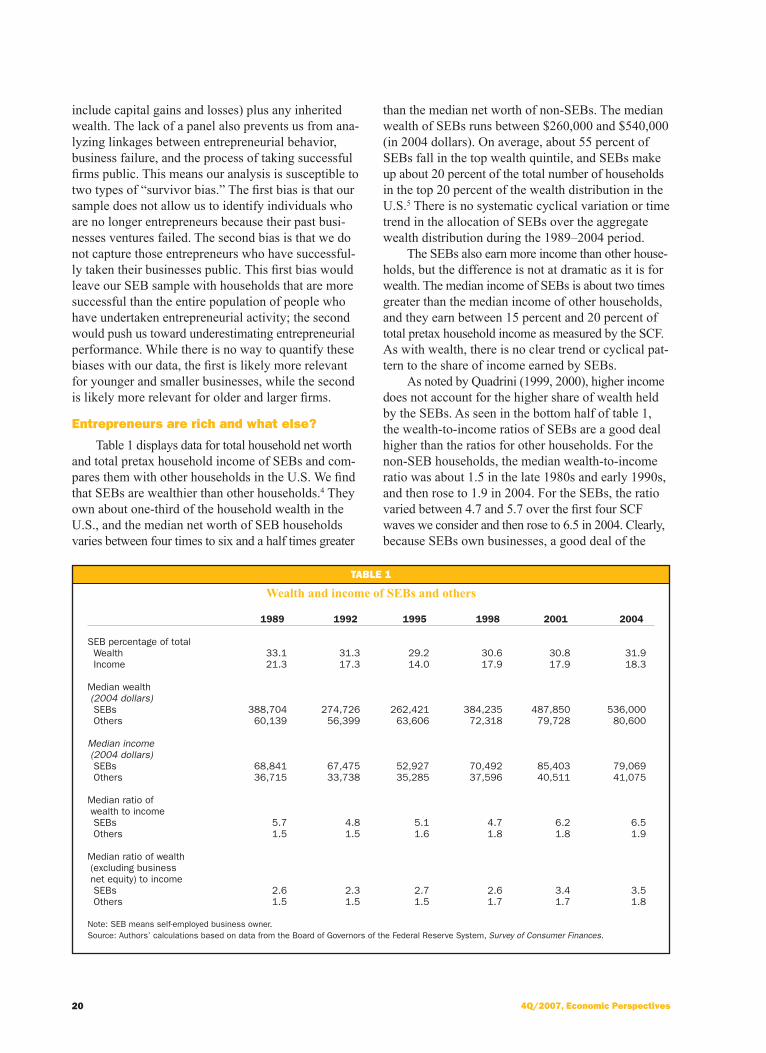
Table 1 displays data for total household net worth and total pretax household income of SEBs and com-pares them with other households in the U.S. We find that SEBs are wealthier than other households.4 They own about one-third of the household wealth in the U.S., and the median net worth of SEB households varies between four times to six and a half times greater
than the median net worth of non-SEBs. The median wealth of SEBs runs between $260,000 and $540,000 (in 2004 dollars). On average, about 55 percent of SEBs fall in the top wealth quintile, and SEBs make up about 20 percent of the total number of households in the top 20 percent of the wealth distribution in the U.S.5 There is no systematic cyclical variation or time trend in the allocation of SEBs over the aggregate wealth distribution during the 1989–2004 period.
The SEBs also earn more income than other house-holds, but the difference is not at dramatic as it is for wealth. The median income of SEBs is about two times greater than the median income of other households, and they earn between 15 percent and 20 percent of total pretax household income as measured by the SCF. As with wealth, there is no clear trend or cyclical pat-tern to the share of income earned by SEBs.
As noted by Quadrini (1999, 2000), higher income does not account for the higher share of wealth held by the SEBs. As seen in the bottom half of table 1, the wealth-to-income ratios of SEBs are a good deal higher than the ratios for other households. For the non-SEB households, the median wealth-to-income ratio was about 1.5 in the late 1980s and early 1990s, and then rose to 1.9 in 2004. For the SEBs, the ratio varied between 4.7 and 5.7 over the first four SCF waves we consider and then rose to 6.5 in 2004. Clearly, because SEBs own businesses, a good deal of the
21Federal Reserve Bank of Chicago
TaBlE 2
Wealth and income for the top decile of the wealth distribution
1989 1992 1995 1998 2001 2004 PercentageofSEBsintopdecile 42.8 37.9 35.9 39.2 37.1 37.6
Percentageofothersintopdecile 7.2 7.5 8.1 7.7 7.7 7.8 PercentageoftopdecilewhoareSEBs 32.7 30.9 24.0 29.2 28.8 28.1 Medianwealth (2004 dollars) SEBs 1,215,984 1,038,488 1,100,371 1,277,309 1,848,665 1,956,500Others 923,723 752,902 765,240 980,487 1,279,169 1,331,200 Medianincome (2004 dollars) SEBs 140,742 125,504 114,676 140,984 206,937 164,300Others 110,146 94,465 97,033 92,815 125,914 133,494 Medianratioofwealthtoincome SEBs 10.5 8.8 10.4 9.9 11.8 13.9Others 9.7 9.6 9.0 11.0 11.9 12.3
Note:SEBmeansself-employedbusinessowner.Source:Authors’calculationsbasedondatafromtheBoardofGovernorsoftheFederalReserveSystem,Survey of Consumer Finances.
difference between wealth-to-income ratios reflects business assets. Overall, the median SEB household holds about one-third of its wealth as net equity in its business ventures. Non-SEB households hold very little business wealth. Even excluding business net equity, however, SEB households are wealthier than non-SEB households. The last two rows of table 1 show that excluding business net equity, SEBs still hold one and a half to two times more wealth relative to income than other households.
Are the self-employed business owners different from the other rich households?
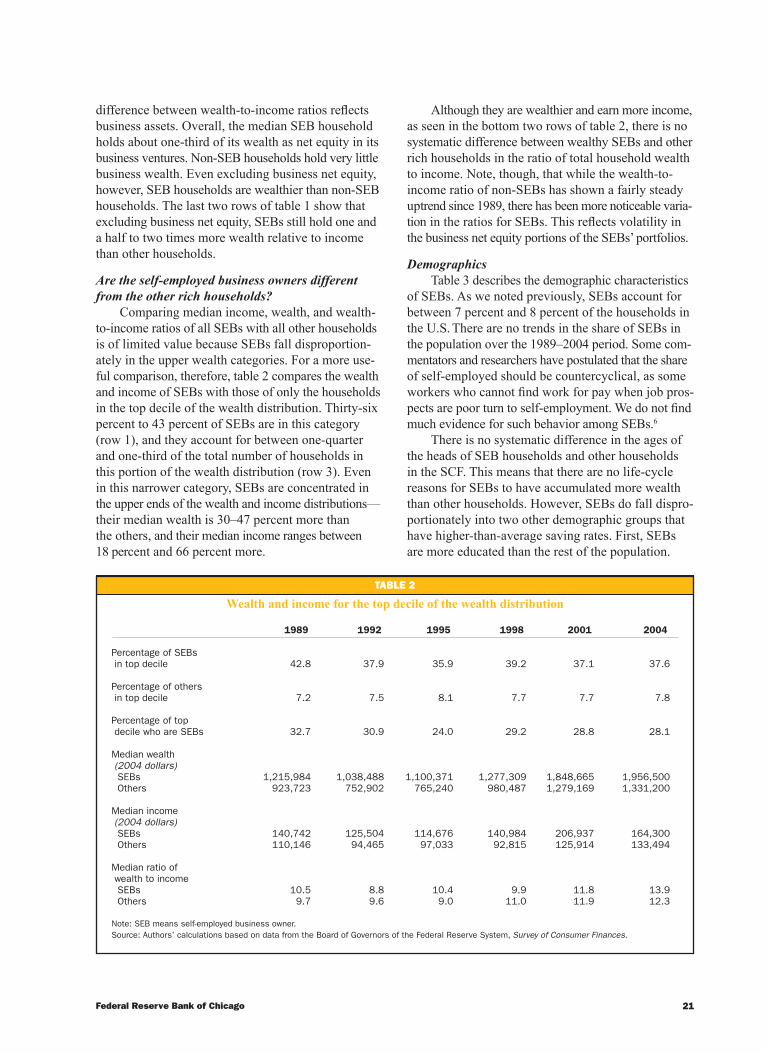
Comparing median income, wealth, and wealth-to-income ratios of all SEBs with all other households is of limited value because SEBs fall disproportion-ately in the upper wealth categories. For a more use-ful comparison, therefore, table 2 compares the wealth and income of SEBs with those of only the households in the top decile of the wealth distribution. Thirty-six percent to 43 percent of SEBs are in this category (row 1), and they account for between one-quarter and one-third of the total number of households in this portion of the wealth distribution (row 3). Even in this narrower category, SEBs are concentrated in the upper ends of the wealth and income distributions—their median wealth is 30–47 percent more than the others, and their median income ranges between 18 percent and 66 percent more.
Although they are wealthier and earn more income, as seen in the bottom two rows of table 2, there is no systematic difference between wealthy SEBs and other rich households in the ratio of total household wealth to income. Note, though, that while the wealth-to- income ratio of non-SEBs has shown a fairly steady uptrend since 1989, there has been more noticeable varia-tion in the ratios for SEBs. This reflects volatility in the business net equity portions of the SEBs’ portfolios.
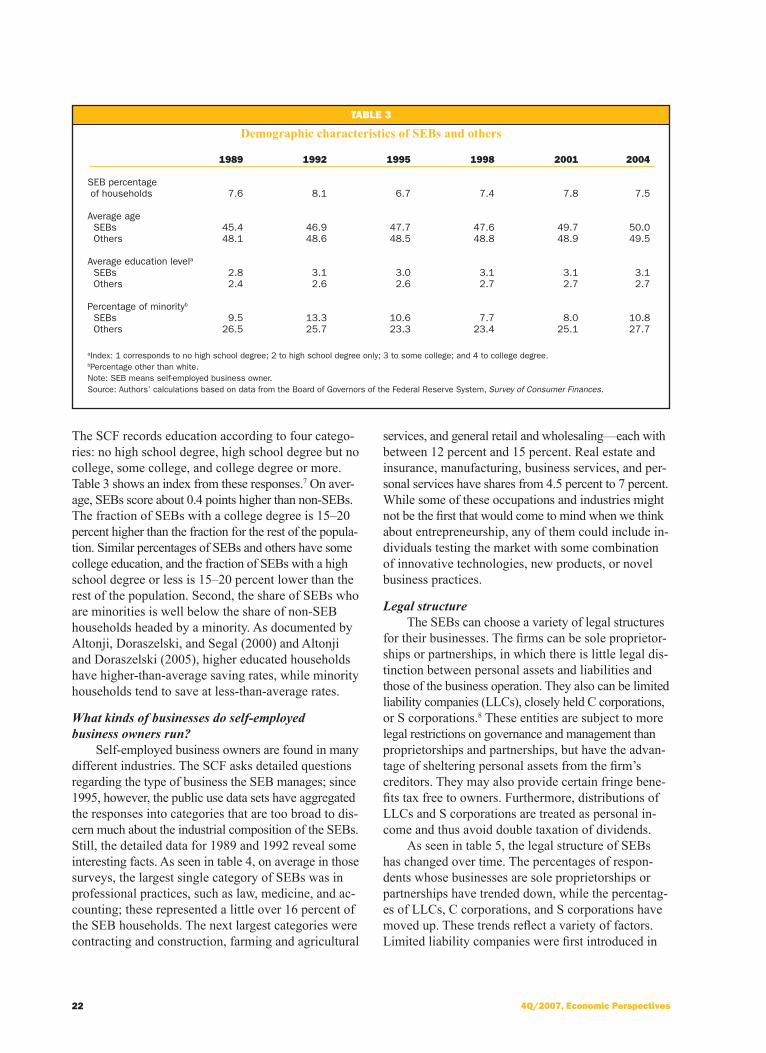
DemographicsTable 3 describes the demographic characteristics
of SEBs. As we noted previously, SEBs account for between 7 percent and 8 percent of the households in the U.S. There are no trends in the share of SEBs in the population over the 1989–2004 period. Some com-mentators and researchers have postulated that the share of self-employed should be countercyclical, as some workers who cannot find work for pay when job pros-pects are poor turn to self-employment. We do not find much evidence for such behavior among SEBs.6
There is no systematic difference in the ages of the heads of SEB households and other households in the SCF. This means that there are no life-cycle reasons for SEBs to have accumulated more wealth than other households. However, SEBs do fall dispro-portionately into two other demographic groups that have higher-than-average saving rates. First, SEBs are more educated than the rest of the population.
22 4Q/2007, Economic Perspectives
TaBlE 3
Demographic characteristics of SEBs and others
1989 1992 1995 1998 2001 2004
SEBpercentageofhouseholds 7.6 8.1 6.7 7.4 7.8 7.5 Averageage SEBs 45.4 46.9 47.7 47.6 49.7 50.0Others 48.1 48.6 48.5 48.8 48.9 49.5 Averageeducationlevela SEBs 2.8 3.1 3.0 3.1 3.1 3.1Others 2.4 2.6 2.6 2.7 2.7 2.7 Percentageofminorityb SEBs 9.5 13.3 10.6 7.7 8.0 10.8Others 26.5 25.7 23.3 23.4 25.1 27.7
aIndex:1correspondstonohighschooldegree;2tohighschooldegreeonly;3tosomecollege;and4tocollegedegree.bPercentageotherthanwhite.Note:SEBmeansself-employedbusinessowner.Source:Authors’calculationsbasedondatafromtheBoardofGovernorsoftheFederalReserveSystem,Survey of Consumer Finances.
The SCF records education according to four catego-ries: no high school degree, high school degree but no college, some college, and college degree or more. Table 3 shows an index from these responses.7 On aver-age, SEBs score about 0.4 points higher than non-SEBs. The fraction of SEBs with a college degree is 15–20 percent higher than the fraction for the rest of the popula-tion. Similar percentages of SEBs and others have some college education, and the fraction of SEBs with a high school degree or less is 15–20 percent lower than the rest of the population. Second, the share of SEBs who are minorities is well below the share of non-SEB households headed by a minority. As documented by Altonji, Doraszelski, and Segal (2000) and Altonji and Doraszelski (2005), higher educated households have higher-than-average saving rates, while minority households tend to save at less-than-average rates.
What kinds of businesses do self-employed business owners run?
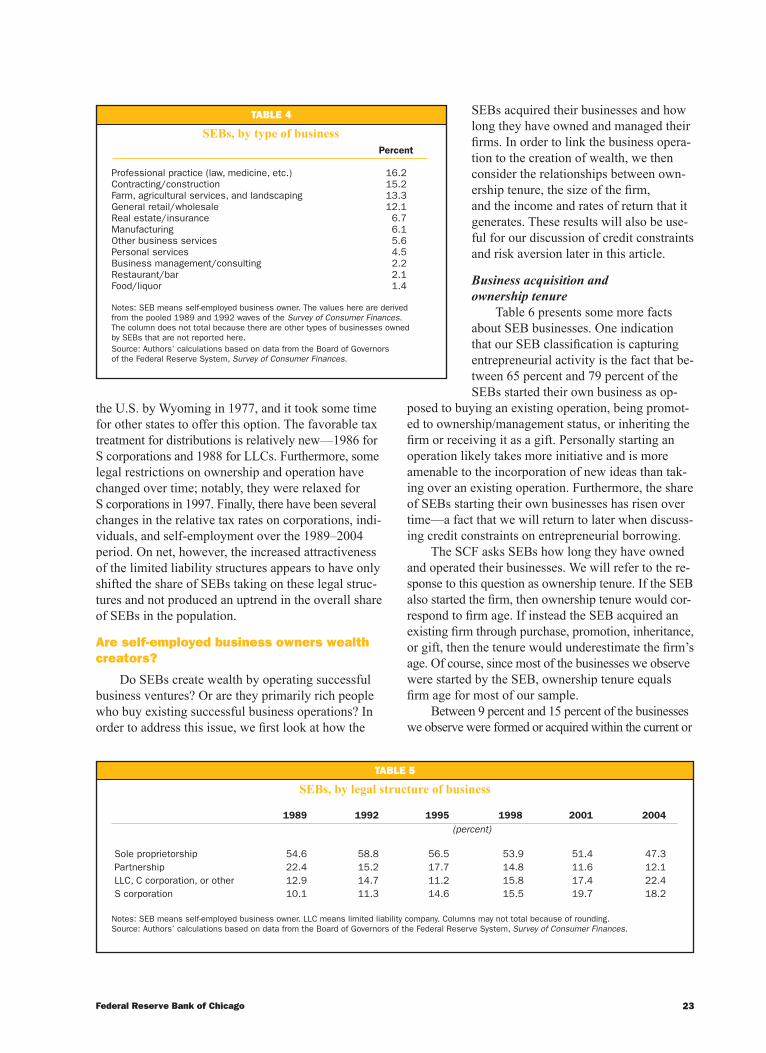
Self-employed business owners are found in many different industries. The SCF asks detailed questions regarding the type of business the SEB manages; since 1995, however, the public use data sets have aggregated the responses into categories that are too broad to dis-cern much about the industrial composition of the SEBs. Still, the detailed data for 1989 and 1992 reveal some interesting facts. As seen in table 4, on average in those surveys, the largest single category of SEBs was in professional practices, such as law, medicine, and ac-counting; these represented a little over 16 percent of the SEB households. The next largest categories were contracting and construction, farming and agricultural
services, and general retail and wholesaling—each with between 12 percent and 15 percent. Real estate and insurance, manufacturing, business services, and per-sonal services have shares from 4.5 percent to 7 percent. While some of these occupations and industries might not be the first that would come to mind when we think about entrepreneurship, any of them could include in-dividuals testing the market with some combination of innovative technologies, new products, or novel business practices.
Legal structureThe SEBs can choose a variety of legal structures
for their businesses. The firms can be sole proprietor-ships or partnerships, in which there is little legal dis-tinction between personal assets and liabilities and those of the business operation. They also can be limited liability companies (LLCs), closely held C corporations, or S corporations.8 These entities are subject to more legal restrictions on governance and management than proprietorships and partnerships, but have the advan-tage of sheltering personal assets from the firm’s creditors. They may also provide certain fringe bene-fits tax free to owners. Furthermore, distributions of LLCs and S corporations are treated as personal in-come and thus avoid double taxation of dividends.
As seen in table 5, the legal structure of SEBs has changed over time. The percentages of respon-dents whose businesses are sole proprietorships or partnerships have trended down, while the percentag-es of LLCs, C corporations, and S corporations have moved up. These trends reflect a variety of factors. Limited liability companies were first introduced in
23Federal Reserve Bank of Chicago
TaBlE 4
SEBs, by type of business Percent
Professionalpractice(law,medicine,etc.) 16.2Contracting/construction 15.2Farm,agriculturalservices,andlandscaping 13.3Generalretail/wholesale 12.1Realestate/insurance 6.7Manufacturing 6.1Otherbusinessservices 5.6Personalservices 4.5Businessmanagement/consulting 2.2Restaurant/bar 2.1Food/liquor 1.4
Notes:SEBmeansself-employedbusinessowner.Thevaluesherearederivedfromthepooled1989and1992wavesof the Survey of ConsumerFinances.ThecolumndoesnottotalbecausethereareothertypesofbusinessesownedbySEBsthatarenotreportedhere.Source:Authors’calculationsbasedondatafromtheBoardofGovernorsoftheFederalReserveSystem,Survey of Consumer Finances.
TaBlE 5
SEBs, by legal structure of business
1989 1992 1995 1998 2001 2004 (percent)
Soleproprietorship 54.6 58.8 56.5 53.9 51.4 47.3Partnership 22.4 15.2 17.7 14.8 11.6 12.1LLC,Ccorporation,orother 12.9 14.7 11.2 15.8 17.4 22.4Scorporation 10.1 11.3 14.6 15.5 19.7 18.2
Notes:SEBmeansself-employedbusinessowner.LLCmeanslimitedliabilitycompany.Columnsmaynottotalbecauseofrounding.Source:Authors’calculationsbasedondatafromtheBoardofGovernorsoftheFederalReserveSystem,Survey of Consumer Finances.
the U.S. by Wyoming in 1977, and it took some time for other states to offer this option. The favorable tax treatment for distributions is relatively new—1986 for S corporations and 1988 for LLCs. Furthermore, some legal restrictions on ownership and operation have changed over time; notably, they were relaxed for S corporations in 1997. Finally, there have been several changes in the relative tax rates on corporations, indi-viduals, and self-employment over the 1989–2004 period. On net, however, the increased attractiveness of the limited liability structures appears to have only shifted the share of SEBs taking on these legal struc-tures and not produced an uptrend in the overall share of SEBs in the population.
are self-employed business owners wealth creators?
Do SEBs create wealth by operating successful business ventures? Or are they primarily rich people who buy existing successful business operations? In order to address this issue, we first look at how the
SEBs acquired their businesses and how long they have owned and managed their firms. In order to link the business opera-tion to the creation of wealth, we then consider the relationships between own-ership tenure, the size of the firm, and the income and rates of return that it generates. These results will also be use-ful for our discussion of credit constraints and risk aversion later in this article.
Business acquisition and ownership tenure
Table 6 presents some more facts about SEB businesses. One indication that our SEB classification is capturing entrepreneurial activity is the fact that be-tween 65 percent and 79 percent of the SEBs started their own business as op-
posed to buying an existing operation, being promot-ed to ownership/management status, or inheriting the firm or receiving it as a gift. Personally starting an operation likely takes more initiative and is more amenable to the incorporation of new ideas than tak-ing over an existing operation. Furthermore, the share of SEBs starting their own businesses has risen over time—a fact that we will return to later when discuss-ing credit constraints on entrepreneurial borrowing.
The SCF asks SEBs how long they have owned and operated their businesses. We will refer to the re-sponse to this question as ownership tenure. If the SEB also started the firm, then ownership tenure would cor-respond to firm age. If instead the SEB acquired an existing firm through purchase, promotion, inheritance, or gift, then the tenure would underestimate the firm’s age. Of course, since most of the businesses we observe were started by the SEB, ownership tenure equals firm age for most of our sample.
Between 9 percent and 15 percent of the businesses we observe were formed or acquired within the current or

24 4Q/2007, Economic Perspectives
TaBlE 6
Characteristics of businesses
1989 1992 1995 1998 2001 2004 (percent)a. all SEBs Acquisitionmethod Started 65.3 72.4 71.4 73.9 78.5 77.9Purchased 24.7 23.0 21.3 20.4 17.5 17.3Joined/promoted 0.7 0.0 1.4 1.9 1.5 2.8Inherited/gift 9.4 4.6 5.9 3.8 2.5 2.0 Ownershiptenure 0–1year 13.2 15.2 13.7 12.6 9.2 12.62–5years 27.3 21.0 24.8 26.9 23.4 25.66ormoreyears 59.5 63.8 61.5 60.6 67.4 61.8 B. Wealthy SEBs Acquisitionmethod Started 59.2 65.1 63.1 69.7 68.8 67.1Purchased 25.9 26.5 26.7 23.3 27.4 25.2Joined/promoted 0.3 0.0 1.3 2.8 1.0 3.2Inherited/gift 14.6 8.4 9.0 4.2 2.9 4.5 Ownershiptenure 0–1year 8.2 5.5 5.7 6.0 6.2 6.22–5years 19.1 16.2 15.2 14.4 17.4 18.06ormoreyears 72.7 78.3 79.1 79.7 76.4 75.8
Notes:SEBmeansself-employedbusinessowner.WealthySEBsarethoseinthetopdecileofthewealthdistribution.Columnsmaynottotalbecauseofrounding.Source:Authors’calculationsbasedondatafromtheBoardofGovernorsoftheFederalReserveSystem, Survey of Consumer Finances.
previous year of the SCF sampling date, about one-quarter two years to five years prior to the sampling date, and about 60 percent at least six years prior to the date. Accordingly, our data set likely contains a fairly good mix of start-ups and established firms. There is no trend in these tenure shares. However, there is a noticeable increase in the share of businesses that were started or acquired one year ago or less in 1992 and a marked drop in this share in 2001. Both of the 1992 and 2001 SCF waves are capturing entrepreneurial activity during periods of macroeconomic weakness. Thus, the data provide conflicting readings on wheth-er small business formation serves as a substitute for work for pay during periods of economic weakness.
A somewhat larger share—between 23 percent and 27 percent—of wealthy SEBs (those in the top decile of the wealth distribution) purchased their businesses (panel B of table 6). Still, in every year we consider, about two-thirds of the rich SEBs started their busi-nesses themselves. So it is likely that much of the busi-ness wealth accumulated by the rich SEBs reflects their efforts to start and nurture a successful business plan.
Since rich SEBs hold a good deal more business wealth and older firms have more net equity, it is likely the case that wealthy SEBs own older operations. This is indeed true. Panel B of table 6 presents the tenure of the businesses managed by SEBs in the top decile of the wealth distribution. Only between 6 percent and
8 percent of these firms fall in the one year or less cate-gory—somewhat less than the 9 percent to 15 percent for the SEB population as a whole. And between 73 percent and 80 percent are in the six years or more year classification, about 10–20 percentage points more than for the overall SEB population.
Business net equityThe SCF calculates business net worth by taking
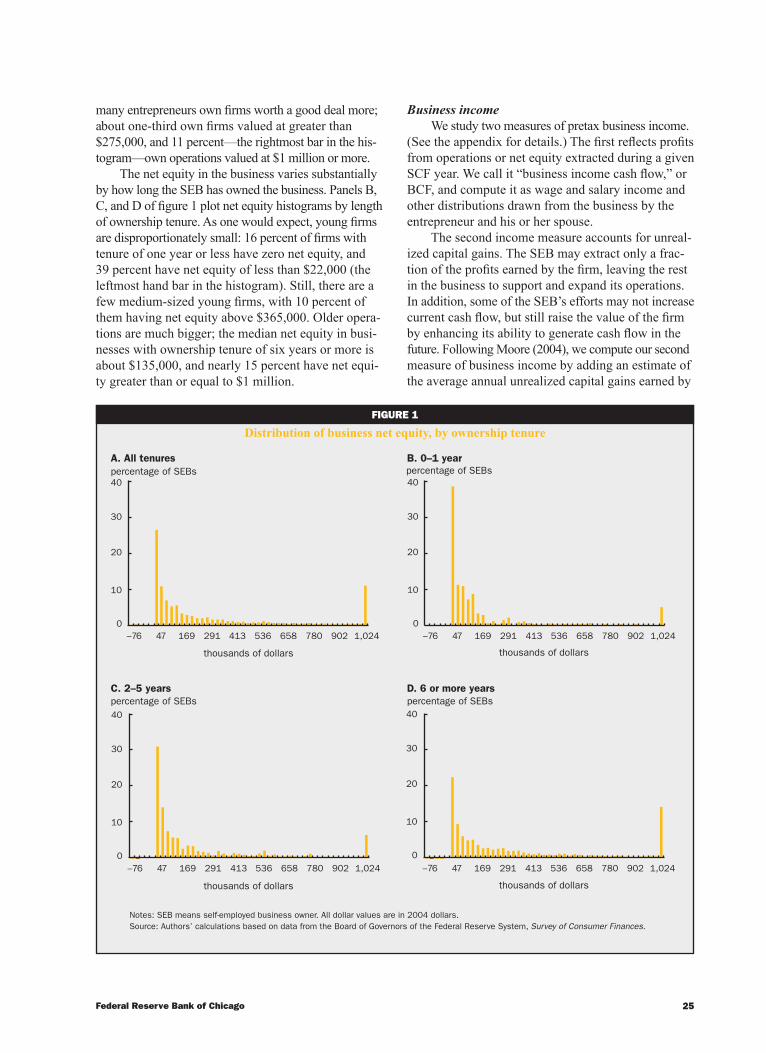
the respondent’s assessment of the net value that the household would receive if the business were sold today plus the net of any lending or collateral provi-sion from the personal accounts of the household to the business ledger. (See the appendix for more de-tails.9) Figure 1 shows histograms of the net equity in the businesses that entrepreneurs actively manage. We have combined all six waves of the SCF, recorded net equity in 2004 dollars, and combined all businesses valued at $1 million or more in the rightmost bar of the histograms. For reference, table 7 shows the busi-nesses’ median net equity by SCF year.
Panel A of figure 1 plots net equity for all firms and shows that there is large variation and skewness in business net equity. Most firms are small. The left-most bar of the histogram corresponds with business net worth between –$2,200 and $22,000, and indicates that 27 percent of firms fall in this category.10 Median business net equity is a bit under $100,000. However,
25Federal Reserve Bank of Chicago
FIguRE 1
Distribution of business net equity, by ownership tenure
Notes:SEBmeansself-employedbusinessowner.Alldollarvaluesarein2004dollars.Source:Authors’calculationsbasedondatafromtheBoardofGovernorsoftheFederalReserveSystem,Survey of Consumer Finances.
percentageofSEBs percentageofSEBs
percentageofSEBs percentageofSEBs
A.Alltenures B.0–1year
D.6ormoreyearsC.2–5years
thousandsofdollars thousandsofdollars
thousandsofdollars thousandsofdollars
–76 47 169 291 413 536 658 780 902 1,024 –76 47 169 291 413 536 658 780 902 1,024
–76 47 169 291 413 536 658 780 902 1,024 –76 47 169 291 413 536 658 780 902 1,024
0
10
20
30
40
0
10
20
30
40
0
10
20
30
40
0
10
20
30
40
many entrepreneurs own firms worth a good deal more; about one-third own firms valued at greater than $275,000, and 11 percent—the rightmost bar in the his-togram—own operations valued at $1 million or more.
The net equity in the business varies substantially by how long the SEB has owned the business. Panels B, C, and D of figure 1 plot net equity histograms by length of ownership tenure. As one would expect, young firms are disproportionately small: 16 percent of firms with tenure of one year or less have zero net equity, and 39 percent have net equity of less than $22,000 (the leftmost hand bar in the histogram). Still, there are a few medium-sized young firms, with 10 percent of them having net equity above $365,000. Older opera-tions are much bigger; the median net equity in busi-nesses with ownership tenure of six years or more is about $135,000, and nearly 15 percent have net equi-ty greater than or equal to $1 million.
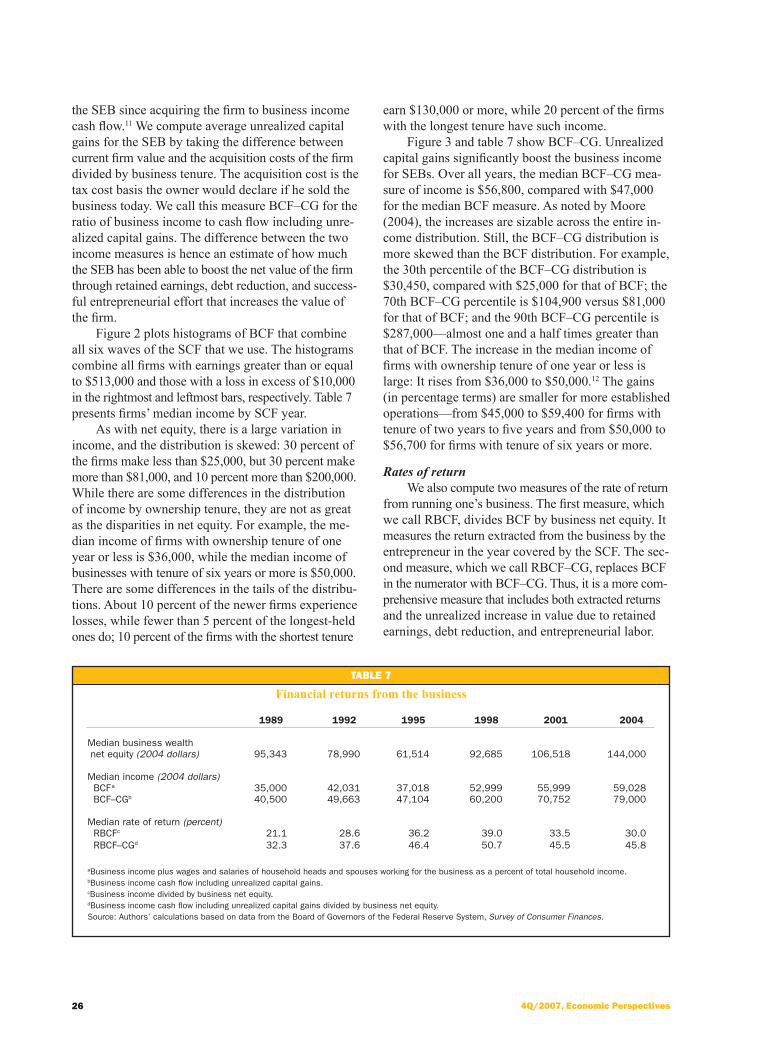
Business incomeWe study two measures of pretax business income.
(See the appendix for details.) The first reflects profits from operations or net equity extracted during a given SCF year. We call it “business income cash flow,” or BCF, and compute it as wage and salary income and other distributions drawn from the business by the entrepreneur and his or her spouse.
The second income measure accounts for unreal-ized capital gains. The SEB may extract only a frac-tion of the profits earned by the firm, leaving the rest in the business to support and expand its operations. In addition, some of the SEB’s efforts may not increase current cash flow, but still raise the value of the firm by enhancing its ability to generate cash flow in the future. Following Moore (2004), we compute our second measure of business income by adding an estimate of the average annual unrealized capital gains earned by
26 4Q/2007, Economic Perspectives
TaBlE 7
Financial returns from the business
1989 1992 1995 1998 2001 2004
Medianbusinesswealthnetequity(2004 dollars) 95,343 78,990 61,514 92,685 106,518 144,000 Medianincome(2004 dollars) BCFa 35,000 42,031 37,018 52,999 55,999 59,028BCF–CGb 40,500 49,663 47,104 60,200 70,752 79,000 Medianrateofreturn (percent) RBCFc 21.1 28.6 36.2 39.0 33.5 30.0RBCF–CGd 32.3 37.6 46.4 50.7 45.5 45.8
aBusinessincomepluswagesandsalariesofhouseholdheadsandspousesworkingforthebusinessasapercentoftotalhouseholdincome.bBusinessincomecashflowincludingunrealizedcapitalgains.cBusinessincomedividedbybusinessnetequity.dBusinessincomecashflowincludingunrealizedcapitalgainsdividedbybusinessnetequity.Source:Authors’calculationsbasedondatafromtheBoardofGovernorsoftheFederalReserveSystem,Survey of Consumer Finances.
the SEB since acquiring the firm to business income cash flow.11 We compute average unrealized capital gains for the SEB by taking the difference between current firm value and the acquisition costs of the firm divided by business tenure. The acquisition cost is the tax cost basis the owner would declare if he sold the business today. We call this measure BCF–CG for the ratio of business income to cash flow including unre-alized capital gains. The difference between the two income measures is hence an estimate of how much the SEB has been able to boost the net value of the firm through retained earnings, debt reduction, and success-ful entrepreneurial effort that increases the value of the firm.
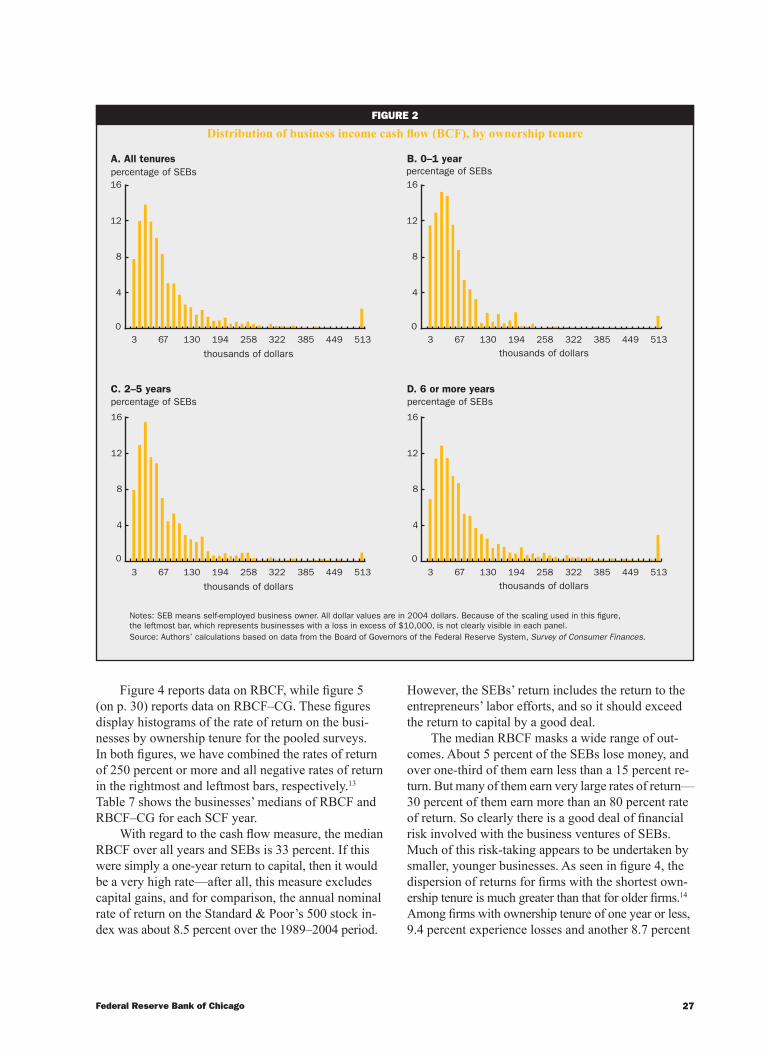
Figure 2 plots histograms of BCF that combine all six waves of the SCF that we use. The histograms combine all firms with earnings greater than or equal to $513,000 and those with a loss in excess of $10,000 in the rightmost and leftmost bars, respectively. Table 7 presents firms’ median income by SCF year.
As with net equity, there is a large variation in income, and the distribution is skewed: 30 percent of the firms make less than $25,000, but 30 percent make more than $81,000, and 10 percent more than $200,000. While there are some differences in the distribution of income by ownership tenure, they are not as great as the disparities in net equity. For example, the me-dian income of firms with ownership tenure of one year or less is $36,000, while the median income of businesses with tenure of six years or more is $50,000. There are some differences in the tails of the distribu-tions. About 10 percent of the newer firms experience losses, while fewer than 5 percent of the longest-held ones do; 10 percent of the firms with the shortest tenure
earn $130,000 or more, while 20 percent of the firms with the longest tenure have such income.
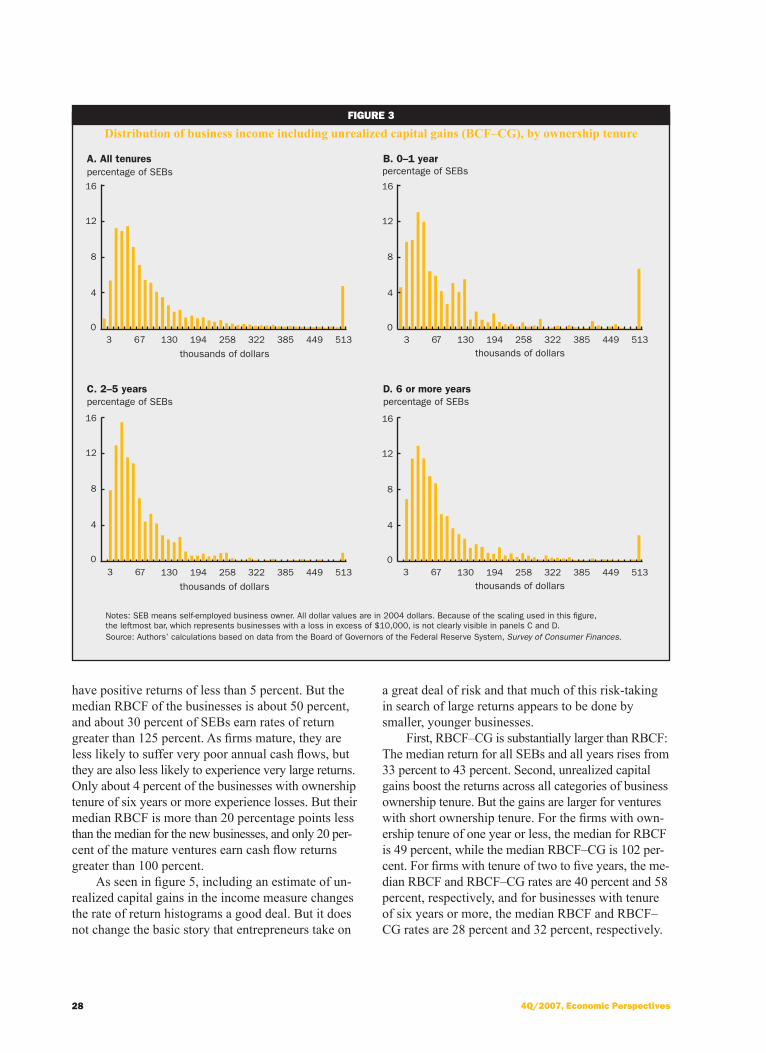
Figure 3 and table 7 show BCF–CG. Unrealized capital gains significantly boost the business income for SEBs. Over all years, the median BCF–CG mea-sure of income is $56,800, compared with $47,000 for the median BCF measure. As noted by Moore (2004), the increases are sizable across the entire in-come distribution. Still, the BCF–CG distribution is more skewed than the BCF distribution. For example, the 30th percentile of the BCF–CG distribution is $30,450, compared with $25,000 for that of BCF; the 70th BCF–CG percentile is $104,900 versus $81,000 for that of BCF; and the 90th BCF–CG percentile is $287,000—almost one and a half times greater than that of BCF. The increase in the median income of firms with ownership tenure of one year or less is large: It rises from $36,000 to $50,000.12 The gains (in percentage terms) are smaller for more established operations—from $45,000 to $59,400 for firms with tenure of two years to five years and from $50,000 to $56,700 for firms with tenure of six years or more.
Rates of returnWe also compute two measures of the rate of return
from running one’s business. The first measure, which we call RBCF, divides BCF by business net equity. It measures the return extracted from the business by the entrepreneur in the year covered by the SCF. The sec-ond measure, which we call RBCF–CG, replaces BCF in the numerator with BCF–CG. Thus, it is a more com-prehensive measure that includes both extracted returns and the unrealized increase in value due to retained earnings, debt reduction, and entrepreneurial labor.
27Federal Reserve Bank of Chicago
FIguRE 2
Distribution of business income cash flow (BCF), by ownership tenure
Notes:SEBmeansself-employedbusinessowner.Alldollarvaluesarein2004dollars.Becauseofthescalingusedinthisfigure,theleftmostbar,whichrepresentsbusinesseswithalossinexcessof$10,000,isnotclearlyvisibleineachpanel.Source:Authors’calculationsbasedondatafromtheBoardofGovernorsoftheFederalReserveSystem,Survey of Consumer Finances.
percentageofSEBs percentageofSEBs
percentageofSEBs percentageofSEBs
A.Alltenures B.0–1year
D.6ormoreyearsC.2–5years
thousandsofdollars thousandsofdollars
thousandsofdollars thousandsofdollars
3 67 130 194 258 322 385 449 5130
4
8
12
16
3 67 130 194 258 322 385 449 513 3 67 130 194 258 322 385 449 513
3 67 130 194 258 322 385 449 5130
4
8
12
16
0
4
8
12
16
0
4
8
12
16
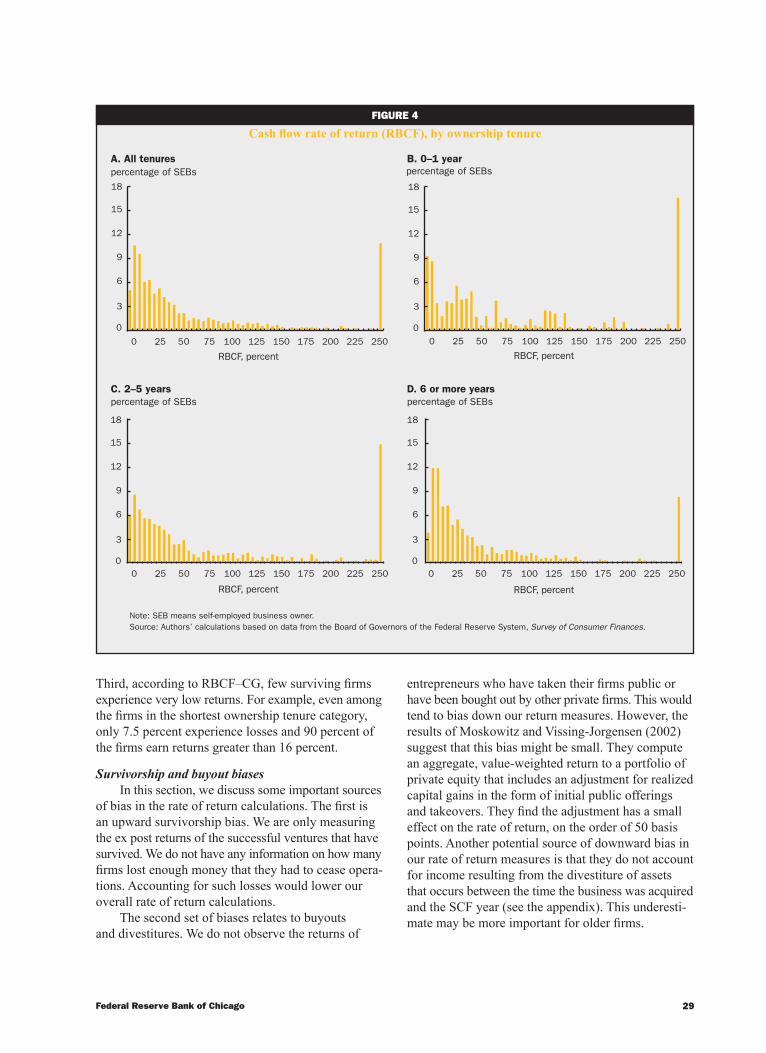
Figure 4 reports data on RBCF, while figure 5 (on p. 30) reports data on RBCF–CG. These figures display histograms of the rate of return on the busi-nesses by ownership tenure for the pooled surveys. In both figures, we have combined the rates of return of 250 percent or more and all negative rates of return in the rightmost and leftmost bars, respectively.13 Table 7 shows the businesses’ medians of RBCF and RBCF–CG for each SCF year.
With regard to the cash flow measure, the median RBCF over all years and SEBs is 33 percent. If this were simply a one-year return to capital, then it would be a very high rate—after all, this measure excludes capital gains, and for comparison, the annual nominal rate of return on the Standard & Poor’s 500 stock in-dex was about 8.5 percent over the 1989–2004 period.
However, the SEBs’ return includes the return to the entrepreneurs’ labor efforts, and so it should exceed the return to capital by a good deal.
The median RBCF masks a wide range of out-comes. About 5 percent of the SEBs lose money, and over one-third of them earn less than a 15 percent re-turn. But many of them earn very large rates of return— 30 percent of them earn more than an 80 percent rate of return. So clearly there is a good deal of financial risk involved with the business ventures of SEBs. Much of this risk-taking appears to be undertaken by smaller, younger businesses. As seen in figure 4, the dispersion of returns for firms with the shortest own-ership tenure is much greater than that for older firms.14 Among firms with ownership tenure of one year or less, 9.4 percent experience losses and another 8.7 percent
28 4Q/2007, Economic Perspectives
FIguRE 3
Distribution of business income including unrealized capital gains (BCF–CG), by ownership tenure
Notes:SEBmeansself-employedbusinessowner.Alldollarvaluesarein2004dollars.Becauseofthescalingusedinthisfigure,theleftmostbar,whichrepresentsbusinesseswithalossinexcessof$10,000,isnotclearlyvisibleinpanelsCandD.Source:Authors’calculationsbasedondatafromtheBoardofGovernorsoftheFederalReserveSystem,Survey of Consumer Finances.
percentageofSEBs percentageofSEBs
percentageofSEBs percentageofSEBs
A.Alltenures B.0–1year
D.6ormoreyearsC.2–5years
thousandsofdollars thousandsofdollars
thousandsofdollars thousandsofdollars
3 67 130 194 258 322 385 449 513
3 67 130 194 258 322 385 449 513 3 67 130 194 258 322 385 449 513
3 67 130 194 258 322 385 449 5130
4
8
12
16
0
4
8
12
16
0
4
8
12
16
0
4
8
12
16
have positive returns of less than 5 percent. But the median RBCF of the businesses is about 50 percent, and about 30 percent of SEBs earn rates of return greater than 125 percent. As firms mature, they are less likely to suffer very poor annual cash flows, but they are also less likely to experience very large returns. Only about 4 percent of the businesses with ownership tenure of six years or more experience losses. But their median RBCF is more than 20 percentage points less than the median for the new businesses, and only 20 per-cent of the mature ventures earn cash flow returns greater than 100 percent.
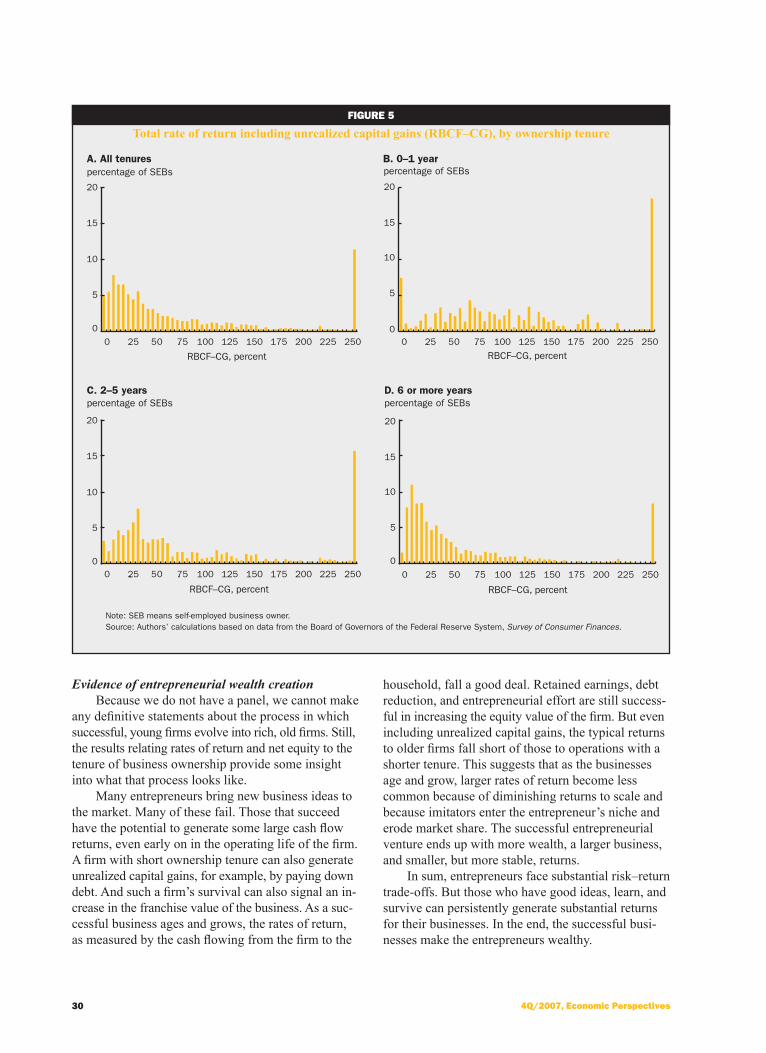
As seen in figure 5, including an estimate of un-realized capital gains in the income measure changes the rate of return histograms a good deal. But it does not change the basic story that entrepreneurs take on
a great deal of risk and that much of this risk-taking in search of large returns appears to be done by smaller, younger businesses.
First, RBCF–CG is substantially larger than RBCF: The median return for all SEBs and all years rises from 33 percent to 43 percent. Second, unrealized capital gains boost the returns across all categories of business ownership tenure. But the gains are larger for ventures with short ownership tenure. For the firms with own-ership tenure of one year or less, the median for RBCF is 49 percent, while the median RBCF–CG is 102 per-cent. For firms with tenure of two to five years, the me-dian RBCF and RBCF–CG rates are 40 percent and 58 percent, respectively, and for businesses with tenure of six years or more, the median RBCF and RBCF–CG rates are 28 percent and 32 percent, respectively.
29Federal Reserve Bank of Chicago
FIguRE 4
Cash flow rate of return (RBCF), by ownership tenure
Note:SEBmeansself-employedbusinessowner.Source:Authors’calculationsbasedondatafromtheBoardofGovernorsoftheFederalReserveSystem,Survey of Consumer Finances.
percentageofSEBs percentageofSEBs
percentageofSEBs percentageofSEBs
A.Alltenures B.0–1year
D.6ormoreyearsC.2–5years
RBCF,percent RBCF,percent
RBCF,percent RBCF,percent
0 .25 50 .75 100 125 150 175 200 225 250
0
3
6
9
12
15
18
0
3
6
9
12
15
18
0
3
6
9
12
15
18
0
3
6
9
12
15
18
0 .25 50 .75 100 125 150 175 200 225 250
0 .25 50 .75 100 125 150 175 200 225 250 0 .25 50 .75 100 125 150 175 200 225 250
Third, according to RBCF–CG, few surviving firms experience very low returns. For example, even among the firms in the shortest ownership tenure category, only 7.5 percent experience losses and 90 percent of the firms earn returns greater than 16 percent.
Survivorship and buyout biasesIn this section, we discuss some important sources
of bias in the rate of return calculations. The first is an upward survivorship bias. We are only measuring the ex post returns of the successful ventures that have survived. We do not have any information on how many firms lost enough money that they had to cease opera-tions. Accounting for such losses would lower our overall rate of return calculations.
The second set of biases relates to buyouts and divestitures. We do not observe the returns of
entrepreneurs who have taken their firms public or have been bought out by other private firms. This would tend to bias down our return measures. However, the results of Moskowitz and Vissing-Jorgensen (2002) suggest that this bias might be small. They compute an aggregate, value-weighted return to a portfolio of private equity that includes an adjustment for realized capital gains in the form of initial public offerings and takeovers. They find the adjustment has a small effect on the rate of return, on the order of 50 basis points. Another potential source of downward bias in our rate of return measures is that they do not account for income resulting from the divestiture of assets that occurs between the time the business was acquired and the SCF year (see the appendix). This underesti-mate may be more important for older firms.
30 4Q/2007, Economic Perspectives
FIguRE 5
Total rate of return including unrealized capital gains (RBCF–CG), by ownership tenure
Note:SEBmeansself-employedbusinessowner.Source:Authors’calculationsbasedondatafromtheBoardofGovernorsoftheFederalReserveSystem,Survey of Consumer Finances.
percentageofSEBs percentageofSEBs
percentageofSEBs percentageofSEBs
A.Alltenures B.0–1year
D.6ormoreyearsC.2–5years
RBCF–CG,percent RBCF–CG,percent
RBCF–CG,percent RBCF–CG,percent
0
5
10
15
20
0
5
10
15
20
0
5
10
15
20
0
5
10
15
20
0 .25 50 .75 100 125 150 175 200 225 250 0 .25 50 .75 100 125 150 175 200 225 250
0 .25 50 .75 100 125 150 175 200 225 250 0 .25 50 .75 100 125 150 175 200 225 250
Evidence of entrepreneurial wealth creationBecause we do not have a panel, we cannot make
any definitive statements about the process in which successful, young firms evolve into rich, old firms. Still, the results relating rates of return and net equity to the tenure of business ownership provide some insight into what that process looks like.
Many entrepreneurs bring new business ideas to the market. Many of these fail. Those that succeed have the potential to generate some large cash flow returns, even early on in the operating life of the firm. A firm with short ownership tenure can also generate unrealized capital gains, for example, by paying down debt. And such a firm’s survival can also signal an in-crease in the franchise value of the business. As a suc-cessful business ages and grows, the rates of return, as measured by the cash flowing from the firm to the
household, fall a good deal. Retained earnings, debt reduction, and entrepreneurial effort are still success-ful in increasing the equity value of the firm. But even including unrealized capital gains, the typical returns to older firms fall short of those to operations with a shorter tenure. This suggests that as the businesses age and grow, larger rates of return become less common because of diminishing returns to scale and because imitators enter the entrepreneur’s niche and erode market share. The successful entrepreneurial venture ends up with more wealth, a larger business, and smaller, but more stable, returns.
In sum, entrepreneurs face substantial risk–return trade-offs. But those who have good ideas, learn, and survive can persistently generate substantial returns for their businesses. In the end, the successful busi-nesses make the entrepreneurs wealthy.
31Federal Reserve Bank of Chicago
Credit constraints, risk preferences, and precautionary saving
Ideally, the entrepreneur would be able to borrow as needed at a cost that is contingent on the particular state of the world that eventually transpires. Such ide-al conditions do not exist because, in reality, certain information is available to the entrepreneur, but not the lender; there is limited enforceability of contracts; and there is a risk that entrepreneurs might reduce their work effort if they do not bear all of the risks and reap all of the rewards from their business ventures. These features generate less-than-perfect risk sharing be-tween lenders and entrepreneurs. And in light of the large variability in returns, the importance of survivor-ship, and the relevance of unrealized capital gains for entrepreneurs, this lack of risk sharing likely has an important influence on the economic environment faced by entrepreneurs and their creditors.
One potentially important implication is that entre-preneurs can face credit constraints. Such constraints can take many forms—differences between borrowing and lending rates, collateral requirements, or outright denial of credit at any price.15 Credit constraints can deter entrepreneurs from investing as much as they think is necessary to make their businesses profitable and can expose them to consumption fluctuations due to unforeseen shocks. The more the household is averse to risk, the larger the cost of these consumption fluc-tuations. And so there is an incentive for entrepreneurs to self-insure against these costs by building wealth for precautionary balances and to finance their business operations. However, the degree to which entrepreneurs will do so also depends on their attitudes toward risk and the severity of the credit constraints they face.
We find qualitative evidence that entrepreneurs face credit constraints, though there are indications that these have eased over time. We also find evidence that SEB households are less risk averse than other wealthy households. This discounts the notion that the wealth of entrepreneurs disproportionately reflects a buildup of precautionary balances.
Credit constraintsThe data seem consistent with the proposition
that SEBs do face important credit constraints, although there is no way to determine how much of SEB wealth is associated with such constraints. Furthermore, some of our other results suggest that credit constraints have moderated over the 1989–2004 period.
The SCF calculates business net worth by taking the net value the household would receive if the busi-ness were sold today plus the net of any lending or collateral provision from the personal accounts of the
household to the business ledger (see the appendix). For example, if an SEB puts up a house as collateral to secure a line of bank credit to be used by the busi-ness, this amount is included in the value of business net worth. The greater is the degree of credit con-straints on business lending, the greater the need for such lending or collateralization.
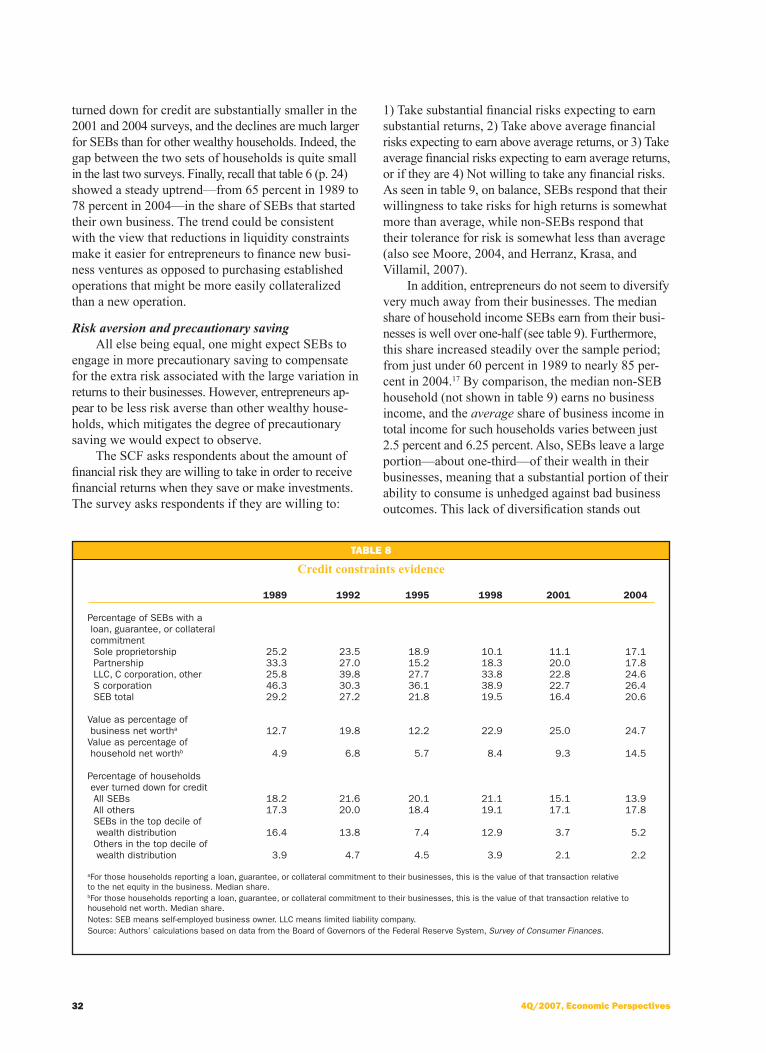
As seen in table 8, a substantial share of SEBs make such commitments. In every year we consider, more than 15 percent of SEBs have a loan or a guar-antee or they have pledged collateral to their business. Furthermore, the size of these commitments is not triv-ial. The median value as a share of net equity of the firm varies between 12 percent and 25 percent; in terms of the household’s net worth, the commitments vary between 4 percent and 15 percent. In general, there are more cases of lending between households and businesses for the limited liability ventures. This may simply reflect the fact that for such entities there are more legal reasons to distinguish the balance sheet of the owner from that of the business. The size of the commitment, however, does not vary systematically between the various legal forms of business structure.
Further insight into credit constraints can be gleaned from a question in the SCF that asks if over the past five years the respondent has been turned down for credit or not been given as much credit as requested. As seen in the bottom portion of table 8, over the first four survey years in our sample, SEBs were slightly more likely than others in the population to have ex-perienced such a constraint. However, the relative share of SEBs experiencing such limits seems large given the disproportionate representation of SEBs in the up-per ranges of the wealth and income distributions. When we consider only those households in the top 10 per-cent of the wealth distribution, SEBs experienced a much higher rate of being turned down for credit than other households. As we document, SEBs have much higher debt-to-income ratios than other households (see table 9). They also may try to borrow more often than non-SEB households in order to finance business operations. Accordingly, SEBs may experience more instances of credit denial by lenders that are concerned about their ability to service debt.
Even though SEBs apparently face credit con-straints, such restrictions appear to have relaxed over time. The share of SEBs making loan commitments to their businesses declined from nearly 30 percent in 1989 and 1992 to the 15–20 percent range in the late 1990s and early 2000s.16 A decline in personal lending to the business is evident for all forms of legal structure. Furthermore, the percentages of all households in the top decile of the wealth distribution that have been
32 4Q/2007, Economic Perspectives
TaBlE 8
Credit constraints evidence
1989 1992 1995 1998 2001 2004
PercentageofSEBswithaloan,guarantee,orcollateralcommitment Soleproprietorship 25.2 23.5 18.9 10.1 11.1 17.1Partnership 33.3 27.0 15.2 18.3 20.0 17.8LLC,Ccorporation,other 25.8 39.8 27.7 33.8 22.8 24.6Scorporation 46.3 30.3 36.1 38.9 22.7 26.4SEBtotal 29.2 27.2 21.8 19.5 16.4 20.6 Valueaspercentageofbusinessnetwortha 12.7 19.8 12.2 22.9 25.0 24.7Valueaspercentageofhouseholdnetworthb 4.9 6.8 5.7 8.4 9.3 14.5 Percentageofhouseholdseverturneddownforcredit AllSEBs 18.2 21.6 20.1 21.1 15.1 13.9Allothers 17.3 20.0 18.4 19.1 17.1 17.8SEBsinthetopdecileofwealthdistribution 16.4 13.8 7.4 12.9 3.7 5.2Othersinthetopdecileofwealthdistribution 3.9 4.7 4.5 3.9 2.1 2.2
aForthosehouseholdsreportingaloan,guarantee,orcollateralcommitmenttotheirbusinesses,thisisthevalueofthattransactionrelativetothenetequityinthebusiness.Medianshare.bForthosehouseholdsreportingaloan,guarantee,orcollateralcommitmenttotheirbusinesses,thisisthevalueofthattransactionrelativetohouseholdnetworth.Medianshare.Notes:SEBmeansself-employedbusinessowner.LLCmeanslimitedliabilitycompany.Source:Authors’calculationsbasedondatafromtheBoardofGovernorsoftheFederalReserveSystem,Survey of Consumer Finances.
turned down for credit are substantially smaller in the 2001 and 2004 surveys, and the declines are much larger for SEBs than for other wealthy households. Indeed, the gap between the two sets of households is quite small in the last two surveys. Finally, recall that table 6 (p. 24) showed a steady uptrend—from 65 percent in 1989 to 78 percent in 2004—in the share of SEBs that started their own business. The trend could be consistent with the view that reductions in liquidity constraints make it easier for entrepreneurs to finance new busi-ness ventures as opposed to purchasing established operations that might be more easily collateralized than a new operation.
Risk aversion and precautionary savingAll else being equal, one might expect SEBs to
engage in more precautionary saving to compensate for the extra risk associated with the large variation in returns to their businesses. However, entrepreneurs ap-pear to be less risk averse than other wealthy house-holds, which mitigates the degree of precautionary saving we would expect to observe.
The SCF asks respondents about the amount of financial risk they are willing to take in order to receive financial returns when they save or make investments. The survey asks respondents if they are willing to:
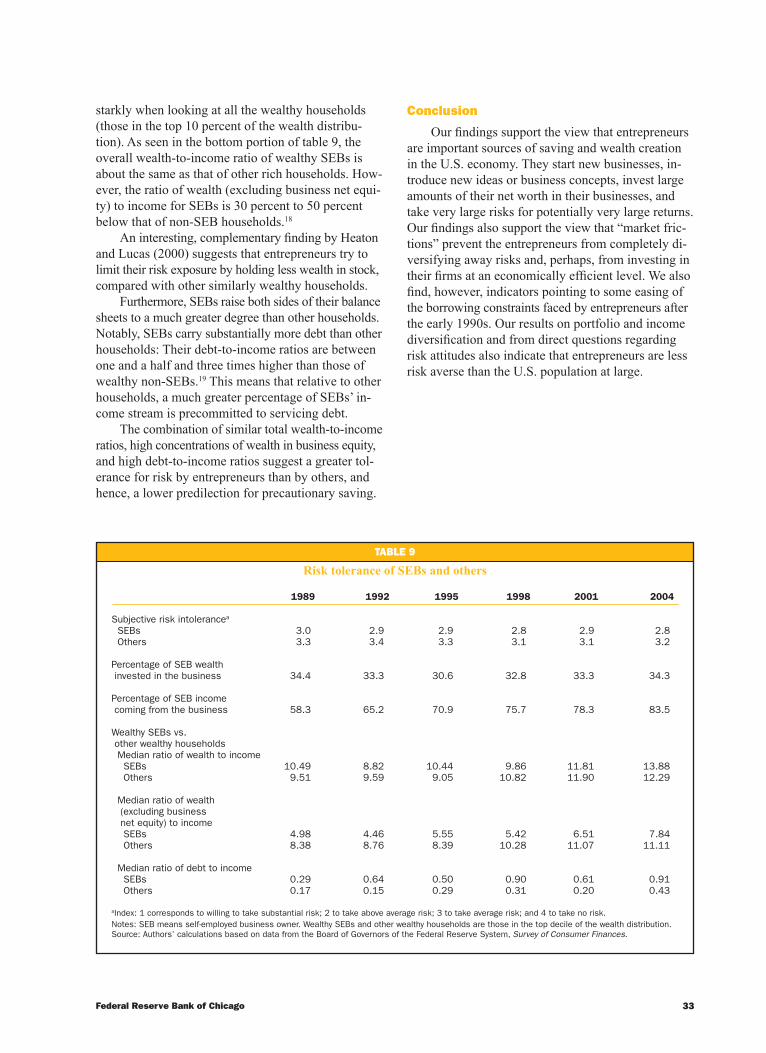
1) Take substantial financial risks expecting to earn substantial returns, 2) Take above average financial risks expecting to earn above average returns, or 3) Take average financial risks expecting to earn average returns, or if they are 4) Not willing to take any financial risks. As seen in table 9, on balance, SEBs respond that their willingness to take risks for high returns is somewhat more than average, while non-SEBs respond that their tolerance for risk is somewhat less than average (also see Moore, 2004, and Herranz, Krasa, and Villamil, 2007).
In addition, entrepreneurs do not seem to diversify very much away from their businesses. The median share of household income SEBs earn from their busi-nesses is well over one-half (see table 9). Furthermore, this share increased steadily over the sample period; from just under 60 percent in 1989 to nearly 85 per-cent in 2004.17 By comparison, the median non-SEB household (not shown in table 9) earns no business income, and the average share of business income in total income for such households varies between just 2.5 percent and 6.25 percent. Also, SEBs leave a large portion—about one-third—of their wealth in their businesses, meaning that a substantial portion of their ability to consume is unhedged against bad business outcomes. This lack of diversification stands out
33Federal Reserve Bank of Chicago
TaBlE 9
Risk tolerance of SEBs and others
1989 1992 1995 1998 2001 2004
Subjectiveriskintolerancea SEBs 3.0 2.9 2.9 2.8 2.9 2.8Others 3.3 3.4 3.3 3.1 3.1 3.2 PercentageofSEBwealthinvestedinthebusiness 34.4 33.3 30.6 32.8 33.3 34.3
PercentageofSEBincomecomingfromthebusiness 58.3 65.2 70.9 75.7 78.3 83.5 WealthySEBsvs.otherwealthyhouseholds Medianratioofwealthtoincome SEBs 10.49 8.82 10.44 9.86 11.81 13.88Others 9.51 9.59 9.05 10.82 11.90 12.29Medianratioofwealth(excludingbusinessnetequity)toincome SEBs 4.98 4.46 5.55 5.42 6.51 7.84Others 8.38 8.76 8.39 10.28 11.07 11.11Medianratioofdebttoincome SEBs 0.29 0.64 0.50 0.90 0.61 0.91Others 0.17 0.15 0.29 0.31 0.20 0.43
aIndex:1correspondstowillingtotakesubstantialrisk;2totakeaboveaveragerisk;3totakeaveragerisk;and4totakenorisk.Notes:SEBmeansself-employedbusinessowner.WealthySEBsandotherwealthyhouseholdsarethoseinthetopdecileofthewealthdistribution.Source:Authors’calculationsbasedondatafromtheBoardofGovernorsoftheFederalReserveSystem,Survey of Consumer Finances.
starkly when looking at all the wealthy households (those in the top 10 percent of the wealth distribu-tion). As seen in the bottom portion of table 9, the overall wealth-to-income ratio of wealthy SEBs is about the same as that of other rich households. How-ever, the ratio of wealth (excluding business net equi-ty) to income for SEBs is 30 percent to 50 percent below that of non-SEB households.18
An interesting, complementary finding by Heaton and Lucas (2000) suggests that entrepreneurs try to limit their risk exposure by holding less wealth in stock, compared with other similarly wealthy households.
Furthermore, SEBs raise both sides of their balance sheets to a much greater degree than other households. Notably, SEBs carry substantially more debt than other households: Their debt-to-income ratios are between one and a half and three times higher than those of wealthy non-SEBs.19 This means that relative to other households, a much greater percentage of SEBs’ in-come stream is precommitted to servicing debt.
The combination of similar total wealth-to-income ratios, high concentrations of wealth in business equity, and high debt-to-income ratios suggest a greater tol-erance for risk by entrepreneurs than by others, and hence, a lower predilection for precautionary saving.
Conclusion
Our findings support the view that entrepreneurs are important sources of saving and wealth creation in the U.S. economy. They start new businesses, in-troduce new ideas or business concepts, invest large amounts of their net worth in their businesses, and take very large risks for potentially very large returns. Our findings also support the view that “market fric-tions” prevent the entrepreneurs from completely di-versifying away risks and, perhaps, from investing in their firms at an economically efficient level. We also find, however, indicators pointing to some easing of the borrowing constraints faced by entrepreneurs after the early 1990s. Our results on portfolio and income diversification and from direct questions regarding risk attitudes also indicate that entrepreneurs are less risk averse than the U.S. population at large.

34 4Q/2007, Economic Perspectives
NOTES
1Although we require that SEBs own at least one business, we do not restrict our analysis to households whose business net worth is above a given threshold. Therefore, we have not necessarily excluded owners of tiny businesses that may enter or exit operation quickly.
2We chose to not use the 1983 and 1986 SCF waves because these surveys appear to be of lower quality, and they did not ask all of the questions regarding the households’ business interests found in the six SCF waves that we use.
3The SCF generally takes place in the second half of the calendar year. Flow variables, notably income, refer to the previous calendar year; stock variables and demographic or business ownership iden-tifiers cover current values.
4The summary statistics we present in this article are calculated by first multiplying the relevant observations by their SCF weight. These are demographic weights that indicate how representative the observed household is of the U.S. population as a whole.
5The SEBs are overrepresented in the other portions of the upper ends of the wealth distribution as well. Nearly 40 percent of SEBs fall in the top wealth decile, and nearly one-quarter are in the top 5 percent of the wealth distribution. The SEBs make up 25–30 percent of the top 10 percent of the wealth distribution and 30–40 percent of the top 5 percent.
6There is some evidence of a countercyclical pattern for self-employed workers as a whole in the Current Population Survey (CPS), which is conducted by the U.S. Census Bureau for the U.S. Bureau of Labor Statistics. (See Aaronson, Rissman, and Sullivan, 2004, and Rissman, 2006.) The CPS does not allow one to identify who among the self-employed own and manage a business operation. With regard to our results, many of those making cyclical transitions between self-employment and work for pay may not consider themselves as actively managing a business, and so they would not be included in our SEB sample. The movements in and out of self-employment of such individuals may indeed be countercyclical.
7The education index is constructed by coding household heads as a 1 if they do not have a high school degree; a 2 if they have a high school degree only; a 3 if they have some college; and a 4 if they have a college degree. The index is the population-weighted aver-age across respondents.
8Note that C corporations may or may not be publicly traded, but the SCF questions regarding active business ownership instruct respondents to give only information on corporations that are not publicly traded that they own or share ownership of and in which they have an active management role.
9Clearly, measurement error may be an important issue with busi-ness net worth. The value of the firm is a self-reported number. So unless the SEB has recently received a credible buyout offer or other external assessment of the firm’s valuation, the answer to this question will be subjective. Valuation might be particularly diffi-cult for SEBs running start-ups, since there is little track record available to judge the long-run potential of the firm.
10A small percentage of firms—0.05 percent—have a net worth less than –$2,200.
11We differ from Moore (2004) in that we do not include an adjust-ment for the difference between the unrealized capital gain and the opportunity cost of capital.
12This result may seem surprising for firms with short ownership tenure, since they have had little time to reap the gains from capital investments made using retained earnings. However, other factors may be boosting their net equity. First, the SEB may have paid down a substantial amount of debt incurred when acquiring the business. Second, the survival of the SEB’s firm may provide a posi-tive signal of the ongoing viability of the business venture, causing the SEB to give a more optimistic assessment of the value of the firm. Note, though, that we likely are underestimating annualized capital gains to the firms with short ownership tenure. This is because we do not know the exact month the firm was acquired; hence, we divided the change in value by one, even if the firm was created less than a year ago.
13In addition, to avoid skewing the rates of return because of the earnings of businesses with little or negative net equity, we perform rate of return computations only for businesses with a net worth greater than $1,000. Even with this adjustment, however, some firms’ high rates of return may reflect relatively modest income flows against a base of very little net equity. Unfortunately, the SCF only records net equity in the business and does not separate assets and liabilities. Accordingly, we cannot calculate an alterna-tive rate of return on assets.
14Some of the higher dispersion among businesses with ownership tenure of one year or less might be affected by sampling error, since the number of SEBs in this category is a good deal smaller than those in the other two tenure classifications.
15Some researchers, for example, Hurst and Lusardi (2004) ques-tion the importance of credit constraints to entrepreneurial activity documented by much other literature on the subject.
16That said, conditioned on making a loan or pledging collateral, the size of such lending has trended up over time. The median commitment rose from between 12 percent and 20 percent of the net worth of the business in the first three surveys in our sample to about 25 percent in the 2001 and 2004 surveys.
17The trends in legal structure do not appear to account for the trend in the business income share of total SEB income. All legal forms of business show an uptrend in the share of income derived from their business activity, and the differences in business shares among the legal forms are small.
18For comparison, among non-SEB households in the top decile of the wealth distribution, the median amount of wealth held in private business equity is zero, and the average amount varies be-tween 9 percent and 12 percent. Moskowitz and Vissing-Jorgensen (2002) also document the lack of portfolio diversifications for entrepreneurs.
19Undoubtedly, this is a natural consequence of borrowing to oper-ate their businesses, although we cannot tell for sure because the SCF provides information on only the net value of the businesses, without separating their assets and liabilities.

35Federal Reserve Bank of Chicago
TaBlE a1
Number of observations in each SCF wave
1989 1992 1995 1998 2001 2004
SEBs 566 837 838 856 878 931
Others 2,577 3,068 3,461 3,449 3,564 3,588
Notes:SEBmeansself-employedbusinessowner.SCFmeansSurvey of Consumer Finances.Source:BoardofGovernorsoftheFederalReserveSystem,Survey of Consumer Finances.
APPENDIx
The number of observations in each wave of the Survey of Consumer Finances we use in our article appears in table A1.
Business net worth
Business net worth equals the net equity if the busi-ness were sold today, plus loans from the household to the business, minus the loans from the business to the household not reported as personal debt by the respon-dent, plus the value of personal assets used as collateral for business loans not reported as an asset by the house-hold earlier. Net equity is the self-reported answer to the question: “What is the net worth of the business? What could you sell it for today?”
Self-employed business owners’ business income
Isolating the income SEB households earn from their businesses is not straightforward. We do so by combin-ing the SCF questions that directly ask respondents how much salary or wages they earn from their main jobs and, in addition to regular salary, how much of the net earnings or other income they received from their businesses. We include income received by the spouses from the businesses. These data are not without problems, and measurement error is still a concern. For example, they may suffer
from recollection error, and while salary data are for the current year, other business income refers to the calen-dar year prior to the SCF. See Moore (2004) for a dis-cussion of these and other issues. Still, we feel this ap-proach is superior to using tax data, which the SCF also records. Importantly, partnership and S corporation income are found in form 1040, line 17, but line 17 also includes income from rental real estate, royalties, and trusts that might not be actively managed businesses by SEB house-holds. Furthermore, S corporations and other closely held corporations can pay salaries to their owners. Such salary income is included in the regular wage and salary reporting in form 1040, line 7, but they also include wage earnings of family members from outside of the businesses.
Computing business income net of taxes would be very interesting but requires work that goes beyond the scope of this article. It would be relatively easy to do so for businesses organized as C corporations because they face a flat tax rate on business income. Such firms, how-ever, make up only a small fraction of the SEBs in our sample. For other types of SEBs, business income is in-cluded in the households’ total income, and hence, it is tax-based on all of the household financial and demographic characteristics. Computing business income net of taxes does require a complicated and detailed algorithm.

36 4Q/2007, Economic Perspectives
Aaronson, Daniel, Ellen R. Rissman, and Daniel G. Sullivan, 2004, “Can sectoral reallocation explain the jobless recovery?,” Economic Perspectives, Federal Reserve Bank of Chicago, Vol. 28, No. 2, Second Quarter, pp. 36–49.
Altonji, Joseph G., and Ulrich Doraszelski, 2005, “The role of permanent income and demographics on black/white differences in wealth,” Journal of Human Resources, Vol. 40, No. 1, Winter, pp. 1–30.
Altonji, Joseph G., Ulrich Doraszelski, and Lewis M. Segal, 2000, “Black/white differences in wealth,” Economic Perspectives, Federal Reserve Bank of Chicago, Vol. 24, No. 1, First Quarter, pp. 38–50.
Gentry, William M., and R. Glenn Hubbard, 2004, “Entrepreneurship and household savings,” Advances in Economic Analysis and Policy, Vol. 4, No. 1, article 8, available at www.bepress.com/bejeap/advances/ vol4/iss1/art8.
Heaton, John, and Deborah Lucas, 2000, “Portfo-lio choice and asset prices: The importance of entre-preneurial risk,” Journal of Finance, Vol. 55, No. 3, pp. 1163–1198.
Herranz, Neus, Stefan Krasa, and Anne P. Villamil, 2007, “The impact of entrepreneur characteristics and bankruptcy rules on firm performance,” University of Illinois at Urbana–Champaign, mimeo, May.
Hurst, Erik, and Anna Lusardi, 2004, “Liquidity constraints, wealth accumulation, and entrepreneur-ship,” Journal of Political Economy, Vol. 112, No. 2, pp. 319–347.
Knight, Frank H., 1921, Risk, Uncertainty, and Profit, Boston: Hart, Schaffner, and Marx and Houghton Mifflin.
Moore, Kevin, 2004, “Comparing the earnings of employees and the self-employed,” Board of Governors of the Federal Reserve System, mimeo, October 19.
Moskowitz, Tobias, and Annette Vissing-Jorgensen, 2002, “The returns to entrepreneurial investment: A private equity premium puzzle?,” American Economic Review, Vol. 92, No. 4, September, pp. 745–778.
Quadrini, Vincenzo, 2000, “Entrepreneurship, saving, and social mobility,” Review of Economic Dynamics, Vol. 3, No. 1, January, pp. 1–40.
__________, 1999, “The importance of entrepreneur-ship for wealth concentration and mobility,” Review of Income and Wealth, Vol. 45, No. 1, March, pp. 1–19.
Rissman, Ellen R., 2006, “The self-employment duration of younger men over the business cycle,” Economic Perspectives, Federal Reserve Bank of Chicago, Vol. 30, No. 3, Third Quarter, pp. 14–26.
Schumpeter, Joseph A., 1934, The Theory of Economic Development: An Inquiry Into Profits, Capital, Credit, Interest, and the Business Cycle, Redvers Opie (trans.), Cambridge, MA: Harvard University Press, originally published as Theorie der Wirtschaftlichen Entwicklung, 1911, Leipzig, Germany: Duncker und Humblot.
REFERENCES