evidence and impact of value-based benefit design emma hoo, director of value-based purchasing...
TRANSCRIPT

Evidence and Impact of Value-Based Benefit Design
Emma Hoo, Director of Value-Based PurchasingPacific Business Group on Health
National Pay for Performance SummitMarch 10, 2009
© Pacific Business Group on Health, 2009 2
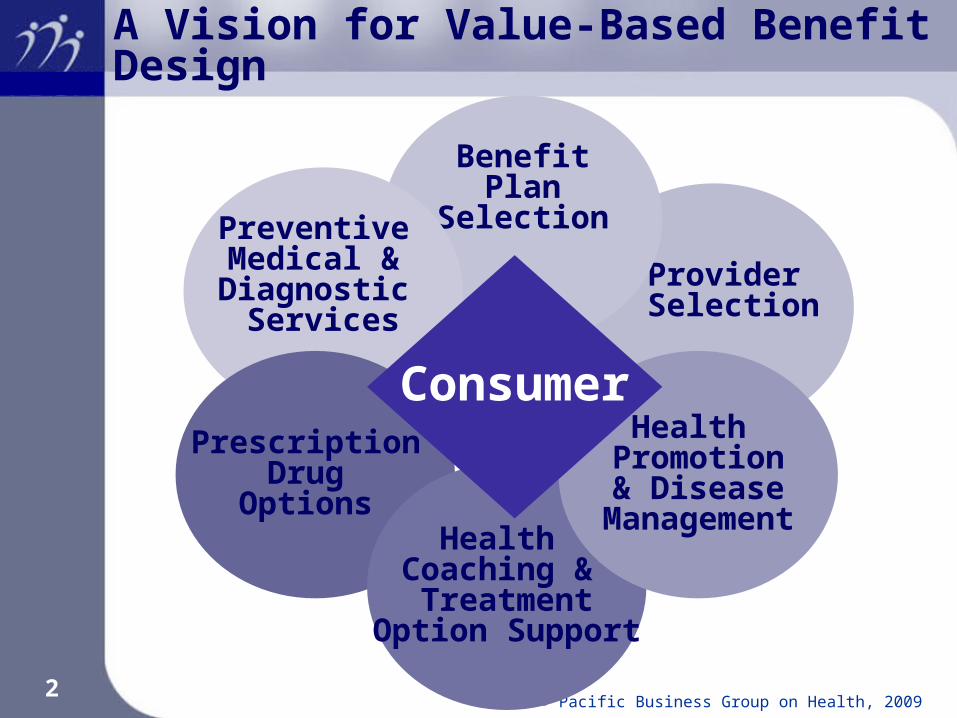
Provider Selection
BenefitPlan
SelectionPreventive Medical & Diagnostic
Services
A Vision for Value-Based Benefit Design
Prescription Drug
Options Health
Coaching & Treatment
Option Support
Health Promotion& Disease
Management
Consumer

© Pacific Business Group on Health, 2009 3
Harnessing the Value of Health Management
© Pacific Business Group on Health, 2009 4
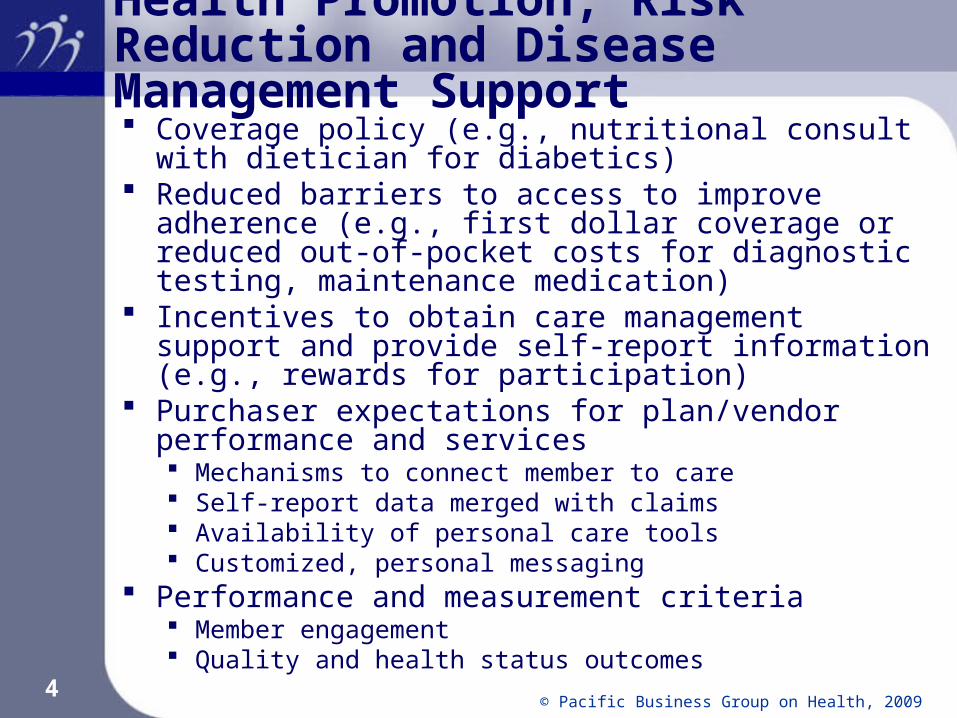
Health Promotion, Risk Reduction and Disease Management Support Coverage policy (e.g., nutritional consult with dietician
for diabetics) Reduced barriers to access to improve adherence
(e.g., first dollar coverage or reduced out-of-pocket costs for diagnostic testing, maintenance medication)
Incentives to obtain care management support and provide self-report information (e.g., rewards for participation)
Purchaser expectations for plan/vendor performance and services Mechanisms to connect member to care Self-report data merged with claims Availability of personal care tools Customized, personal messaging
Performance and measurement criteria Member engagement Quality and health status outcomes

© Pacific Business Group on Health, 2009 5
Targeting Incentives: A Continuum of Health and Disease Management Services
Well
e.g., Low Risk, Good Nutrition, Active
Lifestyle
At Risk
e.g., Inactivity, High Stress, Overweight,
High Blood Pressure, Smoking
Acute Conditions
e.g., Respiratory, Strain and Sprains,
Lacerations
Chronic Conditions
e.g., Depression Musculoskeletal, Heart Disease
Catastrophic Conditions
e.g., Cancer, Renal Disease, Rare
Diseases
Health Promotion Health Risk Management
Self CareChronic Disease
ManagementHigh Cost Case
Management
Awareness Health Risk Assessment
Promote Existing Services
Patient Identification and enrollment
Navigational Support
Screenings Targeted Behavior Modification
NurseLine Care Coordination Patient Advocacy
ImmunizationsStress/Mental Health
ManagementLeverage Internet Practice Guidelines Care Coordination
Healthy Lifestyle Promotion
Physical Activity Campaign
Reinforce Safety at Home and Work
Address Comorbid Conditions
Address Comorbid Conditions
Integrated Services, Communication, Reinforcement, Accountability, and Measurement and Evaluation
Integrated Care Management Interventions
Source: Mercer Human Resource Consulting

© Pacific Business Group on Health, 2009 6
Health Coaching & Treatment Option Support Early identification of members
Just diagnosed Ongoing illness Personal behavior change Annual budgeting and planning
Treatment options tailored to individual Preference-sensitive Integrated with benefit design and cost information
Coordination between medical group/provider and patient
Coordination between plan and medical group/provider
Coordination between plan and patient Support for risk reduction and self-care Performance and measurement criteria
Member identification and engagement Quality and health status outcomes

© Pacific Business Group on Health, 2009 7
Health Dialog Consumer Support through Interactive Voice Response
Presented by Mary Jane Favazza, senior vice president of business development and client services, Health Dialog, at PBGH Consumer Tools Symposium, April 26, 2007

© Pacific Business Group on Health, 2009 8
Harnessing the Value of Behavior Change, Self-Care and Risk Reduction
Source: Disease Management Advisor, June 2006Kaiser implementation of Health Media online tools

© Pacific Business Group on Health, 2009 9
Prescription Drug Options
Assess data Quantify population prevalence of health condition Evaluate level of non-adherence and improvement
opportunity Incentives for access, adherence or engagement in
managing health condition Rewards for behavior change Coordination with medical benefits
Coverage for routine diagnostic services to manage chronic condition
Coverage for services that support behavior change (e.g., nutritional counseling for diabetics)
Performance and measurement criteria Medication adherence and possession rates Utilization changes (e.g., avoided admissions or ER visits) Quality and health status outcomes

© Pacific Business Group on Health, 2009 10
Understanding the Cost Impact of Improved Prescription Drug Adherence
9© 2004-2008 Medco Health Solutions, Inc. All rights reserved.
$0
$2,000
$4,000
$6,000
$8,000
$10,000
1-19 20-39 40-59 60-79 80-100
Drug Cost
Medical Cost
Diabetics who stay on therapy have lower overall healthcare costs¹
1Sokol, MC, McGuigan, KA, Verbugge, RR, Epstein, RS. Impact of Medication Adherence on Hospitalization Risk and Healthcare Cost. Medical Care 2005; 43: 521-530.
Drug Adherence Level (%)
The Value of Compliance With Drug RegimensThe Value of Compliance With Drug RegimensThe Value of Compliance With Drug Regimens
Source: Presented by Jane Barlow, MD at PBGH Pharmacy Symposium, April 2008

© Pacific Business Group on Health, 2009 11
Understanding the Cost Impact of Improved Prescription Drug Adherence
10© 2004-2008 Medco Health Solutions, I nc. All rights reserved.
Compliance (MPR) Improves Blood Levels And Reduces Hospitalizations¹ ²
0
2
4
6
8
10
12
14
16
<.40 .40-.59 .60-.79 .80-.99 1% h
ospi
taliz
ed y
ear
2
MPR Year 1
¹Parris ES et al: Adherence to Statin Therapy and LDL Cholesterol Goal Attainment by Patients With Diabetes and Dyslipidemia Diabetes Care 28:595-599, 2005
²Lau DT, Nau DP: Oral Antihyperglycemic Medication Nonadherence and Subsequent Hospitalization Among Individuals With Type 2 Diabetes. Diabetes Care27:2149-2153, 2004
Target compliance MPR > 80%
Source: Presented by Jane Barlow, MD at PBGH Pharmacy Symposium, April 2008

© Pacific Business Group on Health, 2009 12
Preventive Medical and Diagnostic Services
Prioritize evidence-based clinical preventive services with greatest economic and health value
Map to population risk profile First dollar coverage of preventive services
or modest cost-share Broad communications Personalized messaging and reminders Performance and measurement criteria
Member identification and engagement Quality and health status outcomes

© Pacific Business Group on Health, 2009 13
The Evidence for Preventive Medical and Diagnostic Services
Service
CPB — Maximum Score = 5
CE — Maximum Score = 5
Combined Score CPB and CE —
Maximum Score = 10
Aspirin chemoprophylaxis 5 5 10Childhood immunization series 5 5 10Tobacco use, screening and brief intervention 5 5 10
Problem drinking, screening and brief counseling 4 4 8
Colorectal cancer screening 4 4 8
Hypertension screening 5 3 8
Influenza immunization 4 4 8
Pneumococcal immunization 3 5 8
Vision screening (adults) 3 5 8
Cervical cancer screening 4 3 7
Cholesterol screening 5 2 7
Breast cancer screening 4 2 6
Calcium chemoprophylaxis 3 3 6
Chlamydia screening 2 4 6
Vision screening (children) 2 4 6
Folic acid chemoprophylaxis 2 3 5
Obesity screening 3 2 5
Depression screening 3 1 4
Hearing screening 2 2 4
Injury prevention, counseling 1 3 4
CPB indicates clinically preventable burden; CE, cost-effectiveness.aEvaluated in terms of the clinically preventable burden of disease and cost-effectiveness. Dyann M. Matson Koffman, DrPH, MPH, CHES, Andrew Lanza, MPH, MSW, Kathryn Phillips Campbell, MPH. A Purchaser’s Guide to Clinical Preventive Services: A Tool to Improve Health Care Coverage for Preventionhttp://www.cdc.gov/pcd/issues/2008/apr/07_0220.htm

© Pacific Business Group on Health, 2009 14
Incentives Work, but…
Benefit design (consumers) and reimbursement methods (providers) inherently provide incentives
Incentives interact with one another and drive all stakeholders’ behavior
Key challenges confronted today have to do with alignment of incentives: discourage “bad” and encourage “good” behaviors efficiently target incentives to reward change in
behavior while still encouraging those who are already “there”
facilitate good doctor-patient relationships without adding excess burdens
Consider impact of incentives on all stakeholders

© Pacific Business Group on Health, 2009 15
A Toolkit for Value-Based Benefit Design
Develop framework for implementation Define benefit actions and opportunity for product types
HMO PPO CDHP Self-funded vs. insured
Estimated short, medium and long-term impact Total claims experience (utilization) in ASO settings Premiums (pmpm) in insured settings Indirect financial benefits Quality of care
Provide common benefit design language and benefit coverage interpretation

© Pacific Business Group on Health, 2009 16
PBGH-Milliman Project (example)
Nature of Incentive/Design Action(s) Sought and Goal(s)
Preventive medical and diagnostic services Reduced copayment for preventive adult services
(well-baby/child preventive visits are already commonly offered with reduced copayments)
Reduced copayment for diagnostic services (e.g., colonoscopy)
Additional categories to be addressed (map to CDC-NBGH preventive guidelines)
Action: Increase use of EBM-supported preventive care generally; promote screening.
Goal: Increase preventive care and early intervention in disease.
Health and disease management Positive incentive (payment of premium or fund
HSA) or reduced co-payment (insurance) to participate
Positive incentive (payment of premium or fund HSA) or reduced co-payment (insurance) to complete HRA
Positive incentive to use other online tools or personal health record
Action: Encourage better compliance with treatment for individuals with chronic illness; may also include incentives to promote engagement in shared decision-making to encourage more preference-sensitive patient decision-making.
Goal: reduce morbidity/mortality and costs for chronically ill; increase patient engagement in self-care and adherence.
Action: Consumer self-assessment of health status and engagement opportunities.
Goals: (1) Encourage better patient engagement in their own care; (2) create data platform to provide data interchange and electronic transmission of patient information to emergency rooms and/or other service sites to avoid unnecessary tests
Treatment option decision support Positive incentive to use treatment decision
support Reduced copayment or coinsurance for services
upon completion of decision support/health coach encounter
Action: Increase selection of lower-cost alternative treatments that are preference-sensitive.
Goal: Reduce cost without reducing quality
© Pacific Business Group on Health, 2009 17
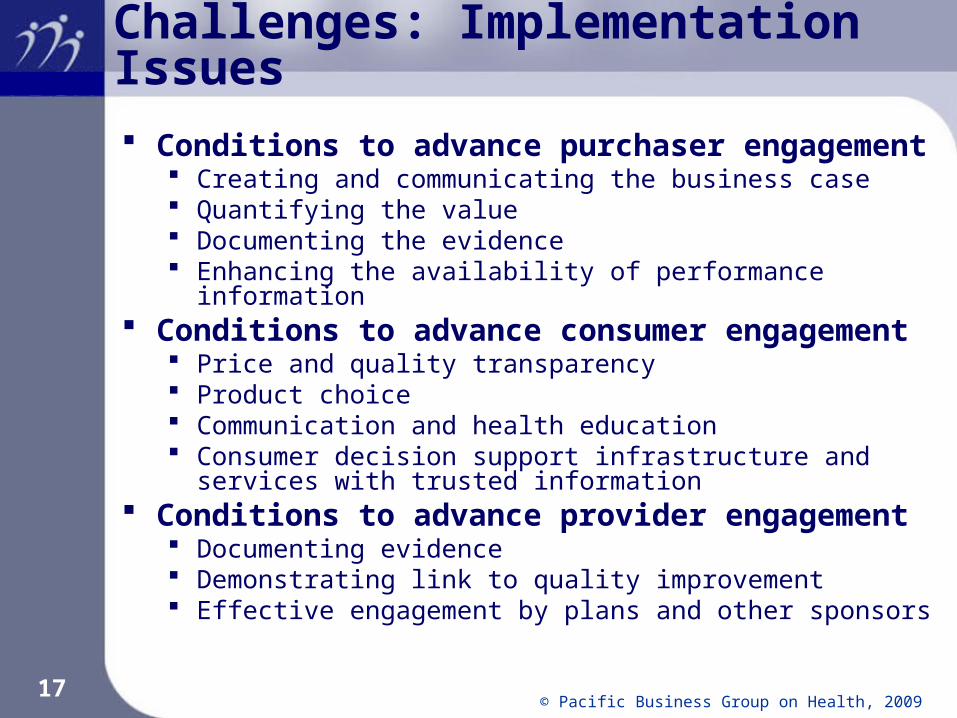
Challenges: Implementation Issues
Conditions to advance purchaser engagement Creating and communicating the business case Quantifying the value Documenting the evidence Enhancing the availability of performance information
Conditions to advance consumer engagement Price and quality transparency Product choice Communication and health education Consumer decision support infrastructure and services with
trusted information Conditions to advance provider engagement
Documenting evidence Demonstrating link to quality improvement Effective engagement by plans and other sponsors

© Pacific Business Group on Health, 2009 18
www.pbgh.org – an overview of PBGH programs and initiatives
http://blog.pbgh.org – commentary on health care policy and reform
www.calquality.org – an overview of the California Quality Collaborative (CQC) with resources for providers
www.cchri.org – an overview of the California Cooperative Healthcare Reporting Initiative (CCHRI)
To subscribe to the PBGH E-Letter, go to www.pbgh.org/news/eletters
To Learn More…