evaluation of the appalachian regional commission's ... · evaluation of the appalachian...
TRANSCRIPT

Evaluation of The Appalachian Regional Commission’s Vocational Education and Workforce Training Projects Study conducted by Westat for the Appalachian Regional Commission
January 2002

Evaluation of The Appalachian Regional Commission’s
Vocational Education and
Workforce Training Projects
Prepared by:
Laurie Plishker Gary Silverstein Joy Frechtling
Westat 1650 Research Boulevard
Rockville, Maryland 20850
Prepared for:
Appalachian Regional Commission 1666 Connecticut Avenue, NW, Suite 700
Washington, DC 20009-1068
NOTE: The views, findings, conclusions, and recommendations expressed in this report are those of the authors and do not necessarily represent the official views, opinions, or policy of the Appalachian Regional Commission.
TABLE OF CONTENTS
Chapter Page Acknowledgments .................................................................................................................... i Executive Summary ................................................................................................................. iii
Study Overview ............................................................................................................ iii Vocational Education and Workforce Training Background........................................ iv Project Context ............................................................................................................. v Project Activities........................................................................................................... v Achievement of Objectives........................................................................................... vi Project Sustainability .................................................................................................... vi Project Objectives and Data Collection Activities........................................................ vii Recommendations......................................................................................................... vii Conclusions................................................................................................................... ix
I Introduction................................................................................................................. 1
Appalachia: A Region in Transition ............................................................................ 1 The Appalachian Regional Commission....................................................................... 1
Program Changes............................................................................................. 2
Study Overview ............................................................................................................ 3
Study Questions ............................................................................................... 3 Issues Regarding Study Methodology ............................................................. 4
Structure of the Report.................................................................................................. 5
II The ARC Evaluation in the Context of the History and Status of Vocational Education and Workforce Training.......................................................................... 7
History and Background ............................................................................................... 7
Early Developments......................................................................................... 7 The New Vocationalism .................................................................................. 8 Evaluation, Accountability, and Performance Indicators ................................ 8
Overview of Data Collection Requirements for Federal Workforce and Vocational Programs........................................................................................ 10 ARC’s Fit into the Field................................................................................................ 12
Framework for Understanding Vocational Education and Workforce Training Projects .............................................................................. 13

TABLE OF CONTENTS (continued)
Chapter Page
Summary and Conclusions ........................................................................................... 13 References........................................................................................................ 15
III Project Context ........................................................................................................... 17
Community Context...................................................................................................... 17 Geographic Distribution .................................................................................. 17 Metropolitan Status.......................................................................................... 19 Economic Status .............................................................................................. 20 Community Groups Served ............................................................................. 21 Communities’ Need for ARC Funding ............................................................ 21
Grants and Grant Recipients ......................................................................................... 23
Grant Recipient Organizations......................................................................... 23 Duration of Funding......................................................................................... 23 Funding Source ................................................................................................ 24 Funding Amount and Total Project Cost ......................................................... 25 Funding from Other Agencies ......................................................................... 25
Project Beneficiaries ..................................................................................................... 26
Age and Job Status of Beneficiaries ................................................................ 26 Industries Served.............................................................................................. 27
Summary and Conclusions ........................................................................................... 28
IV Project Activities ......................................................................................................... 29
Approaches and Activities Conducted by Cohort 1 Projects ........................................ 29 Equipment and Physical Plant Improvements ................................................. 29 Training, Training Materials, and Project Staff Training ................................ 32 Job Search Assistance and Career Counseling ................................................ 35 Social Support Services ................................................................................... 37 Community-Wide Activities............................................................................ 38
Cohort 2 Projects .......................................................................................................... 39 Impact of the ARC Grant.............................................................................................. 40 Implementation Problems Encountered ........................................................................ 41 Summary and Conclusions ........................................................................................... 43

TABLE OF CONTENTS (continued)
Chapter Page V Achievement of Objectives ......................................................................................... 45
Overall Achievements of Cohort 1 Projects ................................................................. 46 Extent to Which Specific Objectives Were Achieved .................................................. 48
Services Provided to Individuals ..................................................................... 50 Services Provided to Communities .................................................................. 50 Barrier Reduction............................................................................................. 50 Skill Attainment............................................................................................... 50 Degree Attainment ........................................................................................... 50 Employment Status .......................................................................................... 52 Community Viability ....................................................................................... 53
Qualitative Findings on Projects’ Objectives................................................................ 53 Respondents’ Perceptions of Their Most Important Outcomes ....................... 53 Site Visit Findings Regarding Project Accomplishments................................ 53
Summary and Conclusions ........................................................................................... 57
VI Project Sustainability and Expansion ....................................................................... 59 Project Status ................................................................................................................ 59
Types of Changes............................................................................................. 61 Factors that Contributed to Changes................................................................ 61
Status of ARC-Funded Activities and Equipment ........................................................ 61 Summary and Conclusions ........................................................................................... 64
VII Project Objectives and Data Collection Activities ................................................... 65 Objectives That Projects Identified for Themselves ..................................................... 65
Quality of Projects’ Objectives........................................................................ 66 Types of Objectives Specified by Projects ...................................................... 67
Projects’ Efforts to Collect Outcome Data ................................................................... 72
Type of Outcome Data Projects Plan to Collect .............................................. 73 Data Collection Methodologies ....................................................................... 73 Collection of Followup Data............................................................................ 74
Barriers to Collecting Outcome Data............................................................................ 76

TABLE OF CONTENTS (continued)
Chapter Page
Site Visit Findings Regarding Projects’ Data Collection Activities ............................. 76 Manufacturing Assistance Center .................................................................... 78 Winston County Technology Center ............................................................... 78 Daniel Morgan Technology Center ................................................................. 79 Ohio Fund for Appalachian Industrial Retraining ........................................... 80 Chautauqua County Wood Skills Training Project.......................................... 81
Summary and Conclusions ........................................................................................... 81
VIII Summary and Recommendations.............................................................................. 83
Project Characteristics and Innovative Activities ......................................................... 83 Enhancing Project Objectives ....................................................................................... 85 Project Evaluation and Performance Reporting............................................................ 86 Conclusions................................................................................................................... 89
LIST OF APPENDICES
Appendix Page A Additional Survey Data............................................................................................. A-1 B Evidence in Support of Projects’ Outcomes.............................................................. B-1 C Notes on the Technical Approach ............................................................................. C-1 D Case Study Methodology and Reports ...................................................................... D-1 E ARC Vocational Education and Workforce Training Project Descriptions.............. E-1 F Cohort 1: Survey of ARC-Funded Vocational Education and Workforce
Training Projects ....................................................................................................... F-1 G Cohort 2: Survey of ARC-Funded Vocational Education and Workforce
Training Projects ....................................................................................................... G-1

TABLE OF CONTENTS (continued)
LIST OF TABLES
Table Page Chapter 3
3-1 Percent of ARC projects that indicated they were designed to provide services,
resources, or other assistance to the following groups, by cohort............................. 21 3-2 Percent of ARC projects, by the type of organization of the grant recipient, by
cohort......................................................................................................................... 23 3-3 Percent of projects by source of ARC funding, by cohort ........................................ 24 3-4 Percent of projects with various ARC grant sizes and total project costs, by
cohort......................................................................................................................... 25 3-5 Percent of projects, by age of intended beneficiaries of the project, by cohort......... 26 3-6 Percent of projects, by job experience of intended beneficiaries of the project,
by cohort.................................................................................................................... 27 3-7 Percent of projects serving various industries, by cohort.......................................... 27
Chapter 4 4-1 Number and percent of activities conducted, by type ............................................... 30 4-2 Percent of Cohort 1 projects reporting purchasing, renting, or leasing various
types of equipment with ARC funding (n=67).......................................................... 30 4-3 Percent of Cohort 1 projects reporting physical plant activities (n=67).................... 32 4-4 Percent of Cohort 1 projects reporting conducting various training activities
(n=67)........................................................................................................................ 32 4-5 Percent of training activities conducted with ARC funding...................................... 33 4-6 Percent of training activities conducted in various locations .................................... 33 4-7 Percent of training activities by duration .................................................................. 34 4-8 Percent of training activities by frequency................................................................ 34 4-9 Percent of Cohort 1 projects reporting developing various types of training
materials (n=67) ........................................................................................................ 34

TABLE OF CONTENTS (continued)
LIST OF TABLES
(continued)
Table Page
Chapter 4 4-10 Percent of Cohort 1 projects reporting training project staff in various areas
(n=67)........................................................................................................................ 35 4-11 Percent of Cohort 1 projects reporting providing job search assistance and career
counseling activities (n=67) ...................................................................................... 36 4-12 Percent of job search assistance/career counseling activities provided with ARC
funding ...................................................................................................................... 37 4-13 Percent of Cohort 1 projects reporting providing social support services (n=67)..... 37 4-14 Percent of Cohort 1 projects reporting conducting community-wide activities
(n=67)........................................................................................................................ 38 4-15 Percent of Cohort 2 projects reporting activities in various categories..................... 39
Chapter 5 5-1 Number of Cohort 1 projects reporting that they achieved their objectives.............. 46 5-2 Number of individuals from Cohort 1 who benefited as a result of the ARC
grant, by type of benefit ............................................................................................ 47 5-3 Number and percent of objectives, by extent to which they were achieved ............. 48 5-4 Forms of evidence that Cohort 1 projects provided to support their claims that
they met their objectives, by type of objective.......................................................... 49
Chapter 6 6-1 Number and percent of Cohort 1 projects that reported various ways their
projects have changed since the ARC grant (n=30) .................................................. 61 6-2 Number and percent of Cohort 1 projects reporting that the following ARC-
funded activities/equipment were still operational at the time of the mail survey .... 63

TABLE OF CONTENTS (continued)
LIST OF TABLES
(continued)
Table Page
Chapter 7 7-1 Percent of objectives of various types and percent with numerical benchmarks,
by cohort.................................................................................................................... 68 7-2 Percent of Cohort 2 projects collecting outcome data about project participants
and/or the overall community, by type of outcome data (n=25) ............................... 73 7-3 Percent of Cohort 2 projects using various data collection and analysis methods .... 74 7-4 Timeframe used by Cohort 2 projects to collect data on project objectives.............. 75 7-5 Timeframe used by Cohort 2 projects to collect data on project objectives, by
intermediate and long-term project goals .................................................................. 75 7-6 Barriers that hindered the efforts of Cohort 2 projects to collect outcome data........ 76
LIST OF FIGURES
Figure Page
Chapter 3 3-1 Geographic distribution of expected beneficiaries of ARC vocational education
and workforce training projects................................................................................. 18 3-2 Percent of projects by metropolitan status ................................................................ 19 3-3 Percent of projects by economic status ..................................................................... 20
3-4 Percent of projects that reported receiving ARC funding during the years 1990–
2000........................................................................................................................... 24

TABLE OF CONTENTS (continued)
LIST OF FIGURES
(continued)
Figure Page
Chapter 4 4-1 Percent of projects reporting the most likely outcome if the project had not
received ARC funding (n=67)................................................................................... 40 4-2 Among Cohort 1 projects that would have been partially implemented without
ARC funding (n=35), the percent reporting various effects...................................... 40 4-3 Percent of Cohort 1 projects reporting number of problems or barriers to
implementing ARC-funded activities (n=67)............................................................ 41 4-4 Percent of Cohort 1 projects reporting implementation obstacles for ARC
activities (n=67) ........................................................................................................ 42
Chapter 6
6-1 Current status of Cohort 1 projects (n=67)................................................................ 59 6-2 Percent of Cohort 1 projects reporting current operating status, by last year
funded (n=67)............................................................................................................ 60 6-3 Percent of ARC projects no longer in operation or in operation but changed
(n=34) reporting factors contributing to reduced or expanded scope........................ 62
Chapter 7 7-1 Percent of projects delineating numeric objectives ................................................... 67

TABLE OF CONTENTS (continued)
LIST OF EXHIBITS
Exhibit Page
Chapter 2 2-1 Flow chart of an individual’s advancement through a model vocational
education or workforce training program.................................................................. 14
Chapter 3
3-1 Examples of geographically isolated areas ............................................................... 19 3-2 Example of an economically disadvantaged area...................................................... 20 3-3 Example of disadvantaged group served by an ARC project.................................... 21 3-4 Additional examples of communities’ need for funding........................................... 22 3-5 Examples of grant recipient organizations ................................................................ 23 3-6 Examples of projects serving primarily adults and primarily youth ......................... 26 3-7 Example of projects serving unemployed adults....................................................... 27 3-8 Example of a general workforce project ................................................................... 27
Chapter 4
4-1 Examples of equipment purchased............................................................................ 30 4-2 Examples of physical plant improvements................................................................ 32 4-3 Examples of training provided .................................................................................. 32 4-4 Examples of training materials development ............................................................ 35 4-5 Examples of project staff training ............................................................................. 36 4-6 Examples of job search assistance and career counseling services ........................... 36 4-7 Example of social support services ........................................................................... 37 4-8 Examples of community-wide activities ................................................................... 39 4-9 Examples of implementation obstacles ..................................................................... 42

TABLE OF CONTENTS (continued)
LIST OF EXHIBITS
(continued)
Exhibit Page
Chapter 5
5-1 Examples of reasons that respondents provided for why objectives pertaining to services provided to individuals were not achieved .................................................. 51
5-2 Examples of reasons that respondents provided for why skill/degree attainment
objectives were not achieved..................................................................................... 52 5-3 Examples of respondents’ perceptions of the most important outcome to result
from the ARC grant................................................................................................... 54
Chapter 6
6-1 Example of equipment sustainability ........................................................................ 63
Chapter 7
7-1 Examples of outputs anticipated by Cohort 1 and Cohort 2 projects ........................ 68 7-2 Examples of skill attainment outcomes anticipated by Cohort 1 and Cohort 2
projects ...................................................................................................................... 70 7-3 Examples of degree attainment outcomes anticipated by Cohort 1 and Cohort 2
projects ...................................................................................................................... 70 7-4 Examples of employment outcomes anticipated by Cohort 1 and Cohort 2
projects ...................................................................................................................... 71 7-5 Examples of community viability outcomes anticipated by Cohort 1 and Cohort
2 projects ................................................................................................................... 72 7-6 Examples of factors that prevented respondents from determining whether their
ARC objectives had been achieved ........................................................................... 77
Chapter 8 8-1 Framework for analysis of activities and objectives, by project type ....................... 87

i
Acknowledgments The evaluation of ARC’s vocational education and workforce development projects could not have taken place with our many colleagues who have labored tirelessly to help conduct this study. Nicole Bartfai and Janice Lee managed the mail survey effort, along with telephone interviewers Kathy Wickert and Paula Horowitz and field room director Roberta Pike; we attribute our high response rate to their efforts. Atsushi Miyaoka conducted the analyses of the study data, with assistance from Ethel Sanniez and Edward Mann in processing the data. Glenn Nyre conducted the literature review and wrote early drafts of Chapter 2, and Carl Setzer provided additional help in writing the report. Our technical editor was Carol Litman, and our desktop publishing specialist was Sylvie Warren. We would also like to acknowledge our site visitors, Nicole Bartfai, Brian Kleiner, Glenn Nyre, Laurie Plishker, and Gary Silverstein.
We must give enormous credit to the projects that hosted site visits, completed the mail surveys, and responded to numerous telephone queries. Without their willingness to take part in multiple data collection activities, we could not have completed our study. Finally, we wish to acknowledge the essential support and advice we have received from the Appalachian Regional Commission (ARC)—particularly Greg Bischak, who served as the ARC study director for the evaluation effort. Judy Rae and Jeffery Schwartz also provided critical reviews of the work in progress. In addition to providing important insights and guidance regarding the conduct of the study, ARC staff went out of their way to facilitate every facet of the evaluation effort.

iii
Executive Summary Within the context of large-scale policy changes in the goals, resources, and implementation of national vocational education and workforce training programs, the Appalachian Regional Commission (ARC) directs a relatively small grants program aimed at these same issues. As government performance reporting requirements for nationwide vocational education programs are increased, the Commission is focusing on evaluating the implementation and achievements of its projects, as well as the parallel performance reporting systems they employ, to improve the program overall and its individual projects. This report summarizes findings from an evaluation of vocational education and workforce training projects funded by ARC between 1995 and 2000. STUDY OVERVIEW In the late 1990s, ARC began a systematic review of its portfolio of funded projects. This study of vocational education and workforce training projects—conducted by Westat, a Rockville, Maryland, research firm—follows a similar study conducted in 2000 of ARC’s educational projects; it builds upon the methodology and understanding of the ARC context from the previous study. ARC delineated four primary objectives for the evaluation: (1) assess the extent to which projects were able to accomplish their anticipated outcomes; (2) benchmark project activities and accomplishments against current national studies of workforce training and vocational education efforts; (3) assess the utility and validity of specific performance measurements that might enhance ARC’s ongoing capacity to monitor and evaluate its workforce training and vocational education projects; and (4) make other policy recommendations that can improve ARC’s efforts to monitor and assist its workforce training and vocational educational projects. In an effort to ensure that the evaluation addressed each of these objectives in a comprehensive manner, we
identified seven primary, interrelated research questions that guided the study: • What are the characteristics of communities
and individuals who benefited from the projects?
• What problems were projects designed to address?
• What approaches did projects use to ameliorate these problems?
• What specific outcomes were projects designed to achieve?
• To what extent have projects accomplished their objectives?
• What factors influenced projects’ ability to implement their approaches and achieve their objectives?
• What performance reporting systems are projects utilizing and how could these benefit the ARC?
The evaluation employed both qualitative and quantitative techniques that addressed all of the study’s outcome and process questions in various depths and to different degrees. The approach included the following integrated activities. Qualitative techniques:
• A review of the literature regarding workforce
training and vocational education and data collection requirements for these types of projects.
• An extensive review of project files to gain a better understanding of the purpose, scope, and goals/objectives of the 92 projects in the study sample.

iv
• Site visits to five projects to obtain detailed information about project-related implemen-tation experiences, accomplishments, and impacts.
Quantitative techniques: • A mail survey to collect broad-based data on
the implementation and impact of the 67 projects in the study sample that received ARC funding between 1995 and 1999 (called Cohort 1).
• An abbreviated survey of 25 projects that received ARC funding in 2000 (called Cohort 2).
VOCATIONAL EDUCATION AND
WORKFORCE TRAINING
BACKGROUND ARC’s portfolio of vocational education and workforce training projects follows decades of debate about the purposes and activities of these programs and, more recently, debate about accountability and performance reporting. While not all of the recent changes to performance reporting requirements necessarily directly impact ARC, they are changing the amount of money that some future ARC programs’ co-funders receive, how those funds can be used, and the extent to which training providers will need to institute required performance reporting and data collection efforts to determine outcomes and impacts. Furthermore, to the extent that ARC grantees are indirectly receiving federal funding, they are now required to collect and report performance data.
This evaluation is timely as it provides an opportunity view ARC’s projects in light of these other requirements just as they are being implemented. Drawing on our reading of the literature and a review of ARC project documents, we have developed a conceptual framework that graphically illustrates how a trainee might advance through a vocational education or workforce training program. The framework provides a visual mechanism for understanding many of the dimensions we will use to describe the study sample: • The status of beneficiaries (i.e., age and job
experience) maps roughly to the participant box.
• Mediating factors, such as community context, grant recipient, funding, and industry, can be determinants of the types of services that are provided.
• The various industries served can determine the training, career services, and specific skills and degrees or credentials obtained.
• The project components in place and the different types of services map to the activities discussed.
• The flow chart concludes with outputs and outcomes, including projects’ immediate skills-oriented goals, obtaining degrees or credentials, employment-oriented goals, and community impacts.
The model also shows that the training process is an iterative one, where a participant may progress through multiple training programs over the life of his or her career.

v
PROJECT CONTEXT Study findings suggest that projects are serving some of Appalachia’s most geographically isolated and disadvantage residents. One-third (33 percent) of Cohort 1 projects were located in nonmetropolitan areas, compared with over half (56 percent) of Cohort 2 projects. In addition, about one-third of projects were serving at least one distressed county. Community groups that were targeted generally reflected ARC’s goal of serving those most in need. ARC awards are intended to be used in conjunction with funds from other sources, such as local or state agencies, businesses, or foundations; the required match is based upon the economic status of the community within which the project is located. ARC grants in the study sample ranged from lows of about $15,000 to highs of near $900,000. Projects also varied in terms of the total financial resources that they had at their disposal—from lows of about $27,000 to highs well over $1 million. About half (48 percent) of Cohort 1 projects were serving primarily adults, and another third (33 percent) were serving primarily youth. In addition, Cohort 1 projects were primarily serving
those without full-time job experience (60 percent) and a combination of individuals with and without full-time job experience (28 percent). PROJECT ACTIVITIES With the possible exception of support services, all of the activities and project components in our conceptual framework for vocational and workforce projects were covered by the projects in the study sample. The vast majority of Cohort 1 projects (87 percent) reported purchasing, renting, or leasing various types of equipment with ARC funding, and almost half (45 percent) conducted activities around the construction, expansion, or leasing of a physical plant. Almost all projects (99 percent) conducted training activities, while 61 percent developed training materials, and 75 percent trained project staff. In addition, most projects provided job search assistance or career counseling (68 percent) and community-wide activities (64 percent), while only 31 percent provided support services. That ARC projects in both cohorts conducted training and acquired equipment in such vast numbers, and that the majority of projects were conducting other critical activities, suggest that ARC’s portfolio of vocational education and workforce training
Obtain Skills basic skills academic skills vocational/technical skills employability skills
Support Services child care assistance transportation assistance financial assistance referrals
Gain/Retain Initial Full-Time Employment
Improved Employment Status maintain current employment increase responsibilities earn promotion increase wages obtain/retain new jobs
Community Impacts viability/stability/growth of businesses economic/social viability of communities
Ameliorate Barriers increase access to transportation increase access to child care increase access to clothing/food/shelter
Job Search and Career Services career counseling job search assistance employability skills
Project Participants in school unemployed employed
youth adults
Program Components in Place equipment physical plant project staff training materials community awareness
Other Mediating Factors community context grant recipient funding industry
Classroom Training adult basic education academic vocational/technical employability
Worksite Training on-the-job training apprenticeship Obtain Degree/Credential
secondary degree or equivalent proficiency credential in conjunction with a secondary school diploma postsecondary degree/credential/ certificate
Context Activities Outputs and Outcomes

vi
projects provides adequate coverage of the activities represented in our conceptual framework. Nearly two-thirds (64 percent) of projects reported that they had no implementation problems, while 18 percent reported only one problem. The fact that so few projects indicated they face problems is indeed good news. It suggests that ARC grant reviewers are selecting appropriate projects to fund, and that the technical assistance by ARC staff is helpful. For all categories (except equipment, for which comparable data were not collected), ARC funding and the associated match supported a much smaller percentage of activities than did all sources of funding. This is an indication that the projects’ ARC funds are in fact doing—and leveraging—much more than may have been indicated in a grant application or final report. Thus, while ARC is funding what may be a small portion of a project, it should be recognized that, overall, projects seem to be providing the full range of services to their beneficiaries. This suggests that even when ARC is not directly supporting projects to provide a fuller range of services indicated in our conceptual framework, the projects are often providing those services with other sources of funding. This suggests that, in at least some cases, ARC provides some “last mile” funding for training and equipment, without which the projects might not exist. Almost all projects indicated that without ARC support, they would not have been implemented—or would have had to scale back the scope of their efforts. Only two projects (3 percent) felt that they would have been fully implemented using alternative sources. Conversely, just under half (45 percent) believed that their projects would never have been implemented without their ARC award. ACHIEVEMENT OF OBJECTIVES Projects appeared to have achieved most of their ARC-related objectives. Specifically, all of the Cohort 1 projects reported that they achieved at
least one of their objectives. In fact, the vast majority of the 67 Cohort 1 projects reported achieving all (45 percent), all but one (27 percent), or all but two (16 percent) of their objectives. Only six (9 percent) achieved fewer than half of their objectives. In addition, projects achieved 74 percent of the 281 objectives that they identified in their ARC proposals. However, some of the evidence appeared to be anecdotal or based on less than rigorous data collection activities. Cohort 1 projects were asked to estimate the number of individuals who had benefited at each stage as a direct or indirect result of their ARC grant in order to quantify the impact of ARC support at the project level. The range in the number of beneficiaries varied considerably across the projects. Projects estimated that as a result of the ARC grant, a median of four project staff received training, a median of 195 individuals received academic or vocational training, a median of 51 individuals received career counseling or job search/placement assistance, a median of 50 individuals obtained a degree or credential, and a median of 60 individuals obtained employment. These medians provide an approximation of the impact the projects are having, but because no examination of causality was conducted, we cannot suggest there is a correlation among the medians. PROJECT SUSTAINABILITY Most projects have sustained themselves beyond the ARC grant. Nearly half (49 percent) of the 67 Cohort 1 projects were operating at full capacity in the same way as during the ARC grant, and 30 percent were operating with a scope that had expanded either in the services provided or the number of participants served. The four projects that were no longer in operation and the 30 that had changed in some way since their ARC grant indicated dichotomous factors that contributed to the changes (expanded or reduced) in their projects. While some of these projects cited a loss of funding for continuation, others indicated that additional funding was available for additional services or participants.

vii
Whereas nearly half indicated an increased need for their services in the community and 41 percent found additional areas of need since grant inception that led to expansion, smaller numbers reported factors related to buy-in and need that reduced projects’ scope. These figures suggest that ARC vocational education and workforce training projects face relatively few barriers to sustainability beyond securing continuing funding. And indeed, while funding can lead to expansion, the needs of the community are truly driving project expansion. PROJECT OBJECTIVES AND DATA
COLLECTION ACTIVITIES In 1998, ARC implemented a new performance measurement system requiring projects to specify outputs and outcomes and encouraging them to discuss quantifiable results. Cohort 2 projects are relatively new; many are still open, and they were included in the sample to examine the changes in the quality of projects’ objectives. There has indeed been an improvement in the quality of outcomes identified by Cohort 2 projects over those of Cohort 1, which were identified before the changes in procedures. Specifically, a higher proportion of Cohort 2 projects contained a numeric outcome. In addition, a lower proportion of Cohort 2 proposals contained impractical goals—and Cohort 2 projects were more likely to describe a direct link between services and outcomes. This suggests that the steps ARC has taken to improve the quality of its applications have paid off. Many Cohort 2 projects are planning to collect at least some new data through a mail or telephone survey. However, few of the projects were planning to collect data 13 to 24 months after participants left the program—and none were planning to collect data more than 24 months after participants left the program. In addition, findings from the site visits suggest that some of these collections may be relying on imprecise methods. Only 22 percent of projects that were obtaining information on participants’ enhanced employment status (e.g., increased responsibilities, increased wages, or promotions) and 18 percent of
projects obtaining information on participants’ new employment were collecting data more than 12 months after participants left the project. This finding is significant, since it suggests that the majority of Cohort 2 projects that are promoting long-term employment achievements are not obtaining data that can be used to assess whether such gains have actually occurred. This is likely due to the fact that projects do not have the capacity and resources to collect longer term outcome data. Evaluation is not easy, nor can it be done without thorough planning. It is likely that these projects, while aware of the need to conduct evaluations, do not have the tools or knowledge to do them. And even when they are able to conduct effective short-term evaluations, project staff may not have built the capacity to continue the evaluation effort beyond the grant period. Thus, training, materials, and technical assistance may be a first critical step in developing evaluation capacity and improving project evaluations across all of ARC’s vocational education and workforce training projects. Indeed, ARC is likely facing this challenge across many of its projects in all areas of investment. This report—and these findings regarding project evaluation—represent a first step in improving ARC’s and funded projects’ evaluation capacity. Recommendations included in the next section suggest next steps. Further discussion is needed around the pros and cons of comprehensive evaluation strategies if ARC is interested in pursuing this avenue. RECOMMENDATIONS This report provides considerable evidence that the projects in the study sample succeeded in bringing about a series of educational and employment gains throughout Appalachia. What follows, therefore, is a series of recommendations designed to enhance ARC’s capability to promote the use of innovative practices in its projects, document successes, and provide technical assistance to its grant recipients. Realign the designations used to classify vocational education and workforce training

viii
projects. The ARC database includes multiple dimensions for categorizing vocational education and workforce training project types. However, survey findings suggest that these categories do not adequately reflect the range of activities that ARC is funding. Using the conceptual model described throughout this report, we have identified four alternative terms for categorizing ARC’s portfolio of vocational education and workforce training projects: • Career awareness—including general work
and employability skills, generally for middle school youth.
• Vocational education—typically run through high schools, including apprenticeship programs.
• Job placement training—training for unemployed adults, displaced workers, career changes.
• Workplace training—including retraining, skills upgrade for currently employed or underemployed adults.
Encourage applicants to use the conceptual model in developing their projects. The flow chart presented throughout this report can be a useful tool for helping grantees understand their own projects in relation to a “model” project. Disseminate information about best practices to prospective grantees. ARC should reinforce its procedures for disseminating information about innovative and successful projects (however innovation and success are to be defined) with its pool of applicants. Reinforce ARC’s reporting structure by enhancing the quality of the final reports that projects submit to ARC. We recommend that ARC mandate that uniform guidelines be used by all of its projects—with customized examples of outputs and outcomes for each of the Commission’s five strategic goals. Encourage ARC staff to update the project database uniformly. Requiring applicants to define quantitative outputs and outcomes in their
proposals (see below) might compel ARC staff to regularly update the database structure used to track projects’ objectives. This information could then be used to monitor individual projects and assess trends across similar types of projects. Require that all applicants quantify at least one output and at least one corresponding outcome. The finding that almost all Cohort 2 projects identified at least one numeric outcome suggests that it would be possible to impose this requirement on all future vocational education and workforce training projects. We believe that most of the vocational education and workforce training projects that ARC funds should be able to specify the number of individuals who will participate in a given activity and the number of individuals who will ultimately attain a specific outcome as a result of their participation in that activity. There is an inherent danger that by reducing projects’ expectations to a set of numbers, ARC will ultimately lose the broader statements of how the circumstances of Appalachian citizens will be improved. These statements provide projects an important opportunity to describe how their efforts might eventually impact both individuals and the community at large. We therefore suggest that ARC view this recommendation as an enhancement to—as opposed to a replacement of—the narratives that applicants are currently required to provide in their proposals. We must also caution against reducing all vocational education and workforce training projects to a uniform progression of outcomes that culminate with obtaining employment. Some types of vocational projects are not intended to have an immediate impact on employment status. Develop application materials for each project type. As we suggested in the education report, ARC should consider developing separate guidelines (or supplemental materials) that provide more specific examples of the types of outputs and outcomes that pertain to each of its strategic goals. Meet with other federal agencies to better understand their funding and reporting structures. A primary purpose of such interagency collaboration would be to determine whether there are ways that ARC could piggyback

ix
off of the data collection requirements of other agencies supporting vocational education and workforce training projects. Assess the extent to which the states share common reporting requirements for these projects. The primary purpose would be to ascertain whether there is a useful common core of vocational education and workforce training data that are being mandated by some or all of the 13 states that compose Appalachia. A secondary purpose would be to identify useful data efforts underway in any of the 13 states that might be adapted by other states. Provide written materials on high-quality evaluation practices. ARC should provide applicants and grant recipients with written materials that describe suitable evaluation practices. Such materials can help guide projects through their own evaluations by highlighting data collection and analysis methodologies, identifying typical pitfalls in evaluation, and describing good reporting practices. Reinforce the importance of data collection methodologies by including evaluation as a project approval criterion. ARC could ask applicants to specify the data collection activities in their applications that will be conducted in support of each numeric output or outcome in a proposal. Provide additional evaluation training to project grantees. In addition to offering training to LDDs and state-level program managers, ARC could offer evaluation workshops to grant recipients. This would help to assure that methodologies are properly selected and applied, assuring that evaluations are conducted in a cost-effective and reliable manner, displaying data in a meaningful and useful manner, interpreting and using data, and preparing effective evaluation reports. Provide additional evaluation training to staff. It is likely that ARC staff would benefit from receiving training in this area since it would enhance their capacity to (1) assess whether an application adequately addresses how data will be collected and used, (2) provide technical
assistance to projects that appear to be having difficulty obtaining credible and reliable data, and (3) use projects’ data to address Government Performance and Results Act (GPRA) reporting requirements. Provide project grantees with technical assistance in data collection methodologies. Finally, ARC staff should take a more proactive approach in assuring that individual projects are positioning themselves to collect data about immediate and long-term outcomes. Encourage project grantees to hire external evaluators. This approach would maximize the likelihood that projects would have access to expertise and assistance in their evaluations. The Commission might consider offering financial incentives to those grant recipients that include in their proposals a plan for using external evaluators to collect long-term outcome data on their participants. CONCLUSIONS Throughout this evaluation, the success of ARC’s vocational education and workforce training projects has been evident. The most critical finding that cuts across all of the projects is that projects understand the needs of and maintain close ties with local business and industry. Local communities provide the impetus for projects, the individuals who need and provide training, the jobs that trainees may obtain, and the energy that creates the local economic development to improve the regional economy. That most ARC projects originate with the needs of the local community and culminate with improvements in the community is the real strength of the program. ARC’s greatest challenge is to assist projects in targeting local and regional industry demands and to develop programs that adequately match the labor market needs with communities’ strengths. Together, these findings and recommendations can help enhance ARC’s functioning and the benefits it bestows on the Appalachian region.

1
Introduction
Within the context of large-scale policy changes in the goals, resources, and implementation of national vocational education and workforce training programs, the Appalachian Regional Commission (ARC) directs a relatively small grants program aimed at these same issues. As government performance reporting requirements for nationwide vocational education programs are increased, the Commission is focusing on evaluating the implementation and achievements of its projects, as well as the parallel performance reporting systems they employ, to improve the program overall and its individual projects. This report summarizes findings from an evaluation of vocational education and workforce training projects funded by ARC between 1995 and 2000. APPALACHIA: A REGION IN TRANSITION Appalachia is an area that is undergoing significant changes in its social and economic well-being, yet it continues to lag behind the rest of the nation in education and income. Decades ago its economy depended on industry, agriculture, and mining; today, human capital and the service sector are growing more critical to economic growth. And like the much of the nation, information technology is becoming increasingly important. Furthermore, while some areas within the region have made substantial strides, others have shown only limited progress. Measures such as the number of persons living in poverty, high school completion rates, employment rates, and job growth rates are but a few of the indicators that illustrate the gaps that exist between the citizens of Appalachia and the overall population of the United States. With poverty rates continuing to decrease and educational attainment and employment rates
continuing to grow, the gap is narrowing. However, there remains much work to do. Going beyond these simple indicators, it is clear that if the region is going to become a vital player in the 21st century, its people must attain the new skills required to be successful in the changing world economy. Students must not only graduate high school, but they must be literate in mathematics, science, and technology. They must be able to go beyond the attainment of basic skills to solve challenging problems, to use new tools for solving these problems, and to work with others across the region, the nation, and the world. The region must rely upon human capital to adjust its labor markets and productivity, and human capital development is dependent upon the strength of its workforce training and vocational education programs. THE APPALACHIAN REGIONAL COMMISSION ARC was created in 1965 to promote economic and social development in the region. It is a federal-state partnership designed to help the region help itself by creating self-sustaining economic development and improved quality of life. As such, the agency functions as a catalyst, drawing upon the resources of the federal government, the participating states, and local resources, be they individuals, public agencies, or private organizations. Although considerable progress has been made in its more than three decades, the ARC Strategic Plan: 1997-2002 identifies five key areas of remaining need: • Developing a knowledgeable and skilled pop-
ulation;
I.

2
• Supporting the region’s physical infra-structure;
• Promoting community and civic leadership;
• Creating a dynamic economic base; and
• Fostering healthy people.
The current evaluation addresses two of these areas: developing a knowledgeable and skilled population and creating a dynamic economic base. The stated objectives for the first goal in the strategic plan are (1) increasing the percentage of workers receiving basic education and skills training, skills upgrading, and customized training, which will lead to development of a workforce that is competitive in the 21st century world economy, and (2) increasing the percentage of students participating in school readiness, dropout prevention, school-to-work transition, and GED programs, thereby raising the college-going rate and preparing students for the world of work in the 21st century. Moreover, with improved student achievement and workforce readiness comes productivity improvements in the workplace. These labor market outcomes, along with better business attraction and creation rates in targeted industries, work together to foster a dynamic and improved local economy. To accomplish these five strategic goals, ARC provides financial and technical support to local, regional, and multistate projects through its Area Development Programs. The process for awarding these grants reflects the underlying partnership between the Commission and participating states, as well as the need to give local communities a voice in determining how ARC funds are to be allocated. Within each state, local development districts (LDDs) provide for grassroots-level participation, so that ARC activities originate from—and ultimately benefit—the communities themselves. Each year, the 13 states of Appalachia prepare individual annual strategy statements and spending plans. These documents contain state-level goals (which are aligned with ARC’s five strategic
goals) and corresponding proposals for each of the specific projects that are being recommended for funding. In some states, these initiatives are developed to reflect state priorities. In others, applicants submit proposals based on needs identified in their local communities. Once approved by the governor, a state’s recommendations for project funding are submitted to ARC. Each proposed project is then reviewed by ARC project coordinators and, in most cases, approved by the federal co-chair. A limited number of projects originate and are funded each year directly through the Commission and ARC set-asides. Project coordinators can negotiate changes to the proposed project with state program managers. Until recently, these adjustments primarily reflected changes to timetables and budgets. Program Changes Over the past several years, ARC has made some changes to its application, proposal review, and program monitoring processes. First, program staff developed a workbook for state program managers and applicants with the intent of collecting more complete application packages. By providing examples of outputs and outcomes, they hoped to encourage prospective projects to be mindful of these concepts when designing their implemen-tation plans and to identify specific outputs and outcomes in their grant proposals. Indeed, applicants are now required to specify outputs and outcomes and the degree to which these extend beyond the life of the grant. Applicants are further encouraged to discuss quantifiable results of the proposed projects. Second, staff provided a Grant Administration Manual that describes what should be included in a project’s quarterly progress reports and final report. The manual includes sample formats and examples of how output and outcome measures can fit into the narratives. Program staff are also taking a greater role in negotiating with states and projects to improve the quality of the projects by improving the substance of outputs and requiring that outcomes be more specific. Most recently, ARC staff have begun making site visits to a

3
sample of projects 2 years after the end of their grant period. These validation visits are designed to assess whether projects actually achieve their longer term outcomes. The evaluation is intended to provide both a look at what has been accomplished to date and specific recommendations for addressing this key area in the future. It is an evaluation of the progress achieved through the supports provided by ARC over the last decade and of a work in progress. Because findings and recommendations drawn from this evaluation are reflective of a program that has changed, we do not attempt to generalize these findings to the current system. The next section discusses the purpose of this evaluation in greater detail. STUDY OVERVIEW In the late 1990s, ARC began a systematic review of its portfolio of funded projects. This study of vocational education and workforce training projects—conducted by Westat, a Rockville, Maryland, research firm—follows a similar study conducted in 2000 of ARC’s educational projects; it builds upon the methodology and understanding of the ARC context from the previous study. The study sample comprises 92 projects funded by ARC during the latter half of the 1990s and 2000. In an effort to examine how recent program changes have affected projects’ objectives and data collection practices, the study was conducted with two cohorts of grant recipients. Cohort 1 is composed of 67 projects that were funded between 1995 and 1999, before the change was made, while the 25 Cohort 2 projects were funded in 2000, after the change was made, and were still active at the time the study was being conducted. Study Questions ARC delineated four primary objectives for the evaluation: (1) assess the extent to which projects were able to accomplish their anticipated outcomes; (2) benchmark project activities and accomplishments against current national studies
of workforce training and vocational education efforts; (3) assess the utility and validity of specific performance measurements that might enhance ARC’s ongoing capacity to monitor and evaluate its workforce training and vocational education projects; and (4) make other policy recommendations that can improve ARC’s efforts to monitor and assist its workforce training and vocational education projects. In an effort to ensure that the evaluation addressed each of these objectives in a comprehensive manner, we identified seven primary, interrelated research questions that guided the study: • What are the characteristics of communities
and individuals who benefited from the projects?
• What problems were projects designed to address?
• What approaches did projects use to ameliorate these problems?
• What specific outcomes were projects designed to achieve?
• To what extent have projects accomplished their objectives?
• What factors influenced projects’ ability to implement their approaches and achieve their objectives?
• What performance reporting systems are projects utilizing and how could these benefit the ARC?
The evaluation employed both qualitative and quantitative techniques that addressed all of the study’s outcome and process questions in various depths and to different degrees. The approach included the following integrated activities. Qualitative techniques: • A review of the literature regarding workforce
training and vocational education and data collection requirements for these types of projects. Related to the literature review, we have talked informally with recipients and
4
evaluators of other federal vocational education funding. These conversations contributed to the development of the mail survey and site visits and informed our recommendations to the Commission.
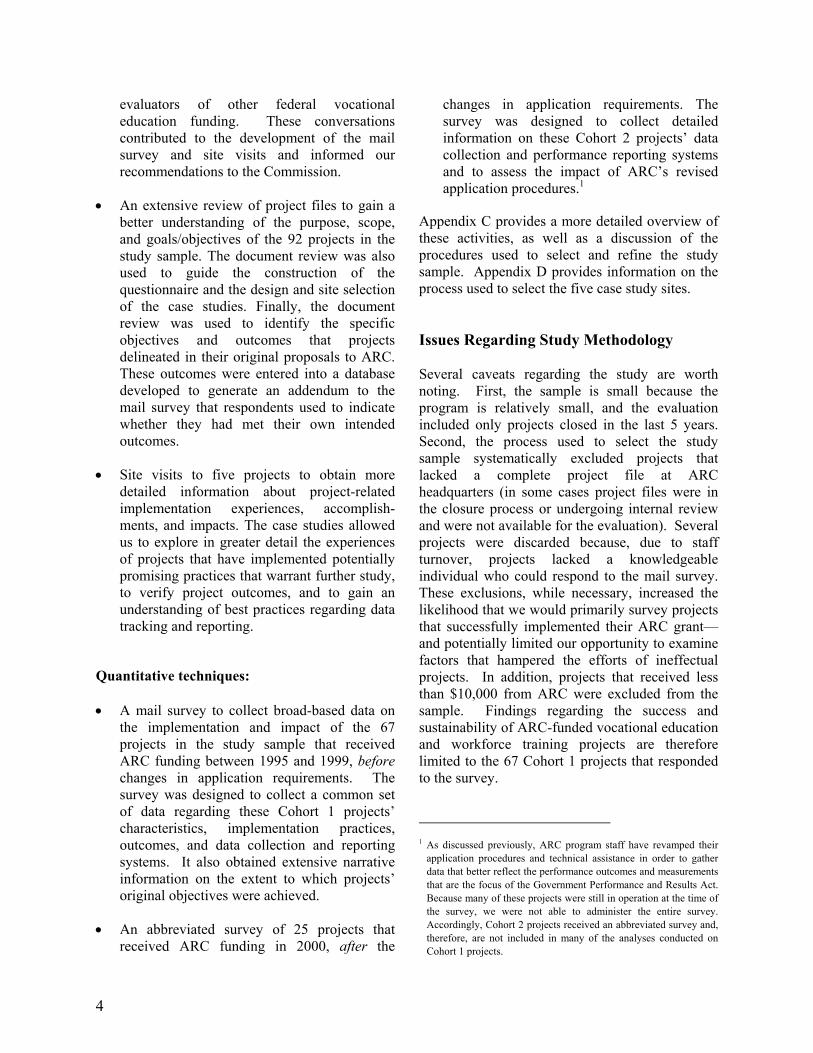
• An extensive review of project files to gain a better understanding of the purpose, scope, and goals/objectives of the 92 projects in the study sample. The document review was also used to guide the construction of the questionnaire and the design and site selection of the case studies. Finally, the document review was used to identify the specific objectives and outcomes that projects delineated in their original proposals to ARC. These outcomes were entered into a database developed to generate an addendum to the mail survey that respondents used to indicate whether they had met their own intended outcomes.
• Site visits to five projects to obtain more detailed information about project-related implementation experiences, accomplish-ments, and impacts. The case studies allowed us to explore in greater detail the experiences of projects that have implemented potentially promising practices that warrant further study, to verify project outcomes, and to gain an understanding of best practices regarding data tracking and reporting.
Quantitative techniques: • A mail survey to collect broad-based data on
the implementation and impact of the 67 projects in the study sample that received ARC funding between 1995 and 1999, before changes in application requirements. The survey was designed to collect a common set of data regarding these Cohort 1 projects’ characteristics, implementation practices, outcomes, and data collection and reporting systems. It also obtained extensive narrative information on the extent to which projects’ original objectives were achieved.
• An abbreviated survey of 25 projects that received ARC funding in 2000, after the
changes in application requirements. The survey was designed to collect detailed information on these Cohort 2 projects’ data collection and performance reporting systems and to assess the impact of ARC’s revised application procedures.1
Appendix C provides a more detailed overview of these activities, as well as a discussion of the procedures used to select and refine the study sample. Appendix D provides information on the process used to select the five case study sites. Issues Regarding Study Methodology Several caveats regarding the study are worth noting. First, the sample is small because the program is relatively small, and the evaluation included only projects closed in the last 5 years. Second, the process used to select the study sample systematically excluded projects that lacked a complete project file at ARC headquarters (in some cases project files were in the closure process or undergoing internal review and were not available for the evaluation). Several projects were discarded because, due to staff turnover, projects lacked a knowledgeable individual who could respond to the mail survey. These exclusions, while necessary, increased the likelihood that we would primarily survey projects that successfully implemented their ARC grant—and potentially limited our opportunity to examine factors that hampered the efforts of ineffectual projects. In addition, projects that received less than $10,000 from ARC were excluded from the sample. Findings regarding the success and sustainability of ARC-funded vocational education and workforce training projects are therefore limited to the 67 Cohort 1 projects that responded to the survey.
1 As discussed previously, ARC program staff have revamped their
application procedures and technical assistance in order to gather data that better reflect the performance outcomes and measurements that are the focus of the Government Performance and Results Act. Because many of these projects were still in operation at the time of the survey, we were not able to administer the entire survey. Accordingly, Cohort 2 projects received an abbreviated survey and, therefore, are not included in many of the analyses conducted on Cohort 1 projects.

5
Third, and similarly, the site visit findings reflect a purposefully selected segment of the study sample. By conducting the mail survey prior to selecting case study sites, we were able to use preliminary survey findings to select potential case study sites. The pool of potential sites included those that had achieved some of their intended outcomes, appeared to have in place a well-planned, complete, or innovative data collection system, and had sustained themselves over time. As such, any conclusions drawn from the site visits may not pertain to the overall study sample. Fourth, we initially planned to disaggregate all survey findings by the project characteristics discussed in Chapter 3. However, after reviewing the data, we found that there were very few noteworthy findings uncovered by these analysis, due in large part to a small sample size, particularly when exacerbated by the small cell counts that occurred when survey responses were divided according to a variety of project characteristics. Typical statistical standards require a sample size of at least 100 and cell sizes of at least five, but preferably ten or more cases, to conduct the more powerful analyses. Additionally, many of the project characteristics were correlated or even overlapping (e.g., projects serving youth, projects serving adults, and projects serving both youths and adults), making the data not appropriate for high-level, complex regression analyses. In addition, there may simply be few differences in project implementation and outcomes based on these characteristics. Nonetheless, we do point out some noteworthy findings and refer the reader to the appropriate table in Appendix A. Given the small sample size, it should be noted that we are largely speculating on these findings and have not conducted tests of statistical significance. Finally, the RFP requested an analysis of the extent to which grantees were complying with other federal and state performance reporting systems. Survey data suggest that in most cases, if projects are participating in other systems, staff are not aware of it. Similarly, other federal programs are structured, funded, and managed very differently from ARC’s program, making comparisons of performance data inappropriate.
In addition, a lack of comparable outcome data precludes such comparisons. STRUCTURE OF THE REPORT The remainder of the report provides the substantive findings from the evaluation. These results are organized as follows: • Chapter 2—History and Background of
Vocational Education and Workforce Training
• Chapter 3—Projects’ Context
• Chapter 4—Project Activities
• Chapter 5—Achievement of Objectives
• Chapter 6—Project Sustainability
• Chapter 7—Project Objectives and Data Collection Activities
• Chapter 8—Summary and Recommendations
• Appendix A—Additional Survey Data
• Appendix B—Evidence in Support of Projects’ Outcomes
• Appendix C—Technical Approach
• Appendix D—Case Study Methodology and Reports
• Appendix E—Project Descriptions
• Appendix F—Cohort 1 Mail Survey
• Appendix G—Cohort 2 Mail Survey

7
The ARC Evaluation in the Context of the History and Status of Vocational Education and Workforce Training
With increased policy activity in the fields of vocational education and workforce training over the past decade, as well as the introduction of new performance reporting requirements, ARC requested an evaluation that would place its projects within the context of other federal workforce development programs and benchmark data collection reporting systems against those for other federal agencies. In this chapter, we discuss the history and status of vocational education and workforce training across the country, particularly as they relate to issues of accountability and performance monitoring. We also provide a general discussion of where ARC fits in to this sector and a conceptual framework for considering these projects. HISTORY AND BACKGROUND With a new administration just beginning, it is possible to reflect on recent history but difficult to predict the future of the existing programs. Nonetheless, an understanding of vocational education’s origins is instructive. Early Developments Early vocational education grew out of economic viability concerns in the early part of the century. The Smith-Hughes Act of 1917 provided federal support for vocational education aimed at preparation for specific jobs, with the intent of supporting the national economy. Despite John Dewey’s arguments that requiring such early vocational decisions limited students’ opportunities in the future, traditional vocational education made its way into classrooms and persisted for most of the century.
Vocational education students and facilities were supported during World War II for their contribution to the national effort, and then weathered criticism during the 1950s and early 1960s for less-than-convincing findings on its tendency to track children by race/ethnicity, class, or ability. Vocational education survived this period and, in fact, expanded with the advent of area vocational schools and training programs for displaced and unemployed persons. In 1963, the Vocational Education Act was signed into law, to be followed by successive versions, the Carl D. Perkins Vocational Education Act of 1984 and its two successors in 1990 and 1998. During the 1960s and through the 1970s, work-force development movements began. In an effort to combat poverty and unemployment, the Department of Labor mounted several manpower programs, including the Manpower Development Training Act (MDTA) of 1962, to provide short, job-specific training for those for whom formal schooling was not successful (Grubb, 1985; Grubb et al., 1999). Services were provided outside the formal education system, typically by community-based organizations. These early programs were consolidated into the Comprehensive Employment and Training Act (CETA) of 1973 and then reorganized into the Job Training Partnership Act (JTPA) of 1981. At the same time, a parallel development of programs and services for welfare recipients was taking place. Beginning as the 1962 Work Experience and Training Program and others related to the Social Security Administration in the late 1960s, this strategy provided transportation and child care services so that welfare recipients could find employment. Several early welfare-to-work programs and the Job Opportunities in the Business Sector (JOBS) program of the Family Support Act of 1988 provided for job training, work experience, remedial education, and other support services.
II.

8
The Personal Responsibility and Work Opportunities Reconciliation Act of 1996 under the Department of Health and Human Services imposed new requirements to move people off welfare, including limiting years of eligibility. During this period, several programs were also established by the Department of Housing and Urban Development, the Employment Service, and Unemployment Insurance, in addition to a number of programs in each state, particularly those eligible for federal matching funds under Aid to Families with Dependent Children (AFDC) and Temporary Assistance to Needy Families (TANF). The New Vocationalism Over the past couple of decades, change in the field of vocational education and workforce training—and the associated proliferation of programs—has been continual, but more incremental than at present. A Nation at Risk (National Commission on Excellence in Education, 1983), a blue-ribbon panel report that captured the public’s attention unlike any previous publication in the field, contended that the country was at risk of being overtaken as an economic and political power because educational standards had been allowed to deteriorate. Reaction came quickly, as almost all states increased the number of credits in the core academic subjects required for high school graduation, and over half established mandatory testing programs. One effect of the move to higher academic standards was a decline in vocational program enrollments at the high school level (NAVE Independent Advisory Panel, 1994a, 1994b). To stem this decline, the vocational education community responded with a series of reports that sought to position vocational education as being capable of meeting the high standards demanded by school reformers. Among them were The Unfinished Agenda, a counterproposal to A Nation at Risk that was prepared by another blue-ribbon commission (National Commission on Secondary Vocational Education, 1984), and An Untold Story (Copa et al., 1985). These publications were among those ushering in the age of “new
vocationalism” in the United States, as the goals of vocational education were being expanded to resonate with the dominant academic ideology of schooling. Evaluation, Accountability, and Performance Indicators Never in history has the evaluation of educational programs received more attention than today, and it is anticipated that congressional concern over the operation and accountability of career and technical education programs will not abate any time soon. However, initiatives requiring states to conduct evaluations have been included in federal legislation regarding vocational education for the last four decades. One of the first examples was the 1963 Vocational Education Act (VEA), which mandated that vocational educators conduct followup studies of their graduates to determine the degree to which they found placement in jobs related to their training. The Vocational Education Amendments of 1968 continued to emphasize state evaluation activities, as state advisory councils for vocational education, in addition to state education agencies, were given responsibility for evaluation. The Vocational Education Amendments of 1976 further expanded the states’ responsibility for evaluation, focusing on the responsiveness of vocational education to changing labor markets and requiring states to evaluate their programs every 5 years. These evaluations were designed to determine the extent to which (1) program completers and leavers found employment in occupations related to their training, and (2) their employers considered them to be well trained and prepared for employment. In the early 1980s, there was notable concern about how VEA funds should be distributed between the secondary and postsecondary sectors. Given the increasing emphasis on accountability, it became necessary to ensure that adequate funding was provided across training programs in proportion to the respective needs of the populations being served, the level and extent of the education and training being provided, and the goals and objectives each was trying to

9
accomplish (Hoachlander & Nyre, 1981; Nyre et al., 1982). The original Perkins Act (Carl D. Perkins Vocational Education Act of 1984) charged states with developing measures for determining the effectiveness of vocational training programs. These measures related to the labor market of the state, the level of skills to be achieved, and the basic employment competencies needed to meet the needs of employers. Nyre (1985, 1986) conducted a comparative analysis of several vocational education and training programs in California for this purpose and found that employers were more satisfied with new hires who had been in less formal and more focused programs.2 Perkins II, in 1990, required states to develop core standards and measures of performance for secondary and postsecondary vocational education programs.3 These performance measures were to include measures of learning and competency gains, and had to contain one or more measures of competency attainment, job or work skill attainment, retention in or completion of school, and placement into additional training or education, military service, or employment. The intent of the School-to-Work Opportunities Act of 1994 was to build upon and advance a range of promising activities, such tech-prep education, career academies, school-to-apprenticeship programs, cooperative education, youth apprenticeship, school-sponsored enter-prises, and business-education compacts. It was designed to improve the knowledge and skills of youths by integrating academic and occupational instruction, integrating school-based and work-based learning, and forging effective partnerships between various levels of education and training and business and industry.
2 The Nyre study compared participant completion records and
employer satisfaction with completers of programs offered by the California Community Colleges, the Comprehensive Employment Training Act, the Job Training Partnership Act, and the California Worksite Education and Training Act.
3 The Job Training Partnership Act, in 1982, was the first program in the employment and training arena to adopt a system of performance measures and standards.
School-to-Work (STW) has been an important catalyst for accountability in vocational education—partly because it became a politically polarizing piece of legislation, and partly because its emphasis on the integration of vocational and academic instruction brought renewed scrutiny on vocational education from educators who had heretofore marginalized it. According to the Act, federal investment was to “jump-start” the process, and the states were to leverage other federal, state, and local resources to sustain it. The legislation is scheduled to sunset in 2001, and it is very unlikely that it will be renewed.4 Since 1993, performance measurement has been mandated for federal agencies. The Government Performance and Results Act (GPRA) of 1992 holds federal agencies and, by extension, federally sponsored projects accountable for achieving program results and requires them to clarify their missions, set program goals, and measure performance toward achieving those goals. The process consists of five phases: developing strategic plans, creating indicators, developing a data measurement system, refining performance measures, and implementing management practices in support of the system (U.S. General Accounting Office, 1996). According to Hoachlander (1991), in order for performance-based operations to be effective, four constructs must be evident: (1) it must be possible to clearly define desired outcomes; (2) it must be possible to measure those outcomes accurately and efficiently; (3) measures of performance must affect levels of funding; and (4) useful information on outcomes must be made available.
4 While the STW legislation has now sunset, some states are still
receiving funds, since STW grants are for 5 years and some did not get grants (or renewals) until 3 years ago. Some other states have “carry-over” funds for another year, and several are continuing their efforts with state funds.

10
OVERVIEW OF DATA COLLECTION
REQUIREMENTS FOR FEDERAL
WORKFORCE AND VOCATIONAL
PROGRAMS The interrelated Workforce Investment Act of 1998 (WIA) and the Carl D. Perkins Vocational and Technical Education Act of 1998 (Perkins III) were signed into law on August 7 and October 31, 1998, respectively. These two Acts, which took effect on July 1, 1999, are having a major impact on the shape and nature of the nation’s education and workforce investment systems. Their implementation requires collaboration at the federal, state, and local levels to create a more comprehensive, customer-focused workforce investment system. They both also call for greater state and local accountability and reporting requirements.5 Section 501 of the WIA enables states to submit to the U.S. Department of Labor unified plans in which as many as 16 separate federal vocational education and training programs may be linked to one another to maximize joint planning and coordination, and to create new, comprehensive workforce investment systems. The intent is to streamline services, empower individuals, integrate and coordinate services, provide flexibility, and encourage universal access through a variety of programs administered by the U.S. Departments of Agriculture, Education, Health and Human Services, Housing and Urban Development, and Labor. Perkins III and WIA together promote the development of a seamless education and workforce development system, with integrated, “one-stop” service delivery at the state and local levels. Early findings from Westat’s Study on the Funding and Accountability of Perkins III suggest that the accountability systems are not as integrated across federal agencies as intended (personal communication with study director).
5 Failure to meet state-level performance standards could eventually
result in a state’s loss of Perkins III funds. At the same time, Section 503 of the WIA provides incentive grants to states that exceed performance levels under Perkins III.
Perkins III also calls for the establishment of state accountability systems that must contain, at a minimum, the following four core indicators of performance: • Student attainment of challenging state-
established academic, vocational, and skill proficiencies;
• Student attainment of a secondary school diploma or equivalent, a proficiency credential in conjunction with a secondary school diploma, or a postsecondary degree or credential;
• Placement in, retention in, and completion of postsecondary education or advanced training, placement in military service, or placement or retention in employment; and
• Student participation in and completion of vocational and technical education programs that lead to nontraditional training and employment.
Several differences between Perkins II and Perkins III demonstrate the extent to which state and local agencies are being provided with more flexibility and control over funding allocations: • Previous set-asides for single parents,
displaced homemakers, pregnant teenagers, and gender equity coordinators have been eliminated. These categories have now been added to the definition of “special populations.”
• There is no longer a targeting requirement to a limited number of sites or to a limited number of program areas based on special population prioritization.
• A new local secondary funding formula takes effect, with less emphasis on the proportion of students with disabilities than previously.
• No funds may be used to provide vocational and technical education programs to students prior to the seventh grade.

11
• A state performance accountability system to assess the effectiveness of the state in achieving statewide progress in vocational and technical education must be established.
• A portion of funds at the local level must be used to develop and implement evaluations of vocational and technical programs, including an assessment of how and the extent to which the needs of special populations are being met.
While not all of these changes necessarily directly impact ARC, they are changing the amount of money that some future ARC programs’ co-funders receive, how those funds can be used, and the extent to which training providers will need to institute required performance reporting and data collection efforts to determine outcomes and impacts. Furthermore, to the extent that ARC grantees are indirectly receiving federal funding, they are now required to collect and report performance data. However, as is discussed later, findings from the study suggest that many grantees may not be aware that some of their data collection activities are federally mandated, or that their data collections are part of a larger entity. In addition, certain local coordinating bodies are in the process of changing their names and foci. For instance, in many areas Private Industry Councils (PICs) are being replaced by Workforce Investment Boards (WIBs) and will likely be composed and/or operate differently than their predecessors. Since the WIBs are intended to deal with a much broader employment and training agenda than most PICs did in the past, Youth Councils have been created as a part of the WIBs in order to ensure that the historic “youth focus” of the PICs is not lost in this transition. The extent to which ARC grantees and local development district personnel interact with and influence the deliberations and actions of these new entities will determine the nature, quality, and viability of future ARC and other training programs. The larger issues regarding funding and accountability that this evaluation addresses are fraught with sensitivities that both program providers and researchers must acknowledge. Many reasons exist for the performance
accountability thrust of recent legislation, but two goals are crucial: (1) to determine the impact of federal funds and justify their continued appropriation, and (2) to provide benchmarks that can be used to negotiate future performance improvement targets with the states, which will, in turn, negotiate with local schools, vocational education centers, community and technical colleges, and other workforce training programs. Again, how these fare in the new administration remains to be seen. Thus, what emerges is an accountability system premised on indicator data collected in thousands of training programs across the country. Data are to be collected at the local level and then aggregated at larger system levels, which presents a challenge to ARC grantees and others. For example, differences between various levels of vocational training result in different data collection procedures in the systems. The use of unit record data systems is widespread among postsecondary institutions and state higher education agencies. This permits tracking of individual students, which facilitates an analysis of outcomes. Further, the federal government and higher education organizations such as the State Higher Education Executive Officers and the Association for Institutional Research have collaborated to move toward greater uniformity in the collection and reporting of data across institutions. Though still not a mature system, performance and accountability data for many community and technical colleges can be prepared with less difficulty than is the case in most K-12 systems. At the K-12 level, many states do not maintain unit record data systems, and some that do focus their efforts on the distribution of state funds, their data are therefore not useful for analytic purposes. At the outset of the evaluation, we knew relatively little about the capacity of local vocational education and workforce training programs to collect requisite outcome data. We knew even less about successful uses of such data at the local level to improve programs. As is discussed later, a purpose of this evaluation was to gain a better understanding of these data (and their limitations)

12
so as to enhance ARC’s capacity to use indicator data to make important policy decisions.6 Important groundwork that could inform ARC’s future efforts was laid by a study of data quality and alignment conducted in 1997 and 1998 by MPR Associates and the Academy for Educational Development for the National School-to-Work Office (Medrich and White, 1999). That study examined state and local capacity to provide the kinds of data identified in the School-to-Work Opportunities Act. It also explored the dynamics and tensions that come into play when one unit of governance (e.g., a school, a specific training effort, or an overall program such as ARC) is asked to provide data to meet the needs of another (e.g., a federal agency’s response to congressional reporting mandates). Results of the MPR/AED study confirmed—and our evaluation supports—the finding that federal, state, and local officials have different data needs, wants, and interests, based largely on the circumstances and contexts within which they operate. Field interviews revealed a particularly dramatic disparity between federal perceptions of the difficulty of gathering specific data and local experiences in trying to gather that data. ARC’S FIT INTO THE FIELD With fiscal year 2001 federal outlays for vocational education and workforce training reaching $7 billion and states providing additional funding, ARC’s FY2001 contribution of $3.3 million may seem small. However, this ARC funding, in addition to the funding leveraged by grantees, fills some critical needs in the field. Funding for vocational education and workforce training is directed primarily toward equipment purchases, with small amounts going to program improvements and staff development. This is because, for the most part, these funds are seen as temporary or as one-time infusions of money. Program managers are reluctant to establish a new 6 However, while we have learned much about states’ and localities’
ability to gather these data, we have learned little about the specific outcomes of these other programs. Because they are structured, funded, and managed very differently than ARC’s program, obtaining comparable outcome data is difficult.
program and use these funds for ongoing operations when they might not be available in future years to sustain the program. Moreover, vocational programs start out at a financial disadvantage for two reasons. First, equipment for academic programs typically is supported by regular state or local funds distributed to schools. Second, industrial and technical equipment costs more than textbooks, leaving training programs with perpetually short budgets. And as technology advances, equipment is becoming more rapidly outdated, requiring more and more frequent infusions of funding to continue programs. (Issues of equipment obsolescence are addressed in Chapter 7.) Finally, Perkins III established a minimum allocation that individual institutions or consortia of institutions can receive ($15,000 for secondary institutions and $50,000 for postsecondary institutions); that is, institutions cannot receive funding in amounts smaller than these. Since funds are distributed within states by formula according to student enrollment, poverty status, and Pell grant eligibility, some institutions or consortia are too small to receive the minimum allocation and therefore receive nothing at all.7 While there are provisions for reserve funds to be distributed to small institutions, states have the discretion to use them or not. The result can be that small, rural areas no longer receive federal vocational education funding at all. This has left some areas with no new funds for equipment and other program enhancements. For these reasons, ARC has found a niche in vocational education and workforce training. ARC grants fill gaps left by local, state, and federal funding streams. Even as the new administration makes its mark on the field, this niche is certain to remain.
7 For example, if an institution has a very small enrollment, low
numbers of high-poverty students, or too few Pell grant-eligible students, the formula may make it eligible for $30,000. But because this is well below the $50,000 minimum allocation, the institution would not receive anything. The legislation is intended to make grants that are sufficient in size to make a genuine impact. However, it is not clear that these amounts are the “right” minimum amounts.

13
Framework for Understanding Vocational Education and Workforce Training Projects Drawing on our reading of the literature and a review of ARC project documents, we have developed a conceptual framework that graphically illustrates how a trainee might advance through a vocational education or workforce training program. Exhibit 2-1 presents a trainee’s—and a vocational program’s—progression from immediate to long-term goals and from skill-oriented goals to employment-oriented goals to community impacts. Regardless of whether trainees are in school, unemployed, or employed, they would begin with some type of training program with various components in place, such as equipment and a physical plant, project staff, training materials, and community awareness, and various other mediating factors, such as the community, grant recipient, funding, and industry, affecting the program. The trainee might also require various support services (e.g., arranging child care) and job search or career services. These combinations of services could lead to obtaining skills, obtaining a degree or credential, and/or gaining employment or improving employment status. At some point, the trainee might return to the beginning of the cycle for retraining. Ultimately, the community would benefit with more qualified employees and enhanced economic viability. This framework provides a visual mechanism for understanding the context, activities, and outputs and outcomes we will use to describe the different types of projects in Chapters 3, 4, and 5: • The status of beneficiaries (i.e., age and job
experience) maps roughly to the participant box.
• Mediating factors, such as community context, grant recipient, funding, and industry (discussed in Chapter 3), can be determinants of the types of services that are provided.
• The various industries served can determine the training, career services, and specific skills and degrees or credentials obtained.
• The project components in place and the different types of services map to the activities discussed in Chapter 4.
• The flow chart concludes with the outputs and outcomes of Chapter 5, including projects’ immediate skills-oriented goals, obtaining degrees or credentials, employment-oriented goals, and community impacts.
The model also shows that the training process is an iterative one, where a participant may progress through multiple training programs after the life of his or her career. SUMMARY AND CONCLUSIONS ARC’s portfolio of vocational education and workforce training projects follows decades of debate about the purposes and activities of these programs, and, more recently, debate about accountability and performance reporting. This evaluation is timely as it provides an opportunity view ARC’s projects in light of these other requirements just as they are being implemented. One way to examine the gaps addressed by ARC projects is to compare them with a model vocational education and workforce training program, as shown in the flow chart. This conceptual framework for understanding these projects and their various dimensions will be used throughout this report. Moreover, a review of these other programs shows that ARC has found a niche in vocational education and workforce training. ARC grants often fill gaps left by local, state, and federal funding streams. Even as the new administration makes its mark on the field, this niche is likely to remain.

14 Exhibit 2-1. Flow chart of an individual’s advancement through a model vocational education or workforce training program Context Activities Outputs and Outcomes
Obtain Skills basic skills academic skills vocational/technical skills employability skills
Support Services child care assistance transportation assistance financial assistance referrals
Gain/Retain Initial Full-Time Employment
Improved Employment Status maintain current employment increase responsibilities earn promotion increase wages obtain/retain new jobs
Community Impacts viability/stability/growth of businesses economic/social viability of communities
Ameliorate Barriers increase access to transportation increase access to child care increase access to clothing/food/shelter
Job Search and Career Services career counseling job search assistance employability skills
Project Participants in school unemployed employed
youth adults
Program Components in Place equipment physical plant project staff training materials community awareness
Other Mediating Factors community context grant recipient funding industry
Classroom Training adult basic education academic vocational/technical employability
Worksite Training on-the-job training apprenticeship Obtain Degree/Credential
secondary degree or equivalent proficiency credential in conjunction with a secondary school diploma postsecondary degree/credential/ certificate

15
References
Association for Career and Technical Education. (1998). The Official Guide to the Perkins Act of 1998. Alexandria, VA: Association for Career and Technical Education.
Copa, G.H., Plihal, J., Scholl, S., Ernst, L., Rehm, L., and Copa, P. (1985). An untold story: Purposes of vocational education in secondary schools. St. Paul: University of Minnesota, Minnesota Research and Development Center for Vocational Education.
Grubb, W.N. (1995). Evaluating job training programs in the United States: Evidence and explanations. Berkeley, CA: National Center for Research in Vocational Education.
Grubb, W.N., Badway, N., Bell, D., Chi, B., King, C., Herr, J., Prince, H., Kazis, R., Hicks, L., and Taylor, J.C. (1999). Toward order from chaos: State efforts to reform workforce development systems. Berkeley, CA: National Center for Research in Vocational Education.
Hoachlander, E.G. (1991). Systems for performance standards and accountability for vocational education: Guidelines for development. Berkeley, CA: National Center for Research in Vocational Education.
Hoachlander, E.G., and Nyre, G.F. (1981). Simulating alternative methods for dividing federal VEA funds between secondary and postsecondary levels. Presented at the Annual Meeting of the American Educational Research Association, New York, NY.
Medrich, E., and White, R. (1999). The Data dilemma: Putting progress measures data to work for federal, state, and local decision makers. A report to the National School-to-Work Office, Washington, DC.
National Assessment of Vocational Education (NAVE) Independent Advisory Panel. (1994a). Interim report to Congress. Washington, DC: U.S. Department of Education.
National Assessment of Vocational Education (NAVE) Independent Advisory Panel. (1994b). Final report to Congress. Washington, DC: U.S. Department of Education.
National Commission on Excellence in Education. (1983). A nation at risk: The imperative for educational reform. Washington, DC: U.S. Department of Education.
National Commission on Secondary Vocational Education. (1984). The unfinished agenda: The role of vocational education in the high school. Columbus, OH: The Ohio State University, National Center for Research in Vocational Education.
Nyre, G.F. (1985). A comparative analysis of vocational training programs. Sacramento, CA: California Department of Industrial Relations.
Nyre, G.F. (1986). Effective strategies for integrating classroom instruction and worksite training. (3 Vols.) Sacramento, CA: California Employment Development Department.
Nyre, G.F., Hoachlander, E.G., and Rose, C. (1982). Case studies of federal VEA funds distribution systems in selected states. Presented at the Annual Meeting of the American Educational Research Association, Los Angeles, CA.
U.S. General Accounting Office. (1996). Effectively Implementing the Government Performance and Results Act. Washington, DC: GAO/GGD-96-118.

17
Project Participants in school unemployed employed
youth adults
Other Mediating Factors community context grant recipient funding industry
Program Components in Place equipment physical plant project staff training materials community awareness
Obtain Skills basic skills academic skills vocational/technical skills employability skills
Support Services child care assistance transportation assistance financial assistance referrals
Gain/Retain Initial Full-Time Employment
Improved Employment Status maintain current employment increase responsibilities earn promotion increase wages obtain/retain new jobs
Community Impacts viability/stability/growth of businesses economic/social viability of communities
Ameliorate Barriers increase access to transportation increase access to child care increase access to clothing/food/shelter
Job Search and Career Services career counseling job search assistance employability skills
Classroom Training adult basic education academic vocational/technical employability
Worksite Training on-the-job training apprenticeship Obtain Degree/Credential
secondary degree or equivalent proficiency credential in conjunction with a secondary school diploma postsecondary degree/credential/ certificate
Context Activities Outputs and OutcomesOutputs and Outcomes
Project Context
This chapter describes the context for the projects in the study sample, including project participants and other mediating factors that define a project, as shown in the unshaded area of the flow chart. It begins with the communities that received support through ARC, and then it provides an overview of the grants and the types of organizations that received them. It concludes with a description of projects’ beneficiaries. As described earlier, the sample includes two distinct cohorts: Cohort 1 comprises 67 awards made between 1995 and 1999 that were closed at the time the survey was administered, while Cohort 2 comprises 25 projects with awards made in 2000. Data for each cohort are displayed together in this chapter.8 How- ever, since Cohort 1 repre- sents the primary set of projects in the sample, and the descriptive characteristics did not differ dramatically between the cohorts, we focus on these projects and make only limited reference in the text to Cohort 2 projects. Where data are available, we also provide comparisons to the universe of all ARC vocational education and workforce training projects in the tables. 9 8 Comparison of Cohort 1 and Cohort 2 data is not possible in
subsequent chapters because Cohort 2 projects were not surveyed on all items. Comparisons are made in Chapter 7 to assess the quality of objectives specified before and after ARC’s changes to application requirements.
9 We are only able to make comparisons to the universe of vocational and workforce projects for characteristics derived from the ARC
COMMUNITY CONTEXT As described earlier, ARC, together with the 13 states of Appalachia, works to fund projects that will increase the knowledge and skill levels of workers and students throughout the region. In this section, we describe the communities that received education and training services through an ARC vocational education or workforce training grant.
Geographic Distribution The projects in the study sample were asked to describe the geographic distribution of the individuals who were expected to benefit from their ARC grant. Projects were designed to serve a relatively wide variety of areas. Forty percent were designed to serve two or more counties or school districts in a single state, while 25 percent were serving a single county (Figure 3-1). The remaining projects were spread among single cities or school districts and major metropolitan areas, and across multiple states.
database. We are not able to make any comparisons for characteristics derived from the mail survey. In addition, because the study sample and full portfolio of education projects that received ARC funding were not independent of one another, we did not test whether similarities and differences between these two groups were statistically significant.
III.

18
Figure 3-1 Geographic distribution of expected beneficiaries of ARC vocational education and workforce training projects
4%
24%
72%
1%1%4%
7%9%10%
25%
40%
0
20
40
60
80
100
Two or more
counties or
school
districts in a
single state
Single
county
Single school
district
M ajor
metropolitan
area
Two or
more states
All counties
in a
single state
Single city
or town
Other areas Two or more
counties or
school
districts in a
single state
Single city
or town
M ajor
metropolitan
area
Cohort 1 Cohort 2
NOTE: Percents may not sum to 100 due to rounding. SOURCE: 2001 mail survey of ARC grantees.

19
Metropolitan Status Geographically isolated, rural, and nonmetro-politan areas face a number of barriers to an educated workforce, full employment, and economic viability (see Exhibit 3-1). One-third (33 percent) of Cohort 1 projects were located in these nonmetropolitan areas, compared with over half (56 percent) of Cohort 2 projects and 38 percent of all ARC vocational education and workforce training projects (Figure 3-2). A combination of metropolitan and nonmetropolitan areas was served by 46 percent of Cohort 1 projects.
Figure 3-2 Percent of projects by metropolitan status
Cohort 1 (n=67)
33%
21%
46%
Nonmetropolitanonly
Metropolitan onlyBoth metro andnonmetro
Cohort 2 (n=25)
20%
24%
56%
All ARC vocational education and workforce training projects (n=173)
43%
20%
38%
NOTE: Percents may not sum to 100 due to rounding. SOURCE: ARC database.
Exhibit 3-1. Examples of geographically isolated areas
Itawamba Community College Workforce Development. Worker access to a college campus in the region has been limited. More than half of Mississippi’s 2.5 million people (52.7 percent) reside in rural areas. Less than 20 percent of the population live in one of the eight cities having 25,000 or more residents. There is no public transportation provided to 90 percent of the population in the counties of northeast Mississippi. Although many county roads are chip and seal, secondary roads remain red clay, subject to 52 inches of annual rainfall and often impassable conditions. There is a severe shortage of sufficiently educated workers. Only 14.7 percent receive a bachelor’s degree or higher. The state has the lowest per capita and median family incomes in the nation. More than 25 percent of the population fall below the federal poverty level. (Multi-county, Mississippi) Clay County Work Based Learning. Clay County, which is served by the Clay County School District, is exclusively rural. The county’s 9,985 residents are scattered over 367 square miles. Clay County has only one incorporated town—the town of Clay—which has a population of slightly less than 600 residents. According to the U.S. Census Bureau, the 1990 population included 3,028 youth under the age of 18. Census Bureau figures further indicate that 1,446 of Clay County youth under the age of 18 meet the federal poverty definition (48.4 percent). Census Bureau data for 1990 indicate that the unemployment rate in Clay County is 19.9 percent, that 49.4 percent of adults do not have a high school diploma, and that median household income is $12,855 compared to a state average of $20,795. According to the West Virginia Bureau of Employment Programs, 43.4 percent of employed Clay County residents work outside of the county boundaries. (Clay County, West Virginia)

20
Economic Status ARC vocational education and workforce development projects serve some of the region’s most economically disadvantaged persons. About one-third of projects were serving at least one Figure 3-3 Percent of projects by economic status
Cohort 1 (n=67)
73%
27% At least one distressedcountyNo distressed counties
Cohort 2 (n=25)
68%
32%
All ARC vocational education and workforce training projects (n=173)
71%
29%
SOURCE: ARC database.
distressed county (Figure 3-3).10 This proportion is similar to the proportion of all ARC counties that were designated as distressed for FY 2001 (114 of 406 counties, or 28 percent). Poverty, like geographic isolation, brings with it a number of associated circumstances that impede further economic development (see Exhibit 3-2).
10 Begun in 1983, the Distressed Counties Program was designed to
provide a mechanism for setting aside funds for the region’s most impoverished communities. Every year, each of the 406 counties in the region is designated one of four economic categories based upon a number of available indicators. Distressed counties are eligible for additional funding and lower matching requirements: 20 percent of total project cost, compared to 50 percent for transitional counties and 80 percent for competitive counties. Attainment counties are not eligible to receive ARC funding.
Exhibit 3-2. Example of an economically disadvantaged area
Academic Career Training Program. Appalachian Ohio is an area defined, in part, by its geographical isolation and its economic transitions. The southeast Ohio region has been marked by high unemployment. Morgan and Perry Counties have ranked 1st and 7th highest in the state, respectively, followed by Hocking County (11th in the state) and Athens County (61st). In Athens County, much of the available employment is in typically low paying jobs, and 28.7 percent of the Athens County residents live below the poverty level. Per capita income for the four-county area is consistently below the average for the state. Athens County per capita income averaged just $12,285. At this level, Athens County residents were $6,755 below the state per capita income level of $19,040 (Ohio County Profile Data, 1995). Education attainment provides another indicator of need in the four Appalachian counties served by this project. While the high school dropout rate in Ohio averages 3.9 percent, the four counties average 4.4 percent; Morgan County ranks the highest of the four at 6.6 percent. The percentage of high school graduates proceeding on to higher education is lower in Appalachia than in the rest of Ohio. Statewide averages in 1990–91 show that 59 percent of high school students participate in higher education, while only 49.3 percent of Appalachian students continue with such training. In Morgan County, only 30.6 percent of students participate in higher education. (Morgan, Perry, Hocking, and Athens Counties, Ohio)

Community Groups Served Geographic and economic analyses provide a good picture of which communities are being served by ARC projects, but not of the actual community members who compose the target population. To address this issue, the survey asked respondents in both cohorts to indicate the community groups for which their projects provided services, resources, or other assistance. Almost all projects indicated that they were designed to address at least one disadvantaged or underserved community group.11 About half of the projects in Cohort 1 served unemployed and underemployed persons (54 percent) and those living in geographically isolated or rural areas (49 percent) (Table 3-1). Additional disadvantaged groups included medically underserved persons, incumbent employees who required retraining to maintain their jobs, and persons with low educational attainment (see Exhibit 3-3). Table 3-1 Percent of ARC projects that indicated they were designed to provide services, resources, or other assistance to the following groups, by cohort
Characteristic of group Cohort 1 (n=67)
Cohort 2 (n=25)
Unemployed/underemployed ...................... 54 56 Geographically isolated/rural...................... 49 60 Public assistance recipients......................... 24 32 Extreme poverty .......................................... 24 16 Disabled....................................................... 18 24 School dropouts........................................... 15 24 Other groups................................................ 15 28 Underrepresented minorities ....................... 13 12 Illiterate ....................................................... 6 16 Limited English speaking............................ 1 4 Migrant workers/migrant students .............. 0 4
NOTE: Projects may be serving multiple groups. Groups may overlap. SOURCE: 2001 mail survey of ARC grantees.
11 It should be noted that the members of these community groups
overlap considerably.
Co TheinfoneeandexpfuntraicurrepexaCenschStatheaddproproeleceduAs origbuiequdef
PL(WJoisfrcojothprnoreanloemco AentrdeP
Exhibit 3-3. Example of disadvantaged group served by an ARC project
ickens Technical Institute, Technology earning Center. The Workforce Academy
FA) was established in 1994 with funds from the b Training Partnership Act (JTPA). WFA’s goal to prepare economically disadvantaged residents om Cherokee, Pickens, Gilmer, and Fannin unties in Georgia for entry-level manufacturing bs. This is a continuation of a 1995 ARC grant at enabled the Workforce Academy to open its ogram to individuals from these counties who do t fit within the defined JTPA eligibility quirements. Grant funds were used to operate d expand the WFA, thereby providing industries cating or expanding in north Georgia with ployees who are proficient in basic
mmunication, math, and problem-solving skills. dditional computer hardware and software hanced WFA’s local and distance learning
aining capabilities and provide economic velopment resources to business. (Cherokee,
ickens, Gilmer, and Fannin Counties, Georgia)
21
mmunities’ Need for ARC Funding
document review and site visits provided rich rmation about the communities’ and projects’ d for funding. As described in Chapter 2, state local funding often does not cover all of the enses vocational programs have, and ARC ding is used to fill these gaps. Most often, ning providers lack updated equipment rently used in the field and have no funding to lace outdated and obsolete equipment. For mple, although the Winston County Technical ter (WCTC) is a part of the Winston County
ool district, at the time of the ARC grant the te of Alabama made no provisions for funding improvement or updating of equipment. In ition, Winston County’s tax base did not vide for the funding of improvements to its six gram components (automotive technology, tronics technology, carpentry, marketing cation, business education, and cosmetology). a result, WCTC had been operating with the inal equipment in place when the school was
lt in 1972 and was sorely in need of up-to-date ipment for training its students. These iciencies were particularly evident in the case

22
of the automotive technology component, which needed to be completely overhauled given recent rapid and drastic changes in the field. It was anticipated that an upgrade of equipment in automotive technology, electronics technology, and carpentry would benefit students by providing the relevant and realistic training to prepare them for local employment on equipment actually used in the field. Other projects begin as a result of local demand, often based upon industry surveys and local needs assessments. For example, the horticulture program that was established at the Daniel Morgan Technology Center (DMTC) after a countywide needs assessment determined that local land-scaping companies were anticipating job openings in the next 5 years. The school sent out a followup survey to local landscape companies and golf courses in the Greenville/Spartanburg area in order to gain a better understanding the types of skills these workers would need. The ARC grant was then used to purchase equipment that would facilitate the attainment of these skills. Similarly, the Manufacturing Assistance Center (MAC) in Hamarville, Pennsylvania, was established in response to several regional surveys and assessments identifying the critical needs for manufacturing training and equipment resources. After receiving a grant from the Economic Development Administration of the U.S. Department of Commerce, the MAC became fully operational in 1994. Area manufacturers and small-business owners were receptive to the concept of shared manufacturing, and the center was equipped with the same technologies, software, tools, and equipment area manufacturers were already using, but it had no users. Manufacturers were again surveyed informally, and MAC staff and consultants learned that the lack of training and the corresponding lack of workers trained to use the equipment prohibited them from making full use of the center. The MAC turned to ARC for funding to develop training materials and curricula. See Exhibit 3-4 for examples of community needs addressed by other ARC projects in the study sample.
Exhibit 3-4. Additional examples of communities’ need for funding
Computer Lab Upgrade—Tri-County Technical College. A survey of a wide variety of area businesses and industries ranging in size from 3 to 4,000+ employees and employing a total of nearly 12,000 individuals determined the need for the college to establish a computer lab. The survey findings indicated a continuing demand for qualified graduates of Tri-County’s Computer Technology and Office Systems Technology programs. These same companies disclosed a need for 650 current employees to receive additional training in the office skills/computer technology areas. (Anderson, Occonee, and Pickens Counties) Northern Tier Industry Education Consortium. An abundance of high skill, high paying jobs existed in the region, but few local people were qualified to fill the positions. Local employers acknowledged that only 1 in 10 applicants were passing their screening test for employment, the average age of new hires was 27–29 years of age, and the companies were spending thousands of dollars to provide new hires with training that should have already occurred. This circumstance was exacerbated by a lack of clear direction on the part of the students as they drift through secondary and postsecondary school unaware of their own interests and abilities. By the time many students decide on a career choice, they learn that the courses they took inadequately prepared them for their chosen field. Accordingly, the program was designed to increase work-based learning opportunities for high school students. (Bradford, Sullivan, Susquehanna, Wyoming, and Lackawanna Counties, Pennsylvania) Equipment for Commercial/Graphics Art and Machine Technology/Computer Aided Manufactur-ing. The Southern Association of Colleges and Schools’ requirements were not being met in all program areas. Current commercial/graphics art and machine technology/computer aided manufacturing training labs were inadequate. Students were being taught on obsolete and out-of-date equipment and in substandard facilities. Many other colleges have fully developed facilities and instructional labs; however, Shelton State Community College had not been able to equip laboratories designed to meet the needs of its programs. The college and its services have grown at a rapid pace. The labs were old and no longer functional; they were also overcrowded and congested. With the assistance of ARC in equipping training laboratories, this critical need was alleviated. (Pickens, Tuscaloosa, and Bibb Counties, Alabama)

23
GRANTS AND GRANT RECIPIENTS This section provides information about the organizations responsible for overseeing and implementing ARC grants, the duration of their grant funding, the amount and sources of ARC funding they received, and sources of additional funding. Grant Recipient Organizations Most of the projects in the sample originated from training institutions. In fact, 90 percent of Cohort 1 and 64 percent of Cohort 2 projects were overseen by educational institutions (Table 3-2). Area vocational schools and technical colleges received the most grants. See Exhibit 3-5 for examples of grant recipient organizations. Table 3-2 Percent of ARC projects, by the type of organization of the grant recipient, by cohort
Organization type Cohort 1 (n=67)
Cohort 2 (n=25)
Education organizations ........................... 90 64 Area vocational school/vocational high
school .................................................. 24 8 Technical college or institution ............... 21 20 Comprehensive community college
(degree-granting)................................. 16 20 Comprehensive middle or high school.... 12 0 Four-year postsecondary institution ........ 7 8 Local school district/agency.................... 4 0 Other education entity ............................. 4 8 Other organizations .................................. 6 32 Consortia of organizations....................... 3 8 Other community organization................ 3 12 Social service agency .............................. 0 8 Community development organization ... 0 4 Government organizations ....................... 4 4 State government agency......................... 3 4 County government agency..................... 1 0
NOTE: Details may not sum to totals due to rounding. SOURCE: 2001 mail survey of ARC grantees.
Duration of Funding ARC typically awards grants for a 1-year period, but projects may apply for and receive continuations of funding in subsequent years. While most Cohort 1 projects (67 percent)
Exhibit 3-5. Examples of grant recipient organizations
Welding Laboratory/Classroom. Alfred State College is a residential College of Technology located in the rural community of Alfred, New York, and is part of the State University of New York system. Alfred State College has more than 50 programs in agriculture, allied health, business, and engineering technologies plus liberal arts and sciences. Welding has been taught at the Vocational Technology Campus as a short module for many years. In 1992, it was proposed to create a separate dedicated program as originally planned in the 1966 development of the Vocational Technology Campus, but there was not adequate equipment or facilities to support such a program. The idea has been taken more seriously after local industries had been constantly asking Alfred to start such a program. There were several other 2-year programs in New York, but none were in western New York. (Allegany County, New York) Chautauqua County Wood Skills Training Project. While not the direct grant recipient, the Woods Alliance Group in Jamestown, New York, represents an interesting partnership that helped shape the scope and implementation of the Chautauqua County Woods Skills Training Project. The alliance includes a wide range of companies—including two of the nation’s largest furniture manufacturers and three businesses with fewer than 25 employees. A noteworthy achievement of this 3.5-year alliance has been the willingness of these nine companies—which would traditionally vie for the same workers—to pool their resources and promote a uniform pre-hire training program for all of the community’s furniture manufactures. In fact, alliance members eventually agreed to use a common job application form and offer similar starting wages to individuals who completed the PIC’s pre-hire training program. While the ARC grant was not responsible for the creation of this alliance, it did enable the nine companies to significantly expand upon their interest in working together to solve a common problem. (Chautauqua County, New York).

24
received 1 year of funding from ARC,12 15 Cohort 1 projects received 2 years, and seven received 3 or more years of ARC funding. Half (49 percent) of Cohort 1 projects received funding in FY 1995, and 34 percent received funding in FY 1996 (Figure 3-4). Smaller percentages received funding in subsequent years. All but three Cohort 2 projects were first funded in FY 2000 and therefore had received just 1 year of funding when this report was written. Funding Source The projects in the study sample received their funding in one of two ways—through their individual states or through the Commission. Most vocational education and workforce training projects received funding through their states, and several states have been more active than others in promoting these types of projects. South Carolina, Ohio, and Georgia accounted for most of the projects in the study sample (Table 3-3). None of the states were underrepresented or overrepresented in Cohorts 1 or 2 relative to the universe of the vocational education and workforce training projects funded by ARC between 1995 and 2000, indicating that the sample was fairly representative of the universe. However, the uneven distribution of projects across the states precludes analysis of other variables by state.
12 As discussed previously, the Cohort 1 sample was selected from
ARC projects that received funding from 1995 through 1999. However, this did not exclude projects that also received funding prior to 1995 or those that received funding in 2000. In fact, a handful of projects, which may include duplicates, received funding in 1991 (two projects), 1992 (two projects), 1993 (four projects), 1994 (five projects), and 2000 (four projects). In addition, Cohort 2 projects were drawn from those receiving funding in 2000, but some of these projects also received funding prior to 2000 (two in 1998 and five in 1999). Finally, three projects indicated on the survey that they did not receive ARC funding in 2000 (all three received funding in 1999 and one also received funding prior to that), but the ARC database indicates that they did in fact receive funding in 2000. (We believe these projects may have considered their 2000 funding as a part of their previous grants as the funding was added to an existing contract for each project.)
Figure 3-4 Percent of projects that reported receiving ARC funding during the fiscal years 1990–2000
8%
20%
88%
1%1%
3%
3%
6%
7%
49%
34%
21%
15%
16%
6%
0 20 40 60 80 100Percent of projects
Cohort 1 (n=67)Cohort 2 (n=25)
Prior to 1990
1990
1991
1992
19931994
1995
1996
1997
1998
1999
2000
SOURCE: 2001 mail survey of ARC grantees. Table 3-3 Percent of projects by source of ARC funding, by cohort
Source of funding Cohort 1 (n = 67)
Cohort 2 (n = 25)
Percent of all ARC
vocational and
workforce projects
(n = 173) Alabama................................ 6 0 6 Georgia ................................. 9 0 5 Kentucky............................... 1 12 6 Maryland............................... 6 0 6 Mississippi ............................ 4 4 4 North Carolina ...................... 0 0 2 New York ............................. 4 24 9 Ohio ...................................... 18 8 12 Pennsylvania......................... 6 8 5 South Carolina ...................... 34 28 31 Tennessee.............................. 1 0 1 Virginia................................. 6 4 5 West Virginia........................ 3 0 4 Commission.......................... 0 12 4
NOTE: Percents may not sum to 100 due to rounding. SOURCE: ARC database.

25
Funding Amount and Total Project Cost ARC awards are intended to be used in conjunction with funds from other sources, such as local or state agencies, businesses, or foundations; the required match is based upon the economic status of the community within which the project is located. For example, projects located in distressed counties must provide a match of 20 percent of the ARC grant amount, whereas projects located in competitive counties must provide an 80 percent match. In cases where a project serves several counties with different designations, ARC has developed formulas to determine the required amounts. ARC grants across the study sample ranged from a low of $13,49013 in Cohort 1 and $21,600 in Cohort 2 to a high of $890,000 in Cohort 1 and $300,333 in Cohort 2. The universe of all ARC vocational and workforce projects had the same range as Cohort 1 projects. Two-thirds (67 percent) of Cohort 1 projects received $100,000 or less, with 24 percent receiving $50,000 or less (Table 3-4).14 Projects also varied in terms of the total financial resources that they had at their disposal—from a low of $26,980 in Cohort 1, $63,400 in Cohort 2, and $15,914 in the universe of all projects to a high of $2,445,358 in Cohort 1 and the universe to $1,338,000 in Cohort 2. The distribution of total project costs was similar among the two cohorts and the universe. About two-thirds of Cohort 1 (70 percent) and the universe of all ARC vocational and workforce projects (61 percent), and 52 percent of Cohort 2 projects had total project costs of $200,000 or less (Table 3-4).
13 Projects receiving less that $10,000 were excluded from the study
sample and the universe of all ARC vocational and workforce projects for comparison purposes.
14 Funding amounts were combined in cases where projects received multiple years of financial support through ARC.
Table 3-4 Percent of projects with various ARC grant sizes and total project costs, by cohort
Grant size/project cost Cohort 1 (n = 67)
Cohort 2 (n = 25)
All ARC vocational
and workforce projects
(n = 173) ARC grant size
Less than $50,000 .............. 24 28 24 $50,001-$100,000 .............. 43 28 36 $100,001-$200,000 ............ 24 28 23 More than $200,000........... 9 16 17
Total project cost
Less than $100,000 ............ 28 20 23 $100,001-$200,000 ............ 42 32 38 $200,001-$900,000 ............ 24 44 34 More than $900,000........... 6 4 6
NOTE: Percents may not sum to 100 due to rounding. SOURCE: ARC database.
Funding from Other Agencies As required by ARC’s matching funds system, projects obtain funds from other agencies. In order to gain an understanding of the other agencies to which projects were required to report outcome data or some other type of performance reporting, the survey asked respondents to indicate which other federal agencies provided funding. Eleven Cohort 1 projects and three Cohort 2 projects indicated they were receiving funding from other federal agencies: six from the Department of Education, three from the Department of Labor, three from the Department of Commerce, one from the Department of Health and Human Services, one from the Department of Agriculture, one from the Department of Housing and Urban Development, and one other unspecified department (not shown in tables).15
15 Specific programs providing funding include School-to-Work, Carl
Perkins Vocational Education program, Economic Development Administration, Bureau of Health Professions, and the Technology Reinvestment Program. Projects may have received funding from more than one additional agency.

26
It should be noted that the survey only asked respondents about sources of federal funds; it is likely, however, that many projects are also receiving state and local funds, as well as additional federal funds that are filtered through the state. Based on information gathered in case study sites, as well as our other work in evaluations of state and local uses of Perkins funding, we believe many ARC projects may not be aware of the original sources of their funding. For example, a vocational education center may be receiving Perkins funding, but because it comes through the state, staff may not realize that the source is actually a federal program. This issue will be revisited in Chapter 7, as project staff may also be unaware that some of their performance reporting requirements actually originate from a federal mandate. PROJECT BENEFICIARIES This section provides information on beneficiaries projects were targeting. It discusses both individuals and industries targeted. Age and Job Status of Beneficiaries The survey asked respondents to indicate the age groups and job experience of those they were serving. About half (48 percent) of Cohort 1 projects were serving primarily adults, and another third (33 percent) were serving primarily youth (Table 3-5). The remaining projects were serving a mix of both adults and youth (see Exhibit 3-6). Table 3-5 Percent of projects, by age of intended beneficiaries of the project, by cohort
Participant age Cohort 1 (n=67)
Cohort 2 (n=25)
Primarily youth............................................ 33 24 Primarily adults ........................................... 48 64 Both youth and adults ................................. 19 12
SOURCE: 2001 mail survey of ARC grantees.
Cohort 1 projects were primarily serving those without full-time job experience (60 percent) or a combination of individuals with and without full-time job experience (28 percent) (Table 3-6). Thus, while projects were primarily targeting adults, these adults had little full-time job experience (see Exhibit 3-7). In fact, only seven projects serving primarily adults, and one serving both youth and adults, were targeting full-time employees. The data indicating that a large portion of projects served adults without full-time job experience confirm that unemployment and underemployment is indeed a problem in the region.
Exhibit 3-6. Examples of projects serving primarily adults and primarily youth
Appalachian By Design (ABD) Training and Development Assistance. Appalachian By Design (ABD) worked primarily with a network of handloom knitters and weavers. This group first came together in 1991 as eight women with handloom machines for whom ABD (then a project of the Center for Economic Options) found work. Since then, the network has grown considerably. Very few of the women had done production knitting, so that both initial training upon recruitment and on-the-job training were critical to the network’s growth. Training continues to be crucial, as ABD is essentially building a new industry of knitwear producers in rural Appalachia. (Multi-county, West Virginia) Youth Ventures. The Learning Web offers experiential education and career exploration opportunities to over 450 youth each year. Programs include volunteer and stipended apprenticeship programs, work-site tours, community service projects, a homeless youth outreach project, and a youth-run ice cream franchise. Experiential education, youth empowerment, apprenticeship placements dictated by youths’ interests, individually tailored learning contracts, and the one-to-one guidance of adult mentors are key aspects of all Web programs. (Tompkins County, New York)

Table 3-6 Percent of projects, by job experience of intended beneficiaries of the project, by cohort
Participant type Cohort 1 (n=67)
Cohort 2 (n=25)
No full-time job experience ........................ 60 48 Full-time job experience ............................. 12 24 Both experience levels ................................ 28 28
SOURCE: 2001 mail survey of ARC grantees.
Industries Served The industries that projects serve are also considered a beneficiary, since many projects were initiated to address a lack of qualified workers for a particular industry. Overall, the projects were focused on a single industry; only seven Cohort 1 projects were serving more than one type of industry. Forty percent of Cohort 1 projects and 12 percent of Cohort 2 projects focused on manu-facturing industries (Table 3-7). It is possible that the drop in projects serving the construction industry and the concurrent rise in projects serving information technologies between the two cohorts illustrates the changing labor markets in the region between the period of the late 1990s to 2000.16 16 The small sample size precludes us from making any conclusive
statements regarding whether such a shift has occurred in the types of projects that ARC is funding.
Table 3-7 Percent of projects serving various industries, by cohort
Industries served Cohort 1 (n=67)
Cohort 2 (n=25)
Manufacturing ............................................ 40 12 General workforce ...................................... 13 36 Construction ............................................... 12 0 Health.......................................................... 10 8 Business ...................................................... 9 0 Arts and communication ............................ 9 12 Transportation and automotive................... 6 0 Agriculture and natural resources .............. 4 4 Other ........................................................... 4 4 Information technologies............................ 3 16 Education and child care ............................ 1 0 Hospitality and tourism .............................. 0 8 Human services .......................................... 0 4
NOTE: Projects may be serving multiple industries. SOURCE: Document review of ARC grantees.
A number of projects were also serving general workforce functions (see Exhibit 3-8). These projects were preparing youth (all nine of the Cohort 1 projects targeting the general workforce
Exhibit 3-7. Example of a project serving unemployed adults
If I Had a Hammer—Housing Construction and Rehabilitation Training. The If I Had a Hammer – Housing Construction and Rehabilitation Training program provides training for employment in the construction field to persons currently receiving housing assistance through the Wise County Redevelopment and Housing Authority. Long-term county unemployment rates have vacillated between a 10-year low of 9.4 percent in 1989 to a 10-year high of 17.9 percent in 1996. Residents surveyed indicated that a major barrier to employment in the county is a lack of jobs and their lack of job skills. They also reported that they need help in preparing for the world of work. Participants receive job skills training in four areas of housing construction and rehabilitation. (Wise County, Virginia)
Busiof tGreelaborSchooffercoursor spmostbusincompdirecwho counbeencompat eaaccessuccepursuOhio
Exhibit 3-8. Example of a general workforce project
ness Skills Laboratories. The overall purpose he Business Skills Laboratories project in nfield, Ohio, was to establish two computer atories in the Greenfield Exempted Village ol District. Currently, each high school can only the traditional typing courses. No es in word processing, database management, readsheets, which are so commonly needed in businesses today, are offered. Local esses have expressed a need for additional uter skills in all of the local graduates who go tly into the job market. Additionally, those
do go on to college are behind their terparts from more affluent districts that have financially able to provide instruction on uters. By establishing a Business Skills Lab ch of the two high schools, students have s to the computer skills so necessary for ss in either the immediate job market or in ing higher education. (Highland County, )
27

28
indicated they were serving primarily youth) for a wide range of careers or were simply providing workplace habits and skills that would be necessary in any career field, but did not target any particular industry. Career awareness projects were also considered to be general workforce projects. SUMMARY AND CONCLUSIONS In this chapter we described the communities in which projects were operating, the grant recipients and their funding sources, and the beneficiaries projects were targeting. Study findings suggest that projects are serving some of Appalachia’s most geographically isolated, rural, and disadvantaged populations. Community groups that were targeted generally reflected ARC’s goal of serving those most in need.
Many communities turned to ARC for funding to replace outdated or obsolete equipment. Other projects were developed after local studies defined a need for new workers or better qualified workers. Most grants were awarded to educational institutions and were spread evenly across the range of amounts. Projects most frequently targeted adults and those without full-time job experience although youth and experienced workers were also served. Projects primarily addressed the manufacturing and construction industries and general workforce functions.

29
Obtain Skills basic skills academic skills vocational/technical aides employability skills
Gain/Retain Initial Full-TimeEmployment
Improved Employment Status maintain current employment increase responsibilities earn promotion increase wages obtain/retain new jobs
Community Impacts viability/stability/growth of businesses economic/social viability of communities
Ameliorate Barriers increase access to transportation increase access to child care increase access to clothing/food/shelter
Project Participants in school unemployed employed
youth adults
Other Mediating Factors community context grant recipient funding industry
Obtain Degree/Credential
secondary degree or equivalent proficiency credential in conjunction with a secondary school diploma postsecondary degree/credential/ certificate Support Services
child care assistance transportation assistance financial assistance referrals
Job Search and CareerServices career counseling job search assistance employability skills
Classroom Training adult basic education academic vocational/technical employability
Worksite Training on-the-job training apprenticeship
Program Components inPlace equipment physical plant project staff training materials community awareness
Context Activities Outputs and Outcomes
Project Activities
Residents of Appalachia commonly encounter a broad range of geographic, economic, and educational barriers. It is therefore not surprising that the projects in the study sample were primarily designed to address a prevalent condition (e.g., lack of qualified workers, obsolete equipment used for training, lack of appropriate work experiences for teens, outmigration due to lack of available jobs). This chapter discusses the range of approaches and strategies that projects used to overcome these circumstances and to establish or improve vocational education and workforce training systems. It also assesses the extent to which projects used at least some ARC funding to implement these activities. ARC funding (and the associated match17) is often one of many sources of funding a project receives, along with other local, state, and federal sources. In such cases, the projects’ implementation of activities relied on a combination of funding streams, with some activities funded solely by ARC, some funded solely by other sources, and some funded through a combination of sources.
17 For the purposes of understanding what portion of a project’s
activities were associated with ARC funding, we combined the ARC grant funds with the required match, under the assumption that the matching funds would not be available if not for the ARC grant. Thus, survey items and discussions in this report that refer to “ARC-funded” or “ARC funding” include activities, equipment, or objectives funded directly by the ARC grant and/or the associated match.
To determine which approaches were used more frequently, the survey provided respondents with a list of 30 activities across eight categories. The activities from which respondents could choose are illustrated on the flow chart in the unshaded areas and include the components of a program that must frequently be in place before training can begin, including equipment, a physical plant, trained project staff, training materials, and community involvement or awareness of the program, and the components of services provided, including training activities, support
services, and job search and career counseling assistance. The chapter does not discuss the extent of implementation of these activities because our previous study of ARC’s educational projects found that most activities were implemented as planned. We do, however, discuss implementation problems. APPROACHES AND ACTIVITIES
CONDUCTED BY COHORT 1 PROJECTS In this section, we examine all the activities conducted by the 67 projects in Cohort 1, which
IV.
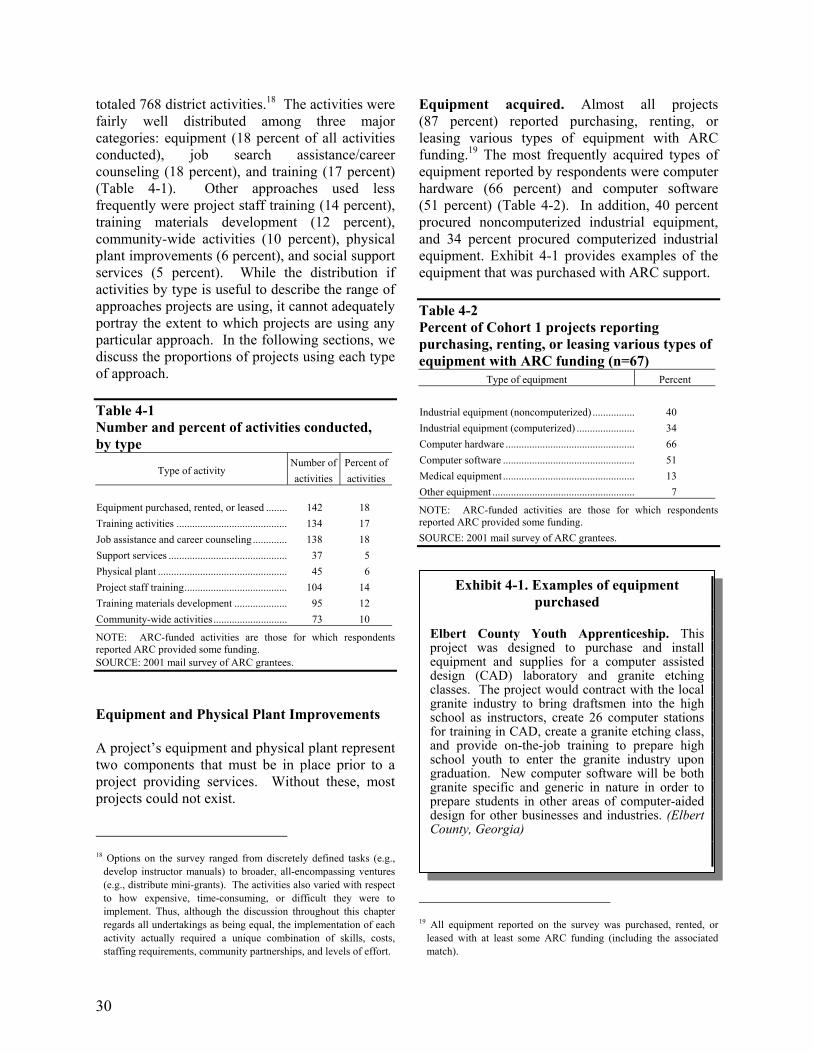
30
totaled 768 district activities.18 The activities were fairly well distributed among three major categories: equipment (18 percent of all activities conducted), job search assistance/career counseling (18 percent), and training (17 percent) (Table 4-1). Other approaches used less frequently were project staff training (14 percent), training materials development (12 percent), community-wide activities (10 percent), physical plant improvements (6 percent), and social support services (5 percent). While the distribution if activities by type is useful to describe the range of approaches projects are using, it cannot adequately portray the extent to which projects are using any particular approach. In the following sections, we discuss the proportions of projects using each type of approach. Table 4-1 Number and percent of activities conducted, by type
Type of activity Number of activities
Percent of activities
Equipment purchased, rented, or leased ........ 142 18 Training activities .......................................... 134 17 Job assistance and career counseling ............. 138 18 Support services ............................................. 37 5 Physical plant ................................................. 45 6 Project staff training....................................... 104 14 Training materials development .................... 95 12 Community-wide activities............................ 73 10
NOTE: ARC-funded activities are those for which respondents reported ARC provided some funding. SOURCE: 2001 mail survey of ARC grantees.
Equipment and Physical Plant Improvements A project’s equipment and physical plant represent two components that must be in place prior to a project providing services. Without these, most projects could not exist. 18 Options on the survey ranged from discretely defined tasks (e.g.,
develop instructor manuals) to broader, all-encompassing ventures (e.g., distribute mini-grants). The activities also varied with respect to how expensive, time-consuming, or difficult they were to implement. Thus, although the discussion throughout this chapter regards all undertakings as being equal, the implementation of each activity actually required a unique combination of skills, costs, staffing requirements, community partnerships, and levels of effort.
Equipment acquired. Almost all projects (87 percent) reported purchasing, renting, or leasing various types of equipment with ARC funding.19 The most frequently acquired types of equipment reported by respondents were computer hardware (66 percent) and computer software (51 percent) (Table 4-2). In addition, 40 percent procured noncomputerized industrial equipment, and 34 percent procured computerized industrial equipment. Exhibit 4-1 provides examples of the equipment that was purchased with ARC support. Table 4-2 Percent of Cohort 1 projects reporting purchasing, renting, or leasing various types of equipment with ARC funding (n=67)
Type of equipment Percent Industrial equipment (noncomputerized) ................ 40 Industrial equipment (computerized) ...................... 34 Computer hardware ................................................. 66 Computer software .................................................. 51 Medical equipment .................................................. 13 Other equipment ...................................................... 7
NOTE: ARC-funded activities are those for which respondents reported ARC provided some funding. SOURCE: 2001 mail survey of ARC grantees.
19 All equipment reported on the survey was purchased, rented, or
leased with at least some ARC funding (including the associated match).
Exhibit 4-1. Examples of equipment purchased
Elbert County Youth Apprenticeship. This project was designed to purchase and install equipment and supplies for a computer assisted design (CAD) laboratory and granite etching classes. The project would contract with the local granite industry to bring draftsmen into the high school as instructors, create 26 computer stations for training in CAD, create a granite etching class, and provide on-the-job training to prepare high school youth to enter the granite industry upon graduation. New computer software will be both granite specific and generic in nature in order to prepare students in other areas of computer-aided design for other businesses and industries. (Elbert County, Georgia)
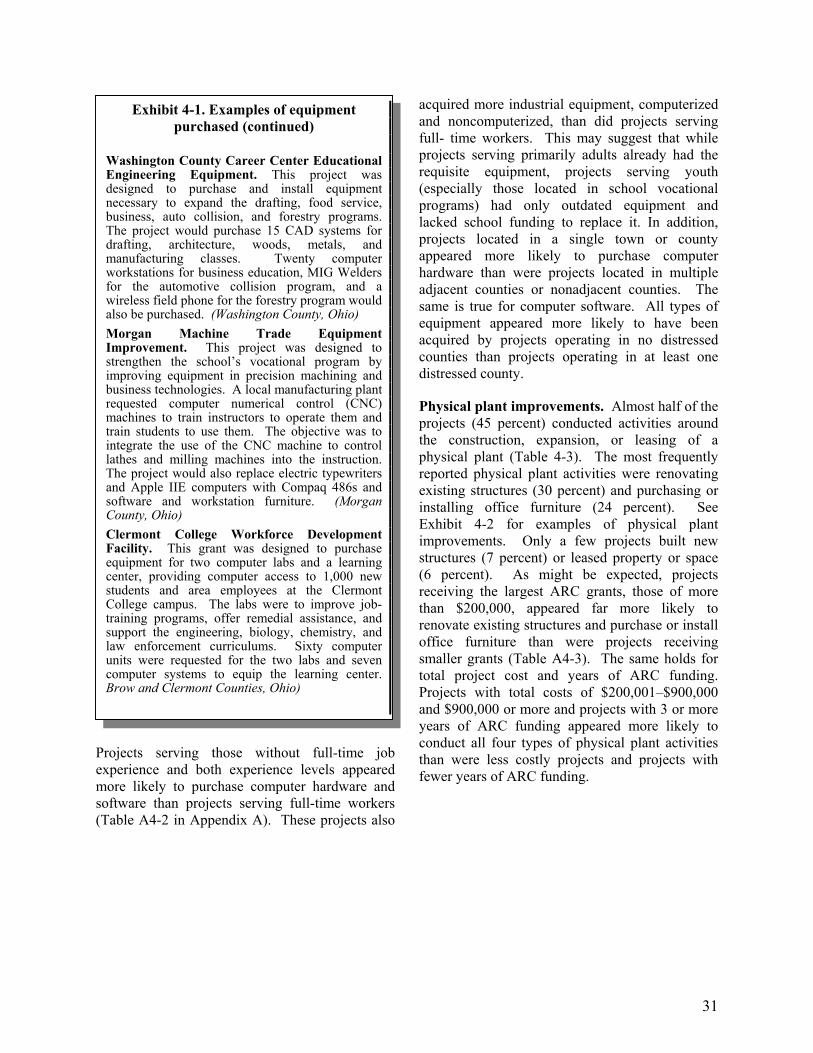
31
Projects serving those without full-time job experience and both experience levels appeared more likely to purchase computer hardware and software than projects serving full-time workers (Table A4-2 in Appendix A). These projects also
acquired more industrial equipment, computerized and noncomputerized, than did projects serving full- time workers. This may suggest that while projects serving primarily adults already had the requisite equipment, projects serving youth (especially those located in school vocational programs) had only outdated equipment and lacked school funding to replace it. In addition, projects located in a single town or county appeared more likely to purchase computer hardware than were projects located in multiple adjacent counties or nonadjacent counties. The same is true for computer software. All types of equipment appeared more likely to have been acquired by projects operating in no distressed counties than projects operating in at least one distressed county. Physical plant improvements. Almost half of the projects (45 percent) conducted activities around the construction, expansion, or leasing of a physical plant (Table 4-3). The most frequently reported physical plant activities were renovating existing structures (30 percent) and purchasing or installing office furniture (24 percent). See Exhibit 4-2 for examples of physical plant improvements. Only a few projects built new structures (7 percent) or leased property or space (6 percent). As might be expected, projects receiving the largest ARC grants, those of more than $200,000, appeared far more likely to renovate existing structures and purchase or install office furniture than were projects receiving smaller grants (Table A4-3). The same holds for total project cost and years of ARC funding. Projects with total costs of $200,001–$900,000 and $900,000 or more and projects with 3 or more years of ARC funding appeared more likely to conduct all four types of physical plant activities than were less costly projects and projects with fewer years of ARC funding.
Exhibit 4-1. Examples of equipment purchased (continued)
Washington County Career Center Educational Engineering Equipment. This project was designed to purchase and install equipment necessary to expand the drafting, food service, business, auto collision, and forestry programs. The project would purchase 15 CAD systems for drafting, architecture, woods, metals, and manufacturing classes. Twenty computer workstations for business education, MIG Welders for the automotive collision program, and a wireless field phone for the forestry program would also be purchased. (Washington County, Ohio) Morgan Machine Trade Equipment Improvement. This project was designed to strengthen the school’s vocational program by improving equipment in precision machining and business technologies. A local manufacturing plant requested computer numerical control (CNC) machines to train instructors to operate them and train students to use them. The objective was to integrate the use of the CNC machine to control lathes and milling machines into the instruction. The project would also replace electric typewriters and Apple IIE computers with Compaq 486s and software and workstation furniture. (Morgan County, Ohio) Clermont College Workforce Development Facility. This grant was designed to purchase equipment for two computer labs and a learning center, providing computer access to 1,000 new students and area employees at the Clermont College campus. The labs were to improve job-training programs, offer remedial assistance, and support the engineering, biology, chemistry, and law enforcement curriculums. Sixty computer units were requested for the two labs and seven computer systems to equip the learning center. Brow and Clermont Counties, Ohio)

32
AdFresstudeedgrredeWCoDefarewotracoacancoPaFaanapmThsqspfaCo
Table 4-3 Percent of Cohort 1 projects reporting physical plant activities (n=67)
Physical plant activity Percent Any physical plant activity ..................................... 45 Build new structure ................................................. 7 Renovate existing structure..................................... 30 Purchase/install office furniture.............................. 24 Lease property or space .......................................... 6
SOURCE: 2001 mail survey of ARC grantees.
Among the physical plant activities conducted, 33 percent were supported wholly or in part by ARC funding (including the associated match) (Table A4-4).
Training, Training Materials, and Project Staff Training Training, along with the availability of appropriate training materials and a staff trained on project equipment, represents the substance of vocational education and workforce training projects. As the primary focus of most projects, training activities varied on a number of dimensions. Training activities conducted. Almost all (99 percent) of ARC’s vocational education and workforce training projects conducted training activities (Table 4-4). The most frequently conducted types of training were occupational or technical training (97 percent) and academic training or enhancement (72 percent) (see Exhibit 4-3). Projects also provided business management training (21 percent) and adult basic education (7 percent). Table 4-4 Percent of Cohort 1 projects reporting conducting various training activities (n=67)
Training activity Percent Any training activity................................................ 99 Occupational/technical training .............................. 97 Academic training or enhancement......................... 72 Business management training................................ 21 Adult basic education .............................................. 7 Other ........................................................................ 3
SOURCE: 2001 mail survey of ARC grantees.
Exhibit 4-2. Examples of physical plant improvements
vanced Graphic Design Laboratory at ostburg State University. The project would tablish a graphic design laboratory for training dents in the advertising, printing, and graphic sign industry, as well as offering continuing ucation workshops for industry personnel. The ant would also purchase laboratory equipment, novate classroom space, and revise the graphic sign curriculum. (Allegany, Garrett, and ashington Counties, Maryland) lumbia/Adair County Training and velopment Center. This project will construct a
cility designed and equipped to meet training and -training requirements of the local and regional rkforce. The two-story facility will provide ining rooms, a computer lab, a media room, and nference rooms. Training rooms will commodate up to 60 people for general training d education classes, and the computer lab will ntain 12 workstations. (Adair County, Kentucky) rtners in Progress Operations and Training cility Project. This project includes the purchase d renovation of a 7,600 square foot building on proximately 2.5 acres to be used for light anufacturing and training of disabled individuals. e project also involved the construction of a 5,600 uare foot addition to house the administrative ace, equipment testing rooms, locker and cafeteria cilities, and conference/training area. (Tioga unty, Pennsylvania)
Exhibit 4-3. Examples of training provided Precision Manufacturing Institute Tool and Machine Training. The project purchased equipment required to expand tooling and machining training in three counties (Crawford, Erie, Warren) in northwest Pennsylvania. The program featured high-density training based on an accelerated curriculum designed to reduce entry-level training time for the tooling and machining industry by at least 50 percent. (Crawford, Erie, and Warren Counties, Pennsylvania) Armstrong Industry Skills & Employability Partnership (InSTEP) Project. This project consisted of 120 hours of instruction in the areas of communications, computer literacy, math, safety and health, personal development, quality, teamwork, technology, and plant tours. Five to six cycles of instruction were to be completed. (Armstrong County, Pennsylvania)

33
Exhibit 4-3. Examples of training provided (continued)
SWVA E-Commerce/Economic Hope for an Underemployed Workforce. This project was established to develop an e-commerce video training project for the underemployed, individual entrepreneurs, and small business owners in the four-county region. The project was to include a training session and the production of a 10-session video course, which provided instruction to participants on developing a web site, online catalog of products and services, and an online purchasing system. (Buchanan, Dickenson, Russell, and Tazewell Counties, Virginia)
Projects that were serving those with full-time job experience appeared more likely to conduct business management training or adult basic education than projects serving those without full-time job experience (Table A4-5). Also, projects serving primarily youth or primarily adults appeared more likely to provide academic training or enhancement than were projects serving both youth and adults, possibly because providing academic training to a mixed age group is more difficult. Across all 134 training activities that the projects reported conducting, 53 percent were funded wholly or in part by ARC (Table 4-5). Eighty percent of adult basic education, 64 percent of business management training, 55 percent of occupational/technical training, and 44 percent of academic training or enhancement were conducted with at least some ARC funding.
Location of training. Training activities take place in a variety of settings. Those conducted in shops or labs and at worksites generally involved hands-on activities, whereas classroom activities are more likely textbook or lecture-based. Of course, both are critical to quality training. Most occupational/technical training was conducted at a school-based shop or lab (69 percent) or a school-based classroom (51 percent) (Table 4-6). Academic enhancement was also mostly conducted in school-based classrooms (63 percent) and school-based shops or labs (57 percent), as was business management training. Relatively fewer training activities were conducted on the job (19 percent) or in worksite classrooms (12 percent). This suggests that ARC projects attended to multiple learning styles, with both hands-on and text- and lecture-based activities. Table 4-5 Percent of training activities conducted with ARC funding
Training activity Percent
conducted with ARC funding
All training activities (n=134).............................. 53 Occupational/technical training (n=65)................ 55 Academic training or enhancement (n=48) .......... 44 Business management training (n=14)................. 64 Adult basic education (n=5)................................. 80 Other training activity (n=2) ................................ 50 NOTE: Percent estimates are based on the projects that indicated they conducted training activities. SOURCE: 2001 mail survey of ARC grantees.
Table 4-6. Percent of training activities conducted in various locations
Location
Training activity School-based classroom
School-based shop or lab
Worksite classroom
Worksite (on the job)
Home or other distance
learning center All training activities (n=134).............. 54 58 12 19 1 Occupational/technical training (n=65) 51 69 14 23 2 Academic training or enhancement
(n=48)............................................... 63 52 8 10 0 Business management training (n=14). 57 43 14 21 0 Adult basic education (n=5)................. 40 20 20 40 0 Other training activity (n=2) ................ 0 50 0 50 0
NOTE: Percents do not sum to 100 because respondents could select more than one training location. SOURCE: 2001 mail survey of ARC grantees.

34
That more training was conducted in schools, as opposed to worksites, likely reflected the fact that education organizations were most likely to receive ARC grants. (As reported in Chapter 3, 90 percent of Cohort 1 grants were awarded to educational institutions.) Duration and frequency. Projects varied in both the duration and the frequency of the training that was provided to individual participants. Overall, training activities tended toward longer durations; 31 percent lasted longer than 12 months, 26 percent occurred over a 8- to 12-month period, and 19 percent occurred over a 4- to 7-month period (Table 4-7). Similarly, projects tended to conduct trainings frequently, with 75 percent of all training activities being conducted more than once a week (Table 4-8). This suggests that ARC projects were attending to general beliefs that ongoing and regular training were more productive than one-shot or sporadic training.
Training materials developed. Many projects (61 percent) developed materials to use in the training activities they conducted (Table 4-9). About half developed or purchased instructor or teacher manuals and curricula (54 percent) or developed or purchased student manuals and materials (48 percent). Forty percent of the projects developed curriculum or performance standards or proficiencies, including those that align with industry skill standards. Table 4-9 Percent of Cohort 1 projects reporting developing various types of training materials (n=67)
Training materials developed Percent Any training materials ............................................. 61 Instructor/teacher manuals/curricula....................... 54 Student manuals/materials ...................................... 48 Standards/proficiencies aligned with industry ........ 40
SOURCE: 2001 mail survey of ARC grantees.
Table 4-7 Percent of training activities by duration
Duration Training activity Less than 1
month 1-3 months 4-7 months 8-12 months
Longer than 12 months
All training activities, total (n=130).................. 8 16 19 26 31 Occupational/technical training (n=64) ............. 9 17 19 25 30 Academic training or enhancement (n=47) ....... 6 11 21 28 34 Business management training (n=13) .............. 8 15 23 23 31 Adult basic education (e.g., literacy) (n=4) ....... 0 50 0 50 0 Other (n=2)......................................................... 0 50 0 0 50
NOTE: Percents may not sum to 100 due to rounding. Duration was not provided for four training activities. SOURCE: 2001 mail survey of ARC grantees.
Table 4-8 Percent of training activities by frequency
Frequency Training activity More than once
a week Once a week 2 to 3 times per month Once a month Less than once
a month All training activities, total (n=130)................... 75 9 2 5 8 Occupational/technical training (n=64) ............. 78 6 3 3 9 Academic training or enhancement (n=47)........ 79 11 2 4 4 Business management training (n=13)............... 62 8 0 15 15 Adult basic education (e.g., literacy) (n=4) ....... 50 25 0 25 0 Other (n=2) ......................................................... 50 50 0 0 0
NOTE: Percents may not sum to 100 due to rounding. Frequency was not provided for four training activities. SOURCE: 2001 mail survey of ARC grantees.

The majority of these materials (57 percent) were developed wholly or in part with ARC funding (including the associated match) (Table A4-7). Specifically, 63 percent of student manuals and materials, 56 percent of instructor manuals and materials, and 52 percent of standards and proficiencies were at least partly funded by ARC. Exhibit 4-4 provides examples of the training materials developed with ARC support. Training of project staff. With the acquisition of new equipment and training materials and plans to conduct training activities, many projects (75 percent) delivered training to project staff (Table 4-10). Almost two-thirds (64 percent) provided training on project-purchased equipment, while 60 percent provided training on content in a specific skill or knowledge area. Fewer projects provided training on pedagogy or teaching skills to training staff.
Table 4-10 Percent of Cohort 1 projects reporting training project staff in various areas (n=67)
Project staff training area Percent Any project staff training ........................................ 75 Project-purchased equipment .................................. 64 Specific skill or content area ................................... 60 Pedagogy or teaching skills..................................... 31
SOURCE: 2001 mail survey of ARC grantees.
Project staff training activities were conducted with at least some ARC funding less often (36 percent) than other training-related activities (Table A4-9). Forty percent used at least some ARC funding to train staff on project-purchased equipment, while 33 percent used ARC funding to train staff in specific skills or content areas and to provide staff training in pedagogy or teaching skills. Exhibit 4-5 provides examples of project staff training conducted with ARC support.20 Job Search Assistance and Career Counseling Most projects (68 percent), along with their equipment and training, provided participants with other essential assistance they might need to obtain or retain a job (Table 4-11). Two-thirds (66 percent) offered participants an opportunity to develop or refine their employability skills, such as positive work attitudes, dependability, punctuality, and good work habits. About half provided career counseling (57 percent) and job search and placement assistance (48 percent) to potential job seekers or students. One-third (36 percent) did not provide these services themselves, but made referrals to other agencies for participants to find job placement or counseling assistance. Exhibit 4-6 provides examples of ARC-supported job search assistance and career counseling services.
20 We were not able to find specific references to project staff training
in projects’ documentation, even for projects that indicated on the survey they conducted the training. Therefore, we believe that survey that respondents may have interpreted project staff training more broadly than intended, including instructors, faculty, and other trainers as project staff, and professional development and staff
WinCurrtradeautom trade and classRust Engiimpl for proginstr with prog courEastDevedesig prognew mana craftexpa Comdeve tech- instr prog20 st Kent
Exhibit 4-4. Examples of training materials development
ston County Technical Center Vocational iculum. This project was designed to upgrade and industrial training programs in otive mechanics, electronics, and the building
s. The grant would fund updating equipmenttraining aids, such as software, manuals, androom supplies. (Winston County, Alabama) College Microsoft Certified Systemsneering Program. The project would ement software engineering training programsminority college students as a 1-year pilotram. The college would contract the uctional sessions and examination preparation the New Horizon Learning Center. Theram would also purchase required Microsoftse kits. (Marshall County, Mississippi) Kentucky Workforce Planning and lopment Program. This project was ned for the development of three new degree
rams at Southeast Community College. The educational programs in hospitality
gement, golf course management, and arts ands design are expected to support the region’s nding cultural tourism industry. The Southeastmunity College would use the funds to lop and field test classes, create internships andprep programs, acquire materials, trainuctors, purchase equipment, and market therams. The programs are expected to graduate udents per year within 2 years. (Multi-county,ucky)
35
development activities as project staff training.

36
As might be expected, these services appeared to be provided more often by projects primarily serving youth and those without full-time job experience than by projects primarily serving adults and those with full-time job experience (Table A4-10). In fact, no projects serving those with full-time job experience provided job search assistance, as compared to almost two-thirds of projects serving those without full-time job experience and over one-third of projects serving those of both experience levels.
Table 4-11 Percent of Cohort 1 projects reporting providing job search assistance and career counseling activities (n=67)
Assistance/counseling activity Percent Any job search assistance........................................ 68 Career counseling .................................................... 57 Job search/placement assistance ............................. 48 Employability skills................................................. 66 Referrals to other agencies for assistance ............... 36
SOURCE: 2001 mail survey of ARC grantees.
Exhibit 4-5. Examples of project staff training
Regional Technology Training Center. This project will initiate delivery of a four-part intensive learning program to over 50 out-of-school adults, 65 high school students, and 6 vocational education instructors, providing instruction in the networking skills needed to compete in today’s technologically advanced labor markets. (Allegany, Cattargus, and Chautauqua Counties, New York) Pennsylvania Appalachian Workforce Development Program. This project was designed to support the continuation of a workforce development program to help employers in Appalachian Pennsylvania. The project was designed to help employers compete in the national and international marketplace by providing top quality training, including supervisory, technical, and team building training. Key work elements include workforce development training activities, one-on-one training (customized by company or sector), supplier training consortium activities, and mentor training programs. (Multi-county, Pennsylvania) Alfred State College Computer Technology Center. Alfred State College of Technology will develop and implement a Computer Technology Educational Center, including the purchase and installation of computer equipment and software, the development of curricula, and upgrading of current faculty skills. The grantee will also offer professional certification testing such as Web Design, A+, and Microsoft Certified Systems Engineer (MCSE), not otherwise available locally. The Computer Technology Educational Center will have the capacity to offer services to community members and area businesses as well as students, further benefiting local economic development. (Allegany County, New York)
as
CorAllidesihaveenabthe asseACTworgradNewAppHalstronagenhighhighand careoppoincrcolleencoand colleconf(HaFresprojtrainand Starnon-TheasseSeleat thor eprovand Way
Exhibit 4-6. Examples of job search sistance and career counseling services
tland County Education and Business ance WorkKeys Project. This project was gned to ensure that all Cortland County youth the basic workplace readiness skills that will le them to compete in the world economy of 21st century. At least 600 students will be ssed using the WorkKeys instrument from , Inc., and 510 will either successfully enter the
kforce or continue their education upon uation from high school. (Cortland County, York) alachian Center for Higher Education in
e (ACHEH). The HERO center will utilize a g team approach composed of community cies, the local school district, and institutes of er education. Mini-grants will be given to local schools in order to help students plan, explore, experience the various possibilities for selecting ers in order to promote the importance and rtunities of postsecondary education and
ease the number of students participating in ge. The ACHEH in Hale approach will be to urage high school students to explore career college options, to inform them about careers, ges, and financial aid, and to engender idence for success in college and life choices. le County, Kentucky) h Start Community Career Center. This
ect was designed for the expansion of a job-ing program that will serve at least 60 people place at least 15 of them in jobs. The Fresh
t Career Center will be located at Goodwill’s profit food processing plant in Wayne County.
agency conducts outreach services, skills ssment, and job training programs for citizens. ct clients already receive food service training e plant, and are then placed in jobs at the plant lsewhere in the community. The grant will ide funds for training staff, training supplies, food processing equipment. (Pulaski and
ne Counties, Kentucky)

Less than one-quarter (21 percent) of these activities were provided wholly or in part with ARC funding (Table 4-12). At least some ARC funding was used to provide 27 percent of the employability skills training, 19 percent of job search and placement assistance, 18 percent of career counseling, and 17 percent of referrals. Table 4-12 Percent of job search assistance/career counseling activities provided with ARC funding
Assistance/counseling activity Percent funded by ARC
All job search assistance/career counseling
activities (n=138) ............................................ 21 Career counseling (n=38).................................... 18 Job search/placement assistance (n=32).............. 19 Employability skills (n=44) ................................ 27 Referrals to other agencies for job
assistance/career counseling (n=24)................ 17 NOTE: Percent estimates are based on the projects that conducted job search assistance/career counseling activities. SOURCE: 2001 mail survey of ARC grantees.
Social Support Services As discussed in Chapter 3, project participants and students often face a number of barriers to obtaining job training and employment. Accordingly, a small number of ARC vocational education and workforce training projects (31 percent) provided social support services to participants to help them overcome these barriers (Table 4-13). One-quarter (24 percent) of the projects made referrals to other agencies for participants to access social services. Eighteen percent provided financial assistance, while assistance arranging transportation and assistance arranging child care were provided by 7 percent and 6 percent of projects, respectively. See Exhibit 4-7 for an example of social support services provided by an ARC-funded project.
Table 4-13 Percent of Cohort 1 projects reporting providing social support services (n=67)
Social support service Percent Any support service................................................. 31 Assistance arranging child care............................... 6 Assistance arranging transportation ........................ 7 Financial assistance ................................................. 18 Referrals to other agencies for social support
services................................................................ 24
SOURCE: 2001 mail survey of ARC grantees.
Financial assistance was provided by projects serving both full-time workers and those without full-time job experience, but assistance arranging child care and transportation was provided by projects serving those without full-time jobs but not by those serving full-time workers (Table A4-11). While we might expect full-time workers to have more child care needs, we must assume that these needs had already been met. In contrast, child care appeared to be more often provided by projects serving primarily adults than by those
Steuben AProgram. ARC, watraining. Iwelfare-to-receive fuspecializedand find project wiwork oppmental hecontinue opportunitidisabilitiespotential, wtheir own,greater ratBenefits aincreased ithe state, support ofprovided tfrom trainYork)
Exhibit 4-7. Example of social support services
RC Expansion of Printing Training This grant, awarded to the Steuben
s designed to provide employment t is the intention of the project to enroll work participants for mentoring as they ndamental work training and more skills training matched to their interests jobs in competitive employment. The ll also continue to provide training and ortunities for trainees with ongoing alth issues. Finally, the project will to provide the quality training and es for people with developmental , helping them to reach their highest
hether that be in a competitive job of in a supported, job, or earning at a e in the employment training facility. re measured not only in terms of ndividual income and related profits for but also in terms of reduced costs for the individual. Additional support is o participants for transportation to and ing activities. (Steuben County, New
37

38
serving primarily youth. Financial assistance was also provided more often to adults than to youth. As with other extra services activities discussed above, ARC funding was infrequently used to cover the cost of providing social support services (16 percent) (Table A4-12). One-quarter (25 percent) of projects provided assistance arranging child care wholly or in part with ARC funding, while 20 percent provided assistance arranging transportation with ARC funding and 19 percent provided referrals to other social services agencies with ARC funding. Only 8 percent provided financial assistance with at least some ARC funding. For example:
In addition to providing job placement assistance, the outreach coordinator at the Manufacturing Assistance Center (MAC) assists students in finding services they will need to be successful on the job. She helps students obtain “welfare” bus passes, drivers permits and licenses, and resources to buy cars. She ensures that students on welfare access allowable clothing budgets to purchase clothing, such as steel-toed boots, required by some employers. While the MAC does not provide funding for transportation or clothing expenses, the outreach coordinator puts students in touch with social service organizations such as the St. Vincent de Paul Society and the Salvation Army that do. (Manufacturing Assistance Center)
Community-Wide Activities Almost two-thirds (64 percent) of projects conducted community-wide activities (Table 4-14). Like equipment and training materials for some projects, community involvement is critical in others. Sixty percent of projects established community or business partnerships, while 39 percent provided community outreach activities and 10 percent distributed funds or mini-grants Exhibit 4-8 provides examples of the community-wide activities of ARC-funded projects. Community or business partnerships appeared to be established more often in nonmetropolitan
counties or projects serving both metropolitan and nonmetropolitan counties than in metropolitan counties (Table A4-13). The same was true for community outreach activities. Community-wide activities appeared to be conducted more frequently by projects serving distressed counties than those serving no distressed counties. These findings suggest that nonmetropolitan and impoverished areas are in need of more assistance than other areas in bringing the community together to provide vocational education and workforce training. For example:
The Ohio Fund for Appalachia Industrial Retraining (FAIR) project assists companies in the Appalachia region by providing funds to support the training of unemployed and underemployed individuals. FAIR receives a single grant from the ARC and then distributes individual subgrants to companies engaged in workforce training. The program operates under the Ohio Industrial Training Program (OITP), which provides funding to new and expanding businesses in Ohio. FAIR assists companies that are often not served by OITP because they are smaller and cannot garner as many resources as companies in cities and other areas of the state. (Ohio FAIR)
Table 4-14 Percent of Cohort 1 projects reporting conducting community-wide activities (n=67)
Community-wide activity Percent Any community-wide activity................................. 64 Establish community or business partnership......... 60 Distribute funds or mini-grants ............................... 10 Provide community outreach ................................. 39
SOURCE: 2001 mail survey of ARC grantees.

39
Almost all of the funds or mini-grants distributed by projects were supported by at least some ARC funding (86 percent) (Table A4-14). Far fewer of the community outreach activities conducted (31 percent) and community or business partnerships established (28 percent) were wholly or partly funded by ARC. COHORT 2 PROJECTS Cohort 2 projects’ activities followed much the same pattern as those in Cohort 1. Among the 25 projects, the vast majority developed training materials (88 percent) and conducted training (88 percent) (Table 4-15). The majority also purchased, rented, or leased equipment (72 percent) and provided community-wide activities (64 percent). Almost half provided job search assistance and career counseling (48 percent) and trained project staff (48 percent). As with Cohort 1, only a few augmented a physical plant (32 percent) and provided support services (16 percent). Table 4-15 Percent of Cohort 2 projects reporting activities in various categories
Type of activity Cohort 2 (n=25)
Equipment purchased, rented, or leased........................... 72 Training activities............................................................. 88 Job assistance and career counseling ............................... 48 Support services ............................................................... 16 Physical plant ................................................................... 32 Project staff training ......................................................... 48 Training materials development....................................... 88 Community-wide activities .............................................. 64
SOURCE: 2001 mail survey of ARC grantees.
Exhibit 4-8. Examples of community-wide activities
Technology Connections for Educational Excellence: School and Business Partnerships. This project was designed to link high school computer labs and local businesses via telephone lines and modems. Funding would support the computer equipment and training for teachers and business personnel. Students would work on actual business projects under the direction of a teacher and coordinator. Workshops would provide hands-on practice using the system. (Chemung County, New York) SCT BOCES Mobile Technology Unit. This grant was designed to purchase and run a mobile “technology bus” serving the Southern Tier of New York State and northern Pennsylvania. The mobile technology bus, fully equipped with computers, will provide customized on-site training for local business and industry. The bus will also assist businesses in developing an e-commerce presence, provide access to technology at satellite GED course locations, bring computer technology to low-income housing projects, disabled persons, and senior citizens, provide career information to both adult and public school students, and assist in deploying emerging technology to school districts throughout the region. (Chemung, Schuyler, and Tioga Counties, New York; Bradford and Tioga Counties, Pennsylvania) The Kentucky Appalachian Higher Education Network Center (KY AHED Center). The Morehead State University center will serve 38 high schools in 23 counties in Appalachian Kentucky. The KY AHED Center will comprise regional partnerships of institutions of higher education, local education agencies, not-for-profit organizations, and assorted community-based organizations. Two types of grants will be awarded: challenge grants to local school districts and challenge grants to network institutions. The scope of work for these grants includes building self-confidence among students, assisting students and their parents with planning college and career choices, and demystifying the higher education experience. (Multi-county, Kentucky)

40
IMPACT OF THE ARC GRANT Cohort 1 respondents were asked to hypothesize what would have happened if their project had not received federal funding through ARC. Only two projects (3 percent) felt that they would have been fully implemented using alternative sources (Figure 4-1). Conversely, just under half (45 percent) believed that their activities would never have been implemented without their ARC award. The remaining respondents indicated that without ARC support, their activities would have only been partially implemented (52 percent). As shown in Figure 4-2, most of these 35 projects would have provided significantly fewer services (91 percent) or reached significantly fewer people (77 percent). In addition, almost all (91 percent) would have been substantially delayed. That only two respondents indicated they would have been able to fully implement their projects without ARC support signifies the extreme importance the projects placed on their ARC funding. Even when ARC only supported a portion of a project’s overall approach, respondents believed that their entire effort would have been jeopardized if Commission funding had not been made available. Figure 4-1 Percent of projects reporting the most likely outcome if the project had not received ARC funding (n=67)
������������������������������������������������������������������������������������������������������������������������������������������������������������������������������������������������
52%45%
3%
The project wouldhave been partiallyimplemented
��������
The project wouldnever have beenimplementedThe project wouldhave been fullyimplemented
SOURCE: 2001 mail survey of ARC grantees.
Figure 4-2 Among Cohort 1 projects that would have been partially implemented without ARC funding (n=35), the percent reporting various effects
9%
91%
Project would stilloffer full range ofservices
Project wouldprovide slightlyfewer services
Project wouldprovidesignificantly fewerservices
6%
17%
77%
Project wouldhave reached anequivalentnumber of people
Project wouldhave reachedslightly fewerpeople
Project wouldhave reachedsignificantlyfewer people
9%
91%
Project would haveimplemented onthe same schedule
Implementationwould have beenslightly delayed
Implemenationwould have beensubstantiallydelayed
SOURCE: 2001 mail survey of ARC grantees.

41
IMPLEMENTATION PROBLEMS
ENCOUNTERED While project close-out documents and case study findings indicate that projects were generally able to implement their planned activities, findings from the mail survey suggest that a few projects did encounter some obstacles as they carried out their approach. For the most part, these obstacles appear to have merely hindered a project’s overall effectiveness or altered its implementation strategy, e.g., introducing time delays, limiting the range of services or potential beneficiaries. This section describes the few problems that hindered projects’ efforts to conduct the activities that were funded by ARC (including the associated match). Survey respondents were provided with a list of common implementation problems and asked to indicate which ones pertained to their project efforts. Nearly two-thirds (64 percent) of projects reported that they had no implementation problems, while 18 percent reported only one problem (Figure 4-3). Three projects each reported two problems, three problems, and four problems. Figure 4-3 Percent of Cohort 1 projects reporting number of problems to implementing ARC-funded activities (n=67)
1
3
4
4
4
18
64
0 20 40 60 80 100
6
5
4
3
2
1
0
Num
ber
of p
robl
ems
Percent of projects
SOURCE: 2001 mail survey of ARC grantees.
As shown in Figure 4-4, no single obstacle was reported by more than 15 percent of projects, with the most frequently reported obstacle being participants not maximizing the use of project services (15 percent). In addition, seven projects (10 percent) indicated they encountered difficulties installing equipment, six projects (9 percent) reported that they underestimated the time or effort needed, and six projects (9 percent) underestimated the resources needed to implement their approach. Four projects (6 percent) each cited local administrative delays and communication problems. The remaining problems were cited by only one or two projects. See Exhibit 4-9 for examples of obstacles projects faced. That there were few management problems reported suggests that projects felt they were doing an adequate job managing themselves. The site visits were intended to provide an opportunity to delve more deeply into the types of problems that projects encountered.21 However, we discovered very few implementation problems in the five sites. Moreover, the greatest problem encountered was one of the national economy, rather than of the ARC project itself. For example, a downturn in the national economy greatly diminished the need of one project to hire new workers. (This had been one of the project’s primary goals at the time the ARC grant was awarded.) Taken together, the findings from the survey and case studies suggest that projects were generally able to implement their approaches as planned. In addition, the absence of any grant-related obstacles, such as lack of access to technical assistance, suggests that respondents generally viewed the level of support provided by ARC staff as both timely and sufficient to meet their needs.
21 As discussed in Appendix D, these five case study sites were not
representative of the overall study sample. They were selected because they had implemented and sustained a unique approach that warranted further study.

42
Figure 4-4 Percent of Cohort 1 projects reporting implementation obstacles for ARC activities (n=67)
3
11
3
315
133
10
11
6
13
6
499
0 10 20 30 40 50
Matching funds less than expected/needed
Project funds depleted before implementation
Community/families not supportive
Construction delays
Installing equipment
Excessive staff turnover
Communication problems
Lack of access to technical assistance
Local administrative delays
Underestimated the demand for services
Underestimated time/effort needed
Percent of projects
Underestimated the resources needed
Grant not awarded in timely manner
Inadequate or underqualified staff
Delays due to outside providers
Development of program materials
Participants not maximizing use of services
Matching funds never received
Planning
Administrative
Personnel
Implementation
Community
Cost
Other
SOURCE: 2001 mail survey of ARC grantees.
Exhibit 4-9. Examples of implementation obstacles Welfare Parent Empowerment Project. The biggest problem that was faced during the contract period was retaining trainees. The program attracted 21 participants, but only 8 remained to meet all the requirements of the program. This loss of trainees was brought about by a number of factors. Childcare is a very demanding profession. Some participants were not prepared to deal with the constant needs of young children. Also, some participants left to seek employment. Some participants did not have the necessary family support to continue. (Harlan County, Kentucky) Youth Apprenticeship Program. The main challenge that the coordinator faced was the difficulty that many of the students had in completing each mini-semester. Because many of the students worked full time, or had parenting obligations, it was very difficult for them to handle work and school. This was difficult on the coordinator due to the amount of time that was spent on each apprentice developing the work site and training plan. (Whitfield County, Georgia)

43
SUMMARY AND CONCLUSIONS With the possible exception of support services and barrier reduction, all of the activities and project components in our conceptual framework for vocational and workforce projects were covered by the projects in the study sample. That ARC projects in both cohorts conducted training and acquired equipment in such vast numbers, and that the majority of projects were conducting other critical activities, suggest that ARC’s portfolio of vocational education and workforce training projects provides adequate coverage of the activities represented in our conceptual framework. While barrier reduction and support services are conducted less frequently by ARC projects, they may be conducted as part of the larger agencies within which the ARC projects operate. ARC may want to investigate whether projects are in fact meeting these needs, and, if they are not, determine whether there is additional work that can be done to meet them.
The fact that so few projects indicated they face implementation problems is indeed good news. It suggests that ARC grant reviewers are selecting appropriate projects to fund and that the technical assistance by ARC staff is helpful.
For all categories (except equipment for which comparable data were not collected), ARC funding and the associated match supported a much smaller percentage of activities than did all sources of funding. This is an indication that the projects’ ARC funds are in fact supporting—and leveraging—much more than may have been indicated in a grant application or final report. Thus, while ARC is funding what may be a small portion of a project, it should be recognized that, overall, projects seem to be providing a full range of services to their beneficiaries. This suggests that even when ARC is not directly supporting projects to provide a fuller range of services indicated in our conceptual framework, the projects are often providing those services with other sources of funding. In addition, only two projects felt they would have been fully implemented in the absence of ARC funding, whereas 30 projects believed they would never have been implemented without ARC’s support. This suggests that, in at least some cases, ARC provides some “last mile” funding for training and equipment, without which the projects might not exist. That is, ARC is providing funding that projects would not get from any other source and that is critical to the initial launch and ongoing operation of the project.

44

45
Achievement of Objectives
The ultimate test of the merit of an ARC project is whether it eventually achieves its intended objectives and whether the various activities and program components do follow the flow chart and lead to projects’ objectives. As such, a major purpose of this evaluation was to “determine the
extent to which these projects have achieved or contributed to the attainment of the projects’ objectives” (Request for Proposals by the Appalachian Regional Commission for a Program Evaluation of Workforce Training and Vocational Education Projects, July 15, 2000). This chapter assesses the degree to which Cohort 1 projects were able to achieve the outputs and outcomes that they delineated in their original requests for ARC support,22 and thus, the emphasis is on the
22 Because many Cohort 2 projects were still receiving ARC funding
at the time the survey was administered, the output/outcome addendum was excluded from the abbreviated survey for Cohort 2 projects. Therefore, they are excluded from this discussion.
outcomes that were directly associated with projects’ ARC grants.23 In an effort to assess the extent to which grant recipients achieved the objectives they had set for themselves, we reviewed each project’s
application materials to identify the objectives they originally specified. These objectives were entered into a database that was then used to generate an addendum to the mail survey. This addendum, customized for each project, provided respondents with an opportunity to (1) indicate whether or not they met each of their own objectives, (2) identify the types of data collection activities that were used to ascertain whether the objective was achieved, and (3) provide tangible evidence that a given objective was achieved or describe factors that hindered their ability to achieve a desired goal.
23 As the objectives were taken from projects’ ARC applications, we
assume they were intended to be attained, at least in part, through ARC funding.
V.
Support Services child care assistance transportation assistance financial assistance referrals
Job Search and CareerServices career counseling job search assistance employability skills
Project Participants in school unemployed employed
youth adults
Program ComponentsPlace equipment physical plant project staff training materials community awareness
Other Mediating community context grant recipient funding industry
Classroom Training adult basic education academic vocational/technical employability
Worksite Training on-the-job training apprenticeship Obtain Skills
basic skills academic skills vocational/technical skills employability skills
Gain/Retain Initial Full-TimeEmployment
Improved Employment maintain current employment increase responsibilities earn promotion increase wages obtain/retain new jobs
Community Impacts viability/stability/growth of businesses economic/social viability of communities
Ameliorate Barriers increase access to transportation increase access to child care increase access to clothing/food/shelter
Obtain Degree/Credential secondary degree or equivalent proficiency credential in conjunction with a secondary school diploma postsecondary degree/credential/ certificate
Context Activities Outputs and Outcomes

46
To the extent possible, the phrasing for the objectives provided in the addendum was taken directly from projects’ original applications to ARC. In a limited number of cases, however, the objective either had to be inferred (e.g., from more general language in the proposal) or taken from other sources (e.g., the official contract between the ARC and the grant recipient, ARC press releases). While the specific objectives were drawn from project materials, they were categorized into seven groups—services provided to individuals, services provided communities, barrier reduction, skill attainment, degree attainment, employment status, and community viability—which map to the unshaded areas of the conceptual framework for an individual’s progress through a vocational education and workforce training project. Once they received the survey, respondents could contact Westat if they believed that the outputs and outcomes listed in the addendum were not representative of what their ARC project was designed to achieve. (None did so.) Respondents could also provide information about any additional ARC-related objectives that were not already listed in the addendum. (Seven projects described additional outcomes.) In reviewing these findings, it is important to note that we did not attempt to substantiate projects’ claims that they had achieved their ARC-supported objectives. The evaluation was not intended to be an audit of projects’ accomplishments. Rather, it was designed to identify the evidence projects used to corroborate their claims of success. Although we asked projects to provide written evidence that a given objective had been achieved, the evaluation did not assess whether these gains had, in fact, occurred. Nor did we ascertain whether the methodologies they used to document these gains were applied in a rigorous and appropriate manner.24 In addition, with many grant recipients receiving funding and support from multiple 24 For example, in one case study site, we found that a telephone
survey that was being used to assess participants’ post-intervention employment status was actually a series of informal conversations with several area businesses. While the information obtained through these conversations was accurate (and appropriate, given the scope of the project), the actual methodology did not approach the rigor that is generally associated with telephone surveys.
sources, we were not able to determine the extent to which a project’s accomplishments were directly or indirectly attributable to the ARC grant. As such, our inclusion of a project’s evidence in this section should not be viewed as confirmation that the corresponding outcome was, in fact, achieved, or that the methodology was suitable and/or applied in an appropriate manner. OVERALL ACHIEVEMENTS OF
COHORT 1 PROJECTS Table 5-1 shows the number of objectives that projects proposed and the number of those objectives that were achieved. For example, among the 12 projects that stated three objectives in their proposals, one achieved one objective, five achieved two objectives, and six projects achieved all three stated objectives. Table 5-1 Number of Cohort 1 projects reporting that they achieved their objectives
Number of objectives achieved Number of objectives in
ARC proposal 1 2 3 4 5 6 7
Number of projects
1 3 3 2 3 8 11 3 1 5 6 12 4 2 5 5 4 16 5 1 1 3 5 10 6 2 1 2 0 5 7 1 1 4 6 8 1 1 2 9 1 1
10 0 11 0 12 1 1
Number of projects 10 20 14 8 8 2 5 67
NOTE: Shaded numbers indicate Cohort 1 projects that achieved all of their objectives. SOURCE: 2001 mail survey of ARC grantees.
The table shows that all of the Cohort 1 projects reported that they achieved at least one of their objectives. In fact, the majority of the 67 projects reported achieving all (45 percent) or all but one (27 percent) of their objectives. In addition, 73

47
percent met at least three-quarters of their intended objectives. Only six (9 percent) achieved fewer than half of their objectives. To gain another perspective on the overall achievement of Cohort 1 projects and to quantify the impact of ARC support at the project level, the survey asked respondents to estimate the number of individuals who had benefited at each stage as a direct or indirect result of their ARC grant. For each type of beneficiary for which data might be provided, respondents were instructed to indicate (1) the number of individuals who benefited as a direct or indirect result of the ARC grant, (2) “not applicable” if an output or outcome was not an intended objective of their project,25 (3) “don’t know” if they were unable to provide a reasonable estimate for an objective that pertained to their project, or (4) “0” if ARC support did not directly or indirectly affect the number of persons who achieved an objective that pertained to their project. As such, there was considerable variation in the number of projects that provided information for each of the objectives on the survey. The range in the number of beneficiaries varied considerably across the Cohort 1 projects, as did the number of projects estimating the number of beneficiaries.26 As such, findings are provided as medians (as opposed to means) so that no single project has an inordinate impact on any given category. Using the conceptual framework, we were able to map out the progression of the number of participants who typically benefit from ARC vocational education and workforce training projects: • Projects reported that a median of four project
staff received training as a result of the ARC grant (Table 5-2). As discussed in Chapter 4, such training is often necessary to lay the
25Survey logic checks and telephone followup with all Cohort 1
survey respondents ensured that only those projects that had conducted an activity—and therefore could expect to have beneficiaries—provided estimates for a particular category.
26As indicated in the table, only projects that intended to provide a given benefit and that could provide a reasonable estimate were asked to provide a number.
groundwork for subsequent work with project beneficiaries.
• Projects reported providing academic or vocational training, the first step in our flow chart, to a median of 195 individuals.
• Projects reported that a median of 51 individuals received career counseling or job search/placement assistance as result of the ARC grant.
• Projects reported that a median of 50 individuals obtained a degree or credential as a result of the ARC grant.
• Projects reported that a median of 60 individuals obtained employment as a result of the ARC grant.
Because no examination of causality was conducted, we cannot suggest there is a correlation between the medians. That is, we cannot infer that because individuals received job training, they went on to obtain jobs as a result. Nevertheless, the figures are a useful approximation of the number of people directly or indirectly affected by ARC. Table 5-2 Number of individuals from Cohort 1 who benefited as a result of the ARC grant, by type of benefit
Type of benefit Median Maximum Project staff who received training (n=51) 4 300 Participants who received academic or
vocational training (n=66) ..................... 195 8,534 Participants who received career
counseling or job search/placement assistance (n=36).................................... 51 7,000
Participants who received support services (n=17)....................................... 0 996
Participants who obtained a relevant degree or credential (n=48).................... 50 7,000
Participants who were placed in jobs (n=47)..................................................... 60 5,000
NOTE: N’s fluctuate because projects that did not have an item as an intended goal or could not provide a reasonable estimate were excluded.
SOURCE: 2001 mail survey of ARC grantees.

48
EXTENT TO WHICH SPECIFIC
OBJECTIVES WERE ACHIEVED In addition to assessing whether Cohort 1 projects were able to achieve the sum of their anticipated objectives, we also examined the extent of achievement across the seven types of outputs and outcomes. A primary purpose was to determine which types of objectives were most likely to be achieved. A secondary purpose was to examine the range of evidence that projects compiled to assess their own level of achievement.
Approximately three-quarters (74 percent) of the 281 objectives (excluding the three “others”) that projects identified in their ARC proposals were achieved, while only 17 percent were not achieved (Table 5-3). Respondents indicated that they were not able to ascertain whether the remaining 9 percent of objectives were met.27 The level of achievement was generally highest for employment objectives (86 percent) and lowest for degree attainment outcomes (57 percent). It is important to note that, overall, projects anticipated and achieved objectives across all areas of the conceptual framework.
27 As discussed in Chapter 7, some projects lacked the resources or
impetus to collect outcome data, others reported that not enough time had passed for projects to assess whether an outcome had been attained, and others felt that the objective was difficult or impossible to measure.
Table 5-3 Number and percent of objectives, by extent to which they were achieved
Percent indicating extent of achievement Type of objective
Number of anticipated objectives
Achieved Not achieved Unable to ascertain
Services provided to individuals ................................... 75 65 31 4 Services provided to communities ................................ 12 83 17 0 Barrier reduction ........................................................... 15 80 0 20 Skill attainment ............................................................. 59 83 10 7 Degree attainment ......................................................... 21 57 33 10 Impact employment status............................................. 43 86 7 7 Impact community viability .......................................... 56 70 11 20 Total............................................................................... 281 74 17 9
NOTE: Percents may not sum to 100 due to rounding. SOURCE: 2001 mail survey of ARC grantees.
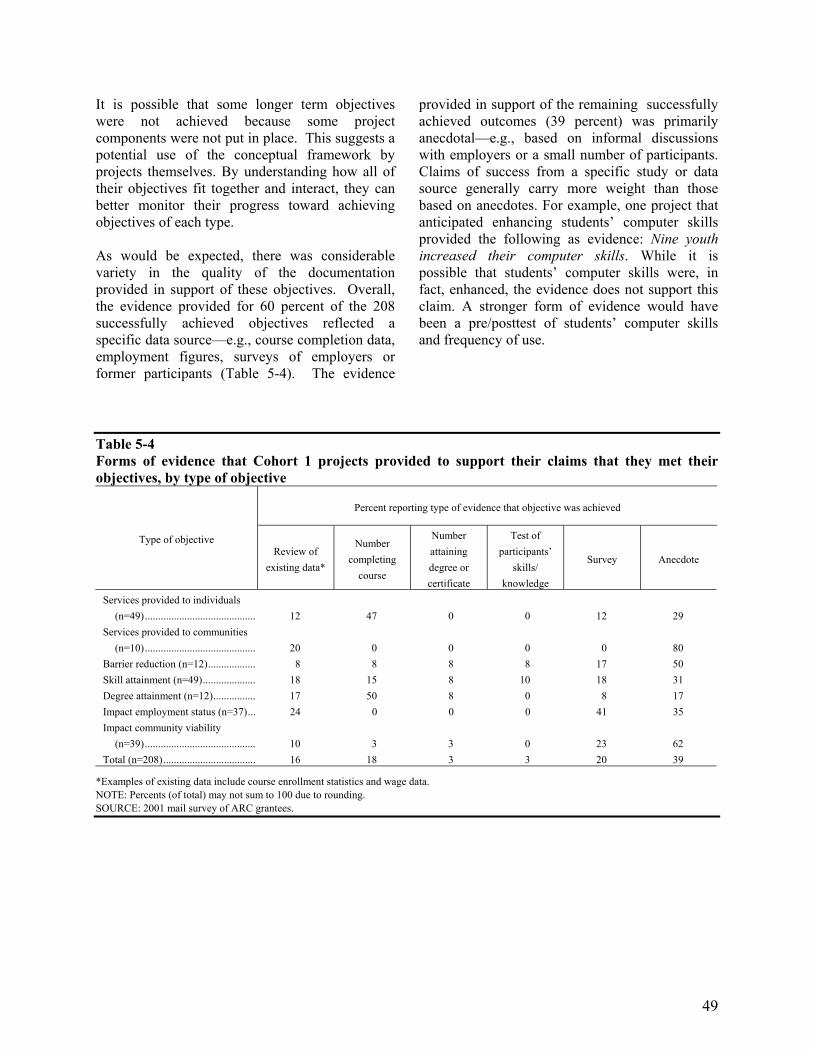
49
It is possible that some longer term objectives were not achieved because some project components were not put in place. This suggests a potential use of the conceptual framework by projects themselves. By understanding how all of their objectives fit together and interact, they can better monitor their progress toward achieving objectives of each type. As would be expected, there was considerable variety in the quality of the documentation provided in support of these objectives. Overall, the evidence provided for 60 percent of the 208 successfully achieved objectives reflected a specific data source—e.g., course completion data, employment figures, surveys of employers or former participants (Table 5-4). The evidence
provided in support of the remaining successfully achieved outcomes (39 percent) was primarily anecdotal—e.g., based on informal discussions with employers or a small number of participants. Claims of success from a specific study or data source generally carry more weight than those based on anecdotes. For example, one project that anticipated enhancing students’ computer skills provided the following as evidence: Nine youth increased their computer skills. While it is possible that students’ computer skills were, in fact, enhanced, the evidence does not support this claim. A stronger form of evidence would have been a pre/posttest of students’ computer skills and frequency of use.
Table 5-4 Forms of evidence that Cohort 1 projects provided to support their claims that they met their objectives, by type of objective
Percent reporting type of evidence that objective was achieved
Type of objective Review of
existing data*
Number completing
course
Number attaining degree or certificate
Test of participants’
skills/ knowledge
Survey Anecdote
Services provided to individuals (n=49).......................................... 12 47 0 0 12 29
Services provided to communities (n=10).......................................... 20 0 0 0 0 80
Barrier reduction (n=12).................. 8 8 8 8 17 50 Skill attainment (n=49).................... 18 15 8 10 18 31 Degree attainment (n=12)................ 17 50 8 0 8 17 Impact employment status (n=37)... 24 0 0 0 41 35 Impact community viability
(n=39).......................................... 10 3 3 0 23 62 Total (n=208)................................... 16 18 3 3 20 39
*Examples of existing data include course enrollment statistics and wage data. NOTE: Percents (of total) may not sum to 100 due to rounding. SOURCE: 2001 mail survey of ARC grantees.

50
Services Provided to Individuals Approximately two-thirds (65 percent) of the objectives pertaining to services provided to individuals, the first objective area shown in the flow chart, were achieved (Table 5-3). The evidence provided for 47 percent of the objectives achieved in this category reflected the number of participants who enrolled in or completed a project component (Table 5-4). For example, one project with a goal that 30-40 students will enter the technical engineering program each year during the first two years reported that The fall 2000 semester showed 60 freshmen engineering students enrolled. Exhibit B5-1 in Appendix B provides a sample of the narratives, both strong and weak, that projects provided in support of the objectives pertaining to services provided to individuals. Approximately one-third (31 percent) of the objectives pertaining to services provided to individuals were not achieved. As shown in Exhibit 5-1, projects generally reported that their failure to meet this goal reflected a variety of factors—e.g., setting participation goals that exceeded the project’s capacity, overestimating community interest in a type of training, encountering factors beyond the control of the project. These findings suggest areas of technical assistance that ARC might provide to applicants and new grantees. Services Provided to Communities Most (83 percent) of the 10 objectives pertaining to services provided to businesses/communities were achieved (Table 5-3). The evidence provided for 80 percent of the objectives achieved in this category reflected anecdotal evidence (Table 5-4). For example, one project that was designed to install and make operational a lumber drying kiln reported that The lumber drying kiln that was installed has provided small businesses an opportunity to dry lumber and add value to their products. Exhibit B5-1 provides a sample of the narratives that projects provided in support of the objectives pertaining to services provided to businesses and communities.
Barrier Reduction Eighty percent of the 15 barrier reduction objectives were achieved (Table 5-3). The evidence provided for 50 percent of the objectives achieved in this category reflected anecdotal evidence (Table 5-4). For example, one project that was designed to reduce training costs [since students/workers will have gained training while being an apprentice] reported that [Company X] reports substantially reduced training costs as well as approximately 11 years being added to the work life of an employee. Skill Attainment Most (83 percent) of the skill attainment objectives were achieved (Table 5-3). The evidence provided for more than two-thirds of the objectives achieved in this category reflected a specific data source—most notably existing data (18 percent) or a survey conducted by the project (18 percent) (Table 5-4). For example, one project that was designed to upgrade the quality of new employees in the trade and industrial program reported that A survey of program completers found that 60 percent were employed using the skills they had learned during the program. Exhibit B5-2 provides a sample of the narratives that projects provided in support of the skill attainment objectives. Degree Attainment More than half (57 percent) of the 21 degree attainment objectives were achieved (Table 5-3). The evidence provided for 50 percent of the objectives achieved in this category reflected the number of participants who enrolled in or completed a project component (Table 5-4).

Efor why obj
Anticipated obje
15 nighttime studentsenrolled in the programadult evening schoalternative school.
26 students will receiveinstruction in the compudrafting lab.
In 1999, 12 welfare recwill be trained to providquality child care in pubcare facilities, preschooor home-based day carefacilities.
Over 320 participants wreceive training per yea
150 students will be enrmiddle school summer residential institute durifirst summer.
Increase the number of participants in the machprogram.
70 full- and part-time stwill be served annuallyrespiratory care laboratoequipment.
80 part-time students wenrolled in this programfall of 1994.
30 employees will reccredit training using laboratory equipment. SOURCE: 2001 mail survey
xhibit 5-1. Examples of reasons that respondents provided ectives pertaining to services provided to individuals were not achieved
ctive Reason objective was not achieved
will be from the ol and
Lack of support from the intended administrative partner was a major obstacle in implementing this program into the evening school. When writing the grant, it seemed like a wonderful idea. But when it came time to implement the evening school, the administrative partner would never make a definitive arrangement with the technology instructor or another tech instructor. He was encouraged to comply, but it was disappointing for it not to come to fruition.
ter aided
The CAD drafting course has been taught for three years. According to course requests and enrollment, the numbers of students taking the course each year has been 18, 28, and 15—an average of 20 students per year.
ipients e high lic day
l settings,
We trained seven participants over the two years we were funded by ARC. In addition, we are currently training five participants who will graduate in the summer (22 women had begun the program). Our program is difficult and demanding, as is the job of a child care provider. Finding dedicated women to complete our 10-month program was a challenge, but we know that those who did graduate were well prepared.
ill r.
The original estimate of 320 was too high. Business and industry participants were lower than hoped for, and overall college and program enrollment decreased.
olled in a
ng the Interest of local parents was overestimated when the proposal was written. In addition, transportation from home to campus was a barrier.
ine tool
Increased graduation requirements in the state and new accountability measures have increased the difficulty for many young people (K-12) to participate in this offering. Current study is being done to address methods to change this trend. Efforts are underway to change the curriculum so that students can add this program. However, it takes several years to achieve this.
udents by the ry
Enrollments have not been at this level annually, so the actual number of participants impacted has been lower than projected. Also, accreditation/credentialing changes have eliminated program options that existed in 1995 when the grant was received.
ill be in the
Most of our enrolled students are enrolled as full-time students. In our original goal, we hoped to have companies enroll on an informal or part-time basis to learn equipment. This did not happen often. The project is doing the job, but technology has changed—we probably need to apply for a grant to buy advanced equipment.
eive non-the new
While some non-credit training occurred using lab equipment, most employers want credit classes for their employees. Since we can customize courses, we have been able to accommodate employers.
of ARC grantees.
51

52
One-third (33 percent) of the degree attainment objectives were not achieved. As shown in Exhibit 5-2, projects generally reported that their failure to meet this goal reflected problems recruiting staff or participants for a specific component or activity. Once again, these findings suggest areas that ARC staff might address during training sessions with applicants and new grantees. Employment Status Most (86 percent) of the employment status objectives were achieved (Table 5-3). The
evidence provided for 41 percent of the objectives achieved in this category reflected a survey conducted by the project (Table 5-4).28 For example, one project designed to increase participants’ wages reported that A survey of former participants found average wages increased from $5.50 per hour to $7.50 per hour. However, vague or anecdotal evidence was provided for 35 percent of these objectives—e.g., We have found that the majority of students who graduated were employed full-time. Exhibit B5-3 provides a sample of the narratives that projects provided in support of the employment objectives.
Eprovided f
Anticipated objective
Increase the number of adultfrom the community who leacomputer aided design.
The job skills and technical training of persons in Appalachian Virginia will beimproved.
15 students will graduate frothe hospitality management technology program.
15-20 students will graduatefrom the occupational theraptechnology program. SOURCE: 2001 mail survey of AR
xhibit 5-2. Examples of reasons that respondents or why skill/degree attainment objectives were not achieved
Reason objective was not achieved
s rn
Inadequate or underqualified staff was the obstacle that prevented us from carrying out this objective. The staff member has just now received enough training that he feels comfortable teaching adults computer aided design. I hope this objective will be accomplished in the near future.
The installation of the lumber drying kiln was a success in that it provided the equipment needed to conduct short sessions on lumber drying. The forest products curriculum, however, did not take off as anticipated. A well-qualified instructor was hired. However, we were unable to recruit high school students into the program. They were not convinced that the education and training would provide them with more or “better” opportunities than going straight to work.
m While this program was approved by the Board of Regents in 1996, no students registered.
y The program never opened. Because salaries were too high in the field, an
instructor could not be found. No one wanted to teach.
C grantees.
28 As discussed in Chapter 7, case study findings suggest that at least
some of these surveys failed to account for such problems as non-response.

53
Only a few (7 percent) of the employment objectives were not achieved. Projects generally reported that their failure to meet this goal reflected a lack of need among area employers for the skill in which participants received training. Community Viability More than two-thirds (70 percent) of the community viability objectives were achieved (Table 5-3). The evidence provided for 62 percent of the objectives achieved in this category reflected vague or anecdotal evidence (Table 5-4). For example, one project designed to meet the communication, mathematics, and scientific needs of local business and industry reported that Because of the ARC funded equipment, our schools were able to teach applied academic skills that meet employer needs—as indicated by almost 0 unemployment in our area over the last 5-7 years and the tremendous economic expansion in Spartanburg and Cherokee counties. In addition, survey data was provided for 23 percent of these objectives—e.g., A survey of the local businesses found increased sales and business. Exhibit B5-4 provides a sample of the narratives that projects provided in support of the community viability objectives. Projects were unable to ascertain whether 20 percent of their community viability objectives were ever achieved. In many cases, this reflected goals that were difficult or impractical to measure. QUALITATIVE FINDINGS ON
PROJECTS’ OBJECTIVES While the preceding analysis allows for an assessment of whether projects met their stated ARC-related objectives, it fails to convey the underlying value of the achievements associated with the Cohort 1 projects. This section provides two additional perspectives on the accomplishments of ARC vocational education and workforce training projects—respondents’ own perceptions of their most notable achievements (as provided on the mail survey) and a more indepth description of outcomes from three case study sites.
Respondents’ Perceptions of Their Most Important Outcomes The survey provided Cohort 1 projects the opportunity to describe, in their own words, the single most important outcome that resulted from their ARC grant. As might be expected, projects varied in terms of the types of achievements they chose to emphasize. While some provided information about a community benefit that occurred as a result of their ARC grant, the majority focused on activities that were implemented or expanded.29 Specifically, three-quarters (75 percent) of the projects illustrated how the ARC grant had enabled them to provide or expand a specific service or activity (not shown in tables). The remaining 25 percent described an outcome (e.g., enhanced skill levels, improved employment or educational status) that occurred as a result of their efforts. Exhibit 5-3 provides examples of the activities and outcomes that these 67 projects identified as being their most important accomplishments. Site Visit Findings Regarding Project Accomplishments During the site visits, we had an opportunity to interview the staff responsible for administering and implementing these projects and, in some cases, the individuals who benefited (directly or indirectly) from the ARC grant. The process used to select the five case study sites precludes us from using site visit findings to make generalizations about the range of accomplishments across the 92 projects in the study sample. We can, however, use information from the case studies to provide a more detailed description of the types of benefits that can be associated with successful ARC vocational education and workforce training grants. This section uses examples from the three of the five case studies to provide a richer portrayal of these project-related outcomes.
29 While the implementation or expansion of an activity represents an
important achievement, successful implementation is not the same as the attainment of an outcome.

54
of th
Enhanced Activities • Our students received
• The most important technical and academbeen exposed to with
• The ability to providindustry. Also, the Career Center.
• This grant has enabprogram.
• Major enhancement t
• The college significa
• This particular grantechnology in the wo
• With the purchase ofARC funding, we wou
• With this electronicstraining and placemefunds.
• The grant provided ato expand school-to-w
• The mode of industractually being receiv
• It was able to put our
• The most important important outcomes able to offer more op
• Student participants learning activity.
• Built a training resoulocal economic devel
Enhanced Skill • Development of self-e
• For those who have cwho enrolled in our This outcome may be
Exhibit 5-3. Examples of respondents’ perceptions e most important outcome to result from the ARC grant
vocational skill training on the very latest equipment.
outcome to result from the ARC grant has been middle school students have received ic training on more and varied technological training modules than they would have
out the ARC grant.
e an industry-specific skill to students interested in becoming employed in the granite ability to provide career guidance to the entire student body through the use of the
led us to fully implement western Maryland’s only 4-year mechanical engineering
o the computer technology department at the college.
ntly upgraded its ability to serve students and, therefore, the community.
t enabled us to convert a typewriter lab to a computer lab in keeping abreast with rkplace.
this equipment, we were able to make our training relevant to industry needs. Without ld have taken much longer to add less capabilities.
lab added to our electricity program, we were able to provide a wider range of nt opportunities. We would not have been able to purchase any of the lab without ARC
n infrastructure of services to students that allow us to leverage other funding sources ork opportunities.
y training was shifted more toward the use of technology. This led to more training ed by those needing it.
program on the map. Our equipment was very old and worn out.
outcome is the ability to offer more students access to that type of equipment. Other included the more flexible scheduling of training, more in-depth training, and being tions to the students.
now have expanded access to similar services across the state by means of this distance
rce that was previously unavailable to local companies. This program has facilitated opment as we have provided training for most of the local companies.
steem and confidence of project participants.
ome off welfare, the economic benefits have (of course) been important. For all those program, there seemed to be an enhanced sense of self-worth and belief in themselves. the most important of all.

55
Manufacturing Assistance Center. The Manufacturing Assistance Center (MAC) of the University of Pittsburgh was established in 1993 to address four core competencies: shared manufacturing, training, technical assistance, and research and education. The trainees include displaced workers, unemployed workers, underemployed individuals, and current employees looking to upgrade or acquire precision machining skills. In addition to trainees, the MAC
serves—and incubates—small and medium-size businesses in the nine counties in southwestern Pennsylvania. ARC funding contributed to the development of training materials and curricula by supporting MAC staff salaries. In its first 5 years of operation, the MAC completed over 550 technical assistance and shared manufacturing projects and 4,500 person-days of training. During this period, they billed
Exhibit 5-3. Examples of respondents’ perceptions of the most important outcome to result from the ARC grant (continued)
Enhanced Skill (continued) • All participants in the program became employable.
• The installation of a 4,000 boardfoot lumber drying kiln has enabled very small businesses to bring lumber to be dried at no cost to their own company. Many of these small operators have been trained to use the kiln and regularly bring small amounts of wood to be dried.
• Developed the capacity of ABD staff and home-based knitters to use technology to improve production, communications, and training for a regional network.
Enhanced Educational Status • The program has been accepted and supported very well by local industries and the two technical colleges
in the area. The majority of our students are attending technical colleges within one year of graduation.
• More than 80 percent of all participants had not considered post-secondary education until attending our program.
Enhanced Employment Status • The major outcome for the ARC grant for the dental hygiene and biomedical program was the fact that 245
students graduated from these programs and 219 (89 percent) of those graduates are employed in these fields. The resulting community and personal benefits are tremendous.
• The most important outcome resulting from the ARC grant to the Occupational Therapy Assistance Program is the fact that from 1995-1999, 178 students graduated from the program—and of those, 150 (84 percent) are working in this field.
• The students and staff improved their technology skills through the use of the materials paid for by this grant. Note: approximately 40-50 students each year were employed due to skills obtained through the program.
• Students were able to leave the program and go directly into the workforce as highly skilled employees.
• Incumbent workers were trained to get higher paying jobs (within the same company) allowing the company to hire unskilled individuals who were easier to recruit.
NOTE: This exhibit provides examples of the activities and outputs that projects provided in their response to survey item 10: What was the major or most important outcome (anticipated or not) to result from the ARC grant? SOURCE: 2001 mail survey of ARC grantees.

56
over $1.5 million for facility services. Overall, the MAC has been very successful with its trainees. Receiving training through the MAC carries some weight in the community; over the years employers have seen that MAC students do well on their tests and perform well on the job. The 10-week program has had three dropouts in 3 years and a near 100 percent placement rate. The computer numerical controlled machining program does not track dropouts because there are none, and it has a 100 percent placement rate. The precision grinding program has a slightly lower placement rate. According to the staff, the few students who have not obtained employment were less motivated than most and did not seem to want to work. Most students are hired for entry-level jobs at fairly low pay rates ($8 to $10/hour), but they can make rapid increases to $40,000 per year and then can become journeymen earning $50,000 to $60,000 per year. The MAC has incubated six businesses, five of which are currently co-located within the MAC. Each began at the MAC when an individual had an idea, but not enough startup funds to purchase necessary equipment. One company recently moved out of the MAC after outgrowing its allotted space. The founders went on to buy their own building and acquire the necessary equipment. Another company, Universal Technologies, began over 4 years ago with four employees bringing in $700,000 per year developing rotary freezer drawer units and robots that maintain test tubes in the drawers for pharmaceutical companies; now they have 30 employees and bring in $8 to $10 million per year. C&C Tooling is a full-service tool and die shop that rebuilds and resells surface grinders; it began 4 years ago with two employees and now has 12 and employs all technologies including EDM. They have recently spent $700,000 on equipment and may soon be moving to their own location. Industrial Laser Systems, a two-person company that was onsite for a year, develops custom laser applications. A robotics company developed a robot used in shipbuilding that crawls up the hull of a ship welding as it goes. The company recently sold its first prototype. In addition to incubating businesses, the MAC has allowed other companies in the area that have used MAC equipment and technical assistance resources to
expand. Through retraining and business expansion, the co-director believes the MAC has led to the creation of over 200 jobs in the region. Winston County Technical Center. The Winston County Technology Center (WCTC) in Double Springs, Alabama, used ARC funds to purchase the latest equipment in automotive technology, electronics technology, and carpentry that allows for the proper training of students for employment in technical fields. The data collected by WCTC for its own purposes and for those of the state provide a variety of indicators upon which to evaluate individual student progress and achievement. Some of the data indirectly point to a relationship between the equipment purchased with ARC funds and student outcomes. For example, results of the placement and followup survey indicate that since the ARC grant in 1996, 63 percent of automotive technology completers and 64 percent of carpentry completers have found employment in-field or in a related field within the first year of graduating from WCTC. In addition, some of the remaining completers have gone on to postsecondary education in technical institutions. While only 20 percent of electronics technology completers have found employment in-field or in a related field after graduation, 34 percent have gone on to 2- or 4-year colleges or technical institutions. Although no baseline data are available for the years before the 1996 ARC grant for comparison, project staff feel recent placement results indicate that student completers fared far better finding employment in-field or a related field after 1996 than before that time. For instance, the automotive technology instructor stated that before 1996 and the purchase of new equipment with ARC funds, none of his student completers found employment in-field or in related fields. He attributes the dramatic reversal in placement success to the fact that his students attained book knowledge in his courses before 1996, but simply were not given adequate hands-on training with equipment used in the field. After 1996, local shops, dealerships, and industry began calling and making visits in search of potential employees that would require little training. The automotive technology instructor noted proudly, “My students can walk in anywhere and get a job.”

57
The same was the case for electronics technology completers, according to the instructor for this component. He noted that students with hands-on training on up-to-date equipment are highly sought by local industry: “They’ll hire every kid I have,” and “Every plant around here has our kids in it.” Instructors also asserted that many students not only find employment, but also are able to attend colleges or technical institutions because of the equipment purchased with ARC funds. Several of WCTC’s automotive technology and electronics technology students in recent years have received college scholarships as a result of outstanding performance in state competitions. Instructors noted that success in such competitions would have been impossible were it not for the hands-on training and practice with equipment made available by the ARC grant. In addition, participation in competitions, according to instructors, helps to make students aware that they are just as capable as students from more prestigious schools to perform well using the most sophisticated equipment available. That provides students with the added confidence needed to pursue some form of postsecondary education. Other anecdotal evidence supports the link between ARC-funded equipment and student success. The automotive technology instructor commented that students who begin attending his courses at WCTC are very impressed by the shop’s equipment. The value that they attribute to this equipment may play a role in student retention, which the instructor noted is far higher than during the years prior to the ARC grant (the graduation rate for automotive technology completers ranged from 91 percent in 1996–97 to 100 percent in 1999–2000). Ohio FAIR. The Ohio Fund for Appalachia Industrial Retraining (FAIR) project assists companies in the Appalachian region by providing funds to support the training of underemployed and unemployed individuals. Unique among the ARC projects, FAIR receives a single grant from ARC and then distributes individual subgrants to companies engaged in workforce training. FAIR operates under the Ohio Investment in Training Program (OITP), which provides funding to new and expanding businesses in Ohio. FAIR assists
companies in Appalachia that are often not served by OITP because they cannot garner as many resources as larger companies in other areas of Ohio. For each training project funded, FAIR contributes 25 percent, OITP contributes another 25 percent, and the company matches those funds by providing the remaining 50 percent of the cost. The 16 companies that received 1999–2000 subgrants from FAIR exceeded their combined training goals by 28 percent, their retraining goals by 3 percent, and their new job creation goals by 17 percent. All but four (75 percent) met or exceeded their individual subgrant training goals; all four companies that had a retraining component met or exceeded their goals; and six of the nine companies that had the creation of new jobs among their goals met or exceeded them. Overall, FAIR funding from the 1999–2000 grant was used to train 1,255 individuals, retrain 402 employees, and help 265 individuals obtain new jobs. While FAIR data collection focuses on the number of individuals trained and retrained and the number of new jobs created, one of the regional directors commented that companies also reported reductions of down time, increased production, and improved product quality as additional outcomes. SUMMARY AND CONCLUSIONS Projects appeared to have achieved most of their objectives. Specifically, all of the Cohort 1 projects reported that they achieved at least one of their objectives. In fact, the majority of Cohort 1 projects reported achieving all or all but one of their objectives. Only six achieved fewer than half of their objectives. In addition, projects achieved three-quarters of the 281 objectives that they identified in their ARC proposals. However, some of the evidence appeared to be anecdotal or based on less than rigorous data collection activities. As would be expected, there was considerable variety in the quality of the documentation provided in support of these objectives. Overall, the evidence provided for 60 percent of the 208 successfully achieved objectives reflected a specific data source—e.g., course completion data, employment figures,

58
surveys of employers or former participants. The evidence provided in support of the remaining successfully achieved outcomes was primarily anecdotal—e.g., based on informal discussions with employers or a small number of participants. Cohort 1 projects were asked to estimate the number of individuals who had benefited at each stage as a direct or indirect result of their ARC grant in order to quantify the impact of ARC support at the project level. The range in the number of beneficiaries varied considerably across the projects. Projects estimated that as a result of the ARC grant, a median of four project staff received training, a median of 195 individuals received academic or vocational training, a median of 51 individuals received career counseling or job search/placement assistance, a median of 50
individuals obtained a degree or credential, and a median of 60 individuals obtained employment. Cohort 1 projects described, in their own words, the single most important outcome that resulted from their ARC grant. As might be expected, projects varied in terms of the types of achievements they chose to emphasize. While some provided information about a community benefit that occurred as a result of their ARC grant, the majority focused on activities that were implemented or expanded.30 Specifically, three-quarters of the projects illustrated how the ARC grant had enabled them to provide or expand a specific service or activity. The remaining projects described an outcome (e.g., enhanced skill levels, improved employment or educational status) that occurred as a result of their efforts.
30 While the implementation or expansion of an activity represents an
important achievement, successful implementation is not the same as the attainment of an outcome.

59
Project Sustainability and Expansion
A final measure of the success of an ARC project is its sustainability. In recent years, federal agencies have placed a premium on grant recipients’ abilities to maintain projects after the initial period of grant funding. Funding agencies are especially anxious to support projects that will remain operational over time and leverage seed money to develop and expand self-sufficient programs. This chapter examines the operating status of Cohort 1 projects at the time of the mail survey, as well as the status of projects’ various activities and equipment. It also describes factors that influenced whether projects were able to sustain themselves beyond their ARC grants. PROJECT STATUS To determine the longevity of ARC projects, respondents were asked to indicate their operating status at the time of the mail survey. Nearly half (33 projects or 49 percent) of the 67 Cohort 1 projects were operating at full capacity in the same way as during the ARC grant, and 30 percent (20 projects) were operating with a scope that had expanded either in the services provided or the number of participants served31 (Figure 6-1). Fifteen percent (10 projects) were operating at a reduced scope, either providing fewer services or serving fewer participants. One of these projects indicated that it was serving more individuals and additional groups of people, but providing fewer services for its participants. Only four projects were no longer in operation. 31 As noted in Chapter 1, projects lacking appropriate documentation
and/or a knowledgeable survey respondent were excluded from the survey sample. It is therefore possible that the sampling method resulted in undercounting the projects that were no longer in operation at the time of the mail survey.
Figure 6-1 Current status of Cohort 1 projects (n=67)
������������������������������������������������������� 49%
30%
15%
6%In full operation in thesame way as during theARC grant period
In operation at anexpanded in scope
In operation at a reducedscope
���No longer in operation
SOURCE: 2001 mail survey of ARC grantees. Some interesting trends emerged from this analysis.32 First, Cohort 1 projects that served participants with full-time job experience appeared to be less likely to be in full operation than projects serving those without full-time job experience or serving both experience levels (Table A6-1). Paradoxically, projects serving those with full-time job experience also appeared to be the most likely to be operating at an expanded scope.
32 It is important to note that we are unable to use these findings to
draw definitive conclusions or recommend the types of projects that ARC should support. However, these findings do suggest some informal steps that ARC staff might take when working with projects with large grants, as well as with projects that served adults and full-time employees. For example, in reviewing proposals, project coordinators might focus on whether applicants describe how specific activities will be sustained beyond the ARC grant period. In cases where this is not adequately addressed, the applicant might then be required to amend the proposal. Once funding has been approved, project coordinators might target these projects for site visits or more intensive technical assistance. While ARC staff might routinely perform these procedures for all of their projects, these findings suggest criteria that might be used to identify initiatives that could ultimately benefit the most from a site visit or other form of technical support.
VI.

60
Projects that received the smallest ARC grants and that had the smallest total project costs appeared more likely to be in full operation than were projects that had more funds. This suggests that projects that were either less ambitious (and therefore able to operate with a smaller total project cost) or were able to leverage additional start-up funds (and therefore able to operate with a smaller ARC grant) were the most likely to obtain the financial support to remain operational beyond the ARC grant period. On the other hand, projects with the smallest ARC grant also appeared the least likely to be operating at an expanded scope.
Contrary to what might be expected, Cohort 1 projects that received ARC grants more recently—those most recently funded in 1998 through 2000—appeared to be less likely to be in full operation than those funded in the early 1990s or 1996 and 1997 (Figure 6-2). However, the remaining 65 percent of recent projects were in operation or had changed, indicating that they may have expanded beyond their initial full operation. Curiously, projects last funded in 1996 or 1997 appeared more likely to be no longer in operation than those funded prior to that time.
Figure 6-2 Percent of Cohort 1 projects reporting current operating status, by last year funded (n=67)
35
42
65
65
46
31
13
4
Percent of projects
In full operation in the same way as during the ARC grant periodIn operation but changedNo longer in operation
Last funded 1990through 1995 (n=26)
Last funded 1996through 1997 (n=24)
Last funded 1998through 2000 (n=17)
0 20 40 60 80 100
NOTE: Percents may not sum to 100 due to rounding. SOURCE: 2001 mail survey of ARC grantees.

61
Types of Changes Among the projects that reported changing, 20 (30 percent of all 67 projects) indicated they were serving more individuals (Table 6-1), 11 (16 percent of all projects) indicated they were providing additional types of services, 9 (13 percent of all projects) were serving additional groups of people, and 8 (12 percent of all projects) were providing services in more sites than they originally had been. Nine projects (13 percent of all projects) indicated they were serving fewer individuals, and 4 (6 percent of all projects) were providing fewer services. Other changes in operation included moving to a different building, adding a CAD/CAM system, and completing startup training before moving on to additional expansion projects. Table 6-1 Number and percent of Cohort 1 projects that reported various ways their projects have changed since the ARC grant (n=30)
Changes in projects Number Percent of all projects
Expansions in scope
The project serves more individuals...... 20 30 The project provides additional types
of services/training............................ 11 16 The project serves additional groups of
people ................................................ 9 13 The project provides services in more
sites.................................................... 8 12 Reductions in scope
The project serves fewer individuals..... 9 13 The project provides fewer services...... 4 6 Other ...................................................... 4 6
NOTE: Percentage estimates are based on the projects that indicated their project had changed since the end of the ARC grant. SOURCE: 2001 mail survey of ARC grantees.
Factors that Contributed to Changes The four projects that were no longer in operation and the 30 that had changed in some way since their ARC grant were asked to indicate factors that contributed to the changes (expanded or reduced) in their projects. Responses represent dichotomous views. While 21 percent of these projects cited a loss of funding as the reason why the project could not continue operations, another 21 percent indicated that additional funding was
available for additional services or participants (Figure 6-3). Whereas 47 percent indicated an increased need for their services in the community and 41 percent found additional areas of need since grant inception that led to expansion, smaller percentages reported factors related to buy-in and need that reduced projects’ scope. Specifically, 15 percent cited a lack of interest among participants, 12 percent indicated they met an established need and services were no longer necessary, and 9 percent faced a lack of support from project partners. These figures are relatively small and suggest that ARC vocational education and workforce training projects face relatively few barriers to sustainability beyond securing continuing funding. In fact, among the four projects no longer in operation, three had discontinued operations because they had met the need they targeted and the project had run its course, while only one project discontinued as a result of lack of funds. And indeed, while funding can lead to expansion, the needs of the community are truly driving project expansion. STATUS OF ARC-FUNDED
ACTIVITIES AND EQUIPMENT In addition to assessing overall project sustainability, we also examined the extent to which individual activities within projects were still operational at the time of the mail survey.33 Overall, 94 percent of Cohort 1 projects indicated that at least some of their activities and equipment funded by ARC (including the associated match) were still operational (not shown in tables). None of the projects reported that all of their activities and equipment were still operational, and only 6 percent indicated that none of their activities and
33 For each activity they conducted, respondents indicated on the mail
survey whether it was still operational or not. Activities for each project were combined to determine whether all, none, or some were still operational. This analysis creates uneven categories in that the “some” category is much broader than either of the other two. For example, some could mean 1 of a project’s 10 activities were operational, or it could mean 9 of the 10 activities were operational. Accordingly, these figures are only a rough approximation of the extent to which projects’ activities are still operational.

62
Figure 6-3 Percent of ARC projects no longer in operation or in operation but changed (n=34) reporting factors contributing to reduced or expanded scope
3
3
6
9
15
21
3
21
41
47
12
0 10 20 30 40 50Percent of projects
Loss of funding for continuation
Lack of interest from participants
Met need, no longer necessary
Lack of support from project partners
Other
Approach no longer appropriate to problem
Loss of key staff
Delays in implementing approach
Expanded scope
Reduced scope
Increased need for services in the community
Additional areas of need since grant inception
Additional funding available for additional participants and/or services
Loss of other services in the community-wide project to take on additional roles
0
SOURCE: 2001 mail survey of ARC grantees. equipment were operational. While the portion of projects reporting that some of their activities and equipment were operational was high across the board, there were some differences across project characteristics (Table A6-2). The most striking trend confirms a project-level operating status finding: projects receiving the largest ARC grants and with the largest total project cost were considerably less likely to have some of their ARC-funded activities and equipment still operational, whereas for each of the other categories of grant amount and total project cost, all projects reported at least some of their activities and equipment were operational. In addition, projects that were serving individuals with full-time job experience appeared less likely
to report that some of their activities and equipment were still operational than were projects serving those no full-time job experience or those serving individuals with both experience levels. Similarly, projects serving adults appeared less likely to report that their activities and equipment were operational than were projects serving youth or both youth and adults. We also examined which types of activities were still operational at the time of the mail survey. All of the projects that acquired computerized industrial equipment, noncomputerized industrial equipment, medical equipment, and other equipment supported with ARC funding reported that the equipment was still operational (Table 6-2). Computer equipment, which tends to become
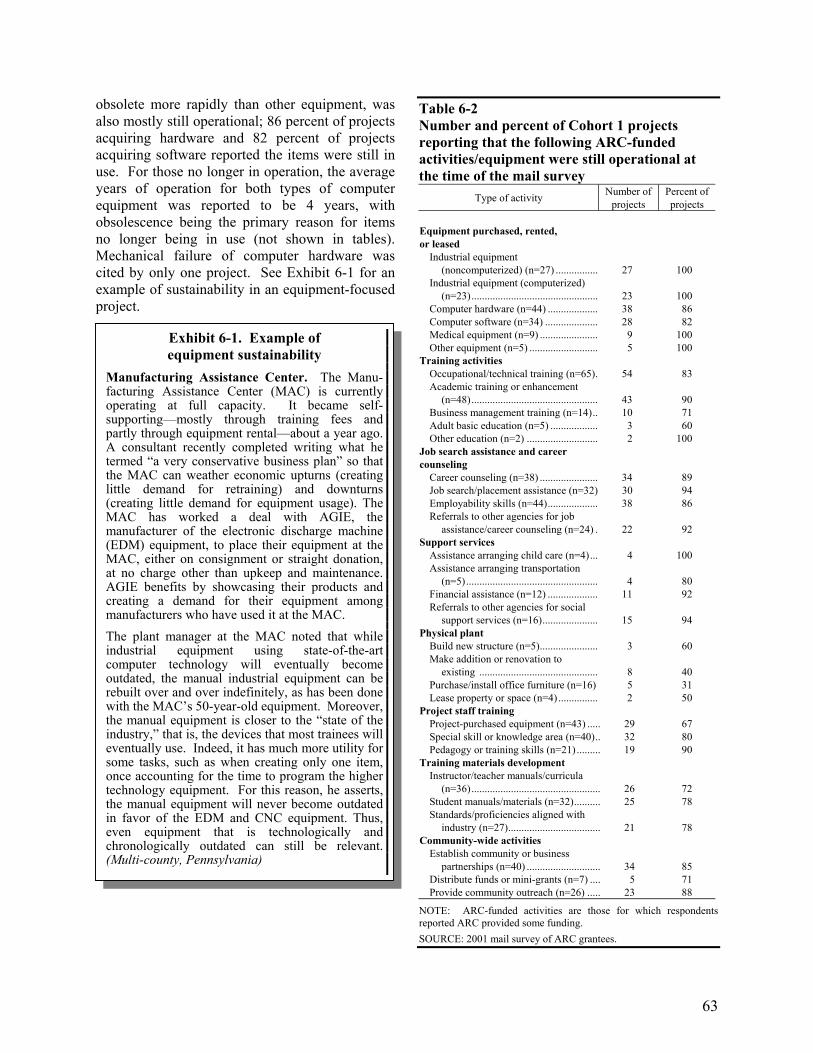
63
obsolete more rapidly than other equipment, was also mostly still operational; 86 percent of projects acquiring hardware and 82 percent of projects acquiring software reported the items were still in use. For those no longer in operation, the average years of operation for both types of computer equipment was reported to be 4 years, with obsolescence being the primary reason for items no longer being in use (not shown in tables). Mechanical failure of computer hardware was cited by only one project. See Exhibit 6-1 for an example of sustainability in an equipment-focused project.
Table 6-2 Number and percent of Cohort 1 projects reporting that the following ARC-funded activities/equipment were still operational at the time of the mail survey
Type of activity Number of projects
Percent of projects
Equipment purchased, rented, or leased
Industrial equipment (noncomputerized) (n=27) ................ 27 100
Industrial equipment (computerized) (n=23)................................................ 23 100
Computer hardware (n=44) ................... 38 86 Computer software (n=34) .................... 28 82 Medical equipment (n=9) ...................... 9 100 Other equipment (n=5) .......................... 5 100 Training activities Occupational/technical training (n=65). 54 83 Academic training or enhancement
(n=48)................................................ 43 90 Business management training (n=14).. 10 71 Adult basic education (n=5) .................. 3 60 Other education (n=2) ........................... 2 100 Job search assistance and career counseling Career counseling (n=38) ...................... 34 89 Job search/placement assistance (n=32) 30 94 Employability skills (n=44)................... 38 86 Referrals to other agencies for job
assistance/career counseling (n=24) . 22 92 Support services Assistance arranging child care (n=4)... 4 100 Assistance arranging transportation
(n=5).................................................. 4 80 Financial assistance (n=12) ................... 11 92 Referrals to other agencies for social
support services (n=16)..................... 15 94 Physical plant Build new structure (n=5)...................... 3 60 Make addition or renovation to existing ............................................. 8 40 Purchase/install office furniture (n=16) 5 31 Lease property or space (n=4) ............... 2 50 Project staff training Project-purchased equipment (n=43) ..... 29 67 Special skill or knowledge area (n=40).. 32 80 Pedagogy or training skills (n=21) ......... 19 90 Training materials development Instructor/teacher manuals/curricula
(n=36)................................................. 26 72 Student manuals/materials (n=32).......... 25 78 Standards/proficiencies aligned with
industry (n=27)................................... 21 78 Community-wide activities Establish community or business
partnerships (n=40) ............................ 34 85 Distribute funds or mini-grants (n=7) .... 5 71 Provide community outreach (n=26) ..... 23 88
NOTE: ARC-funded activities are those for which respondents reported ARC provided some funding. SOURCE: 2001 mail survey of ARC grantees.
Exhibit 6-1. Example of equipment sustainability
Manufacturing Assistance Center. The Manu-facturing Assistance Center (MAC) is currently operating at full capacity. It became self-supporting—mostly through training fees and partly through equipment rental—about a year ago. A consultant recently completed writing what he termed “a very conservative business plan” so that the MAC can weather economic upturns (creating little demand for retraining) and downturns (creating little demand for equipment usage). The MAC has worked a deal with AGIE, the manufacturer of the electronic discharge machine (EDM) equipment, to place their equipment at the MAC, either on consignment or straight donation, at no charge other than upkeep and maintenance. AGIE benefits by showcasing their products and creating a demand for their equipment among manufacturers who have used it at the MAC. The plant manager at the MAC noted that while industrial equipment using state-of-the-art computer technology will eventually become outdated, the manual industrial equipment can be rebuilt over and over indefinitely, as has been done with the MAC’s 50-year-old equipment. Moreover, the manual equipment is closer to the “state of the industry,” that is, the devices that most trainees will eventually use. Indeed, it has much more utility for some tasks, such as when creating only one item, once accounting for the time to program the higher technology equipment. For this reason, he asserts, the manual equipment will never become outdated in favor of the EDM and CNC equipment. Thus, even equipment that is technologically and chronologically outdated can still be relevant. (Multi-county, Pennsylvania)

64
Most training activities supported by ARC were still being conducted as well. In fact, 90 percent of projects providing academic enhancement, 83 percent of projects providing occupational/ technical training, 71 percent of projects providing business management training, and 60 percent of projects providing adult basic education reported they were still providing the training activities. About three-quarters of projects that developed various training materials reported that these materials were still in use. In addition, 80 percent of projects conducted staff training on skills or knowledge, and 90 percent of projects conducting staff training in pedagogy were still providing the training. Among projects providing job search assistance and career counseling services, over 85 percent were still providing each of the four types of activities. Social support services and community-wide activities were also still being conducted at high rates, with 80 percent or more projects continuing to provide support services and 70 percent or more continuing to conduct community-wide activities. The lowest sustainability rates were found among projects conducting physical plant activities. However, it is possible that survey respondents interpreted this item differently for physical plant activities. For example, while one respondent may have indicated that an office furniture “activity” was currently ongoing because the furniture is still in use, another respondent may have answered that the office furniture “activity” was not currently going on because the project is not still purchasing new furniture. Accordingly, we cannot rely too heavily on findings regarding the sustainability of physical plant activities.
SUMMARY AND CONCLUSIONS Most projects have sustained themselves beyond the ARC grant. Nearly half of the 67 Cohort 1 projects were operating at full capacity in the same way as during the ARC grant, and 30 percent were operating with a scope that had expanded either in the services provided or the number of participants served. Fifteen percent were operating at a reduced scope, either providing fewer services or serving fewer participants. One of these projects indicated that it was serving more individuals and additional groups of people, but providing fewer services for its participants. Only 6 percent were no longer in operation. The four projects that were no longer in operation and the 30 that had changed in some way since their ARC grant indicated dichotomous factors that contributed to the changes (expanded or reduced) in their projects. While some cited a loss of funding for continuation, others indicated that additional funding was available for additional services or participants. Whereas some indicated an increased need for their services in the community or found additional areas of need since grant inception that led to expansion, still others reported factors related to buy-in and need that reduced projects’ scope. That these figures are relatively small suggests that ARC vocational education and workforce training projects face relatively few barriers to sustainability beyond securing continuing funding. And indeed, while funding can lead to expansion, the needs of the community are truly driving project expansion.

65
Project Objectives and Data Collection Activities
Under the Government Performance and Results Act (GPRA), even a fully implemented project cannot be considered successful until it provides tangible evidence that it benefited the individuals or communities it served. The conceptual framework of how an individual might progress through a vocational education and workforce training program shows that after completing training or receiving various services by a project, an individual might obtain skills or have barriers ameliorated, or may obtain the skills only after the barriers are addressed. These may lead to obtaining a degree or credential and then improving employment status by gaining or retaining employment. Ultimately, an individual’s participation in vocational education or workforce training might result in improvements in the community’s viability. But none of these movements in and of themselves point to the achievement of an objective. Moving from an individual’s progress through a program to gathering specific and tangible evidence of achievements is neither simple nor without multiple steps. Tangible evidence might include the number of participants who complete a skills training program, attain a technical or vocational degree/credential/certificate, demonstrate an increase in their knowledge or skills, become employed, are promoted or receive increased wages, or leave public assistance (e.g., as a result of increased earnings). Evidence might also include the number of businesses that report hiring project participants or otherwise expanding as a result of ARC-supported activities. In order to provide valid evidence, projects must first clearly specify measurable and attainable objectives that relate to each aspect of a program, such as the components on the flow chart. These objectives must be bolstered with data items that support the objectives and with rigorous data collection
methods that obtain valid and reliable data. In addition, since many objectives, particularly those on the righthand side of the flow chart, may only occur well after the grant period, projects must develop systems for collecting followup data on participants. This chapter provides information on the types of objectives that vocational education and workforce training projects identified for themselves and their participants in their ARC proposals. It also describes the range of data collection activities that projects are using to determine whether their objectives have been achieved. OBJECTIVES THAT PROJECTS
IDENTIFIED FOR THEMSELVES There are two broad types of data that vocational education and workforce training programs can collect and disseminate. Output data provide information on the type and level of services rendered to project participants—e.g., the number of individuals participating in a training program. These are represented in the training, support services, and job search and career services areas of the flow chart. Outcome data document the condition or circumstances of program participants after a service has been provided—e.g., the number of project participants who attain employment or enhance their earnings. These are represented on the righthand half of the flow chart. Prior to 1993, many federal agencies primarily relied on output data to quantify the type of services they were providing. However, under GPRA, federal programs must now also use outcome data to demonstrate improvements that have occurred as a result of their services.
VII.

66
Throughout much of the 1990s, there were few ARC guidelines in place promoting the inclusion of outcomes in applications and final reports. As a result, projects funded during this period were not required to quantify how project participants would benefit from their proposed activities. In 1998, this situation changed when the Commission developed application guidelines designed to improve the quality and consistency of the proposals submitted to ARC. Under these guidelines, applicants are required to describe the objectives of their proposed project, provide an explanation of how the effort pertains to one or more of the Commission’s five strategic goals, and offer a rationale for their proposed approach. They must also describe the “output and outcome benefits to be derived from the project—with particular emphasis on the extent to which the benefits to the area being served by the project will be realized on a continuing rather than a temporary basis.”34 Applicants are also encouraged to provide numeric benchmarks that specify the number of individuals who will receive services and benefit from the ARC-funded activities. Vocational education and workforce training applicants that fail to provide a numeric benchmark may be asked to submit additional information regarding anticipated outputs (e.g., 100 people will receive training), intermediate outcomes (e.g., 75 trainees will obtain a certificate), and long-term outcomes (e.g., 50 trainees will obtain and retain full-time employment). The use of these numerical benchmarks provides the Commission and its projects with specific targets against which immediate and long-term progress can be measured. As such, the delineation of these benchmarks represents a critical cornerstone of ARC’s evolving performance monitoring strategy. In an effort to systematically assess whether changes to the Commission’s application process had their intended effect, we identified the qualitative and quantitative objectives35 that Cohort 1 and Cohort 2 projects delineated in their original proposals to the ARC. By analyzing
34 ARC Project Application Workbook. 35 We use the term objective to include both outputs and outcomes.
objectives for projects funded before (Cohort 1) and after (Cohort 2) the Commission enhanced its application procedures, we were able to examine whether there had been an improvement over time in the quality of outputs and outcomes that projects anticipated for themselves. Quality of Projects’ Objectives Almost all Cohort 1 (97 percent) and Cohort 2 (92 percent) projects described at least one anticipated outcome or community benefit in their proposal to ARC (not shown in tables). The remaining projects only identified outputs or services that would be provided as a result of ARC funding. There were, however, several noteworthy distinctions in the quality of the outputs and outcomes anticipated by Cohort 1 and Cohort 2 projects. Specifically: • A higher proportion of Cohort 2 proposals
described an anticipated outcome pertaining to barrier reduction, degree attainment, and employment status. While a higher proportion of Cohort 1 projects described an outcome pertaining to community viability, many of these statements were not defined in measurable terms.
• A higher proportion of Cohort 2 proposals contained numeric outcomes. Numeric outcomes enable ARC to more precisely assess whether projects have met their goals. Most (84 percent) Cohort 2 projects described at least one numeric outcome in their proposal or program announcement (Figure 7-1). Conversely, just 28 percent of Cohort 1 projects specified a numeric outcome. The remaining Cohort 1 projects specified only numeric outputs (48 percent) or failed to specify any numeric benchmarks (24 percent). This increase in the proportion of projects describing numeric benchmarks appears to be a direct result of ARC’s new application guidelines and the efforts of ARC project

67
coordinators to negotiate such targets when none are specified in the initial proposal.36
Figure 7-1. Percent of projects delineating numeric objectives
Cohort 1
48%
28%
24%Projects with onlynumeric outputsProjects with at leastone numeric outcomeProjects with nonumeric benchmarks
Cohort 2
8%
84%
8%
SOURCE: Document review of ARC education projects.
• A lower proportion of Cohort 2 proposals contained vague and impractical goals. Our document review found that Cohort 2 projects were less likely than their predecessors to
36 Specifically, all but two Cohort 2 proposals contained at least one
benchmark, suggesting that the new guidelines contributed to a widespread recognition among successful applicants that they needed to specify numeric benchmarks in their proposals. In addition, a review of program announcements and press releases found that 8 of the 10 Cohort 2 projects that failed to specify benchmarks in their initial proposal ultimately had stated benchmarks in the program announcement or press release—suggesting that ARC project staff were successful in requiring that applicants develop numeric targets as a condition of receiving ARC funding.
describe lofty goals that were beyond the possibility of a single project to achieve (e.g., the project will improve the quality of life for people in the region, enhance economic development in north Alabama). Once again, this finding suggests that ARC’s revised guidelines helped applicants avoid describing infeasible goals in favor of more precise statements of what would occur if their interventions were successful.
• Cohort 2 projects were more likely to describe a direct link between services and outcomes. Cohort 2 projects were more likely than their predecessors to specify both the number of participants who would receive services and the proportion of those participants who would subsequently realize an intended benefit (e.g., obtain employment, enhance their earnings).
Types of Objectives Specified by Projects Overall, projects delineated objectives on both the output and outcome areas of the flow chart. Of the 284 Cohort 1 objectives identified through the document review, 30 percent represented an anticipated service to individuals or communities, or output, that would be provided, and the remaining 70 percent represented a benefit, or outcome, that would occur as a result of ARC funding (Table 7-1). These include reduced barriers, skill attainment, degree attainment, improved employment status, and improved community viability. The distribution of outputs and outcomes was similar for the 86 objectives contained in the Cohort 2 application materials—36 percent and 64 percent, respectively. Services provided to individuals. Approximately one-fourth of the Cohort 1 (26 percent) and Cohort 2 (29 percent) objectives specified that residents would participate in or complete a project-related activity (Table 7-1). In fact, almost all Cohort 1 and Cohort 2 objectives pertaining to services provided to individuals contained a numeric benchmark—91 percent and 96 percent, respectively. As shown in Exhibit 7-1, there were no discernable differences in the quality of the statements that were made regarding the services

68
that would be provided to individuals as a result of ARC funding. Services provided to the community. Only a few of the Cohort 1 (4 percent) and Cohort 2 (7 percent) objectives represented a service to the community (Table 7-1). These objectives generally indicated the number of businesses that
would receive services, the type of services they would receive, or the benefits that businesses would receive as a result of their participation in the project (Exhibit 7-1). Most of the Cohort 1 (75 percent) and Cohort 2 (83 percent) objectives pertaining to services provided to the community contained a numeric benchmark (Table 7-1).
Table 7-1 Percent of objectives of various types and percent with numerical benchmarks, by cohort
Percent of objectives by type Percent of objectives with
numerical benchmark Type of objective
Cohort 1 (n=284)
Cohort 2 (n=86)
Cohort 1 Cohort 2
Services provided to individuals .................................... 26 29 91 96 Services provided to community.................................... 4 7 75 83 Barrier reduction............................................................. 5 9 20 63 Skill attainment............................................................... 21 17 14 73 Degree attainment........................................................... 7 10 67 89 Impact employment status.............................................. 15 21 23 100 Impact community viability ........................................... 20 6 5 20 Other ............................................................................... 1 0 0 –
NOTE: Percents may not sum to 100 due to rounding. SOURCE: 2001 mail survey of ARC grantees.
Service
Cohort
• In 1
• Twe
• The
• In 1pres
• Ove
Cohort
• The
• Thre
• Durskill
Exhibit 7-1. Examples of outputs anticipated by Cohort 1 and Cohort 2 projects
s Provided to Individuals
1
995-96, 60 students will be trained in machine technology/computer aided manufacturing.
nty students will participate in the Whitfield County Apprenticeship Program.
Manufacturing Assistance Center will broaden its user base.
999, 12 welfare recipients will be trained to provide high quality child care in public day care facilities, chool settings, or home-based day care facilities.
r 170 participants will be retrained to retain employment.
2
new facility is expected to serve nearly 1,000 people in its first year of operation.
e new degree programs will be established.
ing the program year, a total of 147 persons will participate in the program—75 in the pre-hire wood s training and 72 in skills upgrade training.

69
Barrier reduction. Only a few of the Cohort 1 (5 percent) and Cohort 2 (9 percent) objectives addressed barriers that would be ameliorated as a result of ARC funding (Table 7-1). These objectives typically identified an economic condition that would be ameliorated (e.g., reduce participants’ dependence on welfare, housing assistance, and all other forms of public assistance), a specific obstacle that was preventing participants from achieving a greater goal (e.g., less than 5 percent of participants will drop out after the first week of class), or a benefit that would occur after participants had overcome a barrier (e.g., increase the number of students attending college after high school in distressed areas of Kentucky). Data suggest that a higher proportion of Cohort 2 barrier reduction objectives contained a numeric benchmark—63 percent, compared to 20 percent for Cohort 1 projects.
Skill attainment. A similar proportion of Cohort 1 (21 percent) and Cohort 2 (17 percent) objectives represented a skill that participants would acquire as a result of ARC funding (Table 7-1). However, there was a notable difference in the specificity of skill attainment objectives delineated by the two cohorts. As shown in Exhibit 7-2, Cohort 1 applicants generally described the type of skills that participants would acquire (e.g., students will be more safety conscious as entry-level employees), while Cohort 2 applicants also indicated the number of participants who would acquire new skills (e.g., 43 adults will have completed the first half of their Cisco certification training). In fact, data indicate that a much higher proportion of Cohort 2 skill attainment objectives (73 percent) contained a numeric benchmark than did those of Cohort 1 (14 percent).
Exhibit 7-1. Examples of outputs anticipated by Cohort 1 and Cohort 2 projects (continued)
Services Provided to the Community
Cohort 1
• In FY 1997, 30 businesses will be served.
• By the end of the 3rd year, 20 firms will be enlisted to participate in the program.
• Thirty-five manufacturers will be assisted by the SPIRC by providing educational training to become more productive.
• Make GPS technology available for community projects.
• Five hundred educators and business personnel will participate in structured school-to-work staff development activities.
• Decrease in loss-time accidents resulting from training on specialized equipment.
Cohort 2
• Assist 10 or more businesses to meet training needs by enrolling 150 employees in customized training.
• Work with 5 local businesses to conduct job profiles.
• Increase the retention of workers for member companies.
• The workforce training needs of 500 employers will be served each year.
• Increase the productivity and competitiveness for a network of home-based, handloom knitting businesses in rural Appalachia.
• Reduce the recruiting and hiring costs for businesses. SOURCE: Document review of ARC grantees.

70
Degree attainment. Only a few Cohort 1 (7 percent) and Cohort 2 (10 percent) objectives represented a degree or credential that participants would earn as a result of ARC funding (Table 7-1). A higher proportion of Cohort 2 degree attainment objectives contained a numeric benchmark (89 percent compared to 67 percent for Cohort 1 projects). Exhibit 7-3 provides examples of projects’ anticipated degree attainment outcomes. Impact employment status. A similar proportion of Cohort 1 (15 percent) and Cohort 2 (21 percent) objectives described how participants’ employ-ment status would improve as a result of ARC
Exhibit 7-2. Examples of skill attainment outcomes anticipated
by Cohort 1 and Cohort 2 projects
Cohort 1
• New worker behaviors and skills will be transferred to the workplace.
• Western Maryland students who wish to remain in the region will possess the technical skills that enable them to find employment in the region’s printing, publishing, and design industry.
• Increase the small business leadership skills of at least 25 to 30 youth annually.
• Increase the number of adults from the community who learn computer aid design.
• Secondary and adult students who participate in these courses will be better prepared for the workforce.
• Increase the knowledge base and computer skills of Meigs High School graduates.
• Graduates will be prepared to operate CNC machines on the job.
• Forty students will learn both the theory and application aspects of horticulture.
• Students will be more safety conscious as entry-level employees.
• The new hires (graduates with at least one year of training on the new equipment) will have better entry-level skills than previous graduates hired as determined by the employers.
Cohort 2
• Participants will have skills that could be transferred to other industries/labor markets.
• At least 100 employees will complete a training course that had been requested by their employers.
• Forty-three adults will have completed the first half of their Cisco certification training.
• Nineteen individuals with developmental disabilities and mental health issues will complete the training.
• Thirteen welfare-to-work recipients will complete the training.
SOURCE: Document review of ARC grantees.
Exhibit 7-3. Examples of degree attainment outcomes anticipated
by Cohort 1 and Cohort 2 projects
Cohort 1
• Fourteen students will pass all required courses and examinations during the 12-month period.
• Fifteen to twenty students will graduate from the physical therapy technology program.
• Starting in 1996, 40 students per year will complete their degrees.
• Increase the number of evening school students who attain their vocational diploma through their participation in and completion of technology courses.
• In 1999, 6 welfare parents will complete graduation.
Cohort 2
• Twelve students will pass the licensure test.
• Thirty-three students will complete degree requirements.
• Twelve to fifteen students will graduate in July 2001 from the Surgical Technology Program.
• Twenty students will graduate from the Associate Degree program in Machine Tool technology.
• Six vocational education teachers will become fully certified Cisco trainers during the project year.
SOURCE: Document review of ARC grantees.

funding (Table 7-1). However, there was a notable difference in the specificity of employment objectives delineated by the two cohorts, with Cohort 2 projects more frequently providing specific, measurable outcomes. As shown in Exhibit 7-4, Cohort 1 applicants tended to list a general employment goal that lacked a benchmark (e.g., graduates will earn higher wages (since their productivity will increase), jobs of local surveyors will be preserved). In fact, only 23 percent of Cohort 1 employment objectives contained a numeric benchmark. Conversely, all of the Cohort 2 employment objectives specified the number of participants who would have enhanced job status. Impact community viability. A higher proportion of Cohort 1 objectives described how their community would benefit as a result of ARC funding—20 percent, compared to 6 percent for Cohort 2 projects (Table 7-1). As shown in Exhibit 7-5, applicants from both cohorts tended to describe how their projects would assist local businesses (e.g., in FY 1999, business partners in the Apprenticeship Program will expand to at least one more untapped occupational sector) or improve the local economy (e.g., increase the number of start-up businesses, new jobs will be created). A higher proportion of Cohort 2 community viability objectives contained a numeric benchmark—20 percent, compared to 5 percent for Cohort 1 projects—even though these objectives had fewer numeric benchmarks than did other types of objectives. We suspect that even Cohort 2 projects may have found community viability objectives more difficult to quantify than other types of objectives represented on the flow chart.
Co•
•
•
•
•
•
•
•
•
•
•
•
•
•
Co•
•
Exhibit 7-4. Examples of employment outcomes anticipated
by Cohort 1 and Cohort 2 projects
hort 1 Increase the number of qualified dental hygienists entering the job market in the Appalachian counties in north Alabama.
Increase the number of job placements in north Alabama.
Graduates will earn high wages (since their productivity will increase).
Increase the number of students placed in skill development positions.
Increase the percentage of graduates that were placed in jobs.
Adams County students will have greater access to job opportunities.
Improve job prospects for young people in the northeastern region of Pennsylvania.
Students will be more employable because they will be multi-skilled in the industrial maintenance mechanics field.
Successful completers of the apprenticeship program will gain employment into full-time employment.
Workers will have advanced skills required to retain their employment.
Three students per year will be placed in jobs related to granite etching.
For 1999, 6 welfare parents will be placed in full-time child care jobs.
Jobs of local surveyors will be preserved.
More African Americans will enter the workforce in computer system engineering.
hort 2 Participants will increase their family income after being employed.
The 1,700 to 2,000 individuals trained through this program will be employed as production associates in the BMW plant in Spartanburg, South Carolina.
71

72
PR
CO Therequworstatattaemplevewhethe wheidensustshofinaFurconantifina
Co•
•
•
•
•
•
•
SO
Exhibit 7-5. Examples of community viability outcomes anticipated
by Cohort 1 and Cohort 2 projects Cohort 1 • Enhance economic development in north
Alabama.
• The local economy will benefit from the increased wages earned by a more productive workforce.
• In FY 1999, business partners in the Apprenticeship Program will expand to at least one more untapped occupational sector.
• Increase the number of start-up businesses.
• The printing and publishing industry in western Maryland and surrounding counties will continue to grow.
• New jobs will be created.
• Increase the capacity of Appalachian companies to effectively compete in the global marketplace.
• Attract more businesses to a depressed area with better skilled graduates.
Exhibit 7-4. Examples of employment outcomes anticipated
by Cohort 1 and Cohort 2 projects (continued)
hort 2 Thirty-two students will begin an online business in the first year.
Sixty-six participants will receive an increase in wages due to upgrade training.
Nine welfare-to-work recipients will be placed in jobs in the community.
Half of the trainees (500) in the first year will obtain or retain employment as a result of training received at the facility.
Sixteen graduates will be employed in the field at the end of the first year.
Six individuals with developmental disabilities and mental health issues will achieve a more integrated or competitive job placement.
Upon graduation from high school, 510 students (85 percent) will either successfully enter the workforce or continue their education.
URCE: Document review of ARC grantees.
OJECTS’ EFFORTS TO LLECT OUTCOME DATA
Commission’s focus on measuring results ires that its vocational education and kforce training projects compile reliable istics on outcomes, such as gains in skill inment, job placement and retention, loyment status, and earnings. At the national l, these findings can then be used to assess ther ARC is achieving its strategic goals. At local level, such data can be used to assess ther a project has attained its overall goals, to tify successful activities that should be ained, to identify unsuccessful practices that uld be modified or discontinued, and to attract ncial support from other funding sources. thermore, data can be used in concert with the ceptual framework to determine where an cipated process might break down. Where a l outcome was not met, were intermediary
outcomes that were to lead to the final outcome also not met? For example, if participants did not earn expected promotions, it may have been because they also did not earn the required degree to be eligible for the promotion. This section assesses how the 25 vocational education and workforce training projects that
Cohort 2 • The area’s tourism infrastructure will grow
and expand.
• Increase industrial development because of improved environment.
• The wood products industry will benefit by having an accessible pool of potential employees with skills and competencies required by the industry.
• Fifty new jobs will be created in the region as a result of increased sales and new businesses created through e-commerce.
SOURCE: Document review of ARC grantees.

73
received funding in 2000 are positioning themselves to provide the Commission with detailed information supporting their objectives in all areas of the flow chart. It also explores the range of promising practices that projects are employing—and the range of barriers that these projects are experiencing—as they document how their efforts have benefited individuals and the community at large. The primary purpose is to provide the Commission with timely feedback on whether its most recently funded projects are taking the necessary steps to collect and use outcome data. It should be noted that at the time the survey was administered (February 2001), only four Cohort 2 projects had begun collecting outcome data. All but one of the remaining projects were planning to initiate their collection efforts at some point in the future. The remaining project indicated that it was not planning to collect any outcome data. Type of Outcome Data Projects Plan to Collect Cohort 2 projects collected data for both the education- and employment-related areas of the conceptual framework, but concentrated on the earlier stages of an individual’s progress in both. Most Cohort 2 projects indicated that they were planning to collect education-related data on the number of project participants who increased their knowledge or skills (60 percent), and nearly half (44 percent) collected data on the number of participants who completed a skills training program (Table 7-2). But fewer projects planned to collect data on attainment of high school diplomas (24 percent), technical certificates (32 percent), or associate’s or bachelor’s degrees (24 percent). In addition, more than two-thirds (68 percent) collected employment-related outcome data on those who had found employment, and approximately half were planning to count the number of businesses hiring project participants (48 percent). However, fewer than one-third were planning to collect data on job retention (32 percent), increased wages/earnings (24 percent), job promotions (12 percent), increased employer-
Table 7-2 Percent of Cohort 2 projects collecting outcome data about project participants and/or the overall community, by type of outcome data (n=25)
Type of outcome data Percent
Educational Status of Participants Increase knowledge or skills........................................ 60 Completion of a secondary or postsecondary skills
training program...................................................... 44 Attainment of a high school diploma or GED............. 24 Attainment of a technical or vocational
degree/credential/certificate .................................... 32 Entrance into a postsecondary 2-year or 4-year
college or university ................................................ 24 Attainment of an associate’s, bachelor’s, or higher
degree ...................................................................... 24 Other ............................................................................ 8
Employment Status of Participants Job placements ............................................................. 68 Job retention................................................................. 32 Job promotions............................................................. 12 Wages/earnings............................................................ 24 Employer-provided health benefits ............................. 8 Public assistance case closures or grant reductions
due to increased earnings ........................................ 4 Other ............................................................................ 4
Community Impacts Number of businesses served by the project ............... 56 Number of businesses hiring project participants ....... 48 Other ............................................................................ 0
SOURCE: 2001 mail survey of ARC grantees.
provided health benefits (8 percent), or reduced reliance on public assistance (4 percent). It is not clear whether this finding reflects the difficulty of obtaining these data or the fact that fewer respondents considered these employment indicators to be immediate or long-term goals of their projects. Data Collection Methodologies Cohort 2 projects used a range of data collection methods to obtain information supporting their objectives. Most (80 percent) of the projects were planning to employ two or more nonanecdotal collection/analysis methods to assess how their efforts had affected participants or the overall

74
community (not shown in tables).37 Two-thirds of the projects were planning to use at least one type of survey to collect supplementary data. Projects designed mail surveys of participants or former participants (44 percent), telephone surveys of participants or former participants (36 percent), or mail or telephone surveys of local employers (36 percent) (Table 7-3). Table 7-3 Percent of Cohort 2 projects using various data collection and analysis methods
Type of data collection or analysis method Percent using
Informal (anecdotal) conversations (e.g., participants,
employers) ................................................................... 60 Analysis of project administrative records ...................... 52 Analysis of education data ............................................... 48 Pre/post assessment of participants’ knowledge or skills 44 Mail surveys of participants/former participants............. 44 Number of persons who became certified or passed a
test................................................................................ 40 Telephone surveys of participants/former participants ... 36 Mail/telephone surveys of local employers ..................... 36 Analysis of employment and wage data .......................... 20 Analysis of community economic data............................ 12 Analysis of public assistance data ................................... 4 SOURCE: 2001 mail survey of ARC grantees. In addition, approximately one-fifth of the Cohort 2 projects were conducting pre/post assessments of participants’ knowledge or skills (44 percent) or documenting the number of participants who became certified or passed a test (40 percent). Most were planning to analyze some form of existing data, including project-related administrative records (52 percent), education data (48 percent), employment and wage data 37 As discussed in Chapter 5, anecdotal data generally carry less
weight than those derived from a specific study or data source. Thus, we are focusing on the stronger data collection methods that do not employ what may be unsubstantiated claims. Nonanecdotal outcome methods include analysis of project administrative records, analysis of employment and wage data, analysis of education data, analysis of community economic data, analysis of public assistance data, number of persons who became certified or passed a test, pre/post assessment of participants’ knowledge or skills, mail surveys of participants/former participants, telephone surveys of participants/former participants, and mail/telephone surveys of local employers.
(20 percent), community economic data (12 percent), or public assistance data (4 percent). Finally, while 60 percent were planning to rely on anecdotal data (e.g., informal conversations with participants or employers), none were planning to use such informal methods as their only source of information about project-related outcomes. While we obtained information on the types of methodologies that projects were using (or planning to use), we were not in a position to assess whether these projects were taking steps to assure nonbiased sampling and adequate response rates. However, based on findings from the two Cohort 2 site visits (discussed later in this section), it appears that some projects experienced difficulty designing and implementing rigorous and reliable data collection procedures. Collection of Followup Data The full range of benefits associated with an ARC vocational education or workforce training intervention may not occur until well after a participant has left the project. For example, workers who receive training in a specific skill may not attain a promotion or higher wages for 6 to 12 months. If the project only collects outcome data on participants at the time they complete training (e.g., completion of a skills program, an increase in knowledge), it may fail to document longer term outcomes that result from their participation in a training component. To assess whether projects were obtaining information on the longer term benefits associated with their efforts, Cohort 2 respondents were asked when they planned to obtain outcome data on the status of their participants. Only one-fifth (20 percent) were planning to collect outcome data 13 to 24 months after participants left the program (Table 7-4). In addition, 20 percent were only planning to collect outcome data at the time participants left the project, 12 percent were only planning to collect outcome data 1 to 6 months after participants left the project, and none of the projects were planning to collect outcome data more than 24 months after participants left the

project (not shown in tables), suggesting that many projects were not focusing on the long term. Table 7-4 Timeframe used by Cohort 2 projects to collect data on project objectives
Timeframe Percent At the time participants leave the project ............... 44 1-6 months after participants leave the project....... 48 7-12 months after participants leave the project..... 32 13-24 months after participants leave the project .. 20 More than 24 months after participants leave the
project ................................................................. 0
SOURCE: 2001 mail survey of ARC grantees.
In addition, only 5 of the 16 projects that were administering surveys were planning to collect outcome data more than a year after participants left the project (not shown in tables). Only 22 percent of projects that were obtaining information on participants’ enhanced employment status (e.g., increased responsibilities, increased wages, or promotions), and 18 percent of projects obtaining
information on participants’ new employment were collecting data more than 12 months after participants left the project (Table 7-5). This finding is significant, since it suggests that the majority of Cohort 2 projects that are promoting long-term employment achievements are not obtaining data that can be used to assess whether such gains have actually occurred. It also suggests that Cohort 2 projects are not collecting outcome data that can be reported as part of the Commission’s validation visits.38 This is likely due to the fact that projects have neither the capacity, nor the resources to collect longer term outcome data. Finally, the survey did not uncover any evidence that ARC projects receiving larger grants conduct more thorough or rigorous evaluations. This is not to suggest that more funding would not be helpful. However, unless funds are earmarked for evaluation—and projects understand how to conduct and use evaluations—project staff may simply not be motivated to conduct thorough evaluations.
Table 7-5 Timeframe used by Cohort 2 projects to collect data on project objectives, by intermediate and long-term project goals
Cohort 2 project goals
Timeframe Obtain GED
(n=10)
Obtain a degree (n=16)
Gain full-time
employ-ment
(n=19)
Maintain current employ-
ment (n=14)
Increase job respon-
sibilities or wages (n=18)
Obtain new employ-
ment (n=17)
Retrain workers (n=14)
At the end of the project................ 50 44 42 36 39 41 36 1-6 months after participants
leave the project ........................ 40 44 42 50 56 59 57 7-12 months after participants
leave the project ........................ 60 44 32 21 28 29 29 13-24 months after participants
leave the project ........................ 10 6 21 21 22 18 21
SOURCE: 2001 mail survey of ARC grantees.
75
38As part if its effort to obtain GPRA data, the Commission has
recently begun conducting validation visits to projects that are no longer receiving ARC support. The purpose of these visits is to assess whether projects ultimately attained their longer term outcomes.

76
Typical followup patterns for other career and technical training programs suggest that ARC projects should be doing more. U.S. Department of Education vocational education (Perkins III) grantees typically monitor high school graduates at 6, 12, and 24 months and community college graduates at 3, 6, 12, and 24 months. Job Training Partnership Act grantees typically conduct followup at 6, 18, and 30 months, while Welfare-to-Work and JobStart projects may extend followup out to 5 years. However, it should be noted that Perkins III grantees, those with the least followup, typically do not have the funds to do what they are asked. Five percent of local district and postsecondary institution grants is earmarked for administration. Grantees typically use all of these funds, as well as part of the 5 percent set-aside for leadership activities, for evaluation. BARRIERS TO COLLECTING OUTCOME DATA This section provides an additional perspective on the data collection activities undertaken by vocational education and workforce training projects: respondents’ descriptions of the barriers they had encountered (or expected to encounter) in collecting outcome data. Over half (58 percent) of Cohort 2 projects had not encountered any data collection barriers, while 26 percent were experiencing problems associated with a lack of funding or staff (Table 7-6). A smaller proportion reported lacking the time (18 percent) or expertise (5 percent) to collect outcome data. Only 16 percent anticipated having difficulty tracking participants after they had left the project. However, as stated above, few projects were attempting to track participants long after their participation. Although corresponding data were not collected for Cohort 1 projects, the survey addendum did uncover some interesting trends. Specifically, 16 of the 67 Cohort 1 projects indicated that they were unable to ascertain whether at least one of their ARC-related objectives was achieved. Eight of these projects indicated that they lacked the resources or impetus to collect outcome data, while four reported that not enough time had
passed for projects to assess whether an outcome had been attained (not shown in tables). For the remaining projects, it appeared that the objective was difficult or impossible to measure. Exhibit 7-6 provides examples of the factors that prevented projects from determining whether a given outcome was attained. Table 7-6 Barriers that hindered the efforts of Cohort 2 projects to collect outcome data
Barrier Percent Did not encounter any obstacles ............................. 58 Lack of funding or staff........................................... 26 Lack of time............................................................. 18 Difficulty of tracking participants after they have
left the project ..................................................... 16 Lack of access to expertise in data collection and
analysis................................................................ 5 Other ........................................................................ 5
NOTE: Six projects, which did not provide any information about the barriers that hindered the ability to collect outcome data, were excluded from calculation.
SOURCE: 2001 mail survey of ARC grantees.
SITE VISIT FINDINGS REGARDING
PROJECTS’ DATA COLLECTION
ACTIVITIES This section provides a more indepth description of the data collection experiences in the five case study sites. During the site visits, we had an opportunity to interview the staff responsible for collecting data on project participants. As discussed in Chapter 1, case study findings are not representative of the study sample and cannot be used to make generalizations about the data collection experiences of ARC’s vocational education and workforce training projects. We can, however, use information from the case studies to provide a more detailed description of the types of collection methodologies that projects are employing—and the barriers they are encountering as they compile outcome data on project participants. Overall, we found that sites were making at least some effort to obtain information about benefits
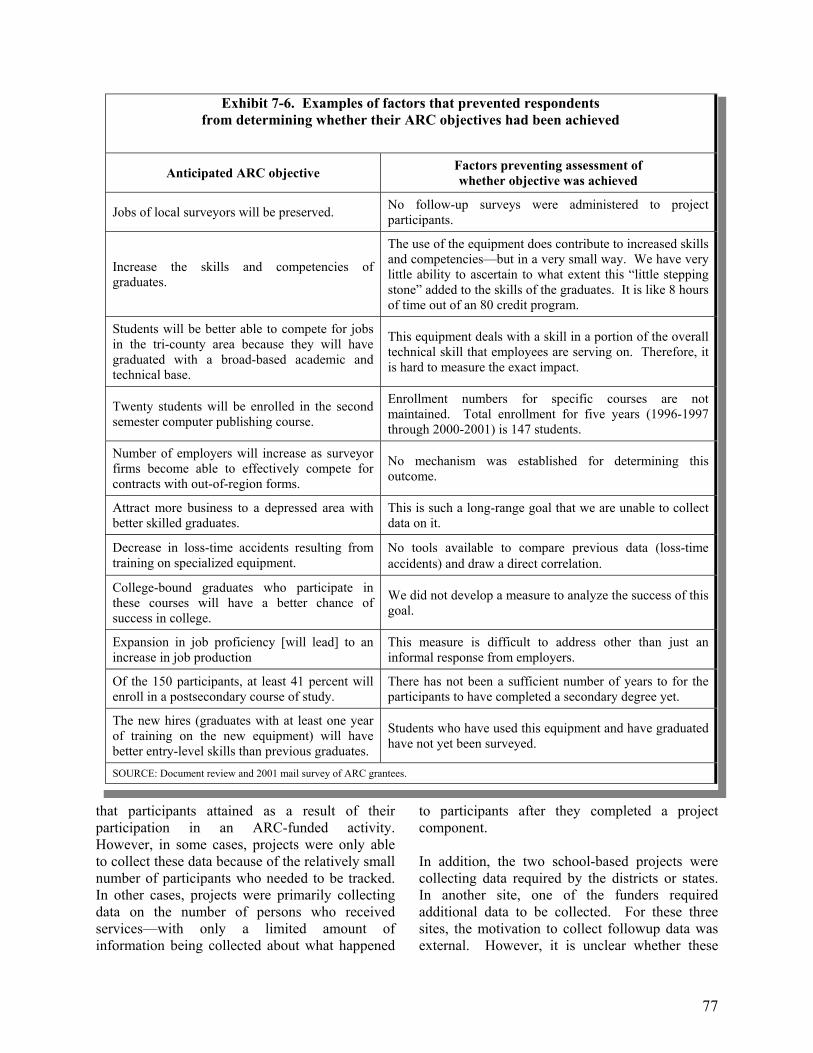
that participants aparticipation in However, in some cto collect these data number of participaIn other cases, projdata on the numbservices—with oninformation being c
fr
Anticipa
Jobs of local survey
Increase the skgraduates.
Students will be bein the tri-county agraduated with a technical base.
Twenty students wsemester computer
Number of employfirms become ablecontracts with out-o
Attract more businbetter skilled gradu
Decrease in loss-ttraining on speciali
College-bound grthese courses wilsuccess in college.
Expansion in job increase in job prod
Of the 150 participenroll in a postseco
The new hires (graof training on thebetter entry-level skSOURCE: Document re
Exhibit 7-6. Examples of factors that prevented respondents om determining whether their ARC objectives had been achieved
ted ARC objective Factors preventing assessment of whether objective was achieved
ors will be preserved. No follow-up surveys were administered to project participants.
ills and competencies of
The use of the equipment does contribute to increased skills and competencies—but in a very small way. We have very little ability to ascertain to what extent this “little stepping stone” added to the skills of the graduates. It is like 8 hours of time out of an 80 credit program.
tter able to compete for jobs rea because they will have broad-based academic and
This equipment deals with a skill in a portion of the overall technical skill that employees are serving on. Therefore, it is hard to measure the exact impact.
ill be enrolled in the second publishing course.
Enrollment numbers for specific courses are not maintained. Total enrollment for five years (1996-1997 through 2000-2001) is 147 students.
ers will increase as surveyor to effectively compete for f-region forms.
No mechanism was established for determining this outcome.
ess to a depressed area with ates.
This is such a long-range goal that we are unable to collect data on it.
ime accidents resulting from zed equipment.
No tools available to compare previous data (loss-time accidents) and draw a direct correlation.
aduates who participate in l have a better chance of We did not develop a measure to analyze the success of this
goal.
proficiency [will lead] to an uction
This measure is difficult to address other than just an informal response from employers.
ants, at least 41 percent will ndary course of study.
There has not been a sufficient number of years to for the participants to have completed a secondary degree yet.
duates with at least one year new equipment) will have ills than previous graduates.
Students who have used this equipment and have graduated have not yet been surveyed.
view and 2001 mail survey of ARC grantees.
77
ttained as a result of their an ARC-funded activity. ases, projects were only able because of the relatively small nts who needed to be tracked. ects were primarily collecting er of persons who received ly a limited amount of ollected about what happened
to participants after they completed a project component. In addition, the two school-based projects were collecting data required by the districts or states. In another site, one of the funders required additional data to be collected. For these three sites, the motivation to collect followup data was external. However, it is unclear whether these

78
sites were receiving funding specially earmarked for evaluation and tracking participants. Manufacturing Assistance Center The Manufacturing Assistance Center (MAC), described in Chapter 5, has a variety of reporting requirements for the agencies it works with, including attendance reports, monthly evaluation forms completed by instructors, and start and termination date verification forms. To meet each of these demands, the MAC maintains a database on each student that contains the following information: • Social Security number, if available,
• Name,
• Current telephone and address,
• Email address, if available,
• Program attended/attending,
• Dates of enrollment,
• Funding agency and name of sponsor at agency,
• Pretest score,
• Post-test score,
• Overall course grade,
• Placement (whether hired in 6 months),
• First company name and address,
• Date of hire,
• Benefits (wages, retirement/pension, 3-, 6-, and 12-month wage increases), and
• Second company and same associated data.
The database is updated 1 year after program completion, as required by YouthWorks (a federal Workforce Investment Act program jointly run by the city of Pittsburgh and Allegheny County). In addition, although CareerLink (the state’s online
employment services system) also requires the collection of some followup data, the MAC collects more extensive data.39 Project staff attribute their ability to collect such detailed data to the small number of students they work with (approximately four students at any given time). Followup is primarily conducted by telephone contact with former students and their employers—and it is considerably more difficult to obtain data once a participant has been away from the program for over a year (unless students contact the MAC seeking placement assistance for a new job). The plant manager and co-director view the equipment and training as leading to significant benefits (e.g., improved job prospects, business development, economic vitality). Nonetheless, the co-director believes the measurement of long-term outcomes is best done through qualitative rather than quantitative methods. He indicated that the creation of several new businesses does not adequately describe MAC’s impact in the region. Nor does he believe that quantitative methods can portray the multiple industry-university collabora-tions that have occurred to promote manufacturing and economic development in the region. To this end, the MAC is creating a portfolio of case studies of success stories that can better describe the impact of the center. Winston County Technology Center Although the Winston County Technology Center (WCTC), described in Chapter 5, collects data that are required by state- and district-level entities, the primary impetus is the internal interest of WCTC administrators and staff members. Altogether, the data collected by WCTC provide a great deal of information regarding student progress and achievement. These data, described below, are used by WCTC to shed light on the school’s strengths and weaknesses and to craft informed short- and long-term goals.
39Only students who are funded by outside agencies are tracked;
students in the apprenticeship program and custom training students are not tracked. MAC staff attempted to track all students but found that it did not make sense to expend the effort when no one was asking for the data.
79
Student performance data. Student performance and achievement are reflected in state measures, including results of the Alabama High School Graduation Exam, taken each year by all juniors and seniors. In addition, the state of Alabama requires that its secondary schools conduct annual placement and followup surveys of all graduated students. Students are contacted (by mail) roughly 6 months after graduation and asked about their current employment/educational status. In addition, WCTC must provide the state (and the U.S. Department of Education’s Office of Vocational and Adult Education) with data on student exam results, graduation and retention rates, postgraduation placement, and program completion rates. In addition to state-mandated student assessment within courses, the performance and achievement of students are documented by a variety of measures at the local level at WCTC. For example, the placement and followup surveys are augmented by each WCTC training component to determine whether graduates are employed in a field that is related to the training they received. Graduates are also asked to note the kinds of equipment they use in their current job (if employed), as well as their opinions, in retrospect, of the strengths and weakness of their education at WCTC. Students who do not complete planned sequences of courses are surveyed each year to determine whether they withdrew from their component program because of transfer to another school or employment in a related or unrelated field. Other performance data. In 1997, WCTC administered an opinion survey, designed by the marketing education department, of students, parents, faculty, and the business community. The survey obtained respondents’ views on the strengths and weaknesses of the school, with special emphasis on the learning environment, quality of education, and the needs of the community. WCTC’s principal noted that the school hopes to conduct this survey once every 5 years. In 1998, local businesses and industries completed an employer needs assessment, which addressed the perceived importance of a wide variety of entry-level employee characteristics and skills. Finally, at the end of each semester,
students are asked to submit a written evaluation of their courses and instructors. Daniel Morgan Technology Center The Daniel Morgan Technology Center (DMTC), a technical and vocational center for two school districts in Spartanburg, South Carolina, established a horticulture program to meet the growing needs of the landscape industry in the greater Greenville/Spartanburg area. The primary goal of the program was to increase students’ knowledge and overall familiarity with horticulture/agriculture. The ARC grant was used to purchase state-of-the-art equipment to enhance the program, and the new equipment added versatility to the types of projects conducted by the class. In general, the performance data collected on the horticulture program are part of the school’s overall evaluation. These data include enrollment, completion rates for students, and placement rates. Some of these data are collected in order to adhere to federal and state reporting requirements, while others represent district-level indicators. As part of the 1998 Perkins Act, South Carolina established performance indicators. These indicators allow individual schools to demonstrate that its students are (or are not) reaching acceptable levels of performance. The public high schools are also held accountable to Perkins for the first four of the six standards. These standards pass directly to the vocational/technology schools to monitor and track. The following are the 1999-2000 school year standards, along with the new 2001 and 2002 standards:40 • Standard 1: Vocational and Technical Skill
Proficiencies. Fifty percent of Career and Technology students will achieve a final grade of at least 2.0 for all Career and Technology Courses taken during the current year. The 2001 standard is 74 percent; for 2002, it is 74.5 percent of students.
40The four standards that were set for achievement at the school level
are provided here. Standards 5 and 6, which deal with gender underrepresentation, are set to be achieved at the state level.
80
• Standard 2: Academic Achievement. Fifty percent of Career and Technology students will achieve a final grade of at least 2.0 for all mathematics, science, and English/language arts courses taken during the current year. The 2001 standard is 61 percent; for the 2002 school year, it is 61.5 percent.
• Standard 3: Graduation. Seventy-five percent of 12th grade Career and Technology completers will receive a South Carolina high school diploma. The 2002 standard is 73.6 percent.41
• Standard 4: Placement. Fifty percent of South Carolina’s Career and Technology completers who are available for placement will be placed in postsecondary instruction, military service, or employment utilizing the Career and Technology competencies attained. For the 2001 and the 2002 school year, the standard will be 93.5 percent, which will be calculated using a 3-year average. It is important to note that employment will be counted whether the student is employed in a related or an unrelated field.
In order to track achievement of these standards, the state’s vocational/technology schools track “completers.” A completer is defined as a student who is expected to complete four courses in one program. Once students enter their second year, they are assigned a code and—for tracking purposes—are considered to be completers. Once the code is assigned, student are tracked by DMTC, regardless of whether they remain enrolled in the school. According to project staff, one problem with this system is that many students who have taken fewer than four courses in one program at Daniel Morgan are not counted toward the school’s achievement of Perkins standards. Although Daniel Morgan no longer receives Perkins money, staff continue to adhere to the Perkins guidelines. The director and assistant director indicated that it was important to collect these data because they can be used to benchmark their school’s progress.
41 There was no standard for the 2001 school year.
In addition to collecting state-mandated performance data, DMTC collects a considerable amount of information regarding students’ attitudes and performance. For example, the guidance counselor at Daniel Morgan recently conducted a student attitude survey at the end of the fall semester and was planning to conduct another one at the end of the spring semester. This survey obtained (1) basic demographic informa-tion (e.g., grade level, home school), (2) students’ plans after high school, (3) students’ rating of the value of their training at DMTC, (4) whether or not students plan to return to DMTC, (5) factors that influenced students’ selection of classes at Daniel Morgan, (6) what students liked best and least about Daniel Morgan, (7) whether or not students would recommend Daniel Morgan to their friends, and (8) suggestions for future courses. Ohio Fund for Appalachian Industrial Retraining When examining the evaluation and outcomes of the Ohio FAIR program (described in Chapter 5), it is important to note there are two beneficiaries: the companies and the employees. Companies benefit when current and new employees learn skills that can improve production, and employees benefit through job creation, job retention, and/or wage increases. As such, FAIR collects three types of data for each project that receives funding: number of individuals trained, number of individuals retrained, and number of new jobs created. Each company specifies its goals for these categories as part of the application process. Other information obtained as part of the grant application process includes (1) name and type of training activity, (2) training provider, (3) travel and other related expenses, (4) materials provided, (5) number of classes or training sessions, (6) hours per class/session, and (7) instructor cost per hour. This information is categorized for the various types of training typically supported by the Ohio Investment in Training Program (OITP), which provides funding to new and expanding businesses in Ohio, and FAIR, including basic skills, quality training, communication skills, customer service, employee orientation, product knowledge, maintenance/trades, managerial/

81
supervisory skills, information technology, and technical processes. Chautauqua County Wood Skills Training Project The Chautauqua County Wood Skills Training Project is designed to develop a series of classes for upgrading the skills of local workers who seek employment in the local wood products industry. The purpose is to develop two training components—i.e., a pre-hire program that would result in the creation of at least 50 new jobs in the local wood products industry, and a skills upgrade program that would enhance the technical proficiency of at least 66 currently employed workers (many of whom had been recently hired through temporary placement agencies). ARC funding has been used to help Woods Alliance members determine their collective training needs, develop training materials, identify prospective new hires, and conduct training. At the time of the site visit, the project had been operational for only 10 months. As a result, project staff were still in the process of documenting the implementation and impact of their ARC grant. Separate strategies were being used to identify outcomes associated with the pre-hire and incumbent classes Pre-hire component. Private Industry Council (PIC) staff conducted a telephone survey of the 17 individuals who completed the pre-hire class. The purpose of this survey, administered 2 months after the class had ended, was to document participants’ employment status.
Incumbent training component. The limited universe within which the project is operating, i.e., the nine companies that compose the Woods Alliance Group, had greatly facilitated the PIC’s ability to keep close tabs on the number of employees who have participated in ARC-supported training activities. This had been accomplished primarily through periodic telephone contacts with alliance members and a review of end-of-class evaluations. Employers had also been tracking the progress of workers who completed an incumbent training course. For
example, one company had used a daily performance log to collect pre- and post-training data on (1) the average number of minutes required for workers to set up a machine, (2) the number of quality adjusts performed per setup, and (3) machine efficiency. Plant managers were planning to use these data to demonstrate the value of employee training to company executives.
PIC staff indicated that they would have benefited from having more guidance from ARC as to the type of outcome data that could be used to document success of their project. In the absence of any such guidance, the PIC was primarily documenting the number of individuals who had participated in the pre-hire and incumbent training components. While staff contacted most of the 17 graduates of the pre-hire training program to ascertain their immediate employment status, there were no plans to obtain longer term data to assess whether graduates had received promotions or salary increases. (The question of whether any follow-up tracking was planned for the pre-hire and incumbent training components did prompt PIC staff to consider steps that might be taken to begin obtaining such information from alliance members.) SUMMARY AND CONCLUSIONS Most Cohort 2 projects described at least one numeric outcome in their proposal or program announcement. In addition, compared with Cohort 1 proposals, a lower proportion of Cohort 2 proposals contained impractical goals, and Cohort 2 projects were more likely to describe a direct link between services and outcomes. Taken together, these findings provide encouraging evidence that ARC’s recent efforts to reinforce its application process have been successful. Many Cohort 2 projects are planning to collect at least some new data through a mail or telephone survey. However, few of the projects were planning to collect data 13-24 months after participants left the program—and none were planning to collect data more than 24 months after participants left the program. In addition, findings

82
from the site visits suggest that some of these collections may be relying on imprecise methods. (The Cohort 2 survey did not obtain information on whether Cohort 2 projects were taking measures to assure an adequate response rate and an unbiased survey sample.) While it is impossible to make any sweeping generalizations from a small number of case studies, these findings do suggest that ARC’s vocational education and workforce training projects are not positioning themselves to obtain the data needed to assess the long-term impact of their efforts. In the next chapter, we address steps that the Commission can take to address this issue.
Evaluation is not easy, nor can it be done without thorough planning. It is likely that these projects, while aware of the need to conduct evaluations, do not have the tools or knowledge to do them. And
even when they are able to conduct effective short-term evaluations, project staff may not have built the capacity to continue the evaluation effort beyond the grant period. Thus, training, materials, and technical assistance may be a first critical step in developing evaluation capacity and improving project evaluations across all of ARC’s vocational education and workforce training projects. Indeed, ARC is likely facing this challenge across many of its projects in all areas of investment. This report—and these findings regarding project evaluation—represent a first step in improving ARC’s and funded projects’ evaluation capacity. Recommendations included in Chapter 8 suggest next steps. Further discussion is needed around the pros and cons of comprehensive evaluation strategies if ARC is interested in pursuing this avenue.

83
Summary and Recommendations
This report has provided considerable evidence that the projects in the study sample succeeded in bringing about a series of educational and employment gains throughout Appalachia.42 Survey findings indicate that the 67 Cohort 1 projects used a variety of basic and innovative strategies to enhance the vocational skills of community residents—including direct training, job search assistance and career counseling, and making critical equipment available to communities and individuals. Most of these projects provided anecdotal and quantitative confirmation that individuals went on to improve their aptitudes and advance their employment status. As such, these projects clearly contributed to the Commission’s goal of reaching those segments of Appalachia that are most in need, including persons who are geographically isolated and disadvantaged. The finding that almost all Cohort 1 respondents reported that without ARC support, they would have been limited in scope (or not implemented at all) further suggests that ARC funding enabled these communities to address educational, economic, and social needs that might have otherwise gone unmet. What follows is a series of recommendations designed to enhance ARC’s capacity to promote the use of innovative practices among its projects, document successes, and provide technical assistance to its grant recipients.
42 Because of the nonrandom process by which study sites were
selected, these findings only reflect the contributions of the 67 Cohort 1 projects in the study sample. We did not attempt to extrapolate these findings to the entire portfolio of ARC vocational education and workforce training initiatives.
PROJECT CHARACTERISTICS AND
INNOVATIVE ACTIVITIES The wide range of activities uncovered through this study makes it difficult to describe a “typical” ARC vocational education and workforce training project. As in Westat’s study of ARC’s education projects, this lack of a “one size fits all” model was viewed by many case study participants as an important feature of ARC’s approach to selecting and funding projects. It clearly reflects the Commission’s emphasis on using its grant making process to support the localized needs and capacities of individual communities. Through this process, ARC continues to provide organizations the opportunity to address local disparities and take advantage of regional resources. Further, the lack of any prominent implementation barriers suggests that grant recipients were generally satisfied with the level of the financial and technical support they received from ARC. Similarly, case study participants praised the role that ARC played in making their projects possible. The absence of criticism among these key stakeholders represents an important and encouraging study finding. The following recommendations address steps that ARC can take to enhance its capacity to share information about potentially promising practices with its projects and other stakeholders. Realign the designations used to classify vocational education and workforce training projects. The ARC database includes multiple dimensions for categorizing vocational education and workforce training project types. However, survey findings suggest that these categories do not adequately reflect the range of activities that ARC is funding. Using the conceptual model
VIII.

84
described throughout this report, we have identified four alternative terms for categorizing ARC’s portfolio of vocational education and workforce training projects: • Career awareness—including general work
and employability skills, generally for middle school youth.
• Vocational education—typically run through high schools, including apprenticeship programs.
• Job placement training—training for unemployed adults, displaced workers, career changes.
• Workplace training—including retraining, skills upgrade for currently employed or underemployed adults.
The use of these designations would enable ARC to more accurately designate and analyze the goals, methods, and outcomes associated with its vocational education and workforce training projects. It would also facilitate ARC’s efforts to link projects that share common goals and activities. Encourage applicants to use the conceptual model in developing their projects. The flow chart presented throughout this report can be a useful tool for helping grantees understand their own projects in relation to a “model” project. While it is unlikely that any project would actually fit the model precisely, ARC should encourage applicants to use this model to see if their proposed efforts are designed to address barriers that might interfere with participants’ efforts to enhance their economic status. For example, projects might use the model to assess whether they have adequately addressed the range of barriers commonly associated with low-income workers—e.g., lack of access to child care and transportation. They might also use the model to identify the range of outputs and outcomes associated with their workforce training and vocational education initiative.
Disseminate information about best practices to prospective grantees. As discussed in the education report, ARC should reinforce its procedures for disseminating information about innovative and successful projects (however innovation and success are to be defined) with its pool of applicants. For example, ARC could share findings from studies conducted by Westat and other external evaluators on its website. It could also post results from the validation visits that ARC conducts with a sample of its projects. While written reports cannot, by themselves, provide sufficient information for prospective grantees, they can point applicants in the right direction and lead them to useful sources of information (including staff at model projects). Reinforce ARC’s reporting structure. If ARC is to be in a position to identify innovative and successful practices, its staff will need to be able to access more detailed information about the implementation and impact of its projects. One method would be to enhance the quality of the final reports that projects submit to ARC. ARC grant recipients are currently required to submit a final narrative and financial report when they complete their project. The ARC Grant Administration Manual contains general guidelines and an example of topics that projects might address in their final report.43 However, our experience with other programs suggests that the lack of uniform reporting requirements frequently results in an uneven quality to closeout reports. We therefore recommend that ARC mandate these uniform guidelines be used by all of its projects—with customized examples of outputs and outcomes for each of the Commission’s five strategic goals.44 The use of a more formalized reporting structure would ultimately enhance project coordinators’ ability to obtain consistent data that can be used to assess project—and program—success. In
43 The instructions that accompany these guidelines state, “You may
find the attached outline useful in compiling your report, though you have flexibility in how to best present information for your project.”
44 Refer to our study of ARC’s education projects (Evaluation of The Appalachian Regional Commission’s Educational Projects: Final Report, Westat, 2001) for a more detailed example of how the submission guidelines for Goal 1 might be enhanced.

85
addition, while some grant recipients might continue to rely primarily on anecdotal information, the use of standard reporting guidelines could compel projects to rely on more sophisticated and robust data collection and analysis techniques. One option would be to use a modified or streamlined version of the survey we used for this report (see Appendix F) to collect standardized close-out data from each project. These data could supplement or replace existing narrative text in the final report format. Data could be entered into a database that would provide ARC staff a consistent format to monitor project implementation and accomplishments over time. Additionally, if a customized form similar to Part 2 of this survey were used, projects would know ahead of time that they are to respond to the specific outputs and outcomes cited in their project applications. Encourage ARC staff to update the project database uniformly. As was the case with ARC’s education projects, we found that ARC staff applied varying standards for entering project information—including anticipated outputs and outcomes—into the monitoring database for workforce training and vocational education projects. Requiring applicants to define numeric outputs and outcomes in their proposals (see below) might compel ARC staff to regularly and uniformly update the database structure used to track projects’ objectives. This information could then be used to monitor individual projects and assess trends across similar types of projects. An alternative would be to make projects responsible for entering data into the ARC database. This approach, already used by a number of federal programs, would require that projects use diskettes or a web-based system to submit their applications, annual reports, and/or closeout data. The electronic submission of project information would facilitate the Commission’s efforts to develop a more comprehensive, flexible, robust, and functional database. However, the development and maintenance of such a system would require a substantial investment of ARC staff and resources. It might also require that projects have access to
computers and Internet connections, which could deter some projects from applying for ARC funding. Nonetheless, ARC might want to consider options by which projects can electronically submit their applications and annual reports. ENHANCING PROJECT OBJECTIVES Most of the projects that received ARC funding in 2000 identified realistic, attainable, and measurable outputs and outcomes in their application materials. In addition, a comparison of Cohort 1 and Cohort 2 applications found that the most recently funded projects were less likely to contain impractical goals and more likely to describe a direct link between their services and outcomes. These findings suggest that the steps ARC has taken to help projects delineate realistic and measurable outputs and outcomes have paid off. As such, the following recommendations address additional steps that ARC can take to further reinforce its application procedures. Require that all applicants quantify at least one output and at least one corresponding outcome. The finding that almost all Cohort 2 projects identified at least one numeric outcome suggests that it would be possible to impose this requirement on all future vocational education and workforce training projects. Unlike other ARC project types (where it might be difficult to identify a quantifiable outcome), vocational education and workforce training efforts tend to be focused on a finite set of clearly defined outcomes—e.g., obtaining a skill, obtaining a degree or certificate, obtaining a job, enhancing an individual’s employment status. We therefore believe that most of the vocational education and workforce training projects that ARC funds should be able to specify the number of individuals who will participate in a given activity and the number of individuals who will ultimately attain a specific outcome as a result of their participation in that activity. We must caution against reducing all vocational education and workforce training projects to a uniform progression of outcomes that culminate
86
with obtaining employment. A danger of the flow chart discussed in Chapter 2 and referred to in Chapters 3, 4, and 5 is that it culminates with employment gains. As shown in Exhibit 8-1, a companion piece to the flow chart, some types of vocational projects are not intended to have an immediate impact on employment status. As this framework suggests, ARC staff will need to calibrate their expectations such that career awareness projects are not held accountable for increasing the number of job placements. Conversely, they will need to assure that workplace training projects specify the number of persons receiving services, as well as the number of participants who retain their jobs, receive promotions, or receive increased wages as a result of their participation in the ARC project. In addition, there is an inherent danger that by reducing projects’ expectations to a set of numbers, ARC will ultimately lose the broader statements of how the circumstances of Appalachian citizens will be improved. These statements provide projects an important opportunity to describe how their efforts might eventually impact both individuals and the community at large. We therefore suggest that ARC view this recommendation as an enhancement to—as opposed to a replacement of—the narratives that applicants are currently required to provide in their proposals. Develop application materials for each project type. As we suggested in the education report, ARC should consider developing separate guidelines (or supplemental materials) that provide more specific examples of the types of outputs and outcomes that pertain to each of its strategic goals. This would enable staff to provide applicants with precise instructions and customized examples that pertain to a particular issue area.45 In addition, workforce training and vocational education applicants might be provided copies of the framework in Exhibit 8-1 as a tool to help them delineate outputs and outcomes relevant to their project type.
45 Refer to our study of ARC’s education projects (Westat, 2000) for a
more detailed example of how the existing generic application guidelines might be expanded and adapted for a Goal 1 application workbook (or as a supplement to existing materials).
Meet with other federal agencies to better understand their funding and reporting structures. A primary purpose of such interagency collaboration would be to determine whether there are ways that ARC could piggyback off of the data collection requirements of other agencies supporting vocational education and workforce training projects. In considering this recommendation, ARC should recognize that its projects can be very different from those supported by other agencies. For example, the feasibility of coordinating data collection activities is dramatically reduced for some of ARC’s very small grants. In addition, while we know that other federal agencies have some very well-defined and explicit data collection requirements, it is unclear at this time whether the systems are working as envisioned. Not enough time has elapsed to determine the impacts, let alone feasibility, of changes in accountability requirements placed by Perkins III and other legislation. Assess the extent to which the states share common reporting requirements for these projects. The primary purpose would be to ascertain whether there is a useful common core of vocational education and workforce training data that are being mandated by some or all of the 13 states that compose Appalachia. A secondary purpose would be to identify useful data efforts underway in any of the 13 states that might be adapted by other states. PROJECT EVALUATION AND
PERFORMANCE REPORTING Even projects with realistic and measurable objectives appeared to be having difficulty designing reliable methods that could be used to assess whether their outcomes have been achieved. Findings from the site visits suggest that at least some projects are relying on imprecise data collection methods, using anecdotal evidence, or implementing surveys that fail to take into account biases introduced through low response rates. In addition, findings from the survey indicate that only a few Cohort 2 projects are planning to collect data 13-24 months after participants left the

87
Exhibit 8-1. Framework for analysis of activities and objectives, by project type
Project Type Type of Activity or Objective Career awareness Vocational education Job placement
training Workplace training
Equipment acquisition
Type and amount of equipment acquired
Type and amount of equipment acquired
Type and amount of equipment acquired
Type and amount of equipment acquired
Physical plant Type of improvements made
Type of improvements made
Type of improvements made
Type of improvements made
Training N/A Type of training provided Type of training provided Type of training provided Project staff training
Type of training provided Type of training provided Type of training provided Type of training provided
Training materials
Number and type of materials developed
Number and type of materials developed
Number and type of materials developed
Number and type of materials developed
Placement or counseling
Type of counseling provided
Type of counseling provided
Type of counseling provided
Type of counseling provided
Support services
Type of supports provided Type of supports provided Type of supports provided Type of supports provided
Act
iviti
es
Community activities
Type of community activities provided
Type of community activities provided
Type of community activities provided
Type of community activities provided
Services provided to individuals
Number of individuals receiving various services
Number of individuals receiving various services
Number of individuals receiving various services
Number of individuals receiving various services
Out
puts
Services provided to communities
Number of businesses or organizations receiving services
Number of businesses or organizations receiving services
Number of businesses or organizations receiving services
Number of businesses or organizations receiving services
Barrier reduction
Number of individuals able to participate in continuing education due to receipt of support services
Number of individuals able to (1) participate in continuing education, or (2) obtain a job due to receipt of support services
Number of individuals able to (1) participate in continuing education, or (2) obtain a job due to receipt of support services
Number of individuals able to obtain or retain a job due to receipt of support services
Skill attainment
Number of individuals with increased skills
Number of individuals with increased skills
Number of individuals with increased skills
Number of individuals with increased skills
Degree attainment
Number of individuals attending or planning to attend a postsecondary institution
Number of individuals earning a degree or certificate
Number of individuals earning degree or certificate
Number of individuals earning degree or certificate
Impact employment status
Number of individuals who (1) report gaining relevant knowledge about career options or (2) seek more training
Number of individuals who (1) obtain a job or (2) seek more training
Number of individuals who (1) obtain a job or (2) seek more training
Number of individuals who (1) retain a job, (2) receive a promotion, (3) receive increased wages, or (4) seek more training
Number of businesses served
Number of businesses served
Number of businesses served
Out
com
es
Impact community viability
N/A
Number of jobs created Number of jobs created Number of jobs created

88
program—and none are planning to collect data for more than 24 months. Even projects that are anticipating long-term employment outcomes are failing to obtain data that can be used to assess whether such gains actually occur. It appears that several factors are contributing to projects’ failure to implement robust collection methods—including a lack of financial resources, a lack of expertise regarding evaluation techniques, and a lack of understanding about how locally collected data could be used to document success and improve future activities. As such, the following recommendations address additional steps that ARC can take to enhance the data collection and evaluation practices of its vocational education and workforce training projects. Provide written materials on high-quality evaluation practices. ARC should provide applicants and grant recipients with written materials that describe suitable evaluation practices. Such materials can help guide projects through their own evaluations by highlighting data collection and analysis methodologies, identifying typical pitfalls in evaluation, and describing good reporting practices. Simply assuring grantees that they are taking appropriate steps is also likely to be helpful. Westat has developed many such materials, and others are readily available. These could be adapted for use by ARC education, vocational education, and workforce training projects. Reinforce the importance of data collection methodologies by including evaluation as a project approval criterion. ARC could ask applicants to specify the data collection activities in their applications that will be conducted in support of each numeric output or outcome in a proposal. This discussion should also specify how projects plan to address such issues as avoiding biases associated with nonresponse. If none are present, project coordinators might require that applicants specify the data they will use to address their objectives and the procedures they will use to assure that these data are collected in a rigorous manner as a condition of receiving ARC funding. In addition, ARC could have someone on staff who is trained to review each successful proposal
(prior to approval) to assure that adequate attention is being paid to evaluation methodologies. Provide additional evaluation training to project grantees. In addition to offering training to LDDs and state-level program managers, ARC could offer evaluation workshops to grant recipients. These workshops might cover such topics as selecting evaluators, budgeting for project evaluations, devising meaningful study questions, determining appropriate methodologies for assessing whether a particular objective has been achieved, and working with external evaluators. This would help to assure that methodologies are properly selected and applied, evaluations are conducted in a cost-effective and reliable manner, data are used, interpreted, and displayed in a meaningful and useful manner, and evaluation reports are effective. Provide additional evaluation training to staff. ARC might also offer training to staff in the selection and use of evaluation methodologies. It is likely that ARC staff would benefit from receiving training in this area since it would enhance their capacity to (1) assess whether an application adequately addresses how data will be collected and used, (2) provide technical assistance to projects that appear to be having difficulty obtaining credible and reliable data, and (3) use projects’ data to address GPRA reporting requirements. Provide project grantees with technical assistance in data collection methodologies. ARC staff should take a more proactive approach in assuring that individual projects are positioning themselves to collect data about immediate and long-term outcomes. In addition to the other recommendations described in this section, ARC should encourage projects to ask questions and request technical assistance regarding their data collection and evaluation efforts. By taking such a hands-on approach, ARC staff will communicate that they are expecting valid and reliable outcome data and are available to provide assistance in the collection and dissemination of information regarding project-related benefits.

89
Encourage project grantees to hire external evaluators. A number of federal programs require that their grant recipients use external evaluators to assess project success. This approach can maximize the likelihood that projects will have access to expertise and assistance in such areas as selecting appropriate evaluation methodologies, collecting valid outcome data, and analyzing statistics in a meaningful manner. The use of external evaluators can also provide projects with timely and constructive feedback on how their services might be improved. Given the size of ARC’s vocational education and workforce training grants, we are not recommending that ARC mandate the use of such external evaluators for all of its projects. However, the Commission might consider offering financial incentives to those grant recipients that include in their proposals a plan for using external evaluators to collect long-term outcome data on their participants.
CONCLUSIONS Throughout this report, the success of ARC’s vocational education and workforce training projects has been evident. This chapter has presented a collection of lessons that may be learned from their successes that ARC can use to ensure its continued success. While we have focused on recommendations related to objectives, data collection, and performance reporting, implementation lessons cannot be ignored. Many of the lessons are specific to a project type or situation and can be found in the case study reports in Appendix D. Beyond these lessons, the most critical finding that cuts across all of the projects is that projects understand the needs of and maintain close ties with local business and industry. Local communities provide the impetus for projects, the individuals who need and provide training, the jobs that trainees may obtain, and the energy that creates the local economic develop-ment to improve the regional economy. That most ARC projects originate with the needs of the local community and culminate with improvements in the community is the real strength of the program. Together, these findings and recommendations can help enhance ARC’s functioning and the benefits it bestows on the Appalachian region.

90

A-1
Appendix A
Additional Survey Data

A-2

A-3
Table A4-1. Percent of Cohort 1 projects reporting at least one ARC-funded activity in a given category, by project characteristics
Category of activity
Project characteristic Equip-ment Training Job
assistance Support services
Physical plant
Project staff
training
Training materials
Com- munity –
wide activities
All projects (n=67) 85 58 18 6 18 27 36 22
Participant type
No full-time job experience (n=40) ............................... 88 58 28 8 20 30 38 23
Full-time job experience (n=8).................................. 50 75 0 0 13 13 50 38
Both experience levels (n=19) ............................... 95 53 5 42 16 26 26 16
Participant age
Primarily youth (n=22).......... 91 82 45 5 23 41 55 32 Primarily adult (n=32)........... 81 50 6 9 19 16 31 22 Both youth and adult
(n=13) ............................... 85 38 0 0 8 31 15 8
Geographic distribution Single town or county
(n=25) ............................... 88 68 44 8 20 40 52 32 Adjacent counties (n=6) ........ 83 50 0 0 0 17 17 17 Nonadjacent counties
(n=36) ............................... 83 53 3 6 19 19 28 17
Economic status At least one distressed
county (n=18) ................... 61 78 22 17 28 33 50 33 No distressed counties
(n=49) ............................... 94 51 16 2 14 24 31 18
Metropolitan status Metropolitan only (n=14)...... 93 57 7 0 21 14 36 7 Nonmetropolitan only
(n=22) ............................... 91 68 41 9 23 45 50 32 Both metro and nonmetro
(n=31) ............................... 77 52 6 6 13 19 26 23
ARC grant size Less than $50,000 (n=16)...... 94 56 6 0 6 25 25 13 $50,001 – $100,000 (n=29)... 90 48 24 7 17 28 31 24 $100,001 – $200,000
(n=16) ............................... 88 75 19 6 25 31 44 25 More than $200,000 (n=6) .... 33 67 17 17 33 17 67 33
Total project cost Less than $100,000 (n=19) ... 89 63 21 0 11 37 37 16 $100,001 – $200,000
(n=28) ............................... 93 54 14 4 4 25 25 21 $200,001 – $900,000
(n=16) ............................... 88 56 25 19 50 25 44 31 More than $900,000 (n=4) .... 0 75 0 0 25 0 75 25
Years of ARC funding 1 year (n=45) ......................... 93 44 11 2 13 20 22 16 2 years (n=15) ....................... 67 93 27 7 7 33 53 20 3 or more years (n=7)............ 71 71 43 29 71 57 86 71
NOTE: ARC-funded activities are those for which respondents reported ARC provided some funding. SOURCE: 2001 mail survey of ARC grantees.

A-4
Table A4-2. Percent of Cohort 1 projects reporting purchasing, renting, or leasing various types of equipment with ARC funding, by project characteristics
Project characteristic
Industrial equipment (noncom-puterized)
Industrial equipment
(com-puterized)
Computer hardware
Computer software
Medical equipment
Other equipment
All projects (n=67) ................................... 40 34 66 51 13 7 Participant type
No full-time job experience (n=40) ..... 45 40 73 53 13 8 Full-time job experience (n=8) ............ 25 13 25 25 13 0 Both experience levels (n=19) ............. 37 32 68 58 16 11
Participant age Primarily youth (n=22) ........................ 45 36 86 68 14 9 Primarily adult (n=32) ......................... 38 28 50 41 19 6 Both youth and adult (n=13)................ 38 46 69 46 0 8
Geographic distribution
Single town or county (n=25) ............. 44 40 80 60 12 8 Adjacent counties (n=6)...................... 50 67 50 50 33 0 Nonadjacent counties (n=36) .............. 36 25 58 44 11 8
Economic status
At least one distressed county (n=18). 33 28 44 28 6 0 No distressed counties (n=49)............. 43 37 73 59 16 10
Metropolitan status
Metropolitan only (n=14).................... 50 50 79 50 14 0 Nonmetropolitan only (n=22) ............. 50 36 64 50 18 5 Both metro and nonmetro (n=31) ....... 29 26 61 52 10 13
ARC grant size
Less than $50,000 (n=16) ................... 38 31 75 50 6 6 $50,001 – $100,000 (n=29)................. 48 41 62 52 14 7 $100,001 – $200,000 (n=16)............... 38 31 75 56 19 6 More than $200,000 (n=6) .................. 17 17 33 33 17 17
Total project cost
Less than $100,000 (n=19) ................. 37 26 74 53 11 5 $100,001 – $200,000 (n=28)............... 50 50 68 57 14 4 $200,001 – $900,000 (n=16)............... 38 25 69 50 19 19 More than $900,000 (n=4) .................. 0 0 0 0 0 0
Years of ARC funding
1 year (n=45) ....................................... 42 47 67 51 16 7 2 years (n=15) ..................................... 40 13 60 40 7 0 3 or more years (n=7).......................... 29 0 71 71 14 29
SOURCE: 2001 mail survey of ARC grantees.

A-5
Table A4-3. Percent of Cohort 1 projects reporting physical plant activities, by project characteristics
Project characteristic Build new structure Renovate existing structure
Purchase/install office furniture
Lease property or space
All projects (n=67) ................................... 7 30 24 6 Participant type
No full-time job experience (n=40) ..... 3 30 23 0 Full-time job experience (n=8) ............ 13 25 38 38 Both experience levels (n=19) ............. 16 32 21 5
Participant age Primarily youth (n=22) ........................ 0 14 23 0 Primarily adult (n=32) ......................... 6 41 28 13 Both youth and adult (n=13)................ 23 31 15 0
Geographic distribution
Single town or county (n=25) ............. 4 16 20 0 Adjacent counties (n=6)...................... 17 50 33 0 Nonadjacent counties (n=36) .............. 8 36 25 11
Economic status
At least one distressed county (n=18). 17 28 17 11 No distressed counties (n=49)............. 4 31 27 4
Metropolitan status
Metropolitan only (n=14).................... 0 36 43 7 Nonmetropolitan only (n=22) ............. 9 18 18 5 Both metro and nonmetro (n=31) ....... 10 35 19 6
ARC grant size
Less than $50,000 (n=16) ................... 6 19 0 0 $50,001 – $100,000 (n=29)................. 7 31 31 3 $100,001 – $200,000 (n=16)............... 6 25 25 6 More than $200,000 (n=6) .................. 17 67 50 33
Total project cost
Less than $100,000 (n=19) ................. 5 16 5 0 $100,001 – $200,000 (n=28)............... 4 29 25 4 $200,001 – $900,000 (n=16)............... 13 44 44 6 More than $900,000 (n=4) .................. 25 50 25 50
Years of ARC funding
1 year (n=45) ....................................... 7 33 20 0 2 years (n=15) ..................................... 7 7 13 7 3 or more years (n=7).......................... 14 57 71 43
SOURCE: 2001 mail survey of ARC grantees.

A-6
Table A4-4. Percent of physical plant activities funded by ARC Physical plant activity Percent funded by
ARC All physical plant activities (n=45) ............................................................................................................................... 33
Build new structure (n=5) ............................................................................................................................................. 40
Renovate existing structure (n=20) ............................................................................................................................... 25
Purchase install office furniture (n=16)......................................................................................................................... 38
Lease property or space (n=4)....................................................................................................................................... 50
NOTE: Percent estimates are based on the projects that indicated they have conducted physical plant activities as part of their projects. SOURCE: 2001 mail survey of ARC grantees.

A-7
Table A4-5. Percent of Cohort 1 projects reporting conducting various training activities, by project characteristics
Project characteristic Occupational/
technical training
Academic training or
enhancement
Business management
training
Adult basic education Other
All projects (n=67) ................................... 97 72 21 7 3 Participant type
No full-time job experience (n=40) ..... 98 83 25 5 5 Full-time job experience (n=8) ............ 100 75 38 38 0 Both experience levels (n=19) ............. 95 47 5 0 0
Participant age Primarily youth (n=22) ........................ 95 82 27 0 9 Primarily adult (n=32) ......................... 100 75 16 16 0 Both youth and adult (n=13)................ 92 46 23 0 0
Geographic distribution
Single town or county (n=25) ............. 100 80 32 4 4 Adjacent counties (n=6)...................... 100 83 0 0 0 Nonadjacent counties (n=36) .............. 94 64 17 11 3
Economic status
At least one distressed county (n=18). 94 72 39 17 6 No distressed counties (n=49)............. 98 71 14 4 2
Metropolitan status
Metropolitan only (n=14).................... 100 71 0 7 0 Nonmetropolitan only (n=22) ............. 100 77 32 5 5 Both metro and nonmetro (n=31) ....... 94 68 23 19 3
ARC grant size
Less than $50,000 (n=16) ................... 100 50 6 0 0 $50,001 – $100,000 (n=29)................. 93 76 17 7 3 $100,001 – $200,000 (n=16)............... 100 88 38 6 0 More than $200,000 (n=6) .................. 100 67 33 33 17
Total project cost
Less than $100,000 (n=19) ................. 100 58 5 0 0 $100,001 – $200,000 (n=28)............... 93 71 21 4 4 $200,001 – $900,000 (n=16)............... 100 94 31 13 6 More than $900,000 (n=4) .................. 100 50 50 50 0
Years of ARC funding
1 year (n=45) ....................................... 98 76 9 9 0 2 years (n=15) ..................................... 93 67 40 0 7 3 or more years (n=7).......................... 100 57 57 14 14
SOURCE: 2001 mail survey of ARC grantees.

A-8
Table A4-6. Percent of Cohort 1 projects reporting developing various types of training materials, by project characteristics
Project characteristic Instructor/teacher manuals/curricula
Student manuals/ materials
Standards/ proficiencies aligned with industry
All projects (n=67) ................................................... 54 48 40 Participant type
No full-time job experience (n=40) ..................... 52 45 38 Full-time job experience (n=8) ............................ 63 75 63 Both experience levels (n=19) ............................. 53 42 37
Participant age Primarily youth (n=22) ........................................ 59 63 45 Primarily adult (n=32) ......................................... 44 41 34 Both youth and adult (n=13)................................ 69 38 46
Geographic distribution
Single town or county (n=25) ............................. 64 60 48 Adjacent counties (n=6)...................................... 67 50 67 Nonadjacent counties (n=36) .............................. 44 39 31
Economic status
At least one distressed county (n=18)................. 72 61 44 No distressed counties (n=49)............................. 47 43 39
Metropolitan status
Metropolitan only (n=14).................................... 36 43 36 Nonmetropolitan only (n=22) ............................. 59 50 36 Both metro and nonmetro (n=31) ....................... 58 48 45
ARC grant size
Less than $50,000 (n=16) ................................... 50 38 44 $50,001 – $100,000 (n=29)................................. 45 41 34 $100,001 – $200,000 (n=16)............................... 75 63 56 More than $200,000 (n=6) .................................. 50 67 17
Total project cost
Less than $100,000 (n=19) ................................. 53 42 42 $100,001 – $200,000 (n=28)............................... 46 43 36 $200,001 – $900,000 (n=16)............................... 69 56 50 More than $900,000 (n=4) .................................. 50 75 25
Years of ARC funding
1 year (n=45) ....................................................... 42 27 24 2 years (n=15) ..................................................... 87 93 80 3 or more years (n=7).......................................... 57 86 57
SOURCE: 2001 mail survey of ARC grantees.
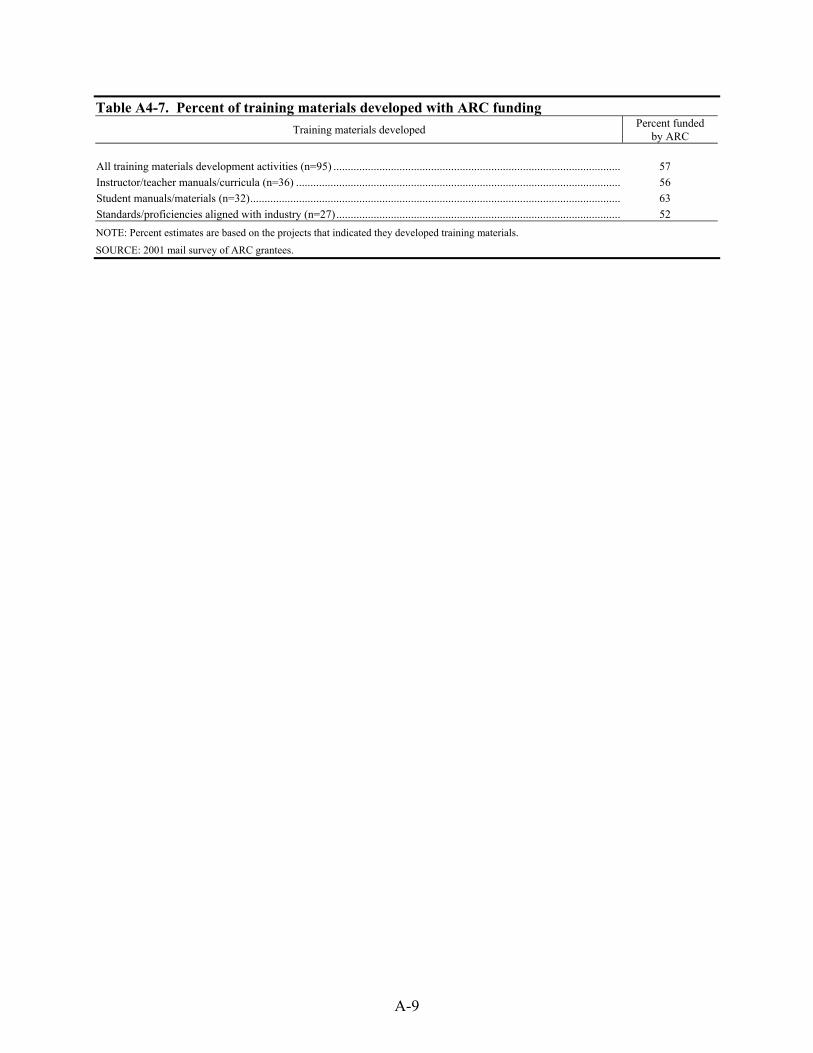
A-9
Table A4-7. Percent of training materials developed with ARC funding Training materials developed Percent funded
by ARC All training materials development activities (n=95) .................................................................................................... 57 Instructor/teacher manuals/curricula (n=36) ................................................................................................................. 56 Student manuals/materials (n=32)................................................................................................................................. 63 Standards/proficiencies aligned with industry (n=27)................................................................................................... 52 NOTE: Percent estimates are based on the projects that indicated they developed training materials. SOURCE: 2001 mail survey of ARC grantees.

A-10
Table A4-8. Percent of Cohort 1 projects reporting training project staff in various areas, by project characteristics
Project characteristic Project-purchased equipment
Specific skill or content area
Pedagogy or teaching skills
All projects (n=67) ...................................................... 64 60 31 Participant type
No full-time job experience (n=40) ........................ 65 58 28 Full-time job experience (n=8) ............................... 63 75 50 Both experience levels (n=19) ................................ 63 58 32
Participant age Primarily youth (n=22) ........................................... 68 50 36 Primarily adult (n=32) ............................................ 50 56 25 Both youth and adult (n=13)................................... 92 85 38
Geographic distribution
Single town or county (n=25) ................................ 68 60 32 Adjacent counties (n=6)......................................... 67 67 50 Nonadjacent counties (n=36) ................................. 61 58 28
Economic status
At least one distressed county (n=18).................... 72 72 33 No distressed counties (n=49)................................ 61 55 31
Metropolitan status
Metropolitan only (n=14)....................................... 36 36 0 Nonmetropolitan only (n=22) ................................ 73 59 36 Both metro and nonmetro (n=31) .......................... 71 71 42
ARC grant size
Less than $50,000 (n=16) ...................................... 56 38 13 $50,001 – $100,000 (n=29).................................... 69 79 41 $100,001 – $200,000 (n=16).................................. 75 56 44 More than $200,000 (n=6) ..................................... 33 33 0
Total project cost
Less than $100,000 (n=19) .................................... 58 42 21 $100,001 – $200,000 (n=28).................................. 75 82 42 $200,001 – $900,000 (n=16).................................. 63 50 31 More than $900,000 (n=4) ..................................... 25 25 0
Years of ARC funding
1 year (n=45) .......................................................... 60 53 22 2 years (n=15) ........................................................ 73 73 47 3 or more years (n=7)............................................. 71 71 57
SOURCE: 2001 mail survey of ARC grantees.

A-11
Table A4-9. Percent of project staff training conducted with ARC funding Project staff training area Percent funded
by ARC All project staff training activities (n=104) ........................................................................................................................ 36 Project-purchased equipment (n=43) ................................................................................................................................. 40 Specific skill or content area (n=40) .................................................................................................................................. 33 Pedagogy or teaching skills (n=21).................................................................................................................................... 33 NOTE: Percent estimates are based on the projects that indicated they trained project staff. SOURCE: 2001 mail survey of ARC grantees.

A-12
Table A4-10. Percent of Cohort 1 projects reporting providing job search assistance and career counseling activities, by project characteristics
Project characteristic Career counseling Job search/ placement activities Employability skills
Referrals to other agencies for assistance
All projects (n=67) ................................... 57 48 66 36 Participant type
No full-time job experience (n=40) ..... 65 63 75 40 Full-time job experience (n=8) ............ 38 0 50 38 Both experience levels (n=19) ............. 47 37 53 26
Participant age Primarily youth (n=22) ........................ 77 68 82 50 Primarily adult (n=32) ......................... 47 34 53 38 Both youth and adult (n=13)................ 46 46 69 8
Geographic distribution
Single town or county (n=25) ............. 72 68 88 44 Adjacent counties (n=6)...................... 67 67 67 33 Nonadjacent counties (n=36) .............. 44 31 50 31
Economic status
At least one distressed county (n=18). 50 33 50 28 No distressed counties (n=49)............. 59 53 71 39
Metropolitan status
Metropolitan only (n=14).................... 64 57 79 43 Nonmetropolitan only (n=22) ............. 55 45 73 41 Both metro and nonmetro (n=31) ....... 53 45 55 29
ARC grant size
Less than $50,000 (n=16) ................... 63 56 69 38 $50,001 – $100,000 (n=29)................. 52 45 66 31 $100,001 – $200,000 (n=16)............... 63 50 69 44 More than $200,000 (n=6) .................. 50 33 50 33
Total project cost
Less than $100,000 (n=19) ................. 63 58 74 42 $100,001 – $200,000 (n=28)............... 46 36 54 25 $200,001 – $900,000 (n=16)............... 75 69 88 56 More than $900,000 (n=4) .................. 25 0 25 0
Years of ARC funding
1 year (n=45) ....................................... 49 49 67 31 2 years (n=15) ..................................... 73 47 67 53 3 or more years (n=7).......................... 71 43 57 29
SOURCE: 2001 mail survey of ARC grantees.

A-13
Table A4-11. Percent of Cohort 1 projects reporting providing social support services, by project characteristics
Project characteristic Assistance arranging child care
Assistance arranging transportation Financial assistance
Referrals to other agencies for social support services
All projects (n=67) ................................... 6 7 18 24 Participant type
No full-time job experience (n=40) ..... 10 10 13 28 Full-time job experience (n=8) ............ 0 0 13 25 Both experience levels (n=19) ............. 0 5 32 15
Participant age Primarily youth (n=22) ........................ 0 9 5 27 Primarily adult (n=32) ......................... 13 9 28 28 Both youth and adult (n=13)................ 0 0 15 8
Geographic distribution
Single town or county (n=25) ............. 8 16 8 28 Adjacent counties (n=6)...................... 0 17 50 33 Nonadjacent counties (n=36) .............. 6 0 19 19
Economic status
At least one distressed county (n=18). 11 17 11 17 No distressed counties (n=49)............. 4 4 20 27
Metropolitan status
Metropolitan only (n=14).................... 7 0 14 14 Nonmetropolitan only (n=22) ............. 9 18 14 36 Both metro and nonmetro (n=31) ....... 3 3 23 19
ARC grant size
Less than $50,000 (n=16) ................... 0 0 13 19 $50,001 – $100,000 (n=29)................. 10 14 24 24 $100,001 – $200,000 (n=16)............... 6 6 13 25 More than $200,000 (n=6) .................. 0 0 17 33
Total project cost
Less than $100,000 (n=19) ................. 0 11 16 26 $100,001 – $200,000 (n=28)............... 4 4 18 14 $200,001 – $900,000 (n=16)............... 18 13 25 44 More than $900,000 (n=4) .................. 0 0 0 0
Years of ARC funding
1 year (n=45) ....................................... 7 7 18 20 2 years (n=15) ..................................... 7 7 13 33 3 or more years (n=7).......................... 0 14 29 29
SOURCE: 2001 mail survey of ARC grantees.

A-14
Table A4-12.Percent of social support services provided with ARC funding Social support service Percent funded
by ARC All social support services activities (n=37) ...................................................................................................................... 16 Assistance arranging child care (n=4) ................................................................................................................................ 25 Assistance arranging transportation (n=5).......................................................................................................................... 20 Financial assistance (n=12)................................................................................................................................................ 8 Referrals to other agencies for social support services (n=16) ................................................................... 19 NOTE: Percent estimates are based on the projects that provided support services. SOURCE: 2001 mail survey of ARC grantees.

A-15
Table A4-13. Percent of Cohort 1 projects reporting conducting community-wide activities, by project characteristics
Project characteristic Establish community or business partnerships
Distribute funds or mini-grants
Provide community outreach
All projects (n=67) ................................... 60 10 39 Participant type
No full-time job experience (n=40) ..... 60 10 38 Full-time job experience (n=8) ............ 63 25 25 Both experience levels (n=19) ............. 58 5 47
Participant age Primarily youth (n=22) ........................ 64 14 36 Primarily adult (n=32) ......................... 53 13 38 Both youth and adult (n=13)................ 69 0 46
Geographic distribution
Single town or county (n=25) ............. 68 8 36 Adjacent counties (n=6)...................... 50 17 33 Nonadjacent counties (n=36) .............. 56 11 42
Economic status
At least one distressed county (n=18). 67 22 56 No distressed counties (n=49)............. 57 6 33
Metropolitan status
Metropolitan only (n=14).................... 43 0 7 Nonmetropolitan only (n=22) ............. 68 9 59 Both metro and nonmetro (n=31) ....... 61 16 39
ARC grant size
Less than $50,000 (n=16) ................... 44 0 19 $50,001 – $100,000 (n=29)................. 69 14 52 $100,001 – $200,000 (n=16)............... 69 6 38 More than $200,000 (n=6) .................. 33 33 33
Total project cost
Less than $100,000 (n=19) ................. 47 5 26 $100,001 – $200,000 (n=29)............... 61 11 43 $200,001 – $900,000 (n=16)............... 81 13 50 More than $900,000 (n=6) .................. 25 25 25
Years of ARC funding
1 year (n=45) ....................................... 53 11 42 2 years (n=15) ..................................... 73 0 27 3 or more years (n=7).......................... 71 29 43
SOURCE: 2001 mail survey of ARC grantees.

A-16
Table A4-14. Percent of community-wide activities conducted with ARC funding Community-wide activity Percent funded
by ARC All community-wide activities (n=73) ............................................................................................................................... 34 Establish community or business partnerships (n=40) ....................................................................................................... 28 Distribute funds or mini-grants (n=7) ................................................................................................................................ 86 Provide community outreach (n=26).................................................................................................................................. 31 NOTE: Percent estimates are based on the projects that conducted community-wide activities. SOURCE: 2001 mail survey of ARC grantees.

A-17
Table A6-1. Percent of projects reporting current operating status, by project characteristics
Project characteristic In full operation Expanded scope Reduced scope No longer in operation
All projects (n=67) ......................................................... 49 30 15 6 Participant type
No full-time job experience (n=40)........................... 53 28 18 3 Full-time job experience (n=8).................................. 13 38 25 25 Both experience levels (n=19)................................... 58 32 5 5
Participant age Primarily youth (n=22).............................................. 55 23 23 0 Primarily adult (n=32) ............................................... 44 34 13 13 Both youth and adult (n=13) ..................................... 54 31 8 0
Geographic distribution
Single town or county (n=25)................................... 56 20 24 0 Adjacent counties (n=6) ........................................... 17 83 0 0 Nonadjacent counties (n=36).................................... 50 28 11 11
Economic status
At least one distressed county (n=18) ...................... 39 28 17 11 No distressed counties (n=49) .................................. 53 31 14 4
Metropolitan status
Metropolitan only (n=14) ......................................... 50 29 7 14 Nonmetropolitan only (n=22)................................... 45 27 23 0 Both metro and nonmetro (n=31)............................. 52 32 13 6
ARC grant size
Less than $50,000 (n=16) ......................................... 75 13 6 0 $50,001 – $100,000 (n=29) ...................................... 48 38 17 0 $100,001 – $200,000 (n=16) .................................... 44 31 19 6 More than $200,000 (n=6)........................................ 0 33 17 50
Total project cost
Less than $100,000 (n=19) ....................................... 63 11 11 0 $100,001 – $200,000 (n=28) .................................... 50 32 21 0 $200,001 – $900,000 (n=16) .................................... 44 44 6 6 More than $900,000 (n=4)........................................ 0 0 25 75
Years of ARC funding
1 year (n=45) ............................................................ 56 27 13 4 2 years (n=15) ........................................................... 40 40 13 7 3 or more years (n=67) ............................................. 29 29 29 14
NOTE: One project reported it had expanded to include more participants but was providing reduced services and is therefore included in both columns. Percents may not sum to 100 due to rounding. SOURCE: 2001 mail survey of ARC grantees.

A-18
Table A6-2. Percent of Cohort 1 projects that reported that their ARC-funded activities/equipment
were still operational to various extents at the time of the mail survey, by project characteristics
Portion of activities/equipment still operational Project characteristic None Some All
All projects (n=67) .......................................................................................... 6 94 0 Participant type
No full-time job experience (n=40) ............................................................ 0 100 0 Full-time job experience (n=8) ................................................................... 38 63 0 Both experience levels (n=19) .................................................................... 5 95 0
Participant age Primarily youth (n=22) ............................................................................... 0 100 0 Primarily adult (n=32) ................................................................................ 13 88 0 Both youth and adult (n=13)....................................................................... 0 100 0
Geographic distribution
Single town or county (n=25) .................................................................... 0 100 0 Adjacent counties (n=6)............................................................................. 0 100 0 Nonadjacent counties (n=36) ..................................................................... 11 88 0
Economic status
At least one distressed county (n=18)........................................................ 17 83 0 No distressed counties (n=49).................................................................... 2 98 0
Metropolitan status
Metropolitan only (n=14)........................................................................... 7 93 0 Nonmetropolitan only (n=22) .................................................................... 0 100 0 Both metro and nonmetro (n=31) .............................................................. 10 90 0
ARC grant size
Less than $50,000 (n=16) .......................................................................... 0 100 0 $50,001 – $100,000 (n=29)........................................................................ 0 100 0 $100,001 – $200,000 (n=16)...................................................................... 0 100 0 More than $200,000 (n=6) ......................................................................... 67 33 0
Total project cost
Less than $100,000 (n=19) ........................................................................ 0 100 0 $100,001 – $200,000 (n=28)...................................................................... 0 100 0 $200,001 – $900,000 (n=16)...................................................................... 0 100 0 More than $900,000 (n=4) ......................................................................... 100 0 0
Years of ARC funding
1 year (n=45) .............................................................................................. 2 98 0 2 years (n=15) ............................................................................................ 7 93 0 3 or more years (n=67)............................................................................... 29 71 0
NOTE: ARC-funded activities are those for which respondents reported ARC provided some funding. Percents may not sum to 100 due to rounding. SOURCE: 2001 mail survey of ARC grantees.

B-1
Appendix B
Evidence in Support of Projects’ Outcomes

B-2
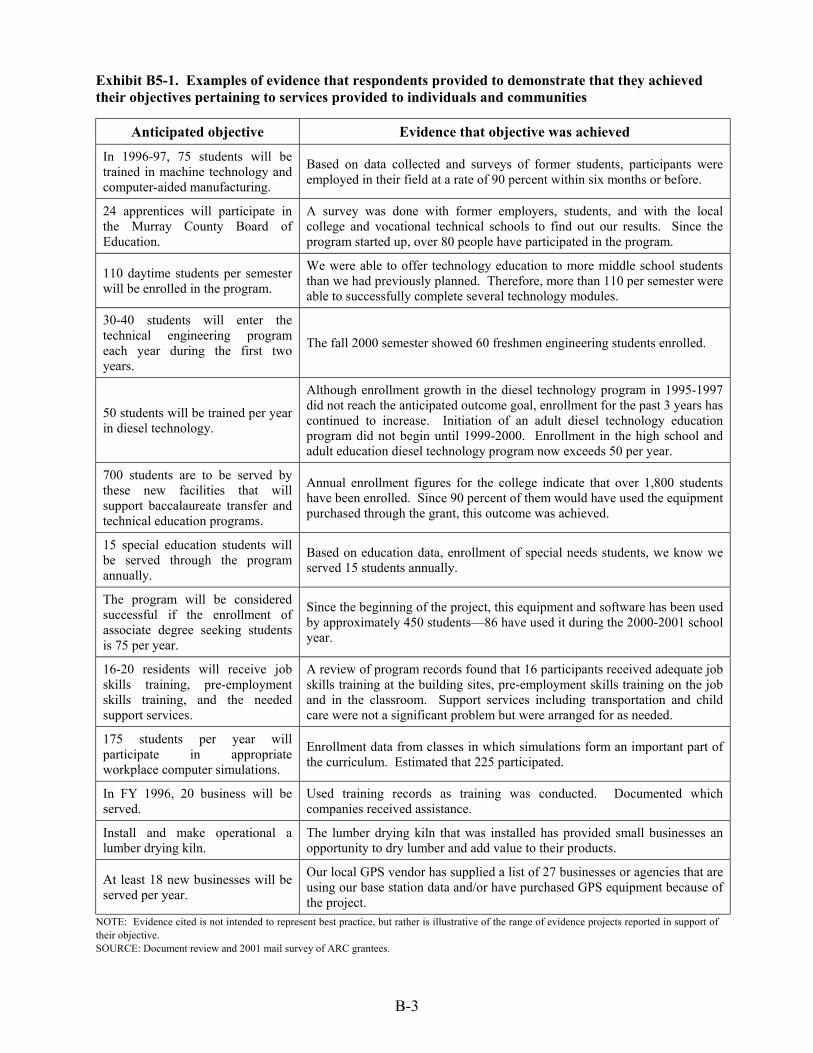
B-3
Exhibit B5-1. Examples of evidence that respondents provided to demonstrate that they achieved their objectives pertaining to services provided to individuals and communities
Anticipated objective Evidence that objective was achieved
In 1996-97, 75 students will be trained in machine technology and computer-aided manufacturing.
Based on data collected and surveys of former students, participants were employed in their field at a rate of 90 percent within six months or before.
24 apprentices will participate in the Murray County Board of Education.
A survey was done with former employers, students, and with the local college and vocational technical schools to find out our results. Since the program started up, over 80 people have participated in the program.
110 daytime students per semester will be enrolled in the program.
We were able to offer technology education to more middle school students than we had previously planned. Therefore, more than 110 per semester were able to successfully complete several technology modules.
30-40 students will enter the technical engineering program each year during the first two years.
The fall 2000 semester showed 60 freshmen engineering students enrolled.
50 students will be trained per year in diesel technology.
Although enrollment growth in the diesel technology program in 1995-1997 did not reach the anticipated outcome goal, enrollment for the past 3 years has continued to increase. Initiation of an adult diesel technology education program did not begin until 1999-2000. Enrollment in the high school and adult education diesel technology program now exceeds 50 per year.
700 students are to be served by these new facilities that will support baccalaureate transfer and technical education programs.
Annual enrollment figures for the college indicate that over 1,800 students have been enrolled. Since 90 percent of them would have used the equipment purchased through the grant, this outcome was achieved.
15 special education students will be served through the program annually.
Based on education data, enrollment of special needs students, we know we served 15 students annually.
The program will be considered successful if the enrollment of associate degree seeking students is 75 per year.
Since the beginning of the project, this equipment and software has been used by approximately 450 students—86 have used it during the 2000-2001 school year.
16-20 residents will receive job skills training, pre-employment skills training, and the needed support services.
A review of program records found that 16 participants received adequate job skills training at the building sites, pre-employment skills training on the job and in the classroom. Support services including transportation and child care were not a significant problem but were arranged for as needed.
175 students per year will participate in appropriate workplace computer simulations.
Enrollment data from classes in which simulations form an important part of the curriculum. Estimated that 225 participated.
In FY 1996, 20 business will be served.
Used training records as training was conducted. Documented which companies received assistance.
Install and make operational a lumber drying kiln.
The lumber drying kiln that was installed has provided small businesses an opportunity to dry lumber and add value to their products.
At least 18 new businesses will be served per year.
Our local GPS vendor has supplied a list of 27 businesses or agencies that are using our base station data and/or have purchased GPS equipment because of the project.
NOTE: Evidence cited is not intended to represent best practice, but rather is illustrative of the range of evidence projects reported in support of their objective. SOURCE: Document review and 2001 mail survey of ARC grantees.

B-4
Exhibit B5-2. Examples of evidence that respondents provided to demonstrate that they achieved their objectives pertaining to skill attainment
Anticipated objective Evidence that objective was achieved
Upgrade the quality of new employees in the trade and industrial program.
A survey of program completers found that 60 percent were employed using the skills they had learned during the program.
New worker behaviors and skills will be transferred to the workplace.
Post-training discussions were conducted with company officials to determine if changes were apparent. Company officials stated that employees were more aware of hazards. Also, skills training helped employees do new things.
Participating students will develop a broad base of skills in the use of technological tools and systems (i.e., problem-solving skills).
After giving students a pre-test to discover how little knowledge they had of a particular technology then to discover the skills learned by giving a post-test. Results were very promising.
Increase the small business leadership skills of at least 25-30 youth annually.
29 youth participated in the management training portion of the project. Staff reports and anecdotal evidence suggested that most youth did increase their skills.
Increase the number of youth that learn and practice computer skills. 9 youth increased their computer skills.
Increase the number of technically educated persons entering the local workforce.
Annual surveys report placement of over 90 percent of graduates in the technical field for which they trained.
Secondary and adult students who participate in these courses will be better prepared for the workforce.
Based on the enrollment in the program and the pre-post tests assessments, we were able to conclude that participants are better prepared for the workforce.
Graduates will be prepared to operate CNC machines on the job.
Information obtained from the VE-23’s indicated that 50 percent of completers were employed in precision machining. Through informal conversations with past completers, 75 percent of the completers have been employed in the precision machining area.
Students who participate in the middle school residential institute will improve their self-esteem and develop positive self-images.
All participants indicated on post-program surveys that they now saw themselves as capable to attend and complete a post-secondary course of study.
Participants’ employability skills will be improved.
Survey results have been taken once over the last five years. Those results indicate that 85 percent of graduates were placed in jobs or continued into post-secondary education.
Students will gain the technical skills and knowledge required to become licensed hygienists and certified assistants.
An overview of both state and national exam results revealed that 85 percent of the students sitting for the examinations passed (first try). Increased to 97 percent after the second attempt.
Increase the efficiency and skill levels of existing network members.
Four knitters received training in apparel design and applied their new skills in design projects. This is a career path that provides better wages for higher skills. Twenty-three knitters participated in quality control, measurements, and pattern reading workshops. The number of second repairs and returns went down significantly. Six knitters became trainers through ABD’s training course. Trainers earn a higher wage and have opportunities for ongoing professional development in the training field.
NOTE: Evidence cited is not intended to represent best practice, but rather is illustrative of the range of evidence projects reported in support of their objective. SOURCE: Document review and 2001 mail survey of ARC grantees.

B-5
Exhibit B5-3. Examples of evidence that respondents provided to demonstrate that they achieved their objectives pertaining to employment status
Anticipated objective Evidence that objective was achieved
Increase the number of qualified dental hygienists entering the job market in the Appalachian counties in north Alabama.
From 1995-2000, 78 students graduated from the dental hygiene program. A survey of graduates indicated that 74 of the 78 are employed in the field for a 95 percent rate of working in the field.
Graduates will earn higher wages (since their productivity will increase).
A survey of former participants found average wages increased from $5.50 per hour to $7.50 per hour.
Increase the number of students placed in skill development positions.
An informal survey was done to verify the results of the outcome. I recall that about 60 students had been placed in skill development positions.
For 1999, six welfare parents will be placed in full-time child care jobs.
Over the two years we were funded by ARC, four of our graduates became employed full-time in child care jobs at Sunshine School. Another graduate, who moved from our area, worked full-time as the director of a home-based day care center. Another participant in our program worked full-time at Sunshine Day Care before obtaining a full-time position at Harlan Elementary School.
Ninety percent of the individuals completing the Certificate program will be employed in positions directly related to the training they received.
Survey of graduates noted that in 1998—12 graduates, 9 replied, 100 percent employed. 1999—17 graduates, 16 replied, 100 percent (31 percent employed, 69 percent transferring).
Increase the percentage of graduates that were placed in jobs.
Post-program completion surveys conducted each year have shown that from 1995 to the 1999-2000 school year, job placement of completers has increased by more than 60 percent. This number is supported by records maintained by administrative staff and placement data provided by employment services.
The 15 special education students will graduate to job placement within the community.
Our follow-up career education placement data indicate that 15 special needs students graduated to job placement.
Through teaching students the latest technical information, students (pre-employment and currently employed) will have the ability to obtain higher paying jobs.
Since this project started, the students have consistently gotten higher paying jobs. For example, students who are trained on a CNC machine can get a higher paying job (even though it is minimal training). It is true that most kids who graduate from this program earn from $1.50 to $2.00 more than other programs. When our first group graduated, they could earn about $8.00 per hour. Then it went up to $9.75 to $10.00—and now our graduates earn $10.50. The kids are so proud they often bring in their paychecks to show us. We know what the program can do. We maintain contact with employers and keep up with our students.
Of the graduates, 80 percent will be directly placed in jobs.
Participant and employer data surveys. Over 85 percent of the graduates from the programs using this equipment were placed in directly or closely related positions.
As a result of the services provided, participants will become gainfully employed.
A survey of former participants helped us determine that 14 participants have been gainfully employed. The employers include construction contractors, the local school system (job care providers), the housing authority (maintenance), health care providers, a furniture manufacturing company, and job corps.
NOTE: Evidence cited is not intended to represent best practice, but rather is illustrative of the range of evidence projects reported in support of their objective. SOURCE: Document review and 2001 mail survey of ARC grantees.

B-6
Exhibit B5-4. Examples of evidence that respondents provided to demonstrate that they achieved their objectives pertaining to community viability
Anticipated objective Evidence that objective was achieved
Participating businesses in work-site partnerships with the school districts will report significant benefits from student placements.
Survey of participating businesses shows that all employers report positive experiences with students placed at their businesses.
Enhance economic development in north Alabama.
We believe that this program funded by the ARC has made a considerable improvement to the economic development of this area. The fact that 150 or more graduates have obtained good paying jobs, that this allows for more spending, and lowers unemployment. This program was the first 2-year OTA program in Alabama—there is only one other 2-year program (in Mobile).
The private sector will benefit from the availability of local workers with up-to-date training.
A survey of employers found that they benefited from the skilled workers.
The local economy will benefit from the increased wages earned by a more productive workforce.
A survey of the local businesses found increased sales and business.
Increase the capacity of Appalachian companies to effectively compete in the global marketplace.
Because of ISO 9000 requirements, as well as other global quality standards, many of our businesses engage in this type of training in order to satisfy these standards (which, in turn, enhances their ability to retain or enhance their market share). Purchases of new machinery and equipment may also require employee training and the FAIR program has contributed to these types of projects as well. Machinery and equipment extends beyond new industrial machinery to include computer and computer systems—all of which may require employee training.
Meet the educational needs of local industry once the new facility is fully operational.
Over 140 different businesses, industries, and agencies use the facilities annually. The number of employees trained has increased from 855 in FY 1993 to 2,204 in FY 2000.
Meet the communication, mathematics, and scientific needs of local business and industry.
Because of the ARC-funded equipment, our schools were able to teach applied academic skills that meet employer needs—as indicated by almost 0 unemployment in our area over the last 5-7 years and the tremendous economic expansion in Spartanburg and Cherokee counties.
Meet the present and future needs of local employers.
Participant and employer survey. Survey results showed over 95 percent met or exceeded present requirements. Over 75 percent felt training would serve their needs for the next five years.
Meet the special job training needs of Appalachian Pennsylvania.
We have found that Appalachian Pennsylvania communities and manufacturers have training needs which are not being met because of geographic and availability considerations. This program brought effective training to the northeast Pennsylvania region.
NOTE: Evidence cited is not intended to represent best practice, but rather is illustrative of the range of evidence projects reported in support of their objective. SOURCE: Document review and 2001 mail survey of ARC grantees.

C-1
Appendix C
Notes on the Technical Approach

C-2
C-3
Appendix C
Notes on the Technical Approach This appendix provides an overview of the data collection and sampling procedures that were used to conduct the study. Specifically, information is provided on the methodologies used to (1) select the study sample, (2) conduct the document review, (3) access information from ARC databases, and (4) conduct the mail survey. The case study methodology is discussed in Appendix D. Process Used to Select the Study Sample The evaluation was designed to focus on a selected sample of ARC’s vocational education and workforce training projects that received funding in the 1990s and 2000. The ARC database contained information about 173 projects that were awarded grants between 1990 and 2000,1 and ARC staff pulled project files for over 100 of them. Every effort was made to achieve a balance of project type (using ARC designations that combine population served and type of service provided) and the states that make up Appalachia, to the extent possible given that some states conducted far more vocational projects than others. Projects were considered for inclusion in the study sample only if there was sufficient information in the file for the document review (e.g., an application and monthly/end of project reports). Ultimately, a sample of 67 Cohort 1 projects and 25 Cohort 2 projects was drawn. The information we extracted from the documentation enabled us to establish a point of contact with each project and to determine
1 These 173 projects represent an unduplicated count. ARC’s
database typically has a separate entry for each year of ARC funding a project receives. The database used to select projects and conduct additional analyses to understand the representativeness of the sample had already been modified so that a project that received ARC funding in multiple years would have only one entry. An exception was made for one grantee that had a similar project in each cohort.
whether someone with knowledge of the ARC grant was still available to reply to the mail survey. We were able to identify a knowledgeable contact in all projects in the sample. Document Review ARC provided Westat with copies of available documentation for the 92 projects in the two cohorts. The most widely available form of documentation was the initial proposal to ARC (89 percent of projects), followed by final or close-out reports (63 percent of projects) and progress reports (50 percent of projects). Ten percent of the projects had separate and detailed evaluation reports.2 The following information was entered into an Access database: • Project description;
• Problems projects were designed to address;
• Population segments served;
• Activities conducted as part of the ARC grant;
• Obstacles/barriers to implementation; and
• Intended outputs and outcomes.
We made considerable use of the information obtained through the document review. First, these data were used to provide the study team with background information about the types of activities and outcomes that were supported by ARC during the 1990s. Second, the document review database was used to develop some of the
2 The documents that we reviewed reflected what was in the project
files at the time of the study. It is possible that some of the materials that individual projects submitted were not in their files at the time the review was conducted.

C-4
close-ended options for the mail survey. Third, we used projects’ original language regarding anticipated outcomes to develop an addendum to the mail survey for Cohort 1 projects. This addendum, customized for each project, provided respondents with an opportunity to more precisely benchmark their levels of achievement against the performance standards set forth in their proposals to ARC. Fourth, we used the materials in a subset of project files to inform the selection of the case study sites. Finally, examples from the document review were used to illustrate findings in the final report. ARC Database Additional descriptive data regarding grant amounts, total project costs, and metropolitan and economic status of counties were obtained from the ARC database. Several issues regarding this task are worth noting. First, with assistance from ARC staff, we obtained a database that had collapsed grant amounts and total project costs for initiatives that spanned 2 or more years. Second, the database contained codes for the economic and metropolitan status of projects and the counties in which they operated. In cases where projects operated in multiple counties, ARC staff assisted us by recoding these fields. We considered the project to be serving a distressed county if at least one of the counties listed in its original application was designated as being distressed at the time the ARC grant was first awarded. Finally, we did not attempt to classify the economic or metropolitan status of projects serving all ARC counties in a state (or serving communities in two or more states). Rather, multicounty, statewide, multistate projects were treated as projects serving both metropolitan and nonmetropolitan counties. Mail Survey The mail survey was the primary data collection activity. The Cohort 1 survey was designed to obtain a common set of data concerning project implementation and accomplishments, as well as information about the extent to which projects achieved the outcomes they had anticipated for themselves. Specifically, Part 1 of the survey contained close-ended items relevant to all ARC
projects. Part 2 focused on the specific outcomes that projects had described in their applications to ARC. Thus, while Part 1 asked about generic project goals (e.g., provide employability skills, retrain workers for new employment), Part 2 asked about specific outcome goals (e.g., decrease unemployment by 10 percent over 3 years). Appendix F provides copies of Parts 1 and 2 of the Cohort 1 mail survey. Cohort 2 projects received an abbreviated survey without a Part 2. Projects were asked all of the same descriptive characteristic questions as Cohort 1, but were asked only generally about their activities. Additional items on data collection methodologies were included on Cohort 2 survey, but not the Cohort 1 survey. Because most Cohort 2 projects were still active at the time of the survey, items related to outputs and outcomes were not included. Appendix G provides the Cohort 2 mail survey. The survey was pretested with five projects in the survey sample and subsequently revised and mailed to the projects early February 2001. Respondents were asked to return completed surveys to Westat by February 22, 2001. Telephone followup for survey nonresponse began in late February 2001—and telephone followup for item nonresponse was conducted throughout March and April 2001. The final survey sample consisted of 67 Cohort 1 projects and 25 Cohort 2 projects, for a 100 percent response rate. The nonresponse rate for individual items (i.e., the respondent either refused to answer the question or indicated “don’t know,” or the response could not otherwise be ascertained) ranged from 0 percent to 3 percent for Cohort 1 and 0 percent to 24 percent3 for Cohort 2.
3 Six respondents did not answer the item on barriers to collecting
followup data on participants.
D-1
Appendix D
Case Study Methodology and Reports

D-2
D-3
Appendix D
Case Study Methodology and Findings This appendix provides case study methodology and the five case study reports. CASE STUDY METHODOLOGY The site visits were designed to allow for a more detailed examination of successful ARC-funded vocational education and workforce training projects, with an emphasis on the lessons learned by these projects and their efforts at sustainability. Five projects (three from Cohort 1 and two from Cohort 2) were selected for intensive visits, and information gained through these site visits was summarized in a series of case studies. In addition, specific findings were used throughout the final report to illustrate key survey findings. The following criteria were used to narrow the pool of projects considered for site visits: • Projects had to still be in operation (full,
partial, or changed). This was ascertained through telephone contacts conducted by Westat in November 2000.
• Projects had to have achieved at least some of their stated goals. This was ascertained through a review of project documentation and survey responses.
• Projects had to have focused on providing services in addition to equipment. This was ascertained through a review of survey responses.
• Projects had to be conducting some type of participant followup data collection that extended beyond informal conversation or anecdotes. This was ascertained through a review of survey responses.
• Projects were then selected to represent a range of the following:
− Population served—i.e., youth or adults—as determined by survey responses and ARC’s database indications of vocational education or workforce training.
− States, with Commission projects representing the states in which they are located.
− Project scope and size, measured by grant amount and number of counties or breadth of the region served.
− Grantee organization types—i.e., schools or districts, state government, economic or community development organizations, postsecondary institu-tions.
Following a brief telephone call to ensure that projects were willing to host a site visit and that ARC-funded activities were still in operation, the original five primary sites were selected as the final case study sample (Exhibit D-1). Site visitors spent 1½ to 2 days at each of the five sites. While onsite, the evaluators met with project directors and other key staff, interviewed or conducted informal focus groups with project beneficiaries, including instructors, students, families, and adult learners, and visited facilities supported through the grants. The resulting case studies were reviewed for accuracy by each project’s primary respondent.

D-4
Exhibit D-1 Case Study Projects
Cohort 1: Daniel Morgan Vocational Center Horticulture Program Daniel Morgan Technology Center, Spartanburg, South Carolina Manufacturing Assistance Center University of Pittsburgh, Harmarville, Pennsylvania Winston County Technology Center Vocational Curriculum Winston County Board of Education, Winston County, Alabama Cohort 2: Chautauqua County Wood Skills Training Private Industry Council of Chautauqua, Inc., Jamestown, New York Fund for Appalachian Industrial Re-Training (FAIR) State of Ohio, Department of Development, Office of Industrial Training, Appalachian Ohio
CASE STUDY REPORTS The five case study reports are provided in the following pages.

D-5
Daniel Morgan Technology Center Horticulture Program
Project Location Spartanburg, South Carolina
Grant Recipient Daniel Morgan Technology Center (DMTC)
ARC Number SC 12090
Project Type Vocational Education
Grant Amount $13,490
Matching Funding $13,490
Dates of Site Visit April 23-24, 2001
Site Visitor Nicole Bartfai
Project Abstract
Daniel Morgan Technology Center (DMTC), a technical and vocational center for two school districts in Spartanburg, South Carolina, established a horticulture program to meet the growing needs of the landscape industry in the greater Greenville/Spartanburg area. The primary goal of the program was to increase students’ knowledge and overall familiarity with horticulture/agriculture. The ARC grant was used to purchase state-of-the-art equipment to enhance the program, including a Bobcat 753 skid loader with auger, pallet, and tiller kits, a 486 computer, horticulture software, sprayer, hedge trimmers, a weed eater, and a blower. The new equipment added versatility to the types of projects conducted by the class.
The horticulture program is one of many offered at Daniel Morgan. Data collected on the horticulture program are part of the overall school evaluation; they include enrollment numbers, completion rates for students, and placement rates. In addition, in-class assessments directly measure a student’s performance in all horticulture course.
The most notable accomplishment of the horticulture program at DMTC is that many students were exposed to various aspects of horticulture and agriculture. Another indication of the school’s success is the increase in the number of students accepted in the National Vocational Honors Society.

D-6
Daniel Morgan Technology Center
Equipment Purchase for the Horticulture Program
A. Background and Context
Objectives/Problems Addressed
The horticulture program that was established at the Daniel Morgan Technology Center (DMTC) was designed to increase students’ knowledge and familiarity with that field of work. It was determined through a countywide needs assessments that local landscaping companies were anticipating job openings in the next 5 years. The school sent out a follow-up survey to local landscape companies and golf courses in the Greenville/Spartanburg area in order to better understand the types of skills these workers would need. The ARC grant was then used to purchase equipment to facilitate students’ attainment of these skills.
Community and Beneficiaries
Daniel Morgan Technology Center serves students in grades 10 through 12 from two local high schools—Spartanburg and Broome. As noted by several school officials, the population at Daniel Morgan is extremely diverse due to the differing characteristics of the feeder schools. Spartanburg High School serves a predominantly urban population with a high percentage of minority students, whereas Broome High School serves a predominantly rural population of primarily white students. Despite the extreme diversity, the students work well together and the school has experienced relatively few problems with students. Broome High School has an overall student population of 800 students in grades 9 through 12; approximately 645 students are in grades 10 through 12. Spartanburg High School serves an average enrollment of 1,500 students in grades 10 through 12.
Grant Recipient
Daniel Morgan Technology Center, once called the Daniel Morgan Vocational Center, provides technical and vocational education courses for students from two of the seven local high schools. The Center offers the traditional vocational courses (i.e., auto mechanics, cosmetology) as well as new courses such as computer programming and culinary arts. A board of directors, composed of three board
D-7
members from each school district, governs the Center, and each district provides funding to DMTC. Daniel Morgan operates under the Office of Career and Technology Education at the South Carolina Department of Education.
Daniel Morgan has an enrollment that ranges from 500 to 600 students each semester. This
high level of enrollment, compared to other vocational schools in the area, can be attributed to several changes the school has made over the past 5 years. For example, at one time, Daniel Morgan only served 11th and 12th grade students, but now it serves 10th grade students as well. More importantly, Daniel Morgan changed from the traditional two sessions to three 90-minute block sessions daily. This change enabled the students to take one course at Daniel Morgan and continue with their academic classes at their local high schools. With the increased flexibility, more students can take semester-long courses at Daniel Morgan without altering their academic schedules. Daniel Morgan also decided to offer semester-long courses instead of the traditional 2-year vocational tracks. This change opened more variety in course offerings, which attracted more nontraditional vocational education students. A greater variety of courses allows students to get more exposure to possible career options.
Current Status
The horticulture program, supported and funded entirely by Broome and Spartanburg High Schools, was in full operation at the time of the site visit. Courses in horticulture were offered at DMTC from 1996 through 1999 and now again in 2001. The horticulture program was not offered during the 1999-2000 school year because the school was unable to find a qualified instructor (the original instructor left his teaching position at the school in order to accept an administrative position with another school district). Since then, the program has hired a new instructor, a recent college graduate, enabling the school to start offering horticulture course again this year. The newly hired instructor demonstrated considerable enthusiasm for and commitment to the horticulture program and its purpose. Though his style of instruction is different from the original instructor, the courses offered have remained consistent. The Director at Daniel Morgan anticipates continuing to offer horticulture/agriculture courses as long as enrollment is adequate and the budget allows for it.
B. Approach
The horticulture program was initiated in 1995 to address the growing need of area businesses in the areas of landscaping. The primary aim was to expose students to the horticulture industry and increase their overall knowledge of horticulture/agriculture. Students interested in horticulture could enter the workforce directly from high school or go to Spartanburg Technical School

D-8
and enter the 2-year program in horticulture. The ARC grant was used to purchase state-of-the-art equipment, i.e., a Bobcat and several attachments, one computer, horticulture software, sprayer, hedge trimmers, a weed eater, and a blower. A school-level survey, conducted to assess the initial level of interest in the horticulture program, asked students general questions regarding the types of horticulture courses they would be most interested in taking. Once the design of the program was finalized, students were actively recruited during English classes. 1
Training/Curriculum
The courses offered include introduction to horticulture, residential landscaping, commercial landscaping, and horticulture business. In order to provide a more interesting selection of courses for the students next year, residential and commercial landscaping are being combined, and a course in wildlife and forestry management was added. Each course meets for 90 minutes every day, Monday through Friday, for an entire semester.
The curriculum for each of the courses is adapted from Clemson University Agriculture
curriculum guidelines. The program is part of the FFA (previously Future Farmers of America) umbrella at Clemson University. Therefore, the data collected on students in the horticulture program are reported to the FFA for their monitoring purposes. Although the base curriculum guidelines are used in the horticulture courses at Daniel Morgan, the instructor is responsible for adapting them to fit the needs of the students.
Integration of horticulture into the regular academic curriculum. One of the strengths
of the previous instructor was his emphasis on bringing horticulture into the regular academic curriculum. He worked with the teachers at Daniel Morgan and with several of the regular high school teachers to integrate horticulture into their subject areas. A plant sale, conducted by this instructor, encouraged classes in other subject areas to talk and learn about horticulture. For example, the algebra classes graphed the results outcomes of the plant sale, the business technology classes tracked financial growth, the marketing classes marketed the product, the science classes discussed the growing cycle, and even the history classes learned about how horticulture affected rural cultures, how different species of plants spread due to migration, and how horticulture has affected medicine.
1 Faculty from DMTC traditionally speak during English class in order to inform students, all of whom must take English, about the opportunities
available at the school.

D-9
Equipment
As mentioned earlier, the most significant part of the equipment purchase was a Bobcat 753 skid loader with auger, pallet, and tiller kits. Additional equipment purchased with the grant money included a trimmer, blower, hedge trimmer, tine tiller, sprayer, and the 486 computer with horticulture software. An advisory committee established to solicit input from business and school stakeholders to enhance the horticulture program originally recommended that a large part of the grant money was to be used for construction of a greenhouse and the purchase of a lawn tractor. After the grant was submitted with these recommendations, the instructor and the current assistant director determined that the Bobcat rather than the lawn tractor would better serve the needs of the school and the program because of its versatility. Ultimately, the two greenhouses were constructed with funding from the regular school budget.
Bobcat 753 skid loader with auger, pallet, and tiller kits. Overall, the Bobcat accounted
for well over half of the grant. In general, all individuals who were interviewed during the site visit indicated that the purchase of the Bobcat was a great investment. At the time of the site visit, the Bobcat was being serviced because of problems with the hydraulics system, but the instructor indicated these problems have not limited the use of the equipment. There are no plans to upgrade this piece of equipment, and staff indicated it would last another 20 years or more.
Computer hardware/software. The 486 computer is still in the classroom, but is rarely
used because it is so much slower than other computers in the class that were more recently purchased. Although the software is outdated, it is still used in the agriculture business course since no other software has been purchased. The instructor indicated they hope to purchase more up-to-date software, but currently there are no plans to do so.
Other landscaping equipment. The other landscaping equipment purchased through the
ARC grant has required general maintenance, but has not experienced any real problems. Given the limited use of some of the equipment (i.e., sprayer), staff anticipated most of it will last for several more years. Therefore, there are no definite plans to upgrade this equipment, but there was some mention of a need to purchase new trimmers in the next couple of years. This expense would be covered in the regular budget.
Integration of the equipment into the horticulture curriculum. Students are required to
learn how to operate the equipment in two of the four horticulture courses, and the other two courses cannot be taken until one of the introductory courses has been completed. One way the instructor ensures that students learn about the equipment is by requiring them to pass both written and hands-on safety tests. They must achieve 100 percent on both tests. Students use the equipment on a regular basis, as they
D-10
are responsible for the upkeep and maintenance of the courtyard and greenhouse areas. In previous years, students also worked in the community on various landscaping projects (e.g., landscaping the front of the county offices of education). In general, students learn how to operate the equipment, which prepares them to enter the workforce or a technical school program.
Other Services
Most support services are offered to students at their home school. However, Daniel Morgan has two onsite guidance counselors who assist students with job placement, postsecondary education, and other career-related activities.
C. Evaluation and Outcomes
In general, the data collected on the horticulture program are part of the overall school evaluation, and include enrollment numbers, completion rates for students, and placement rates. Some of these data are collected in order to adhere to state reporting requirements, while others are district-level indicators. Most importantly, the evaluation tools serve to convince stakeholders that Daniel Morgan Technology Center is meeting its goals and providing a necessary service to the students. In addition to these data, in-class assessments directly measure a student’s performance in all horticulture courses.
Enrollment Data
Total school enrollment averages around 500 students during any given semester, which is about 28 percent of the students from both Broome and Spartanburg High. During the fall 2000 semester, over 600 students attended classes at Daniel Morgan. During Spring 2001, 489 students are enrolled. Only 40 to 50 students per year are considered full-time technology/vocational students, that is, students who are enrolled in a particular track (i.e., cosmetology) and expected to be at Daniel Morgan for half of their school day. Nonetheless, approximately 75 percent of the students return for a second course at Daniel Morgan. Many of the students enroll in one, two, or three courses but do not attend Daniel Morgan for more than one course per semester due to scheduling difficulties.
The director and assistant director both indicated the horticulture program is struggling to
regain its initial enrollment since returning to the course offerings DMTC this past year. During the first semester, 23 students were enrolled in all three courses; currently, only 12 students are enrolled in two courses. These numbers are expected to increase for next year as the enrollment for the fall 2001

D-11
semester is already at 39 students in three classes. As long as enrollment remain high, and the budget allows, horticulture will continue to be offered at Daniel Morgan.
Perkins Career and Technology Education Standards
As part of the 1998 Carl D. Perkins Vocational and Applied Technical Education Act, South Carolina established performance indicators. These indicators allow schools to demonstrate that students in vocational and applied technical programs are (or are not) reaching acceptable levels of performance. The public high schools are held directly accountable to Perkins for the first four of the six standards. These standards pass directly to the vocational/technology schools to monitor and track. The following are the 1999-2000 school year standards, along with the new 2001 and 2002 standards:2
Standard 1: Vocational and Technical Skill Proficiencies. Fifty percent of Career
and Technology students will achieve a final grade of at least 2.0 for all Career and Technology Courses taken during the current year. The 2001 standard is 74 percent; for 2002, it is 74.5 percent.
Standard 2: Academic Achievement. Fifty percent of Career and Technology students will achieve a final grade of at least 2.0 for all mathematics, science, and English/language arts courses taken during the current year. The 2001 standard is 61 percent; for the 2002 school year, it is 61.5 percent.
Standard 3: Graduation. Seventy-five percent of 12th grade Career and Technology completers will receive a South Carolina high school diploma. The 2002 standard is 73.6 percent.3
Standard 4: Placement. Fifty percent of South Carolina’s Career and Technology completers who are available for placement will be placed in postsecondary instruction, military service, or employment utilizing the Career and Technology competencies attained. For the 2001 and the 2002 school year, the standard will be 93.5 percent, which will be calculated using a 3-year average. It is important to note that employment will be counted whether the student is employed in a related or an unrelated field.
In order to track achievement of these standards, the vocational/technology schools track “completers.” A completer is defined as a student who is expected to complete four courses in one program. Once a student enters his/her second year, he/she is assigned a code and for tracking purposes is considered a completer. Once the code is assigned, the student is tracked by DMTC, regardless of whether the student remains enrolled there. One problem with this system is that many students who have taken fewer than four courses in one program at Daniel Morgan are not counted toward the school’s achievement of Perkins standards.
2 The four standards that were set for achievement at the school level are provided here. Standards 5 and 6, which deal with gender
underrepresentation, are set to be achieved at the state level. 3 There was no standard for the 2001 school year. Documentation was provided during the site visit.

D-12
Although Daniel Morgan no longer receives Perkins money, the staff intend to continue to
adhere to the Perkins guidelines. The director and assistant director feel that it is important to collect these data because they are a good way to benchmark the school’s progress. In prior years, Daniel Morgan has well exceeded the standards. At the time of the site visit, performance measures were available from one of the schools served by Daniel Morgan.4 The district’s academic performance standard (Standard 2) was 54.84 percent compared to the 50 percent the required achievement rate. The district’s graduation rate (Standard 3) was 94.59 percent compared to the 75 percent required graduation rate, and the district had a 100 percent placement rate (Standard 4) as compared to the 50 percent placement rate required.
The placement rates (Standard 4) are the sole responsibility of the staff at Daniel Morgan,
and per state requirements these data are collected 1 year after graduation. Placements rate for the 1999-2000 school year for Daniel Morgan completers were:
Placement Number of students (44) Percentage of students Postsecondary education.................................. 22 50 Military ............................................................ 4 9 Employed ......................................................... 16 36 Not engaged in work or school ........................ 2 5 Total number of positive placements ............... 42 95
There were no completers in the horticulture program for the 1999-2000 school year. However, for 1997-1998, two students were considered completers; one was still in high school and the other student was enrolled in a technical school in a related program. The one student completer for the 1998-99 school year could not be reached to determine placement.
Student Attitude Survey
The guidance counselor at Daniel Morgan conducted a student attitude survey at the end of the fall semester and was planning to conduct another one at the end of the spring semester. This survey measured the students’ attitudes and feelings about Daniel Morgan. The survey asks:
Basic demographic information (i.e., grade level, home school)
What are your plans after high school?
How would you rate the value of your training at DMTC?
4 Although most of the information was available, the performance measure for Standard 1 was not provided.

D-13
Will you be returning?
What influenced you to take a class at Daniel Morgan?
What do you like best and least about Daniel Morgan?
Would you recommend Daniel Morgan to your friends?
List any courses you would like offered.
Although, there was no official report of the findings from the survey, the guidance counselor compiled the information for internal use.
Student Assessment
The current instructor of the horticulture program was utilizing many techniques learned while at Clemson and during his student teaching. Students are assessed in each course slightly differently, but for the most part, the same assessment tools are used. Students are expected to pass safety tests on four pieces of equipment—the Bobcat, lawn mower, weed eater, and hedger. Each student is graded on five areas critical to the use of that particular equipment: for example, for the Bobcat, the student is assessed a score of starting, entering and exiting, bucket and arms, belt and bar, and maneuvering. In addition, students must pass a written examination prior to using the equipment. An example of the questions asked is “Once sitting on the Bobcat, the first thing you should do is…?” Students will not be able to operate the equipment unless they receive a 100 percent score on both the written and application tests. Once students pass the test, they are given a Bobcat certification, indicating that they participated in the “Operator Training Course for the Bobcat Skid Steer Loader.” Most students eventually achieve their certification.
Other assessment tools used in the courses include regular tests and a daily grade. The daily
grade is 127 points toward each student’s semester grade and includes student preparedness each day, student initiative, cleaning up, and doing the jobs assigned. Another form of assessment used in the business horticulture class is the completion of a Site Analysis/Design a Landscape project. Students draw the landscape of their current house and then redesign that landscape with certain criteria. The students are graded on the elements of design, lines, key, number of plants, and details. This project represents 100 points toward their overall grade.
D-14
Other Outcomes
The most notable accomplishment of the horticulture program at DMTC is that many students were exposed to various aspects of horticulture and agriculture and the career opportunities available to them in these fields. These students also have a better understanding of the landscaping industry, and through their hands-on experience have an opportunity to acquire new technical skills that may help prepare them for the workforce or postsecondary education. Since the inception of the program, roughly 104 students have taken one of the four horticulture courses. In addition, course enrollment figures for this next year are much higher than last year. Staff at Daniel Morgan attribute this to the fact that horticulture was just being re-offered during the 2000-2001 school year, and that the course in wildlife and forestry management that will be offered next year is attracting students. Either way, if students continue to sign up for these courses, Daniel Morgan will continue to offer them.
Another indication of the school’s success is the increase in the number of students accepted
in the National Vocational Honors Society (NVHS). In order to be accepted as a member of the NVHS, a student must have a 3.0 overall GPA, take at least one course in Vocational/Technical education, and have a teacher’s recommendation.
Several years ago, only a few DMTC students were accepted into the National
Vocational/Technical Honor Society. That number rose to 60 last year, and for the 2000-2001 school year, 140 students from Daniel Morgan Technology Center have been accepted in the NVHS. The director and other Daniel Morgan staff attribute this increase to good recruiting, and the fact that more desirable courses (i.e., Cisco, A+ Certification, and culinary arts) are being offered at Daniel Morgan. An additional reason mentioned by school staff is that a new state exit exam is affecting the type of students attending the vocational schools.5 If students do not pass the pre-exit exam, they have to use one of their electives to take a test preparation course. Consequently, the more academically prepared students have more opportunities to attend courses at Daniel Morgan than students who cannot pass the pre-exit examination. Conversely, the students who are experiencing a more difficult time with the traditional school subjects, which mirror the exit examination, are being forced to stay at the regular high school to prepare for the exit exam, rather than taking vocational courses. As a result, DMTC attracts more students with higher GPAs.
5 All students in South Carolina are expected to pass an exit exam prior to graduating from high school. Students begin practice testing in the 10th
grade and work toward attainment of a satisfactory grade up until the 12th grade.

D-15
Relationship of Activities to Outcomes
Although the Daniel Morgan Technology Center collected various forms of data, it was difficult to relate the purchase of equipment directly to outcome data (i.e., placement rates), as indicated by the assistant director. He felt there needed to be a more tangible approach to measuring outcomes because “there is not a linear relationship” between the equipment/activities and the outcomes. Some of his suggestions as to more appropriate measures concerned:
How many students use the equipment;
What students are learning about the equipment/what types of things are being taught;
How the school is utilizing the equipment within the school and in the community (i.e., Arbor day activities); and
Indirect benefit of saving district money (i.e., district landscaping project).
Although Daniel Morgan considers these measures when evaluating the impact of a program/project, they are not the measures that are reported to funding agencies and state government.
D. Lessons Learned by the Project and Recommendations for Other Communities
Understand the needs of business and the overall community. At the inception of the program, a great deal of time was taken to get the opinions of other school personnel, the business community, and other important stakeholders. The director and assistant director at Daniel Morgan commented that input is critical to improving the creation and implementation of a new program. Therefore, before submitting the grant, Daniel Morgan made sure to gather input from various stakeholders.
Thorough planning and design are critical. The success of the horticulture program and
equipment purchase was due in large part to the level of planning and design that occurred before implementation. The previous instructor and current assistant director conducted research on current needs, and consequently were able to make informed decisions about the types of equipment that would best serve the school and overall community. In addition, planning and design were highly collaborative, inclusive not only of school faculty and administrators, but also of local businesses and community members. The committee, which met regularly during the formative phase of the project, made decisions on project design and recommendations on the type of equipment to purchase.

D-16
Research the equipment purchases and have a willingness to make adjustments. Initially, Daniel Morgan submitted the grant for the purchase of greenhouse material and a lawn mower. After researching various types of landscape-oriented equipment, they altered their request and asked that a majority of the money be used to purchase a Bobcat. The upfront research they put into determining the type of equipment has ultimately benefited the program, the students, and the overall community.
Select an instructor with the right qualifications. Finally, the success of a new program
depends upon having a good teacher. This person should have the requisite knowledge and skill level, as well as a good rapport with students and the community. In addition, the instructor needs to provide relevant and interesting courses for the students.
E. Summary and Conclusions
The horticulture program at the Daniel Morgan Technology Center has proven to be a valuable educational venture not only for the students, but also for the community. Most significantly, the new horticulture program exposed students to an array of horticulture/agriculture-related career fields and provided them will some basic knowledge about horticulture. The horticulture program will still be offered next year, but there will be different courses. For example, a new course in wildlife and forestry management is planned, and it will include developing an animal plot in order to bring more wildlife into the area surrounding the school. The Bobcat will be used to dig up the area so that students can introduce plants (i.e., cloves) that attract deer and other native wildlife. Although it is the instructor’s first year at the school, he mentioned long-term plans for the program. He believes it is important to turn the program from a strictly horticulture program to an agriculture program. It is his desire to “increase the student’s interest in program” and “have the students take pride in being a part of the horticulture/agriculture program.”

D-17
Manufacturing Assistance Center
Project Location Hamarville, PA
Grant Recipient University of Pittsburgh
ARC Number PA 12060
Project Type Workforce Training
Grant Amount $139,426
Matching Funding $34,404
Dates of Site Visit June 5-6, 2001
Site Visitor Laurie Plishker
Project Abstract
The Manufacturing Assistance Center (MAC) of the University of Pittsburgh was established in 1993 in response to several regional surveys and needs assessments identifying the critical needs for manufacturing training and equipment resources. It is directed toward four core competencies: shared manufacturing, training, technical assistance, and research and education. The primary group of trainees are displaced workers and unemployed or underemployed individuals looking to upgrade or acquire precision machining skills. Other trainees are current employees whose employers have sent them to acquire training on a specific piece of equipment. In addition to trainees, the MAC serves—and incubates—small and medium-size businesses in the nine counties in southwestern Pennsylvania. ARC funding contributed to the development of training materials and curricula by supporting MAC staff salaries.
The MAC is providing a vital service to a community heavily tied to manufacturing and dependent on a quality labor force. The training provided at the center is critical to the success of both employees and employers. Additionally, the equipment provided for the use of local businesses virtually built several companies and has become a necessity to others. The center has in place a data collection system that tracks students’ outcomes and enough other information to meet the varying needs of the reporting requirements of agencies funding students’ training.
The future for the MAC looks bright. They are currently developing curricula for a welding training course, since they already have the equipment, space, and an instructor. Also, the co-director would like to expand the research component, perhaps developing new technologies. It seems that only issues of funding and time are holding the MAC back from further expansion in course offerings and equipment.

D-18
Manufacturing Assistance Center A. Background and Context
Objectives and Problems Addressed
The Manufacturing Assistance Center (MAC) of the University of Pittsburgh was
established in 1993 in response to several regional surveys and needs assessments identifying the critical
needs for manufacturing training and equipment resources. After receiving a grant from the Economic
Development Administration of the U.S. Department of Commerce, the MAC became fully operational in
1994. Area manufacturers and small-business owners were receptive to the concept of shared
manufacturing, and the center was equipped with the same technologies, software, tools, and equipment
area manufacturers were already using; yet, it had no users. Manufacturers were again surveyed
informally and MAC staff and consultants learned that the lack of training and the corresponding lack of
workers trained to use the equipment prohibited them from making full use of the center. The MAC
turned to ARC for funding to develop training materials and curricula. Overall, the MAC is directed
toward four core competencies: shared manufacturing, training, technical assistance, and research and
education.
Community and Beneficiaries
Pittsburgh sits in the center of the region known as “Carbide Valley,” home to over 700
machine shops. Throughout the 1970s and 1980s and through half of the 1990s, the region saw a slump in
manufacturing, draining the local economy of workers and income. But as the technology grew in the
late 1990s and the demand for computers and electronics increased, the demand for precision machinists
and tool and die makers surged. Many computer components and other electronic products are generated
from dies, and as manufacturers adopt higher technology to meet precision demands, they have become
increasingly concerned that workers’ training keep pace.
The center serves several different audiences. The primary group of trainees are displaced
workers and unemployed or underemployed individuals looking to upgrade or acquire precision
machining skills. Other trainees are current employees whose employers have sent them to acquire
training on a specific piece of equipment. In addition to trainees, the MAC serves—and incubates—small
and medium-size businesses in the nine counties in southwestern Pennsylvania. Many small or start-up
manufacturers cannot afford the high-end, expensive equipment used for precision machining,
particularly when they may not use it often, so they come to the MAC to “rent” time on the machines.

D-19
Other companies have virtually grown at the MAC. Individuals who have an idea for a product, sketches,
or small prototypes have come to the center to use equipment and seek advice of experts.
Grant Recipient
The MAC is considered a lab of the University of Pittsburgh’s Department of Industrial
Engineering (IE). The university provides fiscal oversight, use of the facility (a former Gulf Oil research
facility), utilities, and other inkind services, such as purchasing, legal representation, etc. The co-
directors of the MAC are IE professors, but overall integration of the MAC as a university facility is
limited. IE students spend limited time at the center each year, largely to gain an understanding of the
manufacturing industry.
Current Status
The MAC is currently operating at capacity. It became self-supporting—mostly through
training fees and partly through equipment rental—about a year ago. A consultant recently completed
writing what he termed “a very conservative business plan” so that the MAC can weather economic
upturns (creating little demand for retraining) and downturns (creating little demand for equipment
usage). The center generally does not advertise its training, equipment, or co-location opportunities
because they are busy enough and do not have additional space to rent.
B. Approach
Equipment
The MAC was started under the concept of “shared manufacturing,” which enables users
from local businesses to rent time on equipment they could not otherwise afford. Qualified users can
develop new products, develop production systems, and conduct limited production runs. Shared
manufacturing lowers the overall implementation costs of the equipment while increasing its productive
use. It allows companies to test equipment before purchasing their own, and more importantly, it allows
them to grow their businesses so that they can purchase their own. Twelve companies are actively using
MAC equipment, with an additional five companies located at the MAC. Some companies use the
equipment as often as daily, while others use it only monthly. Any manufacturer can schedule time on
equipment on a first-come/first-served basis whenever equipment is not in use for training courses. The

D-20
co-located companies are charged a machine access fee and guarantee a certain level of rentals that
increases gradually until it is more cost-effective for them to purchase their own equipment. They can
stay at the MAC indefinitely but generally recognize when they outgrow the space and ought to move on.
The MAC owns outright, or on consignment in some cases, a wide range of technologies,
including:
Wire electric discharge machine (EDM), costing approximately $300,000;
EDM drill “hole popper,” costing approximately $80,000, on consignment from the manufacturer;
EDM die sink, on consignment;
Wire EDM, donated by the manufacturer at a value of $505,000 (considered the most precise available in the world, only 14 were built);
A computer lab with all major computer-aided drafting (CAD) and computer-aided manufacturing (CAM) software packages, networked to the university and the computer numerical controlled machines;
Precision measuring device, donated at a value of $15,000;
Computer numerical controlled (CNC) turning center (lathe), $100,000;
CNC mill, $100,000;
Manual mills;
Manual lathes;
Precision surface grinders;
Drill presses;
Band saws
Welding equipment and booths;
Assorted cutting tools, vices, tool storage;
A painting room; and
One-ton overhead crane.
The MAC has worked a deal with AGIE, the manufacturer of the EDM equipment, to place
their equipment at the MAC, either on consignment or straight donation, at no charge other than upkeep
and maintenance. AGIE benefits by showcasing their products and creating a demand for their equipment
among manufacturers who have used it at the MAC. The plant manager expects that this relationship will
continue and hopes to develop similar agreements with other manufacturers.
The equipment is of varying age, and most items have at least 5 more years left in them.
Some of the manual equipment was built in the 1950s, but these pieces can be rebuilt over and over
indefinitely. While the EDM and CNC equipment represent the state of the art technology, the plant

D-21
manager points out that the manual equipment is closer to the “state of the industry.” That is, these
devices are what most trainees will eventually use. And, in fact, he notes, the manual equipment has
much more utility when creating only one item, once accounting for the time to program the higher
technology equipment. For this reason, he asserts, the manual equipment will never become outdated in
favor of the EDM and CNC equipment.
Training and Technical Assistance
While the MAC started as an equipment provider, most of the time, effort and income result
from the training component. They offer a number of courses and structures:
A 10-week entry level machining course using manual and CNC equipment for
dislocated workers offered in four sessions per year.
A 12-week precision grinding for dislocated workers—there is a big demand for this in the region.
A 8-week CNC machining course under the Manufacturing 2000, a regional initiative run by Duquesne University and Steel Center VoTech and funded by the state, Heinz, and a consortia of hiring companies. This course targets underemployed twenty-somethings who have some college experience and who manufacturers hope can run higher technology equipment. They have found that many of the traditional “vo-tech” students in the area do not have the background to understand or cannot complete the training to run these high tech machines.
A 4-year evening apprenticeship program requiring 8,000 hours per year—2,000 per year on the job and 144 per year in the MAC “classrooms.”
Short course (4-5 days) customized training on CNC, EDM, and CAD and CAM software. Companies send employees for extra training and skills upgrade. These are not offered regularly, but rather on demand once there are enough participants to make it cost-effective to offer.
Project-specific training is offered to users (renters) of equipment as needed by MAC staff and instructors.
Courses typically enroll 7 to 10 students at a time. The 10-week course costs $6,000, the 12-
week course $6,700, and the CNC course $7,500. These fees, considered competitive, are paid by
employers, regional initiatives such as Manufacturing 2000, and YouthWorks, a Federal Workforce
Investment Act program jointly run by the city of Pittsburgh and Allegheny County. Very few students
pay their own tuition. Instructors are journeymen or experienced machinists.
The MAC is currently working on developing a joint program with the New Kensington
campus of Penn State University to deliver training services through a WedNet grant that provides $450
per employee per year to provide training for non-information systems jobs. The partnership is trying to

D-22
develop a Machining Technology Associates degree where Penn State would provide the software,
computer, and sales training, and the MAC would be the lab.
MAC technicians have provided technical assistance to entrepreneurs and small companies.
Technicians are available to visit manufacturers and provide them with engineering advice, prototype
development, and production system design. Technicians and University of Pittsburgh faculty and
graduate student engineers have also conducted various research projects with local manufacturers,
including factory operations, new product development, tungsten carbide machining processes, material
testing, tooling tests for lathes and mills, and workforce testing and evaluation.
Other Services
The MAC’s outreach coordinator responsible for recruitment, admissions, and enrollment
provides any services and assistance locating resources that students need to be successful. She is
available to all students, although some have greater barriers to employment so she works more with
them.
Literacy and Basic Skills. All students take placement tests prior to enrollment. The Test
of Adult Basic Education, required for YouthWorks-funded students, is used more as a diagnostic tool
than for screening (although they have learned that those with lower scores typically underperform in
classes and on the job). The outreach coordinator is working with the local literacy council and
CareerLink, the state’s online employment services system, to help students get up to grade level. In most
cases, underperforming students are not turned away from MAC courses, but rather are given assistance
to raise their scores.
Transportation and Clothing. The outreach coordinator also assists students in finding
services they will need to be successful on the job. She helps students obtain “welfare” bus passes,
drivers permits and licenses, and resources to buy cars. She ensures that students on welfare access
allowable clothing budgets to purchase clothing, such as steel-toed boots, required by some employers.
While the MAC does not fund any of these items, the outreach coordinator puts students in touch with
organizations such as the St. Vincent de Paul Society and the Salvation Army that do.
Career Awareness. As part of MAC courses, students are exposed to the manufacturing
industry through plant tours, guest speakers, and National Tooling and Machine Association (NTMA)
materials that discuss new NTMA skill standards development, overall industry developments, and
benefits offered. The MAC has a library with industry periodicals and videotapes students can check out.

D-23
Students are also provided opportunities to develop good work habits, such as signing in each day,
maintaining cleanliness and hygiene, following hair length and clothing requirements, and developing
good communication skills. Students are expected to show up every day and stay all day. If they have to
miss a day, they must call the front desk. The students generally encourage each other to pay attention to
these items and also provide emotional support to each other as they develop these habits.
Placement Services. MAC staff help students refine their resumes and maintain an email
list of employers that have asked for resumes in the past. Students can use the Harris, the state directory
of manufacturers organized geographically by county, town, and section of town, to target businesses
most convenient to them. The outreach coordinator also places students’ resumes on CareerLink, that
state’s online jobs database, and monitors their CareerLink files for them, since most do not have
computers at home, nor do they have time to be constantly on the job search.
The MAC maintains close contact with area employers and invites them to contact the MAC
with job offerings. (Many do not list on CareerLink because they get too many underqualified workers.)
The NTMA accepts resumes, which it distributes to local member companies. MAC staff spend
considerable amounts of time on the phone with employers both to see how the MAC can better meet
their needs and to find placements for students. Staff members agree that they have excellent rapport with
almost all companies in the area since they provide highly qualified workers. They estimate that by hiring
a MAC graduate, the company can save from $5,000 to $10,000 in advertising, recruiting, interviewing,
testing, and training.
C. Evaluation and Outcomes
In its first 5 years of operation, the MAC completed over 550 technical assistance and shared
manufacturing projects and 4,500 person-days of training. During this period they billed over $1.5
million for facility services.
Student Outcomes Database
Each of the funding agencies has different reporting requirements, such as attendance
reports, monthly evaluation forms completed by instructors, and start and termination (due to completion,
drop out, or employment) date verification forms, that are burdensome to track. To meet each of these
demands, the MAC maintains a database with details on each student. It includes:

D-24
Social Security number, if available, Name, Current telephone and address, Email address, if available, Program attended/attending, Dates of enrollment, Funding agency and name of sponsor at agency, Pretest score, Posttest score, Overall course grade, Placement (whether hired in 6 months), First company name and address, Date of hire, Benefits (wages, retirement/pension, 3-, 6-, and 12-month wage increases), and Second company and same associated data.
The database is updated 1 year after program completion, as required by YouthWorks.
Required CareerLink reporting will also force them to collect some followup data, but the MAC already
collects more extensive data.1 They attribute their ability to collect such detailed data to the small number
of students they work with; they estimate they are actively tracking approximately four students at any
given time. This is mostly done by telephone contact with former students and their employers. Follow-
up data are difficult to collect, but staff are persistent. However, it becomes considerably more difficult
after 1 year, unless students contact the MAC seeking placement assistance for a new job.
Overall, the MAC has been very successful with these students. Receiving training through
the MAC carries with it some weight in the community; over the years employers have seen that MAC
students do well on their tests and perform well on the job. The 10-week program has had three dropouts
in 3 years and has a near 100 percent placement rate. The CNC program does not track dropouts because
there are none, and it has a 100 percent placement rate. The precision grinding program has a slightly
lower placement rate. According to the staff, the few students that have not obtained employment were
less motivated than most and did not seem to want to work. Most students are hired for entry-level jobs at
fairly low pay rates ($8 to $10/hour), but can make rapid increases to $40,000 per year and then can
become journeymen earning $50,000 to $60,000 per year.
Business Development and Job Creation
The MAC has incubated six businesses, five of which are currently co-located within the
MAC. Each began at the MAC when an individual had an idea, but little startup funds to purchase
1 Only students who are funded by outside agencies are tracked; students in the apprenticeship program and custom training students are not tracked. MAC staff attempted to track all students but found that it did not make sense to expend the effort when no one was asking for the data.

D-25
necessary equipment. One company recently moved out of the MAC after outgrowing its allotted space.
The founders went on to buy their own building and acquire the necessary equipment. Another company,
Universal Technologies began over 4 years ago with four employees bringing in $700,000 per year
developing rotary freezer drawer units and robots that maintain test tubes in the drawers for
pharmaceutical companies; now they have 30 employees and bring in $8 to $10 million per year. C&C
Tooling is a full service tool and die shop that rebuilds and resells surface grinders; it began 4 years ago
with two employees and now has 12 and employs all technologies including EDM. They have recently
spent $700,000 on equipment and may soon be moving to their own location. Industrial Laser Systems, a
two-person company onsite for a year, develops custom laser applications. A robotics company
developed a robot used in shipbuilding that crawls up the hull of a ship welding as it goes. The company
recently sold its first prototype.
In addition to incubating businesses, the MAC has allowed other companies in the area that
have used MAC equipment and technical assistance resources to expand. Through retraining and
business expansion, the co-director believes the MAC has led to the creation of over 200 jobs in the
region.
Relationship of Activities to Outcomes
The plant manager and co-director clearly see the equipment and training leading to
improved job prospects or status, business development, and economic vitality. However, the co-director
believes the measurement of long-term outcomes is best done through qualitative methods, rather than
quantitative methods. The spawning of several businesses and their resulting financial information, he
says, cannot adequately describe the impact of the MAC. Nor can quantitative methods portray the
multiple industry-university collaboration that has occurred to promote manufacturing and economic
development in the region. To this end, the MAC is creating a portfolio of case studies of success stories
that can better describe the impact of the center.
D. Lessons Learned
MAC staff believe a similar center could be a critical member of any regional manufacturing
community. This section provides lessons learned and recommendations for other communities
considering establishing a similar center.

D-26
View and market the center as a regional asset. The MAC’s plant manager regrets that
they have not been able to market the center better. He recognizes that the center could provide services
to hundreds of businesses not currently being served. More users would draw in more income and,
consequently, more updated equipment, with the goal of improving the local economy. The center could
be making a bigger impact in the community if it was seen as a regional asset, rather than just a university
“lab.”
Maintain close ties to area industry. Local businesses provide both jobs for trainees and
users of the equipment and are critical to the MAC’s success. After a time of less-close ties to industry,
several companies came to resent the MAC and the access it provides to CNC machines for small
business, citing unfair advantages for companies that do not have to buy their own equipment. In fact, the
MAC has a noncompete policy in that it does not allow businesses using the equipment to do regular
production runs. The MAC is not a manufacturer and does not want to be. This is a critical policy for the
MAC to maintain in order to retain and develop good relationships with area manufacturers.
Personnel are key. The technical engineers employed by the center to provide training to
equipment users and to assist in product designs are recognized experts in EDM and CNC. Companies
have called to request additional technical assistance onsite. Such experts help maintain the MAC’s
reputation in the region.
Maintaining close ties to the university can be tricky. The MAC is both too far removed
from the university and too closely tied. The center is treated as a lab of the IE department but is run as a
business. The plant manager noted that he does not get enough financial information from the university-
based accountants and would prefer to have an accountant onsite. However, the university and MAC are
too closely tied when competing for funding; the university always gets priority with funders, at times to
the detriment of the MAC. The plant manager believes that the relationship actually hinders the MAC
from getting state funding. He notes that the university should be more interested in helping the MAC
obtain funding because the MAC provides good community relations for the university.
Lessening fragmentation among agencies supporting trainees would be helpful. The
plant manager noted that there is little focus among the regional initiatives working with workforce
development and job training. The vocational schools, trade schools, and community colleges have no
cohesive plan for the region’s workforce. Also, there is no regional leadership among industry partners.
With these pieces in place, the plant manager believes, the center could contribute even more to the local
economy.

D-27
E. Summary and Conclusions
The MAC is providing a vital service to a community heavily tied to manufacturing and
dependent on a quality labor force. The training provided at the center is critical to the success of both
employees and employers. Additionally, the equipment provided for the use of local businesses virtually
built several companies and has become a necessity to others. The center has in place a data collection
system that tracks students’ outcomes and enough other information to meet the varying needs of the
reporting requirements of agencies funding students’ training.
The future for the MAC looks bright. They are currently developing curricula for a welding
training course, since they already have the equipment, space, and an instructor. Also, the co-director
would like to expand the research component, such as developing new technologies. It seems the only
thing holding the MAC back from further expansion in course offerings and equipment is funding and
time. The MAC has seen tremendous growth in the last 3 years. But with one-third of its funding coming
from the state, foundations, or donations, and the rest of its funding tied to the economy (positively for the
equipment and negatively for training), the plant manager and co-directors must still work hard spending
time and money to acquire additional funding.

D-28

D-29
Winston County Technical Center
Project Location Double Springs, Alabama
Grant Recipient Winston County Technical Center
ARC Number AL 12269
Project Type Vocational Education
Grant Amount $160,000
Matching Funding $40,000
Dates of Site Visit May 2-3, 2001
Site Visitor Brian Kleiner
Project Abstract
In 1995, due to lack of funds, the Winston County Technical Center (WCTC) in Double Springs, Alabama, found itself unable to keep pace with changes in technology and equipment, and as a result, students were not being adequately prepared for employment in technical fields. Soon thereafter, a grant from the Appalachian Regional Commission provided the funding that, in the words of the school’s principal, “revolutionized the program.” ARC funds were used to purchase the latest equipment in automotive technology, electronics technology, and carpentry that allows for the proper training of students to more adequately prepare them for employment in technical fields. The ARC grant made possible the training and employment of many young people in fields tailored to the needs of Winston County’s local businesses and industries. In addition, the success of many of its students, as a result of the ARC grant, has been and continues to be documented, albeit indirectly, by a careful system of data collection. Students at WCTC are completing their programs and finding employment in-field or in related fields at higher rates than they had prior to the program-supported training, while many are continuing their education at colleges or technical institutions.
D-30
Winston County Technical Center
A. Background and Context
Objectives and Problems Addressed
Although the Winston County Technical Center (WCTC) is a part of the Winston County school district, at the time of the ARC grant the State of Alabama made no provisions for funding the improvement or updating of equipment. In addition, Winston County’s tax base did not provide for the funding of improvements to its six components (automotive technology, electronics technology, carpentry, marketing education, business education, and cosmetology). As a result, WCTC had been operating with original equipment in place when the school was built in 1972 and was sorely in need of up-to-date equipment for training its students. These deficiencies were particularly evident in the case of the automotive technology component, which needed to be “completely overhauled” given recent rapid and drastic changes in the field. It was anticipated that an upgrade of equipment in automotive technology, electronics technology, and carpentry would benefit students by providing them with the relevant and realistic training to prepare them for local employment on equipment actually used in the field.
Community and Beneficiaries
Winston County is set on the southernmost ridge of Appalachia in northwest Alabama and shares many of the characteristics of other Appalachian communities, such as geographical isolation and a people staunchly loyal to the land in which they were raised. Like other Appalachian communities, Winston County also suffers from high unemployment, which at the time of the site visit stood at near 15 percent (about 10 percent above the national average). Thus, while much of its population may be traced back to the families that settled here generations ago, each new generation must face the practical question of how to remain despite a shortage of opportunities for employment.
Of those young people who opt not to attend some form of postsecondary education after
high school (about 75 percent), some are forced to leave Winston County in search of work. Some leave for neighboring counties, and others leave Alabama altogether. The majority of those who remain must compete for relatively few positions within the few industries that are located here. While small numbers of young people find work in retail, forestry, poultry, or dairy occupations, the main source of employment in the county has for many years been the manufactured housing/mobile home industry.

D-31
Moreover, the county’s industries have had to keep up with changes in technology. In order to stay competitive, many of Winston County’s industries have had to modernize and upgrade their equipment, technology, and modes of operation. This has required an existing labor force that is retrained, as well as an incoming highly skilled labor force that requires a minimum of training. It is for this reason that the county’s industries have looked toward local high schools as valuable labor pools, and have been quick to emphasize the importance of technical and vocational training.
Grant Recipient
A significant source of new labor for local industries and businesses in Winston County is the Winston County Technical Center, located in Double Springs, Alabama, the county seat. The WCTC was opened in 1973 and currently serves about a third of the county’s 10th through 12th graders each year. It also prepares many students for jobs within local industries and businesses. In order for WCTC to continue to produce workers prepared for technologically advanced fields within local industries, it needs to continually upgrade the equipment on which its students are trained.
In 1995, due to lack of funds, WCTC found itself unable to keep pace with changes in
technology and equipment, and as a result students were not being adequately prepared for employment in technical fields. Soon thereafter, a grant from the Appalachian Regional Commission provided the funding that, in the words of the school’s principal, “revolutionized the program.” ARC funds were used to purchase the latest equipment in automotive technology, electronics/electricity, and carpentry that allows for the proper training of students to more adequately prepare them for employment in technical fields.
For the reasons mentioned above, WCTC plays a critical role in the life of Winston County.
Of the roughly 1,100 high school students in the four high schools comprising the Winston County school district, about 350 10th through 12th graders attend WCTC for 2 hours each day. All WCTC students, except those from adjacent Winston County High School, commute from their respective high schools for up to 40 minutes per day. The student population in Winston County is nearly 100 percent white.
While enrollment at WCTC dropped in the mid-1990s (perhaps, in part, as a result of
increases in the number of required core course credits), it has increased recently due to its allowing students from the three off-campus high schools to attend required standard and job skills math courses at WCTC (although some student continue to take these courses at their home campuses). In addition, students may earn “embedded credits” in math and science for their participation in elective automotive technology, electronics technology, and carpentry courses at WCTC. Embedded credits help students
D-32
fulfill core math and science credit requirements by participation in vocational courses with substantial math and/or science components.
WCTC maintains important ties with local business and industry in several ways. First,
representatives of local businesses and industries participate in technical committees that inform the school about their employment needs on a regular basis. The school also has a general advisory committee composed of one representative from each of the program technical committees. Second, in 1998, local businesses and industries were given a needs assessment survey to determine what sorts of qualities and skills they are looking for in their new employees. The information provided through these channels has helped WCTC to tailor its curriculum to the needs of local business and industry.
Current Status
WCTC currently offers courses within six components: automotive technology, electronics technology, carpentry, marketing education, business education, and cosmetology. In 2001-2002, the carpentry component will be dissolved and replaced with an information technology component (carpentry will be taught at the four regular high schools within their agriculture departments). Courses are designed to be two-period sessions, but those students who also take math at WCTC may attend technical courses for an hour each day. Students participate in sequences of courses within components, and those who finish such sequences are called “completers.”
B. Approach
Equipment
ARC funds were used to purchase and upgrade equipment for the automotive technology, electronics technology, and carpentry components. For these components, hands-on training on equipment is an integral part of course curricula.
Automotive technology. The largest portion of the ARC grant went toward the purchase of
equipment for automotive technology, the component most in need of an equipment upgrade at the time. New equipment for this component included:
alignment system (complete with lift), brake lathe system and brake washer, tire balancer system, tire changer system,

D-33
air conditioning recycling center, hand tools and diagnostic equipment, Mitchell-on-Demand (software), five computers/printers/desks, classroom supplies/books/software, four gas analyzers, shop press, engine stands, transmission jacks, engine hoist, anti-freeze recycler, two post lifts, and valve guide equipment.
The automotive technology instructor, who was responsible for selecting the new equipment
in 1995, noted that his selection was almost entirely dictated by NATEF (National Automotive Technician Education Foundation) requirements. At the time of the ARC grant, NATEF certification was not required for vocational schools offering automotive technology in Alabama. However, realizing the benefits that would accrue to WCTC (such as free donated cars from Chrysler Corporation), the instructor decided to pursue NATEF certification. Among the conditions for NATEF certification is the possession of many of the items listed above; therefore, the instructor reported, ARC funding made possible this certification. Since that time, NATEF certification has become required for all schools in Alabama that offer automotive technology. The automotive technology component received the 1999 award for excellence in secondary vocational automotive education, presented by the Alliance of Automobile Manufacturers, the Association for Career and Technical Education, and the National Institute for Automotive Service Excellence Industry Planning Council, an honor that would not have been possible had it not been for the ARC-funded equipment.
The automotive technology instructor also noted that the equipment purchased was
appropriate for the component’s curriculum. Since 1995, students have been trained on equipment actually used in the field, although the instructor mentioned that many local auto shops are not as well endowed as WCTC’s! In fact, many community members bring their cars to WCTC’s shop for repair work or service that cannot be done elsewhere in Double Springs (such as a front-end alignment). Further, obsolescence of equipment has not been a problem—the only changes necessary since 1995 have been upgrades of computer software. However, the instructor did note that the automotive industry has in recent years been moving towards an emphasis on electronics, a move which will in time require new upgrades of shop equipment. It was not clear to the instructor how or whether new equipment could be purchased.
Electronics technology. Equipment purchased with ARC funds for the electronics
technology component at WCTC included technical training aids (such as oscilloscopes, and related
D-34
software), hand tools, computers, and electronic work stations. The electronics instructor reported that before 1995, his students would graduate without being adequately prepared for employment in local plants, because at the time there were only two oscilloscopes available to up to 25 students in each course for training. This meant that students lacked hands-on experience in the use of fundamental equipment in the field. ARC funds allowed for the purchase of 25 oscilloscopes so that each student could have that experience.
The electronics instructor said that much of the equipment purchased with ARC funds will
not become obsolete for many years, because it is so fundamental to basic training in the field. However, some oscilloscopes were updated 2 years ago (with state funds) so that the electronics component could become business/industry certified. In addition, some equipment, such as tools, will need to be replaced because of ordinary wear and tear. The instructor expressed concern that new funds would not be available for future equipment upgrades.
Carpentry. Equipment purchased with ARC funds for the carpentry component1 included: 10” table saw, radial arm saw, 18” planer/knife grinding kit/extra knives, 6” jointer, 14” band saw, scroll saw, two-station work benches/vices, air compressor and installation, dust collection system and installation, and three microcomputers with multimedia kit
C. Evaluation and Outcomes
The WCTC’s system of data collection is driven by a combination of state- and district-level reporting requirements, as well as by the internal interest of WCTC administrators and staff members. Altogether, the data collected by WCTC provide a great deal of information regarding, among other things, student progress and achievement. These data are used by WCTC to shed light on the school’s strengths and weaknesses and to craft informed short- and long-term goals. Moreover, the main purpose of the data collection has never been to measure the effects of the ARC grant, and ARC negotiations played little if any role determining what data would be collected by WCTC. However, some of the data do provide indirect evidence for the continuing influence of the original infusion of ARC funds.
1 At the time of the site visit, the carpentry instructor was not on campus and so no interview was conducted.

D-35
Student Performance Data
State measures and Perkins standards. Student performance and achievement are reflected in state measures, including results of the Alabama High School Graduation Exam, taken each year by all juniors and seniors. In addition, the state of Alabama requires that its secondary schools conduct annual placement and followup surveys of all graduated students. Students are contacted (by mail) roughly 6 months after graduation and are asked about their current employment/educational status.
The Carl D. Perkins Vocational and Applied Technical Education Act of 1998 (Perkins III)
requires that vocational schools provide data on various indicators of student performance. Perkins III calls for data on the following four core indicators:
Student attainment of challenging state-established academic, vocational, and skill
proficiencies;
Student attainment of a secondary school diploma or equivalent, a proficiency credential in conjunction with a secondary school diploma, or a postsecondary degree or credential;
Placement in, retention in, and completion of postsecondary education or advanced training, placement in military service, or placement or retention in employment; and
Student participation in and completion of vocational and technical education programs that lead to nontraditional training and employment.
Thus, WCTC must provide the state of Alabama (and the U.S. Department of Education’s
Office of Vocational and Adult Education) with data on student exam results, graduation and retention rates, postgraduation placement, and program completion rates.
Local measures. In addition to student assessment within courses, the performance and
achievement of students is documented by a variety of measures at the local level at WCTC. First, the placement and followup survey is augmented by each WCTC component so that it includes information that goes beyond state requirements, such as the determination of whether graduated completers’ current employment is in-field, in a related field, in an unrelated field, or in the military. Graduated students are also asked to note the kinds of equipment they use in their current job (if employed) as well as their opinions, in retrospect, of the strengths and weakness of their education at WCTC.
Other local measures (used for internal purposes) include the graduation rate, as well as the
completion rate (defined as the completion of a minimum of three or more credits in a planned sequence of courses). In terms of analysis, data on graduation and completion rates may be broken down by component and/or viewed over time, and may be compared to state standards. Students who do not

D-36
complete planned sequences of courses are surveyed each year to determine whether they withdrew from their component program because of transfer to another school or employment in a related or unrelated field. Records are also kept on annual enrollment in the six components, as well as on competitors in state events and membership in vocational student organizations.
Other measures. In 1997, WCTC administered an opinion survey, designed by the
marketing education department, of students, parents, faculty, and the business community. The survey addressed views on the strengths and weaknesses of the school, with emphasis on the learning environment, quality of education, and the needs of the community. WCTC’s principal noted that the school hopes to conduct this survey once every 5 years. In 1998, local businesses and industries completed an employer needs assessment, which addressed the perceived importance of a wide variety of entry-level employee characteristics and skills. Finally, at the end of each semester, students are asked to submit a written evaluation of their courses and instructors.
Problems with data collection/evaluation. WCTC’s principal noted that the state of
Alabama’s department of education provides for a relatively efficient and organized system of data collection with respect to state collection requirements. One obstacle mentioned was the difficulty providing student data to the state before rather tight fall deadlines. She hopes that in the future, software packages will be developed that will make this process even more efficient so that deadlines can be met with less difficulty. As for problems with data collection, none were noted with respect to reliability. However, the principal (and one instructor) did state that the placement and followup survey does not always reach graduated students and many that do receive the survey do not respond, although efforts are made to contact graduates by telephone calls to their parents’ homes (response rates are not available).
Relationship of Activities to Outcomes
The data collected by WCTC for its own purposes and for those of the state provide a variety of indicators upon which to evaluate individual student progress and achievement. Some of the data do indirectly point to a relationship between the equipment purchased with ARC funds and student outcomes. For example, results of the placement and followup survey indicate that since 1996, 63 percent of automotive technology completers and 64 percent of carpentry completers have found employment in-field or in a related field within the first year of graduating from WCTC. In addition, some of the remaining completers have gone on to postsecondary education in technical institutions. Since 1996, only 20 percent of electronics technology completers have found employment in-field or in a related field after graduation. However, many have gone on to 4- or 2-year colleges or technical institutions (34 percent).

D-37
Although no baseline data are available for the years before the 1996 ARC grant for comparison, these placement results do indicate, in comparison to reports by instructors interviewed during the site visit, that student completers fared far better finding employment in-field or a related field after 1996 compared to before that time. For instance, the automotive technology instructor stated that before 1996 and the purchase of new equipment with ARC funds, none of his student completers found employment in-field or in related fields. He attributes this dramatic reversal to the fact that his students attained book knowledge in his courses before 1996, but simply were not given adequate hands-on training on equipment used in the field. After 1996, local shops, dealerships, and industry began calling and making visits in search of potential employees that would require little training. The automotive technology instructor noted proudly: “My students can walk in anywhere and get a job.”
The same was the case for electronics technology completers, according to the instructor for
this component, who noted that students with hands-on training on up-to-date equipment are highly sought after by local industry: “They’ll hire every kid I have,” and “Every plant around here has our kids in it.”
Instructors also asserted that many students not only find employment, but also are able to
attend colleges or technical institutions because of the equipment purchased with ARC funds. Several of WCTC’s automotive technology and electronics technology students in recent years have received college scholarships as a result of outstanding performance in state competitions. Instructors noted that success in such competitions would have been impossible were it not for the hands-on training and practice with equipment made available by the ARC grant. In addition, participation in competitions, according to instructors, helps to make students aware that they are just as capable as students from more prestigious schools to perform well using the most sophisticated equipment available. That provides students with the added confidence needed to pursue some form of postsecondary education.
Other anecdotal evidence supports the link between ARC-funded equipment and student
success. The automotive technology instructor commented that students who begin attending his courses at WCTC are very impressed by the shop’s equipment. The value that they attribute to this equipment may play a role in student retention, which the instructor noted is far higher than during the years prior to the ARC grant (the graduation rate for automotive technology completers ranged from 91 percent in 1996-97 to 100 percent in 1999-2000).
D. Lessons Learned by the Project and Recommendations for Other Communities
Maintain close ties to area business and industry. Part of WCTC’s success is due to maintaining ties with local business and industry. By inviting the views of these prospective employers

D-38
with its advisory committees and employer needs assessments, WCTC is able to tailor its components to the needs of the business community and better prepare students for employment in the local workforce.
Up-to-date equipment is vital. The symbiotic relationship between vocational technical
schools and local business and industry thrives on the use of up-to-date equipment for training students. This allows students to graduate in fields for which they will require less additional training when they become employed.
Select equipment for realistic and relevant training. The selection of equipment should
be driven by the sorts of equipment that are actually used in the field by prospective employers. Realistic and relevant preparation for the workforce enhances the students’ chances of being hired. It also attracts employers who then view technical programs as valuable labor pools. In the case of WCTC’s automotive technology component, the selection of equipment was largely dictated by industry certification standards and requirements. However, such standards and requirements are geared toward preparing students for the workforce with realistic and relevant training.
Maintain pre- and post-funding data. In order to be able to evaluate the effectiveness of
similar projects, data should be collected and maintained before and after funding and should include key indicators of student progress and achievement, such as retention and graduation rates, post-graduation placement, as well as indicators of student, staff, and community opinions about program features.
E. Summary and Conclusions
It is evident that ARC funding had, in the words of WCTC’s principal, “far-reaching effects” on the school, its students, staff, and the community of Winston County. It is hard to overestimate the importance of up-to-date equipment at vocational schools, since hands-on training on equipment used in the field makes students more employable and more highly sought after by business and industry. The infusion of new equipment at WCTC purchased with ARC funds has led since 1996 to greater retention, higher rates of in-field or related field employment after graduation, and higher attendance rates for graduated students at postsecondary institutions. The equipment made possible the achievement of the project’s goals, since WCTC is now producing students capable of finding local employment for which they are well prepared, and others are continuing their education in related fields at colleges and technical institutions.

D-39
Chautauqua County Wood Skills Training Project
Project Location Jamestown, New York
Grant Recipient Private Industry Council of Chautauqua, Inc.
ARC Number NY 13738
Project Type Workforce Training
Grant Amount $94,860
Matching Funding $100,741
Dates of Site Visit May 23-24, 2001
Site Visitor Gary Silverstein
Project Abstract
The Private Industry Council (PIC) of Chautauqua, Inc. is working with the Woods Alliance Group to develop a series of classes for upgrading the skills of local workers who seek employment in the wood products industry. The original purpose of the program was to develop two training components—a pre-hire program that would result in the creation of at least 50 new jobs in the local wood products industry, and a skills upgrade program that would enhance the technical proficiency of at least 66 currently employed workers (many of whom had been recently hired through temporary placement agencies). ARC funding has been used to help Woods Alliance members determine their collective training needs, develop training materials, identify prospective new hires, and conduct training.
A primary purpose of the project was to attract additional workers to the wood products industry. (At the time the application was submitted to ARC, several furniture manufacturers were experiencing labor shortages, and at least one employer had been forced to turn away business because of a lack of available workers.) However, soon after the PIC received the ARC grant, a downturn in the national economy greatly diminished employers’ need to hire new workers. In fact, when the pre-hire training session was conducted (in October 2000), several alliance members were in the process of reducing their workforce. By May 2001, none of the region’s furniture manufacturers were looking to expand their workforce—and many of their recent hires who required remedial training in basic and technical skills had been laid off. As such, the direction of the project had been modified to reflect the changing needs of alliance members. At the time of the site visit, the pre-hire component had been temporarily discontinued, and the PIC was primarily working with two companies that were interested in furthering the expertise of their long-term workforce. Although the other seven furniture manufacturers continued to express their support for the alliance, they were no longer in a position to take advantage of the training that was being offered through the ARC grant.
Nonetheless, the impact of the ARC grant on alliance members was clearly evident throughout the site visit. Without the project, the participating companies would not have been in a position to offer pre-hire or incumbent training. While the downturn in the national economy prevented the alliance from taking full advantage of the pre-hire component, the necessary materials are now in place to offer this training again when the region’s furniture manufacturers find themselves in need of new labor. In addition, while only two companies have been able to take advantage of the incumbent training, it is anticipated that the development of the Manufacturing Technology Center will eventually enable other local furniture manufacturers to offer similar opportunities to their employees.

D-40
Chautauqua County Wood Skills Training Project
A. Background and Context
Objectives and Problems Addressed
In May 2000, the Private Industry Council (PIC) of Chautauqua, Inc.—in conjunction with the Woods Alliance Group (a consortium of nine furniture companies in Jamestown, New York)—requested $94,860 in funding from the Appalachian Regional Commission (ARC) to support the development of a woods skills training program.1 At the time the application was submitted, the robust national economy was contributing to an increased demand for new furniture. Additionally, the region’s low unemployment rate was making it increasingly difficult for local employers to locate and hire skilled workers. As a result, some companies were forced to rely on unskilled laborers obtained through temporary placement agencies, and at least one consortium member was forced to turn away business due to a lack of workers.
The original purpose of the program was to develop two training components—a pre-hire
program that would result in the creation of at least 50 new jobs in the local wood products industry, and a skills upgrade program that would enhance the technical proficiency of at least 66 currently employed workers (many of whom had been recently hired through temporary placement agencies). ARC funding was used to help Woods Alliance members determine their collective training needs, develop training materials, identify prospective new hires, and conduct training.
Community and Beneficiaries
The local community. Jamestown (population 35,000) is located on the southern tip of Chautauqua Lake. Between 1990 and 2000, the population of Chautauqua County declined by 1.5 percent (from 141,895 to 139,750). Once the nation’s second largest furniture manufacturing area, the region now supports only nine firms that specialize in wood products.2 This decline in the wood products industry mirrors the county’s overall loss of manufacturing businesses over the past decade. In addition, many of the region’s recent high school graduates, especially those with technology skills, have sought
1 Local contributions, including $70,741 from the PIC and $30,000 from other sources, brought the total cost of the project to $195,601. 2 Jamestown is also home to several other industries, including Cummings Engine Company and Serta Mattresses.

D-41
employment elsewhere. This, in turn, has made it increasingly difficult for local employers to fill openings at their businesses. (When the proposal was submitted to ARC, the region’s unemployment rate (4.7 percent) was slightly below the state average of 5.0 percent.) According to the PIC:
Chautauqua County and the region are experiencing a significant deficiency in skilled labor. While there are still a number of unemployed or underemployed workers individuals in the area, they do not possess the skills required to perform the jobs that are available and that pay a living wage. As a result, businesses have unfilled positions within their companies negatively impacting production and their ability to compete in global markets. In addition, there are numerous unemployed individuals and underemployed workers who, but for their skill deficiencies, could perform within and fill currently unfilled positions. The region is at a point where further growth will depend on our ability to provide a trained workforce not only for our existing companies but also for new businesses that we seek to recruit. The Woods Alliance Group. The immediate beneficiaries of the project are the nine
companies that compose the Woods Alliance (as opposed to the pre-hires and employees who actually received training). While the trainees are clearly expected to benefit from the project (e.g., through increased skills and wages), the primary purpose of the ARC grant is to help alliance members obtain and retain qualified workers. This, in turn, will improve their economic viability through increased productivity and enhanced capacity to remain competitive in today’s technology-oriented economy.
The alliance includes a wide range of companies—including two of the nation’s largest
furniture manufacturers (Bush Industries and Ethan Allen), the region’s second largest employer (Bush Industries), and three businesses with fewer than 25 employees (see Table 1). While they typically serve different clients, alliance members frequently compete for a share of the region’s shrinking workforce.
Representatives from eight Jamestown furniture companies first approached the PIC in 1997
to discuss a program that would prepare area residents for a career in the wood products industry. The underlying objective was to increase the pool of skilled workers and minimize the need for local furniture manufacturers to steal employees from their competitors. During this initial meeting, employers identified several factors that had contributed to their collective need for enhanced training—e.g., lack of a strong work ethic among new hires, the increased skills required to operate computerized machine tools, the inability of new employees to think beyond their entry level duties or take advantage of available “career ladders,” a pervasive lack of basic skills, a lack of proper concern for safety precautions, and a general impression among the region’s workforce that there are no opportunities for advancement in the region’s wood products industry.
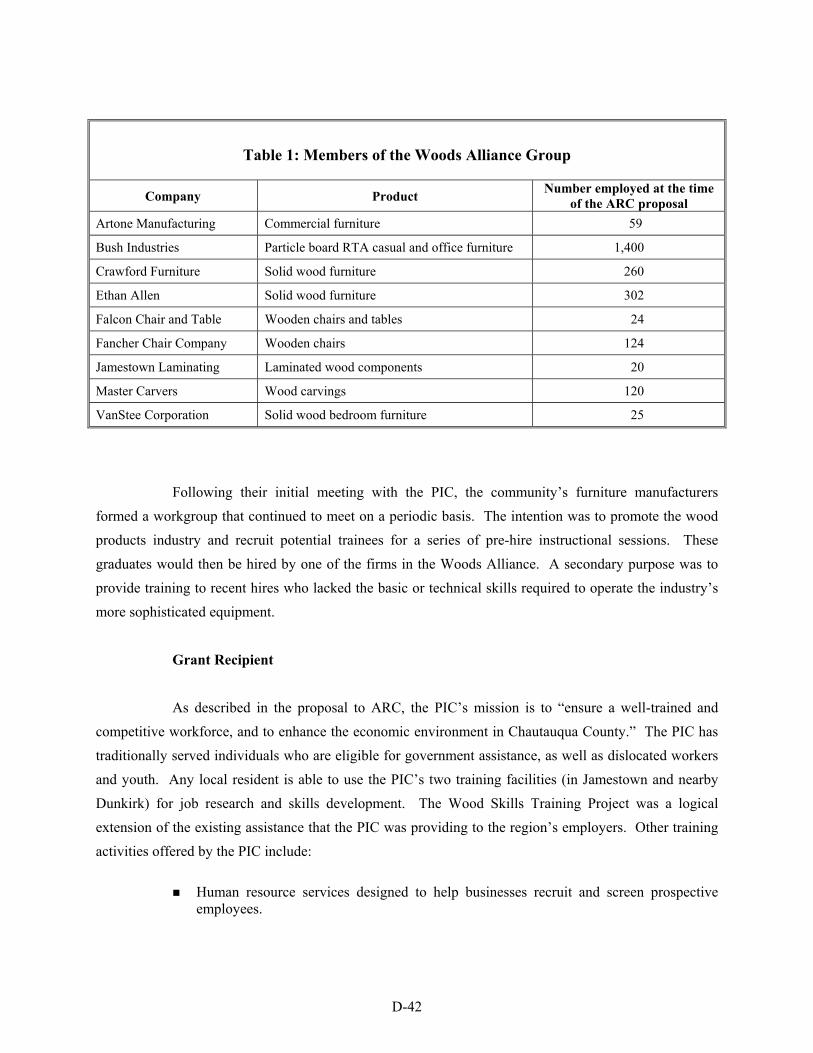
D-42
Table 1: Members of the Woods Alliance Group
Company Product Number employed at the time of the ARC proposal
Artone Manufacturing Commercial furniture 59
Bush Industries Particle board RTA casual and office furniture 1,400
Crawford Furniture Solid wood furniture 260
Ethan Allen Solid wood furniture 302
Falcon Chair and Table Wooden chairs and tables 24
Fancher Chair Company Wooden chairs 124
Jamestown Laminating Laminated wood components 20
Master Carvers Wood carvings 120
VanStee Corporation Solid wood bedroom furniture 25
Following their initial meeting with the PIC, the community’s furniture manufacturers
formed a workgroup that continued to meet on a periodic basis. The intention was to promote the wood products industry and recruit potential trainees for a series of pre-hire instructional sessions. These graduates would then be hired by one of the firms in the Woods Alliance. A secondary purpose was to provide training to recent hires who lacked the basic or technical skills required to operate the industry’s more sophisticated equipment.
Grant Recipient
As described in the proposal to ARC, the PIC’s mission is to “ensure a well-trained and competitive workforce, and to enhance the economic environment in Chautauqua County.” The PIC has traditionally served individuals who are eligible for government assistance, as well as dislocated workers and youth. Any local resident is able to use the PIC’s two training facilities (in Jamestown and nearby Dunkirk) for job research and skills development. The Wood Skills Training Project was a logical extension of the existing assistance that the PIC was providing to the region’s employers. Other training activities offered by the PIC include:
Human resource services designed to help businesses recruit and screen prospective
employees.

D-43
Work Keys, a system created by American College Testing (ACT) to help businesses (1) identify the skills their employees need to successfully complete their jobs, (2) identify individuals who possess those skills, and (3) develop customized training programs.
A teaching factory that uses state-of-the-art equipment to provide entry-level and hands-on training to residents and industries in three New York and seven Pennsylvania counties.
An employee-training program designed to enhance workers’ skills in a variety of areas—e.g., time management, team building, human relations and communications, math for the marketplace, quality technology, and basic keyboarding.
A program to help employers develop procedures and training programs for quality control systems and other standards requirements.
At the time of the site visit, the PIC was developing a Manufacturing Technology Institute
that will enhance its capacity to provide hands-on training and technical assistance. Like the PIC’s existing teaching factory, the center will provide basic and hands-on machine operation skills to pre-hires (to meet the anticipated needs of the local employer base), new hires, current employees, high school students (to gain experience in machine operations and learn about related careers), and college students. To assure that center does not become obsolete, most of the equipment will be leased or borrowed—that is, machines will be moved in and out of the facility on an as-needed basis to accommodate the needs of specific businesses. In addition to serving as training facility, local manufacturers will be able to use the center to test new procedures or troubleshoot existing practices. Vendors will also be able to bring in equipment for demonstration and training purposes.
Current Status
As discussed previously, a primary purpose of the project was to attract additional workers to the wood products industry. However, soon after the PIC received the ARC grant, a downturn in the national economy greatly diminished employers’ need to hire new workers. In fact, when the pre-hire training session was conducted (in October 2000), several alliance members were in the process of reducing their workforce.3 By May 2001, none of the region’s furniture manufacturers were looking to expand their workforce, and many of their recent hires that required remedial training in basic and technical skills had been laid off. As such, the direction of the project had been modified to reflect the 3 Several respondents expressed their surprise at the suddenness of the decline in their business. One alliance member indicated that rising energy
costs (e.g., to keep factories heated in the winter, to transport products to customers) had further hindered his company’s ability to endure a cutback in production. His company had been particularly hard hit by the downturn in the national economy. In April 2000, his firm had 41 employees working 52.5 hours per week and was seeking to add 10 additional workers. By May 2001, the company was down to 19 employees working 3 days per week, and there was a possibility that additional layoffs would be occurring in the near future.
D-44
changing needs of alliance members. At the time of the site visit, both the pre-hire and recent hire components had been temporarily discontinued, and the PIC was primarily working with two companies that were interested in furthering the expertise of their long-term workforce. Although the other seven furniture manufacturers continued to express their support for the alliance, they were no longer in a position to take advantage of the training that was being offered through the ARC grant.
Although the Woods Alliance Group had stopped meeting on a regular basis, some members
continue to express an interest in making the alliance a separate nonprofit entity with a full-time director. In addition, PIC staff and several alliance members anticipate that the group will eventually reconvene to discuss how a section of the new Manufacturing Technology Institute might be used to train workers from the wood products industry.
B. Approach
The Wood Skills Training Project was designed to provide different types of training to pre-hires, recent hires, and incumbents (i.e., long-term employees). This section summarizes the types of assistance that were provided to the pre-hires and incumbents.
Training for Pre-hires
In preparation for the pre-hire training, the PIC conducted a needs assessment of the nine alliance members to obtain estimates of their long-term labor needs. As shown in Attachment 1, the PIC also requested information on companies’ requirements for entry-level positions and starting salaries. The objective was to establish some minimum hiring standards that would be consistent across the region’s wood products industry. Over several meetings, alliance members developed a standardized application form to assure that all nine employers would receive the same level of information about individuals who had been screened by the PIC. In addition, the group agreed that they would only accept entry-level applications from individuals who had completed the pre-hire training course. Alliance members also reached an understanding that the hourly entry-level wage for graduates would be $7.00 (it took the group several meetings to agree on a common entry-level wage).
In October 2000, the PIC sponsored two job fairs (in Jamestown and Dunkirk) to identify
potential candidates for the initial pre-hire training session. Company representatives interviewed the 47 persons who attended these two events. The PIC also placed an advertisement in a local newspaper and

D-45
requested referrals from both the Department of Social Services and the Department of Labor. The objective was to identify unemployed or underemployed workers who would be interested in entering the wood products industry.4 In the end, however, several of the people who attended the job fairs—and who ultimately participated in the pre-hire training—were already employed by one of the region’s furniture manufacturers.
Two weeks after the job fairs, the first pre-hire training session was conducted with 25
participants (out of 32 individuals who had enrolled in the class).5 Most participants were in their 30s and 40s, and just over half were male. The majority were between jobs or felt they needed to advance their careers. Interviews with alliance members revealed differing opinions as to the qualifications of the pre-hires. A representative from one firm indicated that most trainees appeared overqualified for entry-level work, while an official from another company suggested that he would not have hired any of the people he interviewed at the job fair.
Members of the alliance specified the range of topics that would need to be covered, while
PIC curriculum specialists developed the actual outline and course materials. The class, conducted by PIC staff, was offered in the evenings (between 5:00 p.m. and 9:00 p.m.) over a 2-week period. As shown in Attachment 2, the training focused on three primary topics—basic and technical skills required for the wood products industry (e.g., measurement, shop math, blueprint reading, dimensioning and tolerancing), attitudes for success, and employees’ safety.
Just over two-thirds (17) of the 25 participants completed the class.6 Alliance members were
provided graduates’ scores on math and reading exams, as well as a written assessment of each student’s job readiness and ability to perform basic manufacturing tasks (see Attachment 3). A review of these assessments suggests that most participants were ready for employment in the wood products industry. However, by the time the training was completed (October 19, 2000), a slowdown in the national economy had caused the region’s furniture manufacturers to cut back their operations. By the end of the year, none of the companies had a need for the new labor they had predicted on the August needs assessment. In fact, around the time of the pre-hire training, Bush Industries eliminated its third shift, thereby reducing its Jamestown workforce from 1,500 to 1,000.
4 PIC staff pointed out that, given the strong local economy, many of the individuals who were unemployed or underemployed were likely to have
barriers that were preventing them from obtaining full-time employment (e.g., lack of child care, insufficient skills, lack of reliable transportation).
5 The PIC did not conduct any follow-up with the seven enrollees who failed to attend the pre-hire class. However, staff indicated that it was likely that these individuals were already employed and did not feel they would benefit from the training sessions.
6 PIC staff indicated that the eight individuals who did not complete the course were not fully committed to the goals of the course, or had a variety of barriers that they were unable to overcome—e.g., lack of access to child care or transportation.

D-46
As a result, none of the companies that sponsored and helped finance the training were in a position to hire any of the graduates of the pre-hire program. A December 2000 telephone follow-up survey by the PIC found that some participants had gained new employment or improved their employment status within the same company. PIC staff indicated that several graduates were disappointed they had not been able to obtain employment in the wood products industry, and alliance members were apologetic that they had not been able to fulfill their promise of finding jobs for anyone who successfully mastered the training requirements.
Training for Incumbents
Although project staff originally intended to conduct several pre-hire training sessions, the downturn in furniture orders caused alliance members to shift their focus from finding new labor to making their existing workforce more productive. In January 2001, the PIC conducted a train-the-trainer class for 18 supervisors from five wood products companies. Unlike the pre-hire training (in which inexperienced workers were taught specific technical skills), the purpose of the incumbent training was to provide experienced workers with techniques for helping their colleagues master a specific technical skill. The one-time 3-hour session focused on effective teaching methods, including:
How to plan lessons and prepare supporting materials/handouts.
The psychology of instruction—e.g., how to impart important knowledge to participants, when to ask questions of trainees.
Ways to incorporate real-life applications into the instructional environment.
How to deal with nervous participants who had previous trouble in school.
How to use exercises to reinforce topics.
How to help to individual students—especially those who might not otherwise ask for help.
How to develop quizzes that accurately assess trainees’ understanding of specific topics.
Following the train-the-trainer class, the PIC began working with individual alliance
members to develop customized training modules that met a specific need. At the time of the site visit, only two companies—Bush Industries and Artone Manufacturing—had taken advantage of the individualized assistance. In both cases, PIC staff worked with company representatives to determine the most critical training needs of incumbent workers, prepare curriculum materials and manuals, and train

D-47
the supervisors who would be providing instruction to their colleagues. For example, at Artone Manufacturing, supervisors worked with PIC staff to develop an assembly outline that covered how to operate a variety of wood products tools (e.g., doweling machine, case clamp, drawer box clamp, hinge boring machine) and conduct a variety of tasks (e.g., sanding, prepping products, using power tools, using hand tools, final inspection and packaging of company products, handling of company products, touch-up methods). In addition to providing instruction in these topics, training was provided to the newest employees who needed instruction in basic skills. Graduates received a $100 bonus for completing the course.
C. Evaluation and Outcomes
Data Collection Activities
At the time of the site visit, the project had been operational for only 10 months. As a result, project staff were still in the process of documenting the implementation and impact of their ARC grant. Separate strategies were being used to identify outcomes associated with the pre-hire and incumbent classes. Specifically:
Pre-hire component. PIC staff conducted a telephone survey of the 17 individuals who
completed the pre-hire class. The purpose of this survey, administered 2 months after the class had ended, was to document participants’ employment status.
Incumbent training component. The limited universe within which the project is operating—i.e., the nine companies that compose the Woods Alliance Group—has greatly facilitated the PIC’s ability to keep close tabs on the number of employees who have participated in ARC-supported training activities. This has been accomplished primarily through periodic telephone contacts with alliance members and a review of end-of-class evaluations. Employers have also been tracking the progress of workers who complete an incumbent training course. For example, Bush Industries has used a daily performance log to collect pre- and post-training data on (1) the average number of minutes required for workers to set up a machine, (2) the number of quality adjusts performed per setup, and (3) machine efficiency. Plant managers will eventually use these data to demonstrate the value of employee training to company executives.
PIC staff indicated that they would have benefited from having more guidance from ARC as
to the type of outcome data that could be used to document success of their project. In the absence of any such guidance, the PIC was primarily documenting the number of individuals who had participated in the pre-hire and incumbent training components. While staff had attempted to contact the 17 graduates of the

D-48
pre-hire training program to ascertain their employment status, there were no plans to assess whether graduates of the incumbent training program had received promotions or salary increases. (The question of whether any followup tracking was planned for the incumbent training component did prompt PIC staff to consider steps that might be taken to begin obtaining such information from alliance members.)
Outcomes Associated with the ARC Grant
PIC staff were confident that they would surpass one of the quantitative objectives delineated in their ARC proposal—i.e., 147 persons (75 pre-hires and 72 incumbents) will participate in the training program. However, they indicated that the downturn in the national economy has necessitated a shift in focus from the pre-hire to the incumbent component. (ARC has approved this shift in the project’s quantitative outcomes.)
Pre-hire component. At the time of the site visit, 17 individuals had completed a pre-hire
class. Of these 17 graduates, 9 were employed full time, 2 were still self-employed, 1 was employed on a part-time basis, and 3 were not employed. (The remaining 2 graduates did not respond to the telephone survey.) As discussed previously, none of the graduates found new employment in the wood products industry. In addition, many of the graduates appeared to still be employed in the same position that they had held prior to the class. PIC staff doubted that they would conduct additional followup with these individuals, since they were employed outside of the wood products industry and would therefore be difficult to track.
Incumbent component. At the time of the site visit, 81 workers at two companies had
successfully completed an incumbent training course. Representatives from both Artone Manufacturing and Bush Industries indicated that the training has resulted in a more efficient and productive workforce. Over time, company officials plan to demonstrate the impact of training on participants’ efficiency, productivity, promotions, and salary increases.
At both Artone Manufacturing and Bush Industries, an important byproduct of the
incumbent training has been the development of course outlines that will eventually form the basis for a set of standard operating procedures for individual machines. Prior to the ARC grant, supervisors in these two companies lacked any experience in developing outlines and manuals that could be passed on to workers. The design of these standard operating procedures will enhance their capacity to enable more of their workers to become proficient in the use of sophisticated machinery. It will also provide workers with a common and reliable reference when they have questions about how to operate a particular tool.

D-49
Other outcomes. A noteworthy achievement of this 3.5-year alliance has been the willingness of these nine companies—which would traditionally vie for the same workers—to pool their resources and promote a uniform pre-hire training program for all of the community’s furniture manufacturers. In fact, alliance members eventually agreed to use a common job application form and offer similar starting wages to individuals who completed the PIC’s pre-hire training program. While the ARC grant was not responsible for the creation of this alliance, it did enable the nine companies to significantly expand upon their interest in working together to solve a common problem.
D. Lessons Learned
Alliance members generally believed that the process they used to address the labor shortage and training needs of the region’s wood products industry could be adapted in other communities. Respondents’ recommendations for other communities attempting a similar approach with a coalition of industry representatives are summarized below.
Timing is critical when implementing a pre-hire training program. Alliance members
indicated that they would have realized enormous benefits if the pre-hire training component had been in place at the peak of their labor shortage. They suggested that companies plan ahead so that they can initiate pre-hire training as soon as they realize a need to expand their workforce (e.g., following the win of a major contract). In addition, the turnaround time required to identify and train pre-hires needs to be fast enough so that companies come to rely on program graduates (as opposed to untrained labor that can be obtained quickly through temporary agencies) to fill their immediate hiring needs. Finally, the program needs to recognize that it may be more difficult to recruit pre-hires during the winter (when snow and ice can prevent trainees from attending class) and summer (when there is a greater number of construction jobs).
Do not use company representatives to prescreen prospective pre-hires. Six months
after the pre-hire class, one of the alliance members chose to expand its workforce. Although it had participated in the pre-hire training session—and had been provided with documentation on the technical aptitude of each graduate—the company used a temporary agency to obtain untrained labor. A representative from the company cited two reasons why none of the pre-hires were interviewed for the positions: (1) the need to bring in new workers as quickly as possible, and (2) a general impression that

D-50
the individuals who participated in the pre-hire training lacked basic work skills.7 The respondent acknowledged that his impression of the pre-hires was formed prior to the training session (i.e., during his screening interviews at the job fair) and that he had never reviewed the written assessment of students’ job readiness. In hindsight, PIC staff indicated that they should have taken full responsibility for screening candidates for the pre-hire training class. In so doing, they believe that employers’ impressions of the pre-hires would have been based solely on the written assessment of each student’s ability to perform basic manufacturing tasks—and not on their pre-training deficiencies.
Provide incentives for employee training. A primary purpose of the project was to
enhance workers’ skills, employability, and wages. Nonetheless, companies found that employees expected to be reimbursed for their participation in incumbent training (on the assumption that any increase in their productivity would ultimately boost corporate profits and earning). Several alliance members recommended that similar projects provide stipends or other incentives to workers who complete a class.8
Allocate sufficient time for developing course materials. Alliance members severely
underestimated the amount of time that would be required to develop the outlines and manuals for the incumbent training. Several factors hindered employers’ efforts to develop course materials—e.g., company supervisors had to prepare training materials on their own time, and the PIC had to play a greater role than originally anticipated helping to revise the course outlines. Therefore, respondents recommended that similar projects anticipate the need to allow at least 2-3 months for the development of such course materials.
Make training equipment available at a neutral site. The alliance members who took
advantage of the incumbent training indicated that their companies would not have been in a position to upgrade the skills of their workers during a period of economic growth, since all available machinery would have been in use throughout the course of the workday. PIC staff indicated that the development of the Manufacturing Technology Institute will eventually enhance their capacity to provide such hands-on training at a neutral site. This, in turn, will facilitate employers’ efforts to provide such hands-on training during periods that all factory equipment is constantly in use.
7 The respondent referred several of the candidates that he interviewed at the October 2000 job fair for the pre-hire class. Although he indicated
that he had no intention of offering a job to any of these individuals (because they appeared to lack basic work skills), he felt they would eventually be able to apply the knowledge gained through the pre-hire class with other employers in the manufacturing sector.
8 While project funds were used to compensate the company supervisors who developed course materials and conducted the training, the decision of whether to reimburse workers for time spent in training sessions was ultimately left to each company.

D-51
Have someone not affiliated with the industry coordinate the effort. One alliance member indicated that the nine companies benefited from the presence of a neutral third party (the PIC) to coordinate their common training needs. They suggested that other industries would need to rely on a impartial intermediary to organize the effort, conduct the training, and balance the interests of all participating companies.
E. Summary and Conclusions
The impact of the ARC grant on alliance members was clearly evident throughout the site visit. Without the project, the participating companies would not have been in a position to offer pre-hire or incumbent training. While the downturn in the national economy prevented the alliance from taking full advantage of the pre-hire component, the necessary materials are now in place to offer this training again when the region’s furniture manufacturers find themselves in need of new labor. In addition, while only two companies have been able to take advantage of the incumbent training, it is anticipated that the development of the Manufacturing Technology Institute will eventually enable other local furniture manufacturers to offer similar opportunities to their employees.
Unfortunately, many of the innovations and outcomes that alliance members envisioned at
the outset of the ARC grant have yet to be realized. While the PIC successfully conducted a pre-hire training class, the participating companies were never in a position to assess whether graduates had attained the necessary skills for employment in the manufacturing sector. Nor did the alliance have the opportunity to try out its procedures for apportioning prospective employees across the nine companies. As a result, there is no way of knowing whether some of the project’s distinctive features—common application forms, sharing information about the aptitude of all program graduates—would have worked as planned. For example, would competition for a small number of qualified pre-hires have eventually resulted in competition and friction among alliance members?
In spite of these obstacles, the project is to be commended for recognizing the need to
realign its activities to meet the changing needs of the regional economy. Alliance members hope to continue using their workgroup to address common training needs. It will, therefore, be interesting to continue monitoring the project to determine whether the alliance is able to fully implement its approach for attracting new labor to the wood products industry.

D-52
Attachment 1: Woods Alliance Group Company Survey 1. What are the minimum requirements for entry-level positions within your company?
High School Diploma/GED required ___________________________________________________ Felony Convictions allowable? ________________________________________________________ Available to work all shifts? (If applicable) ______________________________________________ Able to lift 20 pounds? ______________________________________________________________ Able to learn blueprint reading? _______________________________________________________ Any additional requirements? _________________________________________________________
2. What would be a starting salary range for your company for persons that complete training and are
hired? $6.00 to $8.00 has been proposed as most likely to be inclusive of all companies. If this is not appropriate for your company, what would be your company range? _________________________________________________________________________________
3. What are the specific job types that you are currently looking to fill on a continuous basis? E.g.,
Sprayer, Sander, etc. ________________________________________________________________ 4. What are your projected hiring needs for late October through December of 2000? _______________ 5. What are your needs for upgrade training for your current employees? E.g., Sprayers, Ripsaw
Operators, CNC, etc., as well as anticipated numbers. Please be specific.
_________________________________________________________________________________
PLEASE RETURN NO LATER THAN SEPTEMBER 1, 2000 IN THE ENCLOSED ENVELOPE. THANKS FOR YOUR INPUT!!

D-53
Attachment 2: Wood Skills Pre-hire Outline (32 hours)
A. Measurement/Math/Blueprint Class
1. Measurement
Care and handling of tools Steel rule (English/Metric) Vernier/dial calipers (English/Metric) Coordinate measuring systems (x, y, and z axes)
2. Shop Math Review
Fractional numbers and operations Decimal numbers and operations
3. Blueprint Reading
Alphabet of lines Symbols Orthographic projections Industrial drawing features
4. Dimensioning and Tolerancing
Unilateral/bilateral tolerancing Block tolerancing Baseline versus cumulative dimensioning English/metric systems
B. Attitude for Success
1. Positive approach 2. 7 steps to self-esteem 3. Goal setting 4. Coping with stress 5. Examining your attitude 6. Time management 7. Communication
C. Safety—Right to Know
1. Lock out—Tag out 2. Evacuation plans 3. Escape routes 4. Hazardous communications—MSDS 5. Lifting 6. Material Handling 7. General safety around machinery

D-54
Attachment 3: Examples of Student Evaluations From the October 2000 Pre-hire Course
John Doe—He was always prompt, pleasant, and willing to do what was expected. I believe he is capable of handling tasks that require advanced skills. Math=100% Print Reading=100% John Doe—He missed two nights because of his responsibilities in the National Guard and his math and print reading scores reflect his absences. Math=46% Print Reading=80% John Doe—He did well in both print reading and math. He was prompt, capable, and seemed to be a desirable candidate. Math=88% Print Reading=80% Jane Doe—She did quite well in both the math and print reading exercises and tests. She was a quick learner and helpful to fellow students which overshadowed her youth and inexperience. Math=85% Print Reading=95% John Doe—John struggled with both basic math and print reading. Although he was very prompt and likable, and eager to find employment, I believe he would need additional help. Math=0% Print Reading=45% John Doe—John was pleasant and friendly, but had considerable trouble in both math and print reading. I don’t think he has the skills required to do machine set up or operations, although he might do well in some support functions. Math=42% Print Reading=60% John Doe—John was one of the top students in the class. He has been self-employed which tells me he has the discipline necessary to perform job tasks, but he is looking for more security. I believe he would be an asset to any company and has the skills to perform machine set ups and operations. Math=96% Print Reading=100% John Doe—He enrolled late and missed the first class. He left early one night and missed the last night and his print reading exam. Math=46% Print Reading=0% John Doe—John struggled in math and print reading. He could benefit from additional training. He tried very hard, but I believe the class was too fast paced for him. Math=12% Print Reading=65% Jane Doe—Jane did a great job. She is a very reserved individual but is very motivated. She walked every day from Falconer (one of the region’s furniture manufacturers) to attend class and was the first to arrive. I believe she is an ideal candidate for any job requiring advanced skills. I even discussed her future in CNC programming and machine operation. Math=96% Print Reading=85% John Doe—He was a good student with an affinity for working with numbers. I think he would do better in a job requiring more mental skills than physical. Math=92% Print Reading=80% John Doe—John did well in both classes even though his background is in nursing. He seemed disillusioned with the profession and is looking for something else. If he possesses mechanical ability along with his intelligence, I believe he would be a good set up/operator. His questions revealed someone with good problem-solving skills. Math=88% Print Reading=100%

D-55
Ohio Fund for Appalachia Industrial Retraining
Project Location Appalachian Ohio
Grant Recipient Ohio Department of Industrial Training
ARC Number OH 10533
Project Type Workforce Training
Grant Amount $250,000
Matching Funding $250,000
Dates of Site Visit May 8-10, 2001
Site Visitors Nicole Bartfai, Glenn Nyre
Project Abstract
The Ohio Fund for Appalachia Industrial Retraining (FAIR) project assists companies in the Appalachian region by providing funds to support the training of underemployed and unemployed individuals. Unique among the ARC projects, FAIR receives a single grant from ARC and then distributes individual subgrants to companies engaged in workforce training. FAIR operates under the Ohio Investment in Training Program (OITP), which provides funding to new and expanding businesses in Ohio. FAIR assists companies in Appalachia that are often not served by OITP because they cannot garner as many resources as larger companies in other areas of Ohio. For each training project funded, FAIR contributes 25 percent, OITP contributes another 25 percent, and the company matches those funds by providing the remaining 50 percent of the cost.
FAIR collects outcome data from each company that receives a subgrant, including the number of individuals trained, the number of individuals retrained, and the number of new jobs created. Under the 1999-2000 grant, FAIR funding trained 1,255 individuals, retrained 402 employees, and helped 265 individuals obtain new jobs, exceeding its combined project goals in these categories by 28 percent, 3 percent, and 17 percent, respectively.
FAIR has received support from ARC since 1990. Currently, 10 projects have obligated money to begin training activities. These companies include various manufacturing companies, a visiting nurses association, and a local community college.

D-56
Ohio Fund for Appalachia Industrial Retraining
A. Background and Context
Objectives and Problems Addressed
The Appalachian region of Ohio comprises three of the state’s 12 economic development regions and consists of 29 counties, 9 of which are classified as distressed by the Appalachian Regional Commission. For 1998, the per capita income in all counties ranged from less than $18,000 to between $22,000 and $26,073. Of the 14 counties in the state that have a per capita income of less than $18,000, 13 are in the Appalachian region.1 Similarly, the three counties with the highest unemployment rates (10 percent or higher) are located in the region. 2
For the past 21 years, the Ohio Investment in Training Program (OITP) has provided
financial assistance and technical resources for customized training of employees of new and expanding Ohio businesses. The Fund for Appalachia Industrial Retraining (FAIR) project was initiated by OITP in 1990 because many companies in the Appalachian region could not compete for OITP funds with the larger companies in the cities of Ohio. Also, the OITP rating system favors new companies that are expanding, and as a result, many established companies in the Appalachian region were unable to obtain funding. With the creation of FAIR, smaller companies had their own pool of funding for similar training activities.
Community and Beneficiaries
The direct beneficiaries of the program are the companies that receive FAIR funding to train new and current employees. In the past, most companies have been in manufacturing or other product-producing industries. These companies ranged in size from 50 to 500 employees. Although manufacturing has been the primary industry of focus, the FAIR director recognized the need to assist other industries as well. Consequently, funding has been provided to health care companies and to consortium-based training projects. Neither OITP nor FAIR fund projects in fields that tend to have low entry-level wages and high turnover rates, such as printing, retail, fast food, and hospitality, unless a company can demonstrate that it has an established career path for entry-level employees. 1 Source: U.S. Bureau of Economic Analysis. 2 Source: Civilian Labor Force Estimates, March 2001.

D-57
Many companies that receive FAIR funding are located in rural areas in which traditional jobs no longer exist. Still, according to FAIR and OITP staff, residents do not want to leave communities where their families have lived for generations and are willing to commute long distances to work. In fact, the average round trip commute in Appalachian Ohio is 100 miles, which presents unique challenges and opportunities for the companies that remain in this region.
Individuals receiving training are either currently employed and need additional training to
retain their jobs or upgrade to other jobs, or they are unemployed and need to acquire both basic and job-specific skills in order to obtain employment. The type of beneficiary depends primarily on the type of company/consortium that is providing the training.
Grant Recipient
The Ohio Investment in Training Program, housed within Ohio’s Department of Development, provides financial assistance and technical resources for customized training for employees of new and expanding businesses. The office works directly with companies to create or retain jobs, increase productivity, improve labor/management relations, and increase the skill level of the labor pool.3 Most OITP funding is targeted for manufacturing industries.
Current Status
The Ohio FAIR project is flourishing, with 16 projects funded during 1999-2000 and 10 sub-grants currently obligated. Discussions with other employers to develop new training programs are also in progress. As evidence of the state’s commitment to FAIR’s goals, the state’s contribution will remain the same, even though state support to OITP is to be reduced next year,.
3 Source: http://www.resourceohio.com/work1.html.

D-58
B. Approach
The Ohio FAIR project was designed to help companies in the Appalachian region provide training to underemployed and unemployed individuals. The FAIR program receives a grant from the ARC and then distributes those funds in the form of subgrants to assist companies in providing training. FAIR support is limited to companies with no more than 500 employees worldwide. The FAIR coordinator indicated that she would like to have this restriction changed to “500 employees in one location,” since that would increase the number of companies eligible for grant money. According to her, some small, struggling plants and subsidiaries in the area could be revitalized and provide continued and even expanded employment opportunities within the area if FAIR were able to assist them.
FAIR’s workforce development efforts are very important to the economic development of
the region. In order for a company to obtain FAIR funds, it must first work with the regional coordinator to determine the appropriate amount of funding. Part of the job of the regional coordinator is to visit area companies on a regular basis in order to identify those anticipating a need to train new and current employees, often due to the acquisition of new equipment or a construction/expansion project. Once a need is established, the coordinator then determines whether the company is eligible for FAIR funding or regular OITP funding. FAIR funds can be used only for direct costs associated with training (materials and instructors), not for overhead costs or equipment. The type of training provided is either determined by the company or companies involved or developed with the assistance of the regional coordinator.
Funding amounts are determined through a series of formulas that are regulated by OITP.
Overall, FAIR contributes 25 percent, OITP contributes 25 percent, and the company must supply the remaining 50 percent of the total cost. The grants are limited to $30,000 for companies and $50,000 for consortia. Although FAIR and OITP funding can only be used for training costs, company matching funds can go for related costs, such as the salaries of the employees while they are being trained, and equipment.
Training
The site visit included visits to two of FAIR’s recent grantee training projects. Buckeye Career Center. Buckeye Career Center is a regional vocational school that serves
three counties in the Appalachian region. The human resource developer at the school initiated this project in order to assist local manufacturing companies in providing pre-employment training. He

D-59
assembled a consortium of manufacturing industries interested in improving the basic skills of potential or current employees, known as the East-Central Ohio Manufacturing Consortium.
A Chamber of Commerce study and supplemental interviews conducted with 32 employers
by center staff determined that the greatest need in the area was to provide potential employees with basic skills that could be applied to a variety of situations. The consortium’s members reviewed other pre-employment training curricula, but felt that they were not geared toward their specific needs. The consortium therefore created its own curriculum, with each member company contributing expertise to the development of one or more of the training modules. The Buckeye Career Center facilitates the Pre-Employment Training (PET) course, but most of those providing the training are from the consortium companies. The PET curriculum includes 96 hours of training in 10 components, as follows:
Component Hours
Communications 10 Quality Awareness 6 Safety 12 Basic Mathematics Skills 12 Teamwork 16 Basic Computer Skills 8 Personal Development 10 Wellness 6 Plant Tours 12 Graduation/Interviews 4
Initially, member companies paid $750 to join the consortium, but this fee has been
increased to $1,250. In addition, there is a $300 fee paid by the hiring company for each trainee hired. The current member fee includes a $600 credit for companies that they can use toward the cost of hiring two new employees. The cost to trainees is $125 for tuition, $35 for a drug screening test, and $25 for a WorkKeys assessment. The only “admissions” criteria is WorkKeys proficiency at a level of “4” in both “Applied Mathematics,” which measures a person’s skill in using mathematical reasoning to solve work-related problems, and “Reading for Information,” which measures a person’s skill in reading and using work-related information including instructions, policies, memos, bulletins, notices, letters, manuals, and governmental regulations.4 Participants who cannot afford the course are eligible for financial assistance from various sources, including religious institutions, a local center for abused women, and the local welfare office. Although member companies cannot officially enroll current employees in the full course, they can “drop in” employees for some of the modules at no cost.
4 WorkKeys testing levels for these two areas range from a low of 3 to a high of 7.

D-60
There is no guarantee that those taking the course will be hired, nor is there any obligation on their part to accept a job if offered. Yet, overall hiring rates have been quite good, with nearly two-thirds of the participants being subsequently employed by either consortium members or other companies, at hourly wages ranging from $7.50 to $15. Those who are not immediately hired are placed in a training pool to which employers can turn when they have employment needs. Employment status followups are conducted at 3, 6, and 12 months after completion of the training, and virtually all those who were hired have been retained, including those who were eventually hired from the training pool.
Some completers were not hired because they failed company background checks. As a
result, the screening process for entry into the course now includes a background check, provided at no charge by local law enforcement. Others had poor interview skills, though interviews are part of the regular curriculum, and staff from consortium members’ human resources departments provide mock interviews during the last class session. Particular training periods can end at what one of the employers interviewed termed “a bad time in the industry,” during which there are simply no employment opportunities.
Six PET courses have been offered through the Buckeye Career Center thus far, with classes
originally being held for 5 weeks on Monday through Friday from 6:00 to 10:00 p.m. However, the program now lasts for 6 weeks, with no Friday night classes. Attendance at all class sessions is required. The project had projected training 60 individuals, but ended up training 67. The course is not currently being offered because the manufacturing industry in the area is experiencing a downturn, and those businesses are not hiring. However, the name of the consortium has been changed to the East-Central Ohio Business Consortium to reflect the fact that it will now welcome the participation of industries other than those engaged in manufacturing. Given this broadening of industry focus, staff at both FAIR and the career center anticipate that the course will soon be offered again.
Mattingly Foods, Inc. Mattingly Foods is a family-owned food distribution warehouse that
has been in business in a small town in Appalachian Ohio for 55 years. It services various restaurants in 20 states, including 460 Bob Evans, 60 Wendy’s and several Reno’s Steakhouses. They distribute food and all other items used at the restaurants, with the exception of chemicals and paper. Mattingly has expanded significantly over the past 5 years, and currently has 210 employees. They have experienced no lay-offs and have an annual staff turnover rate of less than 2 percent, mostly due to retirements. The company is classified as a Minority/Woman Owned Business Enterprise (women control more than 50 percent of the stock), and has recently become an Employee Stock Ownership Plan (ESOP) company. The Mattingly motto “Turn & Earn” refers to the fact they turn over inventory every 11 days, substantially less than the industry average of 20 days. Two vice presidents interviewed stressed that

D-61
OITP and FAIR have provided important support over the past few years that has enabled the company to stay in that location and continue to contribute to the area’s economy.
Mattingly recently completed a significant expansion of its warehouse, including the
introduction of a new computer system that impacted every aspect of the operation. As a result, everyone at the company—from the “pickers” (forklift operators who move the merchandise) to the truck drivers and all office staff—needed to learn at least some aspect of the system in order to retain their jobs. For example, inventory was put on a new bar-coding system that can identify where every piece of merchandise is at any given time, as well as support a “just in time” inventory system. Warehouse personnel must not only be able to respond to computer-generated restaurant orders, but they need scan everything they take off the floor and then enter that information into a computer when they load it on a truck. Pickers are paid on an incentive system, which is based upon the number of items they move within the facility and on and off trucks. Because their errors can hamper inventory delivery and control, their wages are tied to their performance.
In addition, the truck drivers needed to operate computers that not only provide updated data
as the trucks are unloaded at the restaurants, but also keep track of miles traveled, gasoline usage, and the number of hours the drivers have been driving so they do not exceed a certain number of hours during a day or week. Mattingly’s expansion also included the implementation of a new, computerized cooling system for the warehouse, which contains many perishables, and certain employees on each of the two shifts needed to learn that system.
Training took place at local hotels, with onsite followup training taking place at Mattingly’s
own facility. The training approach used is known as “train the trainers,” with FAIR funds used to provide initial instruction by computer experts to key staff and supervisors. They, in turn, trained additional employees. Because of this approach, many more people were trained than the initial group supported by FAIR, and that training continued after the completion of the grant period. Mattingly had intended to use FAIR funds to train 35 employees, but only 17 were trained with those monies. However, the approach used allowed the company to leverage the FAIR funds and train more than 50 additional employees using its own personnel as trainers. In addition, Mattingly more than doubled its projected number of new jobs created, ending up with 17 rather than the 8 anticipated.

D-62
C. Evaluation and Outcomes
When examining the evaluation and outcomes of the FAIR program, it is important to note there are two beneficiaries: the companies and the employees. The companies benefit when current and potential new employees learn skills that can improve production, and the employees benefit through job creation, job retention, and/or wage increases.
Overall FAIR data collection
The FAIR program collects three types of data for each project funded: number of individuals trained, number of individuals retrained, and the number of new jobs created. Each company predetermines its specific goals for these categories as part of the application process, since, as the FAIR director emphasized, “they have the knowledge of the industry and understand the inner workings of their particular companies.”
Other required grant application information includes the following: Name and type of training activity, Training provider, Travel and other related expenses, Materials provided, Number of classes or training sessions, Hours per class/session, and Instructor cost per hour.
This information is categorized for the various types of training typically supported by OITP
and FAIR (e.g., basic skills, quality training, communication skills, customer service, employee orientation, product knowledge, maintenance/trades, managerial/supervisory skills, information technology, and technical processes). The regional OITP training coordinator who works closely with the FAIR projects uses an Excel Company Workbook to facilitate the grant application process for companies. A separate template for each of the training areas listed above is contained in the workbook. Exhibit 1 displays the template for support of a Basic Skills project.
The workbook also contains the following Excel template forms: Request for OITP/FAIR
Assistance, Project Budget, Tax Status Disclosure, EPA Compliance, and Request for Payment. These forms facilitate the application process for the employers and the monitoring process for the agency. Once the forms are completed, the company is asked to describe how the grant will assist the company

D-63
and how the training program will be evaluated. Companies are also requested to provide a description of the products and services produced at their facilities, and a description and cost estimates of recent or planned capital investments in building improvements and equipment.
As shown in Table 1, the 16 companies that received 1999-2000 subgrants exceeded their
combined training goals by 28 percent, their retraining goals by 3 percent, and their new job creation goals by 17 percent. All but four (75 percent) met or exceeded their individual subgrant training goals; all four companies that had a retraining component met or exceeded their goals; and six of the nine companies that had the creation of new jobs among their goals met or exceeded them.
Relationship of Activities to Outcomes
Company training activities are tied directly to the data collected for the FAIR program. While FAIR data collection focuses on the number of individuals trained and retrained and the number of new jobs created, one of the regional directors commented that companies also reported reductions of down time, increased production and improved product quality as additional outcomes.
C. Lessons Learned
Allow a flexible training schedule. The goal of the FAIR project is to provide funding to companies so they can train current and/or potential employees. However, companies have a competing interest; they need to produce a product. With this in mind, FAIR allows companies to be flexible in designing their training delivery approaches so that training courses/sessions do not interfere with companies’ production schedules. It is also important to realize that companies may not be able to adhere to set timelines. This type of understanding and flexibility only enhances the success of the project. For example, if a company has three shifts, training needs to take place within each of them in order to serve all employees. Traditional training models are not always able to accommodate such schedules.

D-64
Exhibit 1. Sample of an Excel Template Used to Apply for Funding
Basic Skills Provide a description of your training activities. For each category provide the following: 1. Name of the training activity 2. Training Provider (In-house, Private Vendor, Public Institution) 3. Travel or other related expenses 4. Materials required (provide quantity and cost per item and Instructor materials)
Description of Basic Needs: Development of remedial training fundamental to the workplace; courses such as literacy, reading comprehension, writing, math, English as a second language, and learning how to learn.
Today’s Date: ___________________________________________ Company: ___________________________________________ Address: ___________________________________________ P.O. Box: ___________________________________________ City: ___________________________________________ State: ___________________________________________ Zip: ___________________________________________
ITEM #
PROVIDE A DESCRIPTION BASED ON ITEMS 1-5 ABOVE
# TRAINED # OF CLASSES
HOURS\ PER
CLASS
TOTAL INSTRUCTOR
HOURS
INSTRUCTOR COST PER HOUR
TUITION TRAVEL
MATERIALS RELATED EXPENSES
TOTAL COMPANY
COST
POTENTIAL OITP
REIMBURSEMENT
Totals>>>> 0.00 0.00 0.00 0.00 0.00 0.00 0.00 0.00 0 0.00 0.00 0 0.00 0.00 0 0.00 0.00 0 0.00 0.00 0 0.00 0.00 0 0.00 0.00 0 0.00 0.00 0 0.00 0.00 0 0.00 0.00 0 0.00 0.00 0 0.00 0.00 0 0.00 0.00 0 0.00 0.00 0 0.00 0.00 0 0.00 0.00 0 0.00 0.00 0 0.00 0.00 0 0.00 0.00 0 0.00 0.00 0 0.00 0.00 0 0.00 0.00 0 0.00 0.00 0 0.00 0.00 0 0.00 0.00 0 0.00 0.00 0 0.00 0.00 0 0.00 0.00 0 0.00 0.00 0 0.00 0.00 0 0.00 0.00 0 0.00 0.00 0 0.00 0.00 0 0.00 0.00 0 0.00 0.00 0 0.00 0.00 0 0.00 0.00

D-65
Table 1. 2000 Final Close-out Report of the Ohio FAIR Project
PROJECT COUNTY PROJECTED
TRAINED ACTUAL TRAINED
PROJECTED RETRAINED
ACTUAL RETRAINED
PROJECTED NEW JOB
ACTUAL NEW JOB
1 MACA PLASTICS Adams* 161 342 0 0 60 40 2 Grafco Hardwood Floors Scioto* 12 15 40 51 12 8 3 A.R.M. (U.S.) Inc. Jefferson 17 17 0 0 3 3 4 S & N Pallets Tuscarawas 33 50 0 0 30 30 5 ZIDE Sport Shop of Ohio, Inc. Washington 14 19 0 0 3 9 6 Hall China Company Columbiana 53 53 0 0 30 30 7 Valley Forge/Colfor Columbiana 219 239 219 219 0 20 8 Buckeye Career Center Consortium Multi 60 67 0 0 0 0 9 Kent State Salem Campus Columbiana 60 109 0 0 0 0
10 Flex Mag Industries Washington 90 104 98 98 0 0 11 Sunpower Athens* 59 23 0 0 30 13 12 Mattingly Foods Muskingum 35 17 0 0 8 17 13 Kopp Clay Company Carroll 40 38 0 0 0 0 14 Alliance Data Systems Washington 50 90 0 0 50 90 15 Marietta College Consortium Washington 45 35 0 0 0 0 16 Refco Jackson* 34 37 34 34 0 5
TOTAL 982 1,255 391 402 226 265
BALANCES 128% 103% 117% * Distressed County

D-66
Another relationship that has contributed to the success of this project is the one that exists between the personnel in the state agency that provides some of the funding for the FAIR projects and the FAIR coordinator and the OITP regional coordinators. Finally, the Governor and state legislature have been very supportive of efforts to help Appalachian Ohio. As mentioned previously, the state’s match for the FAIR program was retained at the same level in the latest budget, even though OITP is facing a reduction in overall funding.
Closely monitor grant expenditures during the contract period. Many companies
receiving FAIR subgrants still have funds remaining after training activities have been concluded, resulting in having to return state monies because they were not used. Because funds are obligated at the beginning of a project, those funds are not available to support other projects during the year. Therefore, it is important to actively monitor the progress of companies to make sure they either use all of the funds, or enter into a contract modification that releases funds they do not anticipate using. Of the 16 companies funded in 1999-2000, all but six had money remaining at the end of their projects. Of the remainder, only three did not meet their projected number of individuals trained or retrained.
E. Summary and Conclusions
The Ohio FAIR project has been under the OITP umbrella since its inception. According to the FAIR coordinator, the OITP framework and its administrators have contributed significantly to the success of the FAIR project. Although many of the companies in the Appalachian region would not have access to regular OITP training funds, OITP provides a highly viable structure within which the program operates—one that has proven to be effective for many companies throughout the state of Ohio.
The FAIR project is an example of an approach that is, first and foremost, oriented to
meeting the needs of the clients it serves. It also brings a high level of flexibility in meeting those needs on behalf of both the companies and trainees. It is a business-driven model that provides, though its coordinator and the OITP regional coordinators, advice, experience, programmatic guidelines, and resources that are contributing much-needed support to this unique region of Ohio. The diversity of employers that are being served and the range of training approaches being utilized can serve as a model for other potential ARC grantees that may wish to utilize the “subgrant approach” for providing multi-area, multi-site training programs.

E-1
Appendix E
ARC Vocational Education and Workforce Training Project Descriptions

E-2

E-3
Appendix E
ARC Vocational Education and Workforce Training Project Descriptions
COHORT 1
Academic Career Training Program. The program was designed to provide three 6-day summer residential institutes on local college campuses for eighth grade students who are least likely to seek or obtain a post-secondary education. The program was to provide a concentrated, hands-on exploration of the academic and vocational careers that are available with a post-secondary education. (OH-12744) Advanced Graphic Design Laboratory at Frostburg State University. The project would establish a graphic design laboratory for training students in the advertising, printing, and graphic design industries, as well as offering continuing education workshops for industry personnel. The grant would also purchase laboratory equipment, renovate classroom space, and revise the graphic design curriculum. (MD-12453) Advanced Technology Training for Dental Hygienist and Biomedical Electronics. This project was designed to upgrade equipment in the Dental Hygiene and Biomedical Electronics Technology programs and develop and revise curricula for these programs. (AL-11505) Allied Health Technologies Instrumentation Proposal. The purpose of this project was to help equip health labs for a new Allied Health Wing, including physical therapy, occupational therapy, and anatomy and physiology labs, for use by 300-400 students per quarter. (OH-12125) Applied Academic Equipment Project. This project was designed to provide schools in the Spartanburg and Cherokee counties with equipment that would enable them to expand
courses being offered in applied academic subjects. The program integrates structured, rigorous academic and technical instruction for students who are unlikely to pursue a baccalaureate degree. (SC-12088) BMW Corporation Worker Recruiting, Screening, and Assessment Center. The project was designed to recruit, screen, assess, and train employees for the BMW automotive assembly plant that was under construction in Spartanburg, South Carolina. As part of the project, (1) 40,000 applicants were to be screened and tested on the General Aptitude Test Battery, (2) 20,000 applicants were to be tested on their pre-disposition to work in a team and on their technical skills, and (3) 2,000 applicants were to be selected for customized pre-employment training. Successful candidates were to be interviewed by BMW and offered employment. The Special Schools were then committed to providing 400 hours of on-the-job-training for each employee. The ARC grant was used to underwrite the lease expenses for the temporary assessment facility. (SC-11467) Building Economic Competitiveness through Workforce Development in Manufacturing Technology. This grant was designed to purchase and install equipment need to develop four new manufacturing courses. (VA-12064) Business Skills Laboratories. The project was designed to establish business skills laboratories in Greenfield Exempted Village School District high schools and offer courses in word processing, database management, and electronic spreadsheets. (OH-12126) Civil Engineering Technology. These funds will be used to purchase Civil Engineering Technology equipment for the Industrial and Engineering Technologies Division of Spartanburg Technical College. (SC-12811)

E-4
Clinical Lab for Respiratory Care. This project was designed to upgrade the instructional equipment for the Respiratory Care Program, allowing students to train on the updated equipment they will use on the job. An accelerated program provided skills upgrading for personnel already employed in the field. (SC-12093) Clinical Laboratory for Dental Auxiliary Programs - Instructional Equipment. This project was designed to purchase instructional equipment for the Dental Hygiene and Dental Assisting programs, including 21 self-contained dental operatory units. (SC-12094) Commercial Graphics Technology Program. This grant was used to purchase Commercial Graphics Technology Equipment for the Industrial and Engineering Technologies Division of Spartanburg Technical College. This would provide students an opportunity for advanced training in commercial graphics. (SC-12814) Computer Aided Design. This grant was used to purchase equipment to update and expand the computer aided design program at the Hamilton Career Center. (SC-12103) Computer Lab Upgrade, Tri-County Technical College. The project was used to upgrade lab facilities for the Office Systems Technology (OST) and Computer Technology (CPT) departments. ARC funds were used to convert an outdated typewriter lab to a computer lab. (SC-12089) Computer Technology Equipment. This grant was designed to upgrade and expand the computer technology equipment for the Business Technology Division at Spartanburg Technical College. This allowed for the revision of course content and the improvement of laboratory instruction. (SC-12102) Customized Industrial Training Program. This project was designed to expand the availability of targeted training programs to prospective and current employees of manufacturing firms operating in Tennessee
presently, and to firms which have chosen Tennessee as the location for a new operation but where the existing workforce lacks the technical abilities to perform the tasks necessary to compete for the jobs of the future. (TN-12486) Daniel Morgan Vocational Center Horticulture Program. The project was designed to purchase equipment necessary to initiate a horticulture program at Daniel Morgan Vocational Technical School. Students were to be trained for employment directly from high school or could attend Spartanburg Technical College for additional training. The program equipment was also to be used for hands-on experiments by biology students from Spartanburg and Broome High Schools. (SC-12090) Drafting/Pre-Engineering Equipment. This grant was used to expand the Computer Aided Drafting (CAD) capabilities of the current drafting program from 12 to 18 workstations. This expansion allowed the Career and Technology Center to use AutoCAD software. (SC-12099) Elbert County Youth Apprenticeship. This project was designed to purchase and install equipment and supplies for a Computer Assisted Design (CAD) laboratory and granite etching classes. The project would contract with the local granite industry to bring draftsmen into the high school as instructors, create 26 computer stations for training in CAD, create a granite etching class, and provide on-the-job training to prepare high school youth to enter the granite industry upon graduation. (GA-13178) Electricity and Electronics Equipment. This grant was designed to update the electronics class in order to meet current industry standards. Upgrading the equipment would provide students and graduates an easier and faster orientation into the workplace. (SC-12812) Engineering Graphics and Machine Tool Technologies Equipment. This grant was designed to assist with the purchase of Engineering Graphics/Machine Tool Technologies equipment for the Industrial and Engineering Technologies Division of Spartanburg Technical College. (SC-12525)

E-5
Environmental Control Equipment. This grant assisted in purchasing equipment to be utilized by high school and adult education students in the Environmental Control Program. (SC-12104) Equipment for Occupational Therapy Assistance Program. This purpose of this project was to provide funds for state of the art laboratory equipment for the Occupational Therapist Assistant program so that trainees can train on equipment comparable to that used in the field. (AL-11849) Forest: SAVER. Southwest and Appalachian Virginia’s Economic Resource. This grant was designed to assist in the development and implementation of a program of students leading to a 2-year degree in Forest Products Technology. The program is to be broad in scope and geared toward producing an entry-level employee who is familiar with the spectrum of forest products operations. (VA-12066) Frostburg State Mechanical Engineering Lab. The purpose of this project was to equip a mechanical engineering laboratory at Frostburg State University. This project is one component of a larger plan to establish mechanical and electrical engineering programs through a cooperative venture with the University of Maryland, Baltimore County and the University of Maryland, College Park. (MD-12454) Frostburg State Mechanical Engineering Materials Science Lab. The purpose of this project is to equip the mechanical engineering materials science laboratory to be built at Frostburg State University. This laboratory will serve students enrolled in the engineering programs. (MD-13101) Fund for Appalachian Industrial Re-training (FAIR). The FAIR program is designed to provide an equitable source of financing for worker re-training in Ohio’s 29-county Appalachian region through a competitive grants program. Because job creation is a major rating criteria under the Ohio Industrial Training Program, Appalachian companies with
significant need were often left underserved until the creation of the FAIR program. (OH-10533) Graphics, Printing and Design. This project was designed to purchase printing presses, computers, and layout table to teach entry-level employment skills demanded by the local industry. (SC-12095) Hamilton Career Center Graphics Communi-cations Equipment. This grant was designed to purchase equipment to meet the growing technology demands of the Graphics Communication industry. As a result of the additional equipment, expanded the course offerings would also be possible in the Graphics Communications discipline. (SC-12810) If I had a Hammer - Housing Construction and Rehabilitation Training. This program involves training persons currently receiving housing assistance through the Wise County Redevelopment and Housing Authority for employment in the construction field. Participants will receive job skills training in four areas of housing construction and rehabilitation. Approximately 16 to 20 residents will be recruited to participate in the program’s first year. (VA-12664) Industrial Electricity Course. This project was designed to update equipment in the Industrial Electricity Course. This equipment will allow the center to meet current industry standards by revising its curriculum, as well as training its students in logic and problem solving, troubleshooting, electronics, pneumatics, and automation. (SC-12098) Industrial Electronics, Automated Manu-facturing, Electronics Engineering Technologies. This project was designed to upgrade equipment for the Industrial and Engineering Technologies Division of Spartanburg Technical College, which serves approximately 180 students annually. The new equipment, which includes the programmable logic controller, digital, and DC and AC equipment labs, will enable the college to update its curriculum and provide its students with both training and instruction consistent with industry standards. (SC-12096) Industrial Maintenance Mechanics Program. This grant was used to upgrade the equipment used

E-6
by the Industrial Maintenance Mechanics Program. (SC-12100) Itawamba Community College Workforce Development. This grant was designed to install an audio-visual instructional network through which academic programs would be offered to workers in local industry. These courses would be taught upon demand and would be offered on schedules that allowed employees to gain advanced skills and credit toward a two-year associate’s degree in Industrial Training Technology, designed for mid-level managers. (MS-12478) Jackson County Youth Apprenticeship. This program was designed to fund the Youth Apprenticeship program through the Jackson County Comprehensive High School and the Regional Evening School. This program consisted of student recruitment and placement in local businesses, business recruitment and mentor training, staff development, student evaluation, and pre-apprenticeship activities. (GA-12725) Jefferson County Joint Vocational School Computer Aided Drafting in the Workplace. This project was designed to provide computer equipment and software to replace antiquated equipment. Twenty-five computers will provide AutoCAD drafting training for entry level work for students and to upgrade skills of current workers. (OH-12255) Lawrence County Vocational School AJE Diesel Technology. This project was designed to upgrade the diesel technology program with current equipment to meet industry needs and certify the program to meet state requirements for ASE certification. (OH-12122) Machine Technology Equipment Project. This project was designed to obtain a vertical Computer Numerical Control (CNC) Machining Center for the machining program. Students as well as current workers would be able to obtain training on the newly acquired computerized machining equipment. (VA-13464)
Machine Tool Operation. This project was designed to purchase equipment to update and expand the machine tool operation program at the Fred Hamilton Career Center. The program provides skilled training for 9-12th graders in Oconee County on a variety of metal shaping equipment, with an emphasis on transition to employment or post-secondary education. (SC-12091) Manufacturing Assistance Center. This project was designed to assist with the operation of the Manufacturing Assistance Center (MAC). The thrust of this project was to assist small to midsize businesses and industries and to strengthen partnerships with local businesses and vendors by providing shared access to industrial equipment. ARC funds were to be used to support technical resources and training costs. (PA-12060) Meigs Computer Instructional Equipment. This project was designed to provide new computers and networking hardware in all vocational and Tech-Prep areas, including two business-office labs, a math and science classroom, a Tech-Prep lab, and several vocational classrooms. (OH-12442) Morgan Machine Trade Equipment Improvement. This project was designed to strengthen the school’s vocational program by improving equipment in precision machining and business technologies. A local manufacturing plant requested computer numerical control machines and will train instructors to operate them and train students to use them. The project would also replace electric typewriters and Apple IIE computers with Compaq 486s and software and workstation furniture. The computer lab would also be used by community college students in the evenings. (OH-12443) Murray County Board of Education Apprenticeship Training. This project established an apprenticeship program to provide 24 high school students with an apprenticeship opportunity in one of four areas: health occupations, business leadership, child development, or technical skills. The grant would fund a vocational counselor who will supervise the program and operation of a career vocational guidance center for all students. (GA-11516)

E-7
Northeast Mississippi Community College Systems Upgrade for Employment Development. This project was designed to upgrade the metal cutting wire Electronic Discharge Machine system. This would allow the college to provide state-of-the-art equipment compatible with the skills needed by students to be employed in local and regional industries. (MS-12044) Northern Tier Industry and Education Consortium Workforce Development. The Northern Tier Industry and Education Consortium (NTIEC) is a partnership of 30 agencies (representing business, secondary education, postsecondary education, and economic development groups) committed to building a highly skilled workforce in Northeastern Pennsylvania. The purpose of this project was to increase the number of work-based learning opportunities for high school students and to expand the post-secondary involvement in the NTIEC’s workforce training initiative. (PA-12048) Ohio Valley Vocational School Machine Tool Technology Equipment. This project was designed to replace machine tools equipment with new, updated equipment. The project will teach machine students during the day and offer adult and retraining classes in the evening. (OH-12494) Paramedic Certified Skill Training. This project was designed to purchase equipment for a new paramedic skill training program for current emergency medical technicians. (OH-11743) Pennsylvania Appalachian Workforce Development Program. This project was designed to support the continuation of a workforce development program to help employers in Appalachian Pennsylvania. Key work elements include workforce development training activities, one-on-one training (customized by company or sector), supplier training consortium activities, and mentor training programs. (PA-11334)
Pickens Technical Institute - Technology Learning Center - Phase 2. This project was the continuation and expansion of the Work Force Academy’s Technology Learning Center, which prepares disadvantaged residents from four counties for entry level manufacturing jobs. Additional computer hardware and software will be purchased to enhance local and distance learning training capabilities and provide economic development resources to businesses. (GA-11830) Plastics Technology Lab. This project was designed to establish a Plastics Technology Lab within the Industrial and Engineering Technology Division of Spartanburg Technical College. The project will permit the Engineering Graphics Technology and Machine Tool Technology Departments to teach the theory and provide hands-on experience in the production of plastic parts and support instruction in the development of the molds, dies, and fixtures necessary for the production of non-metallic products. (SC-12092) Precision Manufacturing Institute Tool and Machine Training. The project was used to purchase equipment required to expand tooling and machining training in three counties (Crawford, Erie, Warren) in Northwest Pennsylvania. The program featured high density training based on an accelerated curriculum designed to reduce entry-level training time for the tooling and machining industry by at least 50 percent. ARC funding was used to purchase equipment required to expand the tooling and machining training, particularly to support additional entry-level training. (PA-13150) Rust College Microsoft Certified Systems Engineering Program. The project would implement software engineering training programs for minority college students as a one-year pilot program. The college would contract the instructional sessions and examination preparation with the New Horizon Learning Center. The program would also purchase required Microsoft course kits. (MS-13474) Shelton State Community College Commercial Graphic Arts. This project was designed to purchase laboratory equipment and furnishings for the Commercial/Graphic Arts and Machine Technology/Computer Aided Manufacturing

E-8
programs. The equipment will provide the necessary workstations for students who are unable to begin training in these programs because of the limited number of workstations. (AL-11867) Sunshine School - Welfare Parent Empowerment Program. This project was designed to continue a demonstration program training welfare recipient parents to become employable child care workers in public day care facilities, preschool settings, or home-based day care facilities. Participants receive classroom instruction and onsite observation opportunities. (KY-12872) Technology Connections for Educational Excellence: School and Business Partnerships. The project was designed to link high school computer labs and local businesses via telephone lines and modems. Funding would support the computer equipment and training for teachers and business personnel. Students would work on actual business projects under the direction of a teacher and coordinator. Workshops would provide hands-on practice using the system. (NY-12022) Technology Core Laboratory. This grant was designed to assist in the establishment of a Technology Core Laboratory within the Industrial Engineering Technology Division of Spartanburg Technical College. The goal was to increase the skills and competencies of graduates to better meet the need within the manufacturing sector for multi-skilled technicians. (SC-12523) Training and Development Program for Handloom Industry. This project was designed to assist Appalachian By Design, a nonprofit organization, support the Training and Development Program, which is aimed at increasing the productivity, proficiency, and skill levels of local artisans. (WV-12071) Union County Technology. This project established a dropout prevention program emphasizing workplace skills development through technology training for middle school students and adults. ARC funds purchased
computers and software used to offer training modules in health care management, computer aided publishing, computer aided design, and electronics and aerodynamics programs. (GA-12724) Washington County Career Center Educational Engineering Equipment. This project was designed to purchase and install equipment necessary to expand the drafting, food service, business, auto collision, and forestry programs. The project would purchase 15 computer aided drafting systems for drafting, architecture, woods, metals, and manufacturing classes. Twenty computer workstations for business education, MIG welders for the automotive collision program, and a wireless field phone for the forestry program would also be purchased. (OH-12441) Washington State Community College Instructional Equipment/Furnishings for Arts/Science Center. This project was designed to purchase and install instructional equipment for new technical programs and the Learning Assistance Center housed in a new Arts and Sciences Center. Programs supported include hospitality management, criminal justice/corrections technology, physical therapy, occupational therapy, respiratory therapy, and basic skills programs. (OH-12124) Welding Equipment. This grant assisted with the purchase of welding equipment for the Industrial and Engineering Technologies Division of Spartanburg Technical College. The equipment will serve approximately 60 credit students annually. (SC-12101) Welding Laboratory/Classroom. The project was designed to create a training program, renovate an existing welding instruction facility and certificate program, purchase equipment, pay a faculty position, and develop public relations materials to publicize the new certificate program. Each year the program would train 45 students as certified welders consistent with national skill standards. (NY-12709) Western Maryland Community College GPS Utility Program. This project was designed to install publicly available Global Positioning System (GPS) base stations, provide equipment for classroom training, and train students and

E-9
community residents in the use of GPS equipment at four local colleges. (MD-13115) Whitfield County (Phoenix High School) Apprenticeship Program. This project was designed to provide apprenticeship services for 15-20 high school students at Phoenix High School, a mostly evening program for nontraditional and dropout students. The project was also designed to fund a stipend for teachers to rewrite parts of the core curriculum into applied courses that utilize job-skill modules; these units would also be field tested and revised based on industry and apprentice input. (AL-11487) Winston County Technology Center Vocational Curriculum. This project was designed to upgrade trade and industrial training programs in automotive mechanics, electronics, and the building trades. The grant would fund update equipment and training aids, such as software, manuals, and classroom supplies. (AL-12269) Work-Based Learning. This project was designed to provide support to school districts for placement of high school students in appropriate work site experiences. Students will be able to participate in computer simulated work site experiences as well as being placed in actual workplace settings. (WV-12955) Youth Ventures. Youth Ventures is a micro-enterprise and leadership training project to provide at-risk, minority, and non-college bound youth with meaningful leadership roles within an actual business. The project was designed to expand the program. Workers receive training in small business management and participate in personnel, financial, facilities management, advertising, and community relations decision-making, in addition to assisting with payroll, marketing, scheduling, inventory, and bookkeeping. (NY-12077)
COHORT 2
Alfred State College Computer Technology Center. This grant was to develop and implement a Computer Technology Education Center. (NY-13662) Appalachian Center for Higher Education in Hale (ACHEH). The HERO Family Resource Center will serve a single county in Hale, Alabama. The HERO center will utilize a strong team approach utilizing community agencies, the local school district, and institutes of higher education. Mini-grants will be given to local high schools in order to help students plan, explore and experience the various possibilities for selecting careers in order to promote the importance and opportunities of post-secondary education and increase the number of students attending college. (CO-13764A) Armstrong Industry Skills & Employability Partnership (InSTEP) Project. This project consisted of 120 hours of instruction in the areas of communications, computer literacy, math, safety and health, personal development, quality, teamwork, technology, and plant tours. Classes were to be held for 4 hours each night, 5 days a week for 6 weeks. Five to six cycles for 120 hours of instruction were to be completed. (PA-13677) Chautauqua County Wood Skills Training. This grant, awarded to the Private Industry Council of Chautauqua, Inc., was designed to implement a wood skills training program. This would create 50 jobs in the wood products industry and upgrade the skills of at least 66 currently employed workers. (NY-13738) Clermont College Workforce Development Facility. This grant was designed to purchase equipment for two computer labs and a learning center, providing computer access for 1,000 new students and area employees at the Clermont College campus. The labs were to improve job-training programs, offer remedial assistance, and support the engineering, biology, chemistry and law enforcement curricula. (OH-13340) Columbia/Adair County Training and Development Center. This project will construct a

E-10
facility designed and equipped to meet training and re-training requirements of the local and regional workforce. The two-story facility will provide training rooms, a computer lab, a media room, and conference rooms. (KY-13357) Computerized Video Production. This project was designed to upgrade the equipment in the Career and Technology Center of Anderson School Districts 1 and 2. With the new equipment, 20 students during the first year and up to 40 students each year after will be trained and will graduate in the areas of computer technology and computerized video production. (SC-13648) Cortland County Education and Business Alliance WorkKeys Project. This project was designed to ensure that all Cortland County youth have the basic workplace readiness skills that will enable them to compete in the world economy of the 21st century. At least 600 students will be assessed using the WorkKeys instrument from ACT, Inc., and 510 will either successfully enter the workforce or continue their education upon graduation from high school. (NY-13753) East Kentucky Workforce Planning and Development Program. This project was designed for the development of three new degree programs at Southeast Community College. The new educational programs in hospitality management, golf course management, and arts and crafts design are expected to support the region’s expanding cultural tourism industry. The programs are expected to graduate 20 students per year within two years. (KY-13807) Fred P. Hamilton Career Center Automated Manufacturing Program. This grant, awarded to the Fred P. Hamilton Career Center, was for equipment to begin an automated manufacturing training program that will provide training to 16 students its first year and at least 45 students per year thereafter. This program will develop students’ skills to the high performance levels needed in today’s competitive global manufacturing. (SC-13646)
Fresh Start Community Career Center. This project was designed for the expansion of a job training program that will serve at least 60 people and place at least 15 of them in jobs. The Fresh Start Career Center will be located at Goodwill’s non-profit food processing plant in Wayne County. (KY-13173) Fund for Appalachian Industrial Re-Training (FAIR). This project was designed to assist small to medium-size companies that lack the resources to offer retraining for their employees. FAIR is targeted to defray some of the cost of training employees who are either entering the workforce or who require incumbent worker training. (OH-10533) Itawamba Community College Advanced Education Center Equipment. This grant, awarded to the Itawamba Community College, was designed to provide workforce skill training for more than 500 employers and 500 employees in northeastern Mississippi. (MS-13475) The Kentucky Appalachian Higher Education Network Center (KY AHED). The Morehead State University center will serve 38 high schools in 23 counties in Appalachian Kentucky. The KY AHED Center will comprise regional partnerships of institutions of higher education, local education agencies, not-for-profit organizations, and assorted community-based organizations. Two types of grants will be awarded: challenge grants to local school districts and challenge grants to network institutions. The scope of work for these grants includes building self-confidence among students, assisting students and their parents with planning college and career choices, and demystifying the higher education experience. (CO-13764B) Mold Design Laboratory, Phase II. This project was designed to provide equipment for the implementation of the second phase of the school’s Mold Design Laboratory. Students in the Machine Tool and Engineering Graphics Technology programs were to receive training in current industry standard designing and tooling processes and related skills. (SC-13652)

E-11
North Central Appalachian Center for Higher Education. This project, which began in 1998, was designed to encourage students to explore their career interests, inform them about college and financial aid options, and build self-confidence in their ability to succeed in higher education. (CO-13218) Partners in Progress Operations and Training Facility Project. This project includes the purchase and renovation of a 7,600 square foot building on approximately 2.5 acres to be used for light manufacturing and training of disabled individuals. The project also involved the construction of a 5,600 square foot addition to house administrative space, equipment testing rooms, locker and cafeteria facilities, and conference/training area. (PA-13612) Regional Technology Training Center. This project will initiate delivery of a four-part intensive learning program to over 50 out-of-school adults, 65 high school students, and 6 vocational education instructors, providing instruction in the networking skills needed to compete in today’s technologically advanced labor markets. (NY-13727) SCT BOCES Mobile Technology Unit. This grant was designed to purchase and run a mobile “technology bus” serving the Southern Tier of New York State and northern Pennsylvania. At least 100 employees will complete a training course that had been requested by their employers within the first year of its operation, resulting in lower costs for employers and higher levels of competitiveness in the global marketplace. (NY-13716) Spartanburg Technical College Machine Tool Technology Program. This project was designed to provide equipment for the Machine Tool Technology Training Program. With the upgrade equipment, 20 students per year will be trained and will graduate from the program with industry-standard skill levels. (SC-13649) Spartanburg Technical College Surgical Technology Program. This project was designed to provide equipment for the Surgical
Technology Training Program. The program trains and graduates 15 students per year with industry-standard skill levels and provide specialized training for area employers. (SC-13647) Steuben ARC Expansion of Printing Training Program. This grant, awarded to the Steuben ARC, was designed to provide employment training. At least 15 adults on the welfare rolls and/or with developmental disabilities or mental health issues in Steuben County, NY, will achieve long lasting employment as a result of training provided by Steuben ARC over the next year. (NY-13617) SWVA E-Commerce/E-conomic Hope for an Underemployed Workforce. This project developed an e-commerce video training project for the underemployed, individual entrepreneurs, and small business owners in the four-county region. The project was to include a training session and the production of a 10-session video course, which provided instruction to participants on developing a web site, online catalog of products and services, and an online purchasing system. (VA-13734) Tri-County Technical College Equipment for Computer Technology Laboratory Business and Human Services Division. This grant was designed to upgrade the Business and Human Services Division computer laboratory, which serves over 250 local students a year. As a result of the upgrade, students were to receive training in Internet applications, Web design, and multimedia applications. (SC-13651) Tri-County Technical College Respiratory Care Lab Equipment for Health Education Division. This grant was designed to train 20 local students to become Respiratory Care Therapists. The new equipment in the Respiratory Care Technology Laboratory was to support the Respiratory Care Therapy training program, a new two-year degree program in the Health Education Division. (SC-13650)


F-1
Appendix F
Cohort 1
Survey of ARC-Funded Vocational Education and Workforce Training Projects
Part 1: ARC Grants and Projects Part 2: ARC-Related Outcomes

F-2

F-3
D-3
Appalachian Regional Commission
Survey of ARC-Funded Vocational Education and Workforce Training Projects Part 1: ARC Grants and Projects
This survey has been authorized by the Appalachian Regional Commission. While you are not required to respond, your cooperation is needed to make the results of this survey comprehensive, accurate, and timely.
INSTRUCTIONS FOR COMPLETING THE SURVEY
The Appalachian Regional Commission (ARC) is conducting a survey of its vocational education and workforce training projects funded since 1990. The purpose is to evaluate the impact of its grants and to identify ways in which the program might be improved. Part 1 of the survey asks general information about your ARC grant and your overall project, while Part 2 asks specific information about the outcomes that you identified in your original proposal to the ARC. Your responses to these items will be used to assess the extent that ARC-funded projects in the study sample were able to achieve their proposed outcomes. Please complete both Part 1 and Part 2 of this survey. We ask that the requested information be provided by the person who is most knowledgeable about the history and current status of the project. The name, contact information, and other descriptive information about the project appear below.
AFFIX LABEL HERE
If any of the above information is incorrect, please update directly on the label.
RETURN COMPLETED FORM BY FEBRUARY 22, 2001 TO:
ARC Evaluation Westat TB 150F 1650 Research Boulevard Rockville, Maryland 20850
IF YOU HAVE ANY QUESTIONS, CALL: Nicole Bartfai 1-800-937-8281, ext. 3865
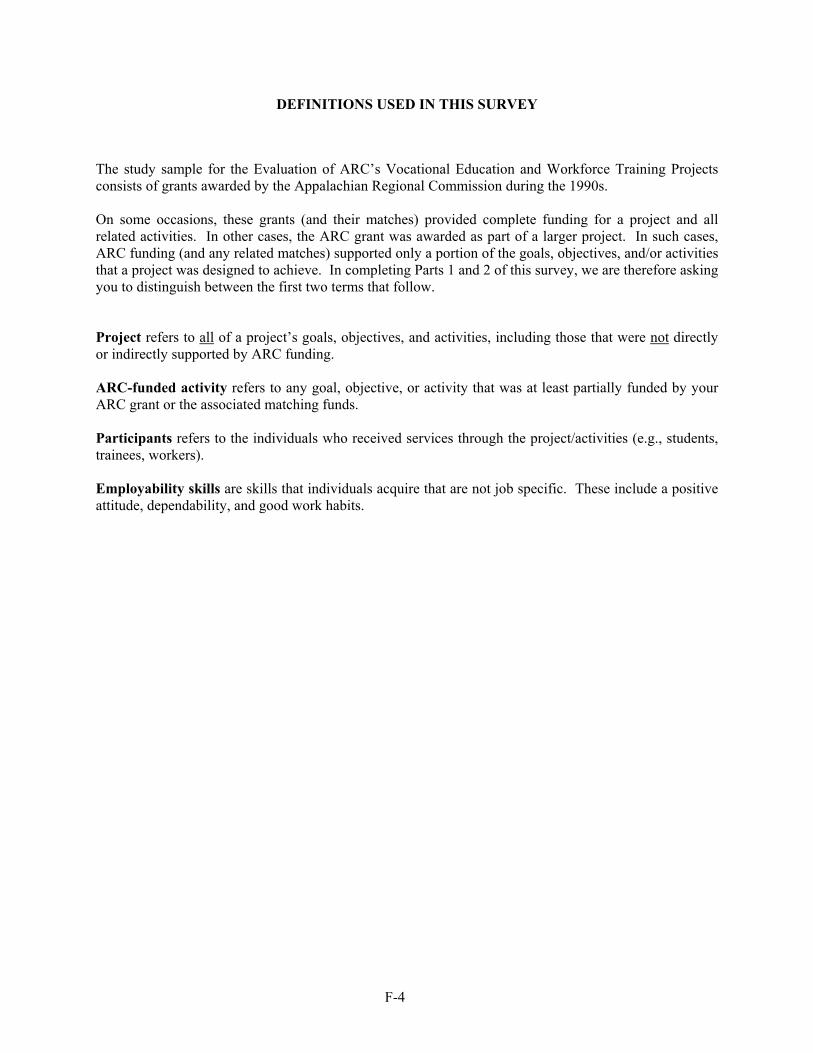
F-4
DEFINITIONS USED IN THIS SURVEY
The study sample for the Evaluation of ARC’s Vocational Education and Workforce Training Projects consists of grants awarded by the Appalachian Regional Commission during the 1990s. On some occasions, these grants (and their matches) provided complete funding for a project and all related activities. In other cases, the ARC grant was awarded as part of a larger project. In such cases, ARC funding (and any related matches) supported only a portion of the goals, objectives, and/or activities that a project was designed to achieve. In completing Parts 1 and 2 of this survey, we are therefore asking you to distinguish between the first two terms that follow. Project refers to all of a project’s goals, objectives, and activities, including those that were not directly or indirectly supported by ARC funding. ARC-funded activity refers to any goal, objective, or activity that was at least partially funded by your ARC grant or the associated matching funds. Participants refers to the individuals who received services through the project/activities (e.g., students, trainees, workers). Employability skills are skills that individuals acquire that are not job specific. These include a positive attitude, dependability, and good work habits.

F-5
SECTION 1: ABOUT THE ARC GRANT
1. From the list below, please indicate the category that BEST describes the grant recipient organization. (Circle only one.)
Educational Organizations Comprehensive middle or high school .................................................................... 01 Area vocational school/vocational high school ....................................................... 02 Technical college or institution................................................................................ 03 Comprehensive community college (degree-granting) ............................................ 04 Four-year postsecondary institution......................................................................... 05 State education agency ............................................................................................ 06 Local school district/agency .................................................................................... 07 Other education entity (specify) _______________________________________ 08 Government Organizations State government agency ......................................................................................... 09 County government agency ..................................................................................... 10 City or municipal government agency..................................................................... 11 Other government entity (specify) _____________________________________ 12 Other Organizations Social service agency............................................................................................... 13 Community development organization.................................................................... 14 Health care organization .......................................................................................... 15 Consortia of organizations ....................................................................................... 16 Other community entity (specify) ______________________________________ 17
2. During what year(s) did you receive ARC funds for this project? (Circle all that apply.)
a. Prior to 1990 ............................................... 01 b. 1990 ............................................................ 02 c. 1991 ............................................................ 03 d. 1992 ............................................................ 04 e. 1993 ............................................................ 05 f. 1994 ............................................................ 06 g. 1995 ............................................................ 07 h. 1996 ............................................................ 08 i. 1997 ............................................................ 09 j. 1998 ............................................................ 10 k. 1999 ............................................................ 11 l. 2000 ............................................................ 12

F-6
SECTION 2: ABOUT THE OVERALL PROJECT
3. Which of the following statements BEST applies to the participants (e.g., students/trainees/workers) in your project? (Circle only one.)
The majority of participants had never held a full-time job (e.g., students, displaced homemakers) . 1
The majority of participants were full-time employees or had previously been employed full time.. 2
Combination of the first two............................................................................................................... 3
4. Which of the following BEST describes the age range of participants in this project? (Circle only one.)
Primarily youth (18 or younger) ........................................................................................ 1 Primarily adults.................................................................................................................. 2 Both youth and adults ........................................................................................................ 3
5. Which one of the following BEST describes the geographic distribution of the individuals expected to benefit
from this project? (Circle only one.)
In a single city or town ....................................................................................... 01 In a single county................................................................................................ 02 In a single school district .................................................................................... 03 In a major metropolitan area (i.e., a central city and its adjacent counties) ........ 04 In 2 or more counties or school districts within a single state (not associated with a common metropolitan area) ..................................................................... 05 In all counties within a single state ..................................................................... 06 In 2 or more states............................................................................................... 07 Other area definition not listed above (specify) ________________________ 08
6. Indicate whether your project was designed to provide services, resources, or other assistance to any of the
following groups. (Circle all that apply.)
a. Extreme poverty .................................................................................................. 01 b. Illiterate................................................................................................................ 02 c. Limited English speaking .................................................................................... 03 d. Disabled............................................................................................................... 04 e. Geographically isolated/rural............................................................................... 05 f. Unemployed/underemployed............................................................................... 06 g. Underrepresented minorities................................................................................ 07 h. Migrant workers/migrant students ....................................................................... 08 i. Public assistance recipients.................................................................................. 09 j. School dropouts ................................................................................................... 10 k. Other group not listed (specify) _____________________________________ 11

F-7
7. Listed below are immediate and long-term goals commonly anticipated by vocational education and workforce
training projects. Please indicate whether each of the following was viewed as
an immediate goal that project participants would be expected to achieve at the time they complete your project,
a long-term goal that project participants would ultimately (i.e., after 1-3 years) be expected to
achieve as a result of their participation in your project, or
not a goal of your project.
Circle one response for each line.
Goal Immediate goal Long-term goal Not a project goal
Obtain skills
a. Provide individuals with basic skills (e.g., literacy)............................................................. 1 2 3
b. Provide individuals with academic skills.......... 1 2 3
c. Provide individuals with vocational and technical skills ..................................................
1
2
3
d. Provide individuals with employability skills (e.g., work attitudes/habits) ..............................
1
2
3
e. Help individuals obtain a high school diploma, GED, or equivalent ...........................................
1
2
3
f. Help individuals obtain a degree/credential...... 1 2 3
Individual employment gains
g. Help individuals who have never held full-time employment gain initial full-time employment ......................................................
1
2
3
h. Help employed individuals maintain current employment ......................................................
1
2
3
i. Help employed individuals increase job-related responsibilities, gain promotion, and/or earn increased wages ........................................
1
2
3
j. Help underemployed or dislocated workers obtain new employment....................................
1
2
3
k. Retrain workers in another field/help employed individuals obtain new employment ......................................................
1 2 3
Community impacts
l. Help local businesses........................................ 1 2 3
m. Increase the economic viability of the community........................................................
1
2
3

F-8 SECTION 3: PROJECT ACTIVITIES
8. Did your project purchase, rent, or lease any equipment—e.g., computerized or non-computerized industrial equipment, computer hardware or software, medical equipment? (For the purposes of this item, equipment includes computers and software—regardless of cost.) (Circle one.)
Yes.................. 1 (Continue with Q9) No..................... 2 (Skip to Q10)
9. Below is a grid that asks you to provide information about equipment that is commonly used by vocational education and workforce training projects. For
each type of equipment listed (a through f), please answer the following questions.
Column A – Did you use ARC funding to purchase this type of equipment? Circle 1 for “Yes” and 2 for “No.” If you answered “Yes,” continue with Column B. If you answered “No,” skip Columns B through D. Repeat for each type of equipment.
Column B – Is most of this equipment currently still in use? Circle 1 for “Yes” if the majority of the equipment is still in use. Circle 2 for “No” if the
majority of the equipment is not still in use. If you answered “Yes,” skip Columns C and D. If you answered “No,” answer Columns C and D. Column C – How many years was the equipment in use? Write in the number of years this type of equipment was in use. If the equipment was
purchased but never used, write “0.” Column D – Why is the equipment no longer in use? Circle the number for each reason that applies.
(A) (B) (C) (D)
Type of Equipment Yes No Yes No Number of years Equipment
became obsolete
Mechanical failure
Lack of interest among users
Project ended
a. Industrial equipment (non-computerized)..... 1 2 1 2 ____________ 1 2 3 4
b. Industrial equipment (computerized)............ 1 2 1 2 ____________ 1 2 3 4
c. Computer hardware ...................................... 1 2 1 2 ____________ 1 2 3 4
d. Computer software ....................................... 1 2 1 2 ____________ 1 2 3 4
e. Medical equipment ....................................... 1 2 1 2 ____________ 1 2 3 4
f. Other (specify) _______________________
____________________________________ 1 2 1 2 ____________ 1 2 3 4

F-9
10. Did your project conduct any training activities for project participants (e.g., occupational/technical training, academic training)? Please note that this question only refers to actual training received by participants (e.g., students/trainees/workers). Question 13 focuses on training provided to project staff, as well as the development of training materials. (Circle one.)
Yes.................. 1 (Continue with Q11) No..................... 2 (Skip to Q12)
11. Below is a list of training activities that are commonly conducted by vocational education and workforce training projects. For each type of training listed (a
through e), please answer the following questions.
Column A – Has this training activity been conducted by your project? Circle 1 for “Yes” and 2 for “No.” If you answered “Yes,” continue with Columns B through F. If you answered “No,” skip Columns B through F. Repeat for each activity.
Column B – Did ARC contribute any funding for this training activity? Circle 1 for “Yes” and 2 for “No.” Column C – Is this training activity currently (still) being conducted? Circle 1 for “Yes” and 2 for “No.” Column D – Where does/did the training activity take place? Circle the number for each location that applies.
Column E – How often does/did this training activity occur?
Please use the code provided. (1) More than once a week (2) Once a week (3) 2 to 3 times per month (4) Once a month (5) Less than once a month
Column F – How long does/did this training activity last? Please use the code provided. (1) Less than 1 month (2) 1-3 months (3) 4-7 months (4) 8-12 months (5) Longer than 12 months
(A) (B) (C) (D) (E) (F)
Training Activities Yes No Yes No Yes No School-based
classroom
School-based shop
or lab
Work site classroom
Work site (on the
job)
Home or other
distance learning center
How often Period of time
a. Occupational/technical training .... 1 2 1 2 1 2 1 2 3 4 5 _________ _________
b. Academic training or enhancement ................................. 1 2 1 2 1 2 1 2 3 4 5
_________ _________
c. Business management training...... 1 2 1 2 1 2 1 2 3 4 5 _________ _________
d. Adult basic education (e.g., literacy).........................................
1 2 1 2 1 2 1 2 3 4 5 _________ _________
e. Other (specify)_______________ 1 2 1 2 1 2 1 2 3 4 5 _________ _________

F-10 12. Below is a list of job search assistance and social support services that are commonly provided by vocational education and workforce training projects. For each
type of assistance/support listed (a through j), please answer the following questions.
Column A – Has this type of assistance/support been provided as part of your project? Circle 1 for “Yes” and 2 for “No.” If you answered “Yes,” continue with Column B. If you answered “No,” skip Columns B and C. Repeat for each type of assistance/support.
Column B – Did ARC contribute any funding for this type of assistance/support? Circle 1 for “Yes” and 2 for “No.”
Column C – Is this assistance/support currently (still) being provided? Circle 1 for “Yes” and 2 for “No.”
(A) (B) (C) Assistance and Support Yes No Yes No Yes No
Job assistance and career counseling a. Career counseling (e.g.,
discussions, diagnostic or aptitude testing)........................... 1 2 1 2 1 2
b. Job search/placement assistance (e.g., job bank, employer outreach) ..................................... 1 2 1 2 1 2
c. Employability skills (e.g., work attitudes/habits) ........................... 1 2 1 2 1 2
d. Referrals to other agencies for job assistance/career counseling ................................... 1 2 1 2 1 2
e. Other (specify)______________ 1 2 1 2 1 2
Social support services f. Assistance arranging child care... 1 2 1 2 1 2 g. Assistance arranging
transportation .............................. 1 2 1 2 1 2
h. Financial assistance..................... 1 2 1 2 1 2
i. Referrals to other agencies for social support services ................ 1 2 1 2 1 2
j. Other (specify)______________ 1 2 1 2 1 2

F-11
13. Below is a list of other activities that are commonly conducted by vocational education and workforce training projects. For each activity listed (a through q), please answer the following questions. Please note that training for project participants is the focus of Q11.
Column A – Has this type of activity been conducted as part of your project? Circle 1 for “Yes” and 2 for “No.” If you answered “Yes,” continue with Column B. If you answered “No,” skip Columns B and C. Repeat for each activity.
Column B – Did ARC contribute any funding for this specific activity? Circle 1 for “Yes” and 2 for “No.”
Column C – Is this activity currently (still) ongoing? Circle 1 for “Yes” and 2 for “No.”
(A) (B) (C)
Other Activities Yes No Yes No Yes No
Construction/expansion/leasing of a physical plant a. Build a new structure ................................................................ 1 2 1 2 1 2 b. Make an addition or renovation to an existing structure ........... 1 2 1 2 1 2 c. Purchase/install office furniture ................................................ 1 2 1 2 1 2 d. Lease property or space............................................................. 1 2 1 2 1 2 e. Other (specify)_____________________________________ 1 2 1 2 1 2 Training of project staff f. Provide training on project-purchased equipment..................... 1 2 1 2 1 2 g. Provide training on content in a specific skill or knowledge
area............................................................................................ 1 2 1 2 1 2
h. Provide training on pedagogy or teaching skills ....................... 1 2 1 2 1 2 i. Other (specify)_____________________________________ 1 2 1 2 1 2 Training materials j. Develop/purchase instructor or teacher manuals/curriculum .... 1 2 1 2 1 2 k. Develop/purchase student manuals/materials ........................... 1 2 1 2 1 2 l. Develop/purchase standards/proficiencies (e.g., align with
industry standards) .................................................................... 1 2 1 2 1 2
m. Other (specify)_____________________________________ 1 2 1 2 1 2 Community outreach n. Establish community or business partnerships.......................... 1 2 1 2 1 2 o. Distribute funds/mini-grants ..................................................... 1 2 1 2 1 2 p. Provide community outreach activities ..................................... 1 2 1 2 1 2 q. Other (specify)_____________________________________ 1 2 1 2 1 2

F-12
D-12
14. Please indicate whether each of the following obstacles or impediments prevented you from carrying out the ARC-funded activities. (Circle all that apply.)
Planning
a. Underestimated the resources needed............................................................. 01 b. Underestimated time/effort needed ................................................................ 02 c. Underestimated the demand for services or magnitude of the problem ......... 03
Administrative d. Local administrative delays............................................................................ 04 e. Grant not awarded in timely manner .............................................................. 05 f. Lack of access to timely or helpful technical assistance ................................ 06
Personnel g. Inadequate or underqualified staff.................................................................. 07 h. Excessive staff turnover ................................................................................. 08 i. Communication problems/misunderstanding of roles .................................... 09
Implementation j. Construction delays ........................................................................................ 10 k. Contracting outside provider delays ............................................................... 11 l. Installing equipment ....................................................................................... 12 m......................................................................................................................... D
evelopment of program materials................................................................ 13
Community n. Community/families not supportive ............................................................... 14 o. Participants not maximizing use of services................................................... 15
Cost p. Project funds were depleted before implementation....................................... 16 q. Matching funds never received ...................................................................... 17 r. Matching funds were less than expected/needed............................................ 18
Other s. Specify: _____________________________________________________ 19

F-13
SECTION 4: IMPACT OF THE ARC GRANT AND CURRENT STATUS
15. What is the current status of this project? (Circle only one.)
In full operation in the same way as during the ARC grant period .......... 1 (Skip to Q18)
In operation but changed.......................................................................... 2 (Continue with Q16)
No longer in operation............................................................................... 3 (Skip to Q17)
16. Which of the following statements describe the way(s) your project has changed since the ARC grant? (Circle
all that apply.)
a. The project serves more individuals......................................................................................... 01
b. The project provides services in more sites.............................................................................. 02
c. The project serves additional groups of people ........................................................................ 03
d. The project provides additional types of services/training ....................................................... 04
e. The project serves fewer individuals ........................................................................................ 05
f. The project provides fewer services ......................................................................................... 06
g. Other (specify) ____________________________________________________________ 07 17. Which of the following factors have contributed to the change in your project? (Circle all that apply.)
Factors that led to reduced or terminated project
a. Met need, no longer necessary ................................................................................................ 01
b. Loss of funding for continuation ............................................................................................. 02
c. Lack of support from project partners ..................................................................................... 03
d. Lack of interest from participants............................................................................................ 04
e. Delays in implementing approach ........................................................................................... 05
f. Approach no longer appropriate to problem............................................................................ 06
g. Loss of key staff ...................................................................................................................... 07
h. Other (specify) ____________________________________________________________ 08
Factors that facilitated growth/expansion of project
i. Increased need for services in the community......................................................................... 09
j. Additional funding available for additional participants and/or services ................................ 10
k. Loss of other services in the community led project to take on additional roles ..................... 11
l. Additional areas of needs recognized since grant inception.................................................... 12
m. Other (specify) ____________________________________________________________ 13

F-14
D-14
18. What do you believe would have been the most likely outcome of your project if you had not received funds through the Appalachian Regional Commission? (Circle only one.)
The project would never have been implemented ................. 1 (Skip to Q22)
The project would have been fully implemented................... 2 (Skip to Q22)
The project would have been partially implemented............. 3 (Continue with Q19)
19. How do you believe the absence of ARC funding would have affected the range of services offered by your project? (Circle only one.)
The project would still be able to offer the full range of services .................................................. 1
The project would have provided slightly fewer services............................................................... 2
The project would have provided significantly fewer services....................................................... 3 20. How do you believe the absence of ARC funding would have affected the number of people reached? (Circle
only one.)
The project would have reached an equivalent number of people.................................................. 1
The project would have reached slightly fewer people ................................................................. 2
The project would have reached significantly fewer people........................................................... 3 21. How do you believe the absence of ARC funding would have affected the implementation schedule of your
project? (Circle only one.)
The project would have been implemented on the same schedule ................................................. 1
Project implementation would have been delayed slightly............................................................. 2
Project implementation would have been substantially delayed .................................................... 3

F-15
22. Please indicate (or estimate) the number of individuals who have ever benefited as a result of the ARC grant.
Indicate N/A (Not Applicable) if the output or outcome was not an intended output or outcome for your project.
Indicate DK (Don’t Know) if you cannot provide a reasonable estimate for an output or outcome that
pertains to your project.
Provide a response for each line.
Outputs and outcomes Number of individuals who have
directly or indirectly benefited as a result of the ARC grant
a. Number of project staff who received training (e.g., in equipment or content/training skills) as a result of the ARC grant............................
b. Number of participants (e.g., students/trainees/workers) who received academic or vocational training as a result of the ARC grant
c. Number of participants who obtained a relevant degree or credential as a result of the ARC grant ................................................................
d. Number of participants who received career counseling or job search/placement assistance as a result of the ARC grant ...................
e. Number of participants who received support services (e.g., child care or transportation assistance) as a result of the ARC grant ...........
f. Total number of actual job placements that resulted from the ARC grant ...........................................................................................
23. What was the major or most important outcome (anticipated or not) to result from the ARC grant?

F-16
SECTION 5: PROJECT DATA COLLECTION STRATEGIES
24. Has this project received funding or support from any other federal agencies? Please include federal grants/administrative monies channeled through the state. (Circle only one.)
Yes................................................................... 1 (Continue with Q25) No.................................................................... 2 (Skip to Q26)
25. Below is a list of federal agencies that commonly provide funding and support to vocational education and
workforce training projects. For each federal agency listed (a through h), please answer the following questions.
Column A – Did this federal agency ever provide funding or support to your project? Circle 1 for
“Yes” and 2 for “No.” If you answered “Yes,” continue with Columns B and C. If you answered “No,” skip Columns B and C. Repeat for each agency.
Column B – Write in the name of the office or program that provided funding or support for your
project. Column C – Were you required to report any outcome data about participants? Circle 1 for “Yes” and
2 for “No.”
(A) (B) (C) Federal Agency
Yes No Name of office or program Yes No
a. Department of Education......... 1 2 1 2
b. Department of Labor ............... 1 2 1 2
c. Department of Health and Human Services....................... 1 2 1 2
d. Department of Commerce ....... 1 2 1 2
e. Department of Agriculture....... 1 2 1 2
f. Department of Justice .............. 1 2 1 2
g. Department of Housing and Urban Development................. 1 2 1 2
h. Other (specify) ____________ 1 2 1 2

F-17
26. Did your project collect any outcome data on project participants and or the overall community? (Circle only
one.)
Yes...................................................... 1
No....................................................... 2 27. Have any of the following factors hindered your ability to collect outcome data on the status of project
participants? (Circle all that apply.)
a. Did not encounter any obstacles.............................................................................................. 01
b. Lack of funding or staff........................................................................................................... 02
c. Lack of time ............................................................................................................................ 03
d. Lack of access to expertise in data collection and analysis ..................................................... 04
e. Difficulty of tracking participants after they have left the project........................................... 05
f. Other (specify) ____________________________________________________________ 06
CONTINUE WITH Q28 ON REVERSE SIDE

F-18
SECTION 6: CONTACT INFORMATION
28. Please provide the name, telephone number, e-mail address, and the most convenient days/times to reach the primary respondent for this survey. The information will be used only if it is necessary to clarify any of your responses. Please keep a copy of the completed questionnaire for your records.
Name Convenient days/times to reach you,
if necessary
Title
Day Time
Telephone (with area code) a.m.
p.m.
E-mail address a.m.
p.m.
a.m. p.m.
THANK YOU FOR ASSISTING US IN THIS SURVEY. YOUR TIME AND EFFORT ARE APPRECIATED.
Please return this questionnaire in the enclosed envelope or send to:
Westat TB 150F-ARC (742404) 1650 Research Boulevard Rockville, MD 20850
If you have any questions, please call Nicole Bartfai at 1-800-937-8281, ext. 3865

F-19
Appalachian Regional Commission
Survey of ARC-Funded Vocational Education and Workforce Training Projects Part 2: ARC-Related Outcomes
This survey has been authorized by the Appalachian Regional Commission. While you are not required to respond, your cooperation is needed to make the results of this survey comprehensive, accurate, and timely.
INSTRUCTIONS FOR COMPLETING THE SURVEY
The items contained in Part 2 are designed to obtain information about the extent to which your project was able to achieve the outcomes that you identified in your original proposal to the Appalachian Regional Commission during the 1990s. Please rely only on existing data to answer these questions. The same questions will be repeated for each of the objectives that you identified in your ARC proposal. In constructing these objectives, we relied upon documents (e.g., applications to ARC, project announcements) that were made available for this evaluation project. You will also be provided an opportunity to identify any other ARC-related outcomes that are not already listed in Part 2 of the survey. Please contact Nicole Bartfai (1-800-937-8281, ext. 3865) if you believe that any of these outcomes are not representative of what your ARC project was designed to achieve. We ask that the requested information be provided by the person who is most knowledgeable about the history and current status of the project. The name, contact information, and other descriptive information about the project appear below.
AFFIX LABEL HERE
If any of the above information is incorrect, please update directly on the label.
RETURN COMPLETED FORM BY FEBRUARY 22, 2001 TO:
ARC Evaluation Westat TB 150F 1650 Research Boulevard Rockville, Maryland 20850
IF YOU HAVE ANY QUESTIONS, CALL: Nicole Bartfai 1-800-937-8281, ext. 3865

F-20
1a. Were you able to achieve the following outcome that you identified in your original proposal to ARC? (Circle one.)
Outcome Yes No Unable to ascertain
The new equipment will serve 180 students annually.
1 2 3
1b. Which of the following data collection and analysis methods were used to assess whether this outcome had
been achieved? (Circle all that apply.)
a. Project administrative records (e.g., number of project completers)............................................................... 01
b. Employment and wage data (e.g., Unemployment Insurance Wage Record System) .................................... 02
c. Education data (e.g., secondary school graduation and dropout rates) ........................................................... 03
d. Community economic data (e.g., local unemployment rates) ......................................................................... 04
e. Public assistance (e.g., AFDC, TANF) caseload and benefit data .................................................................. 05
f. Number of persons who became certified or passed a test.............................................................................. 06
g. Pre/post test of participants’ skills/knowledge................................................................................................ 07
h. Conduct survey (e.g., of participants, former participants, employers) .......................................................... 08
i. Informal (anecdotal) conversations with participants/former participants/employers .................................... 09
j. Other (specify) ________________________________________________________________________ 10
1c. If you indicated “Yes” to Q1a, use the space below to describe any findings or results that illustrate your
project’s achievement of this outcome (e.g., “A survey of former participants found that 80 percent were employed within 6 months of the training sessions”).
If you indicated “No” to Q1a, use the space below to describe any factors that hindered your project’s ability to achieve the desired outcomes.
If you indicated “Unable to ascertain” to Q1a, use the space below to describe any factors that hindered your
ability to determine whether the outcome was achieved (e.g., “A low response rate on a follow-up survey of
former participants”).
_______________________________________________________________________________________ _______________________________________________________________________________________ _______________________________________________________________________________________ _______________________________________________________________________________________ _______________________________________________________________________________________

«Westat_ID» F-21
2a. Were you able to achieve the following outcome that you identified in your original proposal to ARC? (Circle one.)
Outcome Yes No Unable to ascertain
Economic development will be promoted in the Spartanburg, Cherokee, and Union Counties by providing training in skills most in demand by area business and industry.
1 2 3
2b. Which of the following data collection and analysis methods were used to assess whether this outcome had
been achieved? (Circle all that apply.)
a. Project administrative records (e.g., number of project completers)............................................................... 01
b. Employment and wage data (e.g., Unemployment Insurance Wage Record System) .................................... 02
c. Education data (e.g., secondary school graduation and dropout rates) ........................................................... 03
d. Community economic data (e.g., local unemployment rates) ......................................................................... 04
e. Public assistance (e.g., AFDC, TANF) caseload and benefit data .................................................................. 05
f. Number of persons who became certified or passed a test.............................................................................. 06
g. Pre/post test of participants’ skills/knowledge................................................................................................ 07
h. Conduct survey (e.g., of participants, former participants, employers) .......................................................... 08
i. Informal (anecdotal) conversations with participants/former participants/employers .................................... 09
j. Other (specify) ________________________________________________________________________ 10
2c. If you indicated “Yes” to Q2a, use the space below to describe any findings or results that illustrate your
project’s achievement of this outcome (e.g., “A survey of former participants found that 80 percent were employed within 6 months of the training sessions”).
If you indicated “No” to Q2a, use the space below to describe any factors that hindered your project’s ability to achieve the desired outcomes. If you indicated “Unable to ascertain” to Q2a, use the space below to describe any factors that hindered your
ability to determine whether the outcome was achieved (e.g., “A low response rate on a follow-up survey of
former participants”).
_______________________________________________________________________________________ _______________________________________________________________________________________ _______________________________________________________________________________________ _______________________________________________________________________________________ _______________________________________________________________________________________

F-22
3a. Were you able to achieve the following outcome that you identified in your original proposal to ARC? (Circle one.)
Outcome Yes No Unable to ascertain
1 2 3
3b. Which of the following data collection and analysis methods were used to assess whether this outcome had
been achieved? (Circle all that apply.)
a. Project administrative records (e.g., number of project completers)............................................................... 01
b. Employment and wage data (e.g., Unemployment Insurance Wage Record System) .................................... 02
c. Education data (e.g., secondary school graduation and dropout rates) ........................................................... 03
d. Community economic data (e.g., local unemployment rates) ......................................................................... 04
e. Public assistance (e.g., AFDC, TANF) caseload and benefit data .................................................................. 05
f. Number of persons who became certified or passed a test.............................................................................. 06
g. Pre/post test of participants’ skills/knowledge................................................................................................ 07
h. Conduct survey (e.g., of participants, former participants, employers) .......................................................... 08
i. Informal (anecdotal) conversations with participants/former participants/employers .................................... 09
j. Other (specify) ________________________________________________________________________ 10
3c. If you indicated “Yes” to Q3a, use the space below to describe any findings or results that illustrate your project’s
achievement of this outcome (e.g., “A survey of former participants found that 80 percent were employed within 6 months of the training sessions”).
If you indicated “No” to Q3a, use the space below to describe any factors that hindered your project’s ability to achieve the desired outcomes. If you indicated “Unable to ascertain” to Q3a, use the space below to describe any factors that hindered your
ability to determine whether the outcome was achieved (e.g., “A low response rate on a follow-up survey of
former participants”).
_____________________________________________________________________________________
_____________________________________________________________________________________
_____________________________________________________________________________________
_____________________________________________________________________________________
_____________________________________________________________________________________

«Westat_ID» F-23
4a. Were you able to achieve the following outcome that you identified in your original proposal to ARC? (Circle one.)
Outcome Yes No Unable to ascertain
1 2 3
4b. Which of the following data collection and analysis methods were used to assess whether this outcome had
been achieved? (Circle all that apply.)
a. Project administrative records (e.g., number of project completers)............................................................... 01
b. Employment and wage data (e.g., Unemployment Insurance Wage Record System) .................................... 02
c. Education data (e.g., secondary school graduation and dropout rates) ........................................................... 03
d. Community economic data (e.g., local unemployment rates) ......................................................................... 04
e. Public assistance (e.g., AFDC, TANF) caseload and benefit data .................................................................. 05
f. Number of persons who became certified or passed a test.............................................................................. 06
g. Pre/post test of participants’ skills/knowledge................................................................................................ 07
h. Conduct survey (e.g., of participants, former participants, employers) .......................................................... 08
i. Informal (anecdotal) conversations with participants/former participants/employers .................................... 09
j. Other (specify) ________________________________________________________________________ 10
4c. If you indicated “Yes” to Q4a, use the space below to describe any findings or results that illustrate your project’s
achievement of this outcome (e.g., “A survey of former participants found that 80 percent were employed within 6 months of the training sessions”).
If you indicated “No” to Q4a, use the space below to describe any factors that hindered your project’s ability to achieve the desired outcomes. If you indicated “Unable to ascertain” to Q4a, use the space below to describe any factors that hindered your
ability to determine whether the outcome was achieved (e.g., “A low response rate on a follow-up survey of
former participants”).
_______________________________________________________________________________________ _______________________________________________________________________________________ _______________________________________________________________________________________ _______________________________________________________________________________________
_____________________________________________________________________________________

F-24
5a. Were you able to achieve the following outcome that you identified in your original proposal to ARC? (Circle one.)
Outcome Yes No Unable to ascertain
1 2 3
5b. Which of the following data collection and analysis methods were used to assess whether this outcome had
been achieved? (Circle all that apply):
a. Project administrative records (e.g., number of project completers)............................................................... 01
b. Employment and wage data (e.g., Unemployment Insurance Wage Record System) .................................... 02
c. Education data (e.g., secondary school graduation and dropout rates) ........................................................... 03
d. Community economic data (e.g., local unemployment rates) ......................................................................... 04
e. Public assistance (e.g., AFDC, TANF) caseload and benefit data .................................................................. 05
f. Number of persons who became certified or passed a test.............................................................................. 06
g. Pre/post test of participants’ skills/knowledge................................................................................................ 07
h. Conduct survey (e.g., of participants, former participants, employers) .......................................................... 08
i. Informal (anecdotal) conversations with participants/former participants/employers .................................... 09
j. Other (specify) ________________________________________________________________________ 10
5c. If you indicated “Yes” to Q5a, use the space below to describe any findings or results that illustrate your project’s
achievement of this outcome (e.g., “A survey of former participants found that 80 percent were employed within 6 months of the training sessions”).
If you indicated “No” to Q5a, use the space below to describe any factors that hindered your project’s ability to achieve the desired outcomes.
If you indicated “Unable to ascertain” to Q5a, use the space below to describe any factors that hindered your
ability to determine whether the outcome was achieved (e.g., “A low response rate on a follow-up survey of
former participants”).
_______________________________________________________________________________________ _______________________________________________________________________________________ _______________________________________________________________________________________ _______________________________________________________________________________________ _______________________________________________________________________________________

«Westat_ID» F-25
6a. Were you able to achieve the following outcome that you identified in your original proposal to ARC? (Circle one.)
Outcome Yes No Unable to ascertain
1 2 3
6b. Which of the following data collection and analysis methods were used to assess whether this outcome had
been achieved? (Circle all that apply.)
a. Project administrative records (e.g., number of project completers)............................................................... 01
b. Employment and wage data (e.g., Unemployment Insurance Wage Record System) .................................... 02
c. Education data (e.g., secondary school graduation and dropout rates) ........................................................... 03
d. Community economic data (e.g., local unemployment rates) ......................................................................... 04
e. Public assistance (e.g., AFDC, TANF) caseload and benefit data .................................................................. 05
f. Number of persons who became certified or passed a test.............................................................................. 06
g. Pre/post test of participants’ skills/knowledge................................................................................................ 07
h. Conduct survey (e.g., of participants, former participants, employers) .......................................................... 08
i. Informal (anecdotal) conversations with participants/former participants/employers .................................... 09
j. Other (specify) ________________________________________________________________________ 10
6c. If you indicated “Yes” to Q6a, use the space below to describe any findings or results that illustrate your project’s
achievement of this outcome (e.g., “A survey of former participants found that 80 percent were employed within 6 months of the training sessions”).
If you indicated “No” to Q6a, use the space below to describe any factors that hindered your project’s ability to achieve the desired outcomes. If you indicated “Unable to ascertain” to Q6a, use the space below to describe any factors that hindered your
ability to determine whether the outcome was achieved (e.g., “A low response rate on a follow-up survey of
former participants”).
_______________________________________________________________________________________ _______________________________________________________________________________________
_______________________________________________________________________________________ _______________________________________________________________________________________ _______________________________________________________________________________________

F-26
7a. Were you able to achieve the following outcome that you identified in your original proposal to ARC? (Circle one.)
Outcome Yes No Unable to ascertain
1 2 3
7b. Which of the following data collection and analysis methods were used to assess whether this outcome had
been achieved? (Circle all that apply.)
a. Project administrative records (e.g., number of project completers)............................................................... 01
b. Employment and wage data (e.g., Unemployment Insurance Wage Record System) .................................... 02
c. Education data (e.g., secondary school graduation and dropout rates) ........................................................... 03
d. Community economic data (e.g., local unemployment rates) ......................................................................... 04
e. Public assistance (e.g., AFDC, TANF) caseload and benefit data .................................................................. 05
f. Number of persons who became certified or passed a test.............................................................................. 06
g. Pre/post test of participants’ skills/knowledge................................................................................................ 07
h. Conduct survey (e.g., of participants, former participants, employers) .......................................................... 08
i. Informal (anecdotal) conversations with participants/former participants/employers .................................... 09
j. Other (specify) ________________________________________________________________________ 10
7c. If you indicated “Yes” to Q7a, use the space below to describe any findings or results that illustrate your project’s
achievement of this outcome (e.g., “A survey of former participants found that 80 percent were employed within 6 months of the training sessions”).
If you indicated “No” to Q7a, use the space below to describe any factors that hindered your project’s ability to achieve the desired outcomes. If you indicated “Unable to ascertain” to Q7a, use the space below to describe any factors that hindered your
ability to determine whether the outcome was achieved (e.g., “A low response rate on a follow-up survey of
former participants”).
_______________________________________________________________________________________ _______________________________________________________________________________________ _______________________________________________________________________________________ _______________________________________________________________________________________
_____________________________________________________________________________________

«Westat_ID» F-27
8a. Were you able to achieve the following outcome that you identified in your original proposal to ARC? (Circle one.)
Outcome Yes No Unable to ascertain
1 2 3
8b. Which of the following data collection and analysis methods were used to assess whether this outcome had
been achieved? (Check all that apply.)
a. Project administrative records (e.g., number of project completers)............................................................... 01
b. Employment and wage data (e.g., Unemployment Insurance Wage Record System) .................................... 02
c. Education data (e.g., secondary school graduation and dropout rates) ........................................................... 03
d. Community economic data (e.g., local unemployment rates) ......................................................................... 04
e. Public assistance (e.g., AFDC, TANF) caseload and benefit data .................................................................. 05
f. Number of persons who became certified or passed a test.............................................................................. 06
g. Pre/post test of participants’ skills/knowledge................................................................................................ 07
h. Conduct survey (e.g., of participants, former participants, employers) .......................................................... 08
i. Informal (anecdotal) conversations with participants/former participants/employers .................................... 09
j. Other (specify) ________________________________________________________________________ 10
8c. If you indicated “Yes” to Q8a, use the space below to describe any findings or results that illustrate your project’s
achievement of this outcome (e.g., “A survey of former participants found that 80 percent were employed within 6 months of the training sessions”). If you indicated “No” to Q8a, use the space below to describe any factors that hindered your project’s ability to achieve the desired outcomes. If you indicated “Unable to ascertain” to Q8a, use the space below to describe any factors that hindered your
ability to determine whether the outcome was achieved (e.g., “A low response rate on a follow-up survey of
former participants”).
_______________________________________________________________________________________ _______________________________________________________________________________________ _______________________________________________________________________________________ _______________________________________________________________________________________ _______________________________________________________________________________________

F-28
9a. Were you able to achieve the following outcome that you identified in your original proposal to ARC? (Circle one.)
Outcome Yes No Unable to ascertain
1 2 3
9b. Which of the following data collection and analysis methods were used to assess whether this outcome had
been achieved? (Check all that apply.)
a. Project administrative records (e.g., number of project completers)............................................................... 01
b. Employment and wage data (e.g., Unemployment Insurance Wage Record System) .................................... 02
c. Education data (e.g., secondary school graduation and dropout rates) ........................................................... 03
d. Community economic data (e.g., local unemployment rates) ......................................................................... 04
e. Public assistance (e.g., AFDC, TANF) caseload and benefit data .................................................................. 05
f. Number of persons who became certified or passed a test.............................................................................. 06
g. Pre/post test of participants’ skills/knowledge................................................................................................ 07
h. Conduct survey (e.g., of participants, former participants, employers) .......................................................... 08
i. Informal (anecdotal) conversations with participants/former participants/employers .................................... 09
j. Other (specify) ________________________________________________________________________ 10
9c. If you indicated “Yes” to Q9a, use the space below to describe any findings or results that illustrate your project’s
achievement of this outcome (e.g., “A survey of former participants found that 80 percent were employed within 6 months of the training sessions”).
If you indicated “No” to Q9a, use the space below to describe any factors that hindered your project’s ability to achieve the desired outcomes. If you indicated “Unable to ascertain” to Q9a, use the space below to describe any factors that hindered your
ability to determine whether the outcome was achieved (e.g., “A low response rate on a follow-up survey of
former participants”).
_______________________________________________________________________________________ _______________________________________________________________________________________ _______________________________________________________________________________________ _______________________________________________________________________________________ _______________________________________________________________________________________

«Westat_ID» F-29
10a. Were you able to achieve the following outcome that you identified in your original proposal to ARC? (Circle one.)
Outcome Yes No Unable to ascertain
1 2 3
10b. Which of the following data collection and analysis methods were used to assess whether this outcome had
been achieved? (Circle all that apply.)
a. Project administrative records (e.g., number of project completers)............................................................... 01
b. Employment and wage data (e.g., Unemployment Insurance Wage Record System) .................................... 02
c. Education data (e.g., secondary school graduation and dropout rates) ........................................................... 03
d. Community economic data (e.g., local unemployment rates) ......................................................................... 04
e. Public assistance (e.g., AFDC, TANF) caseload and benefit data .................................................................. 05
f. Number of persons who became certified or passed a test.............................................................................. 06
g. Pre/post test of participants’ skills/knowledge................................................................................................ 07
h. Conduct survey (e.g., of participants, former participants, employers) .......................................................... 08
i. Informal (anecdotal) conversations with participants/former participants/employers .................................... 09
j. Other (specify) ________________________________________________________________________ 10
10c. If you indicated “Yes” to Q10a, use the space below to describe any findings or results that illustrate your project’s
achievement of this outcome (e.g., “A survey of former participants found that 80 percent were employed within 6 months of the training sessions”).
If you indicated “No” to Q10a, use the space below to describe any factors that hindered your project’s ability to achieve the desired outcomes.
If you indicated “Unable to ascertain” to Q10a, use the space below to describe any factors that hindered
your ability to determine whether the outcome was achieved (e.g., “A low response rate on a follow-up
survey of former participant”).
_______________________________________________________________________________________ _______________________________________________________________________________________ _______________________________________________________________________________________ _______________________________________________________________________________________ _______________________________________________________________________________________

F-30
A. Please use the space below to identify any additional outcomes that the ARC-funded portion of your project was designed to achieve. (You should copy this page if you need to provide information about two or more additional ARC-funded outcomes.)
Provide the following information about whether you were able to achieve this additional outcome.
Additional Outcome Yes No Unable to ascertain
1 2 3
B. Which of the following data collection and analysis methods were used to assess whether this outcome had
been achieved? (Circle all that apply.)
a. Project administrative records (e.g., number of project completers)............................................................... 01
b. Employment and wage data (e.g., Unemployment Insurance Wage Record System) .................................... 02
c. Education data (e.g., secondary school graduation and dropout rates) ........................................................... 03
d. Community economic data (e.g., local unemployment rates) ......................................................................... 04
e. Public assistance (e.g., AFDC, TANF) caseload and benefit data .................................................................. 05
f. Number of persons who became certified or passed a test.............................................................................. 06
g. Pre/post test of participants’ skills/knowledge................................................................................................ 07
h. Conduct survey (e.g., of participants, former participants, employers) .......................................................... 08
i. Informal (anecdotal) conversations with participants/former participants/employers .................................... 09
j. Other (specify) ________________________________________________________________________ 10
C. If you indicated “Yes” to QA, use the space below to describe any findings or results that illustrate your project’s
achievement of this outcome (e.g., “A survey of former participants found that 80 percent were employed within 6 months of the training sessions”).
If you indicated “No” to QA, use the space below to describe any factors that hindered your project’s ability to achieve the desired outcomes.
If you indicated “Unable to ascertain” to QA, use the space below to describe any factors that
hindered your ability to determine whether the outcome was achieved (e.g., “A low response rate on a follow-up
survey of former participants”).
_____________________________________________________________________________________
_____________________________________________________________________________________
_____________________________________________________________________________________
_____________________________________________________________________________________

G-1
Appendix G
Cohort 2
Survey of ARC-Funded Vocational Education and Workforce Training Projects

G-2

G-3
Appalachian Regional Commission
Survey of ARC-Funded Vocational Education and Workforce Training Projects
This survey has been authorized by the Appalachian Regional Commission. While you are not required to respond, your cooperation is needed to make the results of this survey comprehensive, accurate, and timely.
INSTRUCTIONS FOR COMPLETING THE SURVEY
The Appalachian Regional Commission (ARC) is conducting a survey of its vocational education and workforce training projects funded since 1990. The purpose is to evaluate the impact of its grants and to identify ways in which the program might be improved. Your responses to these items will be used to assess the extent to which the ARC-funded projects in the study sample were able to achieve their proposed outcomes. We ask that the requested information be provided by the person who is most knowledgeable about the history and current status of the project. The name, contact information, and other descriptive information about the project appear below.
AFFIX LABEL HERE
If any of the above information is incorrect, please update directly on the label.
RETURN COMPLETED FORM BY FEBRUARY 22, 2001 TO:
ARC Evaluation Westat TB 150F 1650 Research Boulevard Rockville, Maryland 20850
IF YOU HAVE ANY QUESTIONS, CALL: Nicole Bartfai 1-800-937-8281, ext. 3865

G-4
SECTION 1: ABOUT THE ARC GRANT
1. From the list below, please indicate the category that BEST describes the grant recipient organization. (Circle only one.)
Educational Organizations
Comprehensive middle or high school ................................................................................... 01
Area vocational school/vocational high school ...................................................................... 02
Technical college or institution .............................................................................................. 03
Comprehensive community college (degree-granting) .......................................................... 04
Four-year postsecondary institution ....................................................................................... 05
State education agency........................................................................................................... 06
Local school district/agency................................................................................................... 07
Other education entity (specify) ______________________________________________ 08
Government Organizations
State government agency ....................................................................................................... 09
County government agency.................................................................................................... 10
City or municipal government agency ................................................................................... 11
Other government entity (specify) ____________________________________________ 12
Other Organizations
Social service agency ............................................................................................................. 13
Community development organization .................................................................................. 14
Health care organization ........................................................................................................ 15
Consortia of organizations ..................................................................................................... 16
Other community entity (specify) _____________________________________________ 17 2. During what year(s) did you receive ARC funds for this project? (Circle all that apply.)
a. Prior to 1990 ............................................... 01 b. 1990 ............................................................ 02 c. 1991 ............................................................ 03 d. 1992 ............................................................ 04 e. 1993 ............................................................ 05 f. 1994 ............................................................ 06 g. 1995 ............................................................ 07 h. 1996 ............................................................ 08 i. 1997 ............................................................ 09 j. 1998 ............................................................ 10 k. 1999 ............................................................ 11 l. 2000 ............................................................ 12

G-5
SECTION 2: ABOUT THE OVERALL PROJECT
3. Which of the following statements BEST applies to the participants (e.g., students/trainees/workers) in your project? (Circle only one.)
The majority of participants had never held a full-time job (e.g., students, displaced homemakers) . 1
The majority of participants were full-time employees or had previously been employed full time.. 2
Combination of the first two............................................................................................................... 3 4. Which of the following BEST describes the age range of participants in this project? (Circle only one.)
Primarily youth (18 or younger) ........................................................................................ 1 Primarily adults.................................................................................................................. 2 Both youth and adults ........................................................................................................ 3
5. Which one of the following BEST describes the geographic distribution of the individuals expected to benefit
from this project? (Circle only one.)
In a single city or town ....................................................................................... 01 In a single county................................................................................................ 02 In a single school district .................................................................................... 03 In a major metropolitan area (i.e., a central city and its adjacent counties) ........ 04 In 2 or more counties or school districts within a single state (not associated with a common metropolitan area) ..................................................................... 05 In all counties within a single state ..................................................................... 06 In 2 or more states............................................................................................... 07 Other area definition not listed above (specify) ________________________ 08
6. Indicate whether your project was designed to provide services, resources, or other assistance to any
of the following groups. (Circle all that apply.)
a. Extreme poverty .................................................................................................. 01 b. Illiterate................................................................................................................ 02 c. Limited English speaking .................................................................................... 03 d. Disabled............................................................................................................... 04 e. Geographically isolated/rural............................................................................... 05 f. Unemployed/underemployed............................................................................... 06 g. Underrepresented minorities................................................................................ 07 h. Migrant workers/migrant students ....................................................................... 08 i. Public assistance recipients.................................................................................. 09 j. School dropouts ................................................................................................... 10 k. Other group not listed (specify) _______________________________ 11

G-6
7. Listed below are immediate and long-term goals commonly anticipated by vocational education and workforce training projects. Please indicate whether each of the following was viewed as
an immediate goal that project participants would be expected to achieve at the time they complete
your project, a long-term goal that project participants would ultimately (i.e., after 1-3 years) be expected to
achieve as a result of their participation in your project, or
not a goal of your project.
Circle one response for each line.
Goal Immediate goal Long-term goal Not a project goal
Obtain skills
a. Provide individuals with basic skills (e.g., literacy)............................................................. 1 2 3
b. Provide individuals with academic skills.......... 1 2 3
c. Provide individuals with vocational and technical skills ..................................................
1
2
3
d. Provide individuals with employability skills (e.g., resume writing)........................................
1
2
3
e. Help individuals obtain a high school diploma, GED, or equivalent ...........................................
1
2
3
f. Help individuals obtain a degree/credential...... 1 2 3
Individual employment gains
g. Help individuals who have never held full-time employment gain initial full-time employment ......................................................
1
2
3
h. Help employed individuals maintain current employment ......................................................
1
2
3
i. Help employed individuals increase job-related responsibilities, gain promotion, and/or earn increased wages ........................................
1
2
3
j. Help underemployed or dislocated workers obtain new employment....................................
1
2
3
k. Retrain workers in another field/help employed individuals obtain new employment ...................................................... 1 2 3
Community impacts
l. Help local businesses........................................ 1 2 3
m. Increase the economic viability of the community........................................................
1
2
3

G-7
8. Below is a list of activities that are commonly conducted by vocational education and workforce training projects. For each type of activity listed (a through i), please answer the following questions. Column A – Was this activity conducted as part of your project? Circle 1 for “Yes” and 2 for “No.” If you
answered “Yes,” continue with Column B. If you answered “No,” skip Column B. Repeat this for each activity.
Column B – Did ARC contribute funding for this activity? Circle 1 for “Yes” and 2 for “No.”
(A) (B) Activity Yes No Yes No
a. Purchase, rent, or lease any equipment (e.g., industrial equipment, computer hardware or software, medical equipment) ..............................
1
2
1
2
b. Support the development, construction, expansion, or leasing of a physical plant..............
1
2
1
2
c. Conduct training activities (e.g., adult basic education, academic training, vocational/technical training, on-the-job training, apprenticeships) .....................................
1
2
1
2
d. Provide training to project staff............................ 1 2 1 2
e. Develop/purchase training materials .................... 1 2 1 2
f. Perform community outreach (e.g., community partnerships) ......................................................... 1 2 1 2
g. Provide job assistance and career counseling....... 1 2 1 2
h. Provide social support services (e.g., emotional/psychological counseling) ................... 1 2 1 2
i. Other (specify)___________________________ 1 2 1 2

G-8
SECTION 3: PROJECT DATA COLLECTION STRATEGIES
9. Has this project received funding or support from any other federal agencies since receiving the ARC grant? Please include federal grants/administrative monies channeled through the state. (Circle only one.)
Yes................................................................... 1 (Continue with Q10) No .................................................................... 2 (Skip to Q11)
10. Below is a list of federal agencies that commonly administer or provide funding and support to vocational
education and workforce training projects. For each federal agency listed (a through h), please answer the following questions.
Column A – Did this federal agency ever provide funding or support to your project? Circle 1 for
“Yes” and 2 for “No.” If you answered “Yes,” continue with Columns B and C. If you answered “No,” skip Columns B and C. Repeat for each agency.
Column B – Write in the name of the office or program that provided funding or support for your project. Column C – Were you required to report any outcome data about participants? Circle 1 for “Yes” and 2 for “No.”
(A) (B) (C) Federal Agency
Yes No Name of office or program Yes No
i. Department of Education......... 1 2 1 2
j. Department of Labor ............... 1 2 1 2
k. Department of Health and Human Services....................... 1 2 1 2
l. Department of Commerce ....... 1 2 1 2
m. Department of Agriculture....... 1 2 1 2
n. Department of Justice .............. 1 2 1 2
o. Department of Housing and Urban Development................. 1 2 1 2
p. Other (specify) ____________ 1 2 1 2

G-9
11. Did (or will) your project collect any outcome data on project participants and/or the overall community?
(Circle only one.)
Yes, we have already begun collecting outcome data............. 1 (Continue with Q12)
Yes, we will eventually be collecting outcome data...... 2 (Continue with Q12)
No................................................................................... 3 (Skip to Q16) 12. What outcome data did (or will) your project collect about project participants and/or the overall community?
(Circle all that apply.)
Educational Status of Participants a. Increase in knowledge or skills ..................................................................................................... 01
b. Completion of a secondary or postsecondary skills training program........................................... 02
c. Attainment of high school diploma or a GED............................................................................... 03
d. Attainment of a technical or vocational degree/credential/certificate ........................................... 04
e. Entrance into a postsecondary 2-year or 4-year college or university........................................... 05
f. Attainment of an associate’s, bachelor’s, or higher degree ........................................................... 06
g. Other (specify) _______________________________________________________________ 07
Employment Status of Participants
h. Job placements .............................................................................................................................. 08
i. Job retention .................................................................................................................................. 09
j. Job promotions .............................................................................................................................. 10
k. Wages/earnings ............................................................................................................................. 11
l. Employer-provided health care benefits........................................................................................ 12
m. Public assistance (e.g., AFDC, TANF) case closures or grant reductions due to increased earnings ......................................................................................................................................... 13
n. Other (specify) _______________________________________________________________ 14
Community Impacts
o. Number of businesses served by the project.................................................................................. 15
p. Number of businesses hiring project participants.......................................................................... 16
q. Other (specify) _______________________________________________________________ 17

G-10
13. Which of the following data collection and analysis methods were (or will be) used to collect outcome data on
project participants and/or the overall community? (Circle all that apply.)
a. Analysis of project administrative records .................................................................................... 01
b. Analysis of employment and wage data (e.g., Unemployment Insurance Wage Record System).......................................................................................................................................... 02
c. Analysis of education data (e.g., graduation and dropout rates).................................................... 03
d. Analysis of community economic data (e.g., local unemployment rates) ..................................... 04
e. Analysis of public assistance (e.g., AFDC, TANF) caseload and benefit data.............................. 05
f. Analysis of participants’ certification or test records .................................................................... 06
g. Pre/post tests of participants’ aptitudes/knowledge/skills ............................................................. 07
h. Mail survey of participants/former participants ............................................................................ 08
i. Telephone survey of participants/former participants ................................................................... 09
j. Informal conversations with participants/former participants ....................................................... 10
k. Mail/telephone survey of local employers..................................................................................... 11
l. Other (specify) _______________________________________________________________ 12 14. When did (or will) you collect outcome data on the status of project participants and/or the overall
community? (Check all that apply.)
a. At the end of their participation in the project............................................................................... 1
b. 1-6 months after they left (or leave) the project ............................................................................ 2
c. 7-12 months after they left (or leave) the project ............................................................................................................................................. 3
d. 13-24 months after they left (or leave) the project ........................................................................ 4
e. More than 24 months after they left (or leave) the project ............................................................ 5
15. If you have already collected outcome data (circled “1” in Q11), please use the space below to briefly describe some of the findings that have emerged.

G-11
16. Have any of the following factors hindered your ability to collect outcome data on the status of project participants and/or the overall community? (Circle all that apply.)
g. Did not encounter any obstacles..................................................................... 1 (Skip to Q18)
h. Lack of funding or staff.................................................................................. 2
i. Lack of time ................................................................................................... 3
j. Lack of access to expertise in data collection and analysis ............................ 4
k. Difficulty of tracking participants after they have left the project.................. 5
l. Other (specify) _______________________________________________ 6 17. If you have encountered obstacles that have hindered data collection (answered any options b through f in
Q16), please use the space below to discuss how you have or plan to overcome these obstacles.

G-12
SECTION 4: CONTACT INFORMATION
18. Please provide the name, telephone number, e-mail address, and the most convenient days/times to reach the primary respondent for this survey. The information will be used only if it is necessary to clarify any of your responses. Please keep a copy of the completed questionnaire for your records.
Name Convenient days/times to reach you,
if necessary
Title
Day Time
Telephone (with area code) a.m.
p.m.
E-mail address a.m.
p.m.
a.m. p.m.
THANK YOU FOR ASSISTING US IN THIS SURVEY. YOUR TIME AND EFFORT ARE APPRECIATED.
Please return this questionnaire in the enclosed envelope or send to:
Westat TB 150F-ARC (742404) 1650 Research Boulevard Rockville, MD 20850
If you have any questions, please call Nicole Bartfai at 1-800-937-8281, ext. 3865