evaluation of reforms to the act specialist homelessness ... · final report evaluation of reforms...
TRANSCRIPT
Evaluation of reforms to the ACT Specialist Homelessness Service system
Evaluation report
ACT Community Services Directorate
May 2015
Final report Evaluation of reforms to the ACT Specialist Homelessness Service system
ARTD Pty Ltd ABN 75 003 701 764 Tel 02 9373 9900 Fax 02 9373 9998
Level 4, 352 Kent St Sydney PO Box 1167 Queen Victoria Building NSW 1230 Australia
ii
Acknowledgments
This work was completed with the assistance of Anne Quinn and the Social Housing and Homelessness Services section of the Community Services Directorate.
We would also like to thank the many key informants from the ACT Specialist Homelessness Services (SHS) sector and partner organisations. We thank them for their time and insights and trust that their views are adequately represented in this report.
ARTD Consultancy team
Florent Gomez-Bonnet Francis Matthew-Simmons Kerry Hart Charlie Kingsford Andrew Hawkins
Ethics approval
Our methods for contacting ACT SHS service users as part of the case studies were approved by the Bellberry Human Research Ethics Committee (protocol 2015-01-041).

Final report Evaluation of reforms to the ACT Specialist Homelessness Service system
1
Contents
Tables and figures ........................................................................................................................... 3 List of tables .......................................................................................................................................... 3 List of figures ........................................................................................................................................ 5
Abbreviations and acronyms ...................................................................................................... 7
Executive summary ......................................................................................................................... 8 Reforms to the ACT Specialist Homelessness Service system ........................................... 8 Evaluation of the reforms ................................................................................................................ 8 Service user profile ............................................................................................................................. 9 Outcomes ............................................................................................................................................. 10 Integration of the sector ................................................................................................................ 11 Gaps in service delivery ................................................................................................................. 11 Conclusion ........................................................................................................................................... 12
1. Introduction ......................................................................................................................... 13 1.1 This report ............................................................................................................................... 13 1.2 The ACT Specialist Homelessness Service system between 2009 and
2014 ........................................................................................................................................... 13 1.3 Purpose of the evaluation .................................................................................................. 19 1.4 Evaluation methods ............................................................................................................. 21 1.5 Confidence in the findings ................................................................................................. 24
2. System outcomes ................................................................................................................ 30 2.1 The number of service users increased over the period ....................................... 30 2.2 Service users characteristics and reasons to seek assistance remained
similar over the period ....................................................................................................... 34 2.3 Service users are less likely to exit SHS services into stable housing .............. 39
3. Service delivery outcomes .............................................................................................. 48 3.1 Service users’ needs and expectations are still high ............................................... 48 3.2 ACT SHS provide a high level of support with some new services to
respond to emerging needs ............................................................................................... 49 3.3 Non-housing outcomes seem to have improved over the period ...................... 55
4. Sector outcomes .................................................................................................................. 60 4.1 The centralised intake model seems to be operating as intended, but
there is room for refinement ............................................................................................ 60 4.2 Collaboration has improved in the sector over the 2009-2014 period ........... 66 4.3 Gaps in service delivery relate primarily to service intensity,
accommodation options, and workforce development ......................................... 72
5. Conclusion and implications .......................................................................................... 76 5.1 Overall conclusion ................................................................................................................ 76 5.2 Implications of the evaluation for future policy directions .................................. 77

Final report Evaluation of reforms to the ACT Specialist Homelessness Service system
2
Appendix 1. Detailed methods ........................................................................................... 81 A1.1. Qualitative analysis of six-monthly service provider reports ............................. 81 A3.1. Online survey of SHS providers ....................................................................................... 82 A3.2. Online survey of partner organisations ....................................................................... 83 A3.3. Case studies ............................................................................................................................. 84 A3.4. Quantitative analysis of SHS data ................................................................................... 88
Appendix 2. Results from the SHS providers online survey .................................... 90
Appendix 3. Results from the partner organisations online survey .................. 104

Final report Evaluation of reforms to the ACT Specialist Homelessness Service system
3
Tables and figures
List of tables
Table 1. Key evaluation questions .................................................................................................................... 19
Table 2. Overview of evaluation methods ..................................................................................................... 22
Table 3. Limitations to SAAP/SHSC data and mitigation strategies ................................................... 25
Table 4. Unmet demand, 2011–12 to 2013–14 ........................................................................................... 31
Table 5. Number and reasons for unmet request for assistance, Centralised Intake Service, 2012-13 and 2013-14 .......................................................................................................... 32
Table 6. Summary of service users’ key demographic characteristics, by financial year, 2007–08 to 2013–14 ............................................................................................................................. 37
Table 7. Clients with accommodation provided as % of need identified in ACT compared to Australia, 2011-12 to 2013-14 .............................................................................. 40
Box 1. Case study: Aboriginal service user ................................................................................................ 42
Table 8. Repeat homelessness in the ACT compared to Australia, 2011–12 to 2013–14 ......... 52
Box 2. Case study: reform of the youth homelessness services ........................................................ 54
Box 3. How the centralised intake model is implemented in the ACT ........................................... 61
Box 4. Case study: Rough sleeping service user ...................................................................................... 71
Table 9. Overview of case studies focus and methods ............................................................................. 86
Table 10. Number and proportion of support periods without a valid Client ID, by financial year ............................................................................................................................................ 89
Table 11. Response rate to the SHS provider online survey .................................................................... 90
Table 12. Q1. What is your role in the organisation? .................................................................................. 90
Table 13. Q2. How long have you been working in the SHS sector in the ACT? ............................... 90
Table 14. Q3. Which of the following are core services delivered by your organisation? ........... 91
Table 15. Q4. How many staff with direct service user contact do you have now? (Funded Staff) ........................................................................................................................................................ 91
Table 16. Q4. How many staff with direct service user contact do you have now? (Volunteer Staff) ...................................................................................................................................... 91
Table 17. Q5. How many staff did you have with direct service user contact at 1 January 2009? (Funded Staff) ............................................................................................................................. 92

Final report Evaluation of reforms to the ACT Specialist Homelessness Service system
4
Table 18. Q5. How many staff did you have with direct service user contact at 1 January 2009? (Volunteer Staff) ........................................................................................................................ 92
Table 19. Q6. Of those current staff with direct service user contact, how many have joined your organisation since 1 January 2009? (Funded Staff) ......................................... 92
Table 20. Q6. Of those current staff with direct service user contact, how many have joined your organisation since 1 January 2009? (Volunteer Staff) .................................... 93
Table 21. Q9. What proportion of your new service users would you estimate come through the centralised intake service? ........................................................................................ 93
Table 22. Q12. The centralised intake model ................................................................................................. 94
Table 23. Q13. Which of the following cohorts does your service target as part of its involvement in the SHS system? ...................................................................................................... 95
Table 24. Q14. In terms of accessing private rental housing, what do you see as the main barriers, if any, for service users to enter and sustain private rental housing? What could help within the scope of the SHS system? ............................................................ 95
Table 25. Q16. For each of the following agencies, organisations or services, please indicate the degree of cooperation with your organisation. Observed Integration. ................................................................................................................................................ 96
Table 26. Q16. For each of the following agencies, organisations or services, please indicate the degree of cooperation with your organisation. Expected integration. ................................................................................................................................................ 98
Table 27. Q17. Could you please specify how you feel cooperation has changed with each organisation since 2008? ................................................................................................................. 100
Table 28. Q18. Over the last six years, how would you describe any change in housing outcomes for service users in the ACT? ..................................................................................... 102
Table 29. Q19. Over the last six years, how would you describe any change in non-housing outcomes for service users in the ACT? .................................................................... 102
Table 30. Q20. Over the last six years, how would you describe any change in the way services are working together in the ACT SHS system? ...................................................... 103
Table 31. Response rate to the partner online survey ............................................................................. 104
Table 32. Q1. Of the services that your organisation provides which of the services do you sometimes provide to SHS service users? ........................................................................ 104
Table 33. Q2. How long have you been working in the SHS sector in the ACT? ............................ 105
Table 34. Q5. My service targets the following cohort ............................................................................. 106
Table 35. Q6. For each of the following agencies, organisations or services, please indicate the degree of cooperation with your organisation. Observed integration. ............................................................................................................................................. 107

Final report Evaluation of reforms to the ACT Specialist Homelessness Service system
5
Table 36. Q6. For each of the following agencies, organisations or services, please indicate the degree of cooperation with your organisation Expected integration. ............................................................................................................................................. 107
Table 37. Q7. Could you please specify how you feel cooperation has changed with each organisation since 2008? ................................................................................................................. 108
Table 38. Q8. Over the last six years, how would you describe any change in housing outcomes for service users in the ACT? ..................................................................................... 109
Table 39. Q9. Over the last six years, how would you describe any change in non-housing outcomes for service users in the ACT? ..................................................................................... 109
Table 40. Q10. Over the last six years, how would you describe any change in the way services are working together in the ACT SHS system? ...................................................... 110
List of figures
Figure 1. Timeline of the 2009-2014 reforms to the ACT Specialist Homelessness Service system ........................................................................................................................................................ 18
Figure 2. Number of service users and funding, 2007-2008 to 2013-14 ........................................... 33
Figure 3. Number of service users and staffing, 2007–08 to 2013–14 ............................................... 34
Figure 4. Distribution of SHS service users by age group, 2007–08 to 2013–14 ............................ 36
Figure 5. Main reasons for seeking assistance in ACT compared to Australia, 2011–12 to 2013–14 ..................................................................................................................................................... 38
Figure 6. Need for and provision of accommodation, 2007–08 to 2013–14 .................................... 39
Figure 7. Number of support periods (accommodation and non-accommodation), 2007-08 to 2013-14 .............................................................................................................................. 41
Figure 8. Service users’ housing outcomes, 2008–09 and 2013–14 .................................................... 44
Figure 9. Most common housing situation after support in ACT compared to Australia, 2011–12 to 2013–14 ............................................................................................................................. 45
Figure 10. SHS providers’ perception of changes in housing outcomes ................................................ 46
Figure 11. Mean length of closed support periods in ACT compared to Australia, 2007–08 to 2013–14 ................................................................................................................................................ 50
Figure 12. Proportion of support periods providing ‘intensive support’, 2007-08 to 2013-14 ...................................................................................................................................................... 51
Figure 13. Achievement of case management goals in the ACT compared to Australia, 2011–12 to 2013–14 ............................................................................................................................. 56
Figure 14. Service users’ employment outcomes, 2008–09 and 2013–14 ........................................... 57
Figure 15. Education outcomes for young service users, 2007–08 to 2013–14 ................................ 58

Final report Evaluation of reforms to the ACT Specialist Homelessness Service system
6
Figure 16. SHS providers’ perception of changes in non-housing outcomes ...................................... 59
Figure 17. Self-reported proportion of clients referred from the Centralised Intake Service (excluding services providing only non-accommodation support), n=18 services ....................................................................................................................................................... 62
Figure 18. Number of CIS service users waiting for accommodation and average waiting time, by level of needs (priority), July 2013 to June 2014..................................................... 63
Figure 19. SHS providers’ feedback about the Centralised Intake Service .......................................... 65
Figure 20. SHS providers’ perception of changes in the way services are working together ...... 67
Figure 21. Self-reported observed and desired level of cooperation with other services ............. 68
Figure 22. Self-reported change in cooperation with other services ..................................................... 69

Final report Evaluation of reforms to the ACT Specialist Homelessness Service system
7
Abbreviations and acronyms
ABS Australian Bureau of Statistics
ACT Australian Capital Territory
AIHW Australian Institute of Health and Welfare
CALD Culturally and Linguistically Diverse
CIS Centralised Intake Service
COAG Council of Australian Governments
CSD ACT Community Services Directorate
CURF Confidentialised Unit Record Files
DCR Daily Capacity Reporter
HACS ACT Housing and Community Services
HREC Human Research Ethics Committee
NAHA National Affordable Housing Agreement
NDIS National Disability Insurance Scheme
NFP Not for profit
NPAH National Partnership Agreement on Homelessness
SAAP Supported Accommodation Assistance Program
SHIP Specialist Homelessness Information Platform
SHOR Specialist Homelessness Online Reporting
SHSC Specialist Homelessness Service Collection
SLK Statistical Linkage Key
Final report Evaluation of reforms to the ACT Specialist Homelessness Service system
8
Executive summary
This report provides an evaluation of reforms to the ACT Specialist Homelessness Service (SHS) system between 2009 and 2014. It identifies trends and gaps in service delivery and implications for policy.
Reforms to the ACT Specialist Homelessness Service system
In 2008, the National White Paper on Homelessness, The Road Home, outlined reform priorities for the SHS system. A key focus was better connected services and an integration of homelessness services with mainstream services. In line with these priorities the ACT Government released a discussion paper in late 2009 titled the Road Map that outlined key reforms for homelessness services in the ACT. As a result of the subsequent consultation, the ACT reform directions were identified as
a shift in the provision of support from a crisis accommodation response to a ‘support in place’ model
rebalancing funding over time from accommodation based-support to outreach and preventative approaches, with a move towards ‘tenure neutral’ supports
maintenance of a network of crisis accommodation places to focus on people requiring a mix of accommodation and support, immediate shelter and those at risk of violence
move toward a ‘housing first’ approach, wherever practicable streamlining access to services and housing through the implementation of a central
access point (FirstPoint) assertive engagement and persistent support for rough sleepers, hard to engage
groups and vulnerable Canberrans sustaining tenancies to prevent repeat cycles of homelessness social inclusion – building links to economic and social participation.1
Evaluation of the reforms
The evaluation of the ACT reforms was conducted between November 2014 and May 2015. It addressed 21 evaluation questions spread across the three outcome areas of the recently developed SHS Outcomes Reporting Framework. These are system outcomes, service delivery outcomes and sector outcomes.
1 Modernising Youth Housing and Homelessness Services in the ACT: Discussion Paper, Housing ACT, 2010

Final report Evaluation of reforms to the ACT Specialist Homelessness Service system
9
The evaluation used a mixed-methods approach and drew on the following sources of evidence to synthesise answers to evaluation questions:
SHS service users’ data provided by the Australian Institute of Health and Welfare (AIHW): SAAP CURF data for 2007-08, 2008-09, 2009-10 and 2010-11, SHS CURF data for 2011-12, 2012-13 and 2013-14
An online survey of SHS services (n=51 respondents) An online survey of partner organisations nominated by SHS respondents (n=30
respondents) Six-monthly service provider reports (n = 40 reports covering 44 out of 47 services
for the period January-June 2014) Five case studies each exploring an issue of key interest. These included interviews
with service providers (n=17), interviews with clients (n=4), review of relevant documentation and case file analysis.
Consultation and a workshop with service providers. Evaluation findings are based on the evidence that can be obtained from the best available data—the key limitation was the move from SAAP to SHS data collection system in July 2011 which limits comparisons across the entire reform period of 2009-14.
Service user profile
The number of service users accessing the SHS system is estimated to have increased by 65 per cent from 2,233 in 2008-09 to 3,685 in 2013-14. The number of support periods is estimated to have increased by 55 per cent from 2,662 in 2008-09 to 4,129 in 2013-14. The majority of this increase in support periods has been due to an increase in non-accommodation support periods—from 1,541 to 2,811 support periods. These figures are estimates based on analysis of the different data in SAAP and SHS data systems. In the last three years with no changes to data collection systems there has been a 13 per cent increase in the number of service users from 2011-12 to 2013-14.
At the same time, the number of providers declined from 31 to 29, with a small increase in sector wide staffing (up 14%) and in a context of decreased Commonwealth funding. The Commonwealth funding shortfall was absorbed by the ACT Government and has only begun to be passed on to the sector since 2013.
The profile of service users has not changed substantially over the reform period—there is a slight shift towards older clients and high needs service users. Young people aged 24 and under still account for about one third (31%) of service users and the absolute numbers of young people have increased, but they have decreased in proportion to older age groups, such that those 45 and over now make up 17 per cent of service users (up from 11%).
Increasingly service users accessing SHS accommodation supports are more likely to be vulnerable with higher needs and poor housing situations. The proportion of service users with high needs has increased in both absolute and proportional terms, and now

Final report Evaluation of reforms to the ACT Specialist Homelessness Service system
10
account for 35 per cent of service users (up from 31%). The proportion of service users recorded as having ‘no tenure/ marginal renter’ on entry to the sector in 2008-09 was 8 per cent but has increased to almost one in three (32%).
Outcomes
Understanding housing outcomes achieved for this increased pool of higher needs users during the reform period is more complex. On the one hand, repeat homelessness amongst services users—measured by the AIHW as people moving in and out of homelessness—reduced from 11 per cent (in 2011-12) to 8 per cent (in 2013-14). On the other hand, proportionally fewer service users are exiting the SHS sector into social housing or private rental (49% in 2013-14 down from 67% in 2008-09) and there are more exits into housing situations recorded as ‘no tenure/ marginal renter’ (17% in 2013-14, up from 3% in 2008-09). National data shows that the ACT has a higher proportion of service users exiting into social housing: 45 per cent compared to 21 per cent nationally in 2013-14.
These statistics are corroborated by the views of service providers and partner agencies, 45 per cent of whom perceived that housing outcomes had declined over the period (20% thought they were unchanged, and 35% that they had improved). A concern of service providers was that this may be related to the intensity of services they could provide. However, on one measure of service intensity, the duration of support has remained high in the ACT with152 days average length of closed support periods in 2013-14 compared to 121 in 2007-08 and 162 in 2008-09. At the same time, there has been an increase in the average number of non-accommodation support periods from 1,541 (0.7 per client) in 2008-09 to 2,811 (0.8 per client) in 2013-14—another measure of intensity. National comparison shows that the ACT had consistently much higher duration of overall support (average length of closed support period) and accommodation support (average number of nights of accommodation by client) than national levels over the 2009-2014 period. A logistic regression analysis controlling for initial circumstances of service users shows that number of accommodation nights is predictive of good outcomes, whereas intensity as measured by numbers of supports is not. Those who experienced a longer than average duration in accommodation support were 4.4 times as likely to achieve stable accommodation on exit than other clients, all other things being equal.
Non-housing related outcomes have generally improved over the reform period. Most significantly in employment, where the proportion of service users exiting the system with employment doubled over the reform period—22 per cent were employed on exit in 2008-09 (13% on entry). This increased to 34 per cent employed on exit in 2013-14 (18% on entry)—an increase in employment status of 16 percentage points over the reform period. Of those service users with case management plans, 84 per cent achieved some of their goals. These results are substantially better than the outcomes achieved in other jurisdictions of Australia. These improvements are corroborated by the views of service providers on non-housing outcomes (44% felt these outcomes had improved,

Final report Evaluation of reforms to the ACT Specialist Homelessness Service system
11
22% unchanged, 33% worsened) and partner agencies (45% felt these had improved, 35% unchanged, 20% worsened).
Integration of the sector
As a system, the sector is increasingly integrated. The highest levels of observed cooperation were with Housing ACT and other SHS providers. The largest disparity between observed and preferred cooperation leaving room for improvement to maximise service user’s outcomes was for Aboriginal and Torres Strait Islander services (although the level of cooperation is already reported to be higher than for many other services), disability services and employment assistance services. Cooperation has improved across the collaboration spectrum across all 20 organisation types that were considered by the evaluation. The service type that had improved the most was Aboriginal and Torres Strait Islander services—where 64 per cent of SHS providers felt integration had improved. There was a similar pattern of improved collaboration with refugee/ migration services, Centrelink, Housing ACT and the Centralised Intake Service. The main form of collaboration in the sector is informal or through formal agreements, case coordination or attendance at forums. Increased collaboration was in part a result of the work of Joint Pathways.
One of the major reforms to the sector was the introduction of a Centralised Intake Service (CIS). This has led to increased prioritisation of service users based on need and is recognised to have led to greater equity in service delivery. The CIS has faced some initial resistance from some services and is not currently being used by all service providers: only around half (47%) of all service users went through the CIS in 2013-14 and 17 per cent of services required to go through the CIS (excluding those providing only non-accommodation support) reported to have less than 20 per cent of their clients actually coming from the CIS. Some SHS providers reported issues with the responsiveness of the system in terms of notification of vacancies and operating hours limited to business hours. With the CIS, services have fewer opportunities for collaboration amongst front line staff, as the CIS removes the need for services to spend time communicating amongst themselves to identify supports for service users. While this reduction in initial intake tasks may have freed up time for services to dedicate to support provision, some services pointed out that it led to less contact with other services, in particular at the frontline staff level.
Gaps in service delivery
The gap most commonly identified by service providers was the inability to provide the desired level of service intensity—related in part to funding levels and increases in the number and complexity of service users. However, the ACT still has the longest duration of support in general, and of accommodation support (number of accommodation nights by client) compared to other States and jurisdictions. The second biggest gap was the inability to find social or private rental housing for service users, and finally, gaps in staff skills.

Final report Evaluation of reforms to the ACT Specialist Homelessness Service system
12
Gaps are also evident for certain service user groups who are less likely to be able to access support services, less likely to have their needs met, or less likely to have stable housing on exit. The following groups were reported by services to be less likely to be able to access SHS accommodation supports due to a mismatch between their needs and eligibility for specific service providers: women with children not subject to domestic violence-particularly women with adolescent male dependants; couples over 25; young people under 15 years of age; refugees and people with pets.
A statistical analysis of gaps was conducted using logistic regression of SHSC support period and client data. We considered service users who were most likely to have an unmet need for accommodation, or exit from the SHS sector into unstable housing situations, as evidence for gaps in service delivery. On this analysis, after taking into account demographics and circumstances it was found that young people were more likely to have an unmet need for accommodation and more likely to exit into unstable accommodation. The analysis also found that women were more likely to have an unmet need for accommodation, but less likely to exit an accommodation support into unstable housing. While those with poor accommodation situations on entry were more likely to have their housing needs met, they were nine times more likely to experience an exit into unstable accommodation than other clients.
Conclusion
Over the reform period the SHS sector has experienced greater demand from service users with higher needs accessing the system in less stable housing situations. The SHS sector has provided more services, particularly non-accommodation supports, and has achieved better non-housing related outcomes for service users, especially in employment. However, while the ACT still has a much higher rate of exits into social housing than in other jurisdictions, exits into stable accommodation have declined over the period. Young people should remain a key focus as they are most likely to have an unmet housing need and most likely to exit into unstable accommodation.
The centralised intake service has faced some resistance but indications are it is leading to a more efficient service system. Integration has improved across all service types, but gaps remain—a core challenge remains the availability of social housing and private rental accommodation for people moving out of the SHS sector, with implications for the development of products and services designed to help people rent in the private rental market.
Final report Evaluation of reforms to the ACT Specialist Homelessness Service system
13
1. Introduction
1.1 This report
This document is the final report for the evaluation of the reforms to the ACT Specialist Homelessness Services (SHS) system. The ACT Community Services Directorate (CSD) commissioned ARTD Consultants to conduct this evaluation between November 2014 and May 2015.
The final report is structured around the three categories of outcomes identified in the Specialist Homelessness Sector Outcomes Reporting Framework introduced in the ACT SHS system in 2013-14:
system outcomes service delivery outcomes sector outcomes.
The evaluation answers key questions under each category (see the list in Table 1), using evidence from comprehensive and in-depth data sources.
Key evidence is included in the main report and frequency tables are provided for the online surveys (SHS provider survey data is in Appendix 1 and partner survey data is in Appendix 3).
1.2 The ACT Specialist Homelessness Service system between 2009 and 2014
The ACT Specialist Homelessness Service sector
The Specialist Homelessness Service sector supports ACT residents who are experiencing homelessness, or who may be at risk of homelessness, through the provision of a range of services across the housing continuum. The continuum ranges from prevention and early intervention to crisis intervention, stabilisation and maintenance of tenancy, ultimately aimed at breaking the homelessness cycle.
The sector is comprised of 47 services managed by 29 community-based service providers. The current mix of specialist homelessness services in the ACT includes 20 supported accommodation services; 26 support services and one sector capacity building service, providing the following types of services and supports:
crisis accommodation (including specialised services for women and children escaping domestic violence) with case management to help people identify and achieve goals and address the issues contributing to their homelessness
medium-term and transitional accommodation with outreach support

Final report Evaluation of reforms to the ACT Specialist Homelessness Service system
14
outreach support for people at risk of homelessness or people experiencing homelessness, including those who are waiting to access accommodation
free food, information and referral services services for young people and families experiencing homelessness; and outreach and supported accommodation services targeted at Aboriginal and Torres
Strait Islander people
Policy reforms
In 2008, the Australian Government released a White Paper on Homelessness (The Road Home) setting out two headline goals to guide a long-term national response to homelessness: halve overall homelessness by 2020; and offer supported accommodation to all rough sleepers who need it by 2020. The White Paper on Homelessness outlined three reform priorities:
turning off the tap—services will intervene early to prevent homelessness improving and expanding services—services will be more connected and responsive
to achieve sustainable housing, improve economic and social participation, and end homelessness for their service users
breaking the cycle—people who become homeless will move quickly through the crisis system to stable housing with the support they need so that homelessness does not recur.
At the Council of Australian Governments (COAG) meeting on 29 November 2008, the Commonwealth, State and Territory Governments agreed to the National Affordable Housing Agreement (NAHA) and the National Partnership Agreement on Homelessness (NPAH). The NAHA commenced on 1 January 2009 and the NPAH on 1 July 2009.
In response to the national agenda, the ACT Government released The Road Map in November 2009. This paper was also informed by 2006 Census data, which showed an increase in the number of people experiencing homelessness in the Territory from 2001. Under the National Partnership Agreement on Homelessness (NPAH), nine new programs were introduced. The ACT reform directions were identified as:
a shift in the provision of support from a crisis accommodation response to a ‘support in place’ model
rebalancing funding over time from accommodation-based support to outreach and preventative approaches, with a move towards ‘tenure neutral’ supports
maintenance of a network of crisis accommodation places to focus on people requiring a mix of accommodation and support, immediate shelter and those at risk of violence
move towards a ‘housing first’ 2 approach, wherever practicable
2 ‘Housing First’ was developed in the United States of America to support homeless people with a diagnosed mental illness. It has since been expanded to other populations and contexts. The program is based on the idea that a homeless individual’s first and primary need is to obtain stable, permanent housing, and other issues can only be appropriately addressed once stable housing is obtained. The five fundamental principles are: rapid access to permanent housing, consumer choice, separation of housing and support, recovery as an ongoing process, community integration (Johnson et al, 2012).

Final report Evaluation of reforms to the ACT Specialist Homelessness Service system
15
streamlining access to services and housing through the implementation of a central access point (FirstPoint)
assertive engagement and persistent support for rough sleepers, hard to engage groups and vulnerable Canberrans
sustaining tenancies to prevent repeat cycles of homelessness social inclusion—building links to economic and social participation.
In conjunction with these reforms, a discussion paper and consultation process helped to inform the development of an integrated service delivery model for community provided youth housing and homelessness services. This process drew on evaluation findings from the ACT’s 2004-2007 Homelessness Strategy Breaking the Cycle and three earlier reviews of existing ACT youth homelessness services. These reviews had identified prevention and early intervention, outreach services and greater coordination and collaboration of services as reform priorities for a system that was focussed primarily on meeting the accommodation needs of young people at the crisis end of the spectrum. In 2012, a new youth homelessness service model was implemented, funding eight services to provide a range of accommodation options and other interventions across the continuum, including crisis support, family mediation, and a focus on education and living skills training.
During 2013 and 2014, CSD in consultation with the specialist homelessness services sector, developed a Specialist Homelessness Sector Outcomes Reporting Framework that provides a new way of reporting.
Figure 1 presents a timeline of the key policy reforms and changes in the SHS data system that affected the ACT Specialist Homelessness Services.
Funding reforms
From 2009-10, the National Affordable Housing Special Purpose Payment combined funding previously provided under the Commonwealth/State Housing Agreement and the Supported Accommodation Assistance Program into a single appropriation. COAG agreed that funding allocations to states and territories would be determined on a per capita rate and phased in over a period of five years.
The move to a per capita funding model from 2010-11 resulted in the ACT experiencing a $3.7 million reduction in NAHA funding by 2012-13. The funding allocation was based initially on projected population figures, with a further reduction of $2.2 million (to a total of $5.9 million) anticipated by 2014-15. In 2013-14, actual population figures were used to adjust the total funding reduction for the ACT to $4.6 million.
The reduction in Commonwealth funding was absorbed by Housing and Community Services (HACS) until 30 June 2013. Recognising this was not sustainable in the longer term, HACS undertook extensive consultation with the sector in 2012-13 to agree on a new service costing model to give effect to the Commonwealth’s NAHA reductions. HACS implemented the new costing model from 1 July 2013, passing on only part of the funding reduction while continuing to cushion the sector from the remaining cut. The

Final report Evaluation of reforms to the ACT Specialist Homelessness Service system
16
recently reformed youth services were exempt from these funding cuts. Under the model, it was agreed that a $3.4 million reduction in funding over three years (from 2013-14 to 2015-16) would be implemented in the SHS sector, using a staged approach.
As an addition to the NAHA, the NPAH provided new matched funding to state and territory governments targeted at measures to reduce homelessness levels across Australia. The NPAH was implemented on 1 July 2009, with matched funding of $10 million over four years from 2009-10 to 2012-133. The NPAH was extended in 2013 for another year ($2.96 million matched funding for 2013-14) and again in 2014 ($3.04 million matched funding for 2014-15). On 23 March 2015, Commonwealth funding for the NPAH was extended for another two years to 30 June 2017 at a level of $3.04 million matched funding per year, with the priority focus to be on women and children experiencing domestic violence, and homeless young people under 18.
In 2013-14, the sector received $21.6 million in Government funding for its service delivery. Many services seek to supplement this funding with contributions and in-kind support from other sources, in order to provide the greatest possible assistance to their service users. Details of funding for the Specialist Homelessness Sector over the evaluation period are shown in Figure 2 against number of service users.
Accessing the SHS system
The Central Intake Service is intended to be the primary pathway for referral and is focussed on assisting clients at the crisis end of the housing continuum. The CIS undertakes an initial assessment of a client’s immediate needs and risks and where necessary, allocates a client to a homelessness service, or provides access to other support services. The CIS is also designed to provide information, advice and support as well as access to other housing solutions, such as social housing and private rental accommodation.
FirstPoint delivers the CIS and is co-located with a number of other Government and community providers in the One Human Services Gateway, which brings together a range of services into an accessible hub.
Public housing in the ACT
Since 1996, public housing stock has decreased, largely as the result of sales and transfer to community housing. Existing stock is ageing, and in need of repair which creates a mismatch between properties and the needs of many tenants and applicants. There is a lower turnover of tenancies than in previous periods and often there is a mismatch with the location of properties and location preferences of new applicants. Applications for public housing have more than doubled since 2008. Many applicants still have high 3 ‘Matched funding’ amounts include the Commonwealth and ACT contributions. In addition, the ACT Government contributes on average $0.9 million per year more than its matched funding component for homelessness service delivery. The figure does not include $10 million in capital funding for A Place to Call Home.
Final report Evaluation of reforms to the ACT Specialist Homelessness Service system
17
expectations of being placed in a preferred property, when that outcome is unlikely to be achieved.
Allocation of clients into Priority Housing is determined by a multi-disciplinary panel, with only those applicants demonstrating complex or multiple needs, or with children considered to be at ‘high risk’ considered for the priority list. Other applicants are allocated to the High Needs or Standard Housing list. In 2013-14 a total of 22,605 ACT residents lived in public housing across 10,724 tenancies and there were around 2,300 people on the waiting list in June 2014. In service provision, there has been a shift to a ‘human services approach’, providing “the right support, at the right time, for the right duration”. The service system has moved away from congregate living accommodation to single dwellings with tailored, flexible outreach support based on need, stepping down as client needs are resolved. Housing is envisaged as the starting point of service provision, not the sole outcome.
The ‘Housing First’ approach aims to provide people experiencing homelessness with access to safe, secure and permanent housing as quickly as possible along with additional supports and services as needed. One NPAH funded program, A Place to Call Home, is considered an example of a ‘Housing First’ model of service delivery. A Place to Call Home involved the construction of 20 new dwellings to house homeless families, who also received ongoing support services to help sustain their tenancy. Given the high cost and limited capacity to build new dwellings, the ‘Housing First’ approach in the ACT is approximated by providing access as quickly as possible to an appropriate dwelling in the existing social housing stock, with other supports provided as required.

Final report Evaluation of reforms to the ACT Specialist Homelessness Service system
18
Figure 1. Timeline of the 2009-2014 reforms to the ACT Specialist Homelessness Service system
Change in data
SHIP introduced, replaced SAAP data.
July 2011
2009
Policy/service delivery reform
New youth homelessness services model introduced.
March 2012
Policy/service delivery reform
ACT Government releases The Road Map, outlining key
policy/service delivery reform directions for ACT.
Late 2009
2010 2011 2012 2013 2014
Funding reform
Reduction in NAHA funding commences in ACT.
July 2013
Reporting change
Outcomes reporting for services commenced in ACT (1st report for Jan-
June 2014)
July 2014
Policy/service delivery reform
Centralised access point introduced.
Nov 2010
Funding reform
ACT government agreed to cushion the sector from the
NAHA funding until 2012/13.
New matched funding under NPAH for specific service
delivery responses to program/policy gaps.
July 2009
Policy/service delivery reform
Extensive consultation with the sector about the funding
model
2012/13
Policy/service delivery reform
NAHA and NPAH introduced as part of response to White
Paper, The Road Home.
New focus for homelessness services at national level, filtering to state/territory
level.
Jan/ July 2009
Final report Evaluation of reforms to the ACT Specialist Homelessness Services system
19
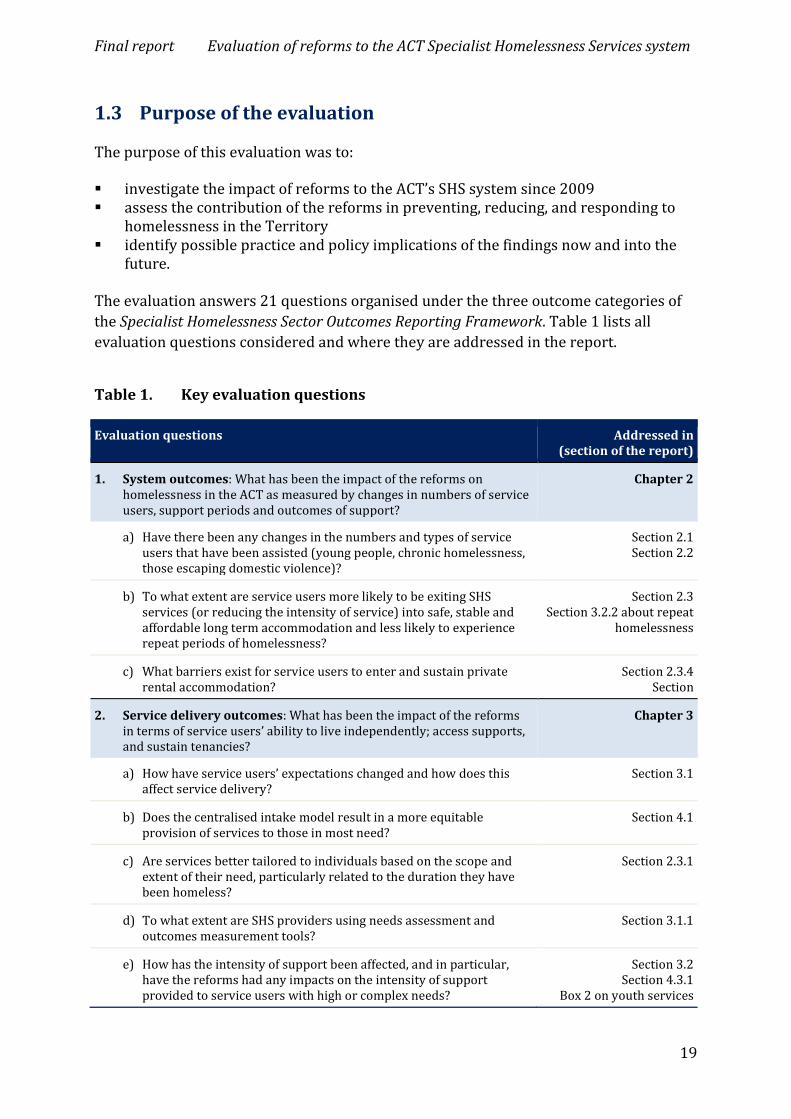
1.3 Purpose of the evaluation
The purpose of this evaluation was to:
investigate the impact of reforms to the ACT’s SHS system since 2009 assess the contribution of the reforms in preventing, reducing, and responding to
homelessness in the Territory identify possible practice and policy implications of the findings now and into the
future.
The evaluation answers 21 questions organised under the three outcome categories of the Specialist Homelessness Sector Outcomes Reporting Framework. Table 1 lists all evaluation questions considered and where they are addressed in the report.
Table 1. Key evaluation questions
Evaluation questions Addressed in (section of the report)
1. System outcomes: What has been the impact of the reforms on homelessness in the ACT as measured by changes in numbers of service users, support periods and outcomes of support?
Chapter 2
a) Have there been any changes in the numbers and types of service users that have been assisted (young people, chronic homelessness, those escaping domestic violence)?
Section 2.1 Section 2.2
b) To what extent are service users more likely to be exiting SHS services (or reducing the intensity of service) into safe, stable and affordable long term accommodation and less likely to experience repeat periods of homelessness?
Section 2.3 Section 3.2.2 about repeat
homelessness
c) What barriers exist for service users to enter and sustain private rental accommodation?
Section 2.3.4 Section
2. Service delivery outcomes: What has been the impact of the reforms in terms of service users’ ability to live independently; access supports, and sustain tenancies?
Chapter 3
a) How have service users’ expectations changed and how does this affect service delivery?
Section 3.1
b) Does the centralised intake model result in a more equitable provision of services to those in most need?
Section 4.1
c) Are services better tailored to individuals based on the scope and extent of their need, particularly related to the duration they have been homeless?
Section 2.3.1
d) To what extent are SHS providers using needs assessment and outcomes measurement tools?
Section 3.1.1
e) How has the intensity of support been affected, and in particular, have the reforms had any impacts on the intensity of support provided to service users with high or complex needs?
Section 3.2 Section 4.3.1
Box 2 on youth services

Final report Evaluation of reforms to the ACT Specialist Homelessness Services system
20
Evaluation questions Addressed in (section of the report)
f) Is the intensity of support commensurate with the outcomes achieved?
Section 2.3.1 Section 2.3.3
Section 3.3
g) Are service users more likely to be provided with ‘housing first’ and services that are not tied to their accommodation or ‘place of change’?
Box 4
h) How have the reforms affected service users’ participation in employment, education and training?
Section 3.3.2 Section 3.3.3
3. Sector outcomes: Are SHS providers working in a more integrated manner with each other and with mainstream services, particularly mental health and social housing, and what gaps in service delivery exist?
Chapter 4
a) Has there been a shift in focus to more non-accommodation services, prevention and early intervention or is the sector still focused on crisis?
Section 2.3.1
b) How has the introduction of a central intake model changed specialist homelessness service delivery in the ACT?
Section 4.1 Box 3
c) Is the central intake model operating as intended? Section 4.1.1 Box 3
d) Are all service providers participating in the centralised intake model?
Section 4.1.3
e) How have the centralised intake model and other reforms impacted on the degree of networking/ coordination/ integration in the sector—including between SHS providers and more broadly with other community, Aboriginal and Torres Strait Islander, and human services organisations?
Section 4.2
f) How have SHS providers worked collaboratively with other human services to holistically address service user needs?
Section 4.2.3
g) What gaps in service delivery have been identified by SHS providers and what steps have been taken to address these gaps across the sector?
Section 4.3
h) How have SHS providers worked to improve engagement with Aboriginal and Torres Strait Islander people and Culturally and Linguistically Diverse service users?
Section 4.2.3 Box 1
i) What preparations have been made by SHS providers for the implementation of the National Disability Insurance Scheme (NDIS)—which current service users are likely to be ineligible for the NDIS and how have their needs been considered?
Section 4.3.3
j) What gaps remain in the targeting or delivery of services to support the diverse range of people who experience homelessness to access and sustain safe, stable and affordable long-term accommodation?
Section 4.3.1

Final report Evaluation of reforms to the ACT Specialist Homelessness Services system
21
1.4 Evaluation methods
The evaluation uses a mixed-methods approach. It brings together quantitative analyses of SHS data about service users’ characteristics, support provided and outcomes, and online survey data about perceptions of the service system, with qualitative data from service providers’ six-monthly reports, online survey open-ended questions, and interviews with stakeholders and service users as part of case studies.
We collected new data (primary data) and made use of existing data (secondary data) collected through existing CSD contract management and reporting processes.
Primary data collection methods included:
an online survey of all SHS providers (n=51 respondents) an online survey of partner organisations referred by respondents to the SHS online
survey (n=30 respondents) five case studies, three focusing on specific system changes (Centralised Intake
Service, reform of youth homelessness services and repeat periods of homelessness) and two focusing on individual service users (one Aboriginal and Torres Strait Islander service user and a service user who was a rough sleeper). Methods used for the case studies included interviews with service providers (n=17), interviews with service users (n=4), review of relevant documentation and case file analysis
consultation with Joint Pathways service providers on preliminary findings and workshops on three topic areas
Secondary data included:
background documentation service provider six-monthly reports for the January to June 2014 period SHS data at aggregated level (from annual reports and statistical summaries) and
individual level (AIHW Confidentialised Unit Record Files) for each financial year from 2007-08 to 2013-14.
Table 2 provides an overview of all evaluation methods, their focus, scope, the sample of participants covered, and timing of data collection. Details about how each method was implemented are provided in Appendix 1.

Final report Evaluation of reforms to the ACT Specialist Homelessness Service system
22
Table 2. Overview of evaluation methods
Method/ source Scope/ sample population
Focus Timeframe for data collection
Sample
Desktop review Program documentation CSD provided ARTD with a total of 114 documents that were reviewed to inform the evaluation. Documents provided covered a range of topics and were organised under the following folders: context, funding model, youth services and centralised intake service.
N/A N/A
Six-monthly service provider reports
January-June 2014 service provider reports
CSD also provided ARTD with individual six-monthly service provider reports for the period January to June 2014. ARTD conducted a comprehensive qualitative analysis on open-ended responses to outcome indicators including two case studies in each report.
January – June 2014 40 six-monthly provider reports covering 44 services
Online survey SHS providers ARTD developed an online survey to gather feedback from SHS providers on how the system has changed during 2009-2014, how the system is working and what gaps may need to be filled. CSD provided ARTD with email addresses for all SHS organisation managers and service coordinators.
12/02/2015 – 25/02/2015
51 responses (45 complete, 6 partial) out of 59 recipients, making an 86 per cent response rate.
Partner organisations A shorter version of the online survey was then sent to contacts from partner organisations identified by respondents to the SHS provider survey.
26/02/2015 – 11/03/2015
30 responses (20 complete, 10 partial) out of 60 recipients, making a 50 per cent response rate.
Case studies Youth homelessness services
ARTD undertook five case studies to collect in-depth data about particular areas of interest. Case studies were selected based on areas of interest identified through the inception
February – March 2015 Stakeholder interviews (n=9) Review of six-monthly reports of
Youth services (n=8) Review of responses to the online

Final report Evaluation of reforms to the ACT Specialist Homelessness Service system
23
Method/ source Scope/ sample Focus Timeframe for data Sample population collection
meeting and scoping interviews, also taking into consideration resources and time available for
survey (n=7) Presentation and discussion of
Centralised intake service
Repeat periods of homelessness
Aboriginal service user
Rough sleeper case study
the evaluation project. The five selected case studies represent a mix of system change (youth homelessness services, Centralised Intake Service and repeat periods of homelessness) and individual service users’ case studies (Aboriginal and rough sleeper). Methods varied across case studies combining analysis of existing data and collection of new data through interviews. Three case studies included client interviews as part of the suggested data collection methods and consequently required ethics approval. Ethics approval was granted by the Bellberry Human Research Ethics Committee for the proposed protocol to approach and interview service users (protocol 2015-01-041).
preliminary analysis at the Youth Housing and Homelessness Forum (n=20 participants)
Service provider interviews (n=3) Service user interview (n=2) Review of FirstPoint six-monthly
reports
Analysis of SHS data Service provider interviews (n=3)
Service user interview (n=1) Service provider interviews (n=1) Case file analysis
Service user interview (n=1) Service provider interviews (n=2) Case file analysis
SHS data Aggregated level data The following aggregated data was retrieved from AIWH website
2007–08 to2013–14 All ACT SHS service users
SAAP ACT annual reports (2007–08, 2008–09, 2009–10 and 2010–11)
SHS annual ACT statistical summaries (2011–12, 2012–13 and 2013–14)
Individual level data AIHW provided ARTD with unique record datasets for the following years SAAP CURF data for 2007–08, 2008–09,
2009–10 and 2010–11 SHS CURF data for 2011–12, 2012–13 and
2013–14

Final report Evaluation of reforms to the ACT Specialist Homelessness Services system
24
1.5 Confidence in the findings
We are confident that the findings are sound and based on sufficient evidence to answer evaluation questions given the diverse range of methods that we were able to implement largely as intended. The data sources drew primarily on quantitative data on client pathways through the system and a mix of quantitative and qualitative information from SHS providers and their external partners.
As the focus of the evaluation was on the impact of high-level reforms, and was, like all evaluations, limited by the time and resources available, the depth of data on every issue was insufficient to fully understand how each initiative was generating outcomes. In particular we have insufficient evidence to make confident answers on the impact of ‘housing first’ and preparations for the NDIS. These issues could each constitute their own evaluation and remain areas for further exploration and understanding.
It is also worth noting that the evaluation did not measure changes from the perspective of the views of service users. While individual services, including the CIS have client satisfaction surveys, there is not a sector wide survey. This was not considered a major limitation given the focus of the reforms on changes to the service system—rather than an evaluation of a particular service. To collect this data would require data on the views of a representative sample of clients prior to the reforms (usually a random sample of around 400 clients is sufficient) that could be compared with a representative sample of clients after the reforms.
Developing a simple and short sector-wide client experience survey would be useful for evaluation and for monitoring expectations, satisfaction and mapping of how their needs were addressed by the SHS and broader service system to which they were referred.
1.5.1 Service providers feedback
The response rate to the online survey addressed to all SHS providers is very high: out of 59 organisation managers and service coordinators surveyed, 51 responded, giving an overall response rate of 86 per cent. Responses collected represented 42 of the 47 services (some service coordinators being responsible for more than one service), leading to 89 per cent of services being covered. This provides a sound basis for statistical analysis. Detailed survey results for responses collected are provided in the Appendix 2.
The response rate for the partner survey is lower (30 out of 60 contacts provided by SHS providers, giving a 50 per cent response rate). However, we do not consider this as a limitation to the evaluation as the main purpose of the partner survey was to get an external perspective from informed stakeholders about recent changes to the ACT SHS system.

Final report Evaluation of reforms to the ACT Specialist Homelessness Services system
25
1.5.2 Service user feedback
A potential criticism of the evaluation could be the lack of service user feedback. A response to this would be that, firstly the focus of the evaluation is on system-wide reforms and the evaluation questions are targeted to services. Secondly, the evaluation methods still capture some service user feedback through individual interviews following ethics approval—four service user interviews were completed. Moreover, quantitative analysis of SHS data looked at a number of service user characteristics, needs, support provided and outcomes.
1.5.3 Specialist Homelessness Services data
The evaluation accessed unit record data (at individual level) about SHS service users from the Australian Institute of Health and Welfare (AIHW), from 2007–08 to 2013–14 financial years. Whenever possible, we reported data for each financial year, starting from 2008-09, to include a baseline before the 2009–2014 period, to 2013–14.
Individual level data allowed us to conduct more sophisticated analyses and to better compare service activity over time; however it also comes with challenges in regards to the accuracy of the reported figures.
Comparability over years of Supported Accommodation Assistance Program (SAAP) and Specialist Homelessness Services Collection (SHSC) data systems
The focus of the present evaluation is to look at changes in the ACT SHS system between 2009 and 2014. One of the key data issues when considering changes over time comes from the change in SHS data reporting system from SAAP to SHSC, in July 2011. The change in data system makes direct comparison between the financial years before and after difficult. Table 3 summarises the key data limitations and the mitigation strategies used to overcome them.
Table 3. Limitations to SAAP/SHSC data and mitigation strategies
Data limitation Strategy
The SHSC includes data from a broader range of agencies than SAAP. SAAP only included services that were funded under this agreement, that were mainly accommodation services, while SHS providers are both accommodation and non-accommodation service providers.
Because of this key difference in scope, it is inappropriate to compare absolute numbers of services users between SAAP and SHSC reporting periods. However, it is possible to compare the distribution of service users in terms of characteristics or outcomes across SAAP and SHSC years, as a proportion (%) of all service users. This relies on the reasonable assumption that service users added to the data collection scope in July 2011have similar characteristics to the ones that were already captured in SAAP.
The SHSC counts children as service users, unlike In SHSC we removed the accompanying children

Final report Evaluation of reforms to the ACT Specialist Homelessness Services system
26
Data limitation Strategy
SAAP, which increases the count of service users when comparing the two without accounting for children.
from our analyses to enable better comparability with SAAP.
Variables used in SHSC are similar to those used in SAAP, but not identical i.e. with different typologies. This is particularly the case for tenure type (housing situation), needs and support provided, and reasons for seeking assistance.
For key variables, we established some corresponding values to increase comparability between the two systems.
A number of services (n=9) in the ACT provide services to people experiencing homelessness, but do not report data using SHIP at the current time.
To assess the activity of these services, we used their six monthly reports to inform the evaluation
Comparability with national data
The analysis undertaken in this evaluation will not align with figures that have been published by the AIHW. There are several reasons for that:
AIHW published data has reported figures for ‘clients’ where all support periods are closed at the end of the reporting period. The creation of the flag for clients with all support periods closed is done at a national level. The data provided to ARTD for this evaluation included ACT clients only and did not include this flag. There will be a small number of ACT clients (i.e. clients with support periods with ACT agencies) who also had support periods in other jurisdictions. Some of these support periods outside ACT may be ongoing and hence, when the client is observed from a national level, all support periods are not closed. There was no way of identifying these clients with ongoing support periods at agencies outside ACT. This meant that it was not possible to ‘recreate’ published figures using the data that was provided by the AIHW.
Because of the focus of the evaluation on changes over years, we sometimes used different variables to ensure comparability between SAAP and SHSC (see above). For instance, we used the ‘tenure type’ variable to measure housing outcomes due to the greater level of comparability between SAAP and SHSC years. In SHSC annual reports, AIHW uses a combination of tenure type and dwelling type in calculating its measure of homelessness.
Wherever possible, we have reported data at service user or ‘client’ level, rather than by support period, while SAAP data was published at support period level. Where service users had more than one support period then their outcomes were measured at the beginning of their first support period, and at the conclusion of their last closed support period.
We report unit record data as unweighted (raw data), whereas the AIHW applies weights to account for non-response. We chose to report unweighted data to better compare SAAP and SHS data.
Finally, a key limitation was specific to the ACT and the introduction of a centralised intake service. In November 2010, the ACT introduced the Centralised Intake Service (CIS) to manage service users’ entry into the SHS system. At their first contact, the service user is registered in the SHSC system with a support period under the CIS. If the service user is referred to other services for accommodation or

Final report Evaluation of reforms to the ACT Specialist Homelessness Services system
27
non-accommodation support, it is important to exclude the CIS support period to avoid double counting when reporting at the aggregated level.
For those key variables where it was considered important to compare ACT figures with national benchmarks, we used aggregated data as reported in AIHW national reports over the last SHSC years (2011–12, 2012–13 and 2013–14). SHSC data is reported at service user level, which allowed us to overcome the issue of ‘double counting’ CIS support periods, as service users will only get counted once even if they had several support periods.
Another limitation to analysing the ACT AIHW data is that it was not possible to identify and exclude service users coming from interstate. This is an issue in the ACT in particular, due to its geographic location, and should be considered in future research.
Unmet demand
A recurrent criticism is that service user data as collected by SHS providers through the Specialist Homelessness Information Platform (SHIP) only reflects service users who enter the system, and does not account for unmet demand. A better measure of the extent of homelessness in the population is provided by the Australian Bureau of Statistics (ABS) every five years through the Census of Population and Housing (Census). The most recent Census was at the time of the evaluation was conducted in 2011 and the next is planned for 2016.
As the Census dates do not allow us to capture the impact of the reforms introduced in 2009, it has been agreed with the steering group that it is beyond the scope of the evaluation to measure the level of homelessness in the ACT. However, the evaluation does present the ACT’s homelessness rate according to the 2011 Census as an overall context indicator (see section 2.1).
The AIHW also has a measure of unmet demand as measured through unassisted requests for assistance. This data also has a number of important limitations:
data about unmet demand was collected through a two-week snapshot in SAAP data until 2011–12 before being added to the recurrent SHS data collection
data may include requests from the same person on different days as persons are not always identified through a unique identifier
data collected does not capture reasons why a service provider could not provide assistance (it could be that the person was not meeting eligible criteria and/or was referred to another service that could potentially provide the assistance in the end).
The evaluation nevertheless reports on unmet demand with the best available proxy indicator: the daily average of unassisted persons (see section 2.1).

Final report Evaluation of reforms to the ACT Specialist Homelessness Services system
28
Missing data
ARTD Consultants identified a limitation in the datasets provided by AIHW: some of the records do not include a unique ‘Client ID’. As it is not possible to determine if service users without Client IDs are unique or repeat service users, and given the risk of over-estimating the actual number of individuals, we decided to exclude records without a Client ID from our quantitative analysis. Encouragingly, only a limited number of records were missing a Client ID: approximately 10 per cent for each year (see Appendix 1, Table 10).
1.5.4 Presentation of preliminary findings to service providers
ARTD Consultants presented preliminary findings of the evaluation to SHS providers firstly at the Youth Housing and Homelessness forum on 3 March 2015 focusing on the case study on the reform of youth homelessness services; and secondly to the whole sector through a Joint Pathways workshop on 24 March 2015. As part of these presentations, service providers were given the opportunity to give feedback and discuss the implications of these findings. Feedback has been incorporated and additional analyses requested by participants have been included in this report.
1.5.5 Ability to answer evaluation questions and future research
The evaluation was able to answer most of the evaluation questions as identified in Table 1. However, lack of data or data limitations identified in previous sections mean that clear answers could not be provided to some questions, in particular:
Question 2.c about services tailored to service users’ needs: changes to the SHS data system in July 2011 changed the way needs and support provided were recorded, which does not allow consideration of changes over the whole period. Future evaluations will have the ability to look at changes using a consistent data system over time.
Questions 2e and 2f about intensity of support: there is no specific measure of intensity of support in the SHS data system beyond the length of support period, but we considered other proxies (e.g. service users with a high number of different types of support provided) and reported on them. However, it is difficult to link overall intensity of support with overall outcomes, as there is no satisfying measure on both sides. The preferred approach was to consider specific outcomes that could be measured against support provided in relation to this specific need, e.g. accommodation, employment and education.
Question 2.g about ‘housing first’ services: the SHS data doesn’t allow identification of service users provided with a ‘housing first’ intervention and limited data was collected through this evaluation in this regard—only through an individual service user case study, that is presented in Box 4.
Question 3.i about the National Disability Insurance Scheme (NDIS): limited data was available and collected through the evaluation with regard to the introduction

Final report Evaluation of reforms to the ACT Specialist Homelessness Services system
29
of the NDIS. Feedback was collected from service providers through the workshop where preliminary findings of the present evaluation were presented, and is presented in section 4.3.3.
Future evaluations should be able to look at these aspects in more detail, because of improved data systems. The ‘housing first’ approach may require dedicated research, to allow for in-depth exploration of this particular model. With regard to the NDIS, more clarity around the implementation of the scheme should also allow future studies to get a more accurate view of the anticipated impact on the SHS system.
Final report Evaluation of reforms to the ACT Specialist Homelessness Services system
30
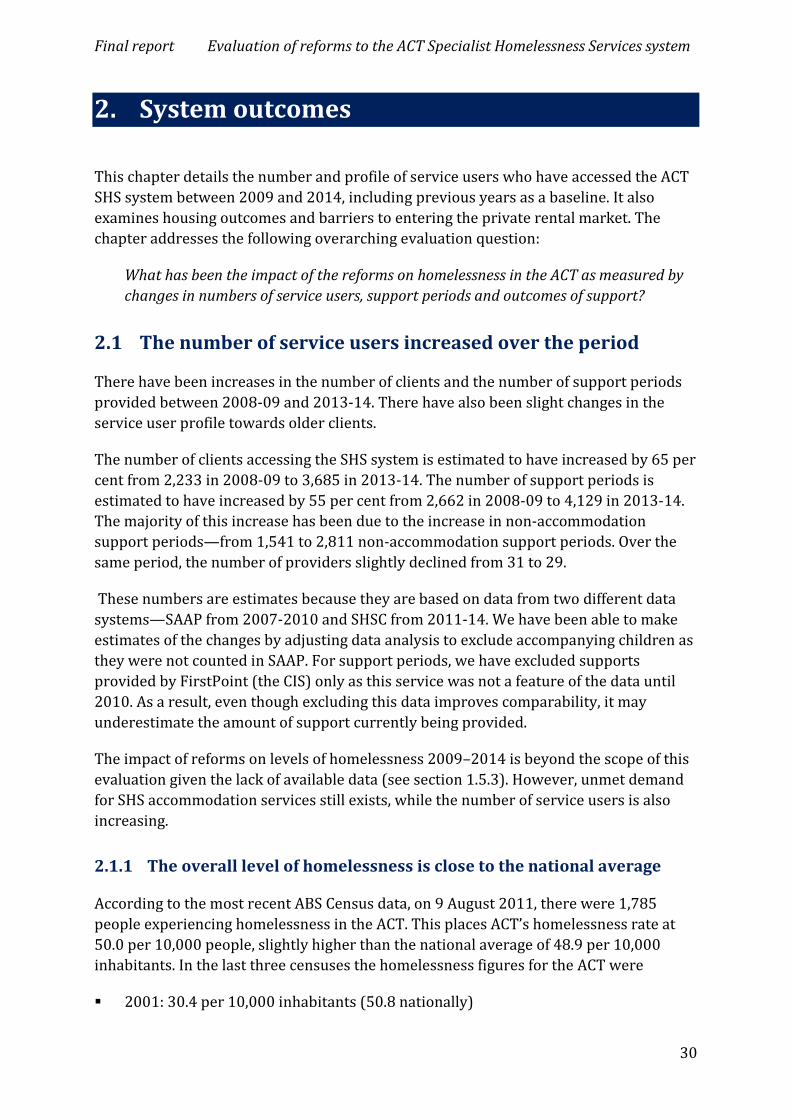
2. System outcomes
This chapter details the number and profile of service users who have accessed the ACT SHS system between 2009 and 2014, including previous years as a baseline. It also examines housing outcomes and barriers to entering the private rental market. The chapter addresses the following overarching evaluation question:
What has been the impact of the reforms on homelessness in the ACT as measured by changes in numbers of service users, support periods and outcomes of support?
2.1 The number of service users increased over the period
There have been increases in the number of clients and the number of support periods provided between 2008-09 and 2013-14. There have also been slight changes in the service user profile towards older clients.
The number of clients accessing the SHS system is estimated to have increased by 65 per cent from 2,233 in 2008-09 to 3,685 in 2013-14. The number of support periods is estimated to have increased by 55 per cent from 2,662 in 2008-09 to 4,129 in 2013-14. The majority of this increase has been due to the increase in non-accommodation support periods—from 1,541 to 2,811 non-accommodation support periods. Over the same period, the number of providers slightly declined from 31 to 29.
These numbers are estimates because they are based on data from two different data systems—SAAP from 2007-2010 and SHSC from 2011-14. We have been able to make estimates of the changes by adjusting data analysis to exclude accompanying children as they were not counted in SAAP. For support periods, we have excluded supports provided by FirstPoint (the CIS) only as this service was not a feature of the data until 2010. As a result, even though excluding this data improves comparability, it may underestimate the amount of support currently being provided.
The impact of reforms on levels of homelessness 2009–2014 is beyond the scope of this evaluation given the lack of available data (see section 1.5.3). However, unmet demand for SHS accommodation services still exists, while the number of service users is also increasing.
2.1.1 The overall level of homelessness is close to the national average
According to the most recent ABS Census data, on 9 August 2011, there were 1,785 people experiencing homelessness in the ACT. This places ACT’s homelessness rate at 50.0 per 10,000 people, slightly higher than the national average of 48.9 per 10,000 inhabitants. In the last three censuses the homelessness figures for the ACT were
2001: 30.4 per 10,000 inhabitants (50.8 nationally)

Final report Evaluation of reforms to the ACT Specialist Homelessness Services system
31
2006: 29.3 (45.2 nationally) 2011: 50 (48.9 nationally)
2.1.2 Unmet demand is difficult to estimate
One proxy measure of homelessness is unmet demand for SHS services which is suggestive of homelessness that is not being addressed. AIHW data includes a measure of unmet demand, but because the unassisted population is, by definition, not entered in the system, this data has limitations—in particular, not allowing all duplicates to be excluded (see section 1.5.3).
Table 4 provides a comparison of the daily unmet demand with daily intake over the SHSC years4. The daily average of unmet requests for assistance remained at a relatively low level over the last three years and was 2.6 in 2013–14. This has to be compared to the level of daily intake of ACT SHS in 2013–14: an average of 16.8 support periods were opened per day in the ACT.
Table 4. Unmet demand, 2011–12 to 2013–14
2011–12 2012–13 2013–14
Daily average of unmet requests for assistance 2.2 2 2.6
Daily average of support periods opened NA 17.8 16.8
Source: AIHW SHS annual reports, ACT Supplementary tables, 2011-12, 2012-13 and 2013-14
With the introduction of the Centralised Intake Service, the ACT SHS system has the ability to measure more accurately the level of unmet demand in the ACT. It was possible to report CIS data through the SHS data system (SHIP) only from the end of March 2012. Data available for the last two years of the period considered shows that the number of unassisted persons is still substantial: 194 in 2012-13 and 303 in 2013-14. However, similar to AIHW data, this is the number of requests, not the number of people, and may include duplicates from people calling back.
In 2013-14, the main reason for not providing assistance was that no accommodation was available (40% of unmet requests), but this comprised only 19 per cent of the unmet requests in 2012-13. However, it is still too early to identify any clear trend.
4 During SAAP years, a different methodology was used to estimate unmet demand, based on a two week snapshot, which doesn’t allow comparison.

Final report Evaluation of reforms to the ACT Specialist Homelessness Services system
32
Table 5. Number and reasons for unmet request for assistance, Centralised Intake Service, 2012-13 and 2013-14
2012–13 2013–14
Unmet request for assistance (excluding requests from outside the ACT)
194 303
Why had the service(s) not been provided? Multiple reasons possible
As a percentage of Unmet request for assistance (excluding requests from outside the ACT)
Person did not accept service 11% 11%
Person wanted different services 23% 18%
Agency had no accommodation available 19% 40%
Agency had no other services available 4% 4%
Agency had insufficient staff 0% 0%
Agency was inappropriate, wrong target group 16% 11%
Agency's facilities were not appropriate for a person with special needs 3% 1%
Person was refused service/ person did not meet criteria 9% 5%
No fee-free services, available at the time of request 0% 0%
Other 29% 20%
Missing 9% 18%
Source: FirstPoint data about Unassisted Person contacts, 2012-13 and 2013-14
2.1.3 SHS service users have increased by 13 per cent since 2011–12
The number of service users increased over the period and we can measure the increase with certainty over the last three years: between 2011–12 and 2013–14, the number of service users increased by 13 per cent. Changes in the data collection system between 2010–11 and 2011–12 make it difficult to accurately estimate the change in the number of service users over the whole 2009–2014 period. Below we present data with a break between these two periods—changes between these two years are most likely related to the change in the data system.
In that same period of time (2011–12 to 2013–14), funding to the SHS sector decreased by 10 per cent. The ACT Government maintained funding to services until 30 June 2013, despite a strong reduction in Commonwealth funding from the introduction of the National Affordable Housing Agreement (NAHA) on 1 January 2009. Over the following three years (2013–14, 2014–15 and 2015–16), the ACT Government planned to
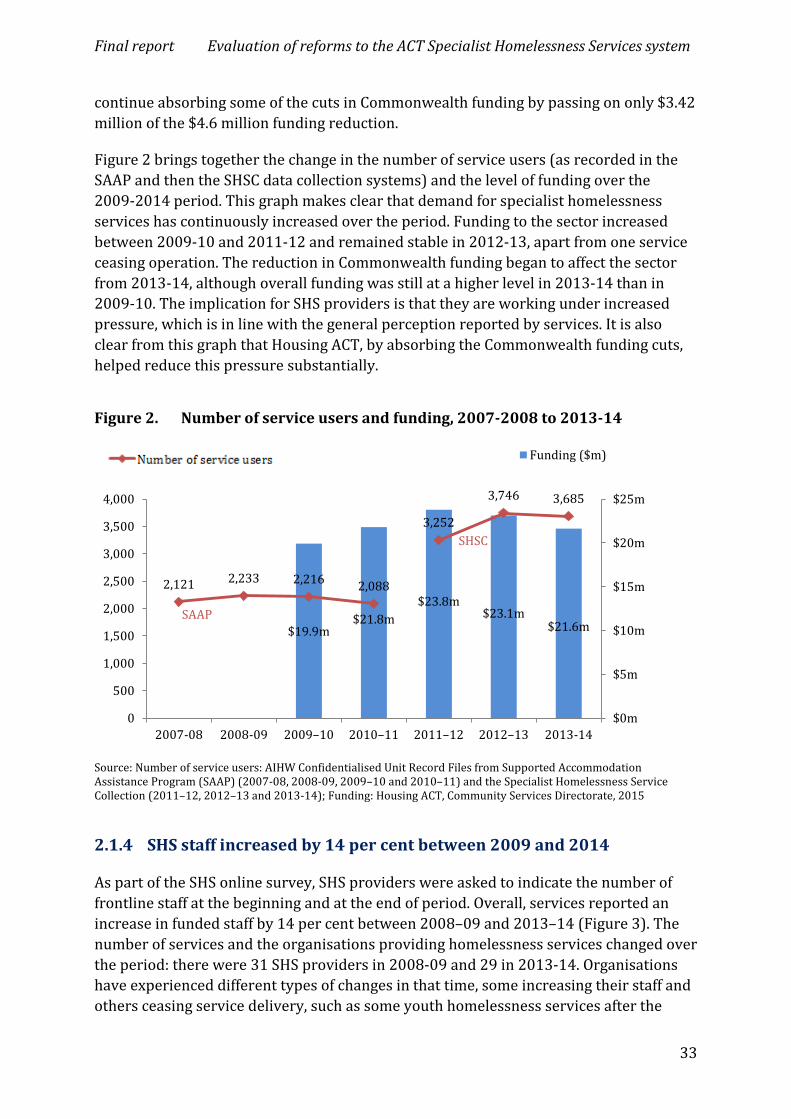
Final report Evaluation of reforms to the ACT Specialist Homelessness Services system
33
continue absorbing some of the cuts in Commonwealth funding by passing on only $3.42 million of the $4.6 million funding reduction.
Figure 2 brings together the change in the number of service users (as recorded in the SAAP and then the SHSC data collection systems) and the level of funding over the 2009-2014 period. This graph makes clear that demand for specialist homelessness services has continuously increased over the period. Funding to the sector increased between 2009-10 and 2011-12 and remained stable in 2012-13, apart from one service ceasing operation. The reduction in Commonwealth funding began to affect the sector from 2013-14, although overall funding was still at a higher level in 2013-14 than in 2009-10. The implication for SHS providers is that they are working under increased pressure, which is in line with the general perception reported by services. It is also clear from this graph that Housing ACT, by absorbing the Commonwealth funding cuts, helped reduce this pressure substantially.
Figure 2. Number of service users and funding, 2007-2008 to 2013-14
Source: Number of service users: AIHW Confidentialised Unit Record Files from Supported Accommodation Assistance Program (SAAP) (2007-08, 2008-09, 2009–10 and 2010–11) and the Specialist Homelessness Service Collection (2011–12, 2012–13 and 2013-14); Funding: Housing ACT, Community Services Directorate, 2015
2.1.4 SHS staff increased by 14 per cent between 2009 and 2014
As part of the SHS online survey, SHS providers were asked to indicate the number of frontline staff at the beginning and at the end of period. Overall, services reported an increase in funded staff by 14 per cent between 2008–09 and 2013–14 (Figure 3). The number of services and the organisations providing homelessness services changed over the period: there were 31 SHS providers in 2008-09 and 29 in 2013-14. Organisations have experienced different types of changes in that time, some increasing their staff and others ceasing service delivery, such as some youth homelessness services after the
$19.9m$21.8m
$23.8m$23.1m
$21.6m
2,121 2,233 2,216 2,088
3,252
3,746 3,685
$0m
$5m
$10m
$15m
$20m
$25m
0
500
1,000
1,500
2,000
2,500
3,000
3,500
4,000
2007-08 2008-09 2009–10 2010–11 2011–12 2012–13 2013-14
Funding ($m)
SHSC
SAAP

Final report Evaluation of reforms to the ACT Specialist Homelessness Services system
34
2012 reforms. Some services may also have absorbed part of the 2013-14 funding reductions through cross-subsidisation by using other sources of funding or by reducing penalty rate shifts.
Volunteer numbers have stayed relatively constant since 2009 for most service providers. However two large organisations saw significant increases to their volunteering numbers, which explains the substantial increase in volunteers over the period (+140 per cent). The increase in the number of volunteers over the past few years seem to have a reasonable explanation and services reported that volunteers have been allocated to appropriate tasks, such as mentorship or after-hours classes. However, shifting service delivery to volunteers could be a risk in the context of further funding cuts with potential implications in terms of quality of support provided to service users.
Figure 3. Number of service users and staffing, 2007–08 to 2013–14
Source: Number of service users: AIHW Confidentialised Unit Record Files from Supported Accommodation Assistance Program (SAAP) (2007-08, 2008-09, 2009–10 and 2010–11) and the Specialist Homelessness Service Collection (2011–12, 2012–13 and 2013-14); Staff: SHS online survey, February 2015
2.2 Service users characteristics and reasons to seek assistance remained similar over the period
The profile of service users has changed to include slightly more men (from 40% in 2007–08 to 44% in 2013–14). There are also proportionally fewer young people (from 45% in 2007–08 to 31% in 2013–14); a slight decrease in the proportion of Aboriginal and Torres Strait Islander service users (from 17% to 14%); and a slight increase in the proportion of high-needs service users, from 31 per cent in 2007–08 to 35 per cent in 2013–14. There have also been changes in reporting the reason for being homeless, in particular an increase in the proportion citing ‘interpersonal relationships’ (which
233.3 266.04
86.09
206.64
2,121 2,233 2,216 2,088
3,252
3,746 3,685
050100150200250300350400450500
0
500
1,000
1,500
2,000
2,500
3,000
3,500
4,000
2007-08 2008-09 2009–10 2010–11 2011–12 2012–13 2013-14
Volunteers (FTE)
Funded staff (FTE)
SAAP
SHSC

Final report Evaluation of reforms to the ACT Specialist Homelessness Services system
35
includes domestic violence) as the main reason from 26 per cent in 2011-12 to 31 per cent in 2013-14.
2.2.1 Service users’ characteristics remained similar over the period, with an increasingly higher proportion in older age groups
Table 6 provides an overview of SHS service users’ key demographic characteristics from 2007–08 to 2013–14. While being broadly similar over time, some noticeable changes can be observed:
a slight increase in the proportion of men, from 40 per cent in 2007–08 to 44 per cent in 2013–14. This could be explained by more public housing being made available for single men over the period and the introduction of the Street-to-Home service in 2010.
a slight decrease in proportion of Aboriginal and Torres Strait Islander service users from 17 per cent to 14 per cent—this doesn’t mean that there are fewer Aboriginal and Torres Strait Islander service users, but that their increase in numbers is less than the overall increase. SHS providers identified several potential explanations for this, including that: some Aboriginal people choose not to record their Aboriginality, some Aboriginal and Torres Strait Islander people have stopped accessing services because they were not satisfied, or for other reasons, such as moving out of the ACT.
a slight increase in the proportion of service users born outside of Australia. They represent around 25 per cent of the SHS population in recent years. This is consistent with feedback from SHS about the increase in refugees, who are a sub-group of service users from culturally and linguistically diverse backgrounds.
a slight increase in the proportion of high-needs service users, from 31 per cent in 2007–08 to 35 per cent in 2013–14. This increase seems to support the priority given to these service users in the allocation of accommodation with the introduction of the centralised intake model in November 2010.
an increase in the proportion of older age groups and relative decline in the youth cohort (Figure 4). This is the most striking change over time. Between 2007–08 and 2013–14 the proportion of service users aged 45 years and over went up from 11 to 17 per cent (with half male, half female service users), while the proportion of young service users (15 to 24 years old) decreased from 45 to 31 per cent—raw numbers of young people still increased over the period, but less than the overall increase in service users. While young service users still represent a substantial proportion of SHS users, the increase in the proportion of older service users —in line with the overall Australian demography—is bringing changes to service users’ needs, and therefore to the demand for certain types of support services. It is expected that aged care and mental health support services will see continued increase in the coming years.

Final report Evaluation of reforms to the ACT Specialist Homelessness Services system
36
Figure 4. Distribution of SHS service users by age group, 2007–08 to 2013–14
Source: AIHW Confidentialised Unit Record Files from Supported Accommodation Assistance Program (SAAP) (2007-08, 2008-09, 2009–10 and 2010–11) and the Specialist Homelessness Service Collection (2011–12, 2012–13 and 2013-14)
45% 42% 43% 38% 36% 34% 31%
26%25% 26%
26% 28% 29% 30%
18% 21% 19%21% 21% 21% 22%
11% 12% 12% 15% 16% 16% 17%
0%
10%
20%
30%
40%
50%
60%
70%
80%
90%
100%
2007-08 2008-09 2009–10 2010–11 2011–12 2012–13 2013-14
45 years and older
35–44 years
25–34 years
15–24 years

Final report Evaluation of reforms to the ACT Specialist Homelessness Services system
37
Table 6. Summary of service users’ key demographic characteristics, by financial year, 2007–08 to 2013–14
Service users characteristics
2007–08 2008–09 2009–10 2010–11 2011–12 2012–13 2013–14
n 2,121 2,233 2,216 2,088 3,252 3,746 3,685
Gender
Male 40% 36% 39% 43% 40% 42% 44%
Female 60% 64% 61% 57% 60% 58% 56%
Missing 17 23 11 10 15 0 0
Cultural background
Aboriginal and/ or Torres Strait Islander
17% 17% 19% 18% 13% 14% 14%
Not Aboriginal and/ or Torres Strait Islander
83% 83% 81% 82% 87% 86% 86%
Not stated 716 866 768 667 362 297 306
Country of birth
Australia NA* NA* NA* NA* 78% 75% 76%
Countries other than Australia
NA* NA* NA* NA* 22% 25% 24%
Missing 414 326 313
Age
15–24 years 45% 42% 43% 38% 36% 34% 31%
25–34 years 26% 25% 26% 26% 28% 29% 30%
35–44 years 18% 21% 19% 21% 21% 21% 22%
45 years and older 11% 12% 12% 15% 16% 16% 17%
Missing 474 518 463 339 587 566 623
Complex needs
% of service users with complex needs**
31% 31% 33% 36% 38% 35% 35%
Source: AIHW Confidentialised Unit Record Files from Supported Accommodation Assistance Program (SAAP) (2007-08, 2008-09, 2009–10 and 2010–11) and the Specialist Homelessness Service Collection (2011–12, 2012–13 and 2013-14)
Notes: Denominator is number of unique clients. Only includes clients with a Client ID and may therefore underestimate the total number of actual clients seen. *Data on country of birth not available in the SAAP dataset (2008-09, 2009–10 and 2010–11) **Complex needs clients are defined as clients with at least three of the following needs: Housing (SAAP), Accommodation or Tenure assistance (SHSC); Financial or General or Personal (SAAP), General (SHS); Specialist (SAAP), Mental Health or Family or AOD or Disability or Immigration or Other specialist (SHS).
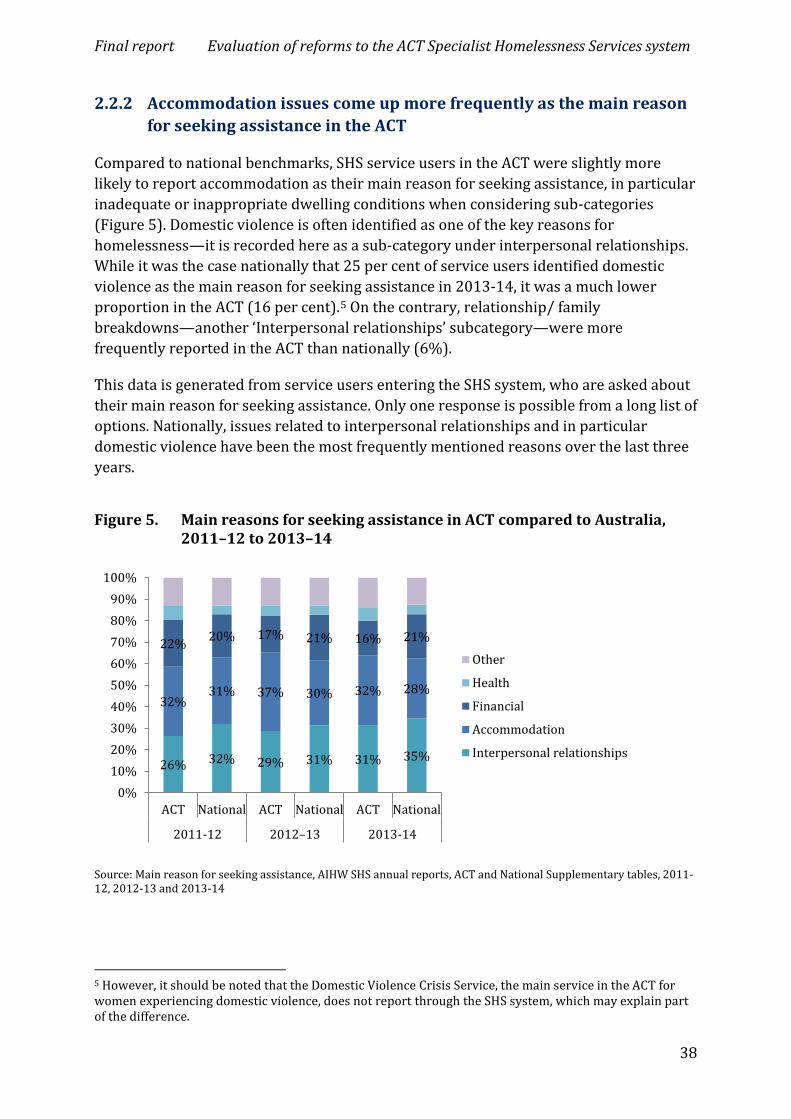
Final report Evaluation of reforms to the ACT Specialist Homelessness Services system
38
2.2.2 Accommodation issues come up more frequently as the main reason for seeking assistance in the ACT
Compared to national benchmarks, SHS service users in the ACT were slightly more likely to report accommodation as their main reason for seeking assistance, in particular inadequate or inappropriate dwelling conditions when considering sub-categories (Figure 5). Domestic violence is often identified as one of the key reasons for homelessness—it is recorded here as a sub-category under interpersonal relationships. While it was the case nationally that 25 per cent of service users identified domestic violence as the main reason for seeking assistance in 2013-14, it was a much lower proportion in the ACT (16 per cent).5 On the contrary, relationship/ family breakdowns—another ‘Interpersonal relationships’ subcategory—were more frequently reported in the ACT than nationally (6%).
This data is generated from service users entering the SHS system, who are asked about their main reason for seeking assistance. Only one response is possible from a long list of options. Nationally, issues related to interpersonal relationships and in particular domestic violence have been the most frequently mentioned reasons over the last three years.
Figure 5. Main reasons for seeking assistance in ACT compared to Australia, 2011–12 to 2013–14
Source: Main reason for seeking assistance, AIHW SHS annual reports, ACT and National Supplementary tables, 2011-12, 2012-13 and 2013-14
5 However, it should be noted that the Domestic Violence Crisis Service, the main service in the ACT for women experiencing domestic violence, does not report through the SHS system, which may explain part of the difference.
26% 32% 29% 31% 31% 35%
32%31% 37% 30% 32% 28%
22% 20% 17% 21% 16% 21%
0%10%20%30%40%50%60%70%80%90%
100%
ACT National ACT National ACT National
2011-12 2012–13 2013-14
Other
Health
Financial
Accommodation
Interpersonal relationships

Final report Evaluation of reforms to the ACT Specialist Homelessness Services system
39
2.3 Service users are less likely to exit SHS services into stable housing
2.3.1 The proportion of service users with an accommodation need remained very high over the whole period
Between 2007–08 and 2013–14, around three quarters of SHS service users reported a need for accommodation provision every year. Support provided against this need declined from 91 per cent of service users with an accommodation need to 45 per cent (Figure 6). This substantial decrease should be considered with care as it is likely to be affected by the change in the SHS data system, from SAAP to SHSC in July 2011; services funded under SAAP were providing specifically supported accommodation, while SHSC has a broader scope, including the provision of more non-accommodation services.
Figure 6. Need for and provision of accommodation, 2007–08 to 2013–14
Source: AIHW Confidentialised Unit Record Files from Supported Accommodation Assistance Program (SAAP) (2007-08, 2008-09, 2009–10 and 2010–11) and the Specialist Homelessness Service Collection (2011–12, 2012–13 and 2013-14)
Considering SHSC years only and comparing these to national figures, it still appears that the ACT has a lower and apparently decreasing proportion of clients with their accommodation needs being met6. National figures have improved over the period (Table 7). The gap between ACT and national levels is largest for short-term or
6 Statistics are slightly different in between Figure 6 and Table 6 as the latter comes from AIHW published data while the former come from unique record level data analysed by ARTD to ensure comparability over years (see section 1.5.3 about data limitations), but the trend is similar.
76%81%
75% 79% 76% 77%73%
91% 91% 91% 91%
53%45% 45%
2007-08 2008-09 2009-10 2010-11 2011-12 2012-13 2013-14
Need identified as % of clients Provided as % of need identified

Final report Evaluation of reforms to the ACT Specialist Homelessness Services system
40
emergency accommodation and medium-term/ transitional housing, while the ACT is doing slightly better in terms of long-term housing.
The inability to meet the accommodation needs of all service users is a strong concern for SHS providers in the ACT. The most frequent response to an open-ended question in the SHS online survey about the main aspect that required change in the ACT SHS system was an increase in accommodation.
Table 7. Clients with accommodation provided as % of need identified in ACT compared to Australia, 2011-12 to 2013-14
2011–12 2012–13 2013–14
Provided as % of need identified ACT Australia ACT Australia ACT Australia
Accommodation provision 58% 62% 51% 64% 54% 70%
Short term or emergency accommodation
50% 68% 45% 70% 50% 76%
Medium term/transitional housing 27% 42% 22% 43% 20% 41%
Long term housing 8% 8% 11% 9% 9% 6%
Source: Clients with accommodation need, accommodation provided as % of need identified, AIHW SHS annual reports, ACT and National Supplementary tables, 2011-12, 2012-13 and 2013-14
This trend in meeting accommodation needs cannot be explained solely by changes in the data system from SAAP to SHSC in 2011. It could be that it reflects the rebalancing over time from accommodation-based supports to outreach that was promoted by the 2009 reforms. Figure 7 shows the number of support periods, split between accommodation and non-accommodation support between 2007-08 and 2013-14, with still the same difficulty of comparison over time with the change in SHS system in 2011.
2.3.2 Increases in the provision of accommodation and non-accommodation support
The first noticeable trend in the provision of support is the increase in the total number of support periods provided, both accommodation7 and non-accommodation supports, and a shift in emphasis towards proportionally more non-accommodation support in line with reform directions.
Figure 7 shows that in 2007-08, before the reforms were introduced, there were 2,683 support periods, of which 1,556 (58%) were for non-accommodation support. There is a spike in 2011-12 that declines slightly such that in 2013-14 there were 4,129 support periods of which 2,811 (68%) were for non-accommodation support. The actual number
7 Defined as support periods with at least one day of accommodation provided

Final report Evaluation of reforms to the ACT Specialist Homelessness Services system
41
of non-accommodation support periods is probably underestimated as a number of services are not required to report through the SHSC system and those services are mostly non-accommodation services, providing practical assistance.
Figure 7. Number of support periods (accommodation and non-accommodation), 2007-08 to 2013-14
Source: AIHW Confidentialised Unit Record Files from Supported Accommodation Assistance Program (SAAP) (2007-08, 2008-09, 2009–10 and 2010–11) and the Specialist Homelessness Service Collection (2011–12, 2012–13 and 2013-14)
Note: support periods from the CIS (FirstPoint) have been excluded from all analyses at support period level to avoid double counting,
The distinction between accommodation and non-accommodation support is not always clear and can even change over the course of a service user’s support. The following case study provides a practical example of support provided to an Aboriginal and Torres Strait Islander service user that initially focused on sustaining the tenancy and progressively extended to other types of non-accommodation support (Box 1).
1,127 1,121 1,169 1,2151,586 1,512 1,318
1,556 1,541 1,548 1,342
2,327 2,7802,811
2,683 2,662 2,717 2,557
3,9134,292 4,129
2007-08 2008-09 2009-10 2010-11 2011-12 2012-13 2013-14
Non-accommodation support periods
Accommodation support periods

Final report Evaluation of reforms to the ACT Specialist Homelessness Services system
42
Box 1. Case study: Aboriginal service user
Context Catherine moved to the ACT around 20 years ago. She is from a country town. Catherine lives with her adult daughter. Occasionally other members of her family stay with her temporarily. Catherine receives a pension. Catherine described her health as good, and although she sometimes gets stressed she said she manages it okay. Catherine described herself as connected to her community—many of her children and grandchildren live close by. Catherine said she takes one day at a time and doesn’t really think about the future. Catherine is happy with the house she lives in. It is close to the shops and near the bus stop. Catherine did say though that there are a lot of ‘rednecks’ in the area. What happened Inanna, an accommodation and outreach program with high level of Aboriginal & Torres Strait Islander service users, began providing case management support to Catherine in mid-2013, when Housing ACT approached Inanna as Catherine was identified as needing support to sustain her tenancy. Once Catherine connected with Inanna, the tenancy of her house was transferred to Inanna and Catherine pays rent directly to Inanna. Inanna can also do housing inspections. This is a supported tenancy option, and the idea is that for people who have difficulty negotiating a complex system like Housing ACT, the landlord can have a closer relationship with them (than Housing ACT) to support them to sustain their tenancy. Catherine began to have regular visits from a case worker. The case worker developed a case management plan with Catherine, focusing on supporting Catherine to manage her tenancy. The case worker mainly talked with Catherine about managing family relationships (sometimes family members visiting Catherine would have disruptive behaviour, leading to complaints from neighbours to Housing ACT). The case worker talked with Catherine about being responsible for her visitors’ behaviour around her neighbourhood, and they also supported her to manage conflict within her family and control large numbers of people when they were ‘out of control’. Other support provided included liaising with Housing ACT to address maintenance issues at her house; provision of a small number of material items, such as a basket of fruit and vegetables, baby clothes and children’s books; and giving Catherine contact details for services such as a food bank, and cleaners when she requested them. Catherine’s case worker also asked if she would like to be connected with any social groups, but she declined at that time. Catherine’s case worker has changed over time as her original case worker moved on from Inanna. Catherine’s first case worker visited her regularly, initially twice a week and then weekly or fortnightly. Subsequent case workers have met with her generally weekly or fortnightly. Sometimes the case workers had difficulty meeting with Catherine as she was not at her house at the agreed meeting time. Catherine developed a particularly warm relationship with her first case worker (she described her as ‘lovely’) and said she talked about ‘everything’ with her, about her family and where she comes from. Catherine described the case workers as ‘pretty helpful’, and said if she asked them something they would tell her the truth. Outcomes Catherine will soon move to another house. She said this is because her neighbours have complained about the noise from her grandchildren when they visit her. Catherine doesn’t mind moving. She said it will be better for her as it will be a new start. She said she will tell the grandchildren that they have to stay away. Catherine has seen the house she is moving to—it is near a park, and the bus stop is across the road. Catherine is happy that the house has a big backyard; and a high fence, which will make it difficult for her great-grandchild to get out when he visits. She is also happy that the rent is less than the house she is currently in. Catherine is not sure when she is moving, but thinks it is in the next week or so. She is packing up the house now, with the help of her grandchildren. Learning/ reflection Catherine was linked in with a case worker who visited her regularly at her own house. The case worker supported Catherine to address issues that impact on her capacity to sustain her tenancy. Inanna said they had to have difficult conversations with Catherine but she knows they have her interests at heart and she feels connected to them. One of the challenges in providing support to Catherine was working with a large group of people (Catherine’s family members often visited her) when the focus of Inanna’s

Final report Evaluation of reforms to the ACT Specialist Homelessness Services system
43
support was Catherine. The support provided by Inanna to clients in its homelessness program is not time limited and support is provided as long as the client is housed. The ultimate goal is for tenants to take on the tenancy themselves. The benefit of this program is that Inanna can work more flexibly than Housing ACT, with its large portfolio of tenants. Inanna commented that Catherine has had periods of great stability, where they have not needed to provide much intensive support. They said that soon Catherine will be able to manage independently from Inanna, and they felt that the move to a new house will enable Catherine to have a ‘fresh start’.
2.3.3 Clients are entering the SHS system with more severe housing needs and are more likely to be exiting into non-stable accommodation
The status of clients exiting specialist homelessness services is related to their accommodation status prior to receiving support, the complexity of their need and the intensity of services with which they could be provided. Increasingly clients accessing SHS accommodation supports are more likely to be vulnerable with higher needs and poor housing situations. Only 8 per cent were recorded as having ‘no tenure/ marginal renter’ on entry to the sector in 2008-09, increasing to 32 per cent in 2013-14, see Figure 8. While this is a reflection of the reforms towards providing more equitable access to SHS services to those most in need, it also partly explains the increased difficulty in achieving outcomes.
This increase in need is associated with a lower proportion of clients exiting SHS support into long-term housing—in 2008-09 there were 67per cent and in 2013-14 there were 49 per cent who exited from an accommodation support into private rental or social housing. There were also more exits into homelessness—in 2008-09 there were 3 per cent and in 2013-14 there were 17 per cent whose housing status on exit from an accommodation service was listed as ‘no tenure/ marginal renter’. A key pattern appears to be a substantially lower proportion of service users being assisted into social housing (from 53% in 2008-09 to 38% in 2013-14) with proportionally more in short term accommodation (from 7% to 18%). The public housing occupancy rate remained over 98 per cent in the ACT over the whole period.8 When looking at service users who had multiple support periods in 2013-14, the main difference is the higher proportion exiting into crisis accommodation: 13 per cent exited into crisis/ short-term accommodation, compared to 7 per cent for service users with only one support period.
Over the 2009-2014 period, the ACT consistently had the longest duration of accommodation support compared to other States and Territories, as measured by the average number of accommodation nights by client: 124 nights of accommodation on average in 2008-09 (57 nationally) and 141.8 in 2013-14 (81.8 nationally). At the same time, there has been an increase in the average number of non-accommodation support periods from 1,541 (0.7 per client) in 2008-09 to 2,811 (0.8 per client) in 2013-14—another measure of intensity.
8 Productivity Commission, Report on Government Services 2015, Housing and homelessness services sector overview, G.20, Table 17A.23

Final report Evaluation of reforms to the ACT Specialist Homelessness Services system
44
Figure 8. Service users’ housing outcomes, 2008–09 and 2013–14
Source: Client tenure at beginning and end of support, for those who required support to obtain housing, AIHW Confidentialised Unit Record Files from Supported Accommodation Assistance Program (SAAP) (2008-09) and the Specialist Homelessness Service Collection (2013-14)
To compare the ACT situation with what has happened nationally, we are using AIHW published data only for the last three years of the period, as categories changed between SAAP and SHSC. This explains why the numbers presented in Figure 9 are slightly different (see section 1.5.3 about data limitations).
Figure 9 shows that exits into social housing in the ACT have increased over the period, from 36 per cent to 45 per cent of service users, and were consistently higher than the national figures that remained around 20 per cent in each year. The ACT has consistently had a lower proportion of service users exiting into private rental, but this seems to have improved markedly in 2013-14. In that year, the ACT had a slightly higher
24%
53%19%
14%
13%
7%14%
8%8%
3%13%11%
0%
10%
20%
30%
40%
50%
60%
70%
80%
90%
100%
Before After
2008-09
Other
Owner
Boarding/caravan park
No tenure/marginal renter
Rent free accommodation
Crisis/short term accommodation
Private rental
Public/community
24%38%
13%
11%8%
18%16%
9%32%
17%3% 3%
0%
10%
20%
30%
40%
50%
60%
70%
80%
90%
100%
Before After
2013-14
Other
Owner
Boarding/caravan park
No tenure/marginal renter
Rent free accommodation
Crisis/short term accommodation
Private rental
Public/community

Final report Evaluation of reforms to the ACT Specialist Homelessness Services system
45
proportion of exits into secure housing, that is, private rental or social housing (66%) than was the case nationally (63%).
Figure 9. Most common housing situation after support in ACT compared to Australia, 2011–12 to 2013–14
Source: Clients with closed support, by housing situation at end of support, AIHW SHS annual reports, ACT and National Supplementary tables, 2011-12, 2012-13 and 2013-14
36%
20%
37%
21%
45%
21%
14%39%
16%39%
21%
42%
25%
20%17%
19%16% 17%
16%13%
22%13% 11% 11%
0%
10%
20%
30%
40%
50%
60%
70%
80%
90%
100%
ACT Australia ACT Australia ACT Australia
2011–12 2012–13 2013–14
Institutional settings
No shelter or improvised/inadequate dwelling
House, townhouse or flat - couch surfer or with no tenure
Short term temporary accommodation
Private or other housing - renter, rent free or owner
Public or community housing - renter or rent free

Final report Evaluation of reforms to the ACT Specialist Homelessness Services system
46
A majority of SHS providers feel that housing outcomes have worsened over the period
SHS providers’ feedback about the change in housing outcomes during the reform period is in line with SHS data showing that more service users are exiting into a non-stable housing situation. When asked about the change in housing outcomes since 2009, 60 per cent of the respondents to the SHS online survey said that it had worsened; including 27 per cent who suggested it had worsened a lot (Figure 10). Only service providers categorised under service funding agreements as men’s services unanimously reported that outcomes were better now than before the reforms. This may reflect the existence of more targeted interventions predominantly used by men, such as Street to Home.
Non-SHS organisations confirmed this perception, with 45 per cent of the respondents to the partner survey feeling that housing outcomes had worsened over the period (20% unchanged and 35% improved). To the open-ended question about what aspect should be changed in the ACT SHS system, the most common answer was to increase safe/ affordable accommodation.
Figure 10. SHS providers’ perception of changes in housing outcomes
Source: SHS online survey, February 2015
27%
22%
11% 11%13%
7%9%
1-Worsened a lot 2 3 4-Unchanged 5 6 7-Improved a lot
Over the last six years, how would you describe any change in housing outcomes for service users in the ACT?

Final report Evaluation of reforms to the ACT Specialist Homelessness Services system
47
2.3.4 Service users face difficulties entering the private rental market
As identified in Figure 9, the ACT has a much lower proportion of service users exiting into private housing. While the rate has increased in recent years, only 21 per cent of service users exited into private rental in 2013-14, half the proportion nationally (42%). This is the opposite of exits into social housing, which in the ACT are more than double the national rate (45% in the ACT compared to 21% nationally). This has been a long standing difference. When asked about the barriers to enter and sustain private rental housing, most SHS providers mentioned, in some way, the affordability of the private market and the attitudes of real estate agents.
“Common perception in society that people exiting a homelessness service are not able to sustain a tenancy from a financial position.” – SHS provider
Providers suggested solutions that were mainly around improving relationships with real estate agents and developing financial incentives or tenancy guarantees for landlords to house SHS service users. During the workshop where preliminary findings of the present evaluation were presented at the end of March 2015, some SHS providers reported a recent improvement in relationships with real estate agents and a more accessible private rental market in the ACT. The higher rate of exits to private rentals in 2013-14 (21% compared to 16% in 2012-13 and 14% in 2011-12) supports this view and provides some hope that further gains could be made in this direction. There are some examples of homelessness programs that have successfully engaged with real estate agents, such as the North Coast Accommodation Project in the North Coast of New South Wales.9 Building rapport, and trust as well as providing financial guarantees were identified as key success factors. Further suggestions are provided in the implications section (5.2.3).
9 ARTD Consultants, Evaluation of the North Coast Accommodation Project, March 2013: www.housing.nsw.gov.au/NR/rdonlyres/F96C0123-AAE8-41AE-99B0-1B287040737B/0/EvaluationoftheNorthCoast.pdf
Final report Evaluation of reforms to the ACT Specialist Homelessness Services system
48
3. Service delivery outcomes
This chapter describes service users’ needs and how services responded to them over the 2009–2014 period. It examines non-housing outcomes and addresses the following overarching evaluation question:
What has been the impact of the reforms in terms of service users’ ability to live independently; access supports, and sustain tenancies?
3.1 Service users’ needs and expectations are still high
3.1.1 Most SHS providers report using a case management and outcomes measurement tool
Based on the analysis of SHS service provider six-monthly performance reports for January to June 2014, almost all services reported using a case management/ outcome measurement tool. Almost half of those mentioning the use of a tool referred to the Outcomes Star tool, in particular youth services. Other services referred to other tools, typically their own case management or outcomes measurement tools.
SHS providers also mentioned the Specialist Homelessness Information Platform (SHIP), the SHIP case plans, the SHIP database and other SHIP tools (e.g. the Specialist Homelessness Service Case Management Resource Kit). Very positive feedback was provided about these tools, developed by AIHW over years. SHIP helps services to not only manage their clients, but also look at their own client data to monitor service delivery. The SHS Outcomes Reporting Framework that was introduced in 2014 is also well perceived.
3.1.2 Needs and expectations from service users remain high
Feedback provided by services indicates that expectations from service users have increased over recent years or at least remained at a high level, similar to before reforms were introduced. In particular, a lot of service users expect to be housed quickly. This was considered a challenge in the context of stable or reduced resources.
Some services reported increased client complexity and more clients from culturally diverse background.
“More complex situations that require significant support and nowhere to refer them to.” – SHS provider
“The cultural origin of clients presenting to the service has changed over time. There has been an overall increase in Culturally and Linguistically Diverse clients using the service.” – SHS provider
Final report Evaluation of reforms to the ACT Specialist Homelessness Services system
49
SHS providers also suggested that the needs of service users have changed in response to changes in the services available, for example due to reduced capacity or new services being provided (see section 3.2.4). As the needs of clients have changed, providers have needed to continue to review the types of services they offer.
However, new types of services offered and new accommodation models do not always meet the needs of all service users. For example, the reform of the youth homelessness services promoted a shift from the congregate housing model to the cluster model, but services report that shared accommodation is not suitable for all young people (see Box 2 about the case study on youth homelessness services).
3.2 ACT SHS provide a high level of support with some new services to respond to emerging needs
3.2.1 ACT still provides high intensity of support with 152 days of support on average in 2013-14
Assessing the impact on the intensity of services is difficult from SHS data, firstly because intensity of support is not captured per se, and secondly because of changes to the SHS system from SAAP to SHS in July 2011.
In this analysis, intensity of support was operationalised in two ways— duration of accommodation supports and number of non-accommodation supports. Before the reforms were introduced, the ACT had the longest average (mean) length of support. A decrease in the length of support periods was identified as a statement of success in the SHS Outcomes Reporting Framework, reflecting one of the operational objectives of the reforms.

Final report Evaluation of reforms to the ACT Specialist Homelessness Services system
50
Figure 11 shows that the average length of closed support periods has not decreased in the ACT, increasing by 26 per cent from 121 days in 2007–08 to 152 days in 2013–14. However, the gap between the ACT and the national average has been substantially reduced with the national average increasing by 68 per cent over the same period of time, albeit from a much lower base. Looking at differences between length of support for accommodation support periods and for non-accommodation support periods does not reveal any clear trend.
Figure 11. Mean length of closed support periods in ACT compared to Australia, 2007–08 to 2013–14
Source: ACT: AIHW Confidentialised Unit Record Files from Supported Accommodation Assistance Program (SAAP) (2007–08, 2008–09, 2009–10 and 2010–11) and the Specialist Homelessness Service Collection (2011–12, 2012–13 and 2013–14); National: AIHW SHS annual reports, National Supplementary tables, 2007–08, 2008–09, 2009–10, 2010–11, 2011–12, 2012–13 and 2013–14
121
163180
143
110
133152
50 56 63 6879 84 81
2007-08 2008-09 2009–10 2010–11 2011–12 2012–13 2013-14
ACT Australia

Final report Evaluation of reforms to the ACT Specialist Homelessness Services system
51
Similar to the definition of service users with complex needs, support periods providing ‘intensive support’ were identified where at least three types of services including accommodation, general services and at least one specialist service were provided.10
Figure 12 shows that the proportion of support periods providing intensive support services did not really change over the period, staying slightly above 20 per cent of support periods.
Figure 12. Proportion of support periods providing ‘intensive support’, 2007-08 to 2013-14
Source: ACT: AIHW Confidentialised Unit Record Files from Supported Accommodation Assistance Program (SAAP) (2007–08, 2008–09, 2009–10 and 2010–11) and the Specialist Homelessness Service Collection (2011–12, 2012–13 and 2013–14)
Note: * definition for intensive support is equivalent to the equivalent of the one for complex needs, when considering support services.
3.2.2 Duration of accommodation supports is a better predictor of outcomes than number of non-accommodation supports
We identified the impact of the length of accommodation support and the number of non-accommodation supports on outcomes by conducting a regression analysis on whether outcomes were good or bad, essentially holding demographic and pre-entry housing status constant. A logistic regression model was conducted, with housing status at the conclusion of the support period as the dependent variable. The model included the two measures of service intensity above (number of non-accommodation supports and length of accommodation support) as dependent variables, as well as demographic factors.
10 Support periods providing ‘intensive support’ are defined as support periods with at least three of the following support services provided: Housing (SAAP), Accommodation or Tenure assistance (SHSC); Financial or General or Personal (SAAP), General (SHS); Specialist (SAAP), Mental Health or Family or AOD or Disability or Immigration or Other specialist (SHS).
23% 21% 23% 25%20% 23% 21%
2007-08 2008-09 2009-10 2010-11 2011-12 2012-13 2013-14

Final report Evaluation of reforms to the ACT Specialist Homelessness Services system
52
The analysis showed that length of accommodation support is more predictive of good outcomes, rather than intensity as measured by numbers of supports, when included in a multivariate model. This finding also holds when looking at overall length of support period (as opposed to just accommodation)— those with longer support periods have better housing outcomes at the conclusion of their support period.
3.2.3 The gap between ACT and the rest of Australia in repeat homelessness appears to be narrowing
In the 2011–12 NAHA performance report, it was identified that the ACT had the highest rate of people experiencing repeat periods of homelessness (13.2% compared to 7.3% nationally). The present evaluation offered the opportunity to explore reasons why and one of the case studies focused on this particular issue.
The AIHW has a specific definition of repeat homelessness:
A client has a repeat period of homelessness if at some time during the reporting period the client changed status from ‘homeless’ to ‘not homeless’ and back to ‘homeless’.
As such, simply having more than one support period in a year is not itself an indicator of repeat homelessness—which can be confusing.
One of the potential reasons initially identified was the introduction of the Centralised Intake Service (CIS) in the ACT. However, looking at individual level data—at service user level as opposed to support period level, which allows accounting for service users coming back—it appears that the ACT may be improving but still has a higher proportion than the national average (Table 8—figures are slightly different from the published data mentioned above, see data limitations in section 1.5.3).
Table 8. Repeat homelessness in the ACT compared to Australia, 2011–12 to 2013–14
2011–12 2012–13 2013–14
ACT 11% 6% 8%
Australia 5% 4% NA*
Source: ACT: AIHW Confidentialised Unit Record Files from the Specialist Homelessness Service Collection (2011–12, 2012–13 and 2013–14); National: AIHW SHS annual reports, 2011–12, 2012–13 and 2013–14.
* Repeat homelessness was not available in the 2013–14 AIHW SHS annual report
When looking at the types of services that have a higher proportion of service users with repeat homelessness, most of them are youth homelessness services. This could be explained by the tendency for young people experiencing homelessness to cycle in and out of homelessness. This explanation is actually supported by the fact that the ACT has

Final report Evaluation of reforms to the ACT Specialist Homelessness Services system
53
a higher proportion of young people than other States: 31.9 per cent compared to 19.2 nationally in 2013-14.
Service providers also identified as another contributing factor the geographic location of the ACT with a lot of transient service users moving in and out of the territory.
3.2.4 The reforms contributed to the introduction of more non-accommodation support
There has been a clear shift in focus for the ACT SHS system over the period 2009–2014 towards non-accommodation support—both in absolute and relative terms. In 2008-09 there were 2,662 support periods, of which 1,541 (58%) were for non-accommodation support. There is a spike in 2011-12 that declines slightly such that in 2013-14 there were 4,129 support periods of which 2,811 (68%) were for non-accommodation support (Figure 7).
SAAP data and SHSC data record very different categories or types of non-accommodation support which prevents analysis of the changes in support types over time, particularly prevention and early intervention supports. However, AIHW data shows that, in 2013-14, 44 per cent of SHS clients accessing the ACT SHS system needed assistance to sustain a tenancy (i.e. early intervention) and of these 82 per cent received a service. This and other support types could be monitored over time to assess a shift in focus towards prevention and early intervention.
Despite the SHSC data, it is possible to clearly identify some new services the reforms made available to service users. The reform of the youth homelessness services is a good example with more life skills support, a stronger emphasis on education and new services for families. Some new partnerships were also developed, in particular with education providers, such as the Canberra Institute of Technology (CIT). Education outcomes for young people are discussed in section 3.3.3. These new services seem to meet an existing demand and emerging needs as identified in recent studies (Box 2).11
11 AHURI, The Cost of Youth Homelessness in Australia Study, Snapshot report 1, 2015

Final report Evaluation of reforms to the ACT Specialist Homelessness Services system
54
Box 2. Case study: reform of the youth homelessness services
Focus question: What has been the early impact of the new youth homelessness services model introduced in 2012? Context The ACT youth homelessness sector went through major changes over the 2009–2014 period. In the context of the Road Map and a substantial funding reduction, the ACT government conducted a consultation process with the sector at the beginning of 2011. This led to the introduction of a new youth homelessness services model in March 2012 following a tender process. The reform shifted the focus from crisis response to support over a spectrum of intervention, ranging from early intervention and prevention, crisis mediation and sustaining tenancies. Eight discrete but complementary service delivery models replaced 19 youth homelessness services while the government funding allocated to the youth sector stabilised around $4.5 million. The number of young people supported by the ACT youth homelessness sector increased by 33 per cent over the period, from 721 in 2008-09 to 995 in 2013-14. What happened The most important change that affected the sector is the reduction in the number of services involved (from 19 to 8). The consequence has been a reduction in staff for some services, but others that joined the sector following the tender process had to increase their resources to deliver a new service. In terms of the service delivery model, a major change was the shift away from crisis intervention towards early intervention. Services were positive about the introduction of the cluster model with onsite case management and also the refurbishing of refuges. The new model also saw some changes in terms of types of support services provided, with more life skills support, a stronger emphasis on education and new services for families. All these new services seem to meet an existing demand among the youth cohort according to feedback collected from services. This is confirmed by the recent study about the Cost of Youth Homelessness in Australia (Snapshot Report 1), in particular in relation to the need for support at the family level and for young people who are couch-surfing. The youth homelessness sector in the ACT benefits from having a retained workforce, with a high level of experience, knowledge of the sector and leadership. It also has a high level of integration that is still reported by services three years after the new model was introduced. However, collaboration with the other specialist homelessness services in the adult sector (e.g. men and women services) appears to have decreased. This was reported to be due to the introduction of the Centralised Intake Service that led to less opportunity to connect through referrals. On the other hand, there seems to be more collaboration with other organisations in the broader sector, for instance education stakeholders such as the Canberra Institute of Technology (CIT). Changes within other key organisations in the sector, such as the youth centres that had some diminished capacity, affected the services’ ability to get in contact with potential clients. With regard to the Centralised Intake Service, while it was acknowledged that it could provide more fairness in the allocation of accommodation, it was considered less responsive than the previous system (further analysis about the CIS is provided in section 4.1). This was perceived as an issue for the youth cohort where the window of opportunity is limited. Outcome Services were positive about most of the changes introduced in terms of accommodation and support services. However, it seemed that the focus on shared accommodation is not appropriate for all service users. In particular high needs service users with mental health, drug and alcohol issues or history of trauma may have more difficulties with sharing their accommodation with another person, leading to various unsuccessful attempts. Other gaps were identified in relation to accommodation for young females (a service existed before but has not been retained), younger service users (14 year olds in particular) and Aboriginal and Torres Strait Islander young people. The lack of housing solutions at exit point was also considered as a key issue across the board, from social housing to private rental. Learning/ reflection What can be learnt from the first years of the new youth homelessness services model is that the accommodation mix may require some adjustment with more single and crisis accommodation to meet the needs of some higher needs service users for whom shared accommodation does not seem to work.

Final report Evaluation of reforms to the ACT Specialist Homelessness Services system
55
Another key area for improvement is the relationship with real estate agents with some effective strategies involving relationship building and financial guarantees being used in other jurisdictions e.g. North Coast Accommodation Project in New South Wales or a not-for-profit real estate agency in Victoria. Finally, services expressed the wish to take the time to consolidate learnings before considering another service innovation. The uncertainty around funding was also considered as a constant challenge in terms of business planning and staff retention, in an area where they are expected to provide stability to service users.
3.3 Non-housing outcomes seem to have improved over the period
When examining service users’ outcomes against the intensity of support provided, it is not possible to reach a conclusion at an overall level, as there are no overall outcomes measures that could be considered against an overall indicator of intensity. Consequently, the evaluation approached this from the perspective of separate types of support/ outcomes: accommodation (see section 2.3) and non-accommodation, with employment and education offering specific outcome measures (see following sections).

Final report Evaluation of reforms to the ACT Specialist Homelessness Services system
56
3.3.1 Most service users have a case management plan, and achieve some of their goals
The main way SHS providers manage the services provided to each service user and monitor progress is through a case management plan. Thus, the proportion of service users with a case management plan is considered as a key performance indicator for SHS providers. In the ACT, around 60 per cent of service users have a case management plan which is close to the national average and remained relatively stable over the last three years of the period. Of those with a case management plan, the proportion of service users achieving some of their goals was higher in the ACT than nationally for each year between 2011-12 and 2013-14 (Figure 13). It is unclear the extent to which goals set in the ACT are comparable to those recorded in case management plans in other jurisdictions—outcomes that can be clearly defined, such employment status, may prove more accurate comparisons (see next section).
Figure 13. Achievement of case management goals in the ACT compared to Australia, 2011–12 to 2013–14
Source: Clients with closed support, by case management plan status, AIHW SHS annual reports, ACT and National Supplementary tables, 2011–12, 2012–13 and 2013–14
62%
88%
54%
88%
60%
84%
57%
74%
55%
76%
63%
75%
0%
10%
20%
30%
40%
50%
60%
70%
80%
90%
100%
% of clients withcase management
plan
Of those, % ofclients where some
goals were met
% of clients withcase management
plan
Of those, % ofclients where some
goals were met
% of clients withcase management
plan
Of those, % ofclients where some
goals were met
2011-12 2012-13 2013-14
ACT Australia

Final report Evaluation of reforms to the ACT Specialist Homelessness Services system
57
3.3.2 Employment outcomes have improved substantially
Employment is often identified as a key support area where success can easily be identified. In 2013–14, 16 per cent of ACT service users reported a need for employment assistance—which is much higher than the national proportion (6.5%). Focusing on these service users with employment needs, it appears that their outcomes have substantially improved over the 2009–2014 period (Figure 14). This also compares very well with national figures, where the proportion of service users (with employment needs) employed at exit slightly decreased from 22 per cent in 2011–12 to 19 per cent in 2013–14. This seems to indicate a positive impact of the reforms that brought a stronger focus on non-housing outcomes.
Figure 14. Service users’ employment outcomes, 2008–09 and 2013–14
Source: Labour force status for clients with a need for employment assistance, at beginning and end of support, AIHW Confidentialised Unit Record Files from Supported Accommodation Assistance Program (SAAP) (2007–08, 2008–09, 2009–10 and 2010–11) and the Specialist Homelessness Service Collection (2011–12, 2012–13 and 2013–14)
14% 13%18% 16%
26%
14%18%17%
22% 22% 22% 22% 23%
34%
0%
10%
20%
30%
40%
50%
60%
70%
80%
90%
100%
2007-08 2008–09 2009–10 2010–11 2011–12 2012–13 2013–14
% employed, of those with a need for employment assistance
Before
After

Final report Evaluation of reforms to the ACT Specialist Homelessness Services system
58
3.3.3 Youth participation in education has slightly improved over the period
Another key reform was the new model for youth homelessness services introduced in March 2012. While it is still early to identify an impact of this reform, it seems that the education outcomes for young service users are slightly improving. The proportion of 15–24 year old service users exiting into education reached a low in 2008–09 (17%) and progressively improved to almost a third (31%) of young service users being students at the end of support in 2013–14 (Figure 15).
Figure 15. Education outcomes for young service users, 2007–08 to 2013–14
Source: Education status for clients aged 15–24 at beginning and end of support, AIHW Confidentialised Unit Record Files from Supported Accommodation Assistance Program (SAAP) (2007–08, 2008–09, 2009–10 and 2010–11) and the Specialist Homelessness Service Collection (2011–12, 2012–13 and 2013–14)
Note: it was not possible to only focus on service users with education needs (similarly to the analysis conducted on employment outcomes) as this variable did not exist in SAAP.
29% 27%21%
17%23% 25%
20% 22%26% 24%
31% 29% 28% 31%
0%
10%
20%
30%
40%
50%
60%
70%
80%
90%
100%
Before After Before After Before After Before After Before After Before After Before After
2007–08 2008–09 2009–10 2010–11 2011–12 2012–13 2013–14
% students (15-24 year old service users)
Post-secondary/ employment training
Primary/ secondary school

Final report Evaluation of reforms to the ACT Specialist Homelessness Services system
59
The apparent improvement in non-housing outcomes over the period is supported by feedback provided by SHS providers. In the online survey, 44 per cent of them felt that non-housing outcomes had improved for service users since 2009 (Figure 16). This may be an early indication of a positive impact of the stronger focus on non-accommodation support brought by the 2009 policy reforms.
Figure 16. SHS providers’ perception of changes in non-housing outcomes
Source: SHS online survey, February 2015
4%
11%
18%
22%20% 20%
4%
1-Worsened a lot 2 3 4-Unchanged 5 6 7-Improved a lot
Over the last six years, how would you describe any change in non-housing outcomes for service users in the ACT?

Final report Evaluation of reforms to the ACT Specialist Homelessness Services system
60
4. Sector outcomes
This chapter examines the impact of the reforms on the SHS system between 2009 and 2014 with a particular focus on the impact of the introduction of a centralised intake model. It assesses the level of cooperation in the service system and remaining gaps in service delivery. The chapter addresses the following overarching evaluation question:
Are SHS providers working in a more integrated manner with each other and with mainstream services, particularly mental health and social housing; and what gaps in service delivery exist?
4.1 The centralised intake model seems to be operating as intended, but there is room for refinement
4.1.1 The Centralised Intake Service (CIS) facilitates access to accommodation to those most in need
The establishment of a centralised intake model for homelessness services in the ACT was formally proposed by the ACT Government in The Road Map in 2009. The aim of the model was to:
develop a more efficient and responsive social housing and homelessness sector enhance service user access to social housing and homelessness services develop greater equity and consistency of practices improve economic and social participation for service users improve integration of homelessness services, employment and training providers
and Centrelink improve data on service needs.
Box 3 describes how the model has been implemented in the ACT and how the process works for service users.

Final report Evaluation of reforms to the ACT Specialist Homelessness Services system
61
Box 3. How the centralised intake model is implemented in the ACT
In early 2010, the ACT Government conducted a tender process to contract out the delivery of a centralised intake service (CIS). The tender was awarded to Connections ACT, a community-based service provider. The CIS, named ‘FirstPoint’ commenced operation in July 2010. FirstPoint is co-located with a number of other Government and community providers in the One Human Services Gateway, a single gateway which brings together a range of services into an accessible hub. Individuals who require help can ring a toll-free telephone number and make contact with a CIS support worker, or they can also drop in to the service, located in the ACT One Human Services Gateway in Nature Conservation House, Belconnen. The majority of service user contact is done via telephone. After making contact with FirstPoint, service users are taken through an initial assessment of their situation and their needs. Generally, a range of referrals is provided, depending on their circumstances. These may include outreach services, meals, and other non-accommodation supports. Where clients require accommodation, they are placed on a FirstPoint waiting list. FirstPoint support workers use the Daily Capacity Reporter (DCR), their vacancy management system, to determine vacancies within the system. SHS providers list these vacancies, which are updated on a daily basis. Once a vacancy becomes available, the CIS then attempts to contact a service user on the waitlist, who is eligible for that particular type of accommodation (depending on their circumstances). The service user is informed that there is a vacancy and is directed to the service. The service may then undertake their own assessment of the service user, to determine their suitability. Services are not bound to provide accommodation to service users referred by the CIS. If the service deems the service user unsuitable, they inform FirstPoint so that contact can be made with the next service user on the waiting list. FirstPoint follows this process until a service user is accepted into the vacancy. Once registered in the FirstPoint database, FirstPoint does not undertake case management. Rather, they practice what is termed ‘active holding’. FirstPoint support workers attempt to make contact with service users on a monthly basis to check in on their situation. If they cannot make contact, they may close the support period. They also close the support period if the service user no longer requires services.
4.1.2 About half of all clients come through the CIS
Analysis of SHS data suggests that there are many SHS clients who are not seen by the CIS. Analysis has revealed that in 2013-14, around half (47% of clients) saw the CIS, that is, 47 per cent of clients had the CIS listed as a service they attended during that year.
In the SHS online survey, service providers were asked to estimate the proportion of their new service users coming from the CIS. On average, across all services, respondents reported that 42 per cent of their service users were coming from CIS. However, not all services are required to get their client referrals through CIS. Excluding services providing non-accommodation support only and that are not required to get their client referrals from CIS, more than half of respondents (54%, out of 18 services) reported having between 80 and 100 per cent of their service users coming from CIS (Figure 17). Youth services and Aboriginal and Torres Strait Islander services are more likely to report a lower rate of CIS referrals, while services catering for men, women and families tend to report a higher proportion of clients coming from CIS.
For services with less than 100 per cent of clients coming from CIS, other ways of getting clients were self-referral, word-of-mouth and referrals from other agencies.

Final report Evaluation of reforms to the ACT Specialist Homelessness Services system
62
Figure 17. Self-reported proportion of clients referred from the Centralised Intake Service (excluding services providing only non-accommodation support), n=18 services
Source: SHS online survey, February 2015
CIS is giving priority to high needs clients
The CIS is monitoring a number of performance indicators that are specific to the centralised intake model and reported in FirstPoint six-monthly performance reports. The focus of the CIS is to ensure a fair allocation of short-term/emergency and medium term/transitional accommodation vacancies in the context of limited availability. FirstPoint reports on allocation of accommodation by service users’ level of needs, as defined in the four priority categories.12 Figure 18 shows the number of service users (presenting units) waiting for accommodation by month over the 2013–14 financial year, broken down by priority/ level of needs. On average, FirstPoint had 286 service users waiting for accommodation every month with some seasonal variations ranging from 248 in December 2013 to 322 in July 2014. Just over one quarter (28%) on average
12 Requests for assistance to FirstPoint are prioritised into four categories: Priority A have high support needs relative to their personal vulnerability AND have high housing needs (that is, they are in primary homelessness, in a violent or unsafe situation or are at imminent risk of homelessness).Priority B have high housing need while their support need is medium, or high support need while their housing need is medium. Priority C have medium housing need and medium support need. That is, they may have a significant support need but are receiving some support although insufficient to their need or their ability to cope may be at risk if their current situation changes, and they may have temporary accommodation which is detrimental to their wellbeing with no other accommodation options. Priority D have medium housing need while their support need is low, or medium support need while their housing need is low. That is, they have access to accommodation alternatives or other temporary arrangements or may have minor support needs.
17%
4%8%
17%
54%
0-20% of clients >20-40 >40-60 >60-80 >80-100% of clients
What proportion of your new service users would you estimate come through the centralised intake service?
(% of respondents excl. services providning only non-accommodation)

Final report Evaluation of reforms to the ACT Specialist Homelessness Services system
63
have high support needs (Priority A) and 60 per cent with high housing need but medium support needs (Priority B). In line with initial intent, priority is given to high needs service users who have lower waiting times: on average, priority A service users wait 52 days against 61 for priority B, 70 for priority C and 67.5 for priority D (only 12 over the whole period).
Figure 18. Number of CIS service users waiting for accommodation and average waiting time, by level of needs (priority), July 2013 to June 2014
Source: FirstPoint six-monthly performance reports, July–December 2013 and January–June 2014
The main limitation to the CIS model is the availability of SHS accommodation vacancies in the ACT. As shown in section 2.3.3, the SHS system still relies heavily on social housing, which is almost at full capacity (at least 98 per cent occupancy rate over the
322
293 298279
260248
276
305315
273 271
291
0
50
100
150
200
250
300
350
Jul-13 Aug-13 Sep-13 Oct-13 Nov-13 Dec-13 Jan-14 Feb-14 Mar-14 Apr-14 May-14 Jun-14
Number of service users waiting for accommodation
D
C
B
A
5146
5452
54
6561
46 4447
5647
65
93
5956
56 64 63
53 5258
57
60
36
6772
85
77 75
96
78
65 6366
5960
78
139
0 07
0
17
0
24
58
157
0
20
40
60
80
100
120
140
160
Jul-13 Aug-13 Sep-13 Oct-13 Nov-13 Dec-13 Jan-14 Feb-14 Mar-14 Apr-14 May-14 Jun-14
Average waiting time (number of days)
A
B
C
D
Final report Evaluation of reforms to the ACT Specialist Homelessness Services system
64
whole 2009–2014 period), limiting exit points for service users.
Access to long-term public housing is also in high demand. In 2013-14 a total of 22,605 Canberrans lived in public housing across 10,724 tenancies and there were around 2,300 people on the waiting list in June 2014. Other options for longer-term housing exist in the community housing sector and private rental market and may be further developed in the future (see section 5.2.3 about suggestions for the future).
Feedback from service users is positive, however more resources would allow useful follow-up
The majority of CIS service users are satisfied with the service. Surveys of clients are performed annually, and the 2013 survey found that 85 per cent of CIS service users felt respected and listened to, and 71 per cent were satisfied with their contact with the CIS. However, some SHS providers reported that a high proportion of service users’ phone calls were not answered directly, which FirstPoint explained by a lack of resources to manage the demand. Some service providers would also like to see the CIS perform follow-up assessments, which would require additional resources.
Feedback provided by SHS providers also indicates that the CIS may not be suited to all service users. Some Aboriginal and Torres Strait Islander people, for example, may not be comfortable accessing the CIS, because it is seen as a government facility (co-located with other government agencies) whereas they may be more comfortable with Aboriginal and Torres Strait Islander services they know better. While this may be the case for some people, CIS data shows that the proportion of CIS service users who are Aboriginal or Torres Strait Islander is similar to the proportion of the overall ACT SHS service users (around 15%). Having a neutral service may also help Aboriginal and Torres Strait Islander service users who might have had difficulties with Aboriginal and Torres Strait Islander services in the past.
SHS providers agree that roles are clearly defined and CIS refers appropriate service users
In the SHS online survey, service providers were asked to rate their level of agreement with a number of statements in relation to the CIS (Figure 19). A majority of respondents agreed that the CIS roles are clearly defined (40% agreed and 31% mostly agreed) and that the CIS refers appropriate service users (23% agreed and 51% mostly agreed). In line with the data about waiting times by level of needs, services also agreed that the CIS provides a fair way to prioritise services to those most in need (25% agreed and 40% mostly agreed). A majority of services also agreed that the CIS was more effective in linking service users to a broader range of services and getting the right help than the system it replaced.
However, SHS providers clearly disagreed that the CIS was helping collaboration, either with SHS or non-SHS services. This is not surprising as with the introduction of the CIS, front line service staff have fewer incidental opportunities to interact with each other.

Final report Evaluation of reforms to the ACT Specialist Homelessness Services system
65
For instance, youth services indicated that they had fewer interactions with men’s and women’s services than before. While this does not undermine the rationale behind the CIS, being aware of this indirect consequence should help leverage other avenues for sector collaboration. This issue is discussed further in section 4.2.
Figure 19. SHS providers’ feedback about the Centralised Intake Service
Source: SHS online survey, February 2015
A positive outcome from the introduction of the CIS is that services are no-longer required to answer phone calls and initiate the eligibility and intake process with potential service users. There has been a reduction in ‘compassion fatigue’ and more time available to support service users. The allocation task has been moved to the CIS support workers, who are now the ‘gatekeepers’ to the service system.
Related to this, is that clients are required to ‘tell their story’ fewer times than they used to. Prior to the CIS, clients may have moved from service to service, explaining their situation multiple times. Now they only have to do this with the CIS, who then take on the task of phoning around for a suitable accommodation place on their behalf.
4.1.3 While engagement with the CIS has improved, SHS providers identified areas for improvement
The implementation of the CIS seems to have faced some initial resistance by some services. While the engagement of SHS providers with this new model seems to have improved, not all accommodation services regularly use the CIS vacancy management system. Five services at least that are providing accommodation support reported in the online survey having less than half of their service users from the CIS.
5%
5%
21%
26%
25%
40%
23%
5%
7%
37%
36%
40%
31%
51%
43%
34%
19%
15%
13%
14%
10%
48%
55%
23%
23%
23%
14%
15%
0% 20% 40% 60% 80% 100%
Having the centralised intake model has increased our collaboration withnon-specialist homelessness services that our service users need.
Having the centralised intake model has increased our collaboration withother specialist homelessness services.
The centralised intake model makes getting the right help easier for serviceusers than the system it replaced.
The centralised intake model is more effective in linking service users to abroader range of services than the system it replaced.
The centralised intake model provides a fairer way of prioritising servicesfor those most in need.
Within the centralised intake model, the respective roles of the centralisedintake service and my organisation are clearly defined.
The central intake service refers service users that are appropriate for ourservices.
Agree Mostly Agree Mostly Disagree Disagree

Final report Evaluation of reforms to the ACT Specialist Homelessness Services system
66
Beyond the fact that some service users may be less suited to the CIS, SHS providers reported issues with the responsiveness of the system. Some services were struggling with having unfilled vacancies waiting for the CIS to refer a client. It can take two to three days to fill a vacancy, as the CIS needs to follow up with the waiting list, make sure that the person is still in need of support, and then the service will do their own assessment and may not accept that client. The fact that the CIS operates during business hours only has also been raised as a key problem with the service’s ability to respond quickly to accommodate needs. However Housing ACT indicated that a number of services have an arrangement with FirstPoint, which allows them to place a person directly in their service out of hours, if required, and update FirstPoint the next business day.
4.2 Collaboration has improved in the sector over the 2009-2014 period
4.2.1 Overall feedback indicates a slight improvement since 2009
Feedback provided by SHS providers and partner agencies across the health and human services sector indicates that collaboration has improved in the SHS sector since 2009.
When asked how they felt about changes in the way services had been working together over the last six years, 58 per cent of SHS respondents felt that it had improved, most of them indicating a slight improvement (Figure 20) while 7 per cent felt it was unchanged and 36 per cent thought it had got worse. This was confirmed in the partner survey where 65 per cent of health and human services organisations felt that collaboration in the ACT SHS system had improved since 2009, 20 per cent felt it was unchanged and 15 per cent thought it had got worse.
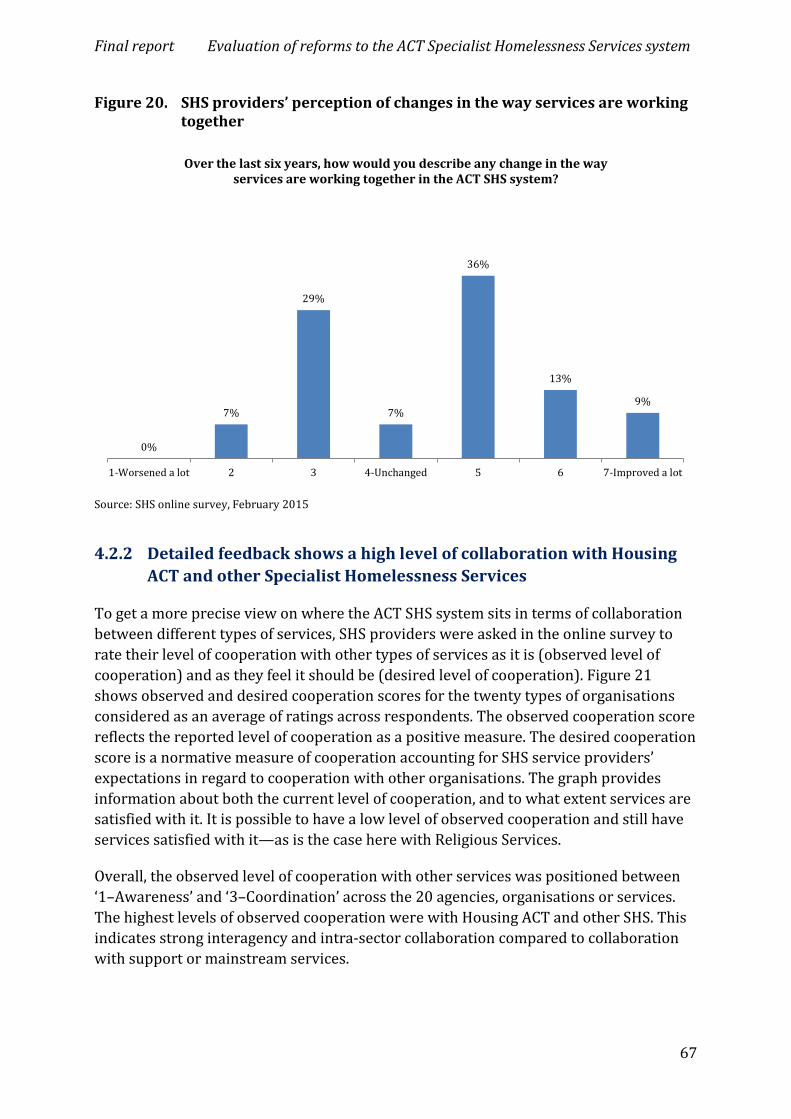
Final report Evaluation of reforms to the ACT Specialist Homelessness Services system
67
Figure 20. SHS providers’ perception of changes in the way services are working together
Source: SHS online survey, February 2015
4.2.2 Detailed feedback shows a high level of collaboration with Housing ACT and other Specialist Homelessness Services
To get a more precise view on where the ACT SHS system sits in terms of collaboration between different types of services, SHS providers were asked in the online survey to rate their level of cooperation with other types of services as it is (observed level of cooperation) and as they feel it should be (desired level of cooperation). Figure 21 shows observed and desired cooperation scores for the twenty types of organisations considered as an average of ratings across respondents. The observed cooperation score reflects the reported level of cooperation as a positive measure. The desired cooperation score is a normative measure of cooperation accounting for SHS service providers’ expectations in regard to cooperation with other organisations. The graph provides information about both the current level of cooperation, and to what extent services are satisfied with it. It is possible to have a low level of observed cooperation and still have services satisfied with it—as is the case here with Religious Services.
Overall, the observed level of cooperation with other services was positioned between ‘1–Awareness’ and ‘3–Coordination’ across the 20 agencies, organisations or services. The highest levels of observed cooperation were with Housing ACT and other SHS. This indicates strong interagency and intra-sector collaboration compared to collaboration with support or mainstream services.
0%
7%
29%
7%
36%
13%
9%
1-Worsened a lot 2 3 4-Unchanged 5 6 7-Improved a lot
Over the last six years, how would you describe any change in the way services are working together in the ACT SHS system?

Final report Evaluation of reforms to the ACT Specialist Homelessness Services system
68
The level of satisfaction vis-à-vis the existing level of cooperation—as measured through the gap between observed and desired cooperation—varies between the organisations. The largest disparity between observed and preferred cooperation was for Aboriginal and Torres Strait Islander services, Disability services and Employment assistance services. Respondents were the least concerned about the level of cooperation with Religious Services, Centrelink and Emergency relief providers.
Figure 21. Self-reported observed and desired level of cooperation with other services
Source: SHS online survey, February 2015
Partner organisations reported an observed level of cooperation around 2-Communication with the ACT SHS organisations, slightly lower with the CIS than with SHS providers and Housing ACT. The difference between the observed and desired level of collaboration was limited, with each type of organisation showing that overall partner organisations are satisfied with the level of cooperation with organisations that are part of the SHS sector. The main area for improvement was identified as the CIS, with some respondents regretting the lack of communication from the service.

Final report Evaluation of reforms to the ACT Specialist Homelessness Services system
69
SHS providers were then asked their views about how cooperation had changed since 2008. A majority of respondents reported improvement with eight types of organisations, with the highest proportion of respondents reporting improvement in cooperation with Aboriginal and Torres Strait Islander services. Interestingly, this means that although services would like to see cooperation with Aboriginal and Torres Strait Islander services at a higher level, they still report an improvement since 2008, showing that it is going in the right direction. Cooperation with the CIS, Housing ACT and other SHS providers is also reported to have improved since 2008, bringing it to a satisfying high level of cooperation as identified in the previous question.
Figure 22. Self-reported change in cooperation with other services
Source: SHS online survey, February 2015
4.2.3 Collaboration between services is mostly informal
As part of the SHS Outcomes reporting framework introduced in 2014, SHS providers have to identify evidence of collaborative practices with other human services. Analysis of the January to June 2014 six-monthly performance reports (n=36 analysed) shows that informal collaboration is the most common form of collaborative practice amongst services. However, services also reported some more formal forms of collaboration:
14 services mentioned some form of partnership agreement or Memorandum of Understanding with other SHS or housing providers.
12 services stated that they had taken part in case coordination or a case conference with other services or organisations.
11%5%
12%5%
12%3%
12%7%
16%14%17%
9%19%
24%11%
26%29%29%
19%24%
4%15%
20%28%
21%31%
24%33%
24%29%26%
35%33%
27%42%
29%31%29%
42%40%
Religious servicesHospitals
Child and Family CentresEmployment assistance services
Education and training service providersJustice/Police
Community Housing providersEmergency relief providers
Disability servicesDrug and Alcohol service providers
Counselling servicesFamily Support Services
Mental health service providersCentrelink
Culturally and Linguistically Diverse servicesOther SHSs
Housing ACTThe central intake service
Refugee/migration servicesAboriginal and Torres Strait Islander services
Improved a lot
Improved a little
Unchanged
Worsened a little
Worsened a lot

Final report Evaluation of reforms to the ACT Specialist Homelessness Services system
70
9 services mentioned that they had attended or taken part in a forum with other organisations, in particular Joint Pathways.
With the introduction of the Centralised Intake Service, services have the impression they have fewer opportunities to interact with other SHS providers (see section 4.2.3). Having the CIS means that services do not have to manage accommodation referrals themselves and call other services to identify accommodation vacancies. However, other avenues for collaboration between services exist, such as the Joint Pathways group and the Youth Housing and Homelessness Forum, and services provided positive feedback about those forums. However, services identified that these existing forums were only involving managers or service coordinators and that frontline staff had fewer opportunities for interactions with other services. This should be considered in discussions around future policy directions.
Engagement with Aboriginal and Torres Strait Islander service users
With regard to engagement with Aboriginal and Torres Strait Islander service users, over half of the services in their January-June 2014 performance reports mentioned some form of consultation with Aboriginal and Torres Strait Islander community groups. Some services also mentioned taking part in Aboriginal or Torres Strait Islander ceremonies and community gatherings, as well as larger events such as NAIDOC week. Twenty of the services also state that staff have undergone or are continuing with cultural awareness/ cultural competency training.
Engagement with Culturally and Linguistically Diverse service users
To a similar question about engagement with Culturally and Linguistically Diverse (CALD) service users, of the 40 services that provided a performance report, 12 stated that they had consultations with CALD community groups, 10 that they had taken part in CALD training and eight that they provided translation services.
4.2.4 A client story to illustrate the benefits of collaborative approaches
The following case study with a rough sleeping service user provides an illustration of the benefits of collaborative approaches to holistically address the range of needs of the service user (Box 4).

Final report Evaluation of reforms to the ACT Specialist Homelessness Services system
71
Box 4. Case study: Rough sleeping service user
Context Tom moved to the ACT from another state 15 years ago. Tom describes himself as independent and quite happy being by himself. Tom was referred to Street to Home by the Centralised Intake Service at the beginning of 2013, and decided to engage with the service because he wanted a house. Tom had twice been evicted from housing because of altercations with other tenants, and he’d been living rough for around 6 months, sleeping behind a public building. What happened Tom’s case worker said Tom was initially hard to engage with as he is very quiet—Tom said he ‘sticks to himself, it keeps me out of trouble’. When he connected with Street to Home, Tom’s housing options were limited. He had an application in with Housing ACT but he didn't have support—Housing requires an applicant for priority housing to be connected to an agency or service provider such as a welfare agency, medical service or counsellor to ensure they have community engagement and connections once housed in long-term public housing. The aim is to avoid future evictions and legal costs associated with having a person go to the tribunal systems. Tom also had an outstanding debt with Housing, his case worker was unsure of when the debt was acquired or when Tom started a payment plan. Other housing providers were unwilling to take Tom on as a client because of his history of not getting on with other tenants. Tom’s only option was to be housed in a property provided by Street to Home (St Vincent de Paul leases properties from Housing ACT, and six of these properties are allocated to the Street to Home program), and he was housed within two months of being referred to Street to Home. This accommodation has no time limit and is referred to as a ‘tenancy training program’. Tenants can extend their three-month initial lease and can apply to live there permanently. Tom managed well in the accommodation, paying his rent on time. He complied with the conditions of his tenancy, which involved meeting with his case manager once a week and abiding by his support plan whose main component was attending a positive lifestyle program. Tom initially resisted attending the program but eventually engaged and attended regularly. The provider of the program supported Tom in other areas, such as helping him source furniture. Tom said he was happy in the accommodation, and he lived there for about seven months before being permanently housed. Tom was also very keen to find full-time employment, but found it difficult without a licence. He said he would take on any job he believed he could do, such as gardening and cleaning. Tom’s case worker supported him to apply for jobs. Tom was also keen to get a volunteer job if he couldn’t get a paying job. His case worker supported him to apply for a number of volunteer jobs, and Volunteering ACT found him a volunteer position in an organisation where he does gardening and odd jobs two days a week. Tom has been doing this for around a year and says he enjoys the work, it keeps him motivated and active ‘I can’t stay home all day, I'm restless’. Tom is connected with an employment agency that supported him to meet with a back-to-work psychologist. Tom’s support worker at the employment agency said Tom is close to being job ready, and the worker has noticed changes in Tom over time, such as smiling more. Tom also linked in with the Staying Connected program, which is a program of Canberra’s electricity and water provider that assists customers to pay their bills during times of financial hardship; for people on Centrelink benefits, the assistance is offered even without acquiring debt with the provider. Street to Home supported Tom with clothes; transport; putting together a resume; and getting a driver’s licence, collecting the paperwork and paying for some driving lessons, to which Tom’s employment agency also contributed. Street to Home has done quite a bit of advocacy on Tom’s behalf: for example, with Housing ACT, and organising letters of support for volunteer positions. Outcomes After being in the Street to Home program for around seven months, Tom moved into public housing through Housing ACT. He has been there for around a year, and is pretty confident he can stay there for a while. Tom had a debt with Housing ACT but he has a payment plan to pay it back. The case worker described his house as clean, well-kept, decorated nicely and said they don’t anticipate any problems in Tom maintaining his tenancy. His case worker hoped that once Tom has a car and a job he would want to move to private accommodation. Tom’s case worker said persistence is a key factor of success in working with rough sleepers. The case worker said the support they have provided Tom has been effective—initially they thought he would be hard to support as he had been evicted from previous tenancies and had anger management issues. Tom exited from Street to Home on 6th March 2015. At this time, he was independent, sustaining a tenancy and had made community connections. Tom’s case worker is confident that once he has his licence he will get a job. Tom said that working with his case worker has been great, ‘someone to talk to’.

Final report Evaluation of reforms to the ACT Specialist Homelessness Services system
72
4.3 Gaps in service delivery relate primarily to service intensity, accommodation options, and workforce development
The perception of service providers, as stated in service provider quarterly reports, was that service intensity, or lack of, was the most commonly referred to gap in the sector (followed by lack of housing, lack of funding and staff skills). Access to accommodation appears from a synthesis of data sources to be the key gap (i.e. a sector with more service users, with greater needs in a context of stable or declining funding, low social housing vacancy rates and relatively low use of the private rental market).
Gaps in service delivery can also be identified by looking at service types where there is a substantial gap between the actual level of collaboration, and what the SHS providers feel is required to ensure clients access the full range of services. The largest disparity between observed and preferred cooperation was for Aboriginal services, Disability services and Employment assistance services (see section 4.2).
4.3.1 SHS providers feel they do not have the ability to always provide the intensity of services required
Using the SHS data we operationalised ‘gaps’ as either unmet needs (where a client had a need for accommodation and was not provided with that service), or as ‘poor’ exits from the support period (into tenure other than private rental, community or social housing, or ownership). This data suggests that females were more likely to have an unmet need. In terms of poor exits into unstable or no tenure accommodation, young people (15-24 year olds) were more likely to have poor exits than older clients. On this measure, females were actually less likely to exit into unstable accommodation. Those who entered the service system from unstable tenure were also nine times more likely to exit into a similar situation, than other clients.
Across different qualitative data sources, services identified certain types of people for whom there were gaps in service delivery, mostly related to a mismatch between eligibility criteria and the needs of these groups (see also unmet demand in section 2.1.1). These people are:
Women with children not subject to domestic violence, Women with adolescent male dependants Couples over 25 Young people under 15 years of age Refugees People with pets
In addition to basic access, the key gap identified by services was service intensity—often referred to in terms of potential clients not receiving support and current clients not receiving enough support. Lack of intensity was also related to funding which determined what clients or how many clients the service is able to take. This was particularly so for Women’s, Men’s and Family/Community services —and included the

Final report Evaluation of reforms to the ACT Specialist Homelessness Services system
73
inability to pay for translation services and difficulty helping families with clothing, furniture and white goods in a new house. It was reported by some services that lack of intensity impacted client follow-up, where stretched services were unable to meet needs in later support stages. It was also recognised that service intensity suffered when client feedback was not properly or extensively collected. Most services responded to this in their reports, indicating that they had improved or were improving client feedback processes. These in turn helped services to realise their achievements or identify further gaps in services that clients were experiencing and work to address these gaps.
Related to intensity, services referred to workforce issues as a gap in service delivery. Data provided in the SHS survey suggests of the 266 FTE staff currently working in the ACT SHS sector, 182 or 69 per cent had joined since 2009. This creates challenges for developing and maintaining staff skills, one of the four main gaps identified by SHS providers. Providers often suggested the need for increased training to cater for certain client groups effectively and the need to hire more Aboriginal or Torres Strait Islander staff in the sector. In the Joint Pathways workshop it was identified by some SHS providers that it can be difficult to attract and retain Aboriginal or Torres Strait Islander staff, in part because they are often asked to work with clients with complex needs and have to balance the requirements of work and culture, which can lead to substantial staff stress.
In the ACT, around 60 per cent of service users have a case management plan which is close to the national average and remained relatively stable over the last three years. Of these, about 84 per cent are achieving some of their goals (higher in the ACT than nationally). Unfortunately SHS data does not record the type of goal and therefore does not allow analysis of the types of goals that are least likely to be met which would suggest further gaps in service delivery.
4.3.2 The lack of safe affordable housing is consistently identified as the main service gap across all service user groups
In the SHS online survey, SHS providers were asked to identify gaps in service delivery for the cohort of service users they were targeting among a list of 12 groups (men, women, younger people <18 years, younger people 18-25 years, older people, families, Aboriginal and Torres Strait Islander people, people affected by domestic violence, people leaving institutional care/facilities (hospital/prison), people with mental health issues, people with substance abuse issues, long-term or chronic homeless people, other).
The most common gap identified for 8 of the 12 service cohorts was a lack of safe and affordable housing for clients. These cohorts were men, women, young people under 18 years of age, young people 18-25 years of age, older people, families, clients experiencing domestic violence and long term homeless clients. The other 4 cohorts (clients with substance abuse, Aboriginal and Torres Strait Islander clients, clients with mental health issues and clients leaving institutional care) suffered from client specific

Final report Evaluation of reforms to the ACT Specialist Homelessness Services system
74
gaps i.e. Aboriginal and Torres Strait Islander clients would benefit from more culturally appropriate services. However for these 4 service cohorts, lack of safe and affordable was still referred to relatively often, being the second or third most identified gap for each cohort.
Crisis accommodation was also mentioned frequently for most cohorts. Respondents suggested that the lack of transitional housing was exacerbating homelessness levels in the sector.
“Lack of exit plan with limited options people ending up homeless.” – SHS provider about clients leaving institutional care.
“Probably the most significant issue other than a shortage of crisis beds is the lack of affordable housing options for women 12 - 18 months after leaving, especially if a settlement is reached with the former partner that is insufficient.” – SHS provider about clients experiencing domestic violence.
Respondents also had the opportunity to identify other client groups not in the initial list. Other client groups mentioned by SHS providers were clients from Culturally and Linguistically Diverse (CALD) backgrounds (3 references), young people under 18 (2 references) and pregnant women (1 reference). Advocacy and legal support were identified as gaps when servicing CALD clients and education and employment assistance when dealing with young clients.
4.3.3 Preparing for the uncertain impact of the NDIS
Anticipating and preparing for the impacts of the NDIS on service delivery appears to be a key issue for some service providers. While the NDIS is still under development, housing and non-accommodation supports are part of the focus of living independently.13 Ministers as part of the COAG Disability Reform Council have planned trials and expect NDIS funds to support capital costs for innovative specialist accommodation and to assist people with disability to access housing.14
Around 1 in 6 providers referred to the NDIS in their quarterly reports—mostly making positive comments about NDIS training or information sessions that had helped improve their understanding of the disability sector. On the one hand stakeholders reported that the NDIS may increase the number and quality of services provided to clients with disability related support needs—leading to improved accommodation and non-accommodation outcomes for clients with disability. On the other hand, there were concerns that current clients who receive disability related support who may be
13 http://www.ndis.gov.au/sites/default/files/documents/fact_sheet_supports_ndis_fund_housing_ind_living.pdf, http://www.ndis.gov.au/sites/default/files/documents/og_plan_assess_supp_plan_housing_infrastructure.pdf, 14 http://mitchfifield.dss.gov.au/media-releases/coag-disability-reform-council-communiqu

Final report Evaluation of reforms to the ACT Specialist Homelessness Services system
75
ineligible for the NDIS will cease to be able to access supports as services adapted to the move away from block funding towards individual support packages.
Our focus over the past 6 months has been related to the impact of the implementation of the NDIS. There is now increased attention on Intellectual disability and acquired brain injury not necessarily covered by NDIS—SHS service provider
The NDIS may also indirectly lead to an increase in measures of homelessness and demand for housing and homelessness services as a result of the focus on clients leaving institutionalised settings seeking specialist or mainstream accommodation options.
Final report Evaluation of reforms to the ACT Specialist Homelessness Services system
76
5. Conclusion and implications
5.1 Overall conclusion
Over the reform period between 2009 and 2014, the ACT Specialist Homelessness Service system went through significant reforms guided by the 2009 Road Map. The reforms were in particular aimed at streamlining access to services and housing through the introduction of a Centralised Intake Service (CIS), shifting away from accommodation-based support to a ‘support in place’ model, and putting a stronger emphasis on preventing homelessness and promoting social inclusion. Reforms were implemented in the context of Commonwealth funding cuts that were absorbed by the ACT Government on behalf of the homelessness sector.
The SHS sector has experienced greater demand from service users with higher needs accessing the system in less stable housing situations. We were not able to determine the extent to which these increases may be affected by clients moving from interstate. The sector has successfully re-oriented to the provision of more non-accommodation supports and has achieved better non-housing related outcomes for service users, especially in employment. Exits into stable accommodation have declined in the ACT over the reform period, but are slightly higher than national figures at the end of the period.
Intensity of support, in terms of length of support is still high in the ACT compared with the rest of Australia. Longer durations of support are also strongly associated with better outcomes in the ACT.
The centralised intake service has faced some initial resistance but appears to be leading to a more equitable and efficient service system.
Service providers reported an overall improvement in collaboration between services over the period. SHS providers are satisfied with the level of cooperation with most types of services. Key areas for improvement include cooperation with Aboriginal and Torres Strait Islander services (despite also being the group with which cooperation has improved the most over the period), disability services and employment assistance services. Avenues for networking exist, in particular through Joint Pathways and the Youth Housing and Homelessness Forum, however staff turnover and more volunteers in the sector reinforces the ongoing need for training and workforce development at the frontline.
A core challenge remains the availability of affordable accommodation for people moving out of the SHS sector. This may relate to low vacancy rates in social housing (despite the fact the ACT is achieving twice the national average in terms of people exiting the SHS sector into social housing) and few products and services designed to help people rent in the private rental market. There are also gaps in service delivery for

Final report Evaluation of reforms to the ACT Specialist Homelessness Services system
77
groups reportedly having difficulty accessing the SHS accommodation supports because of a mismatch of service users’ characteristics and eligibility criteria or the capacity of services: these include women with children not subject to domestic violence, couples over 25, young people below 15, refugees and people with pets.
5.2 Implications of the evaluation for future policy directions
The results of the evaluation suggest the following policy and program areas and actions should be considered to support continuous improvement in the ACT Specialist Homelessness Sector (SHS) to support people and families experiencing, or at risk of homelessness in the ACT.
5.2.1 The outcomes reporting framework and collecting case studies
1. Ensure the outcomes reporting framework is collecting all required information from all services. The outcomes reporting framework was endorsed by SHS providers as an effective and useful approach for data collection. However, out of 47 providers we were able to be provided with reports for 44 services of which only 30 (70%) fully completed the reporting framework. The January-June 2014 report was the first time providers used the outcomes reporting framework. More work may be required to increase compliance with the framework. Instructions for selecting case studies could be modified to improve their use for monitoring and evaluation—a useful approach may be to suggest one case study where gaps prevented the provision or intensity of service required, and one case study that demonstrated how effective collaboration was leading to improved outcomes. This will allow the ongoing monitoring of issues raised (beyond that which can be collected quantitatively in SHIP and SHOR) as well as providing in-depth data for evaluation and understanding of key issues without requiring the expense of additional data collection for case studies.
5.2.2 Managing demand for SHS services
The centralised access service (FirstPoint) is recognised to have increased equity in the allocation of applicants to emergency accommodation. This has resulted in people with more complex needs being referred to accommodation support. It is also likely to increase access to the broader service system through its co-location with the One Human Services Gateway.
2. Consider slightly re-framing the CIS from an intake to an access service. This would preserve current benefits for equity while increasing flexibility if service users were able to enter at any point in the system rather than requiring that the intake be centralised. This may be particularly relevant for certain groups, such as Aboriginal and Torres Strait Islanders, where leveraging existing relationships is an important part of service delivery. This is the approach that has been taken with the Gold Coast Housing Assistance Triage model being trialled by the Queensland Government. Steps towards this approach may be achieved by allowing
Final report Evaluation of reforms to the ACT Specialist Homelessness Services system
78
accommodation services to accept clients who present outside of the CIS hours of operation (9am-5pm weekdays). It may be beneficial to promote the link between the CIS and the One Human Services Gateway to vulnerable people and service providers as a one-stop human-services shop.
The evaluation showed that integration and collaboration within the sector and between the sector and related services has generally improved. This was in part a result of forums like Joint Pathways and the Youth Housing and Homelessness Forum. However, there are some key areas where the gaps between the current level of integration required and the actual level of integration are greatest and/ or not showing signs of improvement. These should be targeted.
3. Promote integration both within and between specialist homelessness services and key external service providers. This may include one-way flows of information about the options available to clients who may wish to then access the CIS. It may also include support for events that promote networking and the development of partnerships. Partnerships with non-SHS services should be a focus for strengthening, particularly with mental health providers, drug and alcohol providers and community housing providers.
4. Closely monitor clients with disability. The National Disability Insurance Scheme (NDIS) with its change from block funding to individualised support packages could result in some current service users receiving fewer supports, as well as an increase in clients seeking to access accommodation options. The definitions of ‘disability’ used in the sector may vary from those used to assess eligibility for the NDIS. Data systems should be able to track NDIS clients.
5. Consider workforce development needs—particularly for frontline staff. Changes in the workforce, including turnover and increases in the numbers of volunteers and reported difficulties attracting and retaining Aboriginal and Torres Strait Islander employees reinforce the ongoing need for frontline workforce development initiatives.
While Joint Pathways and the Youth Housing and Homelessness Forum are effective for organisational level contacts and developing models of care, opportunities to increase collaboration between frontline workers should be explored. Workforce development may also include a strategy for attracting and retaining Aboriginal and Torres Strait Islander staff—including for example mentoring arrangements. Other workforce development strategies may include ongoing attendance at forums in preparation for working with more clients with disability, or with existing clients in different ways, as a result of impacts of the NDIS on access to and expectations for service delivery.
5.2.3 Increasing supply to take pressure off the SHS sector’s ability to meet service users’ needs
There is unmet demand and a recognised need for people experiencing or at risk of homelessness to access long-term accommodation. The ACT already has twice the
Final report Evaluation of reforms to the ACT Specialist Homelessness Services system
79
proportion of clients exiting into social housing as the national average, however relatively low use of the private rental market.
6. Use private rental assistance as a cost effective means of increasing access to affordable accommodation. Evidence in NSW suggests private rental assistance can be effective in a range of real estate markets and particularly when vacancy rates are high and rents low. Private rental assistance usually operates on a continuum; from providing clients with basic tenancy facilitation services (how to find a property, write an application, inspect a property etc.), to developing relationships with real estate agents, providing low-cost tenancy guarantees to provide real estate agents with additional surety, to more intensive brokerage services and subsidies for making up the difference between market and social housing rents.
7. Consider how community housing providers may be supported to develop more social or affordable housing. Recent national partnerships providing funding for the development of new social or affordable accommodation (such as the National Rental Affordability Scheme) have come to a close. Recent experience in NSW suggests community housing providers can be supported in non-financial ways through networking, mentoring and partnerships between smaller and larger organisations to leverage assets to develop new housing.
5.2.4 Innovations in contracting and service delivery
The specific-purpose grants model used to fund SHS providers in the ACT has provided a stable platform for the delivery of The Road Map policy and service delivery reforms. However over time, the SHS program and other human services will need to investigate additional reforms to ensure allocated government funding continues to achieve sustainable outcomes for vulnerable people and families in the ACT. Jurisdictions across Australia are currently piloting and rolling-out a wide range of SHS and human service reforms in response to the challenge of increasing needs and finite budgets. While many of these reforms have yet to be evaluated, it will be important for the ACT Government to monitor these ‘new ways of doing business’ and to engage with the sector in the co-design of the next phase of reforms in the ACT.
8. Review current directions and innovations in contracting and SHS service delivery in other Australian jurisdictions for their relevance in the ACT context. Based on experiences in other jurisdictions, possible areas for investigation include:
– Future funding models: A number of jurisdictions including NSW and SA have moved away from activity-based (block grant) funding to output-based (case-based) funding for specialist homelessness services. Pilots have also been undertaken using outcomes-based funding models where an additional fee is paid once a client has achieved a stable housing outcome for three months. Future reforms in the ACT should investigate the strengths and weaknesses of alternative funding models to maximise the achievement of outcomes.

Final report Evaluation of reforms to the ACT Specialist Homelessness Services system
80
– Future commissioning models: future reforms in the ACT that investigate a commissioning strategy that will most appropriately balance management efficiencies / economies of scale with locally responsive service delivery. A key feature of the NSW Going Home Staying Home SHS reforms has been a commissioning strategy that involved directing funding to a smaller number of lead contractors—who then entered into joint working arrangements with local service providers. This may have had both positive and negative consequences that could inform a commissioning strategy in the ACT.
– Future service system models: Some jurisdictions have piloted pooled-funding models combining SHS with other case-management services. Future reforms in the ACT should investigate opportunities to further integrate the SHS program with other programs working with vulnerable people and families.

Final report Evaluation of reforms to the ACT Specialist Homelessness Services system
81
Appendix 1. Detailed methods
A1.1. Qualitative analysis of six-monthly service provider reports
Purpose
In 2013-14, the ACT Government Community Services Directorate (CSD) introduced a new reporting framework for funded SHS services: the Specialist Homelessness Sector Outcomes Reporting Framework. This new framework moves away from reporting primarily on outputs to reporting on outcomes. It identifies a number of outcome indicators that services have to report against through six-monthly performance reports. These reportable indicators are organised under three high level categories of outcomes:
1. system outcomes 2. service delivery outcomes 3. sector outcomes
The SHS providers’ six-monthly performance reports provide a rich source of information about what services have done and what outcomes they have achieved. The quantitative data in these reports is already contained in SHSC data that the evaluation considered separately through quantitative analysis. In addition to quantitative indicators, the six-monthly performance report template includes a number of qualitative indicators. It was therefore decided to conduct an in-depth qualitative analysis of all service provider reports for the last reporting period (January–June 2014), to make the most out of the rich data collected through the new reporting framework.
The qualitative data reviewed in the performance report template included two case studies and six sector outcome indicators:
evidence of quality improvement practice gaps in service evidence of collaborative practice with other human services evidence of case management/ living skills/ outcomes measurement tools utilised evidence of service/sector initiatives to improve engagement with Aboriginal and
Torres Strait Islander service users.
Sample
Out of the 47 funded services, CSD provided ARTD with 40 six-monthly provider reports covering 44 services (two reports covering multiple services), which represent 94 per cent of the services. Out of these 44 services, 30 followed the new SHS Outcomes reporting framework (70 per cent). Of the 14 that did not, four provided no case studies and no coherent review and as such were not included in the qualitative analysis, but the

Final report Evaluation of reforms to the ACT Specialist Homelessness Services system
82
rest (10) provided appropriate data against the identified quantitative indicators. In the end, a total of 36 reports covering 40 services (85 per cent) were reviewed and coded for qualitative analysis. A total of 80 case studies were reviewed across the 36 reports, with the majority of service reports reporting two case studies as per the template.
Analysis
ARTD conducted comprehensive qualitative data analysis on case studies and qualitative indicators. All case studies and indicators were imported into QSR NVivo 10, a specialised qualitative data analysis software. ARTD developed a coding framework for each item: service user characteristics, experience and outcomes for the case studies, and types of evidence provided for the qualitative indicators.
The coded text was then analysed to identify the common responses to the questions and broken down by type of service as per the categories of the Service Funding Agreements (SFAs).
A3.1. Online survey of SHS providers
Purpose
The purpose of the survey was to seek SHS providers’ feedback about how the system has changed between 2009 and 2014, how the system is working now and what gaps may need to be filled.
Sample
All SHS providers were surveyed, with both organisation managers and service coordinators invited to participate. The ACT SHS service system includes 47 discrete services across 29 organisations (some organisations being responsible for more than one service).
CSD identified a total of 59 contacts across all services, including organisations managers and service coordinators (some organisation managers being also service coordinators).
Data collection instrument
The survey instrument included 22 questions, with a mix of qualitative and quantitative questions across six short sections:
You and your organisation Working in the ACT SHS system Changes to the SHS system since 2009 Gaps in service delivery Integration of the sector

Final report Evaluation of reforms to the ACT Specialist Homelessness Services system
83
Overall feedback.
The survey questionnaire was developed by ARTD with feedback from CSD. ARTD piloted the survey with four respondents, using cognitive interview techniques for key questions. Feedback from piloters was incorporated in the final version of the survey before widespread distribution.
Survey administration
The survey was administered through an online questionnaire using SurveyGizmo. It was distributed using an email campaign that generated secured individual links to each survey contact.
The survey was available for two weeks (12-02-2015 – 25-02-2015). Two reminder emails were sent to non-respondents. The first was sent one week after the invitation email, the second was sent on the day the survey was due to close. To further improve the response rate, CSD organised follow-up phone calls to non-respondents.
The final survey response rate was 86 per cent (54 responses out of 59 recipients) with 45 complete responses and 6 partial. This is considered a very strong response rate.
On average, it took 30 minutes for respondents to complete the survey.
Analysis
Survey responses were exported into an Excel spreadsheet where frequency counts were generated for all closed questions. Additional quantitative analysis was conducted in SPSS v21.0, in particular to identify differences in responses according to service types (men’s services, women’s services, youth services, etc). Responses to open-ended questions were reviewed and common themes identified to develop and apply a coding framework.
A3.2. Online survey of partner organisations
Purpose
The purpose of the partner survey was, firstly, to get an external perspective to the SHS system and, secondly, to validate responses from SHS providers.
Sample
Contacts for the partners’ survey were identified by SHS providers through their online survey where the last question asked them to nominate up to three contacts from non-SHS organisations that provide associated services to SHS service users.

Final report Evaluation of reforms to the ACT Specialist Homelessness Services system
84
A total of 60 contacts were provided by SHS respondents excluding duplicates and contacts without appropriate contact details.
Data collection instrument
The survey questionnaire was a shorter version of the SHS providers’ survey with 11 questions across four short sections:
You and your organisation Gaps in service delivery Integration of the sector Overall feedback.
Survey administration
The survey was administered through an online questionnaire using SurveyGizmo. It was distributed using an email campaign that generated secured individual links to each survey contact.
The survey was available for two weeks (26-02-2015 – 11-03-2015). Two reminder emails were sent to non-respondents. The first was sent one week after the invitation email, the second was sent on the day the survey was due to close.
The final survey response rate was 50 per cent (30 responses out of 60 recipients) with 20 complete responses and 10 partial. This is considered a good response rate for partner organisations.
On average, it took 24 minutes for respondents to complete the survey.
Analysis
Survey responses were exported into an Excel spreadsheet where frequency counts were generated for all closed questions. Responses to open-ended questions were reviewed and common themes identified to develop and apply a coding framework.
A3.3. Case studies
Purpose
As part of the evaluation, ARTD designed five case studies to collect in-depth data about key issues related to the 2009–2014 reforms to the SHS system. Case studies are defined as an empirical inquiry that investigates a contemporary phenomenon within its real-life context. Case studies bring together several data collection method and may have different purposes: illustrative, explanatory, exploratory or critical instances of singular

Final report Evaluation of reforms to the ACT Specialist Homelessness Services system
85
or signal events.15 Two types of case studies have been identified for the evaluation: three system change case studies that had an explanatory or exploratory purpose and two individual service user case studies that were illustrative.
Data collection methods
Various data collection methods were considered for the case studies and selected according to the focus of each case study:
review of available documentation review of six-monthly service provider report analysis of SHSC data review of services responses to the online survey interviews with service providers and partner organisations interview with service users case file analysis.
ARTD sought ethics approval from the Bellberry Human Research Ethics Committee for the three case studies including interviews with service users. Approval was granted on 23 February 2015 (protocol 2015-01-041).
Table 9 provides an overview of the purpose, focus question, selection methods and data collection methods for each of the five case studies.
Analysis and reporting
Data collected through the various methods were analysed and used to answer the focus question of each case study. Case studies are used to support findings in the evaluation report and presented either as separate vignette or as supporting evidence.
15 Robert K. Yin. Case Study Research. Design and Methods. Third Edition. Applied social research method series Volume 5. Sage Publications. California, 2002.

Final report Evaluation of reforms to the ACT Specialist Homelessness Service system
86
Table 9. Overview of case studies focus and methods
Unit of analysis Purpose Focus question Data collection methods
System change case studies
Centralised intake service Explanatory Does centralised intake service result in a more equitable provision of SHS services to those in most need?
Review of Centralised intake model reform documentation Review of FirstPoint six-monthly reports and reported service
user data Review of FirstPoint responses to the online survey Stakeholders interview Service user interviews
Reform of youth homelessness services
Exploratory What has been the early impact of the reform of the youth homelessness services implemented in 2012?
Review of youth homelessness services reform documentation
Review of six-monthly reports of Youth services Review of youth services responses to the online survey Stakeholders interview with all youth services Presentation and discussion of preliminary findings to the
Youth Housing and Homelessness forum
Repeat service users Exploratory Has the level of repeat service usage changed since 2008? To what extent are service users more likely to be exiting SHS services and less likely to experience repeats periods of homelessness?
What is the reason for the high level of repeat service usage in the ACT?
CURFs data: repeat instances of service Stakeholder interviews: SHS with high number of repeat users

Final report Evaluation of reforms to the ACT Specialist Homelessness Service system
87
Unit of analysis Purpose Focus question Data collection methods
Individual service users’ case studies
Aboriginal service user Illustrative How have SHS worked to improve engagement with Aboriginal and Torres Strait Islander users? How do Aboriginal and Torres Strait Islander
people initially come into contact with SHS providers?
Has this engagement affected housing and non-housing outcomes for Aboriginal and Torres Strait Islander people?
Review of Inanna responses to the online survey Service user interview Case file analysis Stakeholder interviews: case managing SHS and service
providers
Rough sleeping service user Illustrative Have outcomes for rough sleepers changed in response to ‘assertive and persistent outreach’?
Is there a group for whom ‘assertive and persistent outreach’ does not work?
What would hard-to-help rough sleepers prefer in terms of service?
Review of Street-to-Home responses to the online survey Service user interview Case file analysis Stakeholders interview: case managing SHS and service
providers

Final report Evaluation of reforms to the ACT Spec
88
A3.4. Quantitative analysis of SHS data
Purpose
The purpose of the analysis was to describe how many people accessed the ACT SHS system between 2009 and 2014, their characteristics and broad trends in service delivery compared to before 2009.
Data source
The AIHW granted access to Confidentialised Unit Record Files (CURFs) for individual SHS clients for their SAAP (2007–08, 2008–09, 2009–10 and 2010–11) and SHSC (2011-2012, 2012–13 and 2013–14) databases. The data included services ID and a broad range of client and service variables. In some instances, the AIHW provided aggregate client numbers by variable to protect individual’s identities.
Analysis
All quantitative survey data analysis was done in SPSS v21.0. Data quality and completeness checks were completed before analysis began. Some data management (re-categorising or re-coding variables) was necessary to ensure equivalent variables were available across the SAAP and SHSC databases.
Data quality checks revealed that approximately 10 per cent of all service users did not have a Client ID. The quality of the data provided improved over years with less missing Client IDs in SHSC data compared to SAAP data. A Client ID is essential for determining unique instances of service. To minimise double counting, only service users with a Client ID were included in the client and service data analyses. The impact of excluding individuals without a valid ID is that our analysis may underestimate the actual number of SHS service users. The proportion of service users without valid IDs is summarised in Table 10.

Final report Evaluation of reforms to the ACT Spec
89
Table 10. Number and proportion of support periods without a valid Client ID, by financial year
2007–08 2008–09 2009– 10 2010–11 2011–12 2012–13 2013–14
Number of support periods with missing Client IDs
436 502 445 338 468 669 707
Number of support periods
2,683 2,662 2,717 2,557 6,292 7,594 7,370
Proportion with missing client ID
14% 16% 14% 12% 7% 8% 9%
Source: AIHW Confidentialised Unit Record Files from Supported Accommodation Assistance Program (SAAP) (207-08, 2008-09, 2009–10 and 2010–11) and the Specialist Homelessness Service Collection (2011–12, 2012–13 and 2013-14)
Notes: Denominator is number of unique clients. Only includes clients with a Client ID and may therefore underestimate the total number of actual clients seen.
Frequency analysis was performed for all relevant client and service variables. ‘Clients’ were used as the denominator for all demographic data analysis and ‘support periods’ were used as the denominator for all service data analysis. The analysis summarised the following information
number of clients assisted demographics of clients assisted (gender, age groups, cultural/ language
background, including Aboriginal and Torres Strait Islander people or culturally and linguistically diverse groups)
housing history (e.g. previously homeless, at risk of homelessness, living in public/ private/ social housing)
support services provided.

Final report Evaluation of reforms to the ACT Spec
90
Appendix 2. Results from the SHS providers online survey
Table 11. Response rate to the SHS provider online survey
Emails sent 59
Emails bounced 0
Population surveyed 59
Complete responses 45
Partial responses 6
Disqualified 0
Total responses 51
Response rate 86%
You and your organisation
Table 12. Q1. What is your role in the organisation?
n %
Organisation Manager/ Director 27 59%
Service Co-ordinator 19 41%
Total 46 100%
Missing 5
Table 13. Q2. How long have you been working in the SHS sector in the ACT?
n %
Less than six months 3 6%
Between six months and two years 0 0%
Between two and five years 16 33%
More than five years 29 60%
Total 48 100%
Missing 3

Final report Evaluation of reforms to the ACT Spec
91
Table 14. Q3. Which of the following are core services delivered by your organisation?
n %
Non-accommodation support 25 58%
Tenancy support 19 44%
Transitional accommodation 16 37%
Crisis accommodation 12 28%
Long-term accommodation 6 14%
Centralised intake service 2 5%
Other* 19 44%
Total 43
Missing 8
Note: Per cent of cases is calculated as the frequency of a given response over the number of valid cases (complete responses to the question).
*When specified, ‘Other’ responses included: family with children both over and under 18 (17), adult relatives living together (11), family with unrelated tenant(s) (7), unsure or prefer not to say (6), grandparents and kids (4), recoded to existing categories (3), family + additional extended family members (2), age unspecified (1).
Table 15. Q4. How many staff with direct service user contact do you have now? (Funded Staff)
Range n %
0-5 11 39%
>5-10 13 46%
>10-15 0 0%
>15-20 0 0%
>20 4 14%
Total 28 100%
Average 9.5
Table 16. Q4. How many staff with direct service user contact do you have now? (Volunteer Staff)
Range n %
0-20 15 88%
>20-40 0 0%
>40-60 0 0%

Final report Evaluation of reforms to the ACT Spec
92
>60-80 1 6%
>80-100 1 6%
Total 17 100%
Average 12.1
Table 17. Q5. How many staff did you have with direct service user contact at 1 January 2009? (Funded Staff)
Range n %
0-5 12 43%
>5-10 10 36%
>10-15 3 11%
>15-20 1 4%
>20 2 7%
Total 28 100%
Average 8.3
Table 18. Q5. How many staff did you have with direct service user contact at 1 January 2009? (Volunteer Staff)
Range n %
0-20 13 93%
>20-40 0 0%
>40-60 1 7%
>60-80 0 0%
>80-100 0 0%
Total 14 100%
Average 6.1
Table 19. Q6. Of those current staff with direct service user contact, how many have joined your organisation since 1 January 2009? (Funded Staff)
Range n %
0-5 16 59%
>5-10 7 26%

Final report Evaluation of reforms to the ACT Spec
93
>10-15 2 7%
>15-20 1 4%
>20 1 4%
Total 27 100%
Average 6.7
Table 20. Q6. Of those current staff with direct service user contact, how many have joined your organisation since 1 January 2009? (Volunteer Staff)
Range n %
0-20 13 93%
>20-40 0 0%
>40-60 0 0%
>60-80 0 0%
>80-100 1 7%
Total 14 100%
Average 8.5
Changes to the SHS system since 2009
Table 21. Q9. What proportion of your new service users would you estimate come through the centralised intake service?
Range n %
0-20% 26 54%
>20-40% 1 2%
>40-60% 2 4%
>60-80% 5 10%
>80-100% 14 29%
Total 48 100%
Average 41.6

Final report Evaluation of reforms to the ACT Specialist Homelessness Service system
94
Table 22. Q12. The centralised intake model
Disagree Mostly Disagree Mostly Agree Agree Missing Don’t know
Please state how much you agree or disagree with each of the statements below
n n % n % n % n %
The centralised intake model makes getting the right help easier for service users than the system it replaced.
43 10 23% 8 19% 16 37% 9 21% 3 5
The centralised intake model is more effective in linking service users to a broader range of services than the system it replaced.
39 9 23% 6 15% 14 36% 10 26% 3 9
The centralised intake model provides a fairer way of prioritising services for those most in need.
40 9 23% 5 13% 16 40% 10 25% 3 8
Within the centralised intake model, the respective roles of the centralised intake service and my organisation are clearly defined.
42 6 14% 6 14% 13 31% 17 40% 3 6
The central intake service refers service users that are appropriate for our services. 39 6 15% 4 10% 20 51% 9 23% 3 9
Having the centralised intake model has increased our collaboration with other specialist homelessness services.
44 24 55% 15 34% 3 7% 2 5% 3 4
Having the centralised intake model has increased our collaboration with non-specialist homelessness services that our service users need.
42 20 48% 18 43% 2 5% 2 5% 3 6

Final report Evaluation of reforms to the ACT Spe
95
Gaps in service delivery
Table 23. Q13. Which of the following cohorts does your service target as part of its involvement in the SHS system?
n %
Men 24 51%
Women 34 72%
Younger people <18 years 27 57%
Younger people 18-25 years 30 64%
Older people 17 36%
Families 20 43%
Aboriginal and Torres Strait Islander people 32 68%
People affected by domestic violence 31 66%
People leaving institutional care/facilities (hospital/prison) 25 53%
People with mental health issues 35 74%
People with substance abuse issues 28 60%
Long term or chronic homeless 22 47%
Total 47
Missing 4
Note: Per cent of cases is calculated as the frequency of a given response over the number of valid cases (complete responses to the question).
*When specified, ‘Other’ responses included: CALD women and families (3), Young people 16-25 (2), people on low to moderate incomes (1), ATSI staff and organisations (1), prenatal and postnatal women (1).
Table 24. Q14. In terms of accessing private rental housing, what do you see as the main barriers, if any, for service users to enter and sustain private rental housing? What could help within the scope of the SHS system?
n %
Barrier 45 88%
No Barrier 6 12%
Total 51

Final report Evaluation of reforms to the ACT Specialist Homelessness Service system
96
Integration of the sector
Table 25. Q16. For each of the following agencies, organisations or services, please indicate the degree of cooperation with your organisation. Observed Integration.
Total No awareness Awareness Communication Coordination Collaboration Missing
n n % n % n % n % n % n
Central intake service 44 3 7% 8 18% 15 34% 13 30% 5 11% 7
Other SHSs 45 1 2% 6 13% 18 40% 8 18% 12 27% 6
Housing ACT 45 0 0% 4 9% 17 38% 12 27% 12 27% 6
Justice/ Police 45 1 2% 17 38% 20 44% 4 9% 3 7% 6
Community Housing 45 4 9% 14 31% 21 47% 2 4% 4 9% 6
Centrelink 45 1 2% 8 18% 21 47% 6 13% 9 20% 6
Employment assistance 45 5 11% 25 56% 10 22% 4 9% 1 2% 6
Mental health services 45 2 4% 12 27% 18 40% 7 16% 6 13% 6
Education and training 45 2 4% 21 47% 13 29% 3 7% 6 13% 6
D&A service 45 1 2% 10 22% 25 56% 4 9% 5 11% 6
ATSI 45 2 4% 9 20% 19 42% 7 16% 8 18% 6
Disability services 45 5 11% 20 44% 14 31% 3 7% 3 7% 6
CALD 45 7 16% 13 29% 15 33% 8 18% 2 4% 6
Family Support 45 2 4% 10 22% 14 31% 15 33% 4 9% 6
Refugee/ migration 45 8 18% 14 31% 15 33% 5 11% 3 7% 6

Final report Evaluation of reforms to the ACT Specialist Homelessness Service system
97
Total No awareness Awareness Communication Coordination Collaboration Missing
n n % n % n % n % n % n
Religious 45 6 13% 28 62% 6 13% 2 4% 3 7% 6
Emergency relief 45 1 2% 12 27% 21 47% 5 11% 6 13% 6
Child and Family 45 6 13% 17 38% 15 33% 6 13% 1 2% 6
Counselling 44 3 7% 11 25% 17 39% 7 16% 6 14% 7
Hospitals 45 4 9% 19 42% 14 31% 7 16% 1 2% 6

Final report Evaluation of reforms to the ACT Specialist Homelessness Service system
98
Table 26. Q16. For each of the following agencies, organisations or services, please indicate the degree of cooperation with your organisation. Expected integration.
Total No awareness Awareness Communication Coordination Collaboration Missing
n n % n % n % n % n % n
Central intake service 44 5 11% 2 5% 8 18% 12 27% 17 39% 7
Other SHSs 44 1 2% 1 2% 9 20% 10 23% 23 52% 7
Housing ACT 45 0 0% 3 7% 3 7% 9 20% 30 67% 6
Justice/ Police 45 0 0% 8 18% 17 38% 10 22% 10 22% 6
Community Housing 45 1 2% 7 16% 10 22% 16 36% 11 24% 6
Centrelink 44 0 0% 3 7% 14 32% 16 36% 11 25% 7
Employment assistance 45 2 4% 8 18% 15 33% 11 24% 9 20% 6
Mental health services 45 0 0% 4 9% 10 22% 16 36% 15 33% 6
Education and training 45 0 0% 8 18% 17 38% 8 18% 12 27% 6
D&A service 45 0 0% 2 4% 12 27% 15 33% 16 36% 6
ATSI 45 0 0% 3 7% 6 13% 11 24% 25 56% 6
Disability services 45 1 2% 4 9% 18 40% 12 27% 10 22% 6
CALD 44 4 9% 4 9% 8 18% 16 36% 12 27% 7
Family Support 44 2 5% 5 11% 8 18% 16 36% 13 30% 7
Refugee/ migration 45 5 11% 3 7% 12 27% 14 31% 11 24% 6
Religious 45 6 13% 16 36% 15 33% 3 7% 5 11% 6
Emergency relief 45 0 0% 4 9% 19 42% 15 33% 7 16% 6

Final report Evaluation of reforms to the ACT Specialist Homelessness Service system
99
Total No awareness Awareness Communication Coordination Collaboration Missing
n n % n % n % n % n % n
Child and Family 44 2 5% 11 25% 13 30% 13 30% 5 11% 7
Counselling 45 1 2% 4 9% 16 36% 11 24% 13 29% 6
Hospitals 45 1 2% 11 24% 14 31% 14 31% 5 11% 6

Final report Evaluation of reforms to the ACT Specialist Homelessness Service system
100
Table 27. Q17. Could you please specify how you feel cooperation has changed with each organisation since 2008?
Total Improved a lot Improved a little Unchanged Worsened a little Worsened a lot Don’t know/ Doesn’t apply
Missing
n n % n % n % n % n % n n
Central intake service 41 12 29% 12 29% 11 27% 4 10% 2 5% 4 6
Other SHSs 42 11 26% 12 29% 10 24% 7 17% 2 5% 2 7
Housing ACT 42 12 29% 13 31% 13 31% 1 2% 3 7% 3 6
Justice/ Police 39 1 3% 12 31% 25 64% 0 0% 1 3% 6 6
Community Housing 42 5 12% 10 24% 25 60% 1 2% 1 2% 3 6
Centrelink 45 11 24% 12 27% 22 49% 0 0% 0 0% 0 6
Employment assistance 40 2 5% 11 28% 24 60% 2 5% 1 3% 5 6
Mental health services 43 8 19% 14 33% 15 35% 6 14% 0 0% 2 6
Education and training 42 5 12% 9 21% 26 62% 1 2% 1 2% 3 6
D&A service 42 6 14% 12 29% 21 50% 3 7% 0 0% 2 7
ATSI 42 10 24% 17 40% 12 29% 2 5% 1 2% 3 6
Disability services 37 6 16% 9 24% 22 59% 0 0% 0 0% 8 6
CALD 36 4 11% 15 42% 17 47% 0 0% 0 0% 9 6
Family Support 43 4 9% 15 35% 23 53% 1 2% 0 0% 2 6
Refugee/ migration 36 7 19% 15 42% 12 33% 1 3% 1 3% 9 6
Religious 27 3 11% 1 4% 23 85% 0 0% 0 0% 16 8
Emergency relief 43 3 7% 14 33% 24 56% 2 5% 0 0% 2 6

Final report Evaluation of reforms to the ACT Specialist Homelessness Service system
101
Total Improved a lot Improved a little Unchanged Worsened a little Worsened a lot Don’t know/ Doesn’t apply
Missing
n n % n % n % n % n % n n
Child and Family 41 5 12% 8 20% 28 68% 0 0% 0 0% 4 6
Counselling 42 7 17% 11 26% 22 52% 2 5% 0 0% 3 6
Hospitals 39 2 5% 6 15% 30 77% 1 3% 0 0% 6 6

Final report Evaluation of reforms to the ACT Spe
102
Overall Feedback
Table 28. Q18. Over the last six years, how would you describe any change in housing outcomes for service users in the ACT?
Change n %
1-Worsened a lot 12 27%
2 10 22%
3 5 11%
4-Unchanged 5 11%
5 6 13%
6 3 7%
7-Improved a lot 4 9%
Total 45 100%
Average 3.18
Missing 6
Table 29. Q19. Over the last six years, how would you describe any change in non-housing outcomes for service users in the ACT?
Change n %
1-Worsened a lot 2 4%
2 5 11%
3 8 18%
4-Unchanged 10 22%
5 9 20%
6 9 20%
7-Improved a lot 2 4%
Total 45 100%
Average 4.20
Missing 6
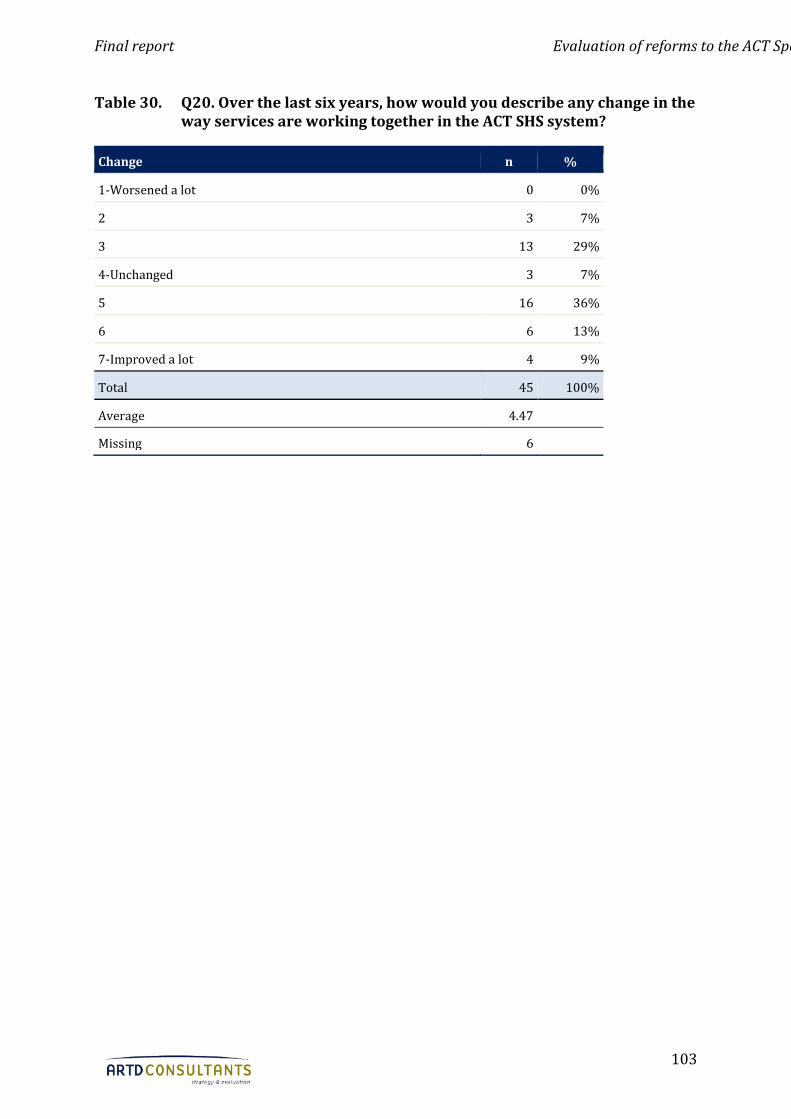
Final report Evaluation of reforms to the ACT Spe
103
Table 30. Q20. Over the last six years, how would you describe any change in the way services are working together in the ACT SHS system?
Change n %
1-Worsened a lot 0 0%
2 3 7%
3 13 29%
4-Unchanged 3 7%
5 16 36%
6 6 13%
7-Improved a lot 4 9%
Total 45 100%
Average 4.47
Missing 6

Final report Evaluation of reforms to the ACT Spe
104
Appendix 3. Results from the partner organisations online survey
Table 31. Response rate to the partner online survey
Emails sent 60
Emails bounced 0
Population surveyed 60
Complete responses 20
Partial responses 10
Disqualified 0
Total responses 30
Response rate 50%
You and your organisation
Table 32. Q1. Of the services that your organisation provides which of the services do you sometimes provide to SHS service users?
Type of service n %
Advocacy/ liaison on behalf of service user 9 39%
Health/ medical services 9 39%
Living skills/ personal development 8 35%
Assistance for family/ relationship incl. domestic violence, parenting skill 8 35%
Material aid/ brokerage 7 30%
Employment assistance 6 26%
Education and training assistance 6 26%
Transport 5 22%
Recreation 5 22%
Drug and alcohol counselling 5 22%
Tenancy support 4 17%
Culturally specific services 4 17%
Legal Advice 4 17%

Final report Evaluation of reforms to the ACT Spe
105
Type of service n %
Problem gambling counselling 3 13%
Meals 3 13%
Laundry/ shower facilities 2 9%
Child care 0 0%
Child protection 0 0%
Other, please specify 15 65%
Total 23
Missing 7
Note: Per cent of cases is calculated as the frequency of a given response over the number of valid cases (complete responses to the question).
*When specified, ‘Other’ responses included: Counselling (4), advocacy (2), referrals to other services (1), coordination to other services (1), rehabilitation (1), respite (1), clothing (1), crisis accommodation (1), housing (1), case coordination (1), out of home care (1), grant funding (1).
Table 33. Q2. How long have you been working in the SHS sector in the ACT?
n %
Less than six months 0 0%
Between six months and two years 0 0%
Between two and five years 5 23%
More than five years 17 77%
Total 22 100%
Missing 8
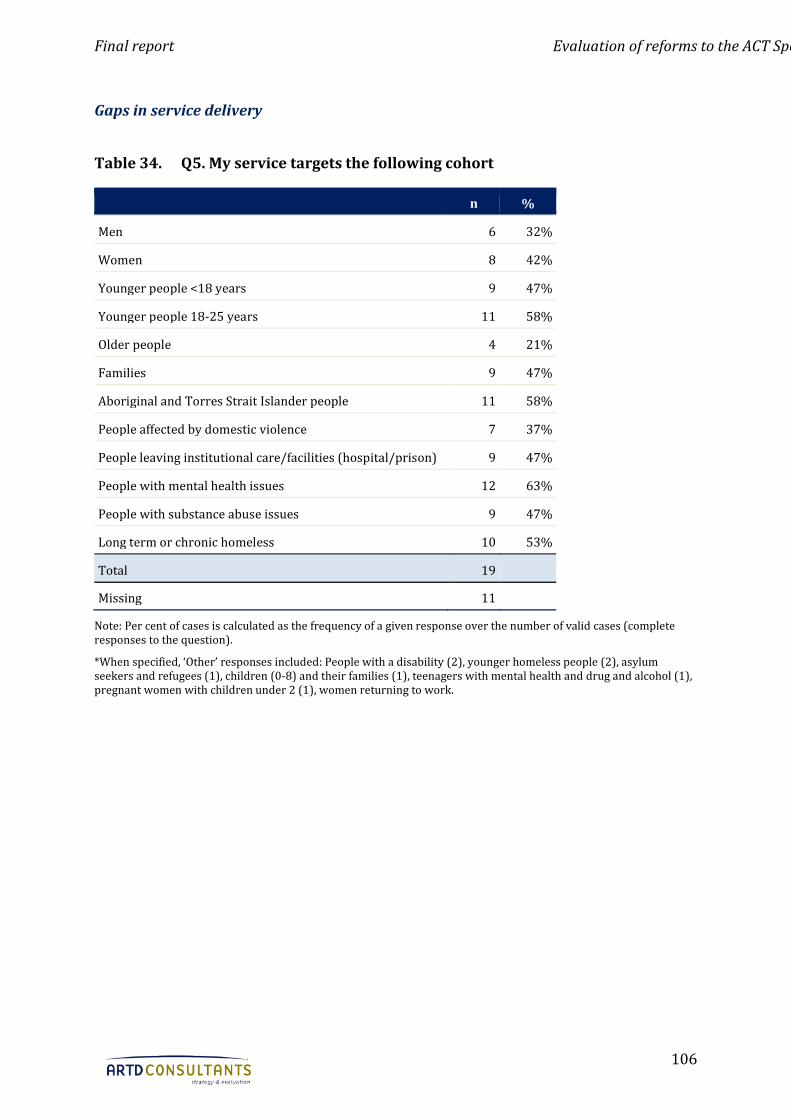
Final report Evaluation of reforms to the ACT Spe
106
Gaps in service delivery
Table 34. Q5. My service targets the following cohort
n %
Men 6 32%
Women 8 42%
Younger people <18 years 9 47%
Younger people 18-25 years 11 58%
Older people 4 21%
Families 9 47%
Aboriginal and Torres Strait Islander people 11 58%
People affected by domestic violence 7 37%
People leaving institutional care/facilities (hospital/prison) 9 47%
People with mental health issues 12 63%
People with substance abuse issues 9 47%
Long term or chronic homeless 10 53%
Total 19
Missing 11
Note: Per cent of cases is calculated as the frequency of a given response over the number of valid cases (complete responses to the question).
*When specified, ‘Other’ responses included: People with a disability (2), younger homeless people (2), asylum seekers and refugees (1), children (0-8) and their families (1), teenagers with mental health and drug and alcohol (1), pregnant women with children under 2 (1), women returning to work.

Final report Evaluation of reforms to the ACT Specialist Homelessness Service system
107
Integration of the sector
Table 35. Q6. For each of the following agencies, organisations or services, please indicate the degree of cooperation with your organisation. Observed integration.
Total No awareness Awareness Communication Coordination Collaboration Missing
n n % n % n % n % n % n
Central intake service 18 1 6% 9 50% 4 22% 1 6% 3 17% 12
SHS Providers 19 1 5% 3 16% 6 32% 5 26% 4 21% 11
Housing ACT 19 0 0% 6 32% 6 32% 2 11% 5 26% 11
Community Housing Providers 19 0 0% 7 37% 7 37% 2 11% 3 16% 11
Table 36. Q6. For each of the following agencies, organisations or services, please indicate the degree of cooperation with your organisation Expected integration.
Total No awareness Awareness Communication Coordination Collaboration Missing
n n % n % n % n % n % n
Central intake service 17 1 6% 4 24% 3 18% 5 29% 4 24% 13
SHS Providers 18 0 0% 1 6% 3 17% 7 39% 7 39% 12
Housing ACT 18 0 0% 1 6% 5 28% 6 33% 6 33% 12
Community Housing Providers 18 0 0% 1 6% 5 28% 8 44% 4 22% 12
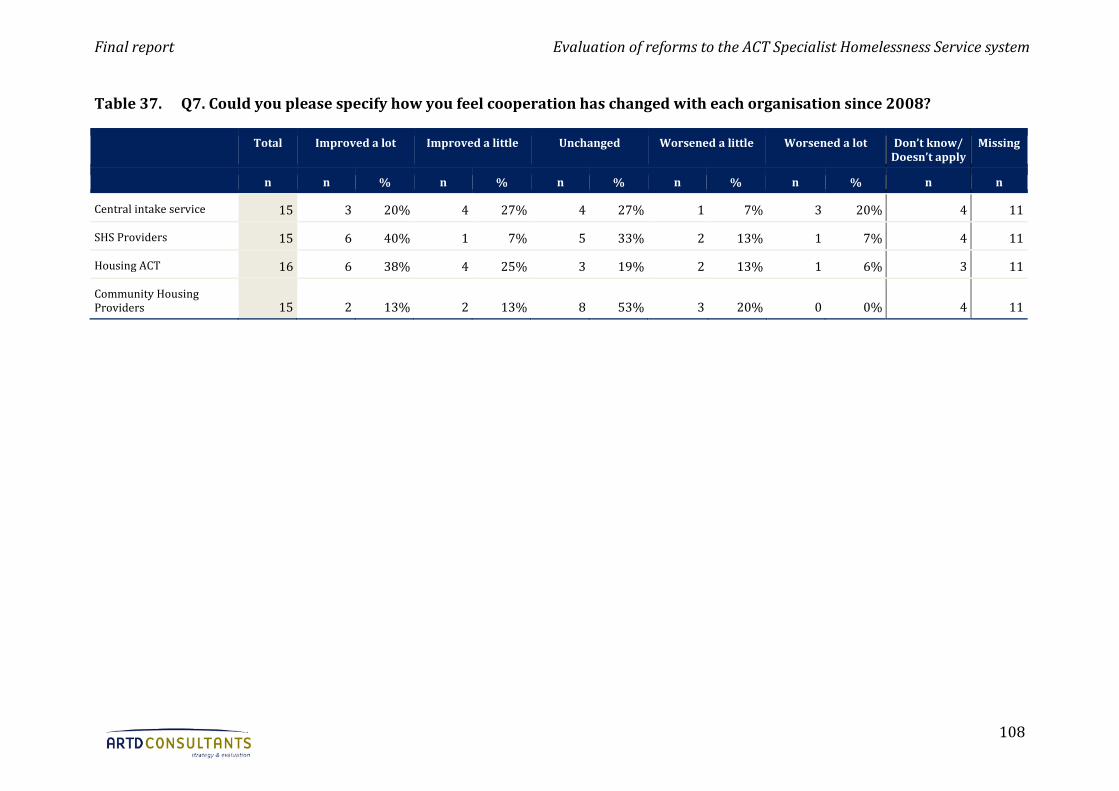
Final report Evaluation of reforms to the ACT Specialist Homelessness Service system
108
Table 37. Q7. Could you please specify how you feel cooperation has changed with each organisation since 2008?
Total Improved a lot Improved a little Unchanged Worsened a little Worsened a lot Don’t know/ Doesn’t apply
Missing
n n % n % n % n % n % n n
Central intake service 15 3 20% 4 27% 4 27% 1 7% 3 20% 4 11
SHS Providers 15 6 40% 1 7% 5 33% 2 13% 1 7% 4 11
Housing ACT 16 6 38% 4 25% 3 19% 2 13% 1 6% 3 11
Community Housing Providers 15 2 13% 2 13% 8 53% 3 20% 0 0% 4 11

Final report Evaluation of reforms to the ACT Specialist Homelessness Service system
109
Overall feedback
Table 38. Q8. Over the last six years, how would you describe any change in housing outcomes for service users in the ACT?
Change n %
1-Worsened a lot 2 10%
2 2 10%
3 5 25%
4-Unchanged 4 20%
5 5 25%
6 2 10%
7-Improved a lot 0 0%
Total 20 100%
Average 3.7
Missing 10
Table 39. Q9. Over the last six years, how would you describe any change in non-housing outcomes for service users in the ACT?
Change n %
1-Worsened a lot 1 5%
2 0 0%
3 3 15%
4-Unchanged 7 35%
5 6 30%
6 2 10%
7-Improved a lot 1 5%
Total 20 100%
Average 4
Missing 10

Final report Evaluation of reforms to the ACT Specialist Homelessness Service system
110
Table 40. Q10. Over the last six years, how would you describe any change in the way services are working together in the ACT SHS system?
Change n %
1-Worsened a lot 0 0%
2 2 10%
3 1 5%
4-Unchanged 4 20%
5 11 55%
6 1 5%
7-Improved a lot 1 5%
Total 20 100%
Average 4.55
Missing 10