evaluation of kilojoule menu labelling - safer food,...
TRANSCRIPT

Evaluation of kilojoule menu labelling
CP070/1308

Evaluation of kilojoule menu labelling CP070/1308 Page 1 of 35
Contents
Summary ............................................................................................................................... 2
Introduction ........................................................................................................................... 4
Rationale for evaluating the initiative ....................................................................................... 6
Evaluation objectives and design ............................................................................................. 7
Data collection methodology.................................................................................................... 8
Industry feedback (Intermediate outcome 1) ......................................................................... 8
Compliance program (Intermediate outcome 1 and 2) ............................................................ 8
Consumer education campaign (Intermediate outcome 3) ...................................................... 8
Qualitative and quantitative research (Intermediate outcomes 4, 5 and 6) ............................... 9
Verification of menu board energy values (Intermediate outcome 4) ..................................... 10
Evaluation results ................................................................................................................. 11
Intermediate outcome 1: Businesses understand and comply the regulatory requirement ........ 11
Intermediate outcome 2: Regulatory agencies manage and enforce the regulation ................. 13
Intermediate outcome 3: NSW Food Authority implements a consumer education program ..... 13
Intermediate outcome 4: Consumers have information to make healthier choices at fast food and snack food chains ....................................................................................................... 14
Intermediate outcome 5: Consumers have awareness and increased understanding of energy (particularly kJ values in qualifying outlets) ......................................................................... 18
Intermediate outcome 6: Consumers purchase fewer kJs from qualifying outlets and/or make different food choices with other meals ............................................................................... 22
Kilojoule labelling influence choice ...................................................................................... 23
Discussion ........................................................................................................................... 25
Good compliance with regulatory requirements .................................................................... 25
Consumer campaign implemented ...................................................................................... 25
Consumer research shows positive signs ............................................................................. 25
Early indication that consumers are making healthier choices ................................................ 26
Conclusion ........................................................................................................................... 27
References ........................................................................................................................... 28
Appendix 1 .......................................................................................................................... 30
Determining the average energy content of Standard Menu Items ......................................... 30
Appendix 2 .......................................................................................................................... 31
List of chains provided with implementation assistance ......................................................... 31
Appendix 3 .......................................................................................................................... 32
Education campaign examples ............................................................................................ 32

Evaluation of kilojoule menu labelling CP070/1308 Page 2 of 35
Summary
Governments in Australia evaluate the outcomes of initiatives so as to plan future policies and programs on an evidence basis. The NSW Food Authority (the Authority) used an evaluation framework for assessing the impacts and the appropriateness of kilojoule menu labelling in fast food and snack outlets in NSW, which had to be displayed at all qualifying outlets in February 20121
Ultimately, implementing the kilojoule menu labelling initiative aims to assist consumers make healthier food choices. As there are multiple public health initiatives contributing towards this goal at the local, state and national level, the evaluation focused on gathering evidence to assess what was achieved for a number of outcomes of specific relevance to kilojoule menu labelling. The evaluation project spanned from May 2011 to January 2013. The desired outcomes and the evidence of what was achieved are summarised below.
.
Desired outcome Achievement indicators
Businesses understand and comply with the regulatory requirement
38 of the 39 affected food chains and one business chain that voluntarily chose to comply sought compliance advice from the Authority prior to the regulation coming into force.
When the regulation came into force, 35 of the 39 affected fast food chains had implemented the new requirements.
Regulatory agencies manage and enforce the regulation
150 random outlets were checked onsite for compliance. Online ordering sites and printed material were also checked. With one exception, only minor issues were identified and these were resolved within defined timeframes by franchisors.
One chain had noncompliances that required escalation via a warning letter from the Authority.
The Authority implements a consumer education program
The NSW Government provided $1.18M to a consumer education campaign. The campaign was targeted towards 18 to 24 year olds as high frequenters of fast food and snacks outlets.
The 8700 campaign, based around the average daily energy intake of 8700 kJ, was launched in March 2011 and used digital, social and radio media, targeting high consumers of fast food. It ran in two phases until December 2012.
Consumers have information to make healthier choices at fast food and snack food chains
All affected chains are displaying kilojoule information on their menus.
With respect to the 8700 campaign, consumers accessed material as demonstrated by: 213,000 visits to the 8700 website; 99,907 downloads of the 8700 app; 9,000 likes on Facebook; 6,200 views of the YouTube video.
The campaign exceeded all its digital media targets.
1 Kilojoule menu labelling extends to supermarkets selling standard menu items. The requirements for Supermarkets came into effect in February 2013 and are subject to a separate evaluative process.

Evaluation of kilojoule menu labelling CP070/1308 Page 3 of 35
Desired outcome Achievement indicators
Consumers have awareness and increased understanding of energy
The views from two consumer groups were sought: the general population (16 years and above) and 18 to 24 year olds.
There was a significant increase over the evaluation period in both consumer groups in nominating the correct range of the average daily energy intake (8000 to 8999 kJ), and nominating the exact value of the average daily energy intake (8700kJ).
Approximately 50% of the general population and 70% of the 18 to 24 year sub-group were aware that kilojoules are a measure of energy. This did not change significantly during the evaluation period.
Consumers purchase fewer kJs from qualifying outlets and/or make different food choices with other meals
The median kilojoules purchased decreased significantly during the evaluation period: an overall reduction of 519 kJ (from 3355kJ to 2836 kJ or 15% decrease).
Consumer behaviour change is likely to take time. The achievements reported here show that the initiative was implemented well by industry and regulators, consumers noticed the new information in outlets, there is a shift towards consumers having a better understanding of the average daily energy intake, and some reduction in kilojoules purchased was observed.
Acknowledgments
The kilojoule menu labelling evaluation and consumer education campaign was funded by a maintenance of effort grant to the NSW Food Authority (the Authority) and by the NSW Ministry of Health.
The NSW Food Authority and the NSW Ministry of Health thank the members of the Fast Choices (kilojoule menu labelling) reference group for their engagement in the initiative and valuable feedback, which contributed greatly to the successes summarised here. We extend our thanks also to the fast food and snack chains that availed their outlets for the purposes of consumer research.

Evaluation of kilojoule menu labelling CP070/1308 Page 4 of 35
Introduction
In November 2010, the NSW Parliament passed legislation requiring certain retail food outlets to display nutrition information on menus at point-of-sale. The initiative is part of the NSW Government’s broad set of responses to assist in reducing high rates of overweight and obesity in the community.
The new laws commenced 1 February 2011 and businesses had 12 months to comply with the requirements2
Standard food items are:
. The requirements apply to ‘standard food outlets’ that sell ‘standard food items’.
• ready-to-eat items (not pre-packaged) sold in servings that are standardised for portion size and content (and may include a combination of such items, eg meal deals) and that are shown on a menu or displayed with a price or label, and
• sold at more than one location.
Standard food outlets are businesses that sell standard food items and have:
• 20 or more locations in NSW, or
• 50 or more locations nationally.
Standard food outlets are required to display both the:
• average energy content of each standard food item (expressed in kilojoule, kJ), and
• reference statement ‘the average daily energy intake is 8700 kJ’.
The kJ value must be next to the price of each item on menus:
• in store,
• at drive throughs,
• on internet ordering sites, and
• distributed via letterboxes.
The requirements are set out in Part 8, Division 4 of the Food Act 2003 (NSW) and Part 2B of the Food Regulation 2010 (NSW).
The legislation also requires a review of Part 8, Division 4 of the Food Act 2003 (NSW) and Part 2B of the Food Regulation 2010 (NSW) to determine whether the:
a) policy objectives of this Division and any regulation remain valid,
b) terms of this Division and those regulation remain appropriate for securing those objectives, and
c) terms of this Division or those regulations, or both, should be amended so that the nutrition information to be displayed includes information relating to fat and salt.
The legislation requires that the review commence as soon as possible after 1 February 2012 and be tabled in each House of Parliament within 12 months after this date. In November 2012, the Review of Fast Food Labelling Report (the Review Report) was tabled in each House of Parliament. The Review Report concluded that the policy objectives of the menu labelling requirements remain valid, and that the requirements remain appropriate for securing the objectives without amendment (NSW Food Authority, 2012).
2 Supermarket were not required to implement until 1 February 2013
Evaluation of kilojoule menu labelling CP070/1308 Page 5 of 35
At the time of tabling the Review Report, the evaluation of the menu labelling requirements was still in progress. This report provides the final findings of the evaluation of the kilojoule menu labelling initiative.
Throughout, the NSW Food Authority and the Ministry of Health worked with a reference group that included representatives from industry, community and government stakeholders:
• Australian Food and Grocery Council
• Australian National Retailers Association
• Bakers Delight Holdings Ltd
• Boost Juice
• Domino’s Pizza Enterprises Ltd
• Gloria Jeans Coffees International
• Retail Food Group Ltd
• Subway
• Choice
• Boden Institute of Obesity, Nutrition, Exercise & Eating Disorders
• George Institute of Global Health
• National Heart Foundation (NSW)
• Department of Premier’s and Cabinet
• NSW Ministry of Health
• NSW Food Authority (Chair)

Evaluation of kilojoule menu labelling CP070/1308 Page 6 of 35
Rationale for evaluating the initiative
Governments in Australia evaluate the outcomes of initiatives so as to plan future policies and programs on an evidence basis. A key public health driver for the kilojoule menu labelling initiative is that Australia, like most of the developed world, is experiencing unprecedented levels of overweight and obesity and NSW as Australia’s most populous jurisdiction is no exception. In 2011, 52.6% of NSW adults were overweight or obese; and in 2010, 22.8% children were overweight and obese (NSW Health 2013, NSW Ministry of Health, 2013). The 2012 State Plan includes targets to reduce the rates of child and adult overweight and obesity in NSW (NSW Government 2011). Overweight, obesity, related preventable chronic diseases and premature death costs an estimated $19 billion per annum in NSW alone (Access Economic, 2008).
Overweight and obesity is itself a serious, chronic medical condition and is also associated with a wide range of debilitating and life threatening conditions and illnesses, including type 2 diabetes, cardiovascular diseases and some cancers. Healthy eating and being physically active contribute to the prevention of many chronic diseases and enhance an individuals’ quality of life. Conversely, unhealthy eating, in particular the over-consumption of energy dense, nutrient poor foods and drinks and physical inactivity and sedentariness, are predictors of overweight and obesity.
Ultimately, implementing the kilojoule menu labelling initiative has the aims to assist consumers make healthier food choices. Progressively monitoring and evaluating whether the initiative is tracking towards delivery of this change also serves to:
• provide government and industry with information to make ongoing improvements that will increase the chances of attaining change,
• show accountability and transparency to the community and other stakeholders by demonstrating that the effectiveness and efficiency of the initiative is under objective scrutiny,
• promote public awareness of the underlying health issues the initiative seeks to address,
• promote public use of the information when making food purchases,
• demonstrate the contribution of funded support programs (eg consumer education) to achieve the desired change, and
• provide qualitative and quantitative evidence to inform policy decisions about the fate of the initiative and support programs.

Evaluation of kilojoule menu labelling CP070/1308 Page 7 of 35
Evaluation objectives and design
The Authority uses an evaluation framework for assessing the impacts and the appropriateness of food regulation in NSW (NSW Food Authority, 2008). The evaluation framework uses program logic mapping that encourages clear thinking about the purpose of the policy underpinning the legislation, resulting in the evaluation process that progresses towards objectives and outcomes more precisely. The program logic mapping exercise for the evaluation of the kilojoule menu labelling initiative is shown in Figure 1.
Figure 1: Kilojoule menu labelling initiative – Program logic model for evaluation
There are multiple initiatives outside the Fast Choices initiative contributing towards the ultimate outcome ‘consumers make healthier food choices’. The intermediate outcomes of specific relevance to the regulatory requirements are:
1. Businesses understand and comply with the regulatory requirement 2. Regulatory agencies manage and enforce the regulation 3. The Authority implements a consumer education program 4. Consumers have information to make healthier choices at fast food and snack food chains 5. Consumers have awareness and increased understanding of energy (particularly kJ values in
qualifying outlets) 6. Consumers purchase fewer kJs from qualifying outlets and/or make different food choices
with other meals
To address the intermediate outcomes, the following data collection strategies were identified:
• type of issues raised by businesses about the regulation and percentage resolved, • number of on-site inspections and percentage of businesses complying, • the collection of both qualitative and quantitative data to estimate changes in food choice
and nutrients purchased, • obtaining qualitative and quantitative data from interviews with consumers to assess
changes in understanding, use and acceptability of the labelling system over time, and • sample collection for laboratory analysis of kilojoules.

Evaluation of kilojoule menu labelling CP070/1308 Page 8 of 35
Data collection methodology
Industry feedback (Intermediate outcome 1)
Following the passage of the legislation in November 2010, the Authority invited stakeholders to attend a briefing session about the requirements. Attendees and non-attendees were then encouraged to provide feedback to the Authority on any aspect of the kilojoule menu labelling requirements.
Feedback from the implementation process was logged on an issues and resolution register and this formed the basis for reporting on issues raised by businesses and percentage resolved.
Compliance program (Intermediate outcome 1 and 2)
Monitoring compliance with the regulation involved:
• visual checks for the presence of the menu labelling by Local Council Environmental Health Officers (Council Officers), and
• review by the Authority of menu labelling to ensure they comply with the requirements.
Council Officers routinely conduct inspections of outlets captured by the legislation. From February 2012, they were requested to notify the Authority of any business not displaying kilojoule information and the Authority then determined whether compliance was required and if necessary conducted follow up action.
Further, during 2012 the Authority undertook compliance inspections to assess compliance with the legislation. This involved review of:
• 150 outlets onsite representing 40 fast food chains,
• online menus (including web-based and tablet/smart phone applications), and
• takeaway menus.
Consumer education campaign (Intermediate outcome 3)
A consumer education campaign supporting the legislation was funded by maintenance of effort grant to the NSW Food Authority and by the NSW Ministry of Health. Following Government approval processes, creative agencies Ogilvy, Apparent and Mediacom were contracted to undertake the campaign development and delivery.
The campaign targeted the 18 to 24 year old age bracket (the group that most often frequents fast food and snack outlets) but also aimed to have a ripple out to other consumers of fast foods in NSW. It had the following communication objectives:
• Build awareness that all standard, ready-to-eat food and drink from major fast food and snack chains are required to display kilojoule values
• Build NSW community awareness of the average Australian adult daily intake of 8700 kJ
• Encourage consumers to find out how many kilojoules they need per day by using online tools
• Encourage consumers to link what they learn from the education campaign to the kilojoule values at point-of-sale to make informed choices
The campaign used a number of digital resources together with waves of paid advertising on out-of-home and online media. Based on this approach and with knowledge of other campaigns that used a similar approach, campaign performance targets were based on advice from creative agencies (Table 1).

Evaluation of kilojoule menu labelling CP070/1308 Page 9 of 35
Table 1: Education campaign performance targets
Online element Target*
Click-through mobile 111,000
Click-through SEM 33,000
Click-through Facebook 43,000
Click-through all of mobile, SEM & Facebook 186,000
Mobile app. downloads 18,600
*Targets set for 31 December 20123
Qualitative and quantitative research (Intermediate outcomes 4, 5 and 6)
To address the qualitative and quantitative data strategies, a consumer research project was initiated. Following a tender and selection process TNS Social Research (TNS) was contracted to conduct this research4
The research project undertaken by TNS was designed on ‘knowledge-attitude-behaviour’ (KAB) models, providing a framework that can be used to monitor the impact of communications on behaviour over time. Behaviour change is a complex, long-term process. By monitoring the knowledge, attitudes and intentions the impact and efficacy of the communication in the short to medium term is determined and, to some extent, potential behavioural responses predicted.
. The findings from that research are summarised in the sections that follow. Readers are encouraged to access the detailed report available on the NSW Food Authority website.
The objectives of the research project were to assess whether the kilojoule menu labelling initiative had impacted consumers’:
• knowledge and awareness of kilojoules, • beliefs about ‘low’ and ‘high’ kilojoule foods, • attitudes and intentions in relation to ‘low’ and ‘high’ kilojoule foods, and • food choices in relevant settings (standard food outlets).
The project involved initial qualitative research followed by quantitative research pre and post implementation of menu labelling.
The initial qualitative research aimed to inform the later quantitative research and involved 12 in-depth interviews with a cross-section of the population. They were designed to provide an insight into the attitudes, beliefs and behaviours of consumers about fast food purchase and consumption. The interviews provided background information needed to assess any changes in consumers with the introduction of menu labelling.
The quantitative research used both intercept interviews with consumers at outlets and surveying consumers online. A mixture of intercept interviews and an online survey was undertaken as it was acknowledged that intercept interviews have time constraints whereas an online survey allows more time to delve deeper into the research.
Research was conducted three times over a twelve month period: 3 Until 31 December 2012 the campaign focused on the fast food and snack outlet setting. After this date, the campaign also focused on the supermarket setting. 4 A request for quotation was developed and sent to 10 organisations on the NSW Ministry of Health’s Preferred Supplier Panel with capabilities in both quantitative and qualitative research. Six proposals were received in response to the request for quotation. A project evaluation committee with representatives from the Authority, NSW Ministry of Health, the George Institute for Global Health and the Boden Institute of Obesity, Nutrition, Exercise and Eating Disorders was established to assess the proposals. The project selection committee assessed each proposal against a set of selection criteria and awarded the research project to TNS social research.

Evaluation of kilojoule menu labelling CP070/1308 Page 10 of 35
• Wave 1 (W1) – pre-implementation (September 2011)
• Wave 2 (W2) – immediately after implementation (April 2012)
• Wave 3 (W3) – six months after implementation (September 2012)
For intercept interviews, 800 people at 16 outlets (representing 10 chains) were interviewed on:
• their understanding of kilojoule content of foods,
• their purchase decision making process,
• perception and attitude to food choices,
• awareness of nutrition information at outlet, and
• acceptance of menu labelling and future intent.
The online survey involved interviewing 500 people to assess their:
• awareness and understanding of kilojoules and nutritional content,
• purchase and consumption patterns,
• awareness of menu labelling, and
• future motivations and intentions.
In early 2012, the research was expanded to include the consumer education campaign. This involved expanding the online survey to gauge exposure and reaction to the different campaign elements. A baseline survey of knowledge and awareness of the target audience was conducted in February 2012 (Wave 1), just prior to the campaign launch but after implementation of menu labelling (due to timing constraints it was not possible to conduct the baseline prior to implementation). The online survey was expanded to include questions relating to the education campaign for both survey periods post implementation (ie, Wave 2 and Wave 3 mentioned above).
Verification of menu board energy values (Intermediate outcome 4)
Clause 16S (3) and (4) of the Food Regulation 2010 requires the average energy content to be calculated in accordance with Standard 1.2.8 of the Australia New Zealand Food Standards Code, and adjusted based on the whole standard food item. A summary of the method for calculating the average energy content and expected variation is provided in Appendix 1.
While variation in nutritional values can be expected, the kilojoule values displayed on menu boards should generally reflect the kilojoules content of the actual food item consumed. To assess difference between menu board values and actual food values, the Authority tested food sold at standard food outlets. The testing program involved collecting 10% of standard food items from the various standard food outlet chains, noting the kilojoule value on the menu board at the time of sampling. The food samples were then submitted to Forensic and Analytical Science Services for kilojoule analysis. Where kilojoule content differed between the menu value and analysis result by more than 20%5
5 Accuracy requirements for nutrition information are not prescribed in the Code. Food Standards Australia New Zealand used an analytical variation of +/- 20% from the label when appraising sodium levels in packaged and take away foods (FSANZ undated). The United States Code of Federal Regulation (21 CFR 101.9(g)) states that desirable nutrients must be at least 80% of the label value and nutrients such as energy, saturated fat and sodium must not exceed 120% of label value to be considered compliant (GPO 2011). As such, a variation of 20% was used when assessing the variation between the menu value and results of analysis.
, two additional samples were collected, each from a different outlet, and analysed. The average of the three analytical results was compared with the menu board value. Collecting multiple samples of the same standard food items from different outlets allow us to account for variations in assembling the items and delaying the resampling allow us to account for potential seasonal variation. Where variation still exceeded 20%, the results were discussed with the relevant standard food outlet chain to determine potential causes for the variation.

Evaluation of kilojoule menu labelling CP070/1308 Page 11 of 35
Evaluation results
Intermediate outcome 1: Businesses understand and comply the regulatory requirement
Business understand the regulatory requirements
The kilojoule menu labelling initiative saw the advent of a new implementation model for the Authority. While the obligation to comply with the legislation falls upon the owner/operator of the food businesses, the Authority was conscious of the specific business models operating within the standard food outlet environment. In particular, the degree of control over menus, marketing and design by “head office” meant that successful implementation was likely to depend largely on the corporate management clearly understanding the requirements and appropriately developing their menus to comply. The approach taken by the Authority during implementation included:
• working with a Reference Group6
• providing interpretation assistance and guidance on menu board compliance to food chains through corporate management,
to resolve specific policy issues (managed via an issues register process),
• negotiating with peak bodies to assist implementation and interpret requirements,
• responding to queries and concerns raised by individual franchise holders, and
• developing industry assistance materials in the form of a user guide to help businesses with common implementation questions
The Authority provided compliance advice to 38 of the 39 affected food chains and one business chain that had voluntarily chosen to comply. Appendix 2 includes the complete list of businesses that were provided with one-on-one implementation assistance from the Authority.
The most commonly requested compliance advice included:
• the location and manner of displaying energy information and the reference statement,
• displaying energy information for meal deals, portion sizes and category items, and
• displaying average energy content using a ‘default’.
Based on the implementation model adapted by the Authority all issues could be resolved prior to implementation of the menu boards at the outlets.
Businesses comply w ith the regulatory requirements
Local council notifications
Since February 2012, Councils Officers have been required to notify the Authority where businesses were not displaying kilojoule information. To date, the Authority has not received any notifications. This result it not unexpected given the degree of control over menus by corporate management and the approach taken by the Authority in assisting businesses during implementation.
Onsite compliance checks
Twelve months after the legislation took effect, the Authority commenced a project to assess industry’s compliance with the requirements. This involved conducting onsite checks of 150 outlets representing 39 fast food chains affected by the legislation and one chain voluntarily displaying
6 The Fast Choices Reference Group was established following the passing of the legislation to provide ongoing policy advice to the government. It included representatives from industry, community and government stakeholders.

Evaluation of kilojoule menu labelling CP070/1308 Page 12 of 35
energy content (and therefore must comply with the requirements). Representative outlets from Sydney and regional areas were randomly selected for the project.
At the initial onsite check, approximately 35 of the 39 affected fast food chains had implemented the new requirements by displaying the energy content and reference statements on-store tags, labels and menu boards. Minor issues were identified including:
• lack of energy content information on some tags/labels and promotional posters (where required),
• lack of reference statement on some menu boards, display cabinets and promotional posters (where required), and
• illegibility or incorrect size and/or font of the energy content and/or reference statement.
Following each compliance check, the Authority informed the corporate management, in writing, of the findings. When noncompliances were identified, the Authority requested a written response outlining how it would rectify the issue. When requested, the Authority continued to work one-on-one with corporate management until businesses achieved full compliance with the legislation. Subsequent onsite checks to different outlets of the same chain showed increased compliance rates demonstrating the success of this approach.
With the four chains where the new requirements were not implemented at the time of the onsite check, three of the chains quickly responded to the Authority’s request for compliance. The Authority was required to escalate enforcement action (via a warning letter) against one chain when initial communication failed to produce a response. This chain has since implemented the requirements.
The compliance checks identified lower compliance rates for tags/labels and posters compared with the menu boards. This was expected as tag/labels and posters are frequently changed.
Compliance levels also varied between outlets from the same fast food chain. At times, some franchised outlets were found to have lower compliance levels compared to those outlets that were owned by the franchisor.
It is worthwhile noting that a number of national chains including Hungry Jacks, The Coffee Club, Subway, McDonalds, Donut King, Boost Juice, Gloria Jeans Coffees, Ali Baba, Domino’s and Wendy’s adopted the requirements before February 2012.
Menu compliance checks
The Authority conducted compliance checks of all available online menus (including web-based and tablet/ smart phone applications) of fast food chains where consumers can place orders. From February to July 2012, the Authority identified that five of the 39 fast food chains subject to the labelling requirements had developed online menus. Overall, the Authority found that online menus were compliant, with only a small number of minor issues identified.
The Authority found high levels of compliance for takeaway menus from four fast food chains that were required to comply with the requirements. Takeaway menus are required to comply when an order can be made from them and usually the menu includes full pricing, options and phone number for placing an order (ie they are not a catalogue or a flyer). From February to July 2012, takeaway menus from three of the four chains were found to be compliant, with one failing to display the reference statement correctly.
Evaluation of kilojoule menu labelling CP070/1308 Page 13 of 35
Intermediate outcome 2: Regulatory agencies manage and enforce the regulation
Both Council and the Authority play a role in managing and enforcing the regulation. As mentioned previously, Council Officers are required to notify the Authority where businesses are not displaying the kilojoule information. The Authority has provided implementation support to businesses to assist with compliance and have conducted compliance inspection and checks as mentioned above. The Authority continues to provide implementation support to businesses new in scope. Both the Authority and Council Officers will continue to play a role in managing and enforcing the regulation through the Food Regulation Partnership7 Conclusion (see ).
Intermediate outcome 3: NSW Food Authority implements a consumer education program
There is generally a low awareness of the energy content of food and beverages and total daily energy requirements (Watson et al 2013; Cowburn, 2005 and Chandon, 2007). Therefore, any menu board initiative should be appropriately supported with consumer education. This was consistently emphasised by stakeholders during the consultation for the kilojoule menu labelling initiative.
To start providing this education, the Authority published a basic information website in February 2011 to coincide with commencement of the kilojoule menu labelling legislation. Standard consumer messages on energy content in food and drink were developed, tested in focus groups and circulated to industry and community stakeholders. The messages were incorporated into the initial website and used by the food industry to develop their communication materials around kilojoules. Focus groups provided initial insights into general consumer understanding and engagement with concepts of energy in food.
A consumer campaign was developed in September 2011 focussing on consumers that frequent fast and snack foods outlet the most (that being 18 to 25 year old males), but also aimed to have a ripple out to other consumers of fast foods in NSW.
Challenges for the campaign included:
• the infrequent use of metric kilojoule terminology in the community and Australian media. ‘Calorie’ terminology dominates,
• very low awareness in the community of total daily energy intake,
• the absence of a single recommended Australian total energy intake as each person’s activity level and body characteristics vary,
• high levels of attachment to fast food consumption, and
• a tendency for unhealthy weight consumers to notice but not personalise messages around healthy weight.
The challenges were addressed by developing an education campaign that was both informative and enabled consumer choice. It encouraged consumers to notice the energy (kilojoule) values displayed on menus in standard food outlets and apply what they learned at the point-of-sale.
The advertising was also designed to build consumer awareness of energy in food and drink even without an awareness of kilojoule menu labelling initiative. It shows foods as the sum of the energy (kilojoule content) in their ingredients and an average total daily kilojoule intake of 8700 kilojoules a day. The materials also invited consumers to find ‘your ideal figure’, the total kilojoule intake suitable for each individual. The campaign avoided stigmatising fast and snack foods and included
7 The Food Regulation Partnership was established in 2008 to improve food safety coordination between councils and the Food Authority. Through the Partnership, the Authority provide support and assistance to councils in conducting their food regulatory role.

Evaluation of kilojoule menu labelling CP070/1308 Page 14 of 35
resources for consumers who were ready to go further along the ‘healthy choices’ journey. It included engagement activities and digital resources for use by consumers to explore, personalise, engage and, ultimately, advocate for the campaign messages by passing on recommendations to others.
The kilojoule menu labelling education campaign was launched in March 2012 and examples are attached at Appendix 3. Resources included a comprehensive website (replacing the initial website), interactive calculators for consumers to derive personal daily energy (kilojoules) intakes, a smartphone application (‘app’), a Facebook page (8700kJ) for social conversations, a searchable interpretive fast food database, infographics and a short video capturing the ‘Big Night In’ community engagement event. Paid advertising was placed in shopping centre food court displays, on selected radio outlets, and via online search marketing, Facebook and mobile phone advertising. Achievements against campaign targets are shown in Table 2.
Table 2: Consumer campaign achievements
Online element Target Actual*
Click-through mobile 111,000 137,754
Click-through SEM 33,000 39,022
Click-through Facebook 43,000 149,871
Click-through all of mobile, SEM & Facebook
186,000 326,647
Mobile app. download 18,600 99,907
*Results as at 31 December 2012, except for mobile app downloads which are as at 31 January 20138
Further, as at 31 December 2012, the digital elements of the campaign were accessed as follows*:
• 8700 website – 213,000 visits with 648,000 page views
• 8700 app (android and apple) – 99,907 downloads of the app with it being access 192,00 times with 1.9 million pages being views
• Facebook page – 9,000 likes of the page with the Facebook version of the energy calculator being used 10,000 times
• YouTube video – viewed 6,200 times
The education campaign also promoted access to other relevant health promotion services such as the NSW Get Healthy Information and Coaching Service.
Intermediate outcome 4: Consumers have information to make healthier choices at fast food and snack food chains
To assess whether consumers have information to make healthier choices at chains, the consumer research explored whether consumers:
• noticed and read nutrition information at outlets,
• were aware of the daily energy intake level (reference statement), and
• were using the nutrition information.
In addition, verification of menu information was assessed to determine the accuracy of the information that consumers use to assist them make the healthier choices.
8 Until 31 December 2012 the campaign focused on the fast food and snack outlet setting. After this date, the campaign also focused on the supermarket setting.

Evaluation of kilojoule menu labelling CP070/1308 Page 15 of 35
Noticed and read nutrition information
Both the intercept and online survey explored whether consumers noticed and read the nutrition information (Figure 2 and Figure 3). For the general population for both surveys, the percentage of consumers noticing the nutrition information increased over the survey period, with the difference between the start and finish of the survey period (September 2011 and September 2012) being significant for the intercept survey. For the 18 to 24 year old online survey, differences between the first and final surveys were not expected as the first survey was undertaken once kilojoule information was on menu boards.
Where participants noticed the information they were asked if they read the information and the percentage reading the information increased significantly during the survey period for the online survey of the general population. No significant changes were seen for the other surveys. As all surveys observed an increase in the number of respondents noticing nutrition information, the number of people reading the information increased across all surveys with the greatest increase being observed in the intercept survey, from 88 participants in Wave 1 to 193 participants in Wave 2.
Figure 2: Participants noticing nutrition information at outlets
(* indicates a significant difference compared to Wave 1 pre-implementation)
0
10
20
30
40
50
60
70
80
90
100
W1 (n=815)
W2 (n=807)
W3 (n=805)
W1 (n=506)
W2 (n= 528)
W3 (n=531)
W1 (n=217)
W2 (n=213)
W3 (n=206)
Intercept Online General Population Online 18 to 24 year olds
Perc
enta
ge (
%)
Yes No Don’t know
*
* *
*
* *

Evaluation of kilojoule menu labelling CP070/1308 Page 16 of 35
Figure 3: Participants reading nutrition information at outlets (* indicates a significant difference compared to Wave 1 pre-implementation)
Figure 3 relates to any nutrition information. After the implementation of kilojoule labelling on menu boards, those correctly and specifically identifying kilojoules on menu boards were:
• Intercept survey – 53% of those noticing the nutrition information
• Online survey of the general population – 44% of those noticing the nutrition information
• Online survey of the 18 to 24 year olds – 50% of those noticing the nutrition information
Awareness of the average daily energy intake
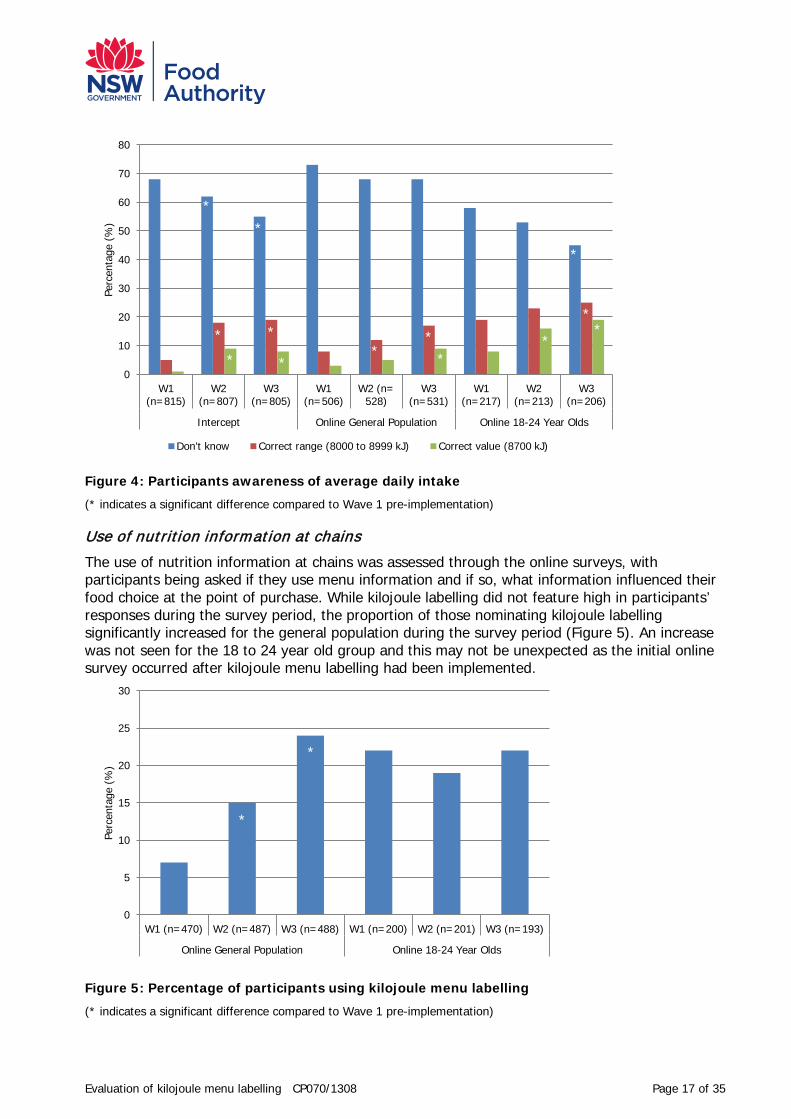
All surveys included questions relating to the awareness of the average daily energy intake. Awareness was low at the start of the surveys, with the proportion of consumers willing to nominate a value increasing over the survey period. The increase was significant for the general population intercept survey and the 18 to 25 year old online survey (Figure 4). While the majority of participants could not indicate the average daily energy intake, there was a significant increase across all survey in the proportion of respondent being able to:
• nominate the correct range of the average daily energy intake (8000 to 8999 kJ)
• nominate the exact value of the average daily energy intake (8700kJ)
0
10
20
30
40
50
60
70
80
W1 (n=122)
W2 (n=321)
W3 (n=293)
W1 (n=233)
W2 (n=257)
W3 (n=254)
W1 (n=128)
W2 (n=138)
W3 (n=130)
Intercept Online General Population Online 18 to 24 year olds
Perc
enta
ge (
%)
Yes No Don't know
*
*
Evaluation of kilojoule menu labelling CP070/1308 Page 17 of 35
Figure 4: Participants awareness of average daily intake
(* indicates a significant difference compared to Wave 1 pre-implementation)
Use of nutrition information at chains
The use of nutrition information at chains was assessed through the online surveys, with participants being asked if they use menu information and if so, what information influenced their food choice at the point of purchase. While kilojoule labelling did not feature high in participants’ responses during the survey period, the proportion of those nominating kilojoule labelling significantly increased for the general population during the survey period (Figure 5). An increase was not seen for the 18 to 24 year old group and this may not be unexpected as the initial online survey occurred after kilojoule menu labelling had been implemented.
Figure 5: Percentage of participants using kilojoule menu labelling
(* indicates a significant difference compared to Wave 1 pre-implementation)
0
10
20
30
40
50
60
70
80
W1 (n=815)
W2 (n=807)
W3 (n=805)
W1 (n=506)
W2 (n= 528)
W3 (n=531)
W1 (n=217)
W2 (n=213)
W3 (n=206)
Intercept Online General Population Online 18-24 Year Olds
Perc
enta
ge (
%)
Don’t know Correct range (8000 to 8999 kJ) Correct value (8700 kJ)
0
5
10
15
20
25
30
W1 (n=470) W2 (n=487) W3 (n=488) W1 (n=200) W2 (n=201) W3 (n=193)
Online General Population Online 18-24 Year Olds
Perc
enta
ge (
%)
*
*
*
* *
* *
*
* *
* *
*
*
*

Evaluation of kilojoule menu labelling CP070/1308 Page 18 of 35
Verification of menu labelling information
From May to December 2012, the Authority conducted a survey to verify the menu board energy values. A total of 256 samples from 36 chains were purchased and analysed for their energy content. At the time of purchase, the kilojoule value displayed for that item was noted. For 96 samples (37.5%) the kilojoule content differed by more that 20% between the menu value and analysis result.
For these 96 samples, the products were re-sampled in duplicate from different outlets on different days and analysed. Again, at the time of purchase, the kilojoule value displayed was noted. For all products, the kilojoule value displayed did not differ between the sampling periods. The average of the three analytical results was then compared with the menu board value. For 60 samples (23.4%) the difference between the analysis and kilojoule labelling value was still greater than 20%.
At the end of the survey, letters were sent to all of the fast food chains informing them of the results. Where the kilojoule value content between the menu and analytical results value was greater than 20%, chains were asked for feedback on possible reasons for differences. Feedback from chains indicated that variation can occur due to:
• individual food handlers assembling made to order items,
• seasonal variation of fresh fruit and vegetables,
• differences in the recommended and actual portion size, and
• different suppliers being used by different outlets.
In a few cases error in calculating the kilojoule label value were identified and kilojoule label values were updated.
Intermediate outcome 5: Consumers have awareness and increased understanding of energy (particularly kJ values in qualifying outlets)
Consumer awareness and increasing understanding of energy, particularly kJ values in outlets, was assessed by exploring consumers’:
• understanding of the term ‘kilojoule’,
• confidence in their knowledge of kilojoules and energy,
• actual knowledge of kilojoules and energy,
• understanding of the average daily energy intake,
• ability to estimate the kilojoule value of the foods they purchased, and
• exposure and reaction to the consumer education campaign.
In addition to this, exposure to consumer campaign elements and the extension of the evaluation to include the campaign can also be used to assess consumers’ awareness and increased understanding of energy.
Understanding of the term ‘k ilojoule’
The online surveys included both unprompted and prompted questions relating to understanding the term kilojoules. Throughout the survey period, participants’ understanding of the term ‘kilojoule’ remained constant and was similar for both unprompted and prompted responses (Figure 6). Around half the general population and two thirds or more of the 18 to 24 year olds correctly identified kilojoules as a measure of energy. While there was a significant decrease for the prompted question in the online survey for the 18 to 24 year olds at Wave 2, this was only temporary with the response levels slightly higher than observed at the start of the survey period.

Evaluation of kilojoule menu labelling CP070/1308 Page 19 of 35
Figure 6: Percentage of participants understanding the term 'kilojoule'
(* indicates a significant difference compared to Wave 1 pre-implementation)
Confidence in know ledge of energy and related terms
The online surveys also asked participants to self-rate their confidence in knowledge on energy, kilojoules and calories as well as other nutrients. Around half of the general population felt very or quite confident in their knowledge of energy and related terms, with the 18 to 24 year olds being less confident (Figure 7). The level of confidence on energy decreased significantly at Wave 2 for the 18 to 24 year olds, although the level of confidence did recover by Wave 3. This confidence change could be attributable to disruption in the target audience’s thinking about kilojoules as they were face with the new menu board labelling and information.
Figure 7: Percentage of participants confident in their knowledge of energy and related terms
(* indicates a significant difference compared to Wave 1 pre-implementation)
0
10
20
30
40
50
60
70
80
90
W1 (n=506) W2 (n= 528) W3 (n=531) W1 (n=217) W2 (n=213) W3 (n=206)
Online General Population Online 18-24 Year Olds
Perc
enta
ge (
%)
Unprompted Prompted
0
10
20
30
40
50
60
W1 (n=506) W2 (n= 528) W3 (n=531) W1 (n=217) W2 (n=213) W3 (n=206)
Online General Population Online 18-24 Year Olds
Perc
enta
ge (
%)
Energy Kilojoules Calories
*
*
*

Evaluation of kilojoule menu labelling CP070/1308 Page 20 of 35
Actual know ledge of energy and kilojoules
To gauge participants’ actual knowledge of kilojoules and energy, they were asked a series of true or false statements. For the general population throughout the survey period, 70% of participants correctly identified that consuming foods and drinks high in energy do not assist with weight loss and over half the participants in the general population correctly identified that food and drinks with a high number of kilojoules are high in energy content.
For the participants in the 18 to 24 year old survey, the proportion of participants responding correctly remained similar during the survey period for all questions. The correct response rate ranged from 58% to 79%, with this age group more likely to respond correctly when compared to the responses from the general population.
Understanding of the average daily energy intake
To assess participants understanding of the average daily energy intake, participants were asked what they think ‘the average daily intake’ refers to. Over half the participants in the general population group and nearly two-thirds of the participants in the 18 to 24 year old group described it as ‘the mean amount of daily food intake’. This level of reply was similar throughout the survey period.
Estimation of k ilojoules in foods purchased at outlets
As part of the intercept survey, participants were asked if they were able to estimate the kilojoule content of the foods they had purchased and if able, the value nominated.
The proportion of participants willing to estimate a kilojoule value for the foods they had purchased increased during the survey period. Those willing to estimate the kilojoule content of their food increased from 25% at Wave 1 to 33% at Wave 2 and 3.
Of those willing to estimate the kilojoule value of their food, there was a significant increase during the survey period for those estimating to within 10% of the actual value (Figure 8). Further, there was a significant decrease in those underestimating by 10% or more and a significant increase in those overestimating by 10% or more.
Figure 8: Percentage of participants estimating the kilojoule content of their purchases
(* indicates a significant difference compared to Wave 1 pre-implementation)
0
10
20
30
40
50
60
70
80
90
Estimating within 10% of actual content
Underestimating by 10% or more Overestimating by 10% or more
Perc
enta
ge (
%)
Intercept W1 (n=178) Intercept W2 (n=218) Intercept W3 (n=202)
* *
* *
* *

Evaluation of kilojoule menu labelling CP070/1308 Page 21 of 35
Consumer campaign
Exposure to the consumer campaign can be assessed by activity statistics to the various digital elements of the campaign and also the results from the online survey, particularly of the 18 to 24 year old age group, the target audience for the campaign. These were reported in a preceding section.
The Wave 2 and 3 online surveys also included questions relating to the campaigns to assess consumer recall of the campaign, understanding of the campaign, and impression and impact of the campaign.
Recall of the campaign was determined by asking participants, both unprompted and prompted, where and what was the content of any advertising they had seen for kilojoule labelling at outlets. At both Wave 2 and Wave 3 when asked unprompted, around a third of respondents recalled advertising (35% and 30% respectively for the general population and 43% and 37% respectively for the 18 to 24 year olds). For those with recall, the most common locations recalled were in store, on TV and at shopping centres or food courts and most recalled the kilojoule labelling itself and the 8700 website.
Survey participants were then shown the campaign elements and asked if they had seen or heard the elements (Table 3). Recall of all campaign elements was higher for the campaign target audience than in the general population. The campaign element most commonly nominated was the poster ads, followed by the online Facebook ad, the 8700 website and the search engine ads.
Table 3: Percentage of participants with recall of campaign elements9
General population
a
W2 W3 18 to 24 year olds W2 W3
Poster ads 9 9 Poster ads 23 31
Online Facebook ads 3 5 Online Facebook ads 22 16b
Website 4 4 Website 14 9b
Search engine ads 3 10b Search engine ads 13 16
Radio ads 2 - Radio ads 13 -
Web banner 3 5 Web banner 6 10
Mobile app 1 3b Mobile app 5 9b
Mobile ads 1 2 Mobile ads 5 8
Facebook page 1 3 Facebook page 4 6
a. Online General W2 n= 528; Online General W3 n=531; Online 18 to 24 W2 n=213; Online 18-24 W3= 206.
b. Significant difference compared to Wave 1 pre-implementation.
After viewing the campaign elements, survey participants were then prompted for the main message of the campaign. Across both survey groups, the most common responses included:
• monitor your energy intake,
• 8700 kJ is the recommended daily intake,
• find your personal recommended daily intake, and
• how many kilojoules/calories are in food.
9 Radio advertising was run only during the timing of the Wave2 surveys and not during the Wave 3. As such, questions relating to the radio advertising were removed from the Wave 3 surveys.
Evaluation of kilojoule menu labelling CP070/1308 Page 22 of 35
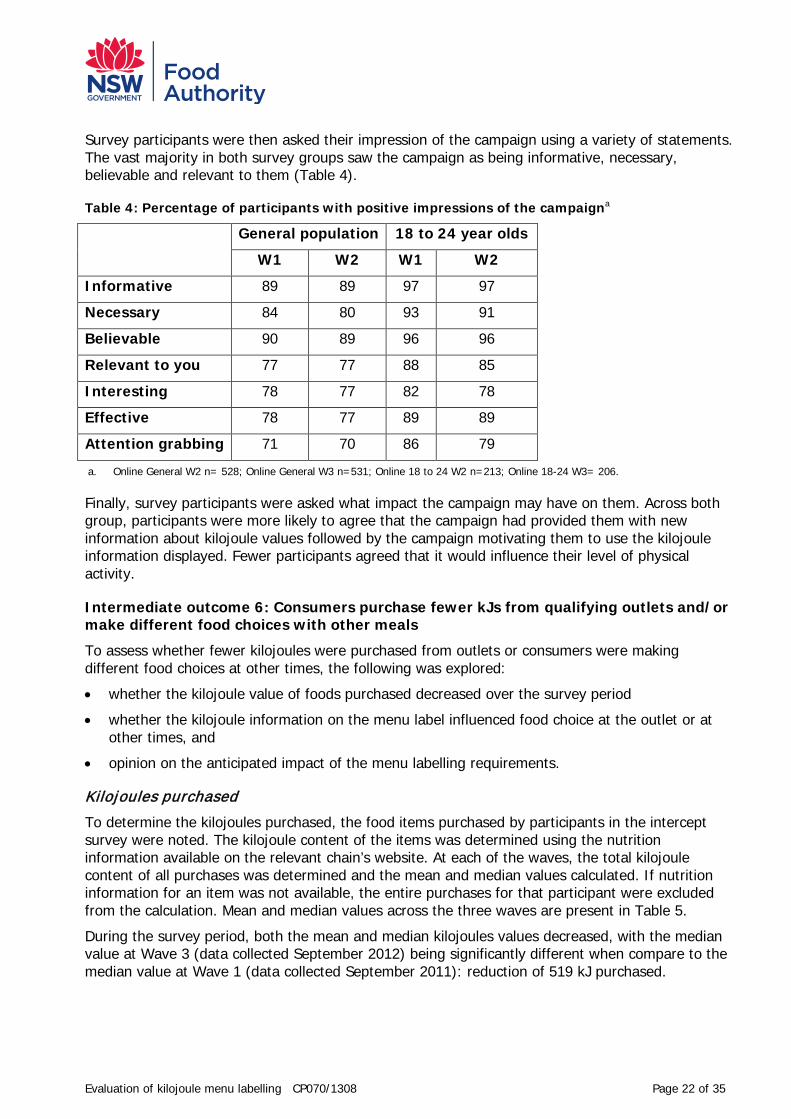
Survey participants were then asked their impression of the campaign using a variety of statements. The vast majority in both survey groups saw the campaign as being informative, necessary, believable and relevant to them (Table 4).
Table 4: Percentage of participants with positive impressions of the campaigna
General population 18 to 24 year olds
W1 W2 W1 W2
Informative 89 89 97 97
Necessary 84 80 93 91
Believable 90 89 96 96
Relevant to you 77 77 88 85
Interesting 78 77 82 78
Effective 78 77 89 89
Attention grabbing 71 70 86 79
a. Online General W2 n= 528; Online General W3 n=531; Online 18 to 24 W2 n=213; Online 18-24 W3= 206.
Finally, survey participants were asked what impact the campaign may have on them. Across both group, participants were more likely to agree that the campaign had provided them with new information about kilojoule values followed by the campaign motivating them to use the kilojoule information displayed. Fewer participants agreed that it would influence their level of physical activity.
Intermediate outcome 6: Consumers purchase fewer kJs from qualifying outlets and/or make different food choices with other meals
To assess whether fewer kilojoules were purchased from outlets or consumers were making different food choices at other times, the following was explored:
• whether the kilojoule value of foods purchased decreased over the survey period
• whether the kilojoule information on the menu label influenced food choice at the outlet or at other times, and
• opinion on the anticipated impact of the menu labelling requirements.
K ilojoules purchased
To determine the kilojoules purchased, the food items purchased by participants in the intercept survey were noted. The kilojoule content of the items was determined using the nutrition information available on the relevant chain’s website. At each of the waves, the total kilojoule content of all purchases was determined and the mean and median values calculated. If nutrition information for an item was not available, the entire purchases for that participant were excluded from the calculation. Mean and median values across the three waves are present in Table 5.
During the survey period, both the mean and median kilojoules values decreased, with the median value at Wave 3 (data collected September 2012) being significantly different when compare to the median value at Wave 1 (data collected September 2011): reduction of 519 kJ purchased.

Evaluation of kilojoule menu labelling CP070/1308 Page 23 of 35
Table 5: Mean and median values for the energy content (kJ) of foods purchaseda
W1 W2 W3
Mean 3770 3231 3196
Median 3355 3192 2836b
a. Intercept W1 n=178; Intercept W2 n=218; Intercept W3 n=202.
b. Significant difference compared to Wave 1 pre-implementation
The mean and median of other nutrients (protein, carbohydrates, sugar, fat, saturated fat and sodium) was also determined. During the survey period both the mean and median for all nutrients decreased, with a significant decrease being observed for the median value for sugar at Wave 2 and Wave 3 and the median carbohydrate value at Wave 3 (see TNS report).
K ilojoule labelling influence choice
The intercept survey also asked whether the presence of the kilojoule value on the menu labelling influenced the choice of food either:
• in the store for the actual purchase,
• consumed later in the day, and
• at subsequent visits to the outlet.
Throughout the survey period, around 40% of the participants indicated that the labelling influenced their choice of food, either at the time of purchase or into the future. For those indicating the labelling would influence their choice, the proportion of participants suggesting it will influence their food choice either later that day or in the chain in the future increased during the survey period, with a significant increase in participants suggesting labelling would influence their choice ‘a little’ later in that day.
Figure 9: Participants nominating a change in habit as a result of menu labelling
0
10
20
30
40
50
60
In store today Later today In this chain in the future
Perc
enta
ge (
%)
Intercept W1 (n=122) Intercept W2 (n=321) Intercept W3 (n=293)
Evaluation of kilojoule menu labelling CP070/1308 Page 24 of 35
Anticipated impact of menu labelling
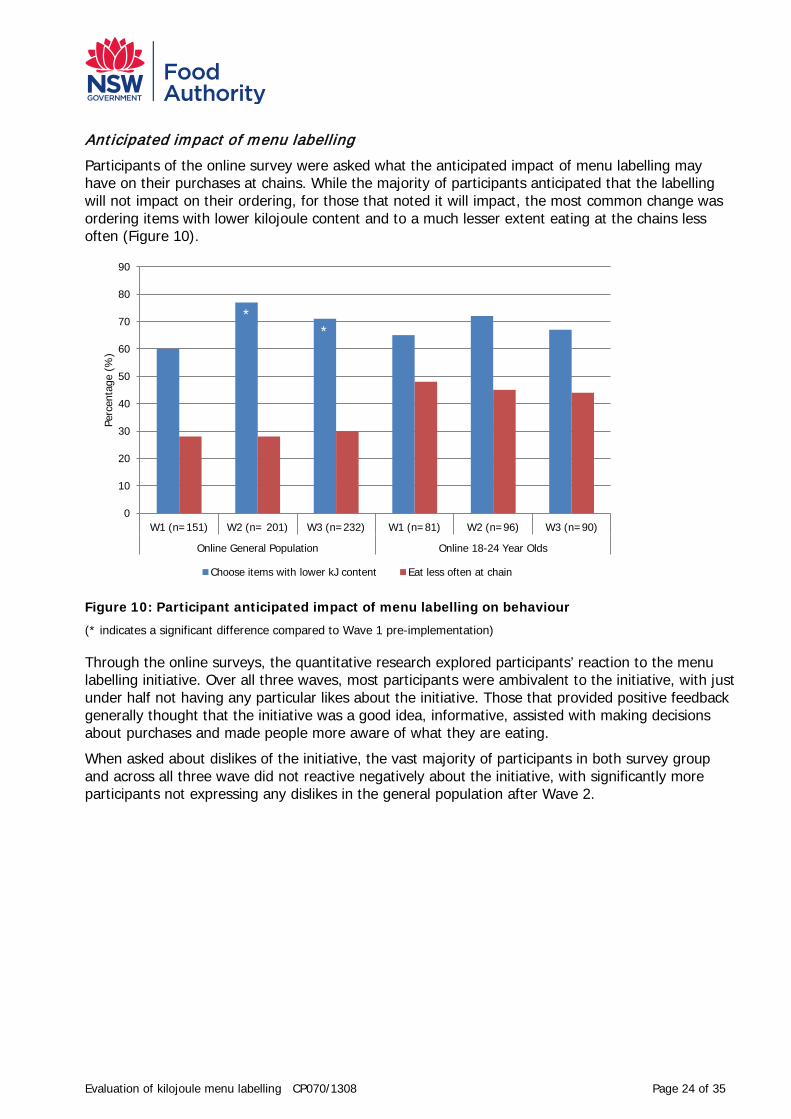
Participants of the online survey were asked what the anticipated impact of menu labelling may have on their purchases at chains. While the majority of participants anticipated that the labelling will not impact on their ordering, for those that noted it will impact, the most common change was ordering items with lower kilojoule content and to a much lesser extent eating at the chains less often (Figure 10).
Figure 10: Participant anticipated impact of menu labelling on behaviour
(* indicates a significant difference compared to Wave 1 pre-implementation)
Through the online surveys, the quantitative research explored participants’ reaction to the menu labelling initiative. Over all three waves, most participants were ambivalent to the initiative, with just under half not having any particular likes about the initiative. Those that provided positive feedback generally thought that the initiative was a good idea, informative, assisted with making decisions about purchases and made people more aware of what they are eating.
When asked about dislikes of the initiative, the vast majority of participants in both survey group and across all three wave did not reactive negatively about the initiative, with significantly more participants not expressing any dislikes in the general population after Wave 2.
0
10
20
30
40
50
60
70
80
90
W1 (n=151) W2 (n= 201) W3 (n=232) W1 (n=81) W2 (n=96) W3 (n=90)
Online General Population Online 18-24 Year Olds
Perc
enta
ge (
%)
Choose items with lower kJ content Eat less often at chain
* *

Evaluation of kilojoule menu labelling CP070/1308 Page 25 of 35
Discussion
The kilojoule menu labelling Evaluation aimed to assess whether the intermediate outcomes identified in the framework were achieved. From the data collected at this point in time, the intermediate outcomes appear to have been met. Achieving behaviour change is however, a long term process (Donovan, 2003) that is generally preceded by attitudinal change. Attitudinal change requires a series of communications, supported by legislation (COI Report 2009), and is dependant on consumers’ existing levels of knowledge, attitudes, beliefs and behaviours regarding the topic (Darnton, 2009).
Good compliance with regulatory requirements
Understanding of and compliance with the regulatory requirements were high. This was achieved by the development of an implementation model that involved a high level of consultation and assistance prior to the menu labelling being roll-out by the businesses. The implementation model also assisted with high rates of compliance post-implementation. Noncompliances were resolved quickly in consultation with head offices. Re-checks found all outlets and chains were compliant. Overall, the Authority managed the regulatory requirements, with assistance from Council Officers. Enforcement action due to noncompliance was minimal, with only one chain requiring escalation via a warning letter. The chain implemented the requirement within the nominated time and no further enforcement action was required.
Consumer campaign implemented
The campaign used digital, social and radio media, targeting high consumers of fast food. The campaign was purposely designed to engage with people and consider their own energy needs. The digital and social media elements of the campaign were well received. Access statistics indicated a good number of downloads or views. Both the general population and campaign target populations agreed that the campaign was necessary, informative and relevant.
Consumer research shows positive signs
The qualitative consumer research was undertaken to assist with assessing:
• consumers’ access to information,
• consumers’ awareness and increased understanding of energy,
• whether consumers purchase fewer kilojoules from outlets.
The design of the research acknowledges that change in consumer behaviour is a long term process. Before change can occur, consumers need access to information and in most cases need a shift in attitude. The ‘knowledge-attitude-behaviour’ (KAB model) used to design the qualitative research supports this and by assessing knowledge and attitude, the potential for future change can be assessed.
The quantitative consumer research was designed to assess both the legislation and the consumer campaign that is, the kilojoule menu labelling initiative in its entirety.
Overall, the research found that with the implementation of the kilojoule menu labelling initiative, consumers are more likely to notice nutrition information in fast food outlets with kilojoule information being the most salient nutrient information at the outlets. Understanding of energy and kilojoules remained the same throughout the survey period, although the awareness and understanding among consumers regarding the daily energy intake value (8700 kJ) significantly increased during the survey period. As increases were seen in both online and intercept surveys, it could be concluded that both the requirement for businesses to display the reference value on menu boards and the consumer campaign attributed to this increase.

Evaluation of kilojoule menu labelling CP070/1308 Page 26 of 35
While most consumers found it difficult to estimate the energy content of their purchases, the kilojoule menu labelling initiative appears to be providing consumers with information they can use, with a significant increase in people willing to estimate the energy content of their purchases across the survey period.
Early indication that consumers are making healthier choices
Results from the intercept survey, collected only eight months after consumer exposure to kilojoule values at point of purchase in these settings, show that there was a significant decrease in the median kilojoule intake (from consumer- reported purchases) of 519 kilojoules. While it is not possible to attribute the reduction in kilojoules to the intervention alone, it nevertheless provides an indication of the potential population health impact of kilojoule menu labelling when consumers make healthier choices in a fast food setting;
• On an individual level, an estimated cumulative energy deficit of 32.2MJ is required to lose 1kg of weight (Hall, 2008). Consuming 519 kJ less on 2 occasions per week would in theory result in a 1kg weight loss in 7 months.
• At a population level, we know that between 1983 and 1995 there was an increase in kilojoule intake of 350kJ per day in Australian adults living in capital cities. During this period, there was also a significant increase in the weight of Australian adults which was sufficient to push the mean and medium weight from in the ‘healthy’ range in 1983 to the ‘overweight’ range in 1995 (Commonwealth Department of Health and Aged Care, 2001).
It is encouraging that the consumer research shows overall support for the kilojoule menu labelling initiative among consumers, with the vast majority of consumers supporting its objectivity: the information assists the consumer choose, not tells the consumer what to choose.

Evaluation of kilojoule menu labelling CP070/1308 Page 27 of 35
Conclusion
The evaluation project aimed to assess the appropriateness of the kilojoule menu labelling initiative (legislation and consumer campaign), using the intermediate outcomes identified through a program logic mapping exercise. Consumer behaviour change is likely to take time but the early indicators that consumers are making healthier choices are encouraging. The evaluation outcomes reported here show that the initiative was well implemented by industry, consumers noticed the new information in outlets, there is a shift towards a better understanding of the average daily energy intake, and some reduction in kilojoules purchased was observed.
The kilojoule menu labelling initiative has significant alignment to nutrition policy and health promotion programs at local, state and national levels. The NSW Ministry of Health has responsibility for these areas and as such it is seen that some aspects of the kilojoule menu labelling initiative are better aligned within the functions of the NSW Ministry of Health.
From 1 July 2013, the NSW Ministry of Health will lead the communications and evaluation components of the kilojoule menu labelling initiative; managing existing consumer assets and developing new campaign material to realise behaviour change ie consumers make healthier food choices.
The Authority and Council Officers will continue to play a role in ensuring compliance to the requirements. Council Officers will continue to inspect for the presence of menu labelling at outlets during routine inspections. The results from the inspections will be reported annually with other food regulatory activities through the Council Activity Report. The Authority will continue to assess takeaway and online menus and will provide implementation assistance to businesses new in scope. The Authority will also respond to reports of noncompliance through the Authority’s standard complaint process.
The kilojoule menu labelling initiative was in part successful due to the high level of stakeholder engagements that occurred during the implementation. This will continue through the stakeholder reference group that includes members from government, industry and community groups. The reference group will provide a forum to discuss the ongoing activities of the initiative as well as an opportunity to discuss other food labelling initiatives as appropriate.

Evaluation of kilojoule menu labelling CP070/1308 Page 28 of 35
References
Access Economics Pty Ltd (2008). The growing cost of obesity. Report commissioned by Diabetes Australia. Retrieved 21 June 2013, from http://www.diabetesaustralia.com.au/PageFiles/7830/FULLREPORTGrowingCostOfObesity2008.pdf
Chandon, P. & Wansink, B. (2007). The biasing health halos of fast-food restaurant health claims: Lower calorie estimates and higher side-dish consumption intentions. Journal of Consumer Research, 34 (3), 301-314.
COI Report (2009). Communications and Behaviour Change. Central Office of Information, United Kingdom.
Commonwealth Department of Health and Aged Care (2001). Comparable data on food and nutrient intake and physical measurements from the 1983, 1985 and 1995 national nutrition surveys. Retrieved on 24 June 2013, from http://www.health.gov.au/internet/main/publishing.nsf/Content/6A40E29D690738DECA25725F00810008/$File/nutrient.pdf
Cowburn, L. & Stockley, K. (2005). Consumer understanding and use of nutrition labelling: a systematic review. Public Health Nutrition, 8(1), 21-28.
Darnton, A. (2008). Reference report: An overview of behaviour change models and their uses. Retrieved 21 June 2013, from http://www.civilservice.gov.uk/wp-content/uploads/2011/09/Behaviour_change_reference_report_tcm6-9697.pdf
Donovan R. & Henley, N, (2003). Social Marketing: Principles and Practices. IP Publishing, Melbourne.
FSANZ (Undated). Sodium levels in a range of packaged and takeaway foods. Retrieved 13 May 2013, from http://www.foodstandards.gov.au/scienceandeducation/publications/sodiumlevelsinarange4648.cfm
GPO (2011). Code of Federal Regulation Title 21 101.9 Nutrition labelling of food, (section (g) - compliance guide). Retrieved 13 May 2013, from http://www.gpo.gov/fdsys/pkg/CFR-2011-title21-vol2/pdf/CFR-2011-title21-vol2-chapI-subchapB.pdf (21 CFR 101.9(g) see page 38)
Hall, K.D (2008). What is the required energy deficit per unit weight loss? Int J Obes, 32(3), 573-576
NSW Government (2011) NSW2021: A Plan to make NSW Number One. Retrieved 21 June 2013, from http://www.2021.nsw.gov.au
NSW Food Authority (2008). Risk Management Programs: Evaluation Framework 2008-12. Retrieved 5 March 2013, from http://www.foodauthority.nsw.gov.au/_Documents/science/risk_management_programs_evaluation_framework_2008.pdf
NSW Food Authority (2012). Review of Fast-food Labelling Requirements (“Fast Choices”). Retrieved 5 March 2013, from http://www.parliament.nsw.gov.au/prod/la/latabdoc.nsf/0/219ba29066e39928ca257ab6001b01b0/$FILE/Section%20106R%20Review%20of%20Food%20Act%202003.pdf
NSW Health (2013). Health Statistics New South Wales, Selected Reports. Retrieved 21 June 2013, from http://www.healthstats.nsw.gov.au/indicator/beh_bmi_age

Evaluation of kilojoule menu labelling CP070/1308 Page 29 of 35
NSW Ministry of Health (2010). NSW Schools Physical Activity and Nutrition Survey (SPANS) NSW Centre for Epidemiology and Evidence. Retrieved 24 June 2013, from http://www0.health.nsw.gov.au/pubs/2011/spans_2010_summary.html
TNS Social Research (2013). Fast Choices: An evaluation of energy purchased and consumer information.
Watson, W.L. et al. (2013). How well do shoppers understand energy terms on food labels? Public Health Nutr, 16(3), 409-417.
Evaluation of kilojoule menu labelling CP070/1308 Page 30 of 35
Appendix 1
Determining the average energy content of Standard Menu Items
Clause 16S (3) and (4) of the Food Regulation (2010) requires the average energy content be calculated in accordance with Standard 1.2.8 of the Australia New Zealand Food Standards Code, and adjust based on the whole standard food item.
Calculating the average energy content requires first determining the amounts of various food components in that food that contributes to the energy content of the food. These components are listed in Standard 1.2.8 of the Australia New Zealand Food Standards Code and include carbohydrates, fats, proteins and alcohol among others. In calculating the average quantity of these food component Standard 1.1.1 of the Australia New Zealand Food Standards Code permits determining the quantities by:
• the manufacturer’s analysis of the food,
• calculating from the actual or average quantity of nutrients used, or
• calculating from generally acceptable data.
Once the average quantity of the food components is calculated, the average energy content is determined by multiplying the average amount of each food component per 100 grams of the food by the energy factor for that food component and then adding them together. Standard 1.2.8 lists the energy factors for each of the food component.
This method will result in some variation depending on the method chosen to calculate the average quantity of the different food component. In addition, variation in the nutrient profile of the food item can be expected due to seasonal variation of ingredients, age of ingredient when used and amount of ingredient added to food item.

Evaluation of kilojoule menu labelling CP070/1308 Page 31 of 35
Appendix 2
List of chains provided with implementation assistance
The following lists fast food chains were provided with one-on-one implementation assistance by the Authority:
Ali Baba La Porchetta
Baker’s Delight Michel’s Patisserie
Baskin and Robbins Muffin Break
Boost Juice Nando’s
Breadtop New Zealand Natural
Brumby’s Noodle Box
Chatime, Oporto
Cold Rock Ice Creamery Pie Face
Crust Gourmet Pizza Bar Pizza Capers
Dominos Pizza Hut
Donut King Red Lea Chickens
Eagle Boys Red Rooster
Easy Way Tea Subway
Gloria Jeans Sumo Salad
Grilld The Cheesecake Shop
Hudson Coffee The Coffee Club
Hungry Jack’s Wild Bean Café
Jamaica Blue Wendy’s
KFC Zarraffa’s
McDonalds

Evaluation of kilojoule menu labelling CP070/1308 Page 32 of 35
Appendix 3
Education campaign examples
Website

Evaluation of kilojoule menu labelling CP070/1308 Page 33 of 35
Facebook page

Evaluation of kilojoule menu labelling CP070/1308 Page 34 of 35
Twitter stream
Mobile smartphone app

Evaluation of kilojoule menu labelling CP070/1308 Page 35 of 35
Selected online advertising
Food court illuminated display advertising – example

NSW Food Authority 6 Avenue of the AmericasNewington NSW 2127PO Box 6682 Silverwater NSW 1811Phone 1300 552 406Fax 02 9647 0026www.foodauthority.nsw.gov.au