evaluation of commercially-a vailable catch basin … ofbench-testing unit and bench testing....
TRANSCRIPT

Evaluation of Commercially-A vailable Catch Basin Inserts for
the Treatment of Stormwater Runoff from Developed Sites
October 1995
King County Transportation &Natural Resources Library
821 Second Avenue, r,,~.s. 90
Seattle, WA 98104-1-598
King County Surface Water Management DivisionKing County Department ofMetropolitan Services
Snohomish County Surface Water Management DivisionSeattle Drainage and Wastewater Utility
Port of Seattle

ACKNOWLEDGMENTS
The tBIC wishes to express appreciation to the manufacturers of the inserts used in this test:
Enviro-Drain, Inc.: James HutterAqua-Net;, Inc.: Paul GeisertStonnwater Services: John Mcpherson, Brian O'Neil
THE CATCH BASIN INSERT COMMl1TEE
King County Surface Water Management: John Koon (Chair)King County Metropolitan Services: Cathy Kennedy, Rodney Pond, George EdwardsSnohomish County Surface Water Management: Bill LeifSeattle Drainage and Wastewater Utility: Jennie Goldberg, Bronwyn BuntinePort of Seattle, Gary Minton (consultant representing the Port).
Primary responsibility of each committee member:
John Koon:
Cathy Kennedy:Rodney Pond:George Edwards :Bill Leif:Jennie Goldberg:Bronwyn Buntine:Gary Minton:
Chair, project approach, bench-test procedures, final report preparation.
Assembly ofbench-testing unit and bench testing.
Bench-testing, record keeping.
Project approach.Project approach, data interpretation.
Analytical techniques, laboratory liaison.Report review .
Project approach, senior writer .
ADDmONAL SUPPORT PROVIDED BY:
Bob Campbell, Snohornish County Dept. of Public Works:Roxanne Thomas, Seattle Drainage and Wastewater Utility:Laura Mithoug, Seattle Drainage and Wastewater Utility:Michael Leavy , King County Dq)t. of Metropolitan Services:Tom Georgianna, King County Dept. ofMetropolitan Services:Nian She, Seattle Drainage and Wastewater Utility:Helene Bourge, King County Surface Water Management:Chris Woelfel, Seattle Drainage and Wastewater Utility:Pat Ross, King County Surface Vvater Management:
Maintenance Input
Maintenance Input
Maintenance Input
Maintenance InputStatistics -
Statistics
Graphics
GraphicsWord Processing
DIRECT INQUIRES TO:
Gary Minton P .E., PhDResource Planning Associates311 W. McGrawSeattle WA 98119(206) 282-1681
Bill Leu p .E.Water Quality EngineerSnohomish County S .W .M.2930 Wetrnore Ave. Suite 101Everett, WA 98201-4044(206) 388-3464 x-4566
2

Executive Summary
Growing concern over the impact of pollutants that are washed from paved areas in theurban environment has prompted regulatory agencies to examine new methods ofstormwater treatment. Similarly, the private sector has recognized the need to developnew products and services that will help businesses and municipalities reduce theircontribution to water pollution problems and meet environmental regulations. Amongthese products are devices designed to fit beneath storm drain inlets and removepollutants from stormwater runoff These devices are commonly referred to as II catch
basin inserts ".
Three /oca/ vendors have deve/oped catch basin inserts and are current/y marketing theirproducts. These inserts range in cost.from $100 to $1,500, may be con.figuredwith, orwithout oil absorbing media, and come in both standard and custom-.fit mode/s. Whileservicing the inserts is simp/e and requires no litt/e or no special equipment, mostmanufactures are deve/oping service programs for their customers.
Inspired by the simplicity and relatively low cost of these product, but uncertain aboutthe performance and maintenance requirements of the products, staff representing fivelocal agencies examined the use of catch basin inserts for the treatment of runoff .fromdeveloped sites. The study focused on the ability of the inserts to remove pollutants, thehydraulic characteristics of the inserts, and estimation of maintenance needs. The intentof the study was to provide the participating agencies and their customers theinformation needed to make sound decisions concerning the use of catch basin inserts.Since catch basin insert technology is rapidly changing, the study focuses more on thetechnology in general, than on the performance of specific products.
The inserts studied were nominally effective at removingfine (silt and clay) sediment andassociated pollutants. Since coarse particles are generally removed by the catch basinsumps used in most conventional system, the study team did not examine the removal ofthese materials (fine sand and larger). The team did however, observe that the insertwere able to capture coarse material and debris, and recommends that inserts be usedwhere the objective is to remove these materials. Specific situations in which coarsesediment and debris removal is desirable include construction sites, materials yards,upstream of oillwater separators and sand filters, and wherever the aesthetic character ofa receiving water is a concern. Maintenance of inserts configured for sediment anddebris removal will vary dramatically and will depend upon the nature of the site and use
of source control best management practices {BMPs).
The insert varied in their ability to remove petroleum products. Removal ratesfor insertsin good condition rangedfrom 20 t9 90 percent when exposed to oil concentrations thatwere near the high end for urban runoff F or most products, performance dropped offrapidly with use. Using a target efficiency of 50 percent, and an effluent objective of 10
i

mg/L, the maintenance interval for these products ranged from after nearly every rainfallevent (1/2 to 3/4 inch ofrain) to after five or more inches ofrain, (or about six weeks).
Efforts to determine the effectiveness of the inserts at removing phosphorus and dissolvedmetals were limited; however, the data-collected did not indicate the inserts were able toremove these pollutants any more effectively than they removed sediment.
King County has used the results of this study in the development of Surface WaterDesign Manual and Water Pollution Prevention Manual. In the Surface Water DesignManual, catch basin inserts have been approvedfor oil control in high traffic areas. TheWater Pollution Prevention Manual targets existing businesses and provides generalguidance concerning the selection and use of catch ba.s'in inserts.
While catch basin inserts have limited applicability for stormwater treatment, and shouldnot be used in place of source control BMPs, they could be a valuable part of anorganization 's pollution prevention plan. The development of new filter media, andimproved structural designs, mQy increase the range of conditions in which theseproducts are use. The greatest difficulties facing those developing catch basin inserts foritormwater treatment lay in the small physical space inside the catch basins, the tendencyfor sediment to clog or blindfilter media, and the fluctuating nature of the flow. Agenciesand organizations involved in the protection of water resources should continue tofollow , and were appropriate, support the development of these products.
II
Evaluation of Commercially-A vailable Catch Basin Inserts
for the Treatment of
Stormwater Runoff from Developed Sites
Table of Contents
EXECUTIVE SUMMARY i
CHAPTERI-INTRODUCTION 1
112335
1.1 PURPOSE OF THE PROJECT1.2 QUESTIONS ADDRESSED BY THE STUDY1.3 STUDY APPROACH AND REPORT ORGANIZATION1.4 VENDOR INVOL VEMENT1.5 INTRODUCTION TO CATCH BASIN INSERTS1.6 INSERTS TESTED
CHAPTER 2- POLLUTANT REMOVAL STUDIES 9
2.1 METHODS2.2 RESUL TS AND DISCUSSION
915
CHAPTER 3- HYDRAULIC CHARACTERISTICS 33
3.1 METHODS3.2 RESUL TS AND DISCUSSION
33
34
CHAPTER 4 -MAINTENANCE 37
3738383941
4.1 INSTALLATION AND HANDLING4.2 POLLUTANT REMOV AL (pERFORMANCE)4.3 MAINTENANCE FREQUENCY AND SCHEDULING4.5 DISpOSAL OF SEDIMENT AND SPENT MEDIA4.6 OTHER OBSERV A TIONS BY MAINTENANCE PERSONNEL
CHAPTER s -INSERT SELECTION AND USE 43
5.1 RECOMMENDATIONS ON APPROPRIATE USES OF INSERTS5.2 MA TCmN G SITE CHARA CTERISTI CS TO INSERT CAP ABILITIES5.3 INSERT DESIGN FEATURES5.4 V ALIDA TION TESnNG
43464850
CHAPTER 6 -FURTHER EVALUATION 53
REFERENCES 55
APPENDIXES 56
APPENDIX A: DESIGN FLOws FOR PERFORMANCE TESTS
APPENDIX B: W ATER QUAUTY DATA FROM BENCH TESTS
APPENDIX C: COMPANION Snmy BY THE PORT OF SEAtTLE
APPENDIX D: VENDORS' COMMENTS AND CuRRENT PRODUCT INFoRMAnoN
APPENDIX E: KING COUNTY SURFACE WATER DESIGN MANUAL EXCERPTS
ii

LIST OF TABLES
I.
2.
3.
4.
5.
6.
7.
8.
9.
8
12
17
34
35
36
41
47
Appendix B
Configurations Used in TestsConfigurations Used at Field SitesAccumulation of Sediments at Field SitesTreatment Capacity of Inserts in New ConditionsTreatment Capacity of Inserts After Field UseHydraulic Capacity ofHigh-Flow OutletsAnalysis of Captured MaterialFlow Estimates 1/4 acre DrainagesAnalytical Methods and Detection Limits
LIST OF FIGURES
4
6
10
16
19
22
24
28
29
30
32
1. Typical F eatures of a Catch B~in Insert2. Basic Catch Basin Insert Configurations used on the Study2. -Bench-Test Facility4. TSS Results5. Particle Size Distributions of Sediment Captured by the Inserts6. Oil and Grease Removal Performance -First Test Sequence7. Oil and Grease Removal Performance- Second Test Sequence8. Total Copper Results9. Total Lead Results
10. Total Zinc Results11. Total Phosphorus Results

CHAPTER 1 -INTRODUCTION
1.1 PURPOSE OF THE PROJECT
The emergence of commercially available devices designed to treat stormwater at catch basininlets may provide an economical means of stormwater treatment. The rapid increase in thenumber of these devices ( commonly referred to as catch basin inserts) has raised both hope andconcern of stormwater managers in the Puget Sound basin. The proper application of thistechnology may enhance the community's ability to protect its water resources; however, thelimited availability of independently derived information on the performance and maintenanceneeds of these products raises concern that they may be inappropriately used to the exclusion ofother, more effective pollution control measures.
To better understand the uses.and limitations of locally manufactured catch basin inserts, theCatch Basin Insert Committee (CBIC:) was formed. The CBIC is comprised of representativesfrom the King County Surface Water Management Division, King County Department ofMetropolitan Services, City of Seattle Drainage and Wastewater Utility, Snohomish CountySurface Water Management, and the Port of Seattle. The CBIC member jurisdictions pooledresources to evaluate several commercially-available inserts that could be used to removecontaminants from urban runoff. This report presents the findings of this project as well as thoseofa related study conducted concurrently by the Port of Seattle.
The purpose of this report is to provide general information on the state of catch basin inserttechnology in general, rather than to evaluate and compare specific products. Where differences inproducts are evident, comparisons are' drawn only to identif}r characteristics which may affect theperfonnance of inserts rather than to promote one product over another. Indeed, catch basininsert technology is changing so rapidly that the products available may well have been modifiedor replaced since this report was prepared. It is hoped the reader will use the general infonnationand observations provided in this report to improve their understanding of the benefits,limitations, and mechanisms associated with catch basin inserts and make wise decisionsconcerning their development, use, and regulation.
1.2 QUESTIONS ADDRESSED BY THE STUDY
The issues addressed by the study focus on three major areas: pollutant removal, hydrauliccapacity, and maintenance. Specific questions associated with each of these areas ofinquiryfollow.

1.2A Pollutant Removal Questions
1
2
3.
Do the inserts remove pollutants from runoff from developed sites?Does an insert provide improved performance over the catch basin sump?Are inserts similar in performance to currently accepted treatment best management practices(BlvIPs) such as wet ponds, grass swales, and constructed wetlands in new developments?Are inserts suitable as retrofit treatment devices in existing developments?4
1.2B Hydraulic Performance Questions
I.
2.
3.
What is the maximum treatment capacity of the inserts?What is the maximum overflow capacity of the inserts?Will the inserts contribute to local flooding around drain inlets?
1.2C Maintenance Questions
I. How often must units pe serviced?2. What are the physical requirements associated with maintenance?3. What is the acceptable disposal method of spent media and accumulated sediment?
1.3 STUDY APPROACH AND REPORT ORGANIZATION
The project was divided into three major tasks. Each task was related to an area of inquirydescribed above. These tasks were:I. Evaluation of pollutant removal performance.2. Evaluation of hydraulic performance.3. Determination of maintenance requirements.
Tasks 1 and 2 were accomplished through a combination of bench testing and field observations.To the extent possible, these tasks were carried out in an empirical manner and were intended toprovide quantifiable results. The experiments used to address Tasks 1 and 2 are described in
Chapters 2 and 3.
Task 3 was addressed by reconciling concerns raised by maitrtenance staffwith field observations
and the empirical results obtained through Tasks 1 and 2. Maintenance concerns and information
related to maintenance issues are presented in Chapter 4.
Additional analytical data were obtained to characterize the spent filter media and trappedsediments. These data supported both the pollutant-removal and maintenance portions of the
study.
?

Chapter 5 provides the reader with recommendations concerning the selection and use of catchbasin inserts by describing the potential uses and limitation of catch basin inserts, as well asdesirable and undesirable design characteristics. This chapter represents the study team's opinions-regarding the state of catch basin insert technology .
Chapter 6 addresses catch basin inserts from the perspective of the regulator and suggests optionsfor performance criteria.
1.4 VENDOR INVOL VEMENT
To the extent possible, manufacturers of the inserts were involved in the study. Early in the study,the vendors were asked to fill out a questionnaire which provided the study team with basicinformation concerning the appropriate use and maintenance of catch basin inserts. In addition,the vendors were asked to provide any existing data on their products. This information was usedin-the development of the experimental design.
Before the inserts were tested, each manufacturer was provided with a draft of the qualityassurance plan and asked to recommend changes to be certain their products would be fairlytested. In response to these recommendations several changes were made in the experimental
design.
During the course of the study, manufacturer involvement was limited because of a legal conflictbetween two of the vendors. Specifically, vendors were not allowed to visit the unsecured fieldlocations.
Once an initial set of pollutant-removal tests was completed, the manufacturers were providedwith analytical results, and were invited to submit alternative configurations of their products for asecond series of tests. Two of the three vendors opted to submit alternative configurations.
Once the draft report was completed, manufacturers were given a copy of the document and wereasked to submit comments. Several recommendations from the 'vendors were incorporated in thisfInal report. Manufacturers' comments on the fInal draft report life included in Append~ D.
1.5 INTRODUCTION TO CATCH BASIN INSERTS
At the beginning of the study, the CHIC was familiar only with I~roducts designed to hang from adrain-inlet frame. Since that time, several other products have been developed that are installedwell below the drain inlet, taking advantage of the space available in the lower portions of thecatch basin or sump. While these products may rightly be called "catch basin inserts," in thisreport this tenn is used only to describe the products tested, all of which are installed immediatelybeneath the inlet grate.
3

Before introducing the inserts used in the study, it is useful to understand cornrnon features ofcatch basin inserts. A few of these features are listed below, and are shown in the generalizedcatch basin insert shown in Figure 1. Design features to keep in mind as you read this reportinclude:.A structure which contains the treatment system.
.A means of suspending this structure from the drain-inlet frame.
.One or more treatment mechanisms which include sedimentation, absorption, filtration, orgravitational separation of oil and water.
.A primary outlet for water which has been treated.
.A secondary- or high-flow outlet, through which water which exceeds the treatment capacityof the system may escape.
It should be noted that while all of the inserts allow stonnwater to exit the system via an overflowwhen the flow rate exceeds the hydraulic capacity of the treatment area, none of.the units have atrue bypass which allows excess water to exit without contacting the treatment area. The
significance of this observation will be discussed in later chapters.
Inlet Grate
Figure I. Typical Features of a Catch Basin Insert
.1

1.6 INSERTS TESTED
Testing in the fall of 1993 was limited to locally manufactured inserts of vendors known to the-CHIC. At that time the CHIC requested the participation of three vendors: Stonnwater Services,Aqua-Net, and Enviro-Drain. Drawings of the basic configuration of each product tested areshown in Figure 2. More detailed descriptions of the specific configurations used during variousstages of the pollutant-removal and hydraulic-perfonnance experiments are provided in Table 1.
~

~
f")~
=';;;=;--.=..,
...~
-~~ ;:
'C::;o.~
~~-=
...~QJ,",
.:~"' ~c:..,~.~~~
=..,=~
~~
-~
~~.~
=.-= ="
C";:.
<~
'"'"""". ". ". ". ,. ,. ,
§!
'"0"0"0"""0"""
~ ::
-0-
~~0-
~~1,...'QJO
.c-~~= :::
~'?>,~
=~=-
C~-~~ ~C -
"'.0-
= ;.
="'~
<t;)
...c,)c..
-fIJc,)(.I
>I..c,)
00I.. ::~O~.~~~e"'I..::;.
~C

rI1~=z-.-="tQ
.N~~.-r.c
~~E--
~
.~c:
-~~
~I-.
00U
~
fIJ O
"4).E~
-
-fIJ fIJ
I .-
fIJ-fIJ
~~
-
-a-.-~td
O
"tn C
~
td .
c: e
-~
.t:
~
C.".Q
.fIJO
td
~~
.c"O
..c:~tdE
--fIJe
.~
-~
e~
~
~
~"O
I-.fIJ
O
.~tdl-.~
.CQ
.~I-.
I ~
~>
--c:.C
c.".C
:"OO
.-°c: °
t:td~
td~
Q
.-tdl-.
.-~~
e Q
.
"OO
Q.
~~
~--~
~
~"0~
-td-~
eC
.".
~
O
fIJ -fIJ
tdc:~.C
td"OI-.
.c .-
~
I-. fIJ
-O
~~
fIJ~O
~
~c:~
fIJ-bO~
...~
e~O
~
.~
.EI-.
~
-
.~
"O.~
~c.".
~~
tE:=~
~
-~
I-.
O~
~O
~
O
~fIJ~
-c:.!.~
O-
"0 .2
.bOO
O:C
~::
~
c=-]
~
td ~
~
fIJ ...
fIJ c:
td !Il
.5 U
c: td
=O
fIJ~
u
~r..
-~\..I~
-~
c.".
~flJO
Z
tde
I .c
tdl-.O~
~
~
E
°<
.-.c
-td
ti1 c=
.ti1
~
~~
~"'
"2~~
.a ~
tQ
+-'
'"'.0 .
ti1 +
-'
~"0~
~
.c:.£-s~+
-' .-C
o.. tQ
~00.0
c= U
Ot11e~
.~
.-0 -S
~--aP
'Co..
>
.C
0 0
ti1~.0t:
:E~
~tQ
+-'e-S
Q,
C=
bi)c=~
~
c=
.-Q,
~
.-"0 Q
,
>-e~
:3oot:~
.ot11~tQ
.0t11.c:tQ
c=
+
-'"0
I .-.c:
~:=
ti1b1).0
0 .-:3
.C
+-'
0
U.C
:c=~
ti1 .~
tQ
~
~~
.0+-,
"0 ~
ti1
-0.-
~
"" ti1
~~
.£.0~]tE
tQ~
~~
-S~
~
~
.~
~=
bi)~
~
c5c==
~~
O
~bi)
~~
<
~
":f
.c: U
.
+-'
tQ
ti1C
o.. ~
ti1 ~
o~
"0ti1
c=
.~tQ
0
.g .0
.S
"0
~.C
:05~
ti1~
-
>
~
~c=
e
"OetQ
o~
~
~
P'
9 .~
U
0
tQ~
:3.0>
"0"0~"O
Ce.c:
tQoQ
,+-'
~
~
~
.5
ot11>"C
etQ]td
-.C:tQ
-e +-'
~
0..~
.c:
ti1
~~
+-'.Q
O"O
.C:tQ
8 8
.~
.!-tQ
~+
-'-
"i)Q,f1.c:
"O~
-ct;bi)0
~
.:3
~5'S
0
~~
~.E
~.O
tl1+-'
~
tQ
ti1.c:
~
.0 .-
~.c:~
'S~'$-:g
-~O
o-ti1
c5~]ra
'S~
~e
z E
~
.c
I .-E
Q
,tQ
-.-~
:3~~
.c:<
~-S
f804-.0
EC
)~~
~
.
-eE--c
o .~
CI)
CI)
~.D
t:o~
0
CI)
t: .,p
.D~
.-~-0
~t:t:
.~
0 ~
~U
~-0
C)
.~C
) .~
~
-CI)
-u-o~
~.£
C)
.--
.Du~
C)
>-O
.CI)
~C
I)~E
- ~
C)
-C
I) C
)
~E
o~
0
~
C)--o
~-ot:
E--C
)oO
l)u
.t: C
)C
I) ~
C
I)
E~
C)
ou.r:~
C)-
o.D-o
.D~
t:.r:~
~
:;Ed'
~C
I)O~
t:
.-
-oC)1U
t:C)~
~
t) ~
Cl)C
I)~C
)C)t:
."E~
oC
l)E--u
-0 .-t: -C
)c
O
C)
OC
I) ~
.r: U
I
-CI)t:
.-C)
:>0l)C
)?
t: ~
~
.-U
U.r:C
I)~
U
~
C)
~
t:~
U
.-
CI)
I ~
CI)~
~
.C
.v~
'"'~
C)C
)O.
C)-oO
.E~
--C
I)C)
O~
-S-.?;0-.r:0.
0. .~
-'
~E
~C
)c...
.-C)
oCl)-o-
C)
CI)
E-o-C
I) C
)-
C)
CI)
~
CI)
C)
CI)...C
I)c~
~
t:
.-C
I) O
.-~>
--d'=
C
I)O
~
C
)..'"'
U
~t:
~.-~
0.
~~
>-C
I)~
U
-c
O-ornC
)I
C)
.-t:O
-
SO
~
~
.>
.~
.B
g.t:-rn~
rT'
U
>-
O-~
rnU
-U
>-
4)4) .t:
ES
~
Q)<
-.~
U4)
.-V
J~o~
0.
~~~.5!.
0 U
=
~~
4)
4) ~
e
VJ
O~
c.b~
4)
0 N
VJ
.-VJ
-5~:s
~
~]
C
~VJ
4) ~
~
C~
.-~
bO4)
C~
.--~
0
~
e~
4)
4) ~
~
VJ
4) ~
u ~
4)
~~
rn~"U
~>
.c~
~
.-c
bO~
~
c c
:.2 .0
~
u u
U04)bO
-VJ
...,4)
~4)~
-"C
c
.-0.-0
0:>
VJ4)
~4)V
JbO=
'«O
~4)~
.o4)
u 0
VJ
VJ
.-
<~
.a..>
- ~
-~
-4)
4)c=
~8.~
VJo.o
4)='-
uQ)--a:
.~
~~
~
Q)
eQ
)~
~ 0
g.
4)c.b~~
:>
~
~b~
t:~~
oQ)rn>
c...~
00
-~
>-
-0-:3ro
{'JE
Q
J{'J.cQ
J .c0()
c.c
.t:
0():3:3"0
e"0.c
QJ
:3{'J
c
QJ
O()C
I.. 0
ro ~
.c .-
U"0
{'J.-{'J"0
;
~-
ro Q
J
E"0
.t: 0
~
E.{'J
~:E
QJ~
.0I.. .
0 ~
{'J U
.0 .>
ro Q
J~
"0
U~
> c.c o
0
I.. c.
~o0
QJ
C..c
ro I..
.c roQ
J
.~
C{'J-0.-
.£""Q)
--~
='
~
0
~
~{'J
ro
U-o
.t: C
.0 0
~
~I..
{'J
~<
~
.
<~
ro..{'J
~
QJ
~.cQJ c
~
0
{'J E
QJ
0u C;
o
QJ.O
00 Q
J
~I.. Q
J I..
~
ro~
9
E
~0-
0oo.c
-Q
J
Q)
';::30C~
.e
8.c:
.>O
..Q)
Q)"0
..c Q
)c
~~
..c o
bOO
..C
0
Q)
Q)
.C..c
Q)
u ~
C
~Q
) Q
)~
C
~"0
.-Q)
"0"0Q
) .>
-a.e.u
0..C
-
0..';)Q
) ~
..c .-
..c~.-:3~
o
~C
o ~
~"0
-CQ)
0
~~
~
~
~<
Q)
.
.~
~Q
) ~
~
Q)
~..c
Q) ~
~
o
~i
0 :3
~
0Q
) Q
).C
.c"0
CQ
) 0
U~~o..~Q
) U
"" 0
t) 0..
:3 ~
"O..c
0 bO
~
:3
0..0
:E.E
~
~
"E
:3~
e
6 C
e ~
~.c
~
~~~
..c
C'

.~~~Q
J
~=.-"0QJ
~~~=Q.-~=~=bLC=QU
.~Q
J-.c=~
=~V}
~V}
<~zo-~~~c-~zot.)e-=~~V}
~V}
~~
~0=z~ ri;,Z00Z
-
o~~~
~~
t.)~rl)Z~
o=
u
ra1=Ou ~
I-u<~I
~I
~p~'~= ~u~0~~0.
If"''Z~~
<f"'~
~<
~ I~
c
<z~~
0==
~tI)
~E
~0
=
~~
00~V
J ~
<~
~~
Z~
~V
J~~
°~ ~uz~~z
~o
01~'11
~t-I
Zo
~~
0~~
u~§.< ~~~~'+
-cuC~
;s;
~~
m ~~ ~~ "'~:..
~u
zz.I
~
~!
0'
«
I~i~10! ='rl
~ f'il1
~
~~
~
"'~
-5.~11~1,01"2
I'~~
~~
I~< -:5.~
I
]j~~-e
!-$ ~"8
8~
=
; rn,
~~ "'~ (/)0;>:.-,
="B'?e"~=~ ~
~--~
~
.r:. .r:.
"' "'
~
~
~
~~
~~
~~
~
~
; ;
oo
e o
~,u
4) u ~
r/)I
O'~ "'~ rl>-
=.e'iIe.~=[1]
<I~ "'~ "'~ "'~
1<I~=.a~e.~=U] >-
~0,~"0d' !
~~~
~~
~-5
c .~
u "'~ "'~
=.~'?e.~1=,!I:I
"000I~~u~"0~}J;u
1£ ~
~~
u<f/)I&1=.aq,
e
!.~!~ 10...
01,.,.
,~
0
.§' ~
=
'
==
2
~
o 5
c~
:::
I/)]-g
~
~~
!3 ~
.:3
o~u
u ~
"'~
~f/)I
OUJ=.~~e.~=w "';>-,
I~
i
!C~~~
~~=.d
8"i
'-I~>-
'!tn~"'~ "'~
I ~,-'is-~ >
<'
"§ .8'>
<.d
0 u
~
500 =
-"-u
~:§
~~
-I
t/J~
...u-~
8E
"E
.9 u
(-'1(-'1
~ ~;>-,
~
"' -
'BQ
..E
-!
=
.o
1-:5 -:5
! .~
u .i
~
=
"'~
~~
Q
c~
'6
.~..~-.i~
~
f..."0f... ~
0~fI)(1)
2.~
8e 'Es
u0000
"'~>-
~~
I~~...G)
-~
"'~
8
~
.~-G
)cncn
~> ~
I~~
...u-~
8E
"E
9 u
rnrn
"'~
~~8§E.g8....cu1E....scu-S.s
.'B~
~
u =
-~~.§
:E
u~
-s.s
e-c.§
.t=
rnfoI ...
Z
~<
~~'B
u~~
~i-:
N

CHAPTER2-POLLUTANTREMOVALSTUDIES
2.1 METHODS
The perfonnance of selected inserts was detennined in a laboratory setting using a bench-testfacility that allowed captured stonnwater to be sampled before and after passing through eachinsert. This bench testing was perfonned when the inserts were new, and later, after the insertshad been installed in the field. The weight and character of the material captured in the insertswhile they were in the field was also used to understand the perfonnance of the inserts. Aconcurrent study conducted by the Port of Seattle contributed to the study team' s understandingof how well catch basin inserts remove pollutants. The procedures used during each of thesestudies are presented in the following sections.
2.1A Bench Testing
Pollutant-removal data were bbtained by running stormwater through the inserts at a constant rateand analyzing samples collected both before and after the test water passed through the inserts.The test water used for the bench testing came from a stormwater vault which served anemployee parking lot and commercial storage area. Particle size distribution data from samples ofthe test water indicated that virtually all of the solids in the test water were in the form of particlesless than 50 microns in diameter. Particles of this size are generally classified as medium silt andclay. Oil and grease concentrations in the test water were near the detection limit of 5 mg/L.
Although the study team was unable to find urban runoff data which confirmed that the sizedistribution of the material used in the test was truly representative of stormwater which typicallyenters a stormwater treatment facility, it is assumed that the test water is typical of stormwaterwhich has been "treated" by a drainage system with sumps below each drain inlet.
Prior to each bench-test session, the water in the vault was circulated for at least 1 hour to re-suspend sediment on the bottom of the vault. The test water was then transferred from the vaultto a 460-gallon tank and transported by forklift to the bench-test facility. As soon as the tank wasin place, a mixer was turned on to keep the particulate material in suspension. This rnix~r waskept in operation throughout the entire bench-test session. Figure 3 shows the principlecomponents of the bench test facility with the mixing tank in place.
Once the mixing tank was in place, an insert was placed in the bench-test apparatus and the testwater was adjusted to a rate of six gallons per minute. (This flow was judged to be reasonablyrepresentative of the average field conditions, being the average flow rate of the 6-month 24-hourstorm event from a drainage catchment of 0.25 acres located in the Seattle area. See Appendix Afor design flow calculations. ) Before sampling, the water was run for three minutes to establish astate of equilibrium between the inflow and outflow.
9

Figure 3. Bench Test Facility. Prior to testing, stormwater was transferred from a wet vault to the mixing tank.The test water was pumped from the tank, through a flow meter and H-flume, to the catch basin insert via aTeflon-lined approach. A mixture of 50 percent used motor oil, and 50 percent diesel was added at the upper H-flume. Samples were collected below the upper H-flume and below the lower Teflon-lined collector.
Flow Meter
Inflow Sample Point \H-Flume
\Teflon-Lined APproach",
Tank
L~]
Since oil and grease concentrations were to close to the laboratory detection limit of 5 mg/l toallow meaningful analysis of insert performance, a mixture of 50 percent used motor oil and 50percent diesel was introduced to the test water to achieve a concentration of five to ten times thedetection limit. The mixture was introduced at the inlet flume by dripping it from a glass buretteonto a piece of polypropylene material previously saturated with the mixture. This procedure wasused in an attempt to introduce the mixture as a sheen rather than as droplets. As a result, oil andgrease concentrations in the test water were at the high end of what the inserts would typicallyexperience in the field.
After the three-minute "wann-up" period, influent and effiuent samples were obtained over a twoto three minute period. Between one and five inflow and outflow replicate samples were collectedduring each bench-test session. Note in Figure 3 that because the effiuent sample is taken belowthe outlet of the insert, any effect of stormwater bypassing the treatment area is reflected in theeffiuent sample.
Samples were analyzed for: total suspended solids, turbidity, total phosphorus, oil and grease;total recoverable copper, lead, and zinc; and dissolved zinc. Zinc was the only parameterevaluated for its dissolved fraction since it was anticipated that it would be the only metal presentat a concentration high enough to allow meaningful analyses.
10
The samples were immediately put on ice after collection and were delivered to the analyticallaboratory at the end of each day ofbench testing. Turbidity values were obtained during eachbench test using a portable turbidity meter .
2.1B Field Conditioning and Follow-up Bench Tests
After the initial bench tests, during which the filters were in new condition, the inserts were placedin catch basins in the field where they were subjected to real-life conditions. The inserts weretested two or three times throughout each of two test sequences. A test sequence was defined as aset of alternating bench-test sessions and field-conditioning periods that extended from when theinserts were new to when they were no longer functional.
At the beginning of the study, the expected maintenance cycle of the inserts (both in tenns of timeand volume ofwater treated} was poorly understood. One vendor specified montWy maintenancewhile the other vendors based maintenance needs on the condition of the units. The fieldconditioning component of the study was intended, in part, to push the operational period of theinserts.
The details of each of the two test sequences follow.
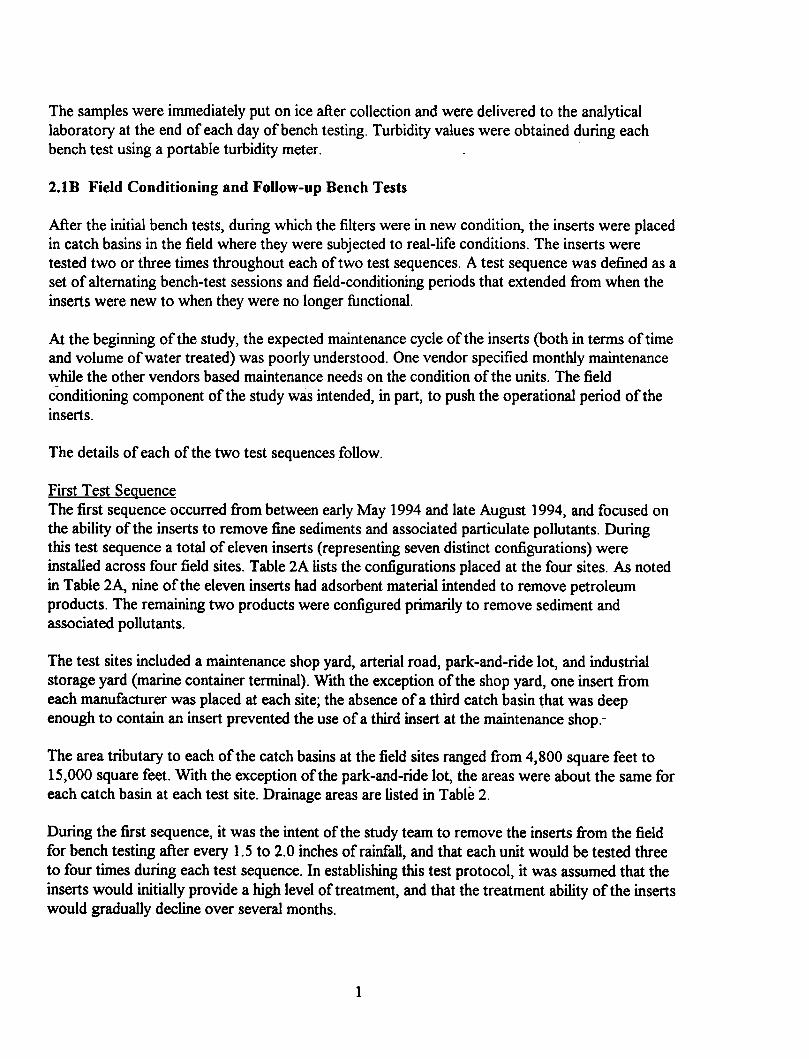
First Test SeguenceThe first sequence occurred from between early May 1994 and late August 1994, and focused onthe ability of the inserts to remove fine sediments and associated particulate pollutants. Duringthis test sequence a total of eleven inserts (representing seven distinct configurations) wereinstalled across four field sites. Table 2A lists the configurations placed at the four sites. As notedin Table 2A, nine of the eleven inserts had adsorbent material intended to remove petroleumproducts. The remaining two products were configured primarily to remove sediment andassociated pollutants.
The test sites included a maintenance shop yard, arterial road, park-and-ride lot, and industrialstorage yard (marine container terminal). With the exception of the shop yard, one insert fromeach manufacturer was placed at each site; the absence of a third catch basin 1hat was deepenough to contain an insert prevented the use of a third insert at the maintenance shop.-
The area tributary to each of the catch basins at the field sites ranged from 4,800 square feet to15,000 square feet. With the exception of the park-and-ride lot, the areas were about the same foreach catch basin at each test site. Drainage areas are listed in Table 2.
During the first sequence, it was the intent of the study team to remove the inserts from the fieldfor bench testing after every 1.5 to 2.0 inches ofrainfall, and that each unit would be tested threeto four times during each test sequence. In establishing this test protocol, it was assumed that theinserts would initially provide a high level of treatment, and that the treatment ability of the insertswould gradually decline over several months.
1

Table 2. Configurations Used at Field Sites
2a. First Test sequenceTEST SITE STORMW A TER
SERVICESAQUA-NET ENVIRO-DRAIN
Basket with Absorbent W
(AN-A)
Maintenance
Shop Yard
Not tested at this site due to
lack of suitable catch basinCoarse screen, and one tray ofAbsorbent W (ED-A)
Tributary area: 7,000 ft2 -Tributary area: 6,000 ~
Park -and-RideLot
Type 11-0, sock with
polypropylene strips (SS-20)
Basket with Absorbent W
(AN-A)
Coarse screen, two trays ofAbsorbent W (ED-SAA)
Tributary area: 10,000 ft2 Tributary area: 13.000 ft2 -Tributary area: 10.000 ft2
Arterial Road Type ll-Q, sock withpolypropylene strips (SS-20)
Basket without bag of
Absorbent W (AN-S)Coarse screen. two trays ofAbsorbent W (ED-SAA)
T~u~ area: 5,500 ft2 Tribu~~~: 4,800 ft2 Tributa~~: 5.000 ft2
Industrial yard Stonnwater Services, TypeI double box (SS-I)
Basket without bag ofAbsorbent W (AN-S)
Coarse screen, tray ofAbsorbent W, trayofactivated carbon (ED-SAC)
Tributary area~lO,OOO ft2 Tributary area: 19~OOO ft2 Tributary area: 10.000 ft2
In the end, units from three of the sites were evaluated twice after the new-condition tests. Unitsfrom the park-and-ride lot were evaluated a third time. Total aggregate rainfall for the four sitesranged from 2.83 to 4.07 inches. The period that each unit remained in the field ranged from 118to 140 days. The details of each field-conditioning period are included with the data tables inAppendix B .
12

Second Test SeguenceThe second sequence of tests was conducted from early December 1994 to early February 1995.Based on experience gained during the first sequence, the second sequence was modified asfollows: the focus was shifted from particulate pollutants to petroleum hydrocarbons, and thetargeted interval between bench-test sessions was reduced from 2 inches to 0.75 inches ofrain. Itwas hoped that by reducing the interval between bench tests, the point at which the ability of theunits to remove oil and grease decreased would be clearly identified.
Prior to the start of the second sequence the manufacturers were given the opportunity to providetheir most current designs. Table 2B presents the configurations tested during the second testsequence. As illustrated by comparing Tables 2A and 2B, two of the manufacturers provided unitsthat were different than those used during the first test sequence. Changes included increases inthe flow path through the treatment area, creation of dead storage, and, for one of the products,introduction of an alternate absorbent. These changes are also reflected in Figures 1 (b) and 1 (f).
F~r the second sequence, the inserts were tested when new, then installed at two sites: anemployee parking lot and a retail commercial parking lot (hardware store). Three differentconfigurations (one from each manufacturer) were tested at each sites. The areas tributary to thecatch basins were initially estimated to range from 13,000 ft:2 to 32,000 ft:2.
The inserts were bench tested two to four times after being placed in the field. Total aggregaterainfall for the two sites ranged from 1.30 to 4.55 inches. The details of each field-conditioningperiod are included with the data tables in Appendix B.
The number of bench tests for the inserts ranged from three to five, including the test when"fresh. " The sequential bench tests were terminated for a particular unit when either a significant
decrease in the hydraulic capacity of the treatment area was observed and/or a significant decreasein oil removal performance was observed. Testing was generally discontinued when either theremoval efficiency was less than 50 percent or effluent concentrations were significantly above10 mg/l.
2.1C Weighing and Analysis of Captured Material
The following data were collected in conjunction with the bench-testing and field-conditioningactivities: The wet weight of each filter was obtained shortly after each bench test to detenninethe maximum field weight maintenance staff would have to work with; dry weights of the insertswere obtained at the beginning and end of the second test sequence; the particle size distributionofboth the test storm water and the material captured in the inserts during the "field-conditioning" was detennined; and spent media and captured sediment were analyzed forpollutants which could limit disposal options.
13
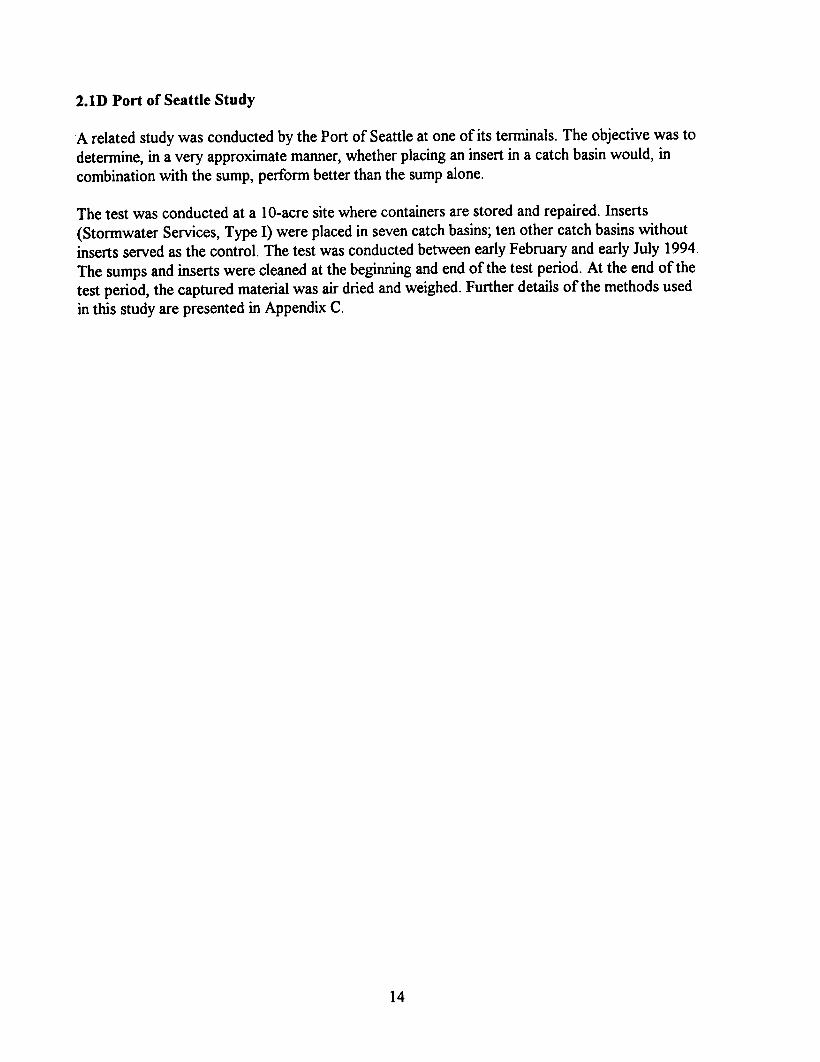
2.1D Port of Seattle Study
A related study was conducted by the Port of Seattle at one of its tenninals. The objective was todetermine, in a very approximate manner, whether placing an insert in a catch basin would, incombination with the sump, perform better than the sump alone.
The test was conducted at a 10-acre site where containers are stored and repaired. Inserts(Stomlwater Services, Type I) were placed in seven catch basins; ten other catch basins withoutinserts served as the control. The test was conducted between early February and early July 1994.The sumps and inserts were cleaned at the beginning and end of the test period. At the end of thetest period, the captured material was air dried and weighed. Further details of the methods usedin this study are presented in Appendix C.
14

2.2 RESUL TS AND DISCUSSION
-2.2A Suspended Solids
Bench T est ResultsTotal suspended solid (TSS) were sampled only during the first test sequence. During thissequence, the inserts achieved very modest TSS removals in the bench-test facility. Thisconclusion is illustrated in Figure 4 which compares the mean influent TSS to the mean quantityofTSS removed for each test. Inflow values during the bench test ranged from 52 mg/L to 157mg/L for all tests. For any given day of bench testing the variability of the inflow was considerablyless than for the entire study. Complete bench test data are presented in the tables in Appendix B.
In Figure 4, each vertical bar represents one bench test for one insert configuration. Each group ofbars represents all tests for a particular configuration used in a specific field site. Themanufacturer and configurations are not identified because of the lack of difference in theirrespective perfonnances. The "diamond" associated with each vertical bar represent the change inTSS concentration. (Diamonds located near the "x" axis are indicative of low removal rates. ) Themean inflow concentration is represented by the height of the bar. During all but two tests, thereduction in TSS was less than or equal to 20 mg/L.
During nearly half of the bench tests, the observed reduction in TSS was near zero mg/L, or wasnegative. All units exhibited negative removals during one or more bench tests. The negativeremoval efficiencies are believed due to a combination of two factors: sediment washout duringthe bench test, and the inherent variability in the laboratory and bench-test procedures.
Washout was observed during most bench test runs. During the flow stabilization period of threeminutes, the turbidity of the water leaving the inserts increased temporarily. Although this initial"spike" of turbidity quickly attenuated (and was not included in the samples), it was apparentfrom visual observations that washout could have been occurring during the sampling period.Although observed only visually during the first test sequence, this "first flush" effect wascharacterized during the second sequence through the collection of turbidity data as soon as waterbegan to leave the insert. First flush values were typically 20 NTU above values for samplescollected after the three-minute "warm-up" period ranged. Outflow turbidity values after thisstabilization period were always within plus or minus ten percent of the inflow values, indicatingthe inserts did not substantially reduce turbidity .
15

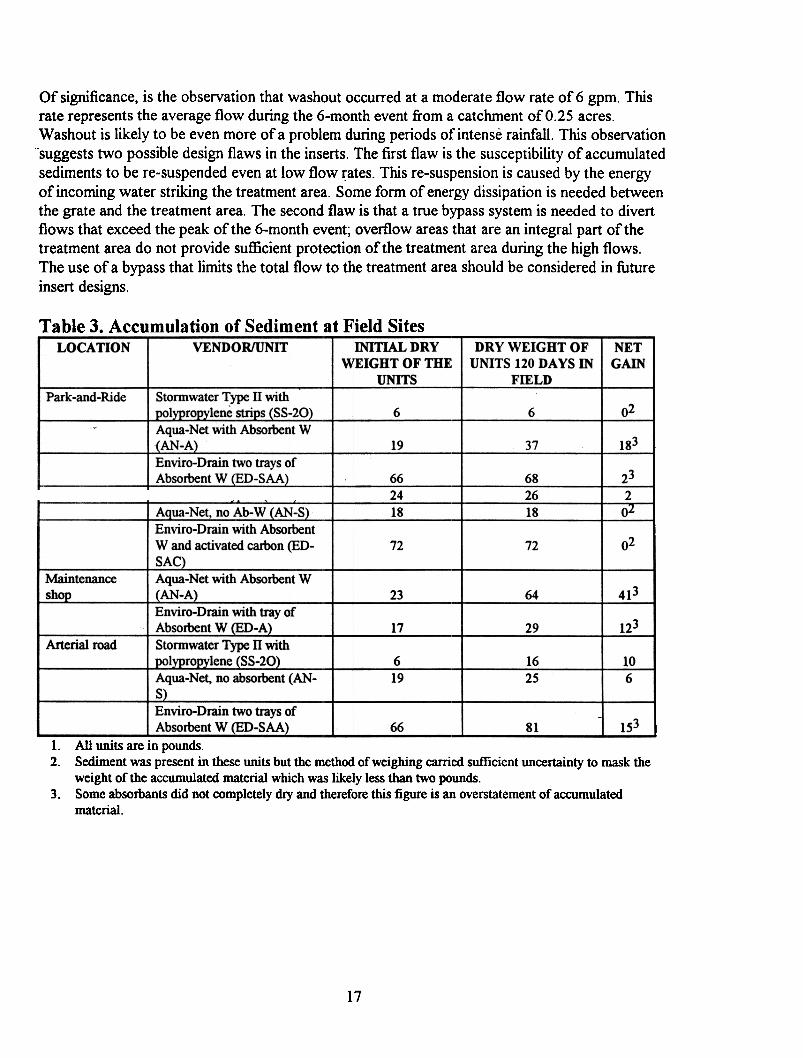
Of significance, is the observation that washout occurred at a moderate flow rate of 6 gpm. Thisrate represents the average flow during the 6-month event from a catchment of 0.25 acres.Washout is likely to be even more ofa problem during periods of intense rainfall. This observation-suggests two possible design flaws in the inserts. The first flaw is the susceptibility of accumulatedsediments to be re-suspended even at low flow rates. This re-suspension is caused by the energyof incoming water striking the treatment area. Some form of energy dissipation is needed betweenthe grate and the treatment area. The second flaw is that a true bypass system is needed to divertflows that exceed the peak of the 6-month event; overflow areas that are an integral part of thetreatment area do not provide sufficient protectiqn of the treatment area during the high flows.The use of a bypass that limits the total flow to the treatment area should be considered in futureinsert designs.
Table 3. Accumulation of Sediment at ~ield SitesLOCATION VENDOR/UNIT INITIAL D R Y
WEIGHT OF mEUNITS
DRY WEIGHT OFUNITS 120 DAYS IN
FIELD
NETGAIN
Park-and-Ride Stormwater Type n with
polypropylene strips (SS-20)Aqua-Net with Absolt)ent W
(AN-A)
026 6
18319 37
Enviro-Drain two trays ofAbsorbent W (ED-SAA) 23
2
0'1
66
24
18
682618
I Industrial I Stonnwater Tvoe 1 (SS-l )
Aq~~~~W{AN-S)Enviro-Drain with AbsorbentWand activated carbon (ED-SAC)
0272 72
MaintenanceShOD
Aqua-Net with Absorbent W
(AN-A) 41323 64
Enviro-Drain with tray ofAbsorbent W (ED-A) 12317 29
Arterial road Stormwater Type n with
qua- et, no so nt (AN-S)
6
19
1625
10
6
Enviro-Drain two trays ofAbsorbent W (ED-SAA) 15366 81
I.
2.
3.
All units are in pounds.Sediment was present in these units but the method of weighing carried sufficient uncertainty to mask theweight of the accumulated material which was likely less than two pounds.Some absorbants did not completely dry and therefore this figure is an overstatement of accumulatedmaterial.
17

As previously stated, the study team sought to push the ability of the inserts beyond theirexpected maintenance cycle. For this reason, the above analysis presents a worst-case scenariosince many of the inserts were at or beyond their useful life during the later tests. One wouldexpect considerably better perfonnance during the first set ofbench tests when the filters werenew, but the data from the new-condition test (which are represented by the first diamond/bardata set in each of the clusters in Figure 4) indicate the initial perfonnance was generally no betterthan the perfonnance later in the study. In a few instances, the perfonnance of the insertsappeared to increase after the first field conditioning session. These small changes in apparentperfonnance, however, are within the expected experimental error.
Sediment Accumulation and Particle Size DistributionWhile the inserts appeared to capture very little sediment in the bench test, they did capture atleast some sediment in the field. Results of the before-and-after weighings ranged from 0 to 41pounds over a period of 120 days. (Complete weight data are presented in Table 3.).
Although three units appeared not to. have increased in weight, visual observations confirmed thatthe units had captured sed,iment. The discrepancy between visual observation and the weight lieswith ~he uncertainty of the scale used to weight the inserts; weighing was originally intended onlyto provide information concerning maintenance needs. Although adequate for its original intendedpurpose, the scale used was not precise enough to reliably quantif}r sediment accumulation with anaccuracy of more than a few pounds. In addition, the apparent quantity of sediment accumulatedin the units with wood-fiber absorbents is probably overestimated because of the difficulty incompletely drying these products at the end of the test period. Considering these sources of errorand the relative small change in weight of the filters, the reported changes in gross weight shouldbe treated only as a rough measure of the amount of material likely to be trapped under the fieldconditions studied. (According to one of the vendors, inserts installed in construction areas havecaptured as much as 100 pounds of sediment. )
The size distribution of the sediment captured by the units is similar to, or slightly coarser than,observed in street-surface contaminants. Figure 5 compares particle size distribution values fromthree studies (Sartor and Boyd, 1972; Aronson et al, 1983; Pitt, 1985), with those obtained fromsamples of the material captured by the inserts. The current study did not include analyses of thematerial entering the inserts in the field and therefore cannot report on the actual removal of thesesediments; however, the comparison in Figure 5 seems to corroborate the observation in thebench tests that the inserts preferentially capture sand-sized sediment as opposed to silt and clay.A follow-up 'study, intended to examine the ability of the inserts to capture sand-sized particleswill be conducted by Snohomish County Surface Water Management (Leif, 1995).
18

...
~.-
-=
~
-t:.-~~
~.5
1 S
-0=~
~-a
e .c
=
~
U~
~~
=
.U
~~
~"'0
=
-=~
~.~
=
=U
o
-()=
~~
~
e ~
.-~1
~oo~
()8"-6
~
.5~
-
=
-~="..=
~=
:
..c .
.c .tl
-=.~
=Q
.e
~
e.~
~
00 =
.
~=
f{$-
U-
CJ
()
-.c ~
.=
~
CJ
()
~'2£.=
"'0
.,,00~
~-+
ot~-~
()
=
~
.-
~-"'0
.--~~
00
.~
oo
'0
O0'1 ICD
O .:. 0
0~
~
Ot"'- "
Jqg!aA\A
gJaIfBw
s %
0
O'-0
00
0I/')
.~.
0~
0
OM
0
.:-0
ON
0
0-
0
0
oooo-ooooo-0-
e-.=..
""'uu~.-0u-u
.-t~
~

Results of the Port of Seattle StudyThe Port study addressed whether one type ofinsert (the Stonnwater Services Type I) plus thesump would result in sigriificantly greater removal of pollutants than just the sump. This study wasconducted on a IO-acre site with 17 catch basins.
The sumps without inserts removed 47 pounds ofair-dried sediment over the five-month testperiod. During this period the inserts removed 20 pounds of sediment and the underlying sumpsremoved 27 pounds, for a combined total of 47 pounds. The analysis of the size distribution of thesediment in the inserts and sumps found that both removed similar material and that the capturedsediment was essentially all sands and course material. This outcome indicates the inserts removedmaterial that would have been removed by the sump. Only about five percent of the capturedsediment were silt- and clay-sized particles as compared to the roughly ten percent fines indicatedin the street-runoff studies presented in Figure 5.
Midway through the test it was realized that the test site possessed two attributes that may beunique. The results therefore, are no~ considered widely applicable at this time. First, the site wasnot completely paved, resulting in a considerable amount of sediment in the stormwater .Seco.ndly, the site was washed daily during dry weather to reduce fugitive dust emissions. SeeAppendix C for further information on the study.
Conclusions Regarding the Removal of SusQended Solids.The inserts tested generally did not reduce the concentration of silt and clay sized particles by
more than 20 mg/L and often exhibit removal efficiencies of zero under the conditions tested(moderate to high concentrations of particles less than 50 microns in diameter, delivered at aflow rate of6 gallons per minute).
.Although the study was not designed to evaluate the ability of the inserts to remove materialsgreater than 50 microns, visual observations and particle-size distribution tests suggest thatinserts are able to trap the courser materials typically found in street runoff. Thus, an insertintended to capture "raw" stormwater will likely achieve a higher removal efficiency thanobserved in the bench tests.
.The ability of the inserts to retain trapped material appears to be compromised in part bywashout of previously trapped materials. Washout of trapped material may be reducedthrough the use of an energy dissipater and a high flow bypass (Other conditions which arelikely to limit the performance of inserts are discussed in the following chapter on hydraulic
performance. ).None of the data indicate that inserts are able to reduce end-of-pipe concentrations under a
normal sump-maintenance scenario; however, inserts may extend the maintenance cycle of thecatch basin sumps by providing additional sediment storage. Routine maintenance of theinserts could be used to reduce the need for eductor-truck services.
.The inserts were unable to remove sediments which had been capture in, (and therefore wereremoved by) the sedimentation vault used to collect stormwater in the study. If theperformance of other water quality facilities (ponds and vaults) is similar to the vault used inthe study, it can be assumed that the insets do not perform as well as currently acceptedtreatment BMPs.
20

2.2B Petroleum Hydrocarbons
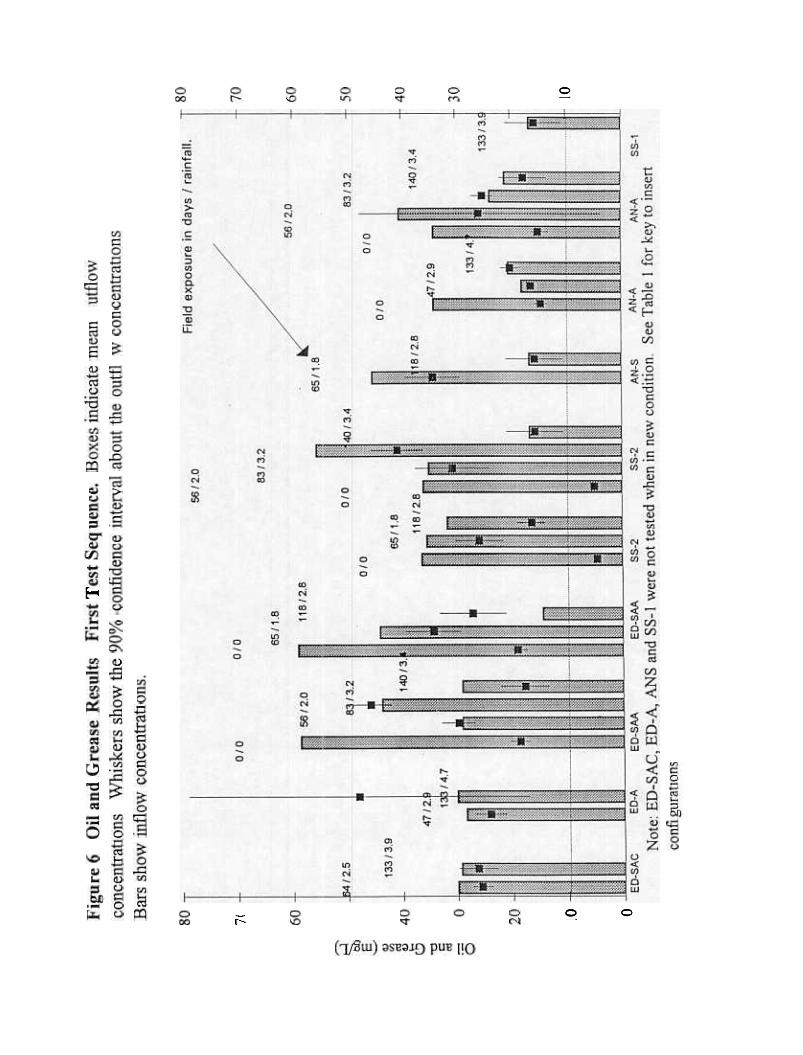
-First Test SeQuenceDuring the first test eight inserts were configured to remove petroleum hydrocarbons. Figure 6compares the influent and effluent concentrations for each test. In Figure 6 each diamond/bar setrepresents the results from one bench test on one insert configuration. Each group of barsrepresents all tests for a particular configuration. Except as noted below, the bar to the left of thegroup is the initial test, and each successive bar represents additional tests after field conditioning.The inserts ED-SAA, SS-20, and AN-A were each used in more than one site, but were onlytested once in the new condition. New-condition results for these products are presented onlywith the first cluster for each product. The insert! ED-SAC was not tested for oil and grease
removal when in new condition.
In Figure 6, the bars represent the mean influent concentration and a diamond represents the meane:tI1uent concentration. The error bars as.sociated with the diamond represent the 90 percentconfidence interval about the,outflow concentration. The paired values above each diamond/barset indic.ate the total number of days of field exposure and the total amount of rainfall prior to thebench test. A horizontal line at 10 mg/L represents the oil and grease concentration defined as"significant" in NPDES industrial stormwater permits.
An examination of Figure 6 suggests that the inserts were able to reduce oil and greaseconcentrations by between 30 and 90 percent when in new condition, and that removal rates werereduced to 30 percent or less by the first post-field conditioning tests. Only one of the units (SS-20) was able to reduce the oil and grease concentrations to below 10 mg/L, and this, only when
the insert was new.
Two of the units, (ED-SAA and SS-20), exhibited increased removal efficiency (30 to 50 percentremoval) during the last test after having been in the field for about four months. As with most ofthe units, the performance of these products had dropped off after the new-condition tests.Whether these changing removal rates are the product of changes in the nature of the filtersduring the field-conditioning period, or is simply indicative of the variability in the samplingprocedure is uncertain. It is interesting to note that the insert designated AN-S, which was notconfigured to remove oil and grease and did not contain any oil-absorbing media, exhibited acalculated removal rate of 25 percent during the last test on that product.
21
Second Test SeguenceThe results from the first test sequence suggest the removal efficiency drops significantly at orbefore the units experienced 2 inches of accumulated rainfall. The second test sequence was
-conducted to better define the required maintenance frequency.
As in the first test sequence, the units were tested when new and then installed in the field. Onceinstalled in the field the units were removed for bench testing after each 1/2 to 3/4-inch of rain.
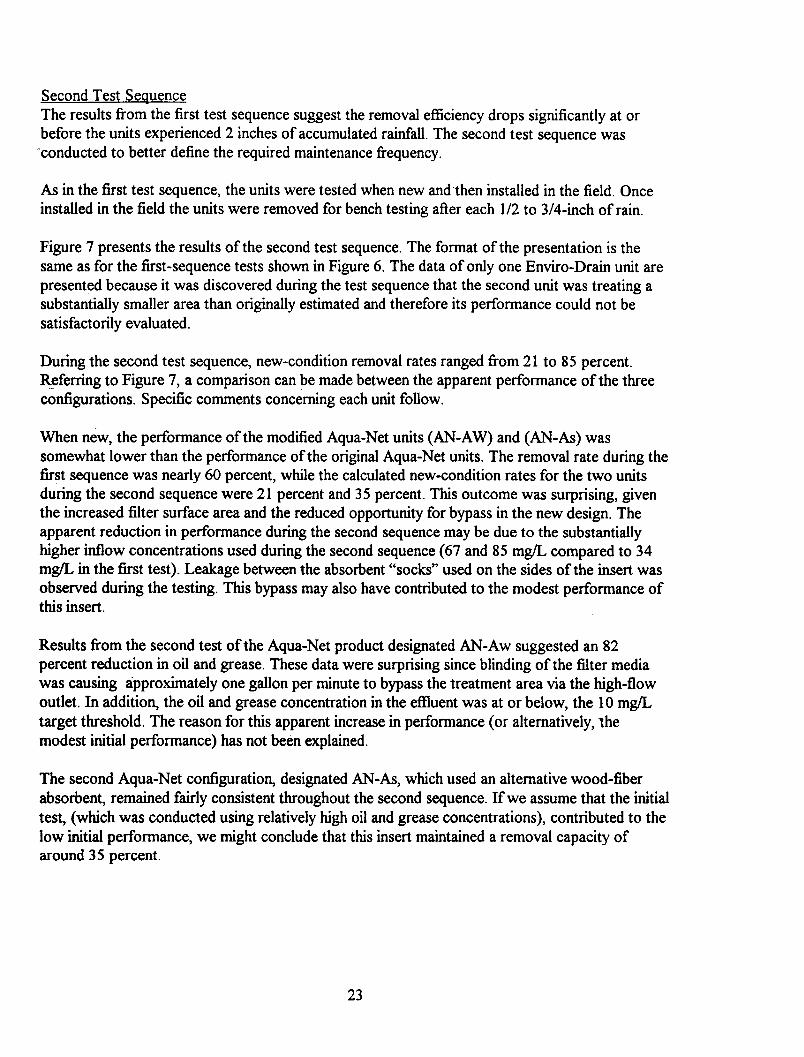
Figure 7 presents the results of the second test sequence. The fonnat of the presentation is thesame as for the first-sequence tests shown in Figure 6. The data of only one Enviro-Drain unit arepresented because it was discovered during the test sequence that the second unit was treating asubstantially smaller area than originally estimated and therefore its perfonnance could not besatisfactorily evaluated.
During the second test sequence, new-condition removal rates ranged from 21 to 85 percent.R~ferring to Figure 7, a comparison can ~e made between the apparent performance of the threeconfigurations. Specific comments concerning each unit follow.
When new, the performance of the modified Aqua-Net units (AN-AW) and (AN-As) wassomewhat lower than the performance of the original Aqua-Net units. The removal rate during thefirst sequence was nearly 60 percent, while the calculated new-condition rates for the two unitsduring the second sequence were 21 percent and 35 percent. This outcome was surprising, giventhe increased filter surface area and the reduced opportunity for bypass in the new design. Theapparent reduction in performance during the second sequence may be due to the substantiallyhigher inflow concentrations used during the second sequence (67 and 85 mg/L compared to 34mg/L in the first test). Leakage between the absorbent "socks" used on the sides of the insert wasobserved during the testing. This bypass may also have contributed to the modest performance ofthis insert.
Results from the second test of the Aqua-Net product designated AN-Aw suggested an 82percent reduction in oil and grease. These data were surprising since blinding of the filter mediawas causing approximately one gallon per minute to bypass the treatment area via the high-flowoutlet. In addition, the oil and grease concentration in the emuent was at or below, the 10 mg/Ltarget threshold. The reason for this apparent increase in performance ( or alternatively, themodest initial performance) has not been explained.
The second Aqua-Net configuration, designated AN-As, which used an alternative wood-fiberabsorbent, remained fairly consistent throughout the second sequence. If we assume that the initialtest, (which was conducted using relatively high oil and grease concentrations), contributed to thelow initial performance, we might conclude that this insert maintained a removal capacity ofaround 35 percent.
23

~0~0~Q)
8 ~
Q)
0
~~
.-="'0
O.=
Q
)f/1..SQ
)-~
+
-'0
=
~..8.~~
-C
j ~
~
~=
Q
)c-~~
.~
r,,) Q
)-(.)f/1
Q~
Q
) .
~"'0~
~
~
.g=
0
~=
(.)
~C
j ,c
d~
Q
" Q
,)r,,)0(.)
I 0'1
df/1
Q,) o
.=..s(.)
=
:>
~f/1~
O~
Otg
~
~
.=f/1
f/1 ~
=
0~
]..=~
.f/1
f/1
"'C~
~
=~
~-f/1
..-d
QO
o
o.~
.~
.~
~r---~
~~
Q
Q
...Q,)
Q,)
=
(.) (.)
~
Q
Q.-O
O
~
(.) (.)
E0.s(/)(/)
~.0-i.c(.);§.
~cE-~cu~~~i""iiii:
vN"00
o0> om
o00 O00
o o
,... (~
w)
or-.0(0
0Lt)0q-
0Mo 0
M
NpU
B
1!0
ON
0 O.-
0 0
~~~~z< ~(/)cw (0)
ch(/)t(/)Nz<
I:
(')<1>
II)
The operating instructions for the Aqua-Net units call for periodic removal and "shaking out" ofthe absorbent-filled bag. The purpose of this activity is to break up any crust which may form overthe absorbent surface and improve contact betwebn the absorbent and the stormwater. While thisIntermediate maintenance activity (which was not carried out during the study), is likely to affectthe performance of the inserts once they have been installed in the field, it would not have affectedthe initial performance of the units when they were in new condition.
The Enviro-Drain unit (ED-SAA) failed to bring the oil and grease concentration to the 10 mg/Ltarget level during the "new-condition" test, but met this treatment objective after the first fieldconditioning period. New conditions removal rat~s for the Enviro-Drain were around 50 to 60percent. The unit appears to have performed wel~ up to a rainfall depth somewhere between 0.7and 1.3 inches, however, transporting the units from the field to the laboratory increased thehydraulic capacity of the insert; when observed in the field at the end of the first field-conditioningtest, the upper absorbent tray was full of water even though it was not raining and there was no sno water entering the insert. Once at the test facility, the flow through the upper absorbent trayw-as measured at 4.6 gallons per minute. ,!his observation raises concern over the potential effects(both positive and negative) Qftransporting the inserts to the bench-test facility.
The reduced filter capacity of the Enviro-Drain appeared to be due to clogging of the bottomscreen of each tray, either by sediment or the absorbant used in the tray. A second problem whichlimited the performance of the Enviro-Drain was that the absorbant became covered with a thinlayer of sediment and oil that prevented stormwater from reaching the absorbent. The layeringwas especially evident during dry weather when it formed a nearly impermeable crust. Accordingto the vendor, this layering problem can be overcome by gently breaking up the crust betweenstorm events. As with the Aqua-Net units, this intermediate maintenance step was not carried outduring the field-conditioning periods.
The Stormwater Service units maintained removal efficiencies of around 50 percent, and outflowconcentration near, or below 10 mg/L well after the third field conditioning period. These unitswere subjected to total of 4.5 and 5.2 inches ofrain respectively (2.5 to 3.0 inches more than theother inserts) before a final test.
Performance of the Stormwater Services units differed between the two test sequences. Duringthe first sequence the units perfornled very well when fresh, but their perfornlance droppedsignificantly after 2 to 3 inches of rainfall. However, during the second sequence the units werestill performing well after about 5 inches of accumulated rainfall. This difference is almostcertainly due to the design changes made between the first and second test sequences. The designchange thought to have the greatest impact on perfornlance was the addition of a "pocket" on theexterior of the insert. This pocket allowed the outflow to be routed from near the bottom of theinsert to an elevation just below the high-flow outlet (see Figure l(t)). Since the filter fabric thatthese inserts are constructed from quickly becomes impernleable when installed in the field, themodification creates a dead storage area inside the unit and reduces the hydraulic head (and thusvelocity), at the outlet. The creation of a dead-storage area increases the contact time between thestOrnlWater and the absorptive media, and allow~ s,ome gravitational separation of trapped oil andsediment. The reduced velocity around the outlet, combined with the low velocity in the dead
25