bench testing results for the electrical pcm-assisted
TRANSCRIPT

ORNL/TM-2016/175
Bench Testing Results for the Electrical PCM-Assisted Thermal Heating System (ePATHS)
Tim J. LaClair Zhiming Gao Omar Abdelaziz
4/20/2016
Approved for public release. Distribution is unlimited.

DOCUMENT AVAILABILITY
Reports produced after January 1, 1996, are generally available free via US Department of Energy (DOE) SciTech Connect. Website http://www.osti.gov/scitech/ Reports produced before January 1, 1996, may be purchased by members of the public from the following source: National Technical Information Service 5285 Port Royal Road Springfield, VA 22161 Telephone 703-605-6000 (1-800-553-6847) TDD 703-487-4639 Fax 703-605-6900 E-mail [email protected] Website http://www.ntis.gov/help/ordermethods.aspx Reports are available to DOE employees, DOE contractors, Energy Technology Data Exchange representatives, and International Nuclear Information System representatives from the following source: Office of Scientific and Technical Information PO Box 62 Oak Ridge, TN 37831 Telephone 865-576-8401 Fax 865-576-5728 E-mail [email protected] Website http://www.osti.gov/contact.html
This report was prepared as an account of work sponsored by an agency of the United States Government. Neither the United States Government nor any agency thereof, nor any of their employees, makes any warranty, express or implied, or assumes any legal liability or responsibility for the accuracy, completeness, or usefulness of any information, apparatus, product, or process disclosed, or represents that its use would not infringe privately owned rights. Reference herein to any specific commercial product, process, or service by trade name, trademark, manufacturer, or otherwise, does not necessarily constitute or imply its endorsement, recommendation, or favoring by the United States Government or any agency thereof. The views and opinions of authors expressed herein do not necessarily state or reflect those of the United States Government or any agency thereof.

ORNL/TM-2016/175
Energy and Transportation Science Division
Bench Testing Results for the Electrical PCM-Assisted Thermal Heating System (ePATHS)
Tim J. LaClair Zhiming Gao
Omar Abdelaziz
Date Published: April 2016
Prepared by OAK RIDGE NATIONAL LABORATORY
Oak Ridge, TN 37831-6283 managed by
UT-BATTELLE, LLC for the
US DEPARTMENT OF ENERGY under contract DE-AC05-00OR22725


Bench Testing Results for the Electrical PCM-Assisted Thermal Heating System (ePATHS)
Oak Ridge National Laboratory
Bench testing of the Electrical PCM-Assisted Thermal Heating System (ePATHS) was completed at the Building Technologies Research and Integration Center (BTRIC) at the Oak Ridge National Laboratory (ORNL). The ePATHS is a thermal energy storage device designed to reduce the energy required from the battery for cabin heating of electric vehicles (EVs) and plug-in hybrid electric vehicles (PHEVs).
ORNL’s testing of the ePATHS assessed three main aspects of operation of the device:
1. ePATHS charging evaluation: measure the time to charge and the energy input needed to fully charge the PCM for a range of different ambient conditions.
2. ePATHS Discharge Evaluations: measure the energy provided by the PCM HX, both during mode 1 and mode 2 operation, and confirm the cabin heating duration that can be provided by the ePATHS. This is the primary evaluation to validate the system performance, and an array of multiple ambient conditions and operating scenarios were tested.
3. Evaluation of Thermal Losses from the ePATHS during Cold Soak: this test evaluated the performance of the insulation system for the ePATHS. The charged ePATHS underwent a long-term soak in cold ambient temperature conditions, and the heat losses were evaluated to validate that the performance satisfies the maximum energy loss requirement.
The charging, discharging and insulation system performance are key metrics for the technical objectives of the project, and the test conditions were defined to thoroughly evaluate these performances.
Figure 1 shows photos of the ePATHS prototype bench unit in the BTRIC test chamber during the evaluation at ORNL. The cabinet contains all of the ePATHS hardware and instrumentation, a data acquisition system located on the top of the cabinet (inside the gray enclosure), several displays that show the status of the ePATHS, and a power supply module including a safety on/off switch. The PCM HX, pump, and most of the plumbing for the ePATHS are located in the lower central region of the cabinet underneath the data acquisition system. The vehicle HVAC module, which contains the cabin HX is the black unit located on the back of the cabinet opposite the power supply. After some initial testing of the device in the chamber, an air duct (not shown) was attached to the intake of the HVAC module and supplied with ambient air from a location in the test chamber several meters away from the air outlet of the HVAC module so that the hot air exhaust from the HVAC module was not drawn back into

the air intake. The ePATHS controller unit and the computer that logged all data from the testing were located outside of the chamber and were attached to the ePATHS via cables passed through the wall of the test chamber. This allowed the ePATHS to be controlled without the need to enter the test chamber, so that the operator could remain in comfort outside the chamber once the test is initiated and to avoid the need to open the door into the chamber unnecessarily, thus minimizing disruptions to the chamber temperature control.
Figure 1. Photos of the ePATHS bench prototype hardware in ORNL’s BTRIC test chamber.
Test Conditions
PCM Charge and Discharge Evaluations
The primary operating condition selected for the ePATHS operation for charge/discharge evaluations corresponds to a cabin temperature setpoint of 24°C with an ambient temperature condition of -10°C. This is the condition at which most of the design goals for the ePATHS were defined. Prior testing by MAHLE of the heating system in the Ford Focus EV characterized the air flow rate and exhaust temperature profiles that are followed by the actual vehicle while operating under these conditions. For the bench evaluation at ORNL, which was conducted in a temperature controlled environmental

chamber, the same measured exhaust air flow rate and temperature profiles (Fig. 2) were used as control targets for the ePATHS operation.
Figure 2. Air flow rate and air vent temperature profiles used for the bench test.
Using the same air flow rate and exhaust air temperature for the chamber test provides a very similar operation during the test to how the ePATHS would function in the vehicle at the setpoint condition. A primary difference of the in-vehicle operation, as compared to the bench level evaluation, however, is that the temperature of the vehicle transiently increases as a result of the heat provided by the HVAC system, whereas the test chamber controller maintains a steady temperature throughout the test (since it is not capable of rapid dynamic control to emulate the vehicle response). For in-vehicle climate control with a fully automatic temperature system, the air intake is a blend of outside and inside air. This recirculation blending is done in a manner that minimizes the amount of ambient air intake as much as possible while ensuring that the humidity of the cabin air remains within limits since an excessive humidity level would lead to fogging of the vehicle’s windows. Due to the recirculation blending and transient cabin air temperature, the air inlet temperature is different during the bench test than during the in-vehicle operation, and the instantaneous heat transfer rate will therefore also differ as a result.
The project team decided to operate the charging and discharge evaluations at an ambient temperature condition in the chamber that results in the same overall heat transfer from the ePATHS over the targeted duration that the ePATHS is designed to heat the cabin, i.e. for the 46 minute average U.S. commute time. This corresponds to an ambient condition that is an average of the blended air inlet temperature for this heating period, weighted by the air flow rate. Using data provided by MAHLE, the appropriate average air intake temperature was calculated to be -2.7°C for the flow rate and exhaust air

temperature profiles corresponding to the 24°C setpoint and the -10°C ambient condition. This represents the baseline condition for the chamber temperature setpoint. In addition, the charging and discharge evaluations were run at chamber temperatures of +10, 0, -10 and -20°C, to evaluate the variation in heating durations and the energy required to charge the PCM under different ambient conditions and to ensure that the additional heat losses resulting from cooler ambient conditions will not result in dramatically reduced performance. It is noted that the charge and discharge tests were run sequentially under identical chamber conditions. Both the -2.7°C (baseline) and the 10°C chamber temperature conditions were run twice to evaluate repeatability.
Evaluation of Thermal Losses during Extended Cold Soak
For the evaluation of heat loss during cold soak, the test is intended to quantify the energy loss from the ePATHS during conditions that emulate a partial charge of the PCM while the EV remains in a parking lot for an extended period of time, for example following a morning commute. The primary thermal losses during this period are through the insulation system that encases the PCM HX, hence the test should quantify the rate of thermal losses from the PCM. A majority of this heat transfer from the PCM takes place at constant temperature (the freezing point), and it is expected that most or all of the initial superheat would be depleted prior to a cold soak in most normal operation situations in a vehicle. Since no temperature change occurs in the PCM during this period of pure latent heat removal, however, the heat losses can be more easily characterized through a measurement at temperatures above and below the freezing point. The difference in temperature between the PCM and the ambient temperature drives the heat transfer from the PCM during the cold soak. Testing at a higher PCM temperature but with the same ambient temperature therefore results in an increased ΔT, so the heat transfer rate will be higher than during a cold soak with a steady PCM temperature at the freezing point. Conversely, testing with the PCM at a lower temperature will result in a reduced heat transfer rate. The rate of heat loss measured with a warmer and cooler PCM temperature therefore provides bounds for the heat losses that would occur when the PCM is at the freezing point. For the cold soak heat loss evaluation conducted at ORNL, it was decided that the temperature would be recorded from 120°C to 80°C for the high temperature case, which corresponds to a lower temperature that is well above the 68°C freezing point of the PCM. For the lower temperature evaluation, a temperature range from 60°C to 40°C was selected. The starting point is 8°C below the freezing point of the PCM, and the lower temperature remains in a range that was believed to be usable for heating of the cabin. Both tests were run with a chamber temperature setting of -10°C.
Measurement Results
Measurements were made at 1s intervals for most of the PCM charge and discharge evaluations and at 10s intervals for the cold soak evaluations. The recorded data included temperatures from thermocouples and thermistors at locations in the PCM HX as well as in the flow path at positions that allow the temperature change across all heat transfer components to be determined; flow rate measurements for each flow branch of the ePATHS; commanded flow settings for the fluid pump and

the cabin fan; electrical power to the heaters; valve position data; and pressure measurements at several locations. These data allow the energy flows through each component in the ePATHS to be determined and to fully verify the operational state at any point in time. In total, nearly 100 data channels, including several calculated data outputs, were recorded and processed. Figure 3 shows a schematic of the ePATHS configuration.
Figure 3. Schematic of the ePATHS, showing the thermistor, flow meter, and pressure sensor locations.
Analysis of the test data was conducted to quantify the heat transfer, energy storage and temperature control of the device in order to characterize the ePATHS performance and validate that the targeted performance was met. Customized VBA code was developed to automate the processing of the data files and generate graphs and summary data for the ePATHS performance.
PCM Charge and Discharge
During the charge and discharge, the primary outputs include the temperature histories, power inputs and transfers to and from the ePATHS heat transfer components, and the cumulative energy stored and transferred. Figure 4 shows temperature and power data during a charge at a chamber temperature

setpoint of -2.7°C. Note that the time shown in all of the plots corresponds to the time since the data logging was started for the test, so it does not generally start at zero. The measured temperatures of the ethylene glycol-water (EGW) coolant are shown at the inlet and outlet from the coolant heater and at the inlet and outlet of the PCM HX. A single measure of the PCM temperature (PCMTemp) is also plotted. This PCMTemp measurement is from a thermistor embedded inside the PCM HX. Although there were also 18 thermocouples at various locations inside the PCM HX, the thermocouple data showed a higher level of noise than the thermistor data and their temperatures generally did not vary significantly from the PCMTemp data channel, other than the time at which the temperature begins to rise above the freezing point, which only provides an indication of the distance of the temperature sensor along the length of the flow path in the PCM HX. Therefore, only the single measurement is shown to provide an indication of the temperature inside the PCM. As can be seen, all of these temperatures are clustered fairly closely together, but the temperatures are ordered in the same sequence as the flow/heat transfer path, with the coolant heater outlet temperature (CltHtrOtT) being the highest, followed by the PCM HX coolant inlet temperature (PCMHXCtIn), the PCM HX coolant outlet temperature (PCMHXCtOt), coolant heater inlet temperature (CltHtrInT), and finally the PCMTemp. The temperature differences across the PCM HX and the coolant heater are shown, primarily for comparison with the corresponding power curves that are calculated using the ΔT values.
Figure 4. Temperature and power results during charging for the -2.7°C ambient temperature case.
The power curves shown in Fig. 4 include a direct measurement of the electrical power provided to the coolant heater (CltHtrPwr), the heat transfer rate to the EGW from the coolant heater (q_ClntHtr) and the heat transfer rate from the EGW to the PCM HX (q_EGWtoPCM). The latter two are calculated using the following:
= ∆ , (1)
where ΔT is the temperature difference of the EGW across the coolant heater or the PCM HX, respectively. We note that when using Eq. (1), ΔT is defined as either Tin-Tout or Tout-Tin so that it is normally positive during the operation considered (we will use the same formula for the ePATHS discharge analysis also). In this way, the calculated value of q is positive.
The electrical power to the heater and the thermal energy transferred from the heater to the fluid should be approximately equal, although the electrical power must in reality be greater than the q_ClntHtr term since there are thermal losses that are not accounted for, and part of the thermal energy is stored in the heater itself as its temperature and that of the fluid contained within it rise. As seen in Fig. 4, although the trend of the electrical power input and the q_ClntHtr term is similar, the calculated value of q_ClntHtr is observed to be the greater quantity, which is not correct. There is about a 10-15% discrepancy between the two power values over most of the period of PCM charging. During some of the evaluations, two separate power meters were used to measure the electrical power to the coolant heater, and their values were very consistent to within a few percent. Based on this and the fact that the electrical power measurement is very straightforward and not prone to large measurement error, it is believed that the difference between the electrical power and the calculated heat transfer rate to the fluid is due to a systematic error in the measurements used to determine q_ClntHtr. Some thermocouple calibration issues were observed in individual data channels, and this could be the primary source of this problem as well. (ORNL had planned to do calibrations for all thermocouples at the end of the testing, but due to timing constraints at MAHLE for vehicle testing using the prototype hardware, ORNL had to return the ePATHS immediately after completing the chamber testing.) In any case, these comparisons of power levels that are closely related provide an indication of the uncertainty in the power and energy calculations for the test data.
The heat transfer rate from the EGW to the PCM HX (q_EGWtoPCM) is shown in light blue in Fig. 4. This is calculated with Eq. (1) using values corresponding to the PCM HX. It is observed that the value of q_EGWtoPCM is lower than the power to the heater, as expected. During the period when the phase change takes place—between about 47 and 100 minutes based on the “knees” in the PCM temperature curve—it is seen that the heat transfer rate is at its peak value, within a few percent of the electrical power input to the heater, and remains nearly constant during this time. This is expected since the isothermal nature of the phase change provides a very effective heat removal with a steady sink temperature. At a time of about 113 minutes, however, the calculated heat transfer rate to the PCM HX begins to decrease steadily and remains considerably below the measured heater power. This reduction in heat transfer performance at higher temperatures is likely a consequence of the thermophysical properties of the EGW solution. The precipitous spikes down in heat transfer rate are probably caused by boiling in the heater, which can cause vapor slugs to form, causing partially or fully blocked fluid flow.
The large drop in q_EGWtoPCM that begins at 124 minutes is accompanied by spikes in the reservoir pressure and a rapid decrease in the flow rate through the PCM HX starting at the same time, as observed in Fig. 5. We note that the controller is programmed to begin reducing power to the heater at a specified temperature level, but this was implemented after observing a rise in the reservoir pressure, which is a strong indication of boiling in the EGW. Since the heat transfer coefficient began to decrease well in advance of the first sign of boiling, it may be possible to control the heater power based on this signal to prevent boiling as opposed to controlling based on the heater outlet temperature.
Figure 6 shows the cumulative energy, obtained by integration, corresponding to each of the power signals appearing in Fig. 4. The PCMTemp curve is included so that the approximate charge status can be identified as a function of time. These curves are useful in quantifying the total energy that is stored and required to complete a full charge. We can also compare the energy over a particular range with the expected charge energy, which helps to better understand the accuracy of the calculated power and energy values. The period between 47 and 100 minutes is the primary period of latent heat storage. Based on the EGW-to-PCM energy curve, the energy stored in the PCM HX increased from approximately 4.0 to 10.8 MJ during this period, indicating a net energy of 6.8 MJ. This is within 10% of the 6.2 MJ of latent heat energy that the 18.2 kg of DPT 68 present in the ePATHS is expected to store. Although we previously observed about a 10-15% over-prediction of the heater-to-EGW power levels relative to the electrical power input to the heater, this is confirmed by the energy calculation, which shows 22.6 MJ and 20.3 MJ for the calculated total heat transfer and the electrical energy, respectively, a difference of 11.3%. This level of uncertainty in the calculated heat transfer rates and total energy seems to be generally appropriate for the test results.
The discharge test results for temperatures and heat transfer rates are presented in Fig. 7. The presented data are similar in format to those from the charge evaluation shown in Fig. 4. However, air temperature data are included along with coolant temperature results, and the corresponding heat transfer rates are from the Cap HX on the liquid and air sides in addition to the heat transfer from the PCM HX to the EGW. An important result from this evaluation was that quite large oscillations in the air vent temperature were present during the discharge of the ePATHS. The data show temperature variations exceeding 20°C over just a few minutes time, which is not appropriate for cabin climate control. These large air temperature variations are caused by the pulsed control of the flow through the PCM HX and the bypass loop. Changing the control strategy to allow a proportional control of the flow through the bypass or adding a coolant flow mixer with enough fluid volume to buffer the temperature oscillations can help eliminate this issue. It is noted that the air flow rate used to calculate the heat transfer rate on the air side of the Cap HX is based on the commanded duty cycle to the fan and uses a correlation from a different HVAC unit for which the air flow rate characterization was available. This is admittedly a very coarse means to estimate the air flow through the unit, and the calculations for the air side heat transfer were not expected to be very accurate.

(a)
(b) Figure 5. (a) Pressure spikes and (b) flow blockage began to appear at the same time as significant deterioration in the heat transfer performance, indicating that boiling occurred in the EGW.

Figure 6. Cumulative energy transfer results during charging for the -2.7°C ambient temperature case.
Figure 7. Temperature and power results during discharge for the -2.7°C ambient temperature case.

Figure 8 shows the discharge cumulative energy curves, which are similar to the charge energy curves of Fig. 6. The difference between energy results seems to indicate a higher level of uncertainty for the discharge evaluation than what was seen for the charge evaluation. Nonetheless, the data are useful for a general measure of the energy transferred, and comparing the PCM-to-EGW discharge to the EGW-to-PCM charging energy values shows reasonable consistency, within approximately 10-15%. This is therefore a useful number to quantify the overall heat transfer performance of the ePATHS.
Figure 8. Cumulative energy transfer results during discharge for the -2.7°C ambient temperature case.
The test data for all other operating conditions evaluated for the charge/discharge testing are presented in the appendix of this report. Table 1 provides a summary of the charging and discharge of the ePATHS for the different ambient conditions tested. Several metrics were selected for the times, temperatures and total storage capacity that relate to the targeted performance. The estimated energy to heat the cabin of the Ford Focus BEV during 46 min in a -10°C ambient condition is 12.6 MJ (3.5kWh), which is the main objective for the ePATHS performance. For the 7 test conditions, only two of them (highlighted in the table) showed a discharge energy that did not exceed the 12.6 MJ target. Since the mass of PCM in the bench unit was only 18.2 kg, which is 9% less than the design mass of 20 kg of PCM, it is believed that the performance will be increased by this same percent with the additional PCM. This indicates that the energy design target would be met for all of the test conditions. In spite of the uncertainties in

the measurements, the team therefore believes that the current design of the ePATHS, when fully charged with PCM, can fully meet the energy requirements needed for heating an EV during a typical U.S. daily commute. The only deficiencies observed during the charge/discharge evaluations were that (1) boiling of the EGW occurred somewhat frequently during the charging of the PCM, and (2) the air temperature exiting the HVAC module vent showed large temperature variations that are not acceptable for heating of a vehicle. These issues will be addressed in subsequent design iteration(s) of the ePATHS.

Table 1. ePATHS Charge/Discharge Evaluation Data Summary
Test Date/Time: 05Feb2016
1011AM 21Dec2015
0109PM 15Dec2015
0925AM 17Dec2015
0944AM 18Dec2015
0705AM 16Dec2015
0850AM 22Dec2015
0556AM Chamber temperature (°C): -20 -10 -2.7 -2.7 0 10 10
Start/End Times for Charge/Discharge: time (min) Start of charging: 53.8 0.4 5.1 10.5 1.3 1.8 1.8 End of charging: 242.7 159.3 165.1 171.4 164.2 136.5 153.7
Start of transient discharge: 243.0 160.2 165.9 171.7 164.4 137.0 154.0 End of transient discharge: 266.0 183.2 188.9 195.7 187.4 159.9 177.0
Start of steady state discharge: 266.6 183.6 189.9 196.1 187.7 160.3 177.3 End of steady state discharge: 358.3 270.1 291.6 289.4 281.7 274.9 292.8
discharged to 60°C (PCMTemp value): 290.4 209.2 227.8 229.3 225.4 218.1 233.6 discharged to 60°C (PCMHXout value): 287.1 207.7 225.1 226.7 222.5 215.0 231.3
total duration of discharge: 115.3 109.9 125.7 117.7 117.4 137.9 138.8 47.4 49.0 61.9 57.6 61.0 81.1 79.6
Temperatures at key times: temperature (°C)
PCMtemp start of charge: -11.37 0.42 5.26 7.00 6.07 13.56 2.38 PCMtemp end of charge: 119.74 119.77 119.98 119.98 119.84 120.00 119.37
PCMtemp start of discharge: 119.87 120.00 120.07 120.00 119.93 120.00 119.31 PCMtemp end of discharge: -10.63 0.14 6.85 6.80 9.96 19.97 20.17
air inlet temp 30sec after discharge start: -15.26 -9.15 0.86 -1.42 1.45 11.01 10.81
Cumulative Energy Results: Energy (kJ) Total EGW_PCM charge energy (kJ): 17249 15248 15492 15579 16843 14887 17351
Total EGW_PCM discharge energy (kJ): 17731 15953 16726 16274 14689 16311 15039 EGW_PCM discharge energy @
PCMTemp=60°C: 13320 12085 13434 13013 11733 13897 12613
Cold Soak Evaluation
For the thermal loss evaluation during a cold soak, the test for the high temperature case was run first. The test plan called for a temperature range from 120°C to 80°C for this test. The PCM charge was performed as during the charge/discharge evaluations, but when the 120°C setpoint temperature was reached (based on the PCMTemp signal), the pump and heater were turned off and the temperature was allowed to stabilize. Due to the thermocouple calibration issue described earlier in this report, the actual start temperature is somewhat uncertain. Although offsets in temperature exist between thermocouples, the temperature changes seem to be quite consistent, as seen in the data presented below for several of the PCMHX temperature data. Therefore, changes in temperature are expected to be quite accurate.
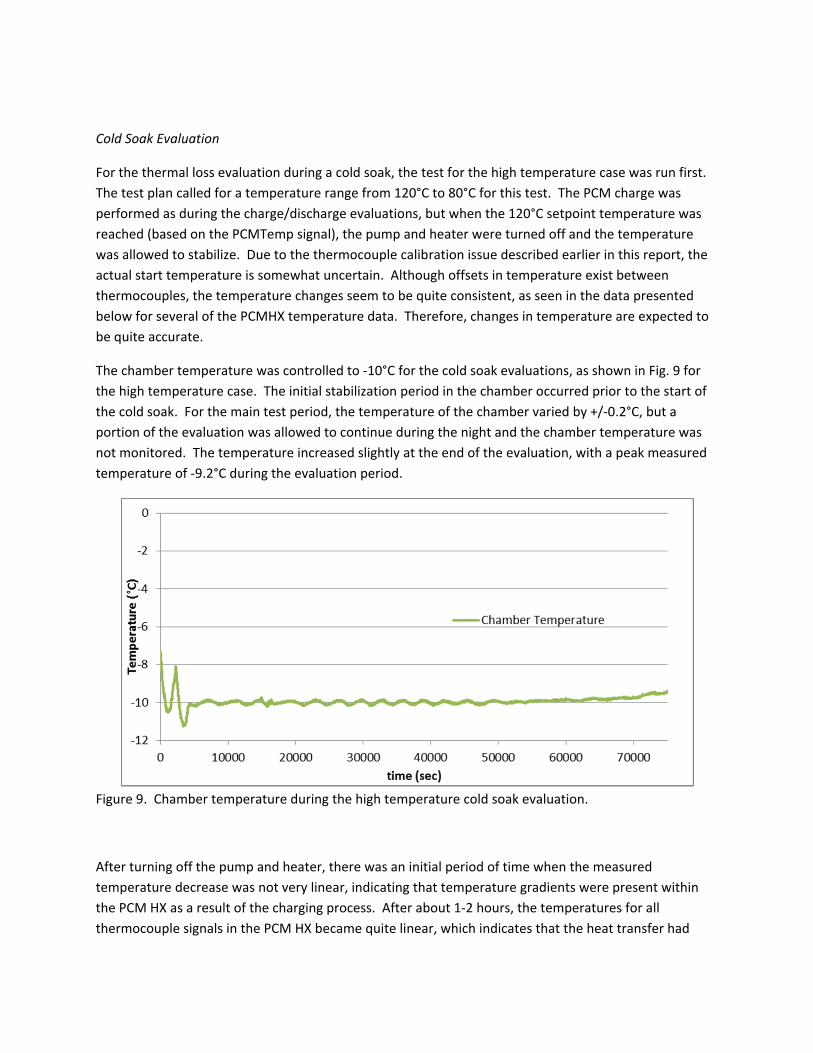
The chamber temperature was controlled to -10°C for the cold soak evaluations, as shown in Fig. 9 for the high temperature case. The initial stabilization period in the chamber occurred prior to the start of the cold soak. For the main test period, the temperature of the chamber varied by +/-0.2°C, but a portion of the evaluation was allowed to continue during the night and the chamber temperature was not monitored. The temperature increased slightly at the end of the evaluation, with a peak measured temperature of -9.2°C during the evaluation period.
Figure 9. Chamber temperature during the high temperature cold soak evaluation.
After turning off the pump and heater, there was an initial period of time when the measured temperature decrease was not very linear, indicating that temperature gradients were present within the PCM HX as a result of the charging process. After about 1-2 hours, the temperatures for all thermocouple signals in the PCM HX became quite linear, which indicates that the heat transfer had

approached a quasi-steady state condition, as expected for the low level heat losses from the PCM HX. A time was selected when the temperatures showed very good linearity and consistency between channels to represent the start of the evaluation. Based on this approach, the temperature range for the evaluation was reduced relative to what was defined in the test plan, although this has no real bearing on the results. The average of all of the PCMHX thermocouple signals is shown along with the signal for PCMHX2 in Fig. 10. The dashed line overlaid on the average temperature curve in the first plot shows the very linear temperature over most of evaluation period. Due to noise in the various thermocouple signals, and possibly due to variations in thermal properties of the PCM and the insulation materials over the temperature range, there was a period in the middle when the average PCM temperature result deviates somewhat from linearity. The impact of this small variation in temperatures on the determination of the cold soak heat loss is believed to be negligible.
The nearly linear temperature decrease throughout the PCM HX indicates that the heat transfer rate from the PCM is nearly constant during the cold soak evaluation. As a result, the calculation of the heat loss is very straightforward. We used thermal properties of the PCM measured in the laboratory (by Entropy Solutions) to calculate the energy loss and compare the heat removed during the cold soak to the total energy storage of the PCM. The performance target for the ePATHS is to have heat losses less than 10% of the total energy storage. For the high temperature cold soak evaluation, the energy loss rate is calculated to be 1.01%/hour of the total design energy storage capacity, which would result in a total loss of about 8.1% of the available energy during an 8 hour cold soak. As mentioned previously, this is an upper bound for the energy loss during the cold soak, but it indicates that the ePATHS is expected to meet the performance goal for heat loss during cold soak even if the cold soak takes place immediately after charging the PCM to its highest operating temperature. Table 2 shows the material property and measurement data used in the calculation.
Table 2. High temperature cold soak results: Cooling from 100 to 72.6°C
temperature change (°C) 27.41 time, hrs. 14.77 total energy storage, kJ (120-50°C) for 20kg PCM 11418.6 energy loss, kJ (based on 18.2 kg actual PCM mass) 1701.0 % energy loss/hour 1.01% % loss expected during 8 hour cold soak 8.07%
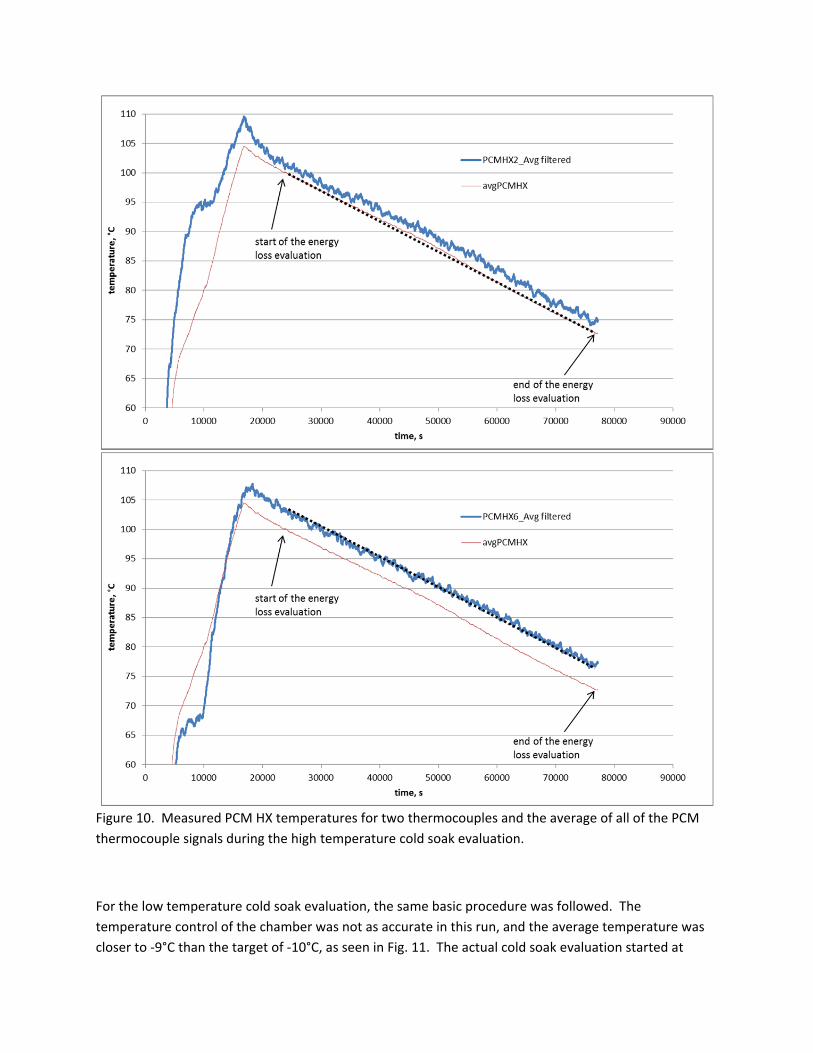
Figure 10. Measured PCM HX temperatures for two thermocouples and the average of all of the PCM thermocouple signals during the high temperature cold soak evaluation.
For the low temperature cold soak evaluation, the same basic procedure was followed. The temperature control of the chamber was not as accurate in this run, and the average temperature was closer to -9°C than the target of -10°C, as seen in Fig. 11. The actual cold soak evaluation started at

11000 seconds, so the initial variations while the chamber temperature stabilized did not take place during the main evaluation.
Figure 11. Chamber temperature during the low temperature cold soak evaluation.
As in the high temperature cold soak, the initial non-linear portion of the temperature signals was not used in the evaluation, and only the quasi-steady period after the temperature profile stabilized was used. This resulted in a temperature range for the average PCMHX thermocouple signals from 58.6 to 55.2°C during the cold soak evaluation. Figure 12 shows two individual thermocouple signals and the average of the temperatures from all thermocouples. The dashed line was drawn parallel to the average PCMHX curve and was used to identify when the individual signals were stabilized so that their temperature variations decreased at the same rate as the entire PCM HX.

Figure 12. Measured PCM HX temperatures for two thermocouples and the average of all of the PCM thermocouple signals during the low temperature cold soak evaluation.
Based on the quasi-steady heat transfer from the PCM HX, the heat transfer rate was calculated using the same method described previously. The final result is that about 0.51% of the energy was removed per hour during the low temperature cold soak, which extrapolates to an estimated 4.1% of the total stored energy being lost during an 8 hour cold soak, as shown in Table 3. This heat loss is considerably lower than the 10% goal, and is only about half of the heat transfer rate determined from the high temperature cold soak evaluation. The improved performance is probably due to the behavior of the vacuum insulation panel (VIP) system used for the PCM HX enclosure. These systems are known to

perform much better at low temperatures since increased temperature causes a pressure rise that increases the thermal conductance through the VIP.
Table 3. Low temperature cold soak results: 58.6 to 55.2°C
temperature change (°C) 3.34 time, hrs. 3.09 total energy storage, kJ (120-50°C) for 20kg PCM 11418.6 energy loss, kJ (based on 18.2 kg actual PCM mass) 181.1 % energy loss/hour 0.51% % loss expected during 8 hour cold soak 4.11%
As noted above, the chamber temperature was approximately -9°C for this test, as opposed to the -10°C target ambient temperature. This results in a decreased potential associated with the heat transfer through the insulation. The temperature difference from the PCM to the ambient is about 65°C, so the 1°C variation represents a relative difference in ΔT of approximately 1.5%, and the heat transfer can be expected to change by roughly this same factor. Therefore, the overall energy loss at -10°C may be closer to 4.2% as opposed to the 4.1% determined from this evaluation, and this difference is likely within the experimental uncertainty of the overall evaluation.
Appendix: Test Results for Remaining Conditions Assessed during the ePATHS Evaluations
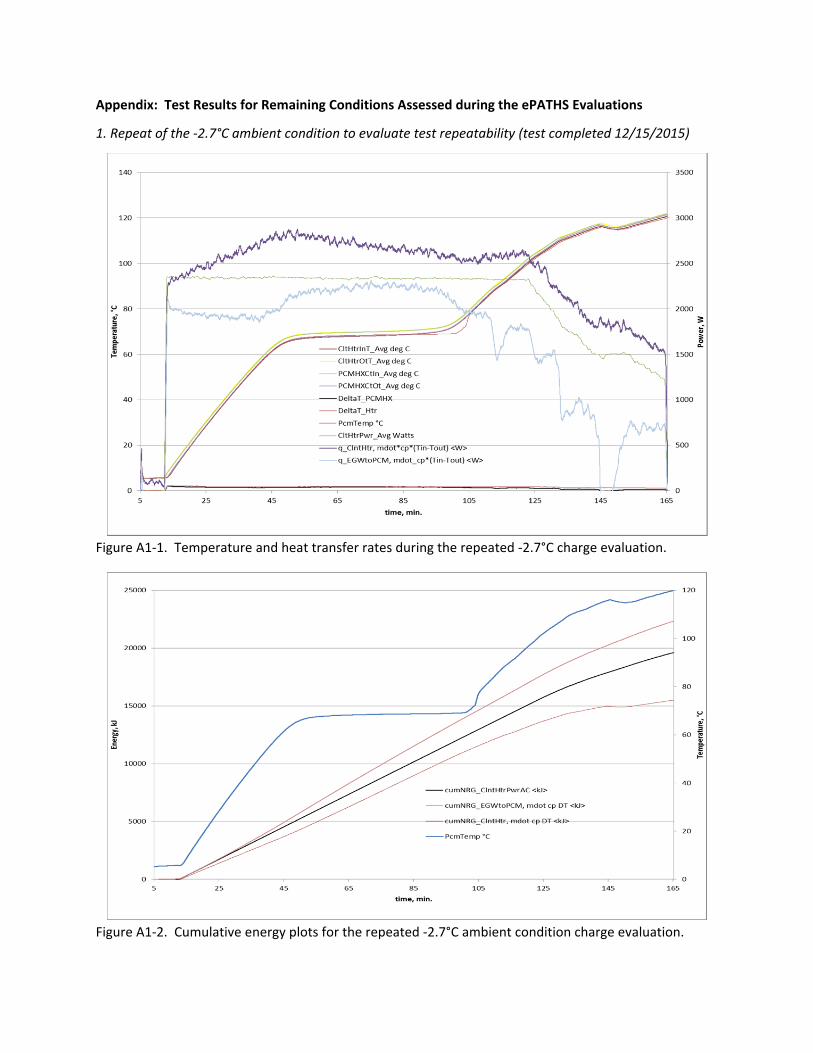
1. Repeat of the -2.7°C ambient condition to evaluate test repeatability (test completed 12/15/2015)
Figure A1-1. Temperature and heat transfer rates during the repeated -2.7°C charge evaluation.
Figure A1-2. Cumulative energy plots for the repeated -2.7°C ambient condition charge evaluation.

Figure A1-3. Heat transfer rates and temperatures for the repeated -2.7°C ambient condition discharge evaluation.
Figure A1-4. Cumulative energy plots for the repeated -2.7°C ambient condition discharge evaluation.

2. Ambient condition: -20°C (test date: 2/5/2016)
Figure A2-1. Temperature and heat transfer rates during the -20°C ambient condition charge evaluation.
Figure A2-2. Cumulative energy plots for the -20°C ambient condition charge evaluation.

Figure A2-3. Heat transfer rates and temperatures for the -20°C ambient discharge evaluation.
Figure A2-4. Cumulative energy plots for the -20°C ambient condition discharge evaluation.

3. Ambient condition: -10°C (test date: 12/21/2015)
Figure A3-1. Temperature and heat transfer rates during the -10°C ambient condition charge evaluation. (This result is anomalous since the flow rate at the end of the test indicated 0.)
Figure A3-2. Cumulative energy plots for the -10°C ambient condition charge evaluation.

Figure A3-3. Heat transfer rates and temperatures for the -10°C ambient discharge evaluation.
Figure A3-4. Cumulative energy plots for the -10°C ambient condition discharge evaluation.
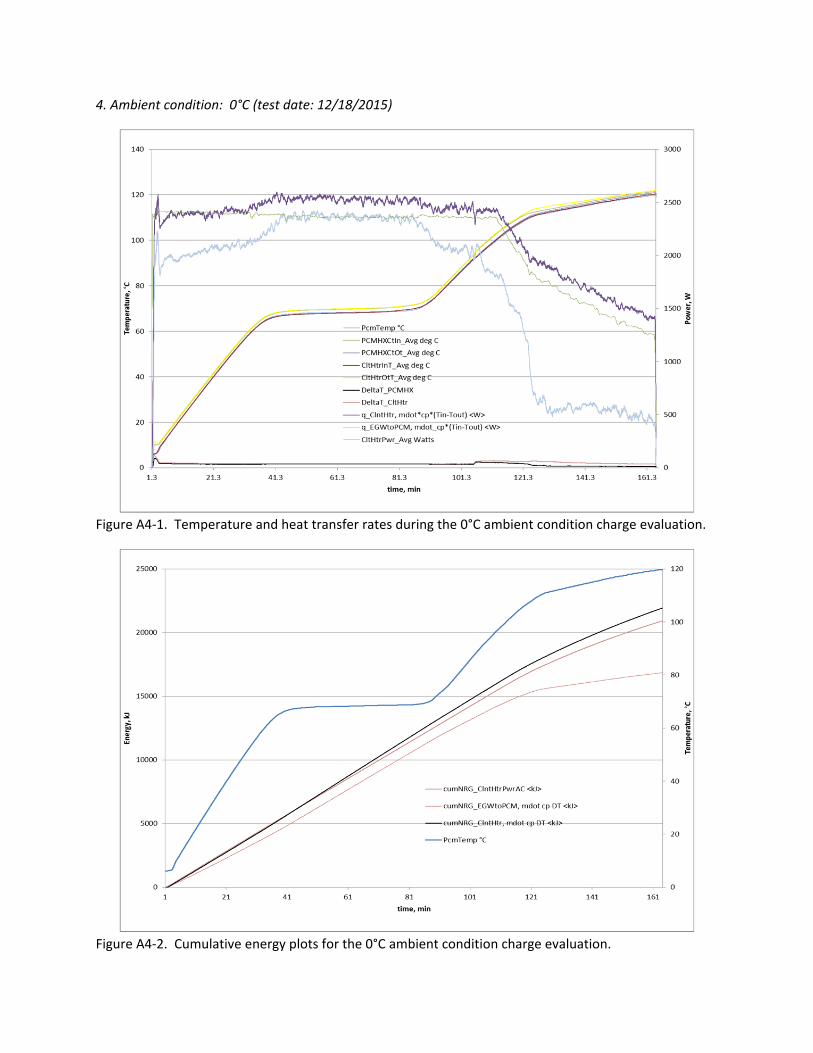
4. Ambient condition: 0°C (test date: 12/18/2015)
Figure A4-1. Temperature and heat transfer rates during the 0°C ambient condition charge evaluation.
Figure A4-2. Cumulative energy plots for the 0°C ambient condition charge evaluation.
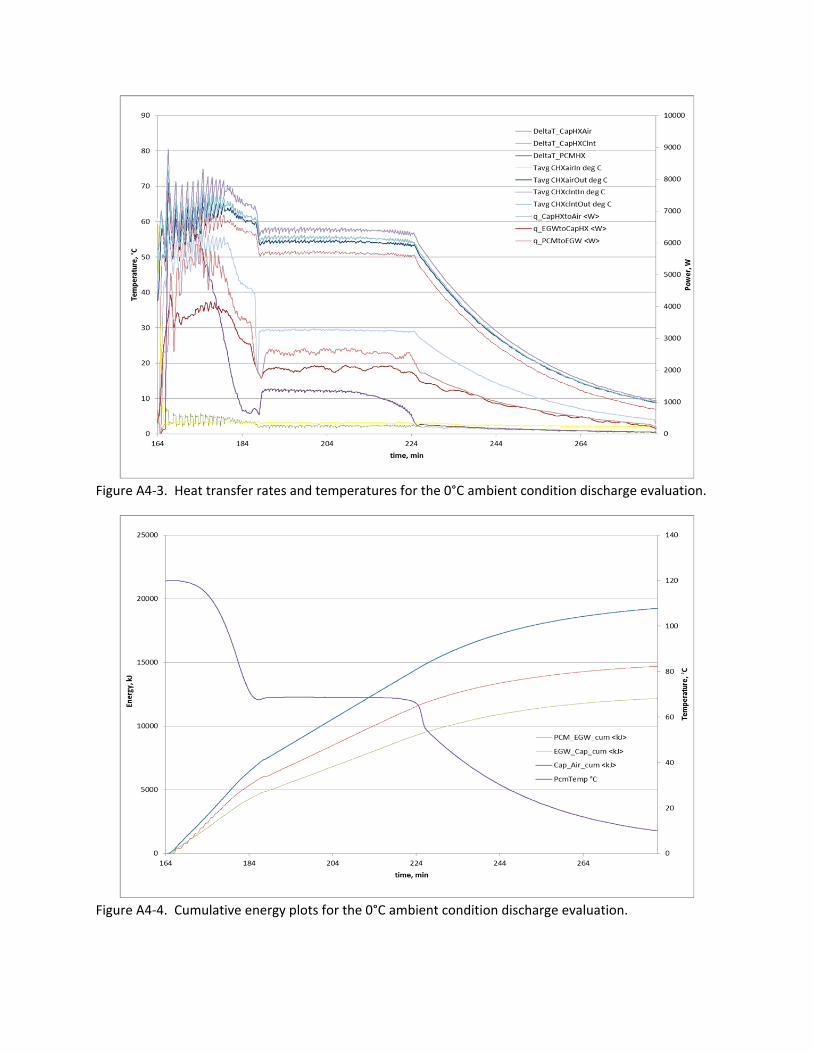
Figure A4-3. Heat transfer rates and temperatures for the 0°C ambient condition discharge evaluation.
Figure A4-4. Cumulative energy plots for the 0°C ambient condition discharge evaluation.

5. Ambient condition: 10°C (test date: 12/16/2015)
Figure A5-1. Temperature and heat transfer rates during the 10°C ambient condition charge evaluation.
Figure A5-2. Cumulative energy plots for the 10°C ambient condition charge evaluation.

Figure A5-3. Heat transfer rates and temperatures for the 10°C ambient condition discharge evaluation.
Figure A5-4. Cumulative energy plots for the 10°C ambient condition discharge evaluation.

6. Ambient condition: 10°C repeat (test date: 12/22/2015)
Figure A6-1. Temperature and heat transfer rates during the repeated 10°C ambient charge evaluation.
Figure A6-2. Cumulative energy plots for the repeated 10°C ambient condition charge evaluation.

Figure A6-3. Heat transfer rates and temperatures for the repeated 10°C ambient discharge evaluation.
Figure A6-4. Cumulative energy plots for the repeated 10°C ambient condition discharge evaluation.