evaluation of an hdpe geomembrane after 14 years as a ... pub/cgj 40(3) 536-550 rowe et al... ·...
TRANSCRIPT

Evaluation of an HDPE geomembrane after14 years as a leachate lagoon liner
R. Kerry Rowe, Henri P. Sangam, and Craig B. Lake
Abstract: A geomembrane – compacted clay composite liner system used to contain municipal solid waste (MSW)landfill leachate for 14 years is evaluated. Field observations of the geomembrane revealed many defects, includingholes, patches, and cracks. Physical, chemical, and mechanical tests conducted on samples collected from five differentlocations of the liner suggest that samples continuously exposed to sunlight and high temperatures experienced moredegradation compared to samples that were covered by leachate or soil. Sorption and diffusion tests revealed that thepermeation coefficients of volatile organic compounds were in the range of 4 × 10–12 to 6 × 10–11 m2/s and that, withrespect to these parameters, there was no significant difference between samples with different exposure levels.However, the permeation coefficients were between four and five times lower than values obtained for unaged HDPEgeomembranes typical of present day production. Contaminant modelling of the entire lagoon liner suggests that thegeomembrane liner most likely stopped being effective as a contaminant barrier to ionic species sometime between0 and 4 years after the installation.
Key words: liquid containment, composite liner, diffusion, HDPE geomembrane, performance.
Résumé : On évalue un système de membrane étanche composite, comprenant une géomembrane et une couched’argile compacte, utilisé pour confiner le lixiviat des enfouissements municipaux solides pour 14 ans. Des observationsde la géomembrane sur le terrain ont révélé plusieurs défauts comprenant des trous, des piéces et des fissures. Desessais physiques, chimiques et mécaniques faits sur des échantillons prélevés de différentes positions sur la membranesuggèrent que les échantillons continuellement exposés aux rayons solaires et aux températures élevées ont subi plus dedégradations par rapport aux échantillons qui étaient couverts de lixiviat ou de sol. Des essais de sorption et de diffu-sion ont révélé que les coefficients de percolation des composés organiques volatiles étaient de l’ordre de 4 × 10–12 à6 × 10–11 m2/s et que, en ce qui concerne ces paramètres, il n’y avait pas de différence significative entre les échantil-lons ayant différents niveaux d’exposition. Cependant, les coefficients de percolation étaient entre 4 à 5 fois plusfaibles que les valeurs obtenues pour les géomembranes HDPE non vieillies typiques de la fabrication actuelle. Lamodélisation du contaminant de l’entière membrane étanche du bassin suggère que la géomembrane a arrêté trèsprobablement d’être efficace comme barrière de contaminant aux espèces ioniques quelque part entre 0 à 4 ans aprèsl’installation.
Mots clés : confinement de liquide, membrane composite, diffusion, géomembrane HDPE, performance.
[Traduit par la Rédaction] Rowe et al. 550
Introduction
The use of a geomembrane in conjunction with compactedclay has been widely accepted as a composite liner systemfor modern landfills and wastewater lagoons (Rowe 2001).The level of understanding associated with the design, selec-tion of materials, construction quality control, and long-term
protection of composite liners has improved considerably inrecent years. The importance of some of these factors canbest be illustrated with reference to case records. Becauseof the relatively short history of high-density polyethylene(HDPE) geomembrane usage in landfill applications, mostof the reported case records are related to their use in liquidcontainment applications (Schmidt et al. 1984; Hsuan et al.1991; Adams and Wagner 2000). Limited cases of HDPEgeomembranes in landfill bottom liner applications found inthe literature have been provided by Rollin et al. (1994) andEith and Koerner (1997).
Issues regarding the hydraulic or diffusive performance ofthe geomembrane liner have not been directly addressed de-spite the fact that the primary function of a geomembrane isto act as a barrier against the migration of landfill leachatecontaminants. Thus, the objective of this paper is to providea case record based on the exhumation of a 14-year-oldgeomembrane from a leachate lagoon. Preliminary data forthis particular case record was presented by Rowe et al.(1998). This investigation expands upon this preliminary in-
Can. Geotech. J. 40: 536–550 (2003) doi: 10.1139/T03-019 © 2003 NRC Canada
536
Received 3 January 2002. Accepted 20 January 2003.Published on the NRC Research Press Web site athttp://cgj.nrc.ca on 1 May 2003.
R.K. Rowe1 and H.P. Sangam.2 GeoEngineering Centre atQueen’s–RMC, Department of Civil Engineering, Queen’sUniversity, Kingston, ON K7L 3N6, Canada.C.B. Lake. Department of Civil Engineering, DalhousieUniversity, Sexton Campus, 1360 Barrington Street, Halifax,NS B3J 1Z1, Canada.
1Corresponding author (e-mail: [email protected]).2Present address: SNC-Lavalin Engineers & Constructors,2200 Lake Shore Blvd., Toronto, ON M8V 1A4, Canada.
I:\cgj\CGJ40-03\T03-019.vpMonday, April 28, 2003 2:11:27 PM
Color profile: Generic CMYK printer profileComposite Default screen

formation and examines (a) the difference in geomembraneproperties that can arise from different exposure conditions,and (b) the influence of such exposure on the effectivenessof the geomembrane as a barrier to contaminant migration.
The lagoon
The leachate lagoon discussed in this study began to col-lect leachate in 1982 and was subsequently decommissionedafter 14 years of service. Decommissioning was required torelocate the lagoon as part of ongoing landfill expansion.The lagoon was at a location in Ontario, Canada where theaverage temperatures during the winter and the summerwere 1 and 25°C, respectively, and the latitude and longitudewere 43°06′00′′ N and 79°04′00′′ W, respectively. The lagoonhad a storage capacity of approximately 2500 m3 with sideslopes of 3H:1V.. It had been used to store leachate gener-ated from a nonhazardous industrial, municipal, and com-mercial landfill. The leachate contained typical inorganicconstituents, including transition and heavy metals (seeTable 1). Volatile organic compounds were infrequentlyobserved during the monitoring program, probably becauseof the nature of the waste in the landfill and (or) their vola-tilization during lagoon aeration.
The lagoon liner system consisted of a smooth 1.5 mmthick HDPE geomembrane overlying an approximately 3 mthick compacted clay liner constructed from “silty clay” bor-row material obtained from near the landfill site. There wasno protection layer above the geomembrane, which was di-rectly exposed to the leachate and, above the leachate level,to the sunlight and the atmosphere. The original physical,chemical, and mechanical properties of the geomembraneand installation, as well as construction information, werenot available to the authors. The hydrogeological conditionsexisting beneath the lagoon and on the site have beendescribed by Lake (2000).
Field observations of the geomembrane andcompacted clay liner
Geomembrane linerAfter the lagoon was taken out of service, it was drained
to examine the surface of the geomembrane. A significantamount of liquid at the bottom of the lagoon was trapped be-tween the geomembrane and the clay giving the appearanceof a “waterbed”. An odorous black sludge was present at thebottom, especially near the influent pipe system. Accordingto the landfill operators, the geomembrane component of thelagoon liner had a history of problems. During its lifespan,the lagoon had been drained several times to remove sludgeand to patch geomembrane liner defects.
For investigation purposes, the exposed geomembraneliner was divided into five areas (north, east, south, and westside slopes and the bottom of the lagoon) with each of thesefive areas subdivided into 5 m × 5 m grid sections to mapany features such as wrinkles, holes, cracks, and patches onthe liner. Wrinkles were observed in the geomembrane at thetop of the slopes of the lagoon, the diagonal intersection ofside slopes, and at various locations on the bottom.
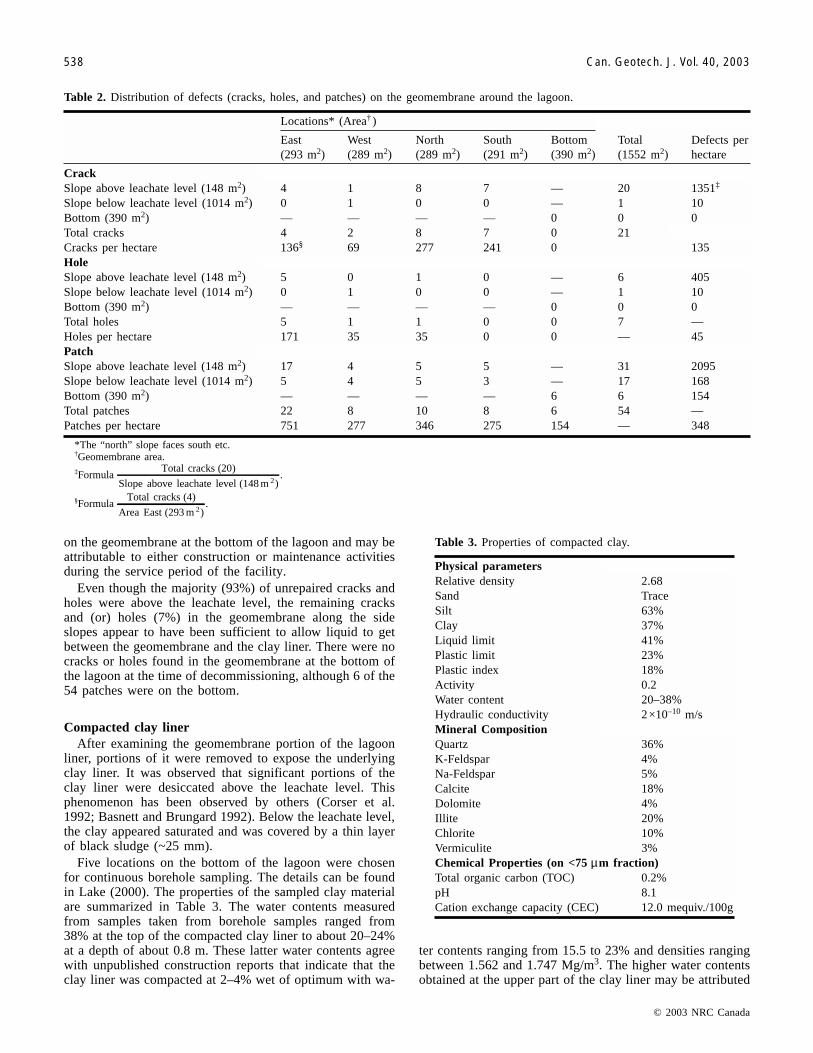
Detailed mapping of the liner revealed many defects(cracks, holes, and patches), as summarized in Table 2.
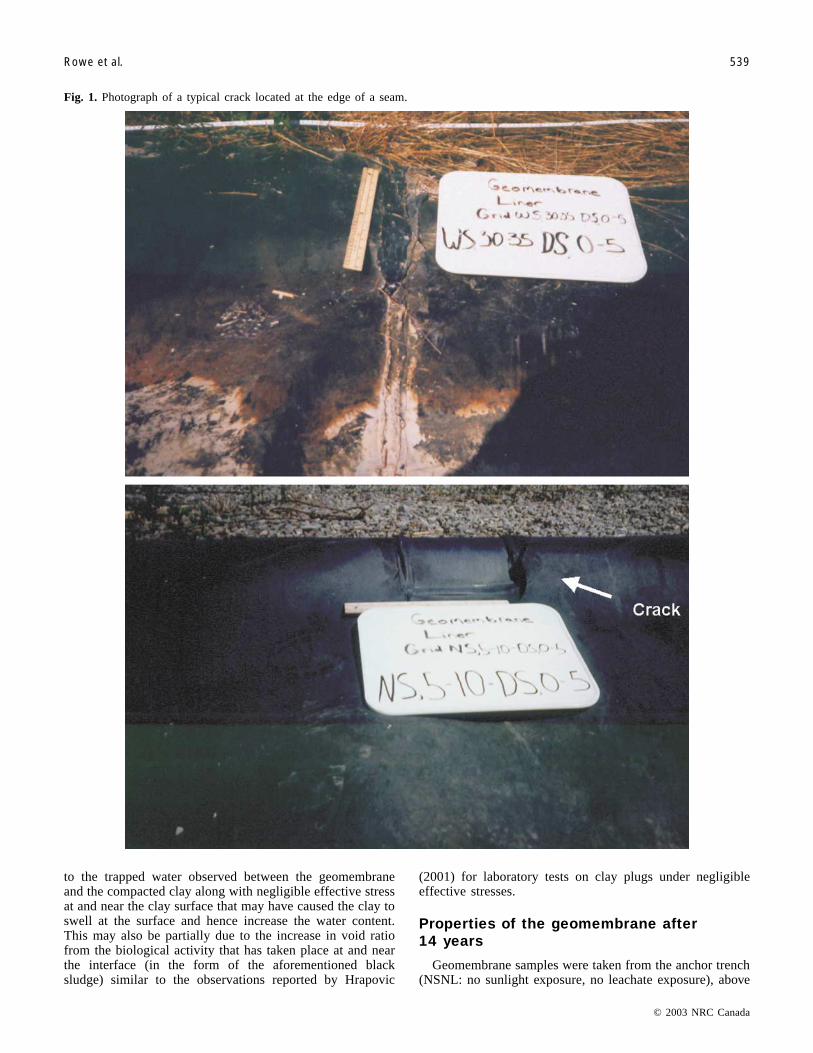
Cracks observed on the slopes where the HDPE geo-membrane liner was not covered by the leachate and hencewas exposed to the sunlight and climate extremes were typi-cally oriented down the slope and located near either seamsor patches. Figure 1 shows a typical crack located near theedge of a seam. The cracks observed at this site were similarto the field observations reported by Peggs and Carlson(1989) and Hsuan (1999) who attributed the cracks to highthermal contraction stresses along the top of the slope adja-cent to the trench where the geomembrane is completelyrestrained from contraction. Some of these cracks were up to30 cm long suggesting a high susceptibility of the geo-membrane to cracking and hence the geomembrane as beingrelatively brittle. As shown in Table 2, four (19%) of the re-ported cracks were on the east, two (10%) on the west, eight(38%) on the north, and seven (33%) were on the southslope. No existing cracks were visible on the bottom. Of thecracks observed, only one was located below the leachatelevel.
Most of the holes recorded were located on the slope por-tion above the leachate level (see Table 2). However, in con-trast to the cracks, the majority of the holes were found onthe east side where the service way was located. A total of54 patches (i.e., repaired former holes or cracks) were alsoobserved on the liner (see Table 2). As with the other defectsalready mentioned, most of the patches (31 of 54) werefound at the upper part of the liner. A few patches wereobserved at the bottom of the liner.
In summary, a total of 82 cracks, holes, and patches hav-ing different forms, patterns, and sizes were observed in thegeomembrane over an area of 1552 m2. This yields an aver-age of 528 defects per hectare over the 14-year period of op-eration. Of these, 70% (348 defects per hectare) were abovethe leachate level and 30% (180 defects per hectare) werebelow the leachate level. Many scratches were also observed
© 2003 NRC Canada
Rowe et al. 537
ParameterMean concentration(mg/L)*
pH (–) 8.08Conductivity (µs/cm) 15 200Total dissolved solids (TDS) 11 300Alkalinity 4 610Hardness 1 040Chemical oxygen demand (COD) 670Biochemical oxygen demand (BOD) 200Cl– 630SO4
2– 3 110Na+ 4 160K+ 300Mg2+ 150NH3-N 170Al 140Fe 1.3Pb 3.3Mn 0.025Phenols 0.24
*Except as otherwise noted.
Table 1. Leachate characteristics from 1989 to 1995(based on Gartner Lee Ltd., 1995).
I:\cgj\CGJ40-03\T03-019.vpMonday, April 28, 2003 2:11:28 PM
Color profile: Generic CMYK printer profileComposite Default screen
on the geomembrane at the bottom of the lagoon and may beattributable to either construction or maintenance activitiesduring the service period of the facility.
Even though the majority (93%) of unrepaired cracks andholes were above the leachate level, the remaining cracksand (or) holes (7%) in the geomembrane along the sideslopes appear to have been sufficient to allow liquid to getbetween the geomembrane and the clay liner. There were nocracks or holes found in the geomembrane at the bottom ofthe lagoon at the time of decommissioning, although 6 of the54 patches were on the bottom.
Compacted clay linerAfter examining the geomembrane portion of the lagoon
liner, portions of it were removed to expose the underlyingclay liner. It was observed that significant portions of theclay liner were desiccated above the leachate level. Thisphenomenon has been observed by others (Corser et al.1992; Basnett and Brungard 1992). Below the leachate level,the clay appeared saturated and was covered by a thin layerof black sludge (~25 mm).
Five locations on the bottom of the lagoon were chosenfor continuous borehole sampling. The details can be foundin Lake (2000). The properties of the sampled clay materialare summarized in Table 3. The water contents measuredfrom samples taken from borehole samples ranged from38% at the top of the compacted clay liner to about 20–24%at a depth of about 0.8 m. These latter water contents agreewith unpublished construction reports that indicate that theclay liner was compacted at 2–4% wet of optimum with wa-
ter contents ranging from 15.5 to 23% and densities rangingbetween 1.562 and 1.747 Mg/m3. The higher water contentsobtained at the upper part of the clay liner may be attributed
© 2003 NRC Canada
538 Can. Geotech. J. Vol. 40, 2003
Locations* (Area† )
East(293 m2)
West(289 m2)
North(289 m2)
South(291 m2)
Bottom(390 m2)
Total(1552 m2)
Defects perhectare
CrackSlope above leachate level (148 m2) 4 1 8 7 — 20 1351‡
Slope below leachate level (1014 m2) 0 1 0 0 — 1 10Bottom (390 m2) — — — — 0 0 0Total cracks 4 2 8 7 0 21Cracks per hectare 136§ 69 277 241 0 135HoleSlope above leachate level (148 m2) 5 0 1 0 — 6 405Slope below leachate level (1014 m2) 0 1 0 0 — 1 10Bottom (390 m2) — — — — 0 0 0Total holes 5 1 1 0 0 7 —Holes per hectare 171 35 35 0 0 — 45PatchSlope above leachate level (148 m2) 17 4 5 5 — 31 2095Slope below leachate level (1014 m2) 5 4 5 3 — 17 168Bottom (390 m2) — — — — 6 6 154Total patches 22 8 10 8 6 54 —Patches per hectare 751 277 346 275 154 — 348
*The “north” slope faces south etc.†Geomembrane area.‡Formula
Total cracks
Slope above leachate level (148 m 2
( )
)
20.
§FormulaTotal cracks (4)
Area East (293 m 2).
Table 2. Distribution of defects (cracks, holes, and patches) on the geomembrane around the lagoon.
Physical parametersRelative density 2.68Sand TraceSilt 63%Clay 37%Liquid limit 41%Plastic limit 23%Plastic index 18%Activity 0.2Water content 20–38%Hydraulic conductivity 2×10⁻¹⁰ m/sMineral CompositionQuartz 36%K-Feldspar 4%Na-Feldspar 5%Calcite 18%Dolomite 4%Illite 20%Chlorite 10%Vermiculite 3%Chemical Properties (on <75 µm fraction)Total organic carbon (TOC) 0.2%pH 8.1Cation exchange capacity (CEC) 12.0 mequiv./100g
Table 3. Properties of compacted clay.
I:\cgj\CGJ40-03\T03-019.vpMonday, April 28, 2003 2:11:28 PM
Color profile: Generic CMYK printer profileComposite Default screen
to the trapped water observed between the geomembraneand the compacted clay along with negligible effective stressat and near the clay surface that may have caused the clay toswell at the surface and hence increase the water content.This may also be partially due to the increase in void ratiofrom the biological activity that has taken place at and nearthe interface (in the form of the aforementioned blacksludge) similar to the observations reported by Hrapovic
(2001) for laboratory tests on clay plugs under negligibleeffective stresses.
Properties of the geomembrane after14 years
Geomembrane samples were taken from the anchor trench(NSNL: no sunlight exposure, no leachate exposure), above
© 2003 NRC Canada
Rowe et al. 539
Fig. 1. Photograph of a typical crack located at the edge of a seam.
I:\cgj\CGJ40-03\T03-019.vpMonday, April 28, 2003 2:11:45 PM
Color profile: Generic CMYK printer profileComposite Default screen

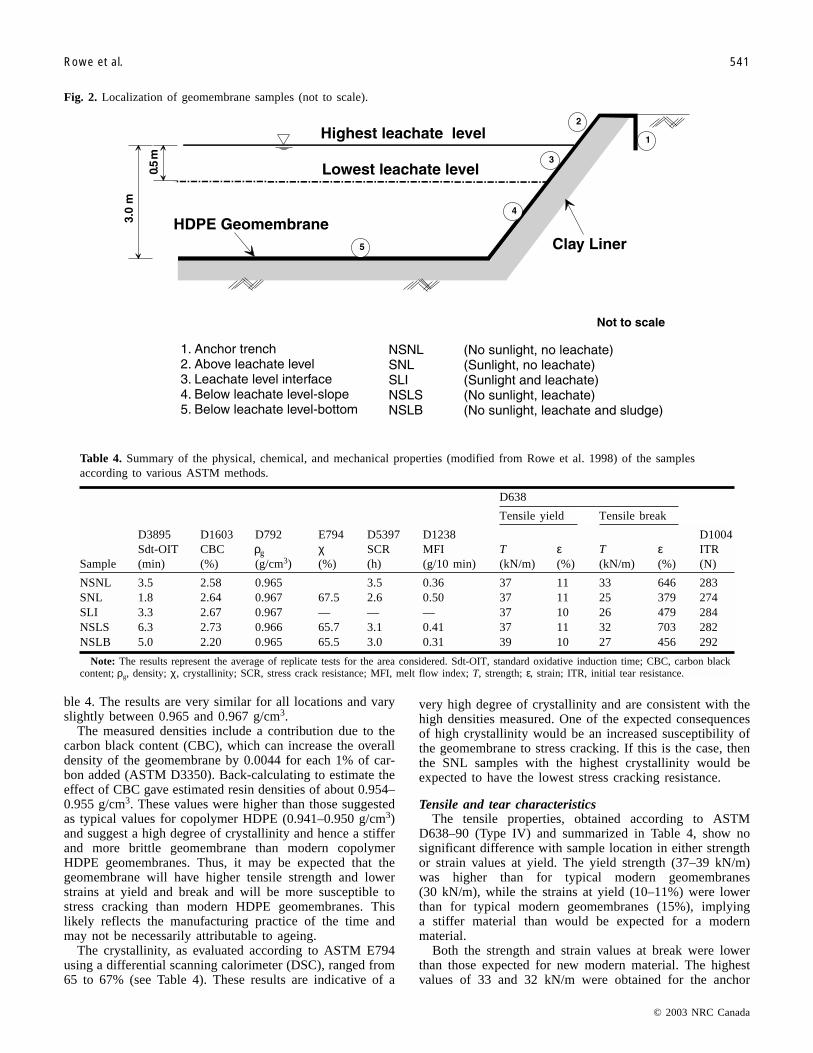
the leachate levels in the lagoon (SNL: sunlight but noleachate exposure), at the leachate level interface (SLI: sun-light and leachate exposure), and below the leachate level(NSL: no sunlight but leachate exposure). Selected sampleswere also taken from the bottom of the lagoon (NSLB:no sunlight but leachate and significant sludge exposure).Figure 2 schematically shows the different locations fromwhich the samples were collected.
ASTM methodsThe following ASTM methods were used to evaluate the
samples:
Geomembrane sheet samples
Oxidative induction time (OIT)The first step of HDPE oxidative degradation is the con-
sumption of the antioxidant used to hinder oxidation of thegeomembrane. The amount of the antioxidant in the geo-membrane is usually evaluated in terms of the oxidativeinduction time (OIT) using either the standard (Std) OIT test(ASTM D3895: 200°C, 35 kPa) or the high pressure (HP)OIT test (ASTM D5885: 150°C, 3500 kPa). A discussion ofthese two test methods has been presented by Hsuan andKoerner (1998).
The OIT values for modern HDPE geomembranes are typ-ically in the range of 100 or more minutes. As shown in Ta-
ble 4, average OIT (standard) values for all exposure condi-tions were very low implying that there were only smallamounts of antioxidant in the geomembrane at the timeof sampling. Of all the sampling locations, those denoted“SNL” were exposed to the greatest amounts of sunlight, thehighest temperatures, and the most abundant amounts ofoxygen. Thus these samples might be expected to have ex-perienced the greatest photo-oxidation (UV) and thermo-oxidation (temperature), and indeed the average OIT of1.8 min (based on 12 tests) was well below that of the otherexposure conditions (see Table 4). The OIT of 1.8 min isclose to the OIT value of 0.5 min measured by Hsuan andKoerner (1998) for an unstabilized (without any antioxidant)HDPE geomembrane, and the possibility that degradationmight already have started in the exposed geomembranecannot be excluded.
The OIT values were slightly higher (5–6 min) for sam-ples below the leachate level (NSLS and NSLB) than forSNL samples, suggesting that more antioxidant remained inthese samples. Factors that can affect antioxidant consump-tion include temperature and the availability of oxygen(Hsuan and Koerner 1998; Sangam 2001). The samples be-low the leachate level would experience the most consistenttemperature and the lowest maximum temperature in theentire liner system. The leachate temperature would remainrelatively constant throughout the year unlike the surfacetemperature, which would vary significantly. Secondly, oxy-gen would not be as abundant in the leachate as in the aireven though the lagoon was aerated.
The SLI samples that had been subjected to intermittentsunlight and leachate exposure had an average OIT of 3 min,which was intermediate between the values obtained for fullsun and full leachate exposure. A similar value was obtainedfor the anchor trench sample (NSNL) that was obtained froma shallow depth (approximately 0.75 m). At this depth, thetemperature would reach 28°C during the summer and, as aconsequence, the degradation would be expected to be fasterthan for samples covered by leachate.
Since the initial OIT of the original material at the time ofinstallation was not available, it was rather difficult to inferthe exact rate at which the antioxidant had been depleted.However, Adams and Wagner (2000) indicated that in the1980s (i.e., the period when the geomembrane being dis-cussed was manufactured and installed), the OIT of HDPEgeomembranes was typically around 50 min (not the typicalvalue of 100 min or more for modern geomembranes). Usingthat value as a basis and assuming that the depletion of anti-oxidants follows the first order decay kinetics as shown byHsuan and Koerner (1995, 1998) and Sangam (2001), it canbe estimated that the depletion of these specific antioxidantspresent in the geomembrane proceeded at approximately0.24 year–1 for the exposed samples and at about 0.15 year–1
for samples covered by the leachate. The depletion ratefor exposed samples compared very well with the rate of0.28 year–1 based on data provided by Hsuan et al. (1991).
Density, carbon black content, and crystallinitySince HDPE is a semicrystalline material, its density may
be related to its degree of crystallinity. The density of fivespecimens cut from each sample was obtained according toASTM D792, and the average values are presented in Ta-
© 2003 NRC Canada
540 Can. Geotech. J. Vol. 40, 2003
ASTM D 883 Standard definitions of terms relating toplastics, Vol. 08.01
ASTM D1004 Standard test method for initial tear resis-tance of plastic film and sheeting,Vol. 08.01
ASTM D1238 Flow rates of thermoplastics by extrusionplastometer, Vol. 08.01
ASTM D1603 Standard test method for carbon black inolefin plastics, Vol. 08.01
ASTM D3350 Standard specification for polyethylene plas-tics pipe and fittings materials, Vol. 08.02
ASTM D3895 Standard test method for oxidative-inductiontime of polyolefins by differential scan-ning calorimetry, Vol. 08.02
ASTM D4437 Standard practice for determining the integ-rity of field seams used in joining flexiblepolymeric sheet geomembranes, Vol. 04.09
ASTM D5397 Standard test method for evaluation of stresscrack resistance of polyolefingeomembranes using notched constanttensile load test, Vol. 04.09
ASTM D5885 Standard test method for oxidative inductiontime of polyolefin geosynthetics by high-pressure differential scanning calorimetry,Vol. 04.09
ASTM D638–90 Standard test method for tensile properties ofplastics, Vol. 08.01
ASTM D792 Standard test methods for density and spe-cific gravity (relative density) of plasticsby displacement, Vol. 08.01
ASTM E794 Standard test method for melting andcrystallization temperatures by thermalanalysis, Vol. 14.02
I:\cgj\CGJ40-03\T03-019.vpMonday, April 28, 2003 2:11:46 PM
Color profile: Generic CMYK printer profileComposite Default screen
ble 4. The results are very similar for all locations and varyslightly between 0.965 and 0.967 g/cm3.
The measured densities include a contribution due to thecarbon black content (CBC), which can increase the overalldensity of the geomembrane by 0.0044 for each 1% of car-bon added (ASTM D3350). Back-calculating to estimate theeffect of CBC gave estimated resin densities of about 0.954–0.955 g/cm3. These values were higher than those suggestedas typical values for copolymer HDPE (0.941–0.950 g/cm3)and suggest a high degree of crystallinity and hence a stifferand more brittle geomembrane than modern copolymerHDPE geomembranes. Thus, it may be expected that thegeomembrane will have higher tensile strength and lowerstrains at yield and break and will be more susceptible tostress cracking than modern HDPE geomembranes. Thislikely reflects the manufacturing practice of the time andmay not be necessarily attributable to ageing.
The crystallinity, as evaluated according to ASTM E794using a differential scanning calorimeter (DSC), ranged from65 to 67% (see Table 4). These results are indicative of a
very high degree of crystallinity and are consistent with thehigh densities measured. One of the expected consequencesof high crystallinity would be an increased susceptibility ofthe geomembrane to stress cracking. If this is the case, thenthe SNL samples with the highest crystallinity would beexpected to have the lowest stress cracking resistance.
Tensile and tear characteristicsThe tensile properties, obtained according to ASTM
D638–90 (Type IV) and summarized in Table 4, show nosignificant difference with sample location in either strengthor strain values at yield. The yield strength (37–39 kN/m)was higher than for typical modern geomembranes(30 kN/m), while the strains at yield (10–11%) were lowerthan for typical modern geomembranes (15%), implyinga stiffer material than would be expected for a modernmaterial.
Both the strength and strain values at break were lowerthan those expected for new modern material. The highestvalues of 33 and 32 kN/m were obtained for the anchor
© 2003 NRC Canada
Rowe et al. 541
Fig. 2. Localization of geomembrane samples (not to scale).
D638
Tensile yield Tensile break
Sample
D3895Sdt-OIT(min)
D1603CBC(%)
D792ρg
(g/cm3)
E794χ(%)
D5397SCR(h)
D1238MFI(g/10 min)
T(kN/m)
ε(%)
T(kN/m)
ε(%)
D1004ITR(N)
NSNL 3.5 2.58 0.965 3.5 0.36 37 11 33 646 283SNL 1.8 2.64 0.967 67.5 2.6 0.50 37 11 25 379 274SLI 3.3 2.67 0.967 — — — 37 10 26 479 284NSLS 6.3 2.73 0.966 65.7 3.1 0.41 37 11 32 703 282NSLB 5.0 2.20 0.965 65.5 3.0 0.31 39 10 27 456 292
Note: The results represent the average of replicate tests for the area considered. Sdt-OIT, standard oxidative induction time; CBC, carbon blackcontent; ρg, density; χ, crystallinity; SCR, stress crack resistance; MFI, melt flow index; T, strength; ε, strain; ITR, initial tear resistance.
Table 4. Summary of the physical, chemical, and mechanical properties (modified from Rowe et al. 1998) of the samplesaccording to various ASTM methods.
I:\cgj\CGJ40-03\T03-019.vpMonday, April 28, 2003 2:11:47 PM
Color profile: Generic CMYK printer profileComposite Default screen

trench samples (NSNL) and the samples from the slope thatwere exposed to leachate (NSLS), respectively. The lowestvalues of 25 and 26 kN/m were measured for samples ex-posed to sun (SNL) and samples from the leachate–sunlightinterface (SLI), respectively. However, a surprising lowvalue of about 27 kN/m was also obtained at the bottom(NSLB). It is hypothesized that this low value is due to thescratched nature of bottom samples, probably induced by themaintenance activities of the lagoon. These results are con-sistent with those reported by Rollin et al. (1994) who ob-served, for a 7-year-old HDPE, an increase of strength atyield and a decrease of both strength and strain at rupture.This behaviour of HDPE geomembranes suggests that thematerial has become brittle, and it would be consistent withageing of the geomembrane.
The initial tear resistance (ITR) of a geomembrane(ASTM D1004) is defined as the load required to initiatetearing of the material. The values obtained for samplesfrom different locations (see Table 4) suggest that the sunexposed (SNL) samples had the lowest ITR and those fromthe bottom of the lagoon had the highest. This contrasts withthe low break strength measured for the sample collectedfrom the bottom of the lagoon that had been scratched. Thisis attributed to the fact that in the ITR test, samples arenotched and therefore are less influenced by surface defects.
Melt flow indexThe molecular weight of the HDPE is related to the melt
flow index (MFI) of the polymer with a low MFI corre-sponding to longer average polymer chains. The MFI valuesobtained (ASTM D1238) from different locations (Table 4)ranged between 0.31 and 0.50 g/10 min, with the lowestvalue corresponding to samples fully covered by leachate(NSLS and NSLB), whereas the exposed samples (SNL) hadthe highest value of 0.50 g/10 min. This, like other evidencediscussed earlier, is consistent with the most exposed (SNL)samples having experienced the greatest degradation (givingrise to the smallest molecular chains) and those near the bot-tom of the lagoon the least degradation. The findings arein stark contrast to the observations made by Hsuan et al.(1991) for a 7-year-old HDPE geomembrane where the low-est MFI was measured for exposed samples.
Stress cracking resistance (SCR)Stress cracking has been defined (ASTM D883) as an ex-
ternal or internal rupture in a plastic caused by a tensilestress less than its short-term mechanical strength. In thepresent investigation, the SCR was assessed by the singlenotched constant load test (SP-NCLT) following the proce-dure described in ASTM D5397. The notch was introducedfrom the exposed side of the geomembrane to minimize sur-face effects such as scratches or any surface degradation.
The SCR, reflected by the failure time given in Table 4,is remarkably low with all specimens failing within 4 hcompared to the 200 h specified for a new modern HDPEgeomembrane (Hsuan and Koerner 1997). Since the SCRdata for the original geomembrane was not available, onecannot assess whether or not the low cracking resistance isdue to ageing. Nevertheless, it is apparent that the exposedgeomembrane had a lower failure time (i.e., more suscepti-ble to stress cracking) than that of the covered samples. This
is consistent with other properties measured (MFI, tensileand initial tear resistance) suggesting that the exposed sam-ples have experienced more degradation than samples fromother locations.
SeamsShear and peel tests (ASTM D4437) were used to evaluate
the quality and the integrity of the seams. In general, asquality control criteria, it is recommended that the ratio be-tween the shear strength of the seam and the tensile strengthof the sheet at yield be greater than 90%, while the peelstrength should be greater than 75% of the sheet strength atyield. Also, the seam strain at break must not be less thanthat of the sheet (ratio greater than 100%). The results of theshear and peel tests performed on five test specimens cutfrom seam samples collected from four different locations(SNL, SLI, NSLS, and NSLB) are summarized in Table 5.
Except for the NSLB sample, the shear strength ratios arebelow today’s typical quality control criteria with values lessthan 70%. The peel test results presented showed very lowseam-sheet strength ratios (<30%) compared to today’s typi-cal quality control criterion of 75%, suggesting either verypoor initial welding or a significant loss of peel strength dur-ing the 14 years of exposure.
Contaminant diffusion through thegeomembrane
Materials and methodsSorption and diffusion tests were conducted on samples
from locations SNL, NSLS, and NSLB (see Fig. 2). Thetests examined seven organic chemicals (Table 6) representa-tive of chlorinated hydrocarbons (dichloromethane (DCM);1,2-dichloroethane (1,2-DCA); and trichloroethylene (TCE))and aromatic hydrocarbons (benzene, toluene, ethylbenzene,and xylenes (BTEX)).
The tests were performed at room temperature (22 ± 2°C)using mixed dilute aqueous solutions with the concentrationof each contaminant at about 5 mg/L. Solution samples col-lected from the cells during the test were analyzed using aVarian gas chromatography – mass spectrometer (GC/MS)consisting of a Saturn 2000 MS and a 3800 GC equippedwith a 8200 CX autosampler used in solid phase micro-extraction (SPME) and headspace modes. The contaminantconcentrations were quantified based on calibration curvesobtained through analysis of standards of known concentra-tions that were regularly prepared during the tests. Detailsregarding the test and the analytical procedure used aregiven in Sangam and Rowe (2001).
In the sorption tests, geomembrane samples were im-mersed in glass cells filled with a mixed dilute solution ofcontaminants. The change in contaminant concentration inthe solution was monitored with time until equilibrium wasreached, and then the partitioning coefficients (Sgf) were de-duced as described by Sangam and Rowe (2001).
The diffusion tests were performed in double glass com-partment cells consisting of a closed system with source andreceptor reservoirs separated by the geomembrane sampleunder investigation as described by Rowe (1998) andSangam and Rowe (2001). During the test, concentrations inboth source (a mixed aqueous solution with each contami-
© 2003 NRC Canada
542 Can. Geotech. J. Vol. 40, 2003
I:\cgj\CGJ40-03\T03-019.vpMonday, April 28, 2003 2:11:48 PM
Color profile: Generic CMYK printer profileComposite Default screen

nant listed in Table 6 at 5 mg/L) and receptor (initially de-ionized distillate water) reservoirs were monitored with timeand the results were plotted as normalized concentrations(i.e., the concentration at a given time divided by the initialsource concentration), as shown in Figs. 3 and 4.
The governing differential equation in these diffusion testscan be expressed as
[1]∂∂
∂∂
c
tD
c
zg
gg
2=
2
where Dg is the diffusion coefficient of the geomembrane[L2T–1], cg is the concentration of diffusing substance in thegeomembrane [ML-3], and z is the direction of diffusion [L].Since the concentrations (cf) in the reservoir are monitored,then the flux, f [ML–2T–1], associated with the process canbe written as (Rowe 1998; Sangam and Rowe 2001)
[2] f S Dcz
Pcz
= − = −gf gf
gfd
ddd
where Pg [L2T–1], referred to as the permeation coefficient,is a contaminant mass transfer coefficient and Sgf [–] is thepartitioning coefficient of the contaminant between the geo-membrane and the adjacent fluid and is dependent upon thechemical–geomembrane system.
The tests were analyzed following the procedure de-scribed in detail by Rowe et al. (1995a) using the finite layeranalysis program POLLUTE© v6.3.6 (Rowe et al. 1999) thatspecifically allows the modelling of the phase change andthe boundary conditions in these tests.
Test results
Sorption testPartitioning coefficients calculated based on the sorption
tests are summarized in Table 6 (full test data is given bySangam 2001). For the chlorinated aliphatic compounds ex-amined, TCE has the highest value of Sgf (53–56), followedby DCA with a Sgf of 5–8. The lowest Sgf (3–5) was mea-sured for DCM. For aromatic compounds, the calculated Sgfis the highest for m- and p-xylenes with values between 190
© 2003 NRC Canada
Rowe et al. 543
Yield Break
Strength Strain Strength Strain
Test Sample T (kN/m) % Sheet ε (%) % Sheet T (kN/m) % Sheet ε (%) % SheetType offailure*
Shear SNL 24 65 6 55 24 73 7 2.1 1a, 3b, 1cSLI 20 54 3 27 20 80 3 0.6 5bNSLS 25 66 4 36 25 96 5 0.7 1a, 4bNSLB 36 92 7 70 35 130 9 2 4b, 1dSNL 6 16 65 17 1a, 4b
Peel SLI 5 14 10 2 1a, 4bNSLS 4 11 70 10 5bNSLB 10 20 178 39 1a, 3b, 1d
Note: Values are the average of 10 samples tested.*The number denotes the number of failures and the letter denotes the type of failure where: a is a failure in adhesion; b is a
break through the fillet; c is a break at the seam edge (bottom sheet); and d is a break in the bottom sheet.
Table 5. Shear and peel test results on seams collected from different locations (ASTM D4437).
Chemicals Formula
Molarweight(g/mole)
Density(g/cm3)
Molarvolume*(cm3)
Aqueoussolubility†
(mg/L)
Octanol–water(logKow)
Dipolemoment(Debye)
PartitioningcoefficientSgf (–)
Chlorinated hydrocarbonsDichloromethane CH2Cl2 84.93 1.3266 64.02 20 000 1.25 1.60 3–51,2-Dichloroethane C2H4Cl2 98.96 1.2530 78.98 8 690 1.45 1.44 6–8Trichloroethylene C2HCl3 131.39 1.4642 89.74 1 100 2.53 0.77 53–56Aromatic hydrocarbonsBenzene C6H6 78.11 0.8765 89.11 1 780 2.13 0.00 20–24Toluene C7H8 92.14 0.8669 106.28 515 2.79 0.30 57–69Ethylbenzene C8H10 106.17 0.8670 122.46 152 3.13 0.36 130–156m-Xylene C8H10 106.17 0.8642 122.85 162 3.20 0.30 190–216o-Xylene C8H10 106.17 0.8802 120.62 152 3.13 0.63 170–180p-Xylene C8H10 106.17 0.8669 122.47 156 3.18 0.00 190–216
*Calculated based on chemical density and molar weight.†At 20°C.
Table 6. The properties (from Montgomery and Welkom 1990) of organic contaminants and the range of partition-ing coefficients, Sgf, deduced from sorption tests.
I:\cgj\CGJ40-03\T03-019.vpMonday, April 28, 2003 2:11:48 PM
Color profile: Generic CMYK printer profileComposite Default screen

© 2003 NRC Canada
544 Can. Geotech. J. Vol. 40, 2003
and 216, while benzene has the lowest Sgf at about 20–24.Although there was some (relatively small) variability in theresults for a given compound, there was no significant orconsistent difference among the results from the differentsample locations. This may be attributed to the fact that thecrystallinity of the samples was similar at the three locations(with the average ranging from 65.5 to 67.5%).
Diffusion testContaminant concentrations (measured in the source and
the receptor over the 85 days of testing for the SNL sample)obtained for chlorinated hydrocarbons and aromatic hydro-carbons are shown in Figs. 3 and 4, respectively. In theseplots, data points represent the average of triplicate valuesquantified with GC analyses. As previously discussed bySangam and Rowe (2001), in this type of test the decrease inthe source concentration is controlled by the partitioning pa-rameter (Sgf) while the increase in the receptor concentrationis dominated by the permeation coefficient (Pg). The diffu-sion curves were very similar for samples from all locations
Fig. 3. Variation in the chlorinated hydrocarbons in the source and receptor during diffusion tests for sample SNL.
I:\cgj\CGJ40-03\T03-019.vpMonday, April 28, 2003 2:11:48 PM
Color profile: Generic CMYK printer profileComposite Default screen

(SNL, NSLS, and NSLB). Full data for all samples is pro-vided by Sangam (2001).
Of the chlorinated compounds, the greatest (60%) de-crease in the source solution concentration was for TCE (seeFig. 3), which dropped to 40% of the initial concentrationafter 85 days of testing. In contrast, the source concentra-tions of DCM and 1,2-DCA decreased by less than 10%over 85 days. In all cases, there was significant mass transferto the receptor reservoir with the greatest increase being forTCE and the smallest for 1,2-DCA. The fact that the source
concentration for 1,2-DCA decreased more than for DCMbut the receptor increased less provides qualitativeinformation about the sorption and diffusion coefficients,implying higher sorption and lower diffusion for 1,2-DCAthan for DCM since there is greater uptake of 1,2-DCA by the geomembrane but less mass transfer through thegeomembrane and into the receptor.
Figure 4 shows the variation in the concentration of aro-matic hydrocarbons for the SNL sample during the diffusiontest period. From the source data, it can be seen that after
© 2003 NRC Canada
Rowe et al. 545
Fig. 4. Variation in the aromatic hydrocarbons in the source and receptor during diffusion tests for sample SNL.
I:\cgj\CGJ40-03\T03-019.vpMonday, April 28, 2003 2:11:49 PM
Color profile: Generic CMYK printer profileComposite Default screen

85 days of testing, the benzene concentration decreased byabout 30% while that of toluene, o-xylene, and the m- and p-xylenes dropped by about 50, 80, and 85%, respectively.The increase in concentration in the receptor was greatestfor benzene and toluene followed by ethylbenzene, the m-and p-xylenes, and o-xylene.
The theoretical curves generated for each of the com-pounds by solving the governing differential equation sub-ject to the appropriate boundary conditions are also shownas lines in Figs. 3 and 4. By obtaining the best fit to thesource and the receptor concentrations one can deduce thevalues of Sgf and Dg and hence calculated Pg as summarizedin Table 7.
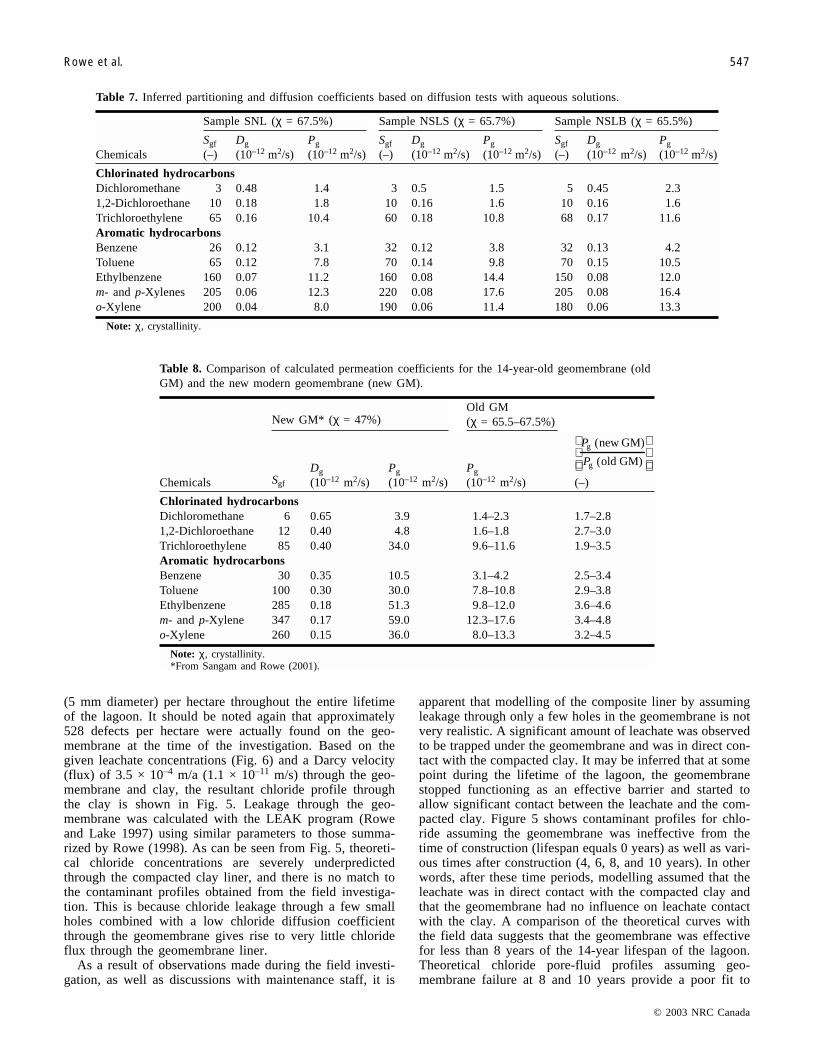
DiscussionThe Sgf values (see Tables 6 and 7) generally increase
with an increase in the n-octanol–water coefficient (logKow)(which indicates the chemical hydrophobicity, and hence theability of the chemical to partition with organic material).The partitioning coefficient varied somewhat from sample tosample in both the sorption (Table 6) and diffusion (Table 7)tests, however, the magnitude of the partitioning was verysimilar for both of the tests.
Comparing the diffusion test results obtained for samplesfrom three different locations (see Table 7), it can be seenthat while there is some small variability there is no consis-tent trend that could be attributed to location or to the smalldifference in crystallinity, and the range of values consideredis more an indication of the variability that can be obtainedamong different samples of similar material in this type oftest.
It is of some interest to compare the diffusion and sorp-tion characteristics of the 14-year-old geomembrane (Ta-ble 7) with those obtained by Sangam and Rowe (2001) foran unaged modern HDPE geomembrane (see Table 8). Theprimary relevant difference between the two geomembranesis the crystallinity (65–68% and 47% for the old and newgeomembranes, respectively). As is evident from Table 8,the permeation coefficient, Pg, is substantially higher for thenew geomembrane than for the old one (by a factor of be-tween 1.7 and 4.8). In fact, the difference in permeationcoefficient between the two geomembranes is compoundspecific with the smallest difference being for DCM (whichhas the lowest molecular volume), and it generally increaseswith increasing molar volume. Benzene and TCE have asimilar molar volume and a similar difference in permeationcoefficients between old and new geomembranes. The great-est difference was for ethylbenzene and xylenes, which allhave a similar molar volume (120.6–122.8 cm3). This ob-served reduction in permeation coefficient may be attributedto the high crystallinity of the samples. As indicated byNaylor (1989) and Rogers (1985), the crystalline zones insemicrystalline polymers act as relatively impermeable barri-ers to the migrating molecules by (1) reducing the sorptiveand diffusive regions, and (2) restraining the mobility of thepolymer molecules required for the accomplishment of thediffusive jump. As a consequence, the segmental mobility ofthe chains required to achieve migration are restrained, andtherefore the diffusion process becomes more dependent onthe size and shape of the migrating molecule (Naylor 1989;Rogers 1985).
Effectiveness of the geomembrane liner
It is well recognized that an intact HDPE geomembrane isan excellent barrier to advective migration as well as anexcellent diffusive barrier against inorganic and polar con-taminants. Chloride is an inorganic ion that has a very lowdiffusion coefficient through HDPE geomembranes (Rowe etal. 1995a). Theoretically, if the HDPE geomembrane exam-ined in this study stayed relatively intact for any length oftime, very little break-through of chloride would be observedin the compacted clay liner. Conversely, if significantamounts of chloride (above background levels) were to bepresent in the compacted clay, this would suggest that thegeomembrane had failed to perform its intended task.
Figure 5 shows the chloride concentration profile throughthe clay liner at the time of the investigation (i.e., after14 years of service) measured from squeezed pore fluid ob-tained from five boreholes drilled into the clay liner. Theprofile shows an apparent back diffusion near the top, proba-bly due to dilution of the leachate present in the bottom ofthe lagoon (rainwater that had accumulated during the onemonth period between decommissioning and the investiga-tion). After 14 years of service, chloride had migrated ap-proximately 1.7 m, which is consistent with expectationsbased on previous field cases in which the leachate was indirect contact with the clay liner (e.g., Rowe et al. 1995b).Although the clay liner appeared to have performed well(there was over 1.0 m of clay below the contaminated zonewith no chloride) in protecting the environment during theservice period, there are still questions about the effective-ness of this particular geomembrane liner in impeding themigration of chloride.
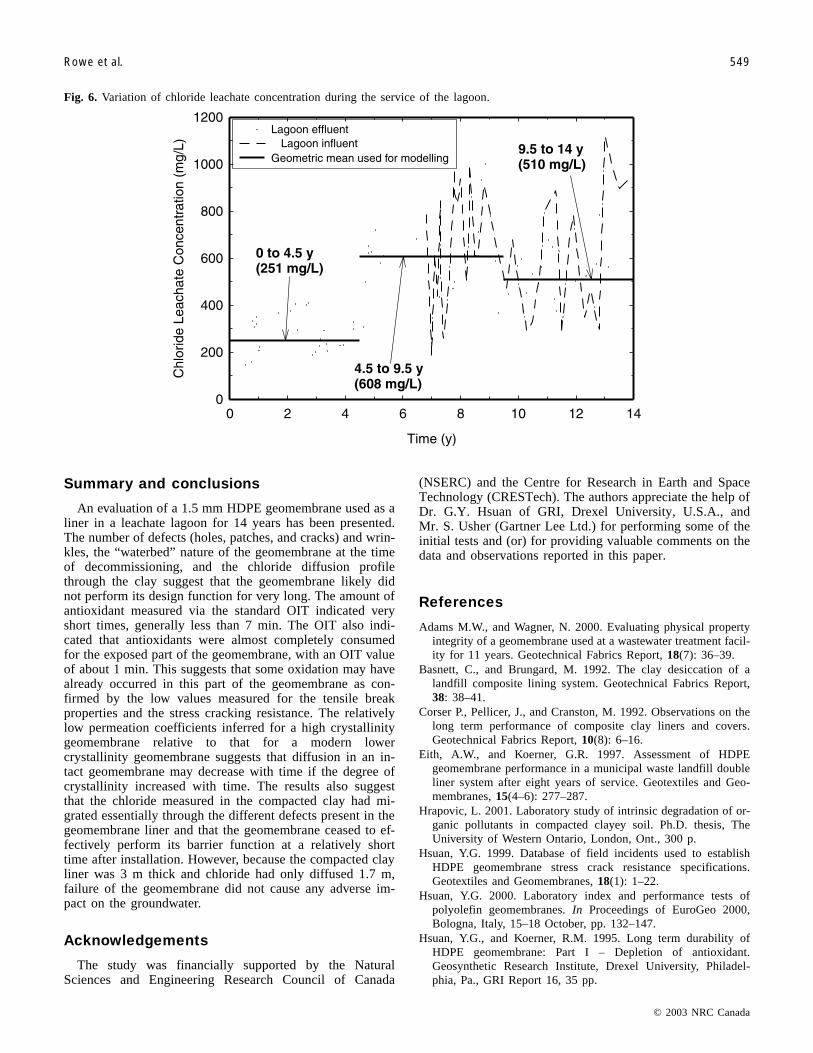
The effectiveness of the geomembrane with respect tocontaminant migration was evaluated via contaminanttransport modelling (using POLLUTE© v6.3.6, Rowe et al.1999). Chloride leachate concentrations as shown in Fig. 6were used to predict chloride pore-fluid concentrationsthroughout the compacted clay based on different assump-tions regarding when the geomembrane failed. Theseprofiles were then compared to chloride pore-fluid concen-trations obtained from the field investigation.
For modelling purposes, the clay liner was subdivided intothree layers (0–0.25, 0.25–0.50, and >0.50 m) with porosi-ties of 0.48, 0.42, and 0.38, respectively, to account for thevariation in water content with depth. The average value ofthe clay hydraulic conductivity (measured using flexiblewall hydraulic conductivity tests with an effective stressranging from 30 to 50 kPa and a gradient across the sampleof 20) was about 2.2 × 10⁻¹⁰ m/s. The chloride diffusion co-efficient for the clay measured in the laboratory was about7 × 10–10 m2/s.
Prediction of chloride pore-fluid profiles through the com-pacted clay requires consideration of the effectiveness of thegeomembrane during the lifespan of the lagoon. If the geo-membrane was intact (no defects), then chloride pore-fluidconcentrations through the clay should be close to back-ground levels because of the very low diffusion of chloridethrough geomembranes (Rowe 1998). For initial comparisonpurposes, it is interesting to examine the theoretical chloridecontaminant profile through the clay for the unlikely sce-nario that the geomembrane was intact with only 2.5 holes
© 2003 NRC Canada
546 Can. Geotech. J. Vol. 40, 2003
I:\cgj\CGJ40-03\T03-019.vpMonday, April 28, 2003 2:11:49 PM
Color profile: Generic CMYK printer profileComposite Default screen
(5 mm diameter) per hectare throughout the entire lifetimeof the lagoon. It should be noted again that approximately528 defects per hectare were actually found on the geo-membrane at the time of the investigation. Based on thegiven leachate concentrations (Fig. 6) and a Darcy velocity(flux) of 3.5 × 10⁻⁴ m/a (1.1 × 10⁻¹¹ m/s) through the geo-membrane and clay, the resultant chloride profile throughthe clay is shown in Fig. 5. Leakage through the geo-membrane was calculated with the LEAK program (Roweand Lake 1997) using similar parameters to those summa-rized by Rowe (1998). As can be seen from Fig. 5, theoreti-cal chloride concentrations are severely underpredictedthrough the compacted clay liner, and there is no match tothe contaminant profiles obtained from the field investiga-tion. This is because chloride leakage through a few smallholes combined with a low chloride diffusion coefficientthrough the geomembrane gives rise to very little chlorideflux through the geomembrane liner.
As a result of observations made during the field investi-gation, as well as discussions with maintenance staff, it is
apparent that modelling of the composite liner by assumingleakage through only a few holes in the geomembrane is notvery realistic. A significant amount of leachate was observedto be trapped under the geomembrane and was in direct con-tact with the compacted clay. It may be inferred that at somepoint during the lifetime of the lagoon, the geomembranestopped functioning as an effective barrier and started toallow significant contact between the leachate and the com-pacted clay. Figure 5 shows contaminant profiles for chlo-ride assuming the geomembrane was ineffective from thetime of construction (lifespan equals 0 years) as well as vari-ous times after construction (4, 6, 8, and 10 years). In otherwords, after these time periods, modelling assumed that theleachate was in direct contact with the compacted clay andthat the geomembrane had no influence on leachate contactwith the clay. A comparison of the theoretical curves withthe field data suggests that the geomembrane was effectivefor less than 8 years of the 14-year lifespan of the lagoon.Theoretical chloride pore-fluid profiles assuming geo-membrane failure at 8 and 10 years provide a poor fit to
© 2003 NRC Canada
Rowe et al. 547
Sample SNL (χ = 67.5%) Sample NSLS (χ = 65.7%) Sample NSLB (χ = 65.5%)
ChemicalsSgf
(–)Dg
(10–12 m2/s)Pg
(10–12 m2/s)Sgf
(–)Dg
(10–12 m2/s)Pg
(10–12 m2/s)Sgf
(–)Dg
(10–12 m2/s)Pg
(10–12 m2/s)
Chlorinated hydrocarbonsDichloromethane 3 0.48 1.4 3 0.5 1.5 5 0.45 2.31,2-Dichloroethane 10 0.18 1.8 10 0.16 1.6 10 0.16 1.6Trichloroethylene 65 0.16 10.4 60 0.18 10.8 68 0.17 11.6Aromatic hydrocarbonsBenzene 26 0.12 3.1 32 0.12 3.8 32 0.13 4.2Toluene 65 0.12 7.8 70 0.14 9.8 70 0.15 10.5Ethylbenzene 160 0.07 11.2 160 0.08 14.4 150 0.08 12.0m- and p-Xylenes 205 0.06 12.3 220 0.08 17.6 205 0.08 16.4o-Xylene 200 0.04 8.0 190 0.06 11.4 180 0.06 13.3
Note: χ, crystallinity.
Table 7. Inferred partitioning and diffusion coefficients based on diffusion tests with aqueous solutions.
New GM* (χ = 47%)Old GM(χ = 65.5–67.5%)
Chemicals Sgf
Dg
(10–12 m2/s)Pg
(10–12 m2/s)Pg
(10–12 m2/s)
P
Pg
g
new GM
old GM
( )
( )
(–)
Chlorinated hydrocarbonsDichloromethane 6 0.65 3.9 1.4–2.3 1.7–2.81,2-Dichloroethane 12 0.40 4.8 1.6–1.8 2.7–3.0Trichloroethylene 85 0.40 34.0 9.6–11.6 1.9–3.5Aromatic hydrocarbonsBenzene 30 0.35 10.5 3.1–4.2 2.5–3.4Toluene 100 0.30 30.0 7.8–10.8 2.9–3.8Ethylbenzene 285 0.18 51.3 9.8–12.0 3.6–4.6m- and p-Xylene 347 0.17 59.0 12.3–17.6 3.4–4.8o-Xylene 260 0.15 36.0 8.0–13.3 3.2–4.5
Note: χ, crystallinity.*From Sangam and Rowe (2001).
Table 8. Comparison of calculated permeation coefficients for the 14-year-old geomembrane (oldGM) and the new modern geomembrane (new GM).
I:\cgj\CGJ40-03\T03-019.vpMonday, April 28, 2003 2:11:49 PM
Color profile: Generic CMYK printer profileComposite Default screen
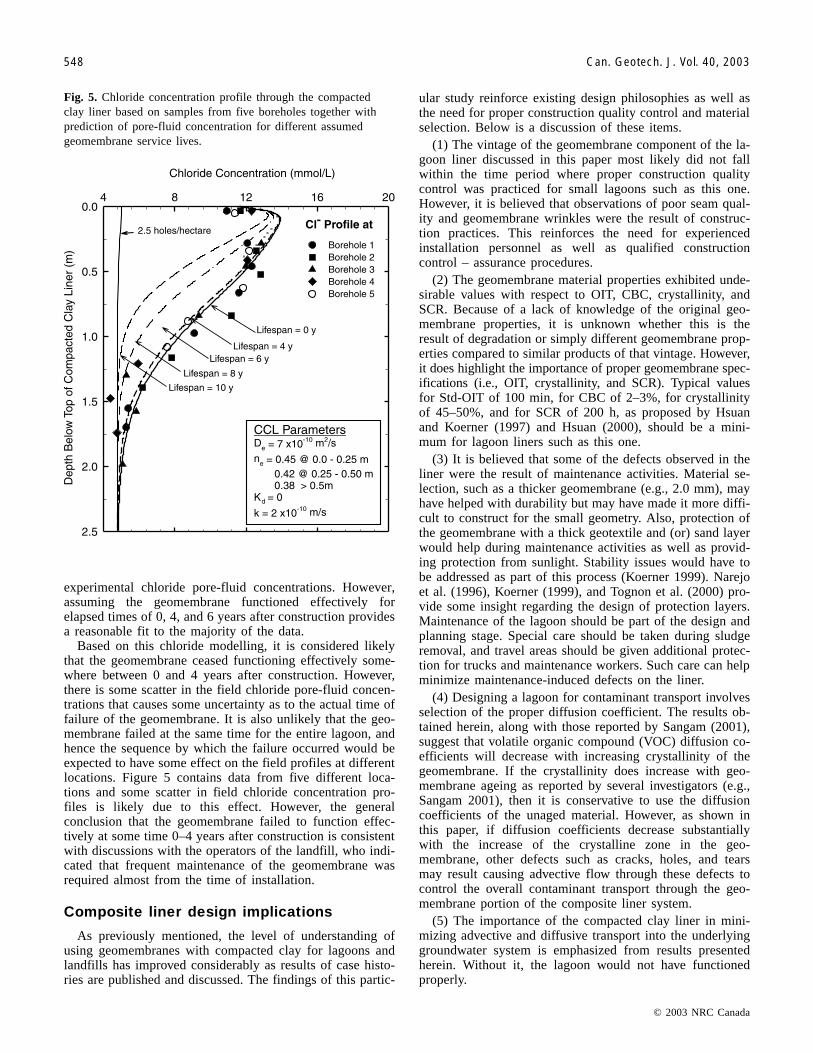
experimental chloride pore-fluid concentrations. However,assuming the geomembrane functioned effectively forelapsed times of 0, 4, and 6 years after construction providesa reasonable fit to the majority of the data.
Based on this chloride modelling, it is considered likelythat the geomembrane ceased functioning effectively some-where between 0 and 4 years after construction. However,there is some scatter in the field chloride pore-fluid concen-trations that causes some uncertainty as to the actual time offailure of the geomembrane. It is also unlikely that the geo-membrane failed at the same time for the entire lagoon, andhence the sequence by which the failure occurred would beexpected to have some effect on the field profiles at differentlocations. Figure 5 contains data from five different loca-tions and some scatter in field chloride concentration pro-files is likely due to this effect. However, the generalconclusion that the geomembrane failed to function effec-tively at some time 0–4 years after construction is consistentwith discussions with the operators of the landfill, who indi-cated that frequent maintenance of the geomembrane wasrequired almost from the time of installation.
Composite liner design implications
As previously mentioned, the level of understanding ofusing geomembranes with compacted clay for lagoons andlandfills has improved considerably as results of case histo-ries are published and discussed. The findings of this partic-
ular study reinforce existing design philosophies as well asthe need for proper construction quality control and materialselection. Below is a discussion of these items.
(1) The vintage of the geomembrane component of the la-goon liner discussed in this paper most likely did not fallwithin the time period where proper construction qualitycontrol was practiced for small lagoons such as this one.However, it is believed that observations of poor seam qual-ity and geomembrane wrinkles were the result of construc-tion practices. This reinforces the need for experiencedinstallation personnel as well as qualified constructioncontrol – assurance procedures.
(2) The geomembrane material properties exhibited unde-sirable values with respect to OIT, CBC, crystallinity, andSCR. Because of a lack of knowledge of the original geo-membrane properties, it is unknown whether this is theresult of degradation or simply different geomembrane prop-erties compared to similar products of that vintage. However,it does highlight the importance of proper geomembrane spec-ifications (i.e., OIT, crystallinity, and SCR). Typical valuesfor Std-OIT of 100 min, for CBC of 2–3%, for crystallinityof 45–50%, and for SCR of 200 h, as proposed by Hsuanand Koerner (1997) and Hsuan (2000), should be a mini-mum for lagoon liners such as this one.
(3) It is believed that some of the defects observed in theliner were the result of maintenance activities. Material se-lection, such as a thicker geomembrane (e.g., 2.0 mm), mayhave helped with durability but may have made it more diffi-cult to construct for the small geometry. Also, protection ofthe geomembrane with a thick geotextile and (or) sand layerwould help during maintenance activities as well as provid-ing protection from sunlight. Stability issues would have tobe addressed as part of this process (Koerner 1999). Narejoet al. (1996), Koerner (1999), and Tognon et al. (2000) pro-vide some insight regarding the design of protection layers.Maintenance of the lagoon should be part of the design andplanning stage. Special care should be taken during sludgeremoval, and travel areas should be given additional protec-tion for trucks and maintenance workers. Such care can helpminimize maintenance-induced defects on the liner.
(4) Designing a lagoon for contaminant transport involvesselection of the proper diffusion coefficient. The results ob-tained herein, along with those reported by Sangam (2001),suggest that volatile organic compound (VOC) diffusion co-efficients will decrease with increasing crystallinity of thegeomembrane. If the crystallinity does increase with geo-membrane ageing as reported by several investigators (e.g.,Sangam 2001), then it is conservative to use the diffusioncoefficients of the unaged material. However, as shown inthis paper, if diffusion coefficients decrease substantiallywith the increase of the crystalline zone in the geo-membrane, other defects such as cracks, holes, and tearsmay result causing advective flow through these defects tocontrol the overall contaminant transport through the geo-membrane portion of the composite liner system.
(5) The importance of the compacted clay liner in mini-mizing advective and diffusive transport into the underlyinggroundwater system is emphasized from results presentedherein. Without it, the lagoon would not have functionedproperly.
© 2003 NRC Canada
548 Can. Geotech. J. Vol. 40, 2003
Fig. 5. Chloride concentration profile through the compactedclay liner based on samples from five boreholes together withprediction of pore-fluid concentration for different assumedgeomembrane service lives.
I:\cgj\CGJ40-03\T03-019.vpMonday, April 28, 2003 2:11:50 PM
Color profile: Generic CMYK printer profileComposite Default screen
Summary and conclusions
An evaluation of a 1.5 mm HDPE geomembrane used as aliner in a leachate lagoon for 14 years has been presented.The number of defects (holes, patches, and cracks) and wrin-kles, the “waterbed” nature of the geomembrane at the timeof decommissioning, and the chloride diffusion profilethrough the clay suggest that the geomembrane likely didnot perform its design function for very long. The amount ofantioxidant measured via the standard OIT indicated veryshort times, generally less than 7 min. The OIT also indi-cated that antioxidants were almost completely consumedfor the exposed part of the geomembrane, with an OIT valueof about 1 min. This suggests that some oxidation may havealready occurred in this part of the geomembrane as con-firmed by the low values measured for the tensile breakproperties and the stress cracking resistance. The relativelylow permeation coefficients inferred for a high crystallinitygeomembrane relative to that for a modern lowercrystallinity geomembrane suggests that diffusion in an in-tact geomembrane may decrease with time if the degree ofcrystallinity increased with time. The results also suggestthat the chloride measured in the compacted clay had mi-grated essentially through the different defects present in thegeomembrane liner and that the geomembrane ceased to ef-fectively perform its barrier function at a relatively shorttime after installation. However, because the compacted clayliner was 3 m thick and chloride had only diffused 1.7 m,failure of the geomembrane did not cause any adverse im-pact on the groundwater.
Acknowledgements
The study was financially supported by the NaturalSciences and Engineering Research Council of Canada
(NSERC) and the Centre for Research in Earth and SpaceTechnology (CRESTech). The authors appreciate the help ofDr. G.Y. Hsuan of GRI, Drexel University, U.S.A., andMr. S. Usher (Gartner Lee Ltd.) for performing some of theinitial tests and (or) for providing valuable comments on thedata and observations reported in this paper.
References
Adams M.W., and Wagner, N. 2000. Evaluating physical propertyintegrity of a geomembrane used at a wastewater treatment facil-ity for 11 years. Geotechnical Fabrics Report, 18(7): 36–39.
Basnett, C., and Brungard, M. 1992. The clay desiccation of alandfill composite lining system. Geotechnical Fabrics Report,38: 38–41.
Corser P., Pellicer, J., and Cranston, M. 1992. Observations on thelong term performance of composite clay liners and covers.Geotechnical Fabrics Report, 10(8): 6–16.
Eith, A.W., and Koerner, G.R. 1997. Assessment of HDPEgeomembrane performance in a municipal waste landfill doubleliner system after eight years of service. Geotextiles and Geo-membranes, 15(4–6): 277–287.
Hrapovic, L. 2001. Laboratory study of intrinsic degradation of or-ganic pollutants in compacted clayey soil. Ph.D. thesis, TheUniversity of Western Ontario, London, Ont., 300 p.
Hsuan, Y.G. 1999. Database of field incidents used to establishHDPE geomembrane stress crack resistance specifications.Geotextiles and Geomembranes, 18(1): 1–22.
Hsuan, Y.G. 2000. Laboratory index and performance tests ofpolyolefin geomembranes. In Proceedings of EuroGeo 2000,Bologna, Italy, 15–18 October, pp. 132–147.
Hsuan, Y.G., and Koerner, R.M. 1995. Long term durability ofHDPE geomembrane: Part I – Depletion of antioxidant.Geosynthetic Research Institute, Drexel University, Philadel-phia, Pa., GRI Report 16, 35 pp.
© 2003 NRC Canada
Rowe et al. 549
Fig. 6. Variation of chloride leachate concentration during the service of the lagoon.
I:\cgj\CGJ40-03\T03-019.vpMonday, April 28, 2003 2:11:50 PM
Color profile: Generic CMYK printer profileComposite Default screen

© 2003 NRC Canada
550 Can. Geotech. J. Vol. 40, 2003
Hsuan, Y.G., and Koerner, R.M. 1997. GRI finalizes its first speci-fication. Geotechnical Fabrics Report, 15(5): 17–20.
Hsuan, Y.G., and Koerner, R.M. 1998. Antioxidant depletion life-time in high density polyethylene geomembranes. Journal ofGeotechnical and Geoenvironmental Engineering, ASCE,124(6): 532–541.
Hsuan, Y.G., Lord, A.E., Jr., and Koerner, R.M. 1991. Effects ofoutdoor exposure on high density polyethylene geomembrane.In Geosynthetics ‘91 Conference Proceedings, Atlanta, Ga.,Industrial Fabrics Association International (IFAI), St. Paul,Minn., pp. 287–302.
Koerner, R.M. 1999. Designing with geosynthetics, 4th ed.,Prentice-Hall Inc., N.J., 761 pp.
Lake, C.B. 2000. Contaminant transport through geosynthetic clayliners and composite liner system. Ph.D. thesis, The Universityof Western Ontario, London, Ont., 408 pp.
Montgomery, J.H., and Welkom, L.M. 1990. Groundwater chemi-cals desk reference, Lewis Publishers Inc., Chelsea, Mich.
Narejo, D.B., Koerner, R.M., and Wilson-Fahmy, R.F. 1996. Punc-ture protection of geomembranes Part II: Experimental.Geosynthetics International, 3(5): 629–653.
Naylor, T.deV. 1989. Permeation properties. In Comprehensivepolymer science. Edited by C. Booth and C. Price. PergamonPress, Oxford, England, Vol. 2, pp. 643–668.
Peggs, I.D., and Carlson, D.S. 1989. Stress cracking of polyethyl-ene geomembrane: Field experience. In Durability and aging ofgeosynthetics. Edited by R.M. Koerner. Elsevier Applied Sci-ence, London, pp. 195–211.
Rogers, C.E. 1985. Permeation of gases and vapors in polymers,Chapter 2. In Polymer permeability. Edited by J. Comyn.Elsevier Applied Science, London, pp. 11–73.
Rollin, A.L., Mlynarek, J., and Zanescu, A. 1994. Performancechanges in aged in-situ HDPE geomembrane. In Landfillingof waste: Barriers, Edited by T.H. Christensen, R. Cossu, andR. Stegmann. E & F N Spon (Routledge) London. pp. 915–924.
Rowe, R.K. 1998. Geosynthetics and the minimization of contaminantmigration through barrier systems beneath solid waste. In Proceed-ings of the 6th International Conference on Geosynthetics, Atlanta,
Ga., 25–29 March. Industrial Fabrics Association International(IFAI), St. Paul, Minn., Vol. 1, pp. 27–103.
Rowe, R.K. 2001. Liner systems, Chapter 25. In Geotechnical andGeoenvironmental Engineering Handbook, Kluwer AcademicPublishing, Norwell, Mass., pp. 739–788.
Rowe, R.K., and Lake, C.B. 1997. Program LEAK — A programfor calculating leakage through holes in a geomembrane in com-posite liners. The University of Western Ontario, London, Ont.
Rowe, R.K., Hrapovic, L., and Kosaric, N. 1995a. Diffusion ofchloride and dichloromethane through an HDPE geomembrane.Geosynthetics International, 2(3): 507–536.
Rowe, R.K., Quigley, R.M., and Booker, J.R. 1995b. Clayey barriersystems for waste disposal facilities. E & FN Spon (Chapman &Hall), London, 390 pp.
Rowe, R.K., Hsuan, Y.G., Lake, C.B., Sangam, P., and Usher, S.1998. Evaluation of a composite (geomembrane/clay) liner for alagoon after 14 years of use. In Proceedings of the 6th Interna-tional Conference on Geosynthetics, Atlanta, Ga., 25–29 March.Industrial Fabrics Association International (IFAI), St. Paul,Minn., Vol. 1, pp. 191–196.
Rowe, R.K., Booker, J.R., and Fraser, J. 1999. POLLUTEv6.3.6 — 1D Pollutant migration through a non-homogeneoussoil.GAEA Technologies Ltd., Whitby, Ont.
Sangam, H.P. 2001. Performance of HDPE geomembrane liners inlandfill applications, Ph.D. dissertation, The University of West-ern Ontario, London, Ont., 394 pp.
Sangam, H.P., and Rowe, R.K. 2001. Migration of dilute aqueousorganic pollutants through HDPE geomembranes. Geotextilesand Geomembranes, 19(6): 329–357.
Schmidt, R.K, Young, C., and Helwitt, J. 1984. Long term fieldperformance of geomembranes — fifteen years experience. InProceedings of the International Conference on Geomembranes,Denver, Colo., Industrial Fabrics Association International(IFAI), St. Paul, Minn., Vol. II, pp. 173–187.
Tognon, A.R., Rowe, R.K., and Moore, I.D. 2000. Geomembranestrain observed in large-scale testing of protection layers. Jour-nal of Geotechnical and Geoenvironmental Engineering,126(12): 1194–1208.
I:\cgj\CGJ40-03\T03-019.vpMonday, April 28, 2003 2:11:51 PM
Color profile: Generic CMYK printer profileComposite Default screen