evaluating the taxonomic status of the great white heron
TRANSCRIPT

Louisiana State UniversityLSU Digital Commons
LSU Historical Dissertations and Theses Graduate School
2001
Evaluating the Taxonomic Status of the GreatWhite Heron (Ardea Herodias Occidentalis) UsingMorphological, Behavioral and Genetic Evidence.Heather Louise McguireLouisiana State University and Agricultural & Mechanical College
Follow this and additional works at: https://digitalcommons.lsu.edu/gradschool_disstheses
This Dissertation is brought to you for free and open access by the Graduate School at LSU Digital Commons. It has been accepted for inclusion inLSU Historical Dissertations and Theses by an authorized administrator of LSU Digital Commons. For more information, please [email protected].
Recommended CitationMcguire, Heather Louise, "Evaluating the Taxonomic Status of the Great White Heron (Ardea Herodias Occidentalis) UsingMorphological, Behavioral and Genetic Evidence." (2001). LSU Historical Dissertations and Theses. 423.https://digitalcommons.lsu.edu/gradschool_disstheses/423
INFORMATION TO USERS
This manuscript has been reproduced from the microfilm master. UMI films the text directly from the original or copy submitted. Thus, some thesis and dissertation copies are in typewriter face, while others may be from any type of computer printer.
The quality of this reproduction is dependent upon the quality of the copy submitted. Broken or indistinct print, colored or poor quality illustrations and photographs, print bleedthrough, substandard margins, and improper alignment can adversely affect reproduction.
In the unlikely event that the author did not send UMI a complete manuscript and there are missing pages, these will be noted. Also, if unauthorized copyright material had to be removed, a note will indicate the deletion.
Oversize materials (e.g.. maps, drawings, charts) are reproduced by sectioning the original, beginning at the upper left-hand comer and continuing from left to right in equal sections with small overlaps.
Photographs included in the original manuscript have been reproduced xerographically in this copy. Higher quality 6a x 9" black and white photographic prints are available for any photographs or illustrations appearing in this copy for an additional charge. Contact UMI directly to order.
ProQuest Information and Learning 300 North Zeeb Road. Ann Arbor, Ml 48106-1346 USA
800-521-0600
Reproduced with permission of the copyright owner. Further reproduction prohibited without permission.

Reproduced with permission of the copyright owner. Further reproduction prohibited without permission.

EVALUATING THE TAXONOMIC STATUS OF THE GREAT WHITE HERON (ARDEA HERODIAS OCCIDENTALIS) USING MORPHOLOGICAL,
BEHAVIORAL AND GENETIC EVIDENCE
A Dissertation
Submitted to the Graduate Faculty of the Louisiana State University and
Agricultural and Mechanical College in partial fulfillment of the
requirements for the degree of Doctor of Philosophy
in
The School o f Forestry, Wildlife, and Fisheries
byHeather L. McGuire
B. A., University of Rochester, 1983 M. A., The College of William and Mary, 1990
December 2001
Reproduced with permission of the copyright owner. Further reproduction prohibited without permission.
UMI Number: 3042639
_______ (f t
UMIUMI Microform 3042639
Copyright 2002 by ProQuest Information and Learning Company. Ail rights reserved. This microform edition is protected against
unauthorized copying under Title 17, United States Code.
ProQuest Information and Learning Company 300 North Zeeb Road
P.O. Box 1346 Ann Arbor, Ml 48106-1346
Reproduced with permission of the copyright owner. Further reproduction prohibited without permission.

ACKNOWLEDGMENTS
This research was supported by an Allan D. and Helen G. Cruickshank Award
from the Florida Ornithological Society, a Research Award from the American
Ornithologists’ Union, and Florida Fish and Wildlife Conservation Commission grant
NG96-025. My graduate study was supported by a Graduate School Fellowship and a
Dissertation Fellowship awarded by the Graduate School at Louisiana State
University. The research was conducted under permits from the Florida Fish and
Wildlife Conservation Commission (WX96214), U.S. Fish and Wildlife Service
(823445), Everglades National Park (1997-0099,1998-0072, and 1999-0133), Key
West and Great White Heron National Wildlife Refuges (96-027.98-016. and 98-
026). and was approved by the Institutional Animal Care and Use Committee at
Louisiana State University (A96-44).
The Burke Museum (University of Washington), the Bell Museum of Natural
History (University of Minnesota), the Field Museum (Chicago), and the Museum of
Natural Science at Louisiana State University (LSUMNS) provided heron tissues for
genetic analysis. I thank the Academy of Natural Sciences of Philadelphia, the
Carnegie Museum of Natural History (Pittsburgh), the Field Museum, the Cleveland
Museum of Natural History, the Museum of Comparative Zoology (Harvard
University), the LSUMNS, and the National Museum of Natural History (Washington,
DC) for access to their bird collections.
I am grateful to James Dame, Dr. Peter Frederick, Becky Hylton, Winslow
McGuire, Melissa Powell, Martin Ruane, Kristina Skarin, and Erin Waggoner for their
help in the field. I thank the members of my dissertation committee - Dr. Frank
ii
Reproduced with permission of the copyright owner. Further reproduction prohibited without permission.

Rohwer (Co-chair), Dr. Frederick Sheldon (Co-chair), Dr. William Kelso, Dr. Cheryl
Hedlund, Dr. J. V. Remsen, and Dr. Mike Stine - for their guidance and support. Dr.
Mohamed A. F. Noor and the people in his lab were extraordinarily generous with
their time, resources, and expertise isolating and analyzing genetic markers. Finally, I
would like to extend special thanks to Laura Quinn and the Florida Keys Wild Bird
Center for providing tissue samples and logistical support in the field.
iii
Reproduced with permission of the copyright owner. Further reproduction prohibited without permission.
TABLE OF CONTENTS
ACKNOWLEDGMENTS.................................................................................................ii
LIST OF TABLES........................................................................................................... vi
LIST OF FIGURES......................................................................................................... vii
ABSTRACT................................................................................................................... viii
INTRODUCTION..............................................................................................................1
CHAPTER 1. Analysis of seven morphological variables measured from museumskins of Great White and Great Blue herons........................................... 9Introduction............................................................................................... 9Methods....................................................................................................13Results......................................................................................................15Discussion.................................................................................................19
CHAPTER 2. Mate choice between sympatric Great White and Great Blue herons.. 22Introduction.............................................................................................22Methods................................................................................................... 23Results..................................................................................................... 26Discussion................................................................................................ 28
CHAPTER 3. Isolation of microsatellite loci in Ardea herodias.................................36Introduction.............................................................................................36Methods................................................................................................... 37Results..................................................................................................... 40Discussion................................................................................................41
CHAPTER 4. Large and small scale geographic patterns of genetic differentiationamong Great White and Great Blue heron populations........................ 44Introduction.............................................................................................44Methods...................................................................................................47Results..................................................................................................... 52Discussion................................................................................................ 55
SUMMARY AND CONCLUSIONS..............................................................................60
LITERATURE CITED.................................................................................................... 65
iv
Reproduced with permission of the copyright owner. Further reproduction prohibited without permission.

APPENDIX A: Morphological variables reported in previous studies of GreatWhite and Great Blue herons................................................................72
APPENDIX B: Raw data (in millimeters) for seven morphological variables measured from museum skins of Great White and Great Blue herons......................................................................................................73
APPENDIX C: Flow charts of statistical procedures used for morphometricanalyses of adult male and female Great White Herons and Great Blue Herons............................................................................................78
APPENDIX D: Tests of ANOVA assumptions (normality and homogeneity of variance) for seven morphological variables measured from museum skins of adult male herons...................................................... 80
APPENDIX E: Tests of t-test assumptions (normality and homogeneity of variance) for seven morphological variables measured from museum skins of adult female herons...................................................81
APPENDIX F: A. herodias microsatellite sequences.....................................................82
APPENDIX G: A. herodias tissue samples used for analysis of geneticdifferentiation at microsatellite loci..................................................... 97
APPENDIX H: Results of tests for independence of loci; Chi-square (X2), degrees of freedom (df) and p-values for each locus pair across all populations........................................................................................... 103
APPENDIX I: Genotypes of the 213 Great White and Great Blue herons used fortests o f population differentiation.......................................................104
APPENDIX J: Allele frequencies at 12 microsatellite loci for six A. herodiasgroups................................................................................................... 113
VITA............................................................................................................................... 117
v
Reproduced with permission of the copyright owner. Further reproduction prohibited without permission.

LIST OF TABLES
Table 1.1: Mean (in millimeters), standard error (SE), and sample size (n) of seven morphological variables measured from museum skins o f adult male herons and p-values for tests of the difference between means....................16
Table 1.2: Mean (in millimeters), standard error (SE), and sample size (n) of seven morphological variables measured from museum skins o f adult female herons. Test statistic (TS), degrees of freedom (df) and p-value for two- tailed tests concerning the difference between means (Ho: p. b-fk = p w- fk)....................................................................................................................17
Table 2.1: Observed (O) and expected (E) values for each pairing categoryexpressed as number of mated pairs and percent of total..............................27
Table 2.2: Number and color of offspring in nests for which adult phenotypes areknown............................................................................................................ 28
Table 2.3: Probability of producing 113 white offspring (Table 2.2) fromwhite/white pairs given different relative proportions of genotype crosses and assuming white plumage is dominant.......................................33
Table 2.4: Possible genotype crosses and percent white offspring expected from these crosses for two hypotheses of color dominance (assuming color is controlled by a single locus) compared with the percent of white offspring (± 95% Cl) observed in nests with known parental phenotypes. 33
Table 3.1: Ardea herodias microsatellite loci and results of cross-speciesamplification in closely related taxa.............................................................42
Table 4.1: A. herodias groups used to examine large scale geographic patterns of genetic differentiation at microsatellite loci and the number of individuals genotyped in each group............................................................47
Table 4.2: Nei’s (1978) unbiased heterozygosity estimate (H) for six A. herodiasgroups at each of 12 microsatellite loci and averaged over all loci............ 54
Table 4.3: Pairwise F st values across all loci (above diagonal). Pairwise R st
values across all loci (below diagonal).........................................................55
Table 4.4: Combined probabilities for exact tests of population differentiation (aafter Bonferroni correction for multiple comparisons = 0.0033)................ 55
Table 4.5: Nei’s (1978) unbiased genetic distance ( D ) for all pairwisecomparisons of six A. herodias groups.........................................................56
vi
Reproduced with permission of the copyright owner. Further reproduction prohibited without permission.

LIST OF FIGURES
Figure 1.1: Distribution of the three Great Blue Heron subspecies found in easternNorth America.............................................................................................. 10
Figure 1.2: Mean values (± 95% Cl) for seven morphological variables measured from museum skins of northern Great Blue Herons (B-N), Great Blue Herons from the Florida Keys (B-FK), and Great White Herons from the Florida Keys (W-FK)..............................................................................18
Figure 2.1: Map of south Florida, including Florida Bay and the Florida Keys 24
Figure 2.2: Great White Heron and Great Blue Heron nests detected in Florida Bay during aerial surveys from October 1995 through October 1997 (Data from Gawlik 1998)....................................................................................... 30
Figure 4.1: Distribution of the four North American Great Blue Heron subspecies that were sampled to evaluate geographic patterns of genetic variation at microsatellite loci.....................................................................................45
vii
Reproduced with permission of the copyright owner. Further reproduction prohibited without permission.

ABSTRACT
The Great White Heron was originally described as a distinct species (Ardea
occidentalis), but is currently considered to be the white morph of a polymorphic
Great Blue Heron subspecies (A. herodias occidentalis). Great White and Great Blue
heron breeding ranges overlap in the Florida Keys (USA), providing an opportunity to
evaluate the degree to which these two taxa are reproductively isolated. The current
classification leads to predictions of no significant size difference (Hoi), random mate
choice (Ho2), and no genetic divergence (Ho3) between sympatric white and blue
herons. Sympatric Great White and Great Blue herons did not differ significantly in
size at any of seven morphological variables. However, the power of these tests was
low, and patterns of mean values were consistent with the hypothesis of a hybrid
origin for Great Blue Herons breeding in the Florida Keys. Mate choice was not
random with respect to plumage color. I observed more white/white and blue/blue
pairs and fewer mixed pairs than expected in a randomly mating population. This
positive assortative pattern suggests that prezygotic reproductive barriers exist within
the Florida Keys population. However, mixed pairs occur and may provide an
opportunity for gene flow between white and blue herons within the Florida Keys or
between the Florida Keys breeding population and other Great Blue Heron
populations. Allele frequencies at 12 nuclear microsatellite loci differed significantly
between the Florida Keys breeding population and Great Blue Herons breeding on the
nearby Florida peninsula. These data suggest that the Florida Keys population is
distinct from other Great Blue Heron populations and that there are barriers to gene
flow between the Florida Keys Great White Heron population and nearby Great Blue
viii
Reproduced with permission of the copyright owner. Further reproduction prohibited without permission.

Heron populations. The Great White Heron appears to be a good biological species
and a review of its taxonomic status is merited. Recruitment from Great Blue Heron
populations does not appear to be an important factor in maintaining the Great White
Heron population. Effective conservation, therefore, will require understanding and
managing the small Florida Keys Great White Heron population as an isolate.
ix
Reproduced with permission of the copyright owner. Further reproduction prohibited without permission.

INTRODUCTION
Conservation biology has emerged as a discipline that seeks to preserve
biological diversity by recognizing evolutionary processes as the foundation for
conservation decisions (Soule and Wilcox 1980, Frankel and Soule 1981). The goal of
conservation biology is to conserve evolutionary potential. Barriers to gene flow
between populations and subsequent genetic differentiation due to natural selection or
genetic drift are the fundamental processes of speciation and, thus, the origin of
biological diversity. Species are the cornerstone of some of the most powerful
environmental legislation ever written (e.g. U.S. Endangered Species Act. Convention
on International Trade in Endangered Species) and remain a galvanizing force behind
most conservation efforts. However, geographically and genetically isolated
populations are of particular interest to the conservation biologist because these
populations have the greatest potential for speciation (Meffe and Carroll 1994).
Many species definitions have been proposed (e.g. biological species,
evolutionary species, phylogenetic species, morphological species, recognition
species, cohesion species, ecological species, genealogical species), but no single
definition works well for all biological organisms. The biological species concept
(BSC) defines species as groups of actually or potentially interbreeding populations
that are reproductively isolated from other such groups (Dobzhansky 1937, Mayr
1942). Although the BSC is one of the most widely used definitions, it has
limitations. It does not apply to organisms that reproduce asexually or to fossil taxa.
It is often difficult to apply to plants because hybridization is common (even between
genera), and many phylogeneticists reject the BSC because it does not necessarily
I
Reproduced with permission of the copyright owner. Further reproduction prohibited without permission.

yield monophyletic species (Quicke 1993, Futuyma 1998). Highly differentiated
populations that never interbreed or undifferentiated populations that interbreed freely
rarely present problems for the BSC. However, there are many cases where the level
of “actual” or “potential” interbreeding is ambiguous and the BSC offers no concrete
rules to govern what level renders two populations conspecific. Many find this to be a
weakness, but it is precisely those cases that present a challenge to the BSC where we
may find the most compelling examples of speciation in progress. Any species
concept can become mired in trivial phenotypic differences among populations. The
criterion of reproductive isolation anchors the BSC to the evolutionary processes that
split a single lineage into two.
Analysis of species with significant among-population variation can provide
insights into evolutionary processes such as adaptation and speciation (Mayr 1942)
and identify unique populations that may require attention as conservation priorities.
Many bird species exhibit geographic variation among populations and are divided
into subspecies based on differences in size, plumage, and geographic distribution.
For example, seven Great Blue Heron (Ardea herodias) subspecies are recognized in
North America (AOU 1957, AOU 1973). Six are composed entirely of individuals
with dark plumage (collectively. Great Blue Heron). Only A. h. occidentalis contains
individuals with all white plumage (Great White Heron). The taxonomic status of the
Great White Heron has been debated for over a century. Unlike the Great Blue Heron,
which is widely distributed throughout North America, the Great White Heron is
restricted to south Florida (USA) and parts of the Caribbean (Stevenson and Anderson
1994). It is extremely rare in the Caribbean (Raffaele et al. 1998) and the largest
i
Reproduced with permission of the copyright owner. Further reproduction prohibited without permission.

known breeding population (approximately 850 breeding pairs) occurs in the Florida
Keys (Powell and Bjork 1996). The debate surrounding the Great White Heron’s
taxonomic status, and the vulnerability of this Florida Keys population to natural
catastrophic events (e.g. hurricanes) and habitat degradation from human activities
motivated my research, which seeks to understand the relationships between Great
White Heron and Great Blue Heron populations.
The Great White Heron was originally described as a distinct species, Ardea
occidentalis, but is currently considered to be the white morph of a polymorphic Great
Blue Heron subspecies, A. herodias occidentalis (AOU 1973). Support for the current
classification stems largely from limited observations of interbreeding between white
and blue herons in the Florida Keys and the existence of a putative hybrid
(Wurdemann's Heron), which has plumage that is clearly intermediate between a
Great White Heron and a Great Blue Heron. Typical Great Blue Heron plumage
includes a white forehead, white crown and white cheeks (which contrast sharply with
a black crest and black occipital plumes), a black breast and belly streaked with white,
and deep bluish-gray wings and back. Wurdemann’s Herons vary considerably, but
they are generally distinguished from Great Blue Herons by an all white head (or
mostly white head streaked with gray or black), white or gray occipital plumes, white
breast and belly streaked with gray or black, and pale bluish-gray wings and back.
Wurdemann’s Heron is not found in other North American Great Blue Heron
populations. It is widely believed to be a hybrid, but has also been regarded as a
distinct species (A. wurdemannii), a light color phase of the Great Blue Heron, or a
dark color phase of the Great White Heron (Holt 1928).
3
Reproduced with permission of the copyright owner. Further reproduction prohibited without permission.

Wurdemann’s Heron is not directly addressed in the 1973 revision of the Great
White Heron’s taxonomic status:
Ardea occidentalis is considered conspecific with A. herodias, a polymorphic species in the West Indies and Caribbean area; the population of the Florida Keys, on additional morphological grounds, is entitled to subspecific rank with the name A. herodias occidentalis......The English species name remains Great Blue Heron, with “Great White Heron” available for the white morph. (AOU 1973)
Although vague, the classification criteria appear to be based primarily on geography
rather than phenotype. Wurdemann’s Heron would, presumably, be considered A. h.
occidentalis because of its geographic distribution (Florida Keys).
Not only is the status of the Wurdemann’s Heron unclear, but accounts conflict
concerning which blue form predominates in the Florida Keys. Holt (1928) and Mayr
(1956) independently examined museum skins of herons collected in breeding
condition from the Florida Keys. They identified all blue individuals as Wurdemann’s
Herons and concluded that few, if any. Great Blue Herons from the Florida peninsula
(belonging to the subspecies A. h. wardi) breed in the Florida Keys. In contrast,
Stevenson and Anderson (1994) stated that there are "apparently no published reports
of the nesting of 2 Wurdemann’s Herons,” implying that Great Blue Herons breeding
in the Florida Keys are something other than Wurdemann’s Herons (presumably A. h.
wardi).
White-dark polymorphism is relatively common in herons. Mock (1978)
identified six species of dichromatic herons (including the Great Blue Heron) in which
adults are either white or dark. A seventh species, the Grey Heron (A. cinerea), is
dark throughout most of its range (Europe, Asia and Africa), but contains an isolated
4
Reproduced with permission of the copyright owner. Further reproduction prohibited without permission.

population of “nearly white” individuals. This population is restricted to small islands
off the coast of Mauritania and has been given subspecific rank (A. c. monicae). A.
herodias and A. cinerea are closely related allopatric species. They have continent
wide distributions and, with two exceptions (A. h. occidentalis and A. c. monicae), are
monochromatic throughout their range. These exceptions may be the result o f similar
evolutionary events (geographic isolation followed by adaptation to local conditions
and phenotypic divergence) and possess attributes that distinguish them from the other
five dichromatic herons.
The Great Blue Heron differs from the other dichromatic herons in at least two
respects. First, although the ratio of white to dark individuals varies among
populations within dichromatic species, both color phases are generally present within
any given population. Great White Herons are almost never found in other North
American Great Blue Heron populations. Second dichromatic species contain few
intermediates. Individuals are usually either all white or uniformly dark. The Florida
Keys population exhibits a wider range o f intermediate plumages than any of the other
dichromatic herons (Mock 1978), and others have suggested that most breeding Great
Blue Herons in Florida Bay have intermediate plumage (Holt 1928. Mayr 1956).
The absence of white individuals in other North American Great Blue Heron
populations and the wide range of blue phenotypes in the Florida Keys population are
more consistent with a hypothesis that south Florida is a contact zone between two
previously isolated taxa rather than a hypothesis that south Florida contains a truly
dichromatic subspecies of the Great Blue Heron (Mayr 1956, Mock 1978, Lazell
1989). The Great White Heron may have diverged from the Great Blue Heron,
5
Reproduced with permission of the copyright owner. Further reproduction prohibited without permission.

perhaps in the Caribbean, during a Pleistocene interglacial when much of the Florida
peninsula was submerged (Mayr 1956, Shinn 1988, Lazell 1989). As sea level
subsided, movement of Great Blue Herons onto the emerging Florida peninsula and
westward expansion of the Great White Heron into the Florida Keys produced a
contact zone where these two taxa currently interbreed. The plumage polymorphism
is probably maintained by immigration of Great Blue Herons into the Florida Keys
and subsequent hybridization with Great White Herons
The importance of mixed pairs and the existence of putative hybrids may have
been overemphasized. A key question is whether white and blue individuals
interbreed freely or only rarely (Mayr 1956). The current classification implies that
reproductive barriers have not accrued between Great White and Great Blue herons,
but there is little evidence to support or refute this assumption. Despite a lively
historical debate regarding the Great White Heron’s taxonomic status (Holt 1928,
Mayr 1956, Meyerriecks 1957, Lazell 1989, Stevenson and Anderson 1994), little
attention has been paid to the relationships between sympatric white and blue herons.
Great White Heron and Great Blue Heron breeding ranges overlap in the Florida Keys.
This sympatry provides an opportunity to study the degree to which these two taxa are
reproductively isolated (if at all).
The challenges imposed on south Florida’s ecosystems by a growing human
population provide compelling reasons to study the Great White Heron, regardless of
how we ultimately classify it (frill species or subspecies). The Great White Heron is
one of the world’s many small endemic populations that persist in remnants of
ecosystems increasingly influenced by surrounding urban, agricultural and recreational
6
Reproduced with permission of the copyright owner. Further reproduction prohibited without permission.

landscapes. It is entirely dependent on troubled south Florida ecosystems, including
Florida Bay, the Florida Keys, and the Florida Everglades. Because of its narrow
geographic distribution, this population is vulnerable to natural catastrophic events
(e.g. hurricanes) and habitat loss or deterioration resulting from human activities. The
discontinuous variation between Great White Herons in the Florida Keys and Great
Blue Herons on the nearby Florida peninsula suggests the presence of reproductive
barriers between these taxa. If reproductive barriers exist between Great White
Herons and Great Blue Herons, conservation of the Great White Heron population will
require that it be viewed and managed as an isolate. For example, if Great White
Heron numbers decline, recruitment from other Great Blue Heron populations would
not be a viable management option. A greater understanding of the relationships
between Great White Herons and Great Blue Herons, therefore, is essential to
formulate an appropriate management scheme for the conservation of this unique
Great White Heron population.
As a first step toward answering the question of whether reproductive barriers
exist between these two taxa. I collected morphological, behavioral, genetic data sets
to evaluate the relationships between Great White Heron and Great Blue Heron
populations. My objectives were to clarify the Great White Heron’s taxonomic status
and provide information that may guide conservation efforts. The current
classification leads to predictions of no significant size differences(Hol), random mate
choice (Ho2), and no genetic divergence (Ho3) between sympatric white and blue
herons. I collected morphometric data from museum specimens to test Hoi and
monitored breeding Great White and Great Blue herons in Florida Bay (Monroe
7
Reproduced with permission of the copyright owner. Further reproduction prohibited without permission.

County, USA) to test Ho2. I compared allele frequencies at 12 nuclear microsatellite
loci and tested for genetic differentiation between Great White Heron and Great Blue
Heron populations (Ho3). Together, these data suggest that the Florida Keys breeding
population is distinct from other Great Blue Heron populations and that there are
barriers to gene flow between the Florida Keys breeding population and nearby Great
Blue Heron populations. Although reproductive isolation does not appear to be
complete. I believe that the Great White Heron is a good biological species and that
these data provide sufficient evidence to merit a review of the Great White Heron’s
taxonomic status. Recruitment from Great Blue Heron populations does not appear to
be an important factor in maintaining the Great White Heron population. Effective
conservation, therefore, will require understanding and managing the Great White
Heron population as an isolate.
8
Reproduced with permission of the copyright owner. Further reproduction prohibited without permission.

CHAPTER 1. Analysis of seven morphological variables measured from museum skins of Great White and Great Blue herons
INTRODUCTION
Although biological species are defined by reproductive isolation, morphology
is often the yardstick by which inferences about species or subspecies boundaries are
made. The Great Blue Heron has been divided into several subspecies, which are
distinguished by differences in size, plumage, and geographic distribution. Although
authors disagree about how many subspecies should be recognized (AOU 1957, AOU
1973. Hancock and Elliott 1978, Eckert 1981, del Hoyo et al. 1992), most
classifications identify three subspecies in eastern North America (Figure 1.1). The
nominate race, Ardea herodias herodias, breeds throughout the mid-Atlantic states
(USA) to Nova Scotia (Canada) and west to northern Montana (USA) and southern
Alberta (Canada). Ardea herodias wardi is distributed throughout the southeastern
and south-central United States, including the southern Florida peninsula. Ardea
herodias occidentalis is restricted to south Florida (Florida Bay and the Florida Keys).
Ardea h. herodias and A. h. wardi are composed entirely of individuals with dark
plumage (“blue”), while Florida’s A. h. occidentalis population contains white and
blue individuals. Other investigators have documented size differences among A. h.
herodias, A. h. wardi and white A. h. occidentalis (Ridgway 1878, Oberholser 1912,
Holt 1928, Mayr 1956. Zachow 1983), but little attention has been given to
morphometric comparisons of white and blue herons from within Florida’s A. h.
occidentalis breeding population. Considering the intensity of the Great White Heron
species debate over the years, this information gap is remarkable.
9
Reproduced with permission of the copyright owner. Further reproduction prohibited without permission.
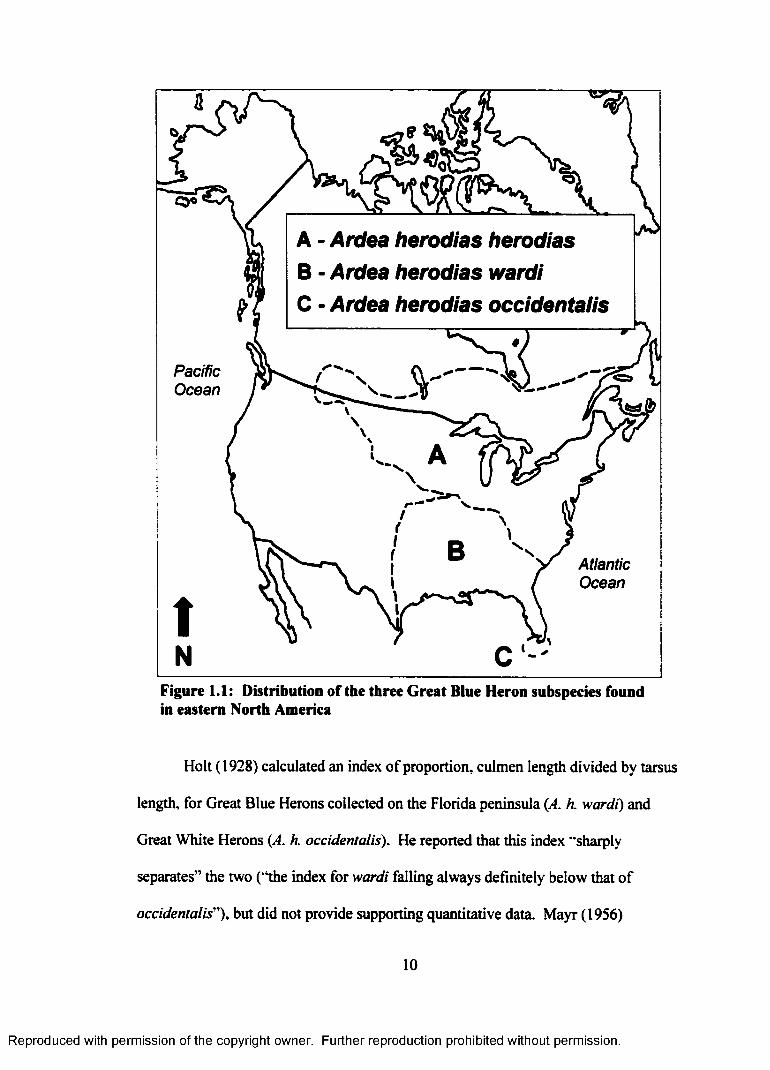
A - Ardea herodias herodias B - Ardea herodias wardi C - Ardea herodias occidentalis
PacificOcean
AtlanticOcean
Figure 1.1: Distribution of the three Great Blue Heron subspecies found in eastern North America
Holt (1928) calculated an index of proportion, culmen length divided by tarsus
length, for Great Blue Herons collected on the Florida peninsula (A. h. wardi) and
Great White Herons (A. h. occidentalis). He reported that this index "sharply
separates” the two ("the index for wardi falling always definitely below that of
occidentalis”), but did not provide supporting quantitative data. Mayr (1956)
10
Reproduced with permission of the copyright owner. Further reproduction prohibited without permission.

presented another index, bill length divided by wing length, for A. h. wardi and white
A. h. occidentalis. Mayr acknowledged that white occidentalis differed from wardi by
an average longer bill, but noted much overlap in the values of this index ( X war(j, =
29.7, n = 14; X occuknmUs = 31.6, n = 11). A t-test of these data show this index is
significantly different between the two groups (Ho: p. wardi ~ P occidentals t = 2.84, d f=
23, p = 0.007). In one of the most thorough treatments, Zachow (1983) found
significant size differences among northern Great Blue Herons (A. h. herodias), Great
Blue Herons from the Florida peninsula (A. h. wardi), and Great White Herons (A. h.
occidentalis). Among these three groups, northern Great Blue Herons were the
smallest. Great Blue Herons from the Florida peninsula were intermediate in size, and
Great White Herons were the largest.
Despite evidence of size differences among A. h. herodias, A. h. wardi. and
white A. h. occidentalis, only one investigator has directly compared white and blue
herons within the Florida Keys breeding population at any morphometric variable.
Occipital plumes, which are normally elongated in adult Great Blue Herons, are
generally reduced or absent in adult Great White Herons. Holt (1928) measured the
longest occipital plume in a small series of Great Blue Herons from the Florida
peninsula and Great White Herons and intermediate Wurdemann’s Herons from the
Florida Keys. Among females, Great Blue Herons from the Florida peninsula had the
longest plumes ( X Blue = 154 mm, n = 4), plumes from Wurdemann’s Herons were
intermediate in size ( X wordemann =137 mm, n = 5), and Great White Herons had the
shortest occipital plumes ( X white= 87.7 mm, n= 11). Among males, occipital plumes
of Great White Herons and Wurdemann’s Herons did not differ in length ( X white=
11
Reproduced with permission of the copyright owner. Further reproduction prohibited without permission.
109.2 mm, n = 11; X wordcmann = 109 mm, n = 5 ) , but both were shorter than plumes of
Great Blue Herons from the Florida peninsula ( X Blue =181 mm, n = 18).
Zachow’s (1983) analysis of skeletal measurements showed that Great Blue
Herons from the Florida peninsula were smaller than Great White Herons. Holt’s
occipital plume data exhibit the opposite trend (Great Blue herons from the Florida
peninsula have longer occipital plumes than Great White Herons) and suggest that
morphometric comparisons may reveal significant size differences between white and
blue herons breeding in the Florida Keys. Together these data suggest that a
morphometric comparison of Great White and Great Blue herons from the Florida
Keys may provide insight into the origin of blue herons breeding in this population.
Extracting appropriate raw data from existing literature, however, is not
possible because no other comparable morphological measurements have been
published for these two groups (Palmer 1962 and Appendix A). I attempted to fill this
information gap by measuring seven morphological variables from museum skins of
Great Blue Herons, Great White Herons, and intermediate Wurdemann’s Herons. My
objectives were to test for size differences between white and blue herons within the
Florida Keys breeding population and, if size differences exist, to determine whether
they are consistent with the hypothesis of a hybrid origin for the intermediate
Wurdemann’s Heron. If size differences exist, then this would suggest that Great
White Herons and Great Blue Herons within the Florida Keys are not a randomly
mating population. The hybrid origin hypothesis would be supported if Wurdemann's
Herons are intermediate in size at all variables measured, regardless of weather an
individual variable is larger in Great Blue Herons or in Great White Herons.
12
Reproduced with permission of the copyright owner. Further reproduction prohibited without permission.

METHODS
Data Collection
I measured seven morphological variables (length of exposed culmen, depth of
bill at base, length o f tarsus, wing chord, length of tail, length of middle toe, and
length of longest occipital plume) from museum skins of herons in the following
groups: northern Great Blue Herons (B-N), Great Blue Herons from the Florida
peninsula (B-FP), and Great White and Great Blue herons from the Florida Keys
breeding population (B-FK, W-FK). The first five variables are commonly reported
for most birds, the length of the middle toe is often reported for herons and other large
birds, and existing data suggest that the longest occipital plume may vary among Great
White Heron and Great Blue Heron populations (Holt 1928).
Ardea h. herodias (B-N) is migratory. Winter ranges overlap with A. h. wardi
(B-FP) and other subspecies to the south (B-FK and W-FK) or west (Palmer 1962,
Eckert 1981). Departures from northern breeding grounds generally begin in mid-
September; returns begin in early February and continue through April (Palmer 1962).
To minimize the possibility of including winter migrants. I restricted the B-FP sample
to Great Blue Herons collected in Florida (excluding the Florida Keys: Monroe
County, FL) during summer, which I defined as 01 April through 30 September.
Selection criteria for B-FK and W-FK included Great Blue Herons collected during
summer in Monroe County, Florida, and Great White Herons and intermediate
Wurdemann’s Herons regardless o f collection date. My selection criteria for B-N
included Great Blue Herons collected within the A. h. herodias subspecies breeding
range regardless of collection date.
13
Reproduced with permission of the copyright owner. Further reproduction prohibited without permission.

I used a ruler to measure the longest occipital plume to the nearest millimeter,
digital calipers to measure depth of bill at base to the nearest 0.1 mm (Baldwin et al.
1931, Proctor and Lynch 1993), a ruler with an upright stop at the zero point to
measure the wing chord to the nearest 0.5 mm (Palmer 1962, Proctor and Lynch
1993), and dividers and a ruler to measure the remaining variables to the nearest 0.5
mm (Baldwin et al. 1931, Proctor and Lynch 1993). For each individual, I measured
each variable at least twice and averaged these measurements to obtain the values
reported in Appendix B.
Because males are larger than females, I analyzed them separately and omitted
birds whose sex was unknown. I did not have a large enough sample of juvenile birds
within any group to adequately test for size differences between adult and juvenile
birds. Therefore, I omitted juvenile birds from subsequent analysis rather than pool
them with adults. Only seven adult Great Blue Herons from the Florida peninsula (3
males. 3 females, I unknown) met my selection criteria. Raw data for these seven
herons are included in Appendix B, but I dropped them from subsequent statistical
analyses because of the small sample sizes.
Statistical Analysis
I analyzed males and females separately for each variable within each group
(B-N, B-FK, and W-FK for males; B-FK and W-FK for females). For each variable, I
calculated descriptive statistics (mean, variance, standard deviation, etc.) and tested
ANOVA and t-test assumptions of normality and homogeneity of variance. I used the
W test for normality (Shapiro and Wilk 1965) to determine whether observations for
each variable within each group were normally distributed. For females, I used an F-
14
Reproduced with permission of the copyright owner. Further reproduction prohibited without permission.

test (Sokal and Rohlf 1995) to test for homogeneity o f variance between groups (Ho:
CT2 B-FK = a 2 w - f k ) . For males, I used Bartlett’s test for homogeneity of variance (Sokal
and Rohlf 1995) to test among groups (Ho: a 2 b -n = cr b - f k = cr2 w - f k ) . I used
appropriate parametric or nonparametric statistics to test for differences between or
among means (Ho females: p b - f k = p w - f k , H o males: p b -n = p b - f k = P w - f k ) . Flow charts
for statistical procedures are shown in Appendix C.
RESULTS
I measured seven morphological variables from a total of 101 Great White and
Great Blue herons (Appendix B). After excluding juvenile birds, birds of unknown
sex, and groups with inadequate sample sizes, my final data set contained 75 herons:
eight male northern Great Blue Herons (B-N), 26 (14 male, 12 female) Great Blue
Herons from the Florida Keys breeding population (B-FK). and 41 (24 male, 17
female) Great White Herons from the Florida Keys breeding population (W-FK). I
did not find any specimens collected from the Florida Keys that met my selection
criteria and had "typical” Great Blue Heron plumage (white cheek and crown, black
crest and occipital plumes, black breast and belly streaked with white, and deep
bluish-gray wings and back). The B-FK group, therefore, contains only intermediate
Wurdemann’s Herons (head all white or white streaked with gray or black, white
breast and belly streaked with gray or black, and pale bluish-gray wings and back).
Results of tests for normality and homogeneity of variance are provided in
Appendix D (males) and Appendix E (females). Descriptive statistics and tests
concerning the difference between means are presented in Table 1.1 (males) and Table
1.2 (females).
15
Reproduced with permission of the copyright owner. Further reproduction prohibited without permission.
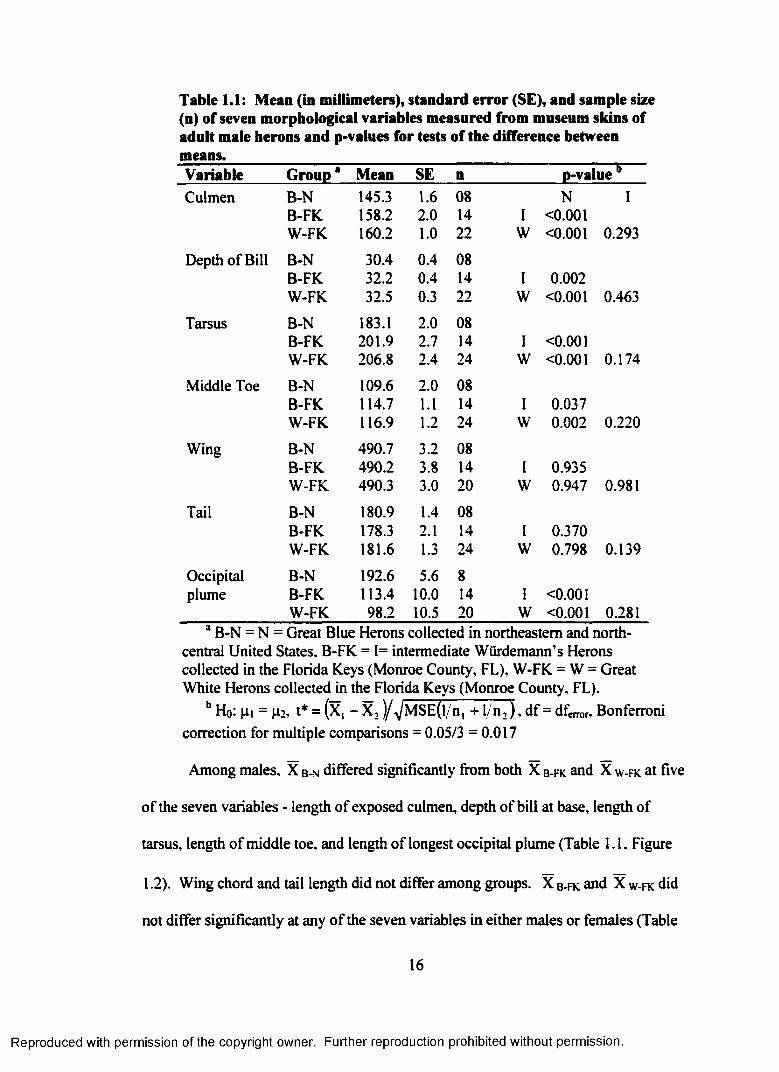
Table t.l: Mean (in millimeters), standard error (SE), and sample size (n) of seven morphological variables measured from museum skins of adult male herons and p-values for tests of the difference between means.Variable Group* Mean SE n p-valueCulmen B-N 145.3 1.6 08 N I
B-FK 158.2 2.0 14 I <0.001W-FK 160.2 1.0 22 W <0.001 0.293
Depth of Bill B-N 30.4 0.4 08B-FK 32.2 0.4 14 I 0.002W-FK 32.5 0.3 22 W <0.001 0.463
Tarsus B-N 183.1 2.0 08B-FK 201.9 2.7 14 I <0.001W-FK 206.8 2.4 24 W <0.001 0.174
Middle Toe B-N 109.6 2.0 08B-FK 114.7 1.1 14 I 0.037W-FK 116.9 1.2 24 W 0.002 0.220
Wing B-N 490.7 3.2 08B-FK 490.2 3.8 14 I 0.935W-FK 490.3 3.0 20 w 0.947 0.981
Tail B-N 180.9 1.4 08B-FK 178.3 2.1 14 I 0.370W-FK 181.6 1.3 24 w 0.798 0.139
Occipital B-N 192.6 5.6 8plume B-FK 113.4 10.0 14 I <0.001
W-FK 98.2 10.5 20 w <0.001 0.281a B-N = N = Great Blue Herons collected in northeastern and north-
central United States, B-FK = 1= intermediate Wurdemann’s Herons collected in the Florida Keys (Monroe County, FL), W-FK = W = Great White Herons collected in the Florida Keys (Monroe County, FL).
b Ho: |ii = (4.2-, t* = (x, - X ,)/^MSE(l/n, +1/n , ) , d f= dferr0r, Bonferronicorrection for multiple comparisons = 0.05/3 =0.017
Among males, X b -n differed significantly from both X b - f k and X w - f k at five
of the seven variables - length of exposed culmen, depth of bill at base, length of
tarsus, length o f middle toe, and length of longest occipital plume (Table 1.1, Figure
1.2). Wing chord and tail length did not differ among groups. X b - f k and X w -fk did
not differ significantly at any of the seven variables in either males or females (Table
16
Reproduced with permission of the copyright owner. Further reproduction prohibited without permission.

1.1 and Table 1.2). Although not significantly different, mean values for these two
groups followed a consistent pattern (Figure 1.2). In males and females, X w - f k was
larger than X b - f k at all variables except longest occipital plume (where X b - f k > X w -
f k ) . X b - f k was intermediate between X b -n and X w - f k at five of the seven variables -
length of exposed culmen, depth of bill at base, length of tarsus, length of middle toe,
and length of longest occipital plume.
Table 1.2: Mean (in millimeters), standard error (SE), and sample size (n) of seven morphological variables measured from museum skins of adult female herons. Test statistic (TS), degrees of freedom (df) and p-value for two-tailed
Variable Group* Mean SE n TS df P > TSCulmen B-FK 148.4 1.8 12 0.21 b 25.5 0.82
W-FK 149.1 2.8 17
Depth of Bill B-FK 30.2 0.6 12 108c 12. 17 0.81W-FK 30.3 0.5 17
Tarsus B-FK 187.7 1.8 12 0.81 b 21.4 0.43W-FK 191.5 4.3 17
Middle Toe B-FK 105.5 1.3 12 1.02 d 27 0.32W-FK 107.6 1.5 17
Wing B-FK 466.0 3.2 11 0.85 b 23.1 0.40W-FK 471.3 5.4 16
Tail B-FK 172.3 1.6 12 0.68d 27 0.50W-FK 174.3 2.2 17
Occipital B-FK 113.2 12.6 11 117c 11,15 0.07plume W-FK 81.5 6.3 15
B-FK = intermediate Wiirdemann’s Herons collected in the Florida Keys (Monroe County, FL), W-FK = Great White Herons collected in the Florida Keys (Monroe County, FL).
b Two sample t-test assuming unequal variances (Ott 1993), test statistic = t' c Mann-Whitney test (Zar 1984), test statistic = U d Two sample t-test assuming equal variances (Ott 1993), test statistic = t
17
Reproduced with permission of the copyright owner. Further reproduction prohibited without permission.

175
£ 125
Male Female
225
125
500
9 175rih
Male Female
EE.e>ei
450
400Male Female
Male Female
40
125
EE
Ia
200-1
Male Female
Male Female
Male Female
■ B-N
E B-FK
□ W-FK
Note: Y-axis origin is not always zero
Figure 1.2: Mean values (± 95% Cl) for seven morphological variables measured from museum skins of northern Great Blue Herons (B-N), Great Blue Herons from the Florida Keys (B-FK), and Great White Herons from the Florida Keys (W-FK).
18
Reproduced with permission of the copyright owner. Further reproduction prohibited without permission.
DISCUSSION
Previous studies have documented significant size differences among the three
Great Blue Heron subspecies found in eastern North America (Holt 1928, Mayr 1956,
Zachow 1983). Northern Great Blue Herons (A. h. herodias) are the smallest, Great
White Herons from the Florida Keys (A. h. occidentalis) are the largest, and southern
Great Blue Herons (A. h. wardi) are intermediate in size (Zachow 1983). Clinal
variation in size among these widely distributed subspecies is not unexpected .
However, the current classification presumes that Great White and Great Blue herons
in the Florida Keys interbreed freely. Finding size differences between these
sympatric taxa would indicate that they are not a randomly mating population.
Comparable measurements of white and blue herons from within south Florida’s A. h.
occidentalis breeding population have been published for only one morphological
variable (longest occipital plume). I compared seven morphological variables from
museum skins of adult Great White Herons and Great Blue Herons from within the
Florida Keys breeding population (A. h. occidentalis). My objectives were to test for
size differences between white and blue herons within the Florida Keys breeding
population and, if size differences exist, to determine whether they are consistent with
the hypothesis of a hybrid origin for the intermediate Wiirdemann’s Heron.
The plumage of Great Blue Herons from the Florida Keys (B-FK) varied, but
all appeared to possess at least some plumage characteristics of intermediate
Wurdemann’s Herons (head all white or mostly white streaked with gray or black,
white breast and belly streaked with gray or black, and pale bluish-gray wings and
back). The phenotypic composition of this sample may accurately reflect resident
19
Reproduced with permission of the copyright owner. Further reproduction prohibited without permission.

Great Blue Herons within the Florida Keys breeding population, but it may also be an
artifact of my selection process. To reduce the chances of including migrants from
northern populations, I excluded birds with '‘typical” Great Blue Heron plumage
collected during winter. This may have biased the B-FK sample against resident
herons with typical Great Blue Heron plumage. Furthermore, some adult Great White
Herons migrate from the Florida Keys to the southern Florida peninsula during non
breeding summer months (Powell and Bjork 1990). If this is true of Great Blue
Herons breeding in the Florida Keys, then this would also reduce the chances of
finding a museum skin from the Florida Keys with '‘typical” Great Blue Heron
plumage.
I found no significant size differences between Great Blue Herons from the
Florida Keys (B-FK) and Great White Herons from the Florida Keys (W-FK) at any of
the seven morphological variables (Table 1.1 and Table 1.2). However, because
sample sizes were small, the power of these tests was low (1-p < 0.30 for all tests of
Ho: P b - f k = P w - f k ) - Although B-FK and W-FK did not differ significantly at any
variable, the low power of these tests and a consistent pattern in mean values suggests
that larger sample sizes might reveal significant differences at some of these variables.
In males. B-FK and W-FK differed significantly from northern Great Blue
Herons (B-N) at five of the seven variables - length of exposed culmen. depth of bill at
base, length of tarsus, length of middle toe, and length of longest occipital plume
(Table 1.1). Although B-FK and W-FK did not differ significantly, there was a pattern
in the mean values of these five variables (Figure 1.2). X b - f k was intermediate
between X b -n and X w - f k regardless of whether the variable was larger in B-N
20
Reproduced with permission of the copyright owner. Further reproduction prohibited without permission.

(longest occipital plume) or W-FK (culmen, depth of bill, tarsus, and middle toe).
This pattern is consistent with the hypothesis that intermediate Wurdemann’s Herons
are the result of hybridization between Great White Herons and the smaller Great Blue
Herons from the Florida peninsula. This interpretation might be supported more
strongly if I had been able to obtain larger sample sizes and demonstrate these patterns
in a larger number of independent variables (the four hard bony structures - culmen,
depth of bill, tarsus, and middle toe - are almost certainly not independent).
The absence of samples from the Florida peninsula is unfortunate. Zachow’s
(1983) morphometric evidence from skeletons suggests that Great Blue Herons from
the Florida peninsula are smaller than Great White Herons, but that these differences
may be small compared to the differences between these two groups and northern
Great Blue Herons. Adequate morphometric samples from the Florida peninsula
would, perhaps, provide stronger inferences regarding the affinities of Great Blue
Herons breeding in the Florida Keys.
21
Reproduced with permission of the copyright owner. Further reproduction prohibited without permission.

CHAPTER 2. Mate choice between sympatric Great White and Great Blue herons
INTRODUCTION
Biological species are defined by reproductive isolation. Even phenotypically
distinct populations may be considered conspecific if gene flow between them can
occur freely. Reproductive barriers reduce or prevent gene flow between taxa and
play an important role in the formation and maintenance of reproductive isolation
between species. Reproductive barriers are categorized as either prezygotic (occurring
before the formation of a hybrid zygote) or postzygotic (inviability of hybrid zygotes
or reduced fertility of hybrid offspring). Behavioral isolation (potential mates
encounter each other but do not mate) is an important prezygotic barrier to gene flow
between sympatric taxa (Futuyma 1998). Positive assortative mating, a consequence
of behavioral isolation, is one line of evidence often used to diagnose reproductive
isolation between sympatric taxa.
Support for the Great White Heron's subspecies status stems largely from
limited observations of interbreeding between sympatric white and blue herons, and
impressions that mate choice is random with respect to plumage color (Holt 1928,
Mayr 1956. Meyerriecks 1957). Mated pairs of white and blue herons have been
reported, as have nests containing mixed broods (Holt 1928, Meyerriecks 1957.
Bancroft 1969, McHenry and Dyes 1983). These observations of mixed pairs may
have carried too much weight in the decision to reclassify the Great White Heron as a
subspecies. A key question is whether white and blue individuals interbreed freely or
only rarely (Mayr 1956).
22
Reproduced with permission of the copyright owner. Further reproduction prohibited without permission.

There are no published data that support a hypothesis of random mating with
respect to plumage color. Meyerriecks (1957) interpreted his observations of a small
number of mated pairs as support for a random mating hypothesis, but cautioned
against accepting this hypothesis without further study. Robertson (1978) reported
that mixed pairs occur "about” one order of magnitude lower than expected from a
randomly mating population, but gave no details of methodology. Powell's
unpublished surveys reportedly support Robertson’s hypothesis of positive assortative
mating (Powell and Bjork 1996).
I tested the hypothesis that sympatric Great White Herons and Great Blue
Herons pair randomly with respect to plumage color by monitoring nests in Florida
Bay (Monroe County, Florida, USA). Rejection of this hypothesis would suggest that
prezygotic reproductive barriers currently exist between Great White Herons and
Great Blue Herons breeding in the Florida Keys. I also recorded nestling phenotypes
to see if these data would provide insight into the genetic basis of color inheritance.
This is the first study to conduct observations on a large number of nests in sufficient
detail to confirm the phenotypes of both members of a mated pair and their offspring.
This allowed me to test the random mate choice hypothesis and make inferences
regarding the genetic basis of the plumage polymorphism found in the Florida Keys
population.
METHODS
Natural History and Study Area
Great Blue Herons are distributed widely throughout North America and are
also found in parts of Central America and the Caribbean. The Great White Heron is
23
Reproduced with permission of the copyright owner. Further reproduction prohibited without permission.

restricted almost entirely to south Florida, Cuba, Jamaica, and off the coasts of
Venezuela and the Yucatan (Powell and Bjork 1996). Great White Herons are
extremely rare in the Caribbean (Raffaele et al. 1998), and south Florida supports the
largest known breeding population. Approximately 850 pairs breed in the shallow
marine and coastal mangrove environments of Florida Bay and the Florida Keys
(Powell and Bjork 1996). Although some non-breeding birds do move to freshwater
wetlands on the southern Florida peninsula during the non-breeding season, this Great
White Heron population is essentially non-migratory, and many birds spend the entire
year within the Florida Keys ecosystem (Powell and Bjork 1990).
50 km Florida Everglades
Gulf of Mexico 6 Florida
Bay
AtlanticOcean
outer Keys
Figure 2.1: Map of south Florida, including Florida Bay and the Florida Keys.
Florida Bay is a large shallow estuary, which receives freshwater input from
the Florida Everglades. It is open to the Gulf of Mexico on its western boundary and
lies between the Florida Everglades to the north and the Florida Keys to the south and
24
Reproduced with permission of the copyright owner. Further reproduction prohibited without permission.

east (Figure 2.1). The “outer Keys” refer to the portion of the Florida Keys that
extend beyond Florida Bay’s western boundary (a line drawn approximately between
Cape Sable on the southwestern Florida peninsula and Long Key in the Florida Keys).
Florida Bay is composed of a series of shallow basins separated by an network of
shoals, mudflats, and hundreds of small mangrove islands. Great White Herons build
nests on these islands within Florida Bay and on small mangrove islands along the
outer Keys. They rarely breed on the Florida peninsula or on the main Keys
themselves (Robertson 1978). Not only do Great Blue Herons nest on islands within
Florida Bay and along the outer Keys, but they also breed in a variety of environments
on the Florida peninsula.
Florida Bay’s population breeds asynchronously. Nests can be found at any
time of year, but peak breeding activity coincides with south Florida’s dry season,
approximately October through April. Although it is difficult to distinguish males and
females in the field, the breeding cycle provides many opportunities to observe both
members of a mated pair together at their nest. Shared duties and characteristic
behaviors between mates make it possible to assign pair status with confidence
(Meyerriecks 1960, Mock 1976, Butler 1992).
Data Collection and Analysis
To test the random mate choice hypothesis (Ho: sympatric Great White Herons
and Great Blue Herons pair randomly with respect to plumage color), I studied
breeding Great White Herons and Great Blue Herons in Florida Bay during the peak
of the 1998-1999 breeding season (October through February). I used high quality
optical equipment to observe nests from a distance (Leica 8x44 binoculars or
25
Reproduced with permission of the copyright owner. Further reproduction prohibited without permission.

Swarovski 60x spotting scope) and monitored each nest until I observed adults
engaged in activities that positively identified them as a pair (e.g. switching incubation
duties). For each blue adult, I attempted to determine whether its plumage was
characteristic of a ‘"typical” Great Blue Heron or of an “intermediate” Wurdemann’s
Heron. However, for reasons discussed below, adult phenotype is reported here as
either white or blue.
I used the number of white and blue adults from the sample of observed nests
to estimate the proportion of white and blue individuals in the breeding population. I
used this estimate to generate expected values for each of the three pairing categories
(white/white, white/blue, blue/blue). I used a X2 goodness of fit test for the difference
between observed and expected values (Sokal and Rohlf 1995), subtracting one degree
of freedom for the total sample size and one degree of freedom because sample
frequencies were used to generate expected values.
Whenever possible, I recorded nestling phenotypes in nests where adult
phenotypes were known. I could not discern any differences in plumage among blue
nestlings, even upon close inspection (1 handled nestlings to take blood and feather
samples for genetic analysis). This made it impossible to infer whether adult
phenotype would be characteristic of a “pure” Great Blue Heron or of an
•"intermediate” Wurdemann’s Heron. Nestling color, therefore, was recorded as either
white or blue.
RESULTS
I determined adult plumage color at 114 nests from 14 islands within Florida
Bay during the 1998-1999 breeding season. White and blue individuals were clearly
26
Reproduced with permission of the copyright owner. Further reproduction prohibited without permission.

distinguishable. Among blue adults a continuum of phenotypes ranged from those
with plumage indistinguishable (under field conditions) from other North American
Great Blue Herons (white cheek and crown, black crest and occipital plumes, black
breast and belly streaked with white, and deep bluish-gray wings and back) to obvious
intermediates (all white head or mostly white with streaks of gray or black, white
breast and belly streaked with gray or black, and pale bluish-gray wings and back). If
I define, for a moment, three somewhat arbitrary plumage categories (blue herons at
one end of the blue plumage continuum, intermediate herons at the other end of the
blue plumage continuum, and white herons), all pair combinations were observed and
all combinations produced viable offspring.
Although some blue adults had plumage that was clearly intermediate and
others had plumage that was indistinguishable from “typical” Great Blue Herons, the
continuum of blue phenotypes made it extremely difficult to devise any meaningful
criteria to categorize blue adults as either “blue” or “intermediate.” Adult phenotype,
therefore, is reported as either white or “blue” (Table 2.1). I rejected the random
mating hypothesis using a X2 goodness of fit test for the difference between observed
and expected values (X2=31.32, df=l, p<0.001).
Table 2.1: Observed (O) and expected (E) values for each pairingcategory expressed as number of mated pairs and percent of total.
# of Mated Pairs % of Total Adult Phenotypes O_______ E*_______O______ §/White White 83 73 73 64White Blue 17 36 15 32Blue Blue 14 5 12 4
a Expected values assume p(white) = 0.8, q(blue) = 0.2, and adults pair randomly with respect to plumage color
27
Reproduced with permission of the copyright owner. Further reproduction prohibited without permission.

Table 2.2 contains nestling and adult phenotype data for two breeding seasons:
1997-1998 and 1998-1999. I found only white nestlings in nests where both adults
were white. Mixed pairs produced broods with all blue offspring, all white offspring,
and mixed offspring. Blue/blue pairs produced broods that were either all blue or
mixed. I did not find any blue/blue pairs with all white offspring, however the number
of nests in this category is small and does not preclude the possibility that two blue
parents could produce a brood of all white offspring.
Table 2.2: Number and color of offspring in nests for which adultphenotypes are known____________________________________
Number Number of offspring Adult phenotypes______ of nests White Blue
White White 51 113 0White Blue 14 15 13Blue Blue 14 6 25
DISCUSSION
Support for the Great White Heron’s subspecies status stems largely from
limited observations of interbreeding between Great White Herons and Great Blue
Herons and from impressions that mate choice is random with respect to plumage
color. However, there are no published data that support a random mate choice
hypothesis. I tested the hypothesis that sympatric Great White Herons and Great Blue
Herons pair randomly with respect to plumage color by monitoring nests in Florida
Bay (Monroe County, Florida, USA). I observed more white/white and blue/blue
pairs and fewer mixed pairs than expected from a randomly mating population
(X2=31.32, df=l, p<0.001).
My data are consistent with Robertson’s (1978) thesis of positive assortative
mating, but the number of mixed pairs that I observed was approximately half that
28
Reproduced with permission of the copyright owner. Further reproduction prohibited without permission.
expected from a randomly mating population rather than the tenfold reduction reported
by Robertson (WBR). Robertson counted 563 white and 380 blue herons at nests
during four surveys of Florida Bay and, therefore, expected about 48% of the pairs to
be mixed. He did not provide the number of pairs observed in each category, but said
the number of mixed pairs was about one order of magnitude lower than expected
(presumably about 5%). Not only does the proportion of observed to expected values
for mixed pairs differ between our data (HLM - about 1:2; WBR - about 1:10), but our
estimates of the relative proportions of white to blue herons in the Florida Bay
breeding population also differ (HLM - about 4:1, WBR - about 3:2).
These estimates suggest that either the proportion of blue herons breeding in
Florida Bay fluctuates over time, or one (or both) of our estimates is (are) incorrect.
Roberston’s surveys were done at two to four month intervals from June 1959 through
May 1960. Recent aerial surveys (Gawlik 1998) show that peak activity is essentially
the same for white and blue herons in Florida Bay (although the Great White Heron
season is more protracted) and breeding Great White Herons outnumber breeding
Great Blue Herons at any given time (Figure 2.2). Great Blue Heron nests comprised
between zero and 26% of the total nests during any given month. My estimate of
relative proportions of white to blue herons in the Florida Bay breeding population
(80% white, 20% blue) is consistent with these recent surveys. If my data and
Robertson’s data are both accurate, the discrepancy between our data sets invites the
following hypothesis. As Great Blue Herons become rare within the Florida Bay
breeding population, the probability that a Great Blue Heron will pair with a Great
White Heron increases, but remains below the level expected from a randomly mating
29
Reproduced with permission of the copyright owner. Further reproduction prohibited without permission.

population. This hypothesis is consistent with mate choice theory that predicts the
degree of “choosiness” exhibited by courting animals will be influenced by the
availability of potential mates (Crowley et al. 1991, Nuechterlein and Buitron 1998).
■oaof<3a9
9>
<
300
250
200
150
100
50
H
Q Great White Heron
■ Great Blue Heron
LOJL IIn fl w n
O N O J F M A M J J A S O N O J F M A M J J A S O
Month
Figure 2.2: Great White Heron and Great Blue Heron nests detected in Florida Bay during aerial surveys from October 1995 through October 1997 (Data from Gawlik 1998).
Although the pattern of mate choice in Florida Bay is assortative. the
mechanism producing this pattern is unknown. The non-random pattern does not
necessarily imply that these herons use plumage color as a criterion for mate choice.
Other factors (habitat preference, timing of breeding, sex ratios, historical geographic
distribution, etc.) may also influence patterns of mate choice. These factors may
function at several spatial or temporal scales and could either inhibit or promote mixed
pairs. For example, subtle differences in habitat preference (nest sites or foraging
habitat) could segregate Great White Herons and Great Blue Herons during the
breeding season. This might manifest itself on small settles (within individual islands)
or on larger scales (among islands). If Great White Herons and Great Blue Herons
30
Reproduced with permission of the copyright owner. Further reproduction prohibited without permission.

occupy different habitats and mate choice is restricted primarily to birds within a
preferred habitat, the probability of encountering potential mates of the opposite
phenotype is reduced and there will be fewer mixed pairs than expected from a
randomly mating population.
Conversely, there may be factors that facilitate mixed pairing even if these
herons prefer mates with like phenotype. In Florida Bay pairs nest singly or in loose
association with other breeding birds, but rarely in the dense colonies typical of other
Great Blue Heron populations. Even large islands generally have fewer than thirty
nesting pairs at any given time and most have fewer than ten (Gawlik and Ogden
1996). Breeding is asynchronous. Not all birds acquire the visible signs o f breeding
condition (brilliant soft part coloration and elongated neck, back and occipital plumes)
simultaneously, and nests at different stages of the breeding cycle (egg, nestling,
fledgling) are commonly found in close proximity (pers. obs.). Great blue herons are
relatively rare in the Florida Bay breeding population. If mate choice occurs on a
small spatial scales (within individual islands or among closely spaced islands), some
blue herons may not encounter a suitable mate of the preferred phenotype. These
birds may pair with the less desired phenotype rather than give up an opportunity to
mate during a particular breeding season. Thus, some mixed pairs could occur even if
Great White Herons and Great Blue Herons have strong preferences for mates with
like phenotype.
The positive associative pattern of mate choice with respect to plumage color
suggests that prezygotic reproductive barriers exist between Great White Herons and
Great Blue Herons in Florida Bay. Without a more detailed understanding of some of
31
Reproduced with permission of the copyright owner. Further reproduction prohibited without permission.
the variables that influence mate choice, it is difficult to assess the nature of the
reproductive isolation between these two taxa. The assortative pattern may reflect
historical influences (e.g. geographic distribution) and may break down over time.
Conversely, "mis-mating” may incur significant fitness consequences and
reproductive isolation may be reinforced over time.
My data from Florida Bay also provide some insight into the genetic basis of
the plumage polymorphism observed in the Florida Bay population. Some
ornithologists have suspected that two white adults are capable of producing blue
offspring (Mayr 1956, Meyerriecks 1957). Mayr (1956) proposed a model in which a
dominant allele conferred white plumage and modifier genes were responsible for
producing the intermediate plumage of the Wurdemann’s Heron. However, I found
only white offspring in nests where both parents were white (Table 2.2). If plumage
color is determined primarily at a single locus and white is dominant, then the
probability of observing this sample is extremely low unless most pairs (>88%) have
at least one member homozygous for the dominant white allele (Table 2.3). Given the
assortative pattern of mate choice and my estimate of the ratio of white to blue herons
in the breeding population (4:1). it is conceivable that most white herons are
homozygous for a dominant white allele and that this sample is statistically likely.
However, I found both blue and white offspring in nests where both parents were blue
and, if plumage color is controlled primarily at a single locus, two blue parents can
produce white offspring only if white plumage is a recessive trait and both parents are
heterozygotes. Furthermore, as Table 2.4 illustrates, the proportion of white offspring
found in nests of blue/blue pairs (19.4 ± 13.9%) is within the range expected under the
32
Reproduced with permission of the copyright owner. Further reproduction prohibited without permission.

hypothesis that white plumage is recessive (0-25%), and differs significantly from the
expected value for the hypothesis that white plumage is dominant (0%).
Table 2J: Probability of producing 113 white offspring (Table 2.2) from white/white pairs given different relative proportions of genotype crossesand assuming white plumage is dominant._____________________________
Relative proportionsof genotype crosses* Probability of Probability of
WW x Ww or producing a single producing 113 Ww x Ww WW x WW white offspring white offspring
i r\n n nn n ~i i <v>51.00 0.00 0.75 7.62x1 O'150.20 0.80 0.95 0.0030.12 0.88 0.96 0.0100.08 0.92 0.98 0.1020.00 1.00 1.00 1.00
a WW and Ww = white, ww = blue
Table 2.4: Possible genotype crosses and percent white offspring expected fromthese crosses for two hypotheses of color dominance (assuming color is controlledby a single locus) compared with the percent of white offspring (± 95% Cl)observed in nests with known parental phenotypes
WHITE DOMINANT WHITE RECESSIVEPossible % white Possible % white % white
Parental genotype offspring genotype offspring offspringphenotypes crosses expected crosses expected observedWhite/White WW x WW 75-100 bb x bb 100 100
WWx WwWwx Ww
White/Blue WW x ww 50-100 bb x Bb 0-50 53.6Ww x ww bb x BB (±18.5)
Blue/Blue ww x ww 0 Bb x Bb 0-25 19.4BB x Bb (±13.9)BBx BB
Although nestling and adult phenotype data indicate that white plumage
behaves as a recessive trait, the single locus hypotheses for the inheritance of plumage
color presented in Table 2.4 ignore the range of blue phenotypes found in the Florida
Bay population. A number of hypotheses can be constructed to explain these
33
Reproduced with permission of the copyright owner. Further reproduction prohibited without permission.
intermediate plumages (e.g. incomplete dominance at a single locus or additive alleles
at more than one locus). However, testing any of these hypotheses would require
examining large numbers of offspring from known crosses and the ability to determine
what their adult phenotype will be. Both are beyond the reach of my data.
Regardless of whether the allele conferring white plumage is dominant or
recessive, it appears to be unique to the Florida Keys population. White individuals
are rarely found in other North American Great Blue Heron populations and there is
only one published observation of a white nestling outside south Florida (McHenry
and Dyes 1983). The lack of white individuals in other Great Blue Heron populations
suggests that most North American Great Blue Herons do not carry an allele
conferring white plumage. This implies that there is little emigration of either white or
blue individuals from the predominantly white Florida Bay population to other Great
Blue Heron populations.
Inferences regarding emigration from other Great Blue Heron populations to
the Florida Bay population are harder to make. Although there were fewer mixed
pairs than expected from a randomly mating population, the number that I observed
(17 out of 114) is not trivial. These may provide an avenue for gene flow between
white and blue herons in Florida Bay or between the Florida Bay breeding population
and other Great Blue Heron populations. Because there is a continuum of blue
phenotypes, it was not possible to confidently identify the origin of an adult blue
heron. It is, therefore, difficult to use this mate choice data to make inferences about
the role of emigration from other Great Blue Heron populations to Florida Bay. I will
34
Reproduced with permission of the copyright owner. Further reproduction prohibited without permission.

address this question in chapter four, by exploring patterns of genetic differentiation
among six Great White and Great Blue heron populations.
35
Reproduced with permission of the copyright owner. Further reproduction prohibited without permission.

CHAPTER 3. Isolation of microsatellite loci in Ardea herodias
INTRODUCTION
Microsatellites have become the marker of choice for evaluating patterns of
genetic differentiation among populations of recently diverged taxa. Microsatellites
are non-coding nuclear sequences composed of tandemly arrayed repeat units. These
repeat units are short, generally 1-6 base pairs (bp) long. Microsatellites evolve
through gain or loss of repeat units caused by slippage and mis-alignment during DNA
replication (Schlotterer and Tautz 1992, Schlotterer and Pemberton 1994). Alleles at a
locus, therefore, differ in length and are easily resolved by electrophoresis (Queller et
al. 1993). Microsatellites have several advantages over other nuclear markers (Queller
et al. 1993, Sunnucks 2000). They are co-dominant (heterozygotes can be
distinguished from both classes of homozygotes), single-locus (a single "gene” is
amplified), and presumably neutral (an assumption of many population genetic
analyses). Microsatellites evolve rapidly and are particularly well suited for genetic
analyses at the level o f populations or individuals and, thus, provide a resolution not
possible with other more slowly evolving co-dominant nuclear markers (e.g.
allozymes).
The primary disadvantage of microsatellites is a technical one. Although rapid
evolution makes them ideal for genetic analysis at lower taxonomic levels (species,
subspecies, populations, and individuals), it also means that microsatellite loci are
often species-specific and require an initial investment of time an money to develop in
new species. Relative to other genetic markers, they are difficult and expensive to
isolate - particularly in birds, in which microsatellites are relatively rare (Primmer et
36
Reproduced with permission of the copyright owner. Further reproduction prohibited without permission.

al. 1997, Longmire et al. 1999). Traditional isolation techniques use radioactively
labeled oligonucleotide probes to screen large libraries o f bacterial clones (genomic
DNA fragments from the target organism inserted into plasmid vectors, which are then
introduced into bacterial cells and replicated along with the bacterial DNA). These
techniques have met with limited success in birds (Tarr and Fleischer 1998).
Enrichment protocols employ an initial “screen” of genomic DNA fragments to
increase the proportion of microsatellite repeats in the insert library prior to cloning
(Armour et al. 1994, Fleischer and Loew 1995). I used an enrichment technique
(Hamilton et al. 1999) to isolate 60 Ardea herodias microsatellite loci and used 12 of
these loci to document patterns of genetic differentiation among Great White Heron
and Great Blue Heron populations (Chapter 4).
METHODS
I isolated microsatellite markers using an enrichment technique that employs a
subtractive hybridization to increase the proportion of microsatellite repeats in the
genomic DNA insert library prior to cloning (Hamilton et al. 1999). Briefly,
streptavidin-coated magnetic beads and biotinylated oligonucleotide repeats retain
single-stranded genomic DNA fragments containing repeat sequences. Linker
sequences, ligated to genomic DNA, provide a PCR (polymerase chain reaction)
priming site (to recover double-stranded DNA) and contain restriction sites to create
compatible ends for cloning. Detailed descriptions of this type of enrichment protocol
can be found elsewhere (Fischer and Bachmann 1998, Hamilton et al. 1999). Except
where indicated, I used the reagent concentrations and reaction conditions suggested
by Hamilton et al. (1999) in the expanded protocol, referenced therein.
37
Reproduced with permission of the copyright owner. Further reproduction prohibited without permission.

I used Sau3 Al, Nhel and Hhal to digest A. herodias genomic DNA and I
conducted separate hybridization reactions for four different biotinylated
oligonucleotide repeat motifs: (CA)is, (TC)is, (AGC)io, and (CATA^CA. I used Nhel
to digest linker sequences and ligated the repeat enriched library into pUC19 plasmid
DNA digested with Xbal. I transformed plasmids into E. coli (Life Technologies,
Library Efficiency® DH5a™) and grew the £. coli overnight at 37 °C on an LB agar
medium with 100 mg/L ampicillin and 20 mg/L X-gal for blue/white screening of
bacterial colonies (Sambrook et al. 1989). I omitted the chemiluminescent screen and
used pUC19 primers to amplify A. herodias DNA inserts directly from bacterial
colonies. Each 50 pL reaction volume contained 50 mM Tris-HCl (pH 8.3), 20 mM
KC1. 1.5 mM MgCli, 0.2 mM each dNTP, 0.5 pM each pUC19 forward and reverse
primers (forward: 5'- CCC AGT CAC GAC GTT GTA AAA CG-3', reverse: 5'- AGC
GGA TAA CAA TTT CAC ACA GG-3'), and 1.0 unit Taq polymerase. DNA was
added by lightly touching a sterile toothpick to a bacterial colony and swirling the
toothpick into the reaction mix. I used a Hybaid Omn-E thermal cycler for all
reactions and the following thermal profile: an initial denaturing step at 95 °C for 5
min: 30 cycles of 94 °C for 60 s, 55 °C for 30 s, 72 °C for 30 s; rapid thermal ramp to
40 °C. A 5 pi aliquot of the reaction mixture was visualized under ultraviolet light
after electrophoresis through a 2% agarose gel stained with ethidium bromide. For
successful reactions (those with a distinct band 300-1000 bp long), I cleaned the
remaining PCR product with a QIAquick PCR Purification Kit (QIAGEN) and eluted
clean product from the QIAGEN mini column with 30 pL sterile ddHiO. I used 2 pL
of clean product in subsequent sequencing reactions.
38
Reproduced with permission of the copyright owner. Further reproduction prohibited without permission.
I used an ABI P r i s m ® Big Dye™ Terminator Cycle Sequencing Ready
Reaction Kit (Perkin Elmer Applied Biosystems) to sequence PCR products. Each 10
(iL reaction volume contained 2 pL PCR product (clean), 2 fiL BigDye ready reaction
mix, and 3.2 pmol (final concentration) pUC 19 primer (either forward or reverse). I
used a Hybaid Omn-E thermal cycler (with hot lid) for the cycle sequencing reaction.
The thermal profile for all reactions was 25 cycles of 96 °C for 30 s, 50 °C for 15 s and
60 °C for 4 min; the cycle sequencing reaction was followed by a rapid thermal ramp
to 40 °C. I used the kit’s ethanol/sodium acetate precipitation protocol to remove
unincorporated dye terminators and sent dried precipitated sequencing products to the
Louisiana State University Museum of Natural Science (LSUMNS), where the
precipitated sequencing products were re-suspended in a loading buffer and
electrophoresed through a polyacrylamide gel on an ABI P r i s m 3 7 7 . Gels were scored
using Sequencher 3.1 (Gene Codes Corporation, Ann Arbor, Michigan). Output for
each sequence was provided by LSUMNS in the form a text file and an
electropherogram. 1 checked each electropherogram for accuracy of base pair
assignments and repeated PCR amplification and sequencing reactions for PCR
products that produced ambiguous electropherograms. In most cases, I sequenced
both strands to obtain unambiguous electropherograms on both sides of the
microsatellite.
I used Oligo Analyzer 2.0 (Integrated DNA Technologies, http://www.
idtdna.com) to design PCR primers for sequences that contained a microsatellite with
nine or more repeat units and sufficient flanking sequence on both sides of the
microsatellite. A 19 bp M13 forward primer (5'- CAC GAC GTT GTA AAA CGA C
39
Reproduced with permission of the copyright owner. Further reproduction prohibited without permission.
-3') was added to the 5' end of the forward primer of each primer pair. This primer
sequence, labeled with an infrared dye (IRD), is included in PCR amplifications,
where it is incorporated into the PCR product. This allows for infrared fluorescence
detection. I screened for polymorphism by genotyping 30 Great Blue Herons (10 each
from three populations) and 10 Great White Herons. I also attempted to amplify these
microsatellites in 1-2 individuals in each of 3 closely related species - A. alba, A.
cinerea. and A. cocoi. Each 10 pL PCR volume contained 50 mM Tris-HCl (pH 8.3),
20 mM KCI, 1.5 mM MgCL, 0.2 mM each dNTP, 0.05 pM forward and reverse
primers, 0.04 pM IRD labeled M l3 primer (LI-COR), 1.0 unit Taq polymerase, and
20-200 ng DNA template. I used a Hybaid Omn-E thermal cycler and the following
touchdown thermal profile: an initial denaturing step at 95 °C for 5 min; X cycles of
94 °C for 60 s, Y °C for 30 s, 72 °C for 30 s; rapid thermal ramp to 40 °C. X and Y
equal 3 and 61, then 3 and 58, and finally 27 and Tm - 5 °C (see Table 3.1 for melting
temperatures). PCR products were visualized on a LI-COR 4200-2 after
electrophoresis through a 25 cm x 0.25 mm 6% acrylamide gel. Images were analyzed
with Gene ImagIR™ software (LI-COR).
RESULTS
Sixty sequences contained microsatellites with four or more repeat units
(Appendix F). I designed PCR primers for 28 loci that had nine or more repeats.
Twenty-six primer pairs amplified products of the appropriate length (two failed to
amplify any product). Seventeen produced PCR products that could be reliably scored
(Table 3.1). Fifteen of these 17 were polymorphic in A. herodias. Two were
apparently monomorphic in A. herodias (based on genotypes from 40 or more
40
Reproduced with permission of the copyright owner. Further reproduction prohibited without permission.

individuals), but exhibited size variation among all the taxa scored. The remaining
nine primer pairs produced ambiguous banding patterns (poor amplification, confusing
stutter bands, or multiple products). These, presumably, could be improved by
redesigning primers and/or optimizing PCR conditions.
DISCUSSION
Typically, birds have relatively few microsatellites (Primmer et al. 1997.
Longmire et al. 1999). Isolating these markers using traditional methods has proven to
be inefficient and expensive for many organisms and has met with limited success in
birds (Fischer and Bachmann 1998, Tarr and Fleischer 1998). The enrichment
technique (Hamilton et al. 1999) was an efficient and relatively inexpensive method
for creating a library of DNA fragments from A. herodias enriched for microsatellites.
Attempts to isolate CATA and ACG microsatellites did not produce many clones
containing these repeat units. Because ACG was reported to be the most abundant
microsatellite repeat in the Brown-headed Cowbird (Longmire et al. 1999), I suspect
this failure is due to sub-optimal hybridization temperatures rather than a lack of these
repeats in A. herodias. The loci reported here are the first microsatellite markers
developed for any heron species. The ability to amplify polymorphic products in
closely related species suggests that these markers may also be useful in other herons,
particularly within the genus Ardea.
41
Reproduced with permission of the copyright owner. Further reproduction prohibited without permission.

Reproduced
with perm
ission of the
copyright ow
ner. Further
reproduction prohibited
without
permission.
Table 3.1: Ardea herodias microsatellite loci and results of cross-species amplification in closely related tew.
Locus Repeat *Size
(bp)b# o f
allelesc ndAmplified in': a1 ci co Primer sequences (5' to 3')
Tm<°C)
Ah 205 (AC),2 256 05 282 xf X X F: CTGTGGAAOCAAGGCTACCC R: GTCCTCATTGTAGGCTGATTCTTGG
58.959.7
Ah 208 (CA)io 207 01 40 x f x f x f F: GCTAATAACACCCAGTGTGGACC R: G ACCCTGT AC AT ACACTTCT A AA ACCC
59.058.7
Ah 209 (AC)|ft 214 10 270 np np xf F:GAAACACATCAGTGCAAGAGCAG R: AGTT A AGG A AC A A ATGTTTGG A AGG A ATG
58.159.3
Ah 210 (CA)„ 179 02 40 x f X X F: ACGGG A ACGTTTC A A A A ATTTAAG ATGTG R: ACGTTTCT ATGGCTC AG A A ACTGG
59.058.7
Ah 211 <CA),3 152 10 291 x r X X F: GCTCATCAGGAGITGAATCTGGC R: TCTGTCATTCAGCAATGGACC
59.256.3
Ah 212 (CAh 173 01 247 x f xr X F: TCAGGCTAACTTTGGGCAAAGC R: AGCCCACTTTCATGACTTGCAG
59.759.4
Ah 217 (CA).o 178 04 286 x np x f F: GCTCAGGCTCTGCTTTGTCTAC R: CACAGATTCAAAACAAGCACCATGC
59.059.3
Ah 320 (AC),, 188 05 289 X X X F: TT AGG AGC A AG ATTTT A A AG A AGGTGC R: A AGTGCTGGGTC AT ACTGG A AT AG
57.758.0
Ah 341 (AC)12 160 03 287 xf xf xf F: GGT A ATG ATTCTG ATTT ACC ACTG AGGG R: ATGTG1T ATC AT ATCTGGTCTTC AC AGC
58.958.7
Ah 343 (AC)n 228 09 288 X xf np F: C ATTGCTT A ACTTCTG A AG A A AC R: CTTGACCC AGC ATTTGTGAAT AAA ACTG
58.659.0
Ah 414 (AC)22 240 12 287 X np np F: CATI'CCAGCTGCTCTTCATTCTTG R: GGCAAAAGCAACTAGGGGC
57.957.7
Ah 421 (CA),5 182 05 263 xf xf xf F: CCCGTTCCACGCTGCTC R: GCCTGCTCACCGAGTGC
59.259.2
Ah 517 (TC),5 176 09 277 np np X F: TTTTCCATCATGCTTCCATCAATACG R: GGCACAAACCAGTAGAGCAATATAATC
57.857.8

Reproduced
with perm
ission of the
copyright ow
ner. Further
reproduction prohibited
without
permission.
Table 3.1 continued
Locus Repeat *Size
(bp)b# o f
allelesc ndAmplified in': a1 ci co Prim er sequences (S' to 3 ')
Tm(°C)
Ah 522 (TCTTC)jj 260 18 37 X X nd F: TTGTGGGACTAAACAGTGAAGCAG R: CAAAGCTGATTIAAAGATGTTCCATCCC
58.958.5
Ah 526 (TC >27 256 18 267 X np X F: GAATGGGGAAGAGAACTGAAAGAGC R: CACTGCTCAGGGACTGGC
59.258.5
Ah 536 <AC)„ 130 07 273 xf xf xf F: CCCTGG nTAGATCACATGATGGAG R: CTGGGCAACCTGTTCCATCT
58.658.4
Ah 630 (TC),2 122 04 286 X np X F: TCCTCCTTCACAATGCTACTTGC R: CGGCAGGCAGTATTATTTCAGTGG
58.759.6
a sequenced cloneb length o f sequenced allele includes a 19bp M 13 primer extension 1 number o f alleles found in A. herodias
£ d number of individuals genotypedc a! = A. alba (n= 1), ci = A. cinerea (n= I), to = A. cocoi (n=2), np = no product, nd = no data f amplified additional alleles not found in A. herodias

CHAPTER 4. Large and small scale geographic patterns of geneticdifferentiation among Great White and Great Blue heron populations
INTRODUCTION
Genetic divergence between parapatric or sympatric populations suggests the
presence of significant barriers to gene flow. Genetic differentiation is a consequence
of reproductive isolation. Barriers to gene exchange between populations and
subsequent genetic differentiation due to natural selection, mutation, or genetic drift
are the fundamental processes of speciation. Interbreeding between populations
counteracts these processes. Migration (movement of individuals between populations
and subsequent interbreeding) is a powerful homogenizing force, and very few
migrants are required to prevent genetic divergence due to random genetic drift (Hard
and Clark 1989).
Mate choice data from Florida Bay suggest that Great White Herons and Great
Blue Herons pair selectively with respect to plumage color (Chapter 2). I observed
more white/white and blue/blue pairs and fewer mixed pairs than expected in a
randomly mating population. This positive assortative pattern suggests that
reproductive barriers exist within the Florida Bay breeding population. However,
mixed pairs did occur providing an opportunity for gene flow not only between Great
White and Great Blue Herons within the Florida Bay population, but also between the
Florida Bay population and other Great Blue Heron populations (e.g. Great Blue
Herons breeding nearby on the southern Florida peninsula). To evaluate large and
small scale geographic patterns of genetic differentiation among Great White and
Great Blue Heron populations, I compared allele frequencies at 12 microsatellite loci
44
Reproduced with permission of the copyright owner. Further reproduction prohibited without permission.

for six A. herodias groups representing four Great Blue Heron subspecies -
occidentalis, wardi, herodias, and fannini (Figure 4.1).
A • Ardea herodias herodias B - Ardea herodias wardi C - Ardea herodias occidentalis D - Ardea herodias fannini
PacificOcean
AtlanticOcean
Figure 4.1: Distribution of the four North American Great Blue Heron subspecies that were sampled to evaluate geographic patterns of genetic variation at microsatellite loci
The nominate race, A. h. herodias, breeds throughout the mid-Atlantic states
(USA) to Nova Scotia (Canada) and west to northern Montana (USA) and southern
Alberta (Canada). Ardea h. wardi is distributed throughout the southeastern and
south-central United States, including the southern Florida peninsula. Ardea h.
occidentalis is restricted to extreme south Florida (Florida Bay and the Florida Keys).
45
Reproduced with permission of the copyright owner. Further reproduction prohibited without permission.

Ardea h. fannini is narrowly distributed along the Pacific coasts o f Washington
(USA), British Columbia (Canada), and southeastern Alaska (USA); it is allopatric
with the other three subspecies and probably rarely interbreeds with any of these.
Ardea h. herodias and A. h. wardi are parapatric. The former is migratory (especially
in the northern portion of its range), and many individuals have winter ranges that
overlap with A. h. wardi and A. h. occidentalis (Palmer 1962, Eckert 1981). The
degree to which these two subspecies interbreed has not been investigated. Ardea. h.
wardi and A. h. occidentalis are also parapatric. Although the intermediate
WQrdemann’s Heron is commonly believed to be a “hybrid” between these two
subspecies, the degree to which they intergrade is also unknown.
I defined six A. herodias groups within these for subspecies: Great Blue
Herons from the Pacific Northwest (B-PNW), northern Great Blue Herons (B-N),
Great Blue Herons from the southern Florida peninsula (B-FP), Great Blue Herons
from Florida Bay (B-FB), Great White Herons from Florida Bay (W-FB), and Great
White Herons from the outer Keys (W-OK). My primary objectives were to
determine if allele frequencies differed significantly between Great White Herons and
Great Blue Herons breeding in Florida Bay (W-FB and B-FB) and whether either (or
both) differed from Great Blue Herons breeding on the nearby Florida peninsula (b-
FP). I also wanted to compare these differences (if any) with those found among other
populations of allopatric and parapatric Great Blue Heron subspecies. Finally, I
looked for evidence of genetic structure within the Great White Heron population by
comparing samples collected along the outer Keys (W-OK) with those collected in
Florida Bay (W-FB).
46
Reproduced with permission of the copyright owner. Further reproduction prohibited without permission.
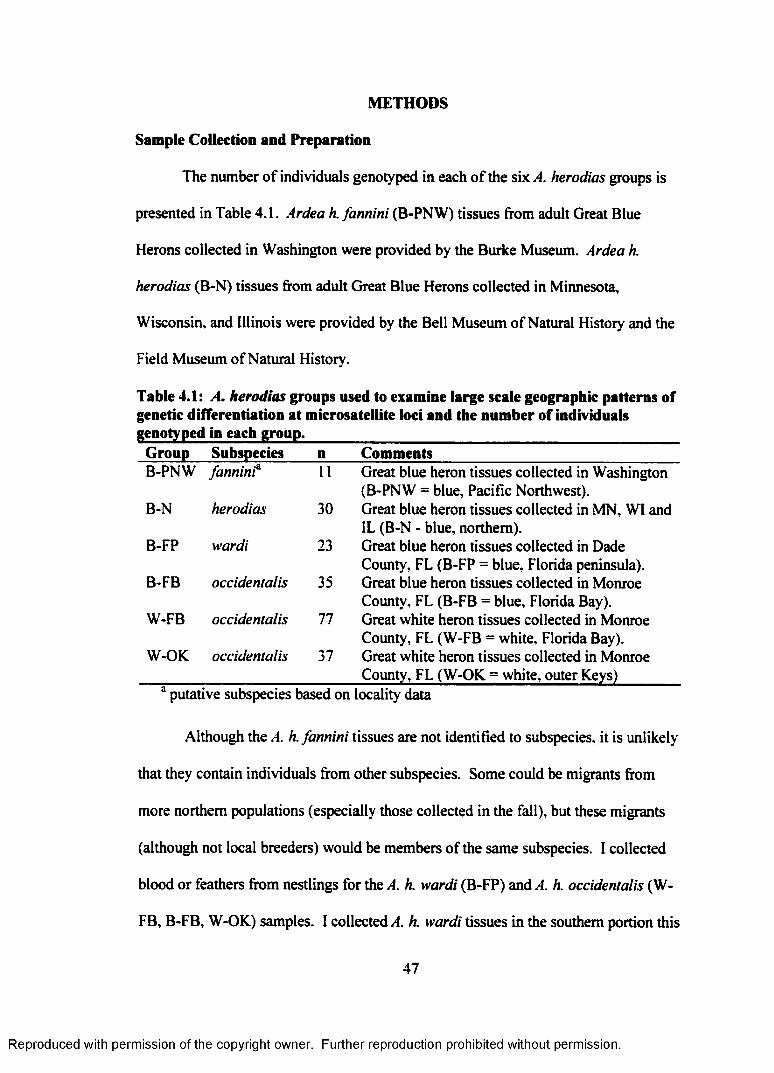
METHODS
Sample Collection and Preparation
The number of individuals genotyped in each of the six A. herodias groups is
presented in Table 4.1. Ardea h. fannini (B-PNW) tissues from adult Great Blue
Herons collected in Washington were provided by the Burke Museum. Ardea h.
herodias (B-N) tissues from adult Great Blue Herons collected in Minnesota,
Wisconsin, and Illinois were provided by the Bell Museum of Natural History and the
Field Museum of Natural History.
Table 4.1: A. herodias groups used to examine large scale geographic patterns of genetic differentiation at microsatellite loci and the number of individuals genotyped in each group.______________________________________________
Group Subspecies n CommentsB-PNW fanninf 11 Great blue heron tissues collected in Washington
(B-PNW = blue, Pacific Northwest).B-N herodias 30 Great blue heron tissues collected in MN, WI and
IL (B-N - blue, northern).B-FP wardi 23 Great blue heron tissues collected in Dade
County, FL (B-FP = blue, Florida peninsula).B-FB occidentalis 35 Great blue heron tissues collected in Monroe
County, FL (B-FB = blue, Florida Bay).W-FB occidentalis 77 Great white heron tissues collected in Monroe
County, FL (W-FB = white, Florida Bay).W-OK occidentalis 37 Great white heron tissues collected in Monroe
County, FL (W-OK = white, outer Keys)a putative subspecies based on locality data
Although the A. h. fannini tissues are not identified to subspecies, it is unlikely
that they contain individuals from other subspecies. Some could be migrants from
more northern populations (especially those collected in the fall), but these migrants
(although not local breeders) would be members of the same subspecies. I collected
blood or feathers from nestlings for the A. h. wardi (B-FP) and A. h. occidentalis (W-
FB, B-FB, W-OK) samples. I collected A. h. wardi tissues in the southern portion this
47
Reproduced with permission of the copyright owner. Further reproduction prohibited without permission.

subspecies’ range (Water Conservation Area 3 A, Dade County, FL), where individuals
are unlikely to interbreed directly with A. h. herodias. Many adult Great Blue Herons
in south Florida during winter and early spring are non-breeding winter migrants. To
minimize the possibility of including migrants from northern subspecies, I collected
feathers from nestlings (Marsden and May 1984). By collecting tissues from
nestlings, I ensured that the B-FB and B-FP samples were representative of local
breeding populations. Sample details are provided in Appendix G.
1 used a sterile 1 mL syringe and 23 gauge needle (Gaunt and Oring 1997) to
collect blood from the tibio-tarsal vein. Approximately 0.1 mL of blood was mixed
with 1.0 mL 10% EDTA anticoagulant/preservative buffer. I allowed red blood cells
(RBCs) to settle overnight, removed and discarded the plasma/EDTA supernatant, re
suspended the RBCs in 1 mL 10% EDTA, and refrigerated the samples at 4 °C.
Feathers were refrigerated at 4 °C during the field season and then stored at -80 °C.
I isolated genomic DNA from each tissue sample (muscle, feather, or blood)
with a DNeasy Tissue Kit (QIAGEN). For muscle samples, I used approximately 50
mg of tissue, followed the kit's extraction protocol for animal tissues, and eluted DNA
from the QIAGEN mini column with 150 pL of 10 mM Tris-HCl (pH 8.3). For
feathers. I cut approximately 5 mm from the root of the feather shaft added 3 mg
dithiothreitol (DTT) to the initial lysis solution, incubated this lysis solution overnight,
and eluted DNA from the QIAGEN mini column with 50 pL o f 10 mM Tris-HCl (pH
8.3). For blood samples I added 50-100 pL of the RBC/EDTA suspension to the
initial lysis solution and eluted DNA from the QIAGEN mini-column with 50 pL of
10 mM Tris-HCl (pH 8.3).
48
Reproduced with permission of the copyright owner. Further reproduction prohibited without permission.

Selection of IVIicrosatellite Loci
I used a number o f criteria to select loci for genetic analyses. First, I omitted
loci with too little or to much variation. Monomorphic loci provide no information
about genetic differentiation among populations. Hypervariable loci often have very
low allele frequencies spread among many alleles. Thus, large sample sizes are
needed to detect small differences in allele frequencies among populations. Second,
tests for population differentiation assume independent loci. I tested this assumption
for all pairs of variable loci with GENEPOP 3.3 - an updated version of GENEPOP
1.2 (Raymond and Rousset 1995). GENEPOP creates a contingency table of the
observed genotype combinations for all pairs of loci in each population. The null
hypothesis (independence of rows and columns) is that genotypes at one locus are
independent from genotypes at another locus. A Markov chain method (Guo and
Thompson 1992) is used to obtain an unbiased estimate of the exact type I error
probability for all pairs of loci in each population (1000 batches, 10,000 iterations per
batch, 10,000 dememorization steps), and Fisher’s combined probability test (Sokal
and Rohlf 1995) is used as a global test for each pair of loci across populations.
Third, a sex-linked locus could produce a false rejection of the null hypothesis
when testing for genetic differentiation (Ho: no difference in allele frequencies among
populations) if a bias in sex ratios exists within any of the heron populations sampled.
To guard against this possibility I determined the sex of a subset of A. herodias
samples (n=20l) and examined allele frequency data for evidence that any of the loci
were sex-linked. If a locus is present only on the “W” chromosome, then all females
(the heterogametic sex, ZW) will be homozygotes, and the locus will not amplify in
49
Reproduced with permission of the copyright owner. Further reproduction prohibited without permission.
males (ZZ). If a locus is present only on the “Z” chromosome, then it will amplify in
both males and females, but all females will be homozygotes.
I used a PCR-based sex identification protocol (Griffiths et al. 1996, Griffiths
et al. 1998) to amplify homologous regions of two CHD (chromo-helicase-DNA-
binding) genes located on the avian “Z” and "W” sex chromosomes. The CHD-Z
gene occurs in both males (ZZ) and females (ZW), but the CHD-W gene is unique to
females (Griffiths and Tiwari 1995, Griffiths and Kom 1997). PCR primers anneal to
conserved regions and amplify across a less conserved intron. PCR products are
digested with HaeIII, which cuts a 65 bp fragment from the CHD-Z gene but does not
cut the CHD-W gene (Griffiths et al. 1996). Females, therefore, have two bands and
males have one band after the restriction enzyme digest (the small 65 bp fragment cut
from the CHD-Z gene is usually not visible on an agarose gel but is not relevant for
sex determination).
I used PCR primers P2 and P8 (Griffiths et al. 1998) to amplify homologous
regions of the two CHD genes. Each 10 pL PCR volume contained 50 mM Tris-HCl
(pH 8.3), 20 mM KC1, 1.5 mM MgCl2, 200 pM dNTPs, 1 pM each P2 and P8 primer.
1.25 units Taq polymerase, and 20-200 ng DNA template. I used a Hybaid Omn-E
thermal cycler and the thermal profile recommended by Griffiths et al. (1998). In A.
herodias, this amplified a fragment just under 400 bp. PCR products were digested
with five units HaelW (New England Biolabs) and a lx final concentration of the
restriction buffer supplied with the enzyme (37 °C, 1 hr). Restriction digests were
visualized under ultraviolet illumination after electrophoresis through a 2% agarose
50
Reproduced with permission of the copyright owner. Further reproduction prohibited without permission.

gel stained with ethidium bromide. Females had two bands (approximately 400 bp
and 335 bp), and males had one band (approximately 335 bp).
Finally, many tests for population differentiation also assume within
population Hardy-Weinberg (HW) equilibrium. To determine which tests for
population differentiation would be appropriate (those assuming HW equilibrium or
those that do not) I used TFPGA 1.3 (Miller 1997) to test for deviations from HW
expectations for each locus within each of the A. herodias groups (Ho: genotype
frequencies do not deviate from HW expectations). Because many loci had expected
genotype values less than one, I used exact tests (conventional Monte Carlo method,
20 batches. 10,000 permutations per batch, 1.000 initial dememorization steps, a
priori a = 0.05), which are preferred over large sample goodness of fit tests (e.g. Chi-
square or G-tests) when sample sizes are small or some genotypes have low expected
values (Guo and Thompson 1992).
Descriptive Statistics and Exact Tests For Population Differentiation
I calculated allele frequencies and unbiased heterozygosity estimates (Nei
1978) for each A. herodias group at each locus using FSTAT 2.9.1 (Goudet 2000) and
TFPGA (Miller 1997) respectively. I used FSTAT to calculate pairwise F st and R st
values. F st and R st (an F st analog often calculated for microsatellite data) are
common descriptive statistics used to evaluate population genetic structure and are
reported here to allow comparison with other studies. I used FSTAT to perform exact
tests for population differentiation between all pairs of the 6 A. herodias groups (Ho:
No difference in allele frequencies between groups; a priori a = 0.05). I chose an
51
Reproduced with permission of the copyright owner. Further reproduction prohibited without permission.

analysis that does not assume HW equilibrium within groups and applied a Bonferroni
correction for multiple comparisons (corrected a = 0.0033).
RESULTS
Selection of Microsatellite Loci
I used 12 of the 17 loci (Table 3.1) for genetic analyses. I omitted Ah 208 and
Ah 212 because they appeared to be monomorphic across the A. herodias groups
being compared, and Ah 210 because it showed extremely low variation across
groups. 1 omitted locus Ah 522 because it was too variable (I found 18 alleles in only
37 heron samples and, presumably, would have found many more). Although it would
be an excellent marker for studies requiring identification of individuals (e.g.
assigning paternity), this locus is composed almost entirely of rare alleles (allele
frequencies generally <0.1), which makes detection of any patterns of population
differentiation extremely difficult.
1 tested for independence of the remaining 13 loci and rejected the null
hypothesis (genotypes at one locus are independent from genotypes at another locus)
in 3 of 78 pairwise tests (Appendix H). All 3 involved the same microsatellite locus -
Ah 211 vs. Ah 341 (p = 0.023, d f= 10), Ah 211 vs. Ah 526 (p = 0.031, df = 8), and
Ah 211 vs. Ah 630 (p = 0.007, df = 10). Although I would expect, by chance, to reject
approximately four o f 78 tests at the 0.05 significance level, and only one of the
contrasts approaches the rejection criteria if a Bonferroni correction for multiple
comparisons is applied (0.05/78 = 0.0064), I adopted a conservative approach and
omitted locus Ah 211 from tests for population differentiation. I found no evidence
52
Reproduced with permission of the copyright owner. Further reproduction prohibited without permission.

that any of the loci were sex-linked. All loci amplified in males (n = 111) and females
(n =110), and heterozygous males and females were found at all loci.
I tested for deviations from HW equilibrium within each of the six A. herodias
groups at 12 microsatellite loci. I rejected the null hypothesis in 8 of 72 tests (Ho:
observed genotype frequencies do not deviate from HW expectations, a = 0.05). One
locus in W-FB (Ah 205, p = 0.0111), one locus in B-FP (Ah 209, p = 0.0097), two loci
in W-OK (Ah 517, p = 0.0166; Ah 536, p = 0.0375) and four loci in B-N (Ah 414, p =
0.0450; Ah 517, p = 0.0074; Ah 526, p = 0.0377; Ah 536, p = 0.0077) appeared to
deviate from HW expectations. There was no evidence of deviation from HW
expectations at any of the 12 loci in the B-FB and B-PNW groups. Only two loci (Ah
571 and Ah 536) deviated from HW expectations within more than one A. herodias
group, suggesting that null alleles (unamplified alleles caused by point mutations in
flanking sequences that prevent PCR primers from annealing) are not an issue for any
of these loci. I would expect to reject, by chance, only about four of 72 tests at the
0.05 significance level. Thus, these tests provide evidence that some of the loci in
some of the A. herodias groups (particularly the B-N group) are not in HW
equilibrium.
Descriptive Statistics and Tests of Population Differentiation.
I genotyped a total of 213 A. herodias individuals at 12 microsatellite loci
(Appendix 0- Allele frequencies and sample sizes for each locus in each of the A.
herodias groups are provided in Appendix J. In general, heterozygosity estimates
(Table 4.2) were high in all six A. herodias groups (average unbiased heterozygosity
over all loci ranged from 0.540 in the W-OK group to 0.671 in the B-FP group) and
53
Reproduced with permission of the copyright owner. Further reproduction prohibited without permission.
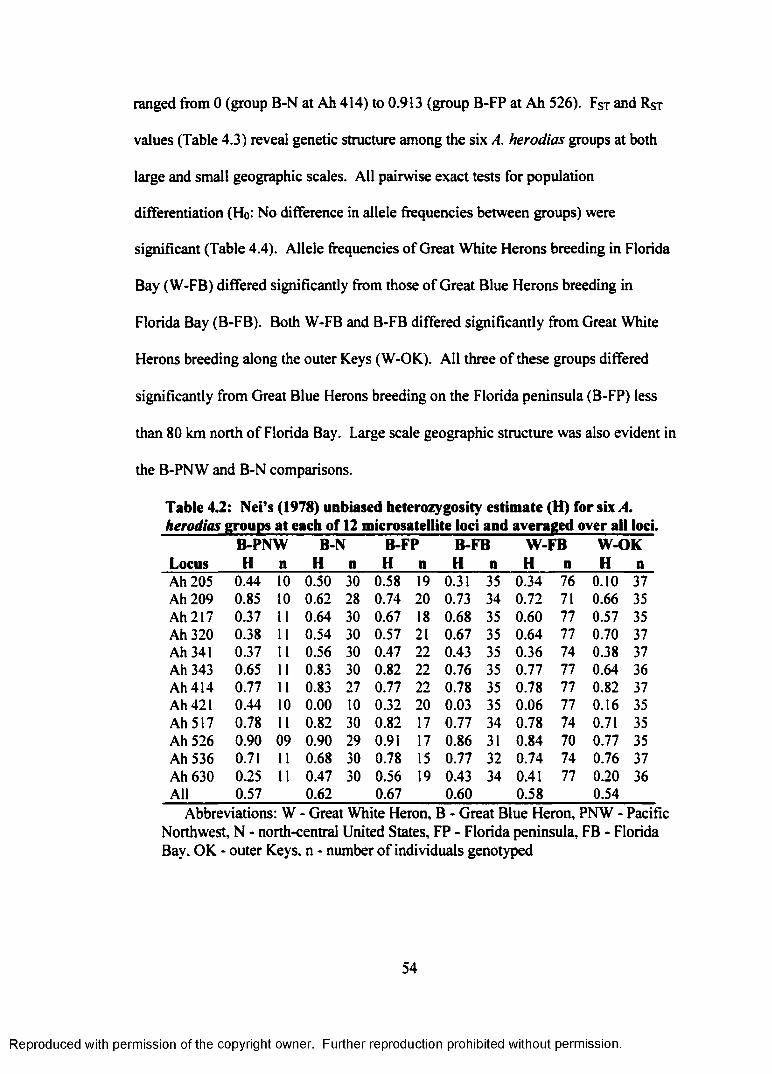
ranged from 0 (group B-N at Ah 414) to 0.913 (group B-FP at Ah 526). F st and Rst
values (Table 4.3) reveal genetic structure among the six A. herodias groups at both
large and small geographic scales. All pairwise exact tests for population
differentiation (Ho: No difference in allele frequencies between groups) were
significant (Table 4.4). Allele frequencies of Great White Herons breeding in Florida
Bay (W-FB) differed significantly from those of Great Blue Herons breeding in
Florida Bay (B-FB). Both W-FB and B-FB differed significantly from Great White
Herons breeding along the outer Keys (W-OK). All three of these groups differed
significantly from Great Blue Herons breeding on the Florida peninsula (B-FP) less
than 80 km north of Florida Bay. Large scale geographic structure was also evident in
the B-PNW and B-N comparisons.
Table 4.2: Nei’s (1978) unbiased heterozygosity estimate (H) for six A.herodias groups at each of 12 microsatellite loci and averaged over all loci.
B-PNW B-N B-FP B-FB W-FB W-OKLocus H n H n H n H n H n H nAh 205 0.44 10 0.50 30 0.58 19 0.31 35 0.34 76 0.10 37Ah 209 0.85 10 0.62 28 0.74 20 0.73 34 0.72 71 0.66 35Ah 217 0.37 11 0.64 30 0.67 18 0.68 35 0.60 77 0.57 35Ah 320 0.38 11 0.54 30 0.57 21 0.67 35 0.64 77 0.70 37Ah 341 0.37 11 0.56 30 0.47 22 0.43 35 0.36 74 0.38 37Ah 343 0.65 11 0.83 30 0.82 22 0.76 35 0.77 77 0.64 36Ah 414 0.77 11 0.83 27 0.77 22 0.78 35 0.78 77 0.82 37Ah 421 0.44 10 0.00 10 0.32 20 0.03 35 0.06 77 0.16 35Ah 517 0.78 11 0.82 30 0.82 17 0.77 34 0.78 74 0.71 35Ah 526 0.90 09 0.90 29 0.91 17 0.86 31 0.84 70 0.77 35Ah 536 0.71 11 0.68 30 0.78 15 0.77 32 0.74 74 0.76 37Ah 630 0.25 11 0.47 30 0.56 19 0.43 34 0.41 77 0.20 36All 0.57 0.62 0.67 0.60 0.58 0.54
Abbreviations: W - Great White Heron, B - Great Blue Heron, PNW - Pacific Northwest, N - north-central United States, FP - Florida peninsula, FB - Florida Bay, OK - outer Keys, n - number of individuals genotyped
54
Reproduced with permission of the copyright owner. Further reproduction prohibited without permission.

Table 4 J : Pairwise F s t values across all loci (above diagonal). Pairwise R s t
values across all loci (below diagonal).________________________________Population* B-PNW B-N B-FP B-FB W-FB W-OKB-PNW 0.0736” 0.0885*' 0.1231” 0.1221“ 0.1861”B-N 0.022 0.0203“ 0.0547“ 0.0675*’ 0.1108“B-FP 0.039 0.016 0.0346** 0.0510** 0.0872“B-FB 0.120 0.045 0.023 0.0066 0.0246**W-FB 0.102 0.058 0.043 0.001 0.0262**W-OK 0.161 0.083 0.059 0.030 0.027
a W - Great White Heron, B - Great Blue Heron, PNW - Pacific Northwest, N - north-central United States, FP - Florida peninsula, FB - Florida Bay, OK - outer Keys
** 99% CI does not include zero (confidence intervals were not calculated for Rst estimates)
Table 4.4: Combined probabilities for exact tests of population differentiation (a after Bonferroni correction for multiple comparisons = 0.0033)._________________________________
Population* B-PNW B-N B-FP B-FB W-FBB-N <0.001B-FP <0.001 <0.001B-FB <0.001 <0.001 <0.001W-FB <0.001 <0.001 <0.001 0.003W-OK <0.001 <0.001 <0.001 <0.001 <0.001
a W - Great White Heron. B - Great Blue Heron, PNW - Pacific Northwest, N - north-central United States, FP - Florida peninsula, FB - Florida Bay. OK - outer Keys
DISCUSSION
Analysis of allele frequencies at 12 microsatellite loci in six A. herodias groups
revealed large and small scale geographic patterns of genetic differentiation (Tables
4.3 and 4.4). I found significant differences in allele frequencies among all four of the
A herodias subspecies compared - A. h. fannini (B-PNW), A. h. herodias (B-N), A. h.
wardi (B-FP), and A. h. occidentalis (W-FB, B-FB, and W-OK). I also found
evidence of genetic subdivision within the Florida Keys A. h. occidentalis population.
Great White Herons and Great Blue Herons breeding in Florida Bay (W-FB and B-
55
Reproduced with permission of the copyright owner. Further reproduction prohibited without permission.

FB) differed significantly from each other, and both differed significantly from Great
White Herons breeding along the outer Keys (W-OK). Although the W-FB vs. B-FB
comparison was significant (Table 4.4), F-statistics indicate that the difference
between these two groups is very small relative to the other comparisons (Table 4.3).
Fst and Rst values, which are measures of the consequence of population
subdivision, are comparable to those found among isolated populations or allopatric
subspecies of other birds (Goostrey et al. 1998, Tarr et al. 1998, von Segesser et al.
1999). However, comparisons with other species are less important than the patterns
of genetic differentiation exhibited among the allopatric. parapatric, and sympatric A.
herodias groups studied. We expect to find genetic divergence between allopatric
groups, but do not necessarily expect to find genetic differentiation among sympatric
groups unless there are reproductive barriers between them.
Table 4.5: Nei’s (1978) unbiased genetic distance ( D ) for all pairwise comparisons of six A. herodias groups____________
Population* B-PNW B-N B-FP B-FB W-FBB-N 0.134B-FP 0.177 0.038B-FB 0.230 0.096 0.060W-FB 0.219 0.115 0.084 0.010W-OK 0.331 0.184 0.138 0.032 0.036
a W - Great White Heron, B - Great Blue Heron, PNW - Pacific Northwest, N - north-central United States, FP - Florida peninsula, FB - Florida Bay. OK - outer Keys
Table 4.5 presents a matrix of unbiased genetic distances (Nei 1978) for all
pairwise comparisons of the six A. herodias groups. A few interesting points emerge
from this distance data. First, the divergence between Great Blue Herons from the
Pacific Northwest (B-PNW) and the other five groups is relatively large, genetic
56
Reproduced with permission of the copyright owner. Further reproduction prohibited without permission.

A
distances ( D ) range from 0.134 to 0.331. This divergence is not surprising because
B-PNW is allopatric with all five groups and separated from them by the continental
divide. Although Great Blue Herons are capable of long distance dispersal,
opportunities for gene flow between B-PNW and the other groups are probably
limited.
Second, the smallest genetic distance in Table 4.5 is for the comparison
between Great White Herons and Great Blue Herons in Florida Bay ( D w -fb vs b - fb =
0.010). The exact test for population differentiation showed a significant difference in
allele frequencies between these two groups (Table 4.4), but this differentiation is
relatively weak, as are all three comparisons within the Florida Keys breeding
A A A
population ( D w -fb v s . b - fb = 0.010, D w -fb v s . w -o k = 0.036, and D b - f b v s . w -o k = 0.032).
Great Blue Herons breeding in Florida Bay are more similar to Great White Herons
( D b - fb v s . w -fb = 0.010, D b - fb v s . w -o k = 0.032) than they are to Great Blue Herons
breeding on the nearby Florida peninsula ( D b - fb vs b -fp = 0.60).
Third, the genetic distance between northern Great Blue Herons and Great
Blue Herons from the Florida peninsula ( D b -n v s . b -fp = 0.038) is comparable to the
distances seen among the Florida Keys groups. Even though sampling locations for
B-N and B-FP were over 2,000 kilometers apart, the genetic distance between them is
only slightly larger than the genetic distance observed between W-FB and W-OK
( D = 0.036), which are separated by less than 100 kilometers.
Finally, although the B-FP sample was collected less than 80 kilometers from
Florida Bay, the genetic distance between Great Blue Herons on the Florida peninsula
5 7
Reproduced with permission of the copyright owner. Further reproduction prohibited without permission.

and Great White Herons in Floirda Bay ( D b -fp vs. w - fb = 0.084) is greater than the B-N
vs. B-FP comparison ( D = 0.038). In other words, Great Blue Herons separated by
thousands of kilometers (B-N and B-FP) are more alike than Great White Herons and
Great Blue Herons separated by less than 80 kilometers (B-FP and W-FB).
These microsatellite data suggest that there are two substantial barriers to gene
flow among the six A. herodias groups studied. The first lies between the three A.
herodias subspecies found in eastern North America and A. h. fannini in the Pacific
Northwest. This divergence is not surprising, given the allopatric distribution of A. h.
fannini (Figure 4.1) and the formidable terrain that must be negotiated before gene
flow can occur between A. h. fannini and any of the eastern subspecies. The second
occurs between the Florida Keys population and Great Blue Herons on the southern
Florida peninsula. This discontinuity in microsatellite allele frequencies is striking
because it suggests that barriers to gene flow among Great Blue Heron populations
throughout the eastern United States (from south Florida to Minnesota, Wisconsin, and
Illinois) are weaker than barriers between the Florida Bay population and Great Blue
Herons breeding on the Florida peninsula less than 80 kilometers from Florida Bay.
The patterns of genetic differentiation among the Florida groups (B-FP. B-FB.
W-FB, and W-OK) provide evidence that even short distance dispersal within the
Great White Heron population is limited Meyerriecks (1957) proposed that the gap
between Florida Bay and the outer Keys might split south Florida's Great White
Herons into two distinct breeding populations, but Robertson (1978) doubted the
existence of this gap. Significant differences in allele frequencies between W-FB and
W-OK and support Meyerriecks' hypothesis. Patterns of genetic differentiation in
58
Reproduced with permission of the copyright owner. Further reproduction prohibited without permission.
south Florida also suggest that most Great Blue Herons breeding in Florida Bay are
permanent members of this population rather than immigrants from the Florida
peninsula. Differences in allele frequencies between Great White and Great Blue
herons breeding in Florida Bay are small. It is likely that the plumage polymorphisms
found in the Florida Keys are the result o f hybridization between Great White Herons
and Great Blue Herons from the Florida peninsula. These microsatellite data suggest
that hybridization events between Florida Bay and Florida peninsula populations may
be relatively rare. Although mate choice within Florida Bay is assortative, the number
of mixed pairs appears to be enough to prevent W-FB and B-FB from differentiating
to the extent observed between the Florida Bay and Florida peninsula populations.
These microsatellite data provide convincing evidence that barriers to gene
flow exist between Great White and Great Blue herons. Two prezygotic isolating
mechanisms may be responsible for limiting gene flow between Florida Bay and the
Florida peninsula. The first is ecological isolation, where taxa occur in the same
geographic area but occupy different habitats. Marked habitat differences between
marine environments in the Florida Keys and freshwater wetlands on the southern
Florida peninsula may inhibit recruitment in either direction. The second mechanism
that may limit gene flow between Florida Bay and the Florida peninsula is temporal
isolation. The Florida Keys population breeds throughout the year, but peak breeding
activity coincides with south Florida's dry season (October through April). Great Blue
Herons on the Florida peninsula generally begin breeding later, in February or March.
This difference in the timing of breeding may limit opportunities for hybridization
between Florida Bay and Florida peninsula populations.
59
Reproduced with permission of the copyright owner. Further reproduction prohibited without permission.

SUMMARY AND CONCLUSIONS
Resolving the debate surrounding the Great White Heron’s taxonomic status
depends on whether reproductive barriers exist between Great White Heron and Great
Blue Heron populations. My data from Florida Bay do not support the hypothesis that
sympatric white and blue herons pair randomly with respect to plumage color. The
positive assortative pattern suggests that prezygotic reproductive barriers exist
between Great White and Great Blue herons within the Florida Keys breeding
population. However, reproductive isolation appears to be incomplete. The putative
hybrid, Wiirdemann’s Heron, produces viable offspring and although the pattern of
mate choice is assortative, my data suggest that mixed pairs occur at about half the
rate expected from a randomly mating population rather than the 10-fold reduction
estimated by Robertson (1978).
Microsatellite data provide evidence that gene flow between Florida Bay and
the Florida peninsula is limited. There are significant differences in allele frequencies
among groups in the Florida Keys, but these differences are small compared to the
differences observed between the Florida Keys population and Great Blue Herons
breeding on the nearby Florida peninsula. The observed patterns of genetic
differentiation suggest that most Great Blue Herons in Florida Bay are permanent
residents rather than migrants from the Florida peninsula, and that immigration into
the Florida Bay population may be a relatively rare event.
Although Great White Herons are larger than Great Blue Herons on the Florida
peninsula (Mayr 1956, Zachow 1983), I found no size differences between Great
White Herons and intermediate Wiirdemann’s Herons. This is consistent with the
60
Reproduced with permission of the copyright owner. Further reproduction prohibited without permission.
microsatellite data, which show that Great Blue Herons in Florida Bay are more
similar to Great White Herons than to Great Blue Herons from the nearby Florida
peninsula. Although Great White and Great Blue Herons from the Florida Keys (W-
FK and B-FK respectively) did not differ significantly in size there was a pattern in
mean values. X b - f k was always intermediate between X w - f k and X b -n (northern
Great Blue Herons) regardless of whether a variable was larger in northern Great Blue
Herons (longest occipital plume) or in Great White Herons (culmen, depth of bill,
tarsus, and middle toe). This is consistent with the hypothesis of a hybrid origin for
Great Blue Herons in the Florida Keys breeding population.
The absence of white individuals in other North American Great Blue Heron
populations and the wide range of blue phenotypes in the Florida Keys population are
more consistent with a hypothesis that south Florida is a contact zone between two
previously isolated taxa rather than a hypothesis that south Florida contains a truly
dichromatic subspecies of the Great Blue Heron (Mayr 1956, Mock 1978, Lazell
1989). The Great White Heron probably diverged from the Great Blue Heron in
isolation during a Pleistocene interglacial. Given the Great White Heron’s present day
distribution, it is likely that this isolation occurred somewhere in the Caribbean.
About 100,000 years ago, sea level in Florida was approximately eight meters higher
than today (Shinn 1988). The Florida Keys were under water and the tip of the
submerged Florida peninsula was about 200 kilometers north of its current position.
Cuba’s present day shoreline is another 150 kilometers from Key West.
Approximately 350-450 kilometers of open water is a significant barrier to dispersal,
especially given the contemporary low levels of genetic differentiation between Great
61
Reproduced with permission of the copyright owner. Further reproduction prohibited without permission.

White Herons in Florida Bay and those along the outer Keys. With the advent of the
Wisconsin Glaciation sea level subsided and fell to its lowest level in recent geological
history (approximately 100 meters lower than it is today) by about 15-20,000 years
ago. As sea level subsided, movement of North American Great Blue Herons onto the
emerging Florida peninsula and westward expansion of the Great White Heron into
the Florida Keys could have produced a contact zone where these two taxa currently
interbreed.
I believe most Great Blue Herons breeding in Florida Bay today are the result
of hybridization between Great White Herons and Great Blue Herons from the Florida
peninsula, and that these hybridizations are relatively rare. Once in the Florida Keys
population, these blue herons and their offspring can (and do) interbreed with Great
White Herons, but even then mate choice is assortative within the Florida Keys
population. My morphological, behavioral and genetic data show that the Florida
Keys population is distinct from the Florida peninsula Great Blue Heron population,
even though their ranges overlap during at least part of the year (some Great White
Herons migrate to the southern Florida peninsula during summer). Although
reproductive barriers are not complete (hybridization between taxa does occur), I
believe the Great White Heron is a good biological species and that a review of its
taxonomic status is merited. Regardless of what we ultimately call the Great White
Heron, species or subspecies, it should be viewed (and managed) as a small isolated
population.
Small populations are more likely to go extinct than large populations
(Goodman 1987). Wading bird populations in the Everglades watershed are estimated
62
Reproduced with permission of the copyright owner. Further reproduction prohibited without permission.

to be less than one fifth of their abundance in the 1930’s (when populations were still
recovering after cessation of the plume trade), and conservative figures estimate the
decline in the total number of nesting attempts by all species of wading birds
combined to be greater than 90% since the 1940’s (Frederick and Spalding 1994,
Ogden 1994). These declines have been linked to habitat loss and deterioration
resulting from human activities. Given the continued threats to south Florida’s
ecosystems from human population growth and expanding agriculture, the Great
White Heron population will almost certainly face serious challenges to its survival in
the future. The scientific community continues to debate the relative importance of
genetic and demographic approaches to conservation (Caro and Laurenson 1994.
Merola 1994, Schemske et al. 1994); both are critical concerns for small isolated
populations. Although microsatellite data show gradual declines in heterozygosity as
you move from the Florida peninsula to the outer Keys (Table 4.2), heterozygosity at
microsatellite loci is still high within the Great White Heron population, and loss of
genetic variation does not appear to be an immediate concern.
However, demographic issues may need to become a focus o f future research.
Estimates of juvenile survival and nest success for Great White Herons in Florida Bay
(Powell 1983. Powell and Powell 1986, Powell and Bjork 1990) are lower than those
reported for other Great Blue Heron populations (Henny and Bethers 1971, Forbes et
al. 1985). Although the Great White Heron population appears to be stable (Powell et
al. 1989, Powell and Bjork 1996), it is not immediately apparent, given Powell’s
demographic estimates, how it replaces itself. Recruitment from other great blue
heron populations seems unlikely and my genetic data suggest that this is not a factor
63
Reproduced with permission of the copyright owner. Further reproduction prohibited without permission.

in maintaining the great white heron population. Whatever the explanation, (published
estimates of survival and nest success may be low, birds may rear more than one
clutch per year, some portions of the great white heron breeding population may be
more productive than others, etc.), effective conservation planning will require a better
understanding of this population's demographics.
64
Reproduced with permission of the copyright owner. Further reproduction prohibited without permission.

LITERATURE CITED
American Ornithologists' Union. 1957. Check-list of North American birds. Port City Press, Inc., Baltimore, Maryland.
American Ornithologists' Union. 1973. Thirty-second supplement to the American Ornithologists’ Union check-list of North American birds. Auk 90:411-419.
Armour, J. A. L., R. Neumann, S. Gobert, and A. J. Jeffreys. 1994. Isolation of human simple repeat loci by hybridization selection. Human Molecular Genetics 3:599-605.
Baldwin, S. P., H. C. Oberholser, and L. G. Worley. 1931. Measurements of birds. Scientific Publications of the Cleveland Museum ofNatural History 11:1-137.
Bancroft. G. 1969. A Great White Heron in Great Blue nesting colony. Auk 86:141- 142.
Butler, R. W. 1992. Great Blue Heron. Pages 1-20 in A. Poole, P. Stettenheim and F. Gill, eds. The birds of North America, No. 25. The Academy ofNatural Sciences, Philadelphia.
Caro, T. M., and M. K. Laurenson. 1994. Ecological and genetic factors in conservation: a cautionary tale. Science 263:485-486.
Crowley, P. H., S. E. Travers, M. C. Linton, S. L. Cohn, A. Sih, and C. R. Sargeant.1991. Mate density, predation risk, and the seasonal sequence of mate choices: a dynamic game. American Naturalist 137:567-596.
del Hoyo, J., A. Elliott, and J. Sargatal. 1992. Handbook of the birds of the world. Vol. 1. Lynx Edicions, Barcelona.
Dobzhansky. T. G. 1937. Genetics and the origin of species. Columbia University Press, New York.
Eckert, A. W. 1981. The wading birds of North America. Doubleday & Company, Inc., New York.
Fischer, D., and K. Bachmann. 1998. Microsatellite enrichment in organisms with large genomes {Allium cepa L.). BioTechniques 24:796-802.
Fleischer, R. C., and S. Loew. 1995. Construction and screening of microsatellite enriched genomic libraries. Pages 459-468 in J. Ferraris and S. Palumbi, eds. Molecular zoology: advances, strategies, and protocols. Wiley-Liss, New York.
65
Reproduced with permission of the copyright owner. Further reproduction prohibited without permission.

Forbes, L. S., K. Simpson, J. P. Kelsall, and D. R. Flook. 1985. Reproductive success of Great Blue Herons in British Columbia. Canadian Journal of Zoology 63:1110-1113.
Frankel, O. H., and M. E. Soule. 1981. Conservation and evolution. Cambridge University Press, Cambridge.
Frederick, P. C., and M. G. Spalding. 1994. Factors affecting reproductive success of wading birds (Ciconiiformes) in the Everglades ecosystem. Pages 659-691 in S. M. Davis and J. C. Ogden, eds. Everglades: the ecosystem and its restoration. St. Lucie Press, Delray Beach, Florida.
Futuyma, D. J. 1998. Evolutionary biology. Third Edition. Sinauer Associates, Sunderland, Massachusetts.
Gaunt, A. S., and L. W. Oring. 1997. Guidelines for use of wild birds in research.The Ornithological Council, Washington, DC.
Gawlik, D. E. 1998. South Florida wading bird report. 4(1).
Gawlik. D. E., and J. C. Ogden. 1996. 1996 late-season wading bird nesting report for south Florida. South Florida Water Management District, West Palm Beach, Florida.
Goodman, D. 1987. The demography of chance extinction. Pages 11-34 in M. E. Soule, ed. Viable populations for conservation. Cambridge University Press. Cambridge.
Goostrey. A., D. N. Carss, L. R. Noble, and S. B. Piertney. 1998. Populationintrogression and differentiation in the great cormorant Phaiacrocorax carbo in Europe. Molecular Ecology 7:329-338.
Goudet. J. 1995. FSTAT (vers. 1.2): a computer program to calculate F-statistics. Journal of Heredity 86:485-486.
Goudet, J. 2000. FSTAT, a program to estimate and test gene diversities and fixation indices (version 2.9.1). Available from http://www.unil.ch/izea/softwares/ fstat.html. Updated from Goudet (1995).
Griffiths, R.. S. Daan, and C. Dijkstra. 1996. Sex identification in birds using two CHD genes. Proceedings of the Royal Society of London B 263:1251-1256.
Griffiths, R., M. C. Double, K. Orr, and R. J. G. Dawson. 1998. A DNA test to sex most birds. Molecular Ecology 7:1071-1075.
Griffiths, R., and R. Kom. 1997. A CHD1 gene is Z chromosome linked in the chicken Gallus domesticus. Gene 197:225-229.
66
Reproduced with permission of the copyright owner. Further reproduction prohibited without permission.

Griffiths, R., and B. Tiwari. 1995. Sex of the last wild Spix's macaw. Nature 375:454.
Guo, S. W., and E. A. Thompson. 1992. Performing the exact test of Hardy- Weinberg proportion for multiple alleles. Biometrics 48:361-372.
Hamilton, M. B., E. L. Pincus, A. DiFiore, and R. L. Fleischer. 1999. Universal linker and ligation procedures for construction of genomic DNA libraries enriched for microsatellites. BioTechniques 27:500-507.
Hancock, J., and H. Elliott. 1978. The herons of the world. Harper & Row, New York.
Hard, D. L.. and A. G. Clark. 1989. Principles of population genetics. Second Edition. Sinauer Associates. Sunderland, Massachusetts.
Henny. C. J., and M. R. Bethers. 1971. Population ecology of the Great Blue Heron with special reference to western Oregon. Canadian Field Naturalist 85:205- 209.
Holt, E. G. 1928. The status of the Great White Heron (Ardea occidentalis Audubon) and WurdemaiuTs Heron (Ardea wurdemannii Baird). Scientific Publications of the Cleveland Museum ofNatural History 1:1-35.
Lazell, J. D., Jr. 1989. Wildlife of the Florida Keys: a natural history. Island Press. Washington, D.C.
Longmire, J. L., D. C. Hahn, and J. L. Roach. 1999. Low abundance of microsatellite repeats in the genome of the Brown-headed Cowbird (Molothrus ater). Heredity 90:574-578.
Marsden, J. E.. and B. May. 1984. Feather pulp: a non-destructive sampling technique for electrophoretic studies of birds. Auk 101:173-175.
Mayr, E. 1942. Systematics and the origin of species. Columbia University Press. New York.
Mayr, E. 1956. Is the Great White Heron a good species? Auk 73:71-77.
McHenry, E. N.. and J. C. Dyes. 1983. First record of juvenal "white-phase" Great Blue Heron in Texas. American Birds 37:119.
Meffe, G. K., and C. R. Carroll. 1994. Principles of conservation biology. Sinauer Associates, Sunderland, Massachusetts.
67
Reproduced with permission of the copyright owner. Further reproduction prohibited without permission.

Merola, M. 1994. A reassessment of homozygosity and the case for inbreeding depression in the cheetah, Acinonyx jubatus: implications for conservation. Conservation Biology 8:961-971.
Meyerriecks, A. J. 1957. Field observations pertaining to the systematic status of the Great White Heron in the Florida Keys. Auk 74:469-478.
Meyerriecks, A. J. 1960. Comparative breeding behavior of four species of North American herons. Publications of the Nuttall Ornithological Club 2:1-158.
Miller, M. P. 1997. Tools for population genetic analysis (TGPGA) 1.3: a Windows program for the analysis of allozyme and molecular population genetic data. Computer software distributed by author.
Mock, D. W. 1976. Pair-formation displays of the Great Blue Heron. Wilson Bulletin 88:185-230.
Mock, D. W. 1978. White-dark polymorphism in herons. Pages 145-161 in L. D. Drawe, ed. Proceedings of the first Welder Wildlife Foundation symposium. Welder Wildlife Foundation, Sinton, Texas.
Nei, M. 1978. Estimation of average heterozygosity and genetic distance from a small number of individuals. Genetics 89:583-590.
Nuechterlein, G. L., and D. Buitron. 1998. Interspecific mate choice by late-courting male western grebes. Behavioral Ecology 9:313-321.
Oberholser, H. C. 1912. A revision of the forms of the Great Blue Heron {Ardea herodias Linnaeus). Proceedings of the United States National Museum 43:531-559.
Ogden, J. C. 1994. A comparison of wading bird nesting colony dynamics (1931-1946 and 1974-1989) as an indication of ecosystem conditions in the southern Everglades. Pages 533-570 in S. M. Davis and J. C. Ogden, eds. Everglades: the ecosystem and its restoration. St. Lucie Press, Delray Beach, Florida.
Ott. R. L. 1993. An introduction to statistical methods and data analysis. Duxbury Press, Belmont, California.
Palmer, R. S. 1962. Handbook of North American birds. Yale University Press, New Haven, Connecticut.
Powell, G. V., R. D. Bjork. J. C. Ogden, R. T. Paul, A. H. Powell, and J. William B. Robertson. 1989. Population trends in some Florida Bay wading birds.Wilson Bulletin 101:436-457.
68
Reproduced with permission of the copyright owner. Further reproduction prohibited without permission.
Powell, G. V. N. 1983. Food availability and reproduction by Great White Herons, Ardea herodias: a food addition study. Colonial Waterbirds 6:139-147.
Powell, G. V. N., and R. Bjork. 1996. Species of special concern: Great WhiteHeron. Pages 388-403 in J. A. Rodgers, Jr., H. W. Kale, II and H. T. Smith, eds. Rare and endangered biota of Florida. Volume V. Birds. University Press of Florida, Gainesville, Florida.
Powell, G. V. N., and R. D. Bjork. 1990. Studies of wading birds in Florida Bay: abiological assessment of the ecosystem. National Audubon Society, Tavemier, Florida.
Powell, G. V. N., and A. H. Powell. 1986. Reproduction by Great White Herons Ardea herodias in Florida Bay as an indicator of habitat quality. Biological Conservation 36:101-113.
Primmer, C. R., T. Raudsepp. B. P. Chowdhary, A. P. Moller, and H. Ellegren. 1997. Low frequency of microsatellites in the avian genome. Genome Research 7:471-482.
Proctor, N. S., and P. J. Lynch. 1993. Manual of ornithology. Yale University Press, New Haven. Connecticut.
Queller, D. C.. J. E. Strassmann. and C. R. Hughes. 1993. Microsatellites and kinship. Trends in Ecology and Evolution 8:285-288.
Quicke, D. L. J. 1993. Principles and techniques o f contemporary taxonomy. Blackie Academic & Professional. London.
Raffaele, H., J. Wiley, O. Garrido, A. Keith, and J. Raffaele. 1998. A guide to the birds of the West Indies. Princeton University Press, Princeton, New Jersey.
Raymond, M., and F. Rousset. 1995. GENEPOP (version 1.2): population genetics software for exact tests and ecumenicism. Journal of Heredity 86:248-249.
Ridgway, R. 1878. Studies of the American herodiones. Bulletin of the United States Geological and Geographical Survey of the Territories IV:219-251.
Ridgway, R. 1887. Notes on Ardea wuerdemanni Baird. Proceedings of the United States National Museum 10:112-115.
Robertson. W. B., Jr. 1978. Species of special concern: Florida Great White Heron. Pages 69-72 in H. W. Kale, II, ed. Rare and endangered biota of Florida. Volume Two: Birds. University Presses of Florida, Gainesville, Florida.
Sambrook, J., E. F. Fritsch, and T. Maniatis. 1989. Molecular cloning a laboratory manual. 2nd Edition. Cold Spring Harbor Laboratory, New York.
69
Reproduced with permission of the copyright owner. Further reproduction prohibited without permission.

Schemske, D. W., B. C. Husband, M. H. Ruckelshaus, C. Goodwillie, I. M. Parker,and J. G. Bishop. 1994. Evaluating approaches to the conservation of rare and endangered plants. Ecology 75:584-606.
Schlotterer, C., and J. Pemberton. 1994. The use of microsatellites for geneticanalysis of natural populations. Pages 203-214 in B. S. B. Schierwater, G. P. Wagner, and R. DeSalle, eds. Molecular ecology and evolution: approaches and applications. Birkhauser Verlag Basel, Switzerland.
Schlotterer, C., and D. Tautz. 1992. Slippage synthesis of simple sequence DNA. Nucleic Acids Research 20:211-215.
Shapiro, S. S., and M. B. Wilk. 1965. An analysis of variance test for normality (complete samples). Biometrika 52:591 -611.
Shinn, E. A. 1988. The geology of the Florida Keys. Oceanus 31:47-53.
Sokal, R. R., and F. J. Rohlf. 1995. Biometry. Third Edition. W. H. Freeman and Company, New York.
Soule, M. E., and B. A. Wilcox. 1980. Conservation biology: an evolutionary- ecological perspective. Sinauer Associates, Sunderland, Massachusetts.
Stevenson, H. M., and B. H. Anderson. 1994. The birdlife of Florida. University Press of Florida, Gainesville, Florida.
Sunnucks, P. 2000. Efficient genetic markers for population biology. Trends in Ecology and Evolution 15:199-203.
Tarr, C. L., C. Fleischer, and R. C. Fleischer. 1998. Founder events and variation at microsatellite loci in an insular passerine bird, the Laysan finch (Telespiza cantans). Molecular Ecology 7:719-731.
Tarr. C. L., and R. C. Fleischer. 1998. Primers for polymorphic GT microsatellites isolated from the Mariana crow, Corvus kubaryi. Molecular Ecology 7:253- 255.
von Segesser, F., N. Menard, B. Gaci, and R. D. Martin. 1999. Geneticdifferentiation within and between isolated Algerian subpopulations of Barbary macaques (Macaca sylvanus): evidence from microsatellites. Molecular Ecology 8:433-442.
Zachow, K. F. 1983. The Great Blue and Great White Heron (Aves: Ciconiiformes: Ardeidae): a multivariate morphometric analysis of skeletons. M.S. Thesis, University o f Miami, Coral Gables, Florida. 107pp.
70
Reproduced with permission of the copyright owner. Further reproduction prohibited without permission.

Zar, J. H. 1984. Biostatistical analysis. Second Edition. Prentice-Hall, Inc., Englewood Cliffs, New Jersey.
71
Reproduced with permission of the copyright owner. Further reproduction prohibited without permission.

APPENDIX A: Morphological variables reported in previous studies of Great White and Great Blue herons
The following table contains a list of morphological variables for which measurements from museum skins3 of adult Great White Herons and intermediate Wiirdemann’s Herons of known sex have been published.
Group ID Number £ Wing
ch
ord
Tail
Cul
men
Depth
of
Bill
Tibi
a
Tars
us
Mid
dle
toe
Occ
ipita
lpl
ume
Citat
ion
b
Intermediate USNM 8690 M X X X X X X X X R.l-2, HUSNM 110210 M X X X X X X X R2, HCBC 8009 M X X X X X X R2CBC 8011 M X X X X X X R2CVfNH 1767 M X X X X X X HCMNH 1405 M X X X X X X HCMNH 1408 M X X X X X X HUSNM 110211 F X X X X X X X R2, HCBC 8010 F X X X X X X R2CBC 8012 F X X X X X X R2CMNH 1765 F X X X X X X HCMNH 1409 F X X X X X X HCMNH 1410 F X X X X X X HCMNH 1407 F X X X X X X H
White MCZ 219809 M X HMCZ 246697 M X HMCZ 246698 M X HMCZ 246699 M X HMCZ 207887 M X HMCZ 229215 M X HMCZ 246715 M X HUSNM 110675 M X HUSNM 6540 M X HUSNM 110695 M X HCMNH 1395 M X HMCZ 246700 F X HMCZ 219810 F X HMCZ 42534 F X HSanford Coll. F X HUSNM 269254 F X HUSNM 110696 F X HCM 94832 F X HCM 94889 F X HCMNH 1397 F X HCMNH 1393 F X HCMNH 1394 F X H
3 Zacow (1983) measured Great White Heron skeletons b H = Holt 1928, R1 = Ridgway 1878, R2 = Ridgway 1887
Reproduced with permission of the copyright owner. Further reproduction prohibited without permission.
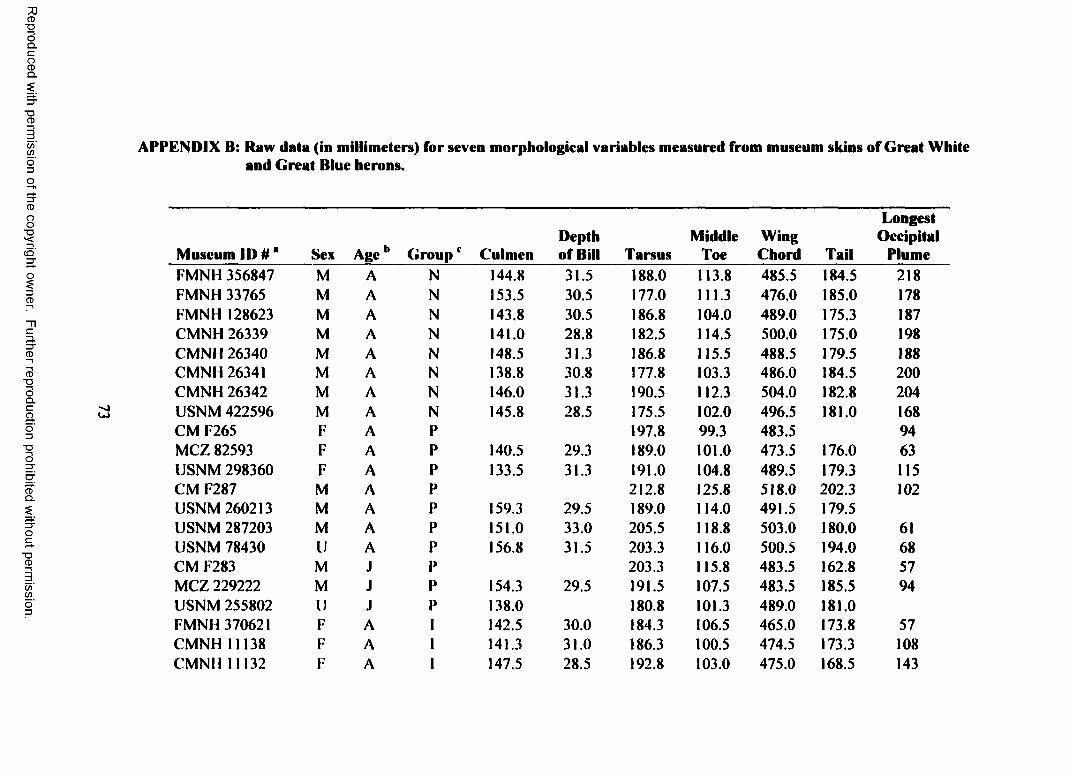
Reproduced
with perm
ission of the
copyright ow
ner. Further
reproduction prohibited
without
permission.
APPENDIX B: Raw data (in millimeters) for seven morphological variables measured from museum skins of Great White and Great Blue herons.
Museum ID#" Sex Age b Groupc CulmenDepth of Bill Tarsus
MiddleToe
WingChord Tail
LongeOccipit
PlumFMNH 356847 M A N 144.8 31.5 188.0 113.8 485.5 184.5 218FMNH 33765 M A N 153.5 30.5 177.0 111.3 476.0 185.0 178FMNH 128623 M A N 143.8 30.5 186.8 104.0 489.0 175.3 187CMNH 26339 M A N 141.0 28.8 182.5 114.5 500.0 175.0 198CMNH 26340 M A N 148.5 31.3 186.8 115.5 488.5 179.5 188CMNH 26341 M A N 138.8 30.8 177.8 103.3 486.0 184.5 200CMNH 26342 M A N 146.0 31.3 190.5 112.3 504.0 182.8 204USNM 422596 M A N 145.8 28.5 175.5 102.0 496.5 181.0 168CM F265 F A P 197.8 99.3 483.5 94MCZ 82593 F A P 140.5 29.3 189.0 101.0 473.5 176.0 63USNM 298360 F A P 133.5 31.3 191.0 104.8 489.5 179.3 115CM F287 M A P 212.8 125.8 518.0 202.3 102USNM 260213 M A P 159.3 29.5 189.0 114.0 491.5 179.5USNM 287203 M A P 151.0 33.0 205.5 118.8 503.0 180.0 61USNM 78430 U A P 156.8 31.5 203.3 116.0 500.5 194.0 68CM F283 M J P 203.3 115.8 483.5 162.8 57MCZ 229222 M J P 154.3 29.5 191.5 107.5 483.5 185.5 94USNM 255802 U J P 138.0 180.8 101.3 489.0 181.0FMNH 370621 F A 1 142.5 30.0 184.3 106.5 465.0 173.8 57CMNH 11138 F A 1 141.3 31.0 186.3 100.5 474.5 173.3 108CMNH 11132 F A 1 147.5 28.5 192.8 103.0 475.0 168.5 143

Reproduced
with perm
ission of the
copyright ow
ner. Further
reproduction prohibited
without
permission.
APPENDIX B continued
Museum II) # * Sex Ageb Groupc CulmenCMNH 11139 F A 143.3MCZ 246710 F A 148.0MCZ 246712 F A 147.5MCZ 48302 F A 146.8MCZ 246708 F A 153.3MCZ 246709 F A 145.0MCZ 251272 F A 147.3USNM 110211 F A 163.8LSUMZ 155814 F A 154.5MCZ 246713 F J 150.0MCZ 2467II F J 145.3MCZ 246707 F J 163.5MCZ 246706 M A 153.0MCZ 246705 M A 153.3MCZ 246704 M A 157.0MCZ 246702 M A 158.0MCZ 246701 M A 158.8MCZ 101086 M A 160.0MCZ 246703 M A 167.8FMNH 370620 M A 167.5FMNH 385671 M A 156.8FMNH 360099 M A 161.0FMNH 33767 M A 166.5USNM 332552 M A 139.8
Depthof Bill Tarsus29.0 183.029.3 176.828.8 182.028.8 185.530.8 189.829.8 187.831.8 188.835.8 198.029.3 198.229.3 191.831.3 193.331.5 208.032.5 189.031.5 186.531.0 203.833.0 200.333.8 210.333.8 211.832.0 209.032.7 208.831.5 205.531.3 188.032.8 220.329.0 198.5
Middle Wing Toe Chord106.8 451.0101.5 447.5105.8 460.0110.0 470.0110.0 469.598.0 461.5104.8 467.5106.0 484.0113.5107.8 460.0100.5 459.0114.8 473.5111.0 494.5113.5 473.0113.3 474.0116.0 495.5118.5 474.5116.8 505.5113.0 497.0115.5 495.0116.5 481.0114.5 494.0125.3 500.5111.8 486.0
Longest Occipital
Tail Plume162.8 119172.0 151177.3 143169.0 51176.8 147167.0 138173.0 46170.0 142184.3171.3 59164.0 38170.0 74181.3 170172.3 148160.5 161177.0 98169.3 78188.0 69183.0 179184.8 128173.3 86187.0 101187.3 75181.5 90
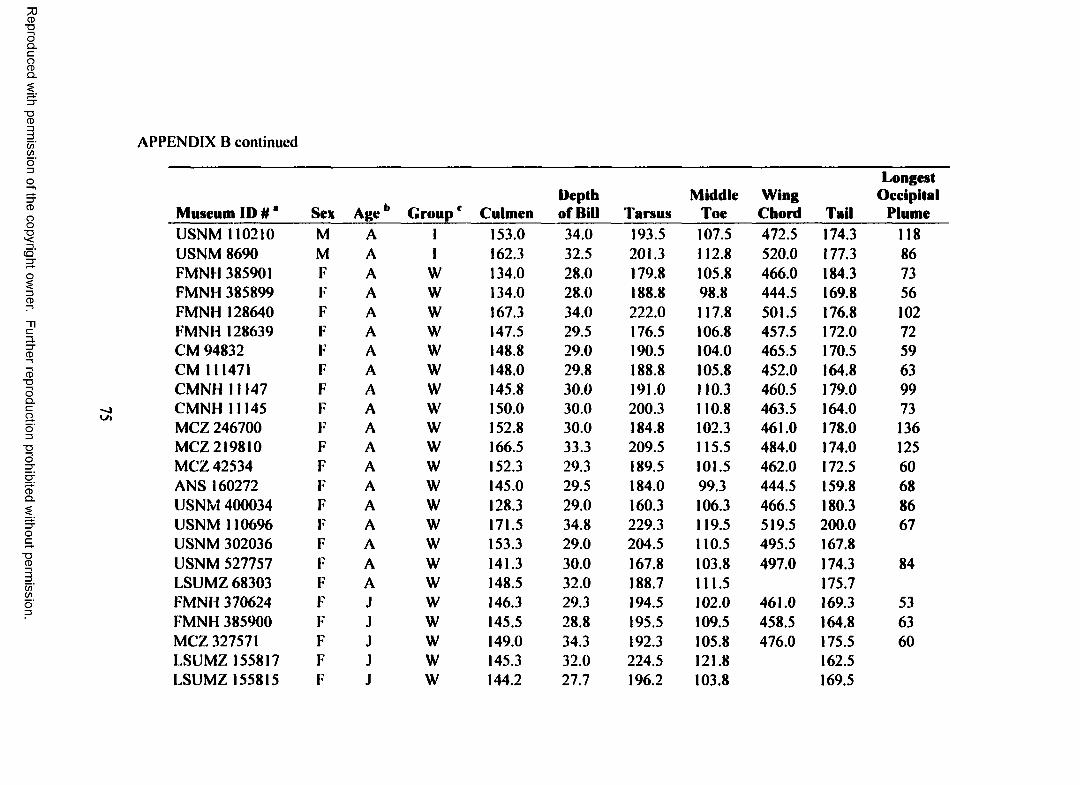
Reproduced
with perm
ission of the
copyright ow
ner. Further
reproduction prohibited
without
permission.
APPENDIX B continued
Museum IP #" Sex Age b GroupcUSNM 110210 M A IUSNM 8690 M A 1FMNH 385901 F A WFMNH 385899 F A WFMNH 128640 F A WFMNH 128639 F A WCM 94832 F A WCM 111471 F A WCMNH 11147 F A WCMNH 11145 F A WMCZ 246700 F A WMCZ 219810 F A WMCZ 42534 F A WANS 160272 F A WUSNM 400034 F A WUSNM 110696 F A WUSNM 302036 F A WUSNM 527757 F A WLSUMZ 68303 F A WFMNH 370624 F J WFMNH 385900 F J WMCZ 327571 F J WLSUMZ 155817 F J WLSUMZ 155815 F J W
LongestDepth Middle Wing Occipital
Culmen of Bill Tarsus Toe Chord Tail Plume153.0 34.0 193.5 107.5 472.5 174.3 118162.3 32.5 201.3 112.8 520.0 177.3 86134.0 28.0 179.8 105.8 466.0 184.3 73134.0 28.0 188.8 98.8 444.5 169.8 56167.3 34.0 222.0 117.8 501.5 176.8 102147.5 29.5 176.5 106.8 457.5 172.0 72148.8 29.0 190.5 104.0 465.5 170.5 59148.0 29.8 188.8 105.8 452.0 164.8 63145.8 30.0 191.0 110.3 460.5 179.0 99150.0 30.0 200.3 110.8 463.5 164.0 73152.8 30.0 184.8 102.3 461.0 178.0 136166.5 33.3 209.5 115.5 484.0 174.0 125152.3 29.3 189.5 101.5 462.0 172.5 60145.0 29.5 184.0 99.3 444.5 159.8 68128.3 29.0 160.3 106.3 466.5 180.3 86171.5 34.8 229.3 119.5 519.5 200.0 67153.3 29.0 204.5 110.5 495.5 167.8141.3 30.0 167.8 103.8 497.0 174.3 84148.5 32.0 188.7 111.5 175.7146.3 29.3 194.5 102.0 461.0 169.3 53145.5 28.8 195.5 109.5 458.5 164.8 63149.0 34.3 192.3 105.8 476.0 175.5 60145.3 32.0 224.5 121.8 162.5144.2 27.7 196.2 103.8 169.5

Reproduced
with perm
ission of the
copyright ow
ner. Further
reproduction prohibited
without
permission.
APPENDIX B continued
Museum I P # 1 Sex Ageh GroupcMCZ 246698 M A WMCZ 229215 M A WMCZ 246697 M A WMCZ 219809 M A WMCZ 246715 M A WMCZ 101085 M A WMCZ 207887 M A WMCZ 301205 M A WMCZ 301207 M A WMCZ 186366 M A WMCZ 251273 M A WFMNH 385669 M A WCM F262 M A WCM F263 M A WFMNH 111914 M A WFMNH 128638 M A WCMNH 11148 M A WUSNM 110695 M A WUSNM 110675 M A WUSNM 89896 M A WLSUMZ 136102 M A WLSUMZ 136101 M A WLSUMZ 155818 M A WLSUMZ 155816 M A W
LongestDepth Middle Wing Occipital
Culmen of Bill Tarsus Toe Chord Tail Plume162.8 33.0 215.0 108.8 474.0 172.8 153160.0 35.3 199.5 113.8 503.5 187.0 76157.8 32.5 195.3 112.5 488.5 172.0 73161.8 33.5 190.5 115.0 493.5 182.5 171167.3 33.3 191.5 117.5 480.5 186.3 184162.8 32.3 226.3 121.3 511.0 179.8 38160.5 32.3 199.5 103.0 481.5 173.0 146150.8 32.0 191.3 105.5 482.0 188.5 89160.3 31.8 202.5 111.0 498.0 178.0 115160.8 33.0 206.8 122.5 502.5 184.5 55162.5 34.0 224.5 124.3 485.5 173.3 75160.5 31.0 205.3 115.0 504.5 184.0 170
219.0 122.3 482.0 193.0 64214.3 118.8 492.0 183.0 146
152.0 29.5 191.8 115.8 469.0 173.0 53161.5 32.0 199.0 121.3 492.5 192.0 94159.3 32.3 198.0 116.5 484.0 181.3 37162.5 32.5 226.0 126.5 513.0 187.7 75171.5 32.8 218.3 120.8 504.0 179.8 81162.3 34.0 199.0 122.5 465.0 186.8 69152.8 31.3 204.5 118.3 174.3158.3 31.0 223.0 123.5 184.3156.0 34.0 209.3 115.0 178.7161.3 33.0 212.6 115.8 183.7

Reproduced
with perm
ission of the
copyright ow
ner. Further
reproduction prohibited
without
permission.
APPENDIX B continued
Museum ID # * Sex Age b Groupc CulmenDepth of Bill Tarsus
MiddleToe
WingChord Tail
LongestOccipital
PlumeFMNH 370867 M J W 146.8 30.3 195.0 109.5 475.0 169.8 51FMNH 370622 M J W 158.0 31.8 211.5 112.0 475.0 176.8 48CM F260 M J w 226.5 122.8 499.0 185.8 62MCZ 246699 M J w 160.5 32.3 219.0 123.5 472.5 172.5 59MCZ 251274 M J w 144.0 33.5 208.0 118.0 486.0 173.3 59FMNH 33769 U A w 162.3 31.0 190.5 112.8 477.5 175.8 122MCZ 46874 U A w 160.8 32.5 199.0 111.2 480.0 182.8 69ANS 48018 U J w 164.5 32.3 214.3 114.8 497.5 181.5 52
a ANS = Academy ofNatural Sciences (Philadelphia), CM = Carnegie Museum (Pittsburgh), CMNH = Cleveland-j Museum ofNatural History, FMNH = Field Museum ofNatural History (Chicago), LSUMZ = Louisiana State
University Museum ofNatural Science (Baton Rouge), MCZ = Museum of Comparative Zoology (Harvard University), USNM = United State National Museum (Washington, DC)
b A = adult, J = juvenilec N = Great Blue Heron collected from northeastern and north-central United States, I = intermediate Wtirdemann’s
Heron, W = Great White Heron

APPENDIX C: Flow charts of statistical procedures used for morphometricanalyses of adult male and female Great White Herons and Great Blue Herons
Statistical procedures used for morphometric analysis o f adult male Great White and Great Blue herons
Ho: Data distri )uted normally?1
Ho
Yes
2 _ 2 2 b: c b-n - cr b -fk - « w -fk Hq: No difference in population distributions1
No Yes
Ho: (a B-N - f t B-FK - |2 W-FK
Yes No
Pairwise comparisons (H0: b -n = |i b -f k , H0: b -n = H- w -f k ,
Hq: (i b -f k = p w -f k )
a W-test for normality (Shapiro and Wilk 1965) b Bartlett’s test for homogeneity of variances (Sokal and Rohlf 1995) c Kruskal Wallis H test (Sokal and Rohlf 1995) d One-way ANOVA (Sokal and Rohlf 1995)
B-N = Great Blue Herons from northeast and north-central United States B-FK = Great Blue Herons from the Florida Keys breeding population W-FK = Great White Herons from the Florida Keys breeding population
78
Reproduced with permission of the copyright owner. Further reproduction prohibited without permission.

APPENDIX C continued
Statistical procedures used for morphometric analysis of adult female Great White and Great Blue herons
H q: Data distributed normally?a
Yes Jo
u 2 _ 2H q: a b -f k _ o W-FK Ho: No difference in
population distributionsc
Yes
Ho: H b -f k - n W-FK ' Hq: H B-FK - n W-FK '
a W-test for normality (Shapiro and Wilk 1965) b F-test (Sokal and Rohlf 1995)0 Mann-Whitney U-test (Sokal and Rohlf 1995) d t-test assuming equal variance (Ott 1993)6 t'-test assuming unequal variances (Ott 1993)
B-FK = Great Blue Herons from the Florida Keys breeding population W-FK = Great White Herons from the Florida Keys breeding population
79
Reproduced with permission of the copyright owner. Further reproduction prohibited without permission.

APPENDIX D: Tests of ANOVA assumptions (normality and homogeneity of variance) for seven morphological variables measured from museum skins of adult male herons.
Normal distribution ** Homogeneity of a 2 c Variable Group * W n p < W X2 df p > X2
Culmen B-N 0.9697 08 0.8927 3.99 2 0.1362B-FK 0.9118 14 0.1652W-FK 0.9226 22 0.0840
Depth of Bill B-N 0.8384 08 0.0745 0.23 2 0.8922B-FK 0.9300 14 0.2963W-FK 0.9785 22 0.8760
Tarsus B-N 0.9018 08 0.3044 4.12 2 0.1273B-FK 0.9626 14 0.7227W-FK 0.9286 24 0.0925
Middle Toe B-N 0.8472 08 0.0914 1.96 2 0.3759B-FK 0.9232 14 0.2385W-FK 0.9573 24 0.3940
Wing B-N 0.9604 08 0.8137 1.64 2 0.4395B-FK 0.9233 14 0.2397W-FK 0.9690 20 0.7255
Tail B-N 0.8637 08 0.1332 3.40 2 0.1827B-FK 0.9399 14 0.3996W-FK 0.9452 24 0.2190
Occipital B-N 0.9869 08 0.9857 7.93 2 0.0190*plume B-FK 0.8987 14 0.1073
W-FK 0.8957 20 0.0348’a B-N = Great Blue Herons collected in northeastern and north-central United
States, B-FK = Wurdemann’s Herons collected in the Florida Keys (Monroe County, FL), W-FK = Great White Herons collected in the Florida Keys (Monroe County, FL).
b Test statistic (W), n, and p-value of the W test for normality (Shapiro and Wilk 1965). Flo: observations within a group are normally distributed.
c Test statistic (X‘), degrees of freedom (df), and p-value of Bartlett’s test for homogeneity of variances (Sokal and Rohlf 1995). Ho: cr b -n - cr B-f k = w -f k -
80
Reproduced with permission of the copyright owner. Further reproduction prohibited without permission.

APPENDIX E: Tests of t-test assumptions (normality and homogeneity of variance) for seven morphological variables measured from museum skins of adult female herons.
Normal distribution b Homogenetiy of sz c Variable Group * W n p < W F df p > F
Culmen B-FK 0.8629 12 0.0502 3.49 16,11 0.0409*W-FK 0.9423 17 0.3467
Depth of Bill B-FK 0.7618 12 0.0027” 1.04 11,16 0.9194W-FK 0.8310 17 0.0049”
Tarsus B-FK 0.9614 12 0.7479 7.73 16,11 0.0015”W-FK 0.9498 17 0.4482
Middle Toe B-FK 0.9816 12 0.9677 1.95 16,11 0.2659W-FK 0.9549 16 0.5284
Wing B-FK 0.9741 11 0.9135 4.18 15, 10 0.0275*W-FK 0.8935 16 0.0641
Tail B-FK 0.9700 12 0.8607 2.68 16,11 0.1021W-FK 0.9216 17 0.1601
Occipital B-FK 0.7871 11 0.0074” 2097 10, 14 0.0524plume W-FK 0.8664 15 0.0298*
a B-FK = Wurdemann’s Herons collected in the Florida Keys (Monroe County,FL), W-FK = Great White Herons collected in the Florida Keys (Monroe County, FL).
b Test statistic (W), n, and p-value of the W test for normality (Shapiro and Wilk 1965). Ho: observations within a group are normally distributed.
c Test statistic (F). degrees of freedom (df), andj>value for test of homogeneity of variances (Sokal and Rohlf 1995). H q: variances (s") among groups are equal.
81
Reproduced with permission of the copyright owner. Further reproduction prohibited without permission.
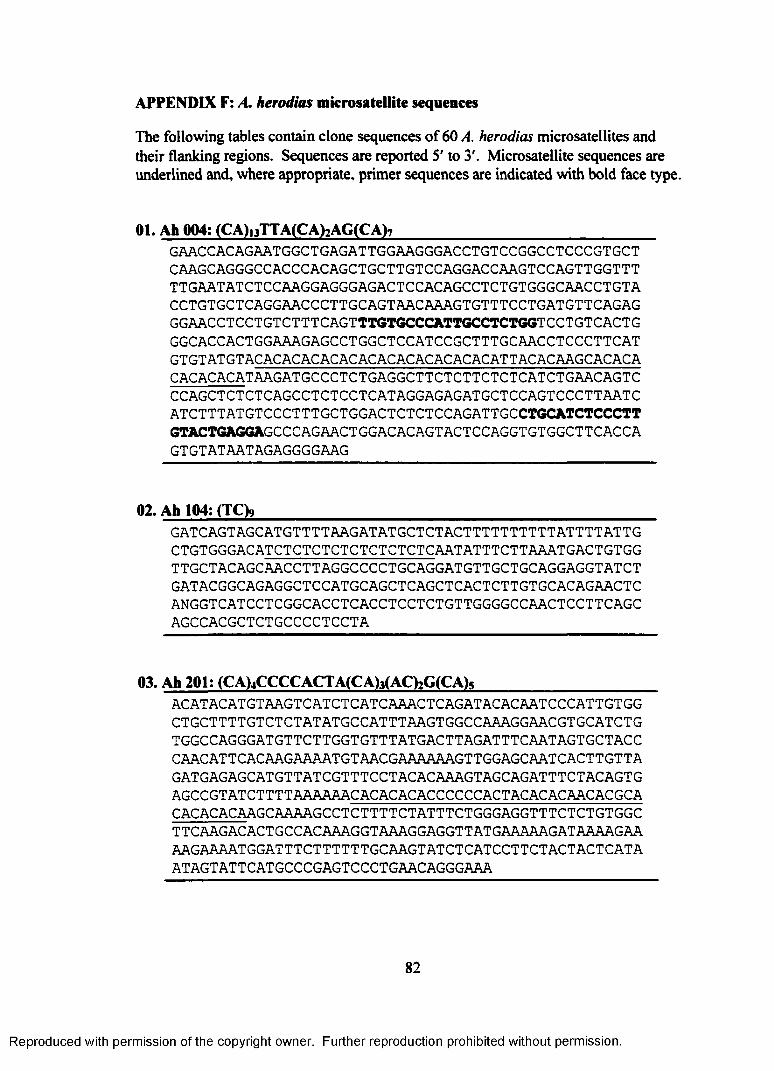
APPENDIX F: A. herodias microsatelllte sequences
The following tables contain clone sequences of 60 A. herodias microsatellites and their flanking regions. Sequences are reported 5' to 3'. Microsatellite sequences are underlined and, where appropriate, primer sequences are indicated with bold face type.
01. Ah 004: (CA)|3TTA(CA)2AG(CA)7_______________________________GAACCACAGAATGGCTGAGATTGGAAGGGACCTGTCCGGCCTCCCGTGCTCAAGCAGGGCCACCCACAGCTGCTTGTCCAGGACCAAGTCCAGTTGGTTTTTGAATATCTCCAAGGAGGGAGACTCCACAGCCTCTGTGGGCAACCTGTACCTGTGCTCAGGAACCCTTGCAGTAACAAAGTGTTTCCTGATGTTCAGAGGGAACCTCCTGTCTTTCAGTTTGTGCCCATTGCCTCTGGTCCTGTCACTGGGCACCACTGGAAAGAGCCTGGCTCCATCCGCTTTGCAACCTCCCTTCATGTGTATGTACACACACACACACACACACACACACATTACACAAGCACACACACACACATAAGATGCCCTCTGAGGCTTCTCTTCTCTCATCTGAACAGTCCCAGCTCTCTCAGCCTCTCCTCATAGGAGAGATGCTCCAGTCCCTTAATCATCTTTATGTCCCTTTGCTGGACTCTCTCCAGATTGCCTGCATCTCCCTTGTACTGAGGAGCCCAGAACTGGACACAGTACTCCAGGTGTGGCTTCACCAGTGTATAATAGAGGGGAAG
02. Ah 104: (TCfe_______________________________________________GATCAGTAGCATGTTTTAAGATATGCTCTACTTTTTTTTTTATTTTATTGCTGTGGGACATCTCTCTCTCTCTCTCTCAATATTTCTTAAATGACTGTGGTTGCTACAGCAACCTTAGGCCCCTGCAGGATGTTGCTGCAGGAGGTATCTGATACGGCAGAGGCTCCATGCAGCTCAGCTCACTCTTGTGCACAGAACTCANGGTCATCCTCGGCACCTCACCTCCTCTGTTGGGGCCAACTCCTTCAGCAGCCACGCTCTGCCCCTCCTA
03. Ah 201: (CA)4CCCCACTA(CA)3(AC)2G(CA)5____________________ACATACATGTAAGTCATCTCATCAAACTCAGATACACAATCCCATTGTGG CTGCTTTTGTCTCTATATGCCATTTAAGTGGCCAAAGGAACGTGCATCTG TGGCCAGGGATGTTCTTGGTGTTTATGACTTAGATTTCAATAGTGCTACC CAACAT T CACAAGAAAAT GTAACGAAAAAAGTTGGAGCAAT CACT T GTTA GATGAGAGCATGTTATCGTTTCCTACACAAAGTAGCAGATTTCTACAGTG AGCCGTATCTTTTAAAAAACACACACACCCCCCACTACACACAACACGCA CACACACAAGCAAAAGCCTCTTTTCTATTTCTGGGAGGTTTCTCTGTGGC TTCAAGACACTGCCACAAAGGTAAAGGAGGTTATGAAAAAGATAAAAGAA AAGAAAATGGATTTCTTTTTTGCAAGTATCTCATCCTTCTACTACTCATA ATAGTAT T CAT GCCCGAGT CCCT GAACAGGGAAA
82
Reproduced with permission of the copyright owner. Further reproduction prohibited without permission.
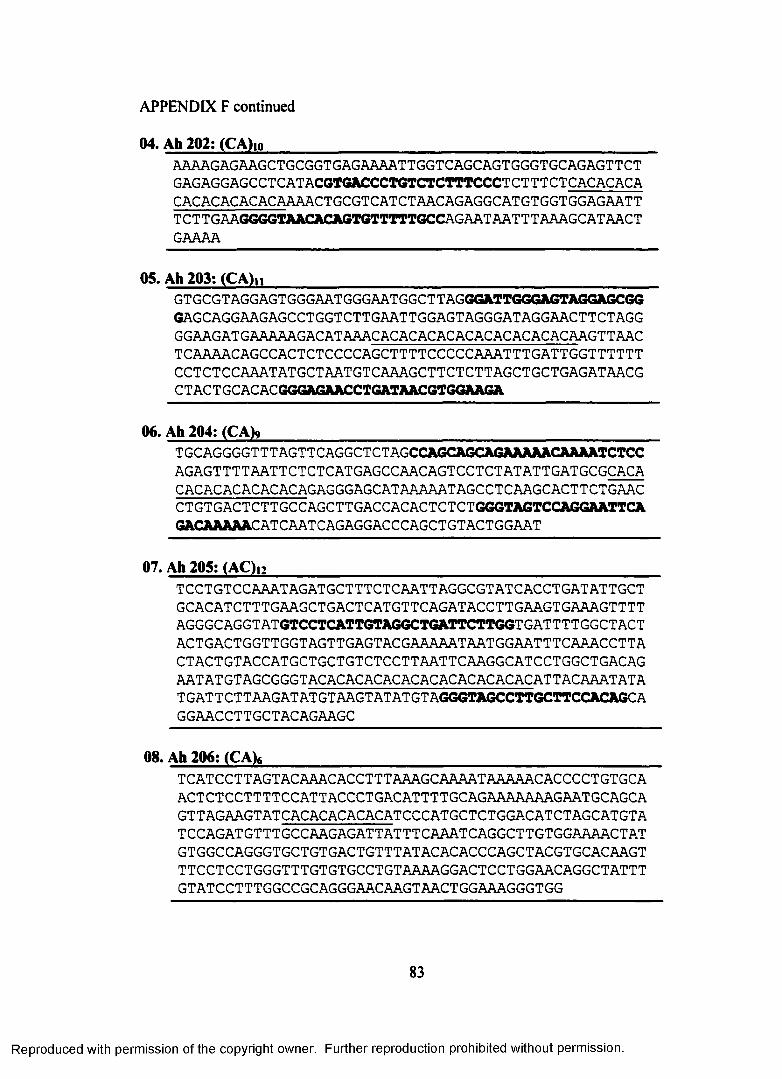
APPENDIX F continued
0 4 . A h 2 0 2 : ( C A ) | 0___________________________________________________________________________
AAAAGAGAAGCTGCGGTGAGAAAATTGGTCAGCAGTGGGTGCAGAGTTCT GAGAGGAGCCT CATACGTGACCCTGTCTCTTTCCCTCTTTCTCACACACA CACACACACACAAAACTGCGTCATCTAACAGAGGCATGTGGTGGAGAATT T CT T GAAGGGGTAACACAGTGTTTTTGCCAGAAT AAT TT AAAGC AT AACT GAAAA
O S . A h 2 0 3 : ( C A ) n ___________________________________________________________________________
GTGCGTAGGAGTGGGAATGGGAATGGCTTAGGGATTGGGAGTAGGAGCGG 6AGCAGGAAGAGCCTGGTCTTGAATTGGAGTAGGGATAGGAACTTCTAGG GGAAGATGAAAAAGACATAAACACACACACACACACACACACAAGTTAAC TCAAAACAGCCACTCTCCCCAGCTTTTCCCCCAAATTTGATTGGTTTTTT CCTCTCCAAATATGCTAATGTCAAAGCTTCTCTTAGCTGCTGAGATAACG C TAC T GC AC ACGGGAGAACCTGATAACGTGGAAGA
0 6 . A h 2 0 4 : (C A > 9 ____________________________________________________________________________
TGCAGGGGTTTAGTTCAGGCTCTAGCCAGCAGCAGAAAAACAAAATCTCCAGAGTTTTAATTCTCTCATGAGCCAACAGTCCTCTATATTGATGCGCACA CACACACACACACAGAGGGAGCATAAAAATAGCCTCAAGCACTTCTGAAC CTGTGACTCTTGCCAGCTTGACCACACTCTCTGGGTAGTCCAGGAATTCA GACAAAAACAT CAAT CAGAGGAC CCAGCTGTACT GGAAT
0 7 . A h 2 0 5 : ( A C ) n ___________________________________________________________________________
TCCTGTCCAAATAGATGCTTTCTCAATTAGGCGTATCACCTGATATTGCTGCACATCTTTGAAGCTGACTCATGTTCAGATACCTTGAAGTGAAAGTTTTAGGGCAGGTATGTCCTCATTGTAGGCTGATTCTTGGTGATTTTGGCTACTACTGACTGGTTGGTAGTTGAGTACGAAAAATAATGGAATTTCAAACCTTACTACTGTACCATGCTGCTGTCTCCTTAATTCAAGGCATCCTGGCTGACAGAATATGTAGCGGGTACACACACACACACACACACACACATTACAAATATATGATTCTTAAGATATGTAAGTATATGTAGGGTAGCCTTGCTTCCACAGCAGGAACCTTGCTACAGAAGC
0 8 . A h 2 0 6 : ( C A ) 6____________________________________________________________________________
TCATCCTTAGTACAAACACCTTTAAAGCAAAATAAAAACACCCCTGTGCA ACTCTCCTTTTCCATTACCCTGACATTTTGCAGAAAAAAAGAATGCAGCA GTTAGAAGTATCACACACACACATCCCATGCTCTGGACATCTAGCATGTA TCCAGATGTTTGCCAAGAGATTATTTCAAATCAGGCTTGTGGAAAACTAT GTGGCCAGGGTGCTGTGACTGTTTATACACACCCAGCTACGTGCACAAGT TTCCTCCTGGGTTTGTGTGCCTGTAAAAGGACTCCTGGAACAGGCTATTT GTATCCTTT GGCCGCAGGGAACAAGTAACT GGAAAGGGT GG
83
Reproduced with permission of the copyright owner. Further reproduction prohibited without permission.

APPENDIX F continued
09. Ah 207: (AC)i0_______________________________________________AAGAGTACACACACACACACACACACGCACAGAGTGACAATGACTCAGCT GAGAGAGCAATCTAATTTTCCTTATTTAAAAAGTCATTTATTTTGCATTA GGTTCAACTTTCCCCTTATCATAAATGGAAAAAAAATCAGTTTAAGCCAG ATGATACCCGTTTAGTTACTTTGGTCACTAAATTTATCCCTGAAGCTTCT TTATTTATAATCTTAAATNGGGGTAGCNCAGCATTCTCTTGAGAACAAAA T GGT AGT C AAGGAGAGAAT
10. Ah 208: (CA)|0_______________________________________________TATTGAGAAATTCCTTTTCCTTGCAATACATTTCTTCTTCCCTTACTCTTGACCCTGTACATACACTTCTAAAACCCTTTAACCATATAACTTTTTTTCACACACACACACACACACACTTACACATATATGTGTGCACATGTATATATA CATACAGGTATATATTTCAAGGGTCTTTAAACAGCAGTAATATGCAATTT GTTTAGTCCTCATGTGGTCCACACTGGGTGTTATTAGCCCCTGGCATGTA C T GAAAT CAGCAT T CGT GAT T CAGGAACACC T GATAT T T GT GAAACT C C C CAAACAAACTTTGCATCTCTGATATGTTTATTCTGTACTTCCTAATTCAG GGAAGG
11. Ah 209: (AC)i6_______________________________________________ACCTTAAGAAAGAAAGATGAATAAAAATAAACATAATTCTTATAAATTATTCCCTTCTTCCACACAGATTTATTACATGTAGTAGCATAGCTTTGAAGAGTTAAGGAACAAATGTTTGGAAGGAATGTTTGTAAAAAGGCCGCTAAGGAAAACAATACCTACACACACACACACACACACACACACACACACAAAATCCTGCTGTCAGTTAAACCTGTACAAATAGAGCTGAGCACGCAAACAAAAGAAACTGAATTCAGGCAAAGATGACTGCTCTTGCACTGATGTGTTTCGGCTTAGGCTATTTCTTGAAATTTCCTACTGTTTTAATGAGCTTAAGCTAATCTTTTAGCTTTTCCTGGTCATGAAGC
12. Ah 210: (CA)n_______________________________________________GATTCACGGGAACGTTTGAAAAATTTAAGATGTGAAAGGGAATTCTCAATTATT T GCACACACACACACACACACACAAAAT CACAAATGAAGGAAAGAA GAAAGATACATTGAATAAATAGCTCATTGTAATTTATTTTTCCAGTTTCT GAGCCATAGAAAGGTGCTTGTCATTAAGTGACTTTTGGAGATACTTGTAT TTTCTTACCTTGGATACAGCTTAGATGGATGAGCTACCATTGCTCTCCAT GCTTATCAAATTAGGAGAATGCATTTCTAAATTCAATTACATCCTCAGTG GAAATGGTTTCTCTGACTCTGGTAATCTTTAGAGAGGAATTATACACAGT CTATAAAGCTTCACATTTCAAAACCCAATTTTGAATGTTATTCAAGAGGT TAATTTAAGATTCATCTTCCTAAAGAGGAGTTAAATAAAACGGATAGAAG GCTGGAACT T GT CGAGT GGT T GAGAGTT T TAT CAGCAT GT GAGAAT
84
Reproduced with permission of the copyright owner. Further reproduction prohibited without permission.

APPENDIX F continued
13. Ah 211: (CA)ijAGGAGAGCAGGTTGATTTTCAATGTTTACCTCCTCCCAGCTCAAGAATAG C CAAT CCAAAAGAGTAGGAAGT GAAACAGAAGTGGCAGGAAGCT TGCACA GGTGAACAAGCAGTTCCTGACTAAATGAGAACGTAAAAATAAAGTGTGTA AGAGGT G AAAGAAGGGACAGGT GACATGGAAGGAATATAGAAACT GTAT G TCACCACATAGGAATGTGGTGAGGAAGCCAAAGCTCATCAGGAGTTGAAT CTGGCAAGACAAAGGTCAATAAGAACAGCGCGCACACACACACACACACA CACACACAC C CCT CAACAGT GAT GGGAAGACCAAAGGAAATACAGGTCCA TTGCTGAATGACAGAGAACACAGAAAAGTCCAAAGTACTGAAT
14. Ah 212: (CAhTAlCAb________________________________________TGGATGGCTATTCCTATGAATTAGCTCAGTATCCTGTGTGGGCATTACTC AGAAACATCGATGTATACAACGTGCATACAGACATGATTTGGGTGAAGAA AAAGAGAACACT T AAAACACAT GTGGT GT GATACT T GGAAAT CT CAT T C T GGTAGCATTTTAAAAAGAGATAAATATTTATTTAAAAAAAACGATAAAAA GAAAATTAAAATACCCCCACTCTTCTCTTACTGTAGTGCCTTAAATGATA GTTTTAGCATTCACGTTCAGGCTAACTTTGGGCAAAGCTTTATCTAATTG TGTTCTAGGCTGTGAAGCATCCATGGCATGCACATTAAAGGGTAAGCAAT TTCAGTTCTGGGTTTCCCAACACACACACACACACACATACACACAAACT GCAAGTCATGAAAGTGGGCTGATATTGAAA
IS. Ah 213: (CA),2_______________________________________________TCAGTGCAAGCCACACACGTGCACACGTGCACACACACACACACACACAC ACACGCATGCACAGAGGGTTCAGCCTAGCACCAGAATGCTGTTAGTGTAA ATGAACACTGTCACGGCTAAAGTGGCTGGGGTTTTTGTTGTGGTTTTTTA TTTCCCCCCACTTTCTGAAACAACCAGCCAATTTAAAAGCACAGTTCAGG GGGAAG
16. Ah 217: (CA)|0_______________________________________________ATTTCTTTAAGACAGAAGTGCTAAAACTGCTTTTTTACCACTGCCAGCAG AGAATTGGGTAACTCAGGAAGAGTATCCTAGGCTGTGCTCCTGTCCGTAA GTCTGACATCACTTCTTCACTTGTTAAAGATGCTGCTGTAGTGCCAGCTA TGACTGAACTGCTGATAACTTCAGTCAGGGAAGAAATCACCTGCATCTCT GTAACAGACCTTTCACTTATAATGTCAGTTTTCTTTGTACTTAGGTAAAA TGGTCAGATGACACAGATTCAAAACAAGCACCATGCAAGTGACACACACA CACACACACACAGAGAGCCCTACTTGTCTTTTGCCACAACCTGCCTACAT T ATC AAGAC AGCAC AGAGGGTT C GGAT GAGCTC AT GGAT GAAAAC C AGGT AGACAAAGCAGAGCCTGAGCAAGAAAGTGGTTATAAAGCTAGGTAAATCA AAGTATTTTGGAAAA
85
Reproduced with permission of the copyright owner. Further reproduction prohibited without permission.
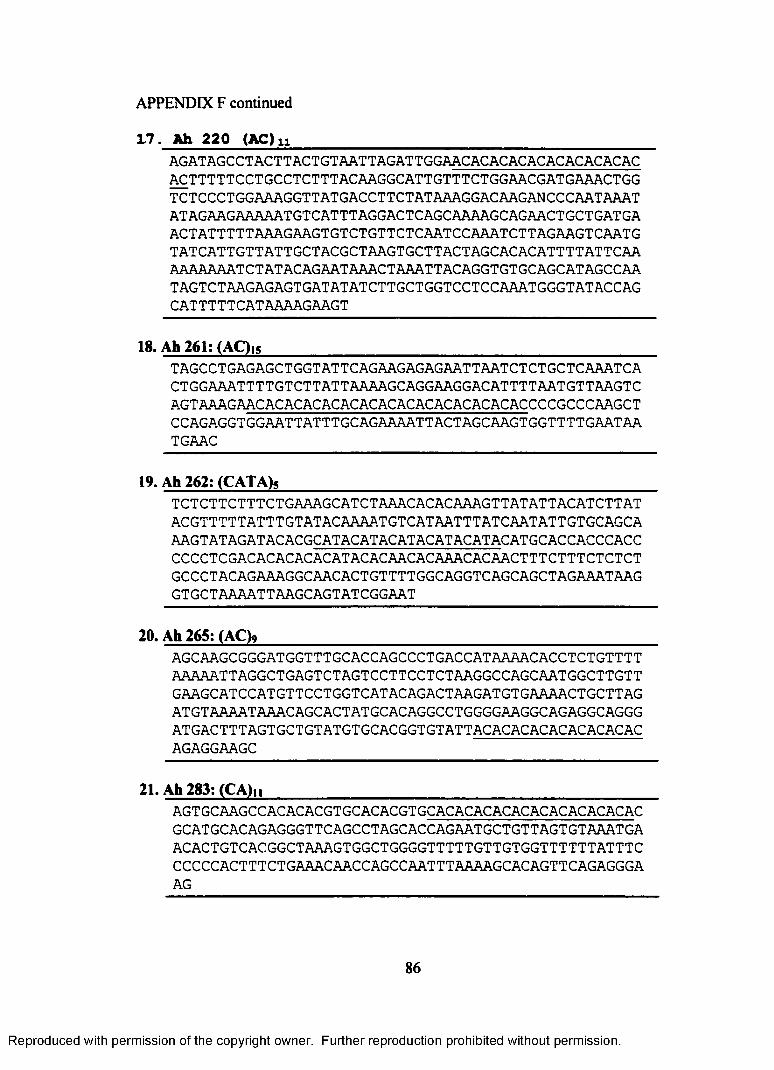
APPENDIX F continued
17. Ah 220 (AC) 1 1
AGATAGCCTACTTACTGTAATTAGATTGGAACACACACACACACACACAC^ TTTTTCCTGCCTCTTTACAAGGCATTGTTTCTGGAACGATGAAACTGGTCTCCCTGGAAAGGTTATGACCTTCTATAAAGGACAAGANCCCAATAAATATAGAAGAAAAATGTCATTTAGGACTCAGCAAAAGCAGAACTGCTGATGAACTATTTTTAAAGAAGTGTCTGTTCTCAATCCAAATCTTAGAAGTCAATGTATCATTGTTATTGCTACGCTAAGTGCTTACTAGCACACATTTTATTCAAAAAAAAATCTATACAGAATAAACTAAATTACAGGTGTGCAGCATAGCCAATAGTCTAAGAGAGTGATATATCTTGCTGGTCCTCCAAATGGGTATACCAGCATTTTTCATAAAAGAAGT
18. Ah 261: (AC)|S________________________________________________TAGCCTGAGAGCTGGTATTCAGAAGAGAGAATTAATCTCTGCTCAAATCA CTGGAAATTTTGTCTTATTAAAAGCAGGAAGGACATTTTAATGTTAAGTC AGTAAAGAACACACACACACACACACACACACACACAC C C CGCC CAAGCT CCAGAGGTGGAATTATTTGCAGAAAATTACTAGCAAGTGGTTTTGAATAA TGAAC
19. Ah 262: (CATA)S______________________________________________TCTCTTCTTTCTGAAAGCATCTAAACACACAAAGTTATATTACATCTTATACGTTTTTATTTGTATACAAAATGTCATAATTTATCAATATTGTGCAGCAAAGTATAGATACACGCATACATACATACATACATACATGCACCACCCACCCCCCTCGACACACACACATACACAACACAAACACAACTTTCTTTCTCTCTGCCCTACAGAAAGGCAACACTGTTTTGGCAGGTCAGCAGCTAGAAATAAGGTGCTAAAATTAAGCAGTATCGGAAT
20. Ah 265: (AC)?_________________________________________________AGCAAGCGGGATGGTTTGCACCAGCCCTGACCATAAAACACCTCTGTTTTAAAAATTAGGCTGAGTCTAGTCCTTCCTCTAAGGCCAGCAATGGCTTGTTGAAGCATCCATGTTCCTGGTCATACAGACTAAGATGTGAAAACTGCTTAGATGTAAAATAAACAGCACTATGCACAGGCCTGGGGAAGGCAGAGGCAGGGATGACTTTAGTGCTGTATGTGCACGGTGTATTACACACACACACACACACAGAGGAAGC
21. Ah283: (CA)n_________________________________________________AGTGCAAGCCACACACGTGCACACGTGCACACACACACACACACACACACGCATGCACAGAGGGTTCAGCCTAGCACCAGAATGCTGTTAGTGTAAATGAACACTGTCACGGCTAAAGTGGCTGGGGTTTTTGTTGTGGTTTTTTATTTCCCCCCACTTTCTGAAACAACCAGCCAATTTAAAAGCACAGTTCAGAGGGAAG
86
Reproduced with permission of the copyright owner. Further reproduction prohibited without permission.

APPENDIX F continued
22. Ah 284: (AC)|0TACCTTTTCCTTTCTCTTATGGCCTTTTCTCCTTATCAGTGAGAGAATTGCACAACAGTTGTTTCTTTCAAAACAGACTAGGGGGAAAAAGGAGGAGAAAACCCAACACACACACACACACACACCCCAAACCCCAAAAATAAGAGGCTAAATCAAAGATGAACACATCCACAACTGAACATGCACATCTTGTACCCAATTTGAAAT
23. Ah 291: (CA)7CG(CA)6CG(CA)2_______________________________TACAACTCCCCATTTGTTTGTTTCTATTATATTTAAAGTAACACATCTTATTTAAGAGTTTCAATGATGGCATGGAGCAGAACTCTGGAAAATAGACAACCTGACTTCATAAGTTGTCTGTAGTCTAGAATAATAACTAAACATTTTACAACACACAGTATAGATGAAACTGTATGCTATTATCAGTATCTGGAATAAAGGATGCTGTTTGTCTACTGCCCTACAACAGATATTCACATCTGCACATTCACACACACACACACGCACACACACACACGCACACTCTTCCAGCTACAGAACCGAAGAGATACATTATTTAAAACCACTTCTGAACGAGGGATGTATTTTTTTATCACCCTCCCATCTATACAATATGCTTTATGCACAGAACTATATTGAGTAGGGAACTCAGCCTAAAATAAATTGTGTTGTTTTTCTTTTCTTGAGTGTTAATTTACTTTTAAATATTCTAGACATACCCTCTTTAAAATGGTACACTCTGTTTCTATTTTACTGTATTCAGCAATCAGTGTCGATTACTCTTGGTAACCATGGCAACAAGCCAGCTAACTGTTCTTAAATCTTCATTTGTCCACTACTTTTACAAAATACTGTACAGTTAAGAAT
24. Ah 292: (CA)3TGCATA(CA)4 and (TA)4_________________________ATTGACTAAATTAACATTCACAGAATTAGTTATTAAATCTCACATCTACAGATTACTTAAATTGATTCACACATGCATACACACACAAACATCATTATATCCATACAGTATATATACACGCAAGGGTATACCTGCCAAAAATTCCCCTCGAGTTCAGTGAAAATACTCGATGTCGAATGTCTTAGCGTTTCTCAATGGCCGAGGGCTGAACCTCAAGGAGTGAAAG
25. Ah 318: (CA)|0______________________________________________AAAAAAAAAAGTGGAGGGACAGTACAGGACCAGAACAACACACACACACA CACACACAAAAAGTGGAGTGAATTAAAATAGTAACAAAAATGAAAAAGCA GGAGCGATGTAAAATCCAAATCACACTAAGACATTAAGGTCTCTGATCGT AAAAACCAATGAAATCAGAAAAATTTAAATTGTCTGCATCAAATTGCCTC GAGGAGGTAGCAGATAGTCAAAATTACATGAACATTATGTTACAATACAA CATTAATCCTAAATTAACCCCTTTTTGGGAGCACATTTGTTTTGTTCTAA TACTTGTCAAATTAAAATAAGAGGCAACTTTTAGCCTGGCCTCAACAGGA ACAGCAAGACCAGGAGATATCAACCAGAAACACTGTGTGAAGCCTGACTC CAAGAAGT GAAGAAT T TAGCAGAAGC
87
Reproduced with permission of the copyright owner. Further reproduction prohibited without permission.

APPENDIX F continued
26. Ah 320: (AC),3CTTATTGACATAGTTAAATATGGGTTTAGGAGCAAGATTTTAAAGAAGGTGCTACTGCTTTGCTCTCTTTCTTACCTTCTTCCTTTCCTTCCTTTCTCCATTTCTTCTTTTCCTACACACACACACACACACACACACACGCGTATGTTTATGCAAGGTTTTAAACCTAACTATTCCAGTATGACCCAGCACTTTGTCCAATACTGAAAATTACATCTAGGATAAGTAGACCTATCGCTAGAATGAGATTCATTTTGGCAAAAGATAGAATAAATATTACACTAGATGGACAACAGAATCAAGTTTAATTAACACTGATATCAATTTCTAACACTCCGGTTCTTTTCCTGTTTAATTATCCTACCTAATGAATGATGAAGTTTTTAACAATGCCAGCCTGCTCACTCTCCAAATGAGGCAGAGGAAGTCATGGATAATCAGCAAGAGAGAATTTCTTGATAAAACAGTGCAGTTTTT'CTACTGCAGTTTGCAACCTTGTGGGCTGTCATTTTATGCCTGCTGTCTGCCTGACAATTAGCAACACCAGAGAATAAAAAAAGTCTGAAAGTCTAGTTTCTTTTCAATAGTGGGAGTTTAAAGTATAA
27. Ah 325: (AC)|2______________________________________________TATAAGAAGATTAGGCATCCTTCGTGCTGTAGTTTGTAGAGACCATGGATGCACGTGTACACACACACACACACACACACACAGAGTCACACGCTCAAACCTCTCAACACTAAGAAAACCCAGGAAAAAAAAATCCTGCACTGACTATTGCACAAAATTTCATTTTTAAAACTCCCATCTGGATGGGAACCTCACAGCTTAAATATCTGCAGAGTTAGCACATTTTTACGGCTATCCTAAGTCTCTGCAAAATTGATTTAATTGGAAACACCTACAGACACTTAAAGGTAAAAAAATGAAAATTGCNTCATAGGAAACAACGTCAGGCTGTGTTTTTGGAAGGGTTTATATAGGTAGCTAAACTCCCGGGTCTGCCATGTCGTCTCTCTGCCAGCCAAGCCCATGCAGCGCGGTGGAGGATGTTACCATGAATACAGCTCTGAAAC
28. Ah 331: (CA)STGCAA(AC)6GTGAA(AC)8_______________________AAACATGTTTGTACTAAGTCTTATCAGCCTCGCCCTTGGGGCCATTTCGC ACATTTACTGTGTTTCTGCAACAGAGGAAGCAGCTCTTGGCAATGACCTT TTTGAATCTGTGGCATATCTGAAATGTGCAGCAGAGCATAGCATTTCTCG CCAGTAAACTTTTTGTCTACTCTCAAATGGTTCCTTTCAGTCTTTCATTC CTTCTGCATATACCTGGCACTTTCACACACACATGCAAACACACACACAC GTGCAAACACACACACACACACGCACATACGCACGCACACTCTGTAAGAA TTATAAACAAGCTTCTGCAAACTCAGAGGCTATTTTCTAACTTGGAATTC ACAAGTAAATAGTGGAAATTATTATTGCCTAACAAGCTCTCAGCACCTTT T GCACCT CTATGTATCTCT GGT GGGT TAGGACTCT GT CAGAAGC
88
Reproduced with permission of the copyright owner. Further reproduction prohibited without permission.

APPENDIX F continued
29. Ah 341: (AC)t2TTTAGTTACCAAGAATGGTAATGATTCTGATTTACCACTGAGGGTTTTATCTTAGTGTCACACACACACACACACACACACACTGGGTCACACAAATTTTATCAAGTGTCCTACTGCGAGTCTTCCATTGCTGTGAAGACCAGATATGATAACACATCAGGATGATAATATATTCCCATTTCAGTAGTTGAGTTCTCCATGCAAATAACTCCTTCAAGGACTATCTTTGGGAAAATAAAAATGCAGTTCCTTTTGAATTAAAATAGGACAAAACTCTTGTTTTAGTGGACCCTTACCTAACTAAAACGAGTGTGTGCTTTATATTCTACTGTGTTGCTTTTCAAGCTTTCAAGTTCTTGTAGCAACTTCTATTATCAGGTTGTTTCTGCTTATATAAATGTACTACAATGGTCTTCTGCTACAAATT
30. Ah 342: (CA)g_______________________________________________ACATTTGTTGTATATTAAGTTTTGGGAAACTGCCATAATTTTTATTTCATCATGCAAACTCATATCATAGCTGGACAGCTGTTATTGTCCCTGCTGGCCTGAGGGTTATATCACACACTATTANTTTAAAGAATGTGACTTAAACCCACCTAAAATGGGAAAGGGTAAACTNTGTAATTAATCCACTACATTGCACAGGTTACACCACACACACACACACACGTCCACTTGCTACTCTGAAGTTCTTTCTCTTTTTTTCACCCTCTCTGAAATTGCCATGATGGAGCCCTGTTTCATGTT
AAAAGCACTGGTTTTTCCTTTTGCTAACCCCAAGCCTTTTTCTTTTTTTTTTCTTTT
31. Ah 343: (AC),?______________________________________________TCAACGGGTCTACCGGAAACTAGATGAGATGCATTGCTTAACTTCTGAAGAAACCAGCTACACGTACACACACACACACACACACACACACACACACACTGAAGAGGACCCATAAGACTAAATAAGACATGGAAAAATGAGGACAAAAGAGTTAATTTCAAATTTTTCGTTTTATGAGTTTGAAAGATAATAATAAATTACTGCACTGAAAACAGTTTTATTCACAAATGCTGGGTCAAGTGTTATTTTTCTTAACCTCTGAAGAGTAGCTCCAGGAAATTATACTGGGACAGAGATAAACCAGGTATAAACAACCATAATGAAAA
32. Ah 344: (AC)6_______________________________________________CAGGGT CAGCACAAGGT CAT GACT T GT GACAT GAGGT TAAT GTAGTT GTT AAGTAACAACATGAGTCTTTTCAATGGCATGAATATTCCACCCCACCCTC GCCCAGACACACACACACGCTTTCTGTCTCCTGGCTGAAGCCTCAGTTGA ATAC TT GT T TAATGTAAGGGCAACCAT GCGAGGCT CAT GGACAATAT GCA ATGCAGTTATACACATTTCAATTACCACATACCCAGAAAAATAAGCTATT TAATACATAGCATGGAAAGGCTACANAAGGCTTNTGCTAGCTANAGTCGA CCTGCAGGCATGCAAGCTTGGCGTAATCATGGTCATAGCTGTTTCCTGTG TGAAATTGTTATCCCGCTA
Reproduced with permission of the copyright owner. Further reproduction prohibited without permission.

APPENDIX F continued
33. Ah 346: (AD4(AC)io(AT)3TAGTTAGCAGTGTCCCTGCTCACTGCAGGGGGGTTGGACTAGATGACCACTAGTGGTCCCTTCCAACCCTAAACATTCTATGATTCTATGATTCTATAACAGAGGTGACTAGTACCTTAGGTAACACCTGAGTGCAAAATAGTTGCTATGTGGCCACCACCATGGACAAGAGGATAGGGCCAAGACTGATTCTCTGGGAAGACAAACTTCTATGGATATCTACTGTTTTCATGGACTTTAATTCTTCCAGACCCATTTGTACAAATGTATATATATACACACACACACACACACACATATATAAAAATCTTTACAATATCAAACTGCATGGAATGAGCACCAGAAAACATTATTAATATTGTGTCAAGCATCCCAAAATGACAAAATTAAGGCTGTCTGTGCAATATAATTCAATTTCCTTGTATGGCTGCATTTAGGAAAAGTTTCTGCCTTTCAACAGGGGGTGTAACCTCAGAAATCTTGTGACTAGTTGGGCTGAAGC
3 4 . Ah 3 5 7 : (AC)iq_________________________________________________________
AGCAGGGAATGCTCTCCTTTGAAAAATCCAATACTGTTATGTTCGTATGATGGTTTTCATTAACACACACACACACACACACCCCCCATAAGAGGAGGCTGAGGGGAGACCTTATCGCCCTCTACAACTACCTGAAAGAAGGCTGTAGCGAGGTGGCGGTCACCTCTTCTCCCTGGTAATGGGTGATAGAACAAGGGGAAATGGTCTGAAGTTGCGCCAGGGCGGGTTTAGGTTGGACATTGAGAAC
3 5 . A h 3 8 1 : ( A C ) s C C C C C A C T ( A C ) 3A ( A C ) 2G ( C A ) s ________________________________
ACATACATGTAAGTCATCTCATCAAACTCAGATACACAATCCCATTGTGG CTGCTTTTGTCTCTATATGCCATTTAAGTGGCCAAAGGAACGTGCATCTG TGGCCAGGGATGTTCTTGGTGTTTATGACTTAGATTTCAATAGTGCTACC CAACATTCACAAGAAAATGTAACGAAAAAAGTTGGAGCAATCACTTGTTA GATGAGAGCATGTTATCGTTTCCTACACAAAGTAGCAGATTTCTACAGTG AACCGTATCTTTTAAAAAACACACACACCCCCCACTACACACAACACGCA CACACACAAGCAAAAGCCTCTTTTCTATTTCTGGGAGGTTTCTCTGTGGC TT C AAGAC ACT GCC AC AAAGGT AAAGGAGGT TAT GAAAAAG AT AAAAGAA AAGAAAATGGATTTCTTTTTTGCAAGTATCTCATCCTTCTACTACTCATA ATAGTATTCATGCCCGAATCCCTGAACAGGGAAA
Reproduced with permission of the copyright owner. Further reproduction prohibited without permission.

APPENDIX F continued
36. Ah 414: (AC)22CTTCCATAGACCTACCCTACAAGAACAAAGGTCATTCTTTTTTAATGAGCAAGGCCTTTTATACTGACAAGGTTTATTCATTCCAGCTGCTCTTCATTCTTGTAACAGAGCCTTGAGGGTTACACACACACACACACACACACACACACACACACACACACACACTTACCTGCAAAGTACAATTTCTGAGCTATTTCTGCAGAATATTTGCATCCAAACTTTAGCAGGGAATATTTATTTCTCAGCCTTGGCGTGGAAACAAATCCGGCGATTGTCTTCTGCCCCTAGTTGCTTTTGCCTCGCAAAATAATTGCTNAGCCATTTCTGTGGAGCTGCTCCCTCTTCCCCCAACCCCTTTCCCCACTTCTATTTAACATCTGCCCTGCTAATGTGATTATATGAAACTCTGACAGATAAACTTTACTGGAGCAGAAATGCTTGACAAATAGCCAAAAAGCACCAGGGATACCCAAATGTGGAGACGAACAAACCACATTGGCGTACTTGCTAGATTGTGTAGAAAGC
3 7 . A h 4 1 7 : ( A C ) iq( A T ) 6___________________________________________________________________
TAAGACTGTTCTGGTTCTTATATCCATCTTATATCCAGATACTTCTTCGCTGCATGCACACATGCATAGATGCATACAAGTATTTATTCAGTGTACACACACACACACACACACATATATATATATAAAATATTTACCTTTTTACAATTAATTTCTTAATTTCTGGNAGGATTGAAA
3 8 . A h 4 2 1 : ( C A ) | S___________________________________________________________________________
CTCCCGTTCCACGCTGCTCCTGTCGCACGCGGCAGCACAACACACCTGGACGCCAATGAGAAAGTACGTTTAATTAATCAGAACTGCAGCCACACACACACACACACACACACACACACAAGTTTAATTTTTCCCCGAGAGAGTTTTGGCACTCGGTGAGCAGGCTGTAAAAAGGCCTGTCTCATAGTTGTTGTGCAGAGGAATCCTGGACCAGGATTGAAGGTAACAGAGCAGGCAGCCCGTGCGGTCGCTGGCCCCGCTTGTTCGGNTTTGGTGAAGCCCCGTGCTCCCGTCTCCCCCCGCTGAGGACCCCTCACCAAGCGGTGAAGC
3 9 . A h 4 2 2 : ( A C ) U ___________________________________________________________________________
ACATGATGGAGTTACACACACACACACACACACACACACACAAATTTAAAAATAATGATAAGCAAAAGAACAGCNTGAGATGGAACAGGTTGCCCAGAGAGGTTGTGGATGCCCCATGCCTGAAAA
4 0 . A h 4 2 4 : ( A C ) , 5___________________________________________________________________________
CTTATAGAATGTCTAGTTAAGGAGATACACACACACACACACACACACACACACACATATGTACATAATATGGCTTTGTAAGACTGAAACTGTAAACAACATTTGCAAAATATTACTTCACCAGGGGCATGAAAATCTAGAAAACAGATCAGCCCCACTATCTTCCCTAAAATAAACACAGACTTCCTCAGAAATTTAAACTCTGCAGCATTACTTGCATTTACTAATAACAATTCCTTAACTTTCCAGAATGGAAA
91
Reproduced with permission of the copyright owner. Further reproduction prohibited without permission.

APPENDIX F continued
41. Ah 429; (CA)< CCCCCAC(CA)4TTACCTTAAAGCTACCTCTACTATCTTCAGGCTTGAAAAAACCACACACA CACACCCCCACCACACACACCCACTGCCATTTTTCTTCACTGAAGCACTA T GTAT T T C T GCAGGTAGAACACATACAGGT CT T TAAAT TTTGGCCT GAGA AGTTTAGGTTCAAGCATATTAAGCAACGTATATAACACGCTAATCTCCAT AATACACCTCATCTATAAAAAGTTACGTGGCAATTTGCAGAGCTCAGAGC ACTGAAAAACCTCGGAGCTCCTTATTAAGTAAGATATTACAAATGTCTAG CAAATTAAGCAACAAACCAAGT T GT T GCT T CACT CCAT GT T CT GAATAAA GTTTGCGCTTCCCCACCACCAGTAGCAGACATTTGTGAGTGGCCCCAGGG GCT T GTAT CTAACAAGACACAT GT GCAAGAAGAAAC
42. Ah 442: (CA)I2 and (TG)S______________________________________CCACACACGCACAGGCACACCCGCACGCACACACACACACACACACACACACCCCCCCCCAGACATCTCCCGNNNNNTTATTGGATTGACTTTGAAGGTTGTGTGTGTGATTCAAGGAGGCTGCATGTTGAACCAGGNGGTGAATATTTAAGGCTGGAANAAGTAAAGGGATTTTTTCTTTTTCCTGTGAAGGGAAAATATCTCANGGACTAGTCTGACCATCCAAACAGCTAAATGTTTATTATGTAAGTACATGTGAAATTCAGCATCGGAATAAAATAGAGCGGGCATGGTGCGAAAGCCCTATGTATGTTTCCTGTTGCGTTNGGAGAATGTTATCGGTCATTGTATGGGGACTGGCATTGAGGTTGCTCGCANACTTTTTAAGCCTACGATCGCACCGTCAGTTGCTTAAAAGTAACTTTTTAGACGAGTAACATAGTTAAATCACTGTCTAG
43. Ah 456: (TGC)6______________________________________________TTCTTGTTGCTATCCCGCAGAGATTCCTGGCTCAGGGACACTCTCCTCTC CTGTCCTCCTACCGGTGTTTTTTCCAGAAAAGTCAGTTTAANAATTGATT TTTTTATTTGCCACAGGAATATCTTGCCACTCTTTCCCCGAGTTCCTCAT TATTTTATTACAAGTGGCAGAGGTGCCCTGCAGAGCCTGAAGAGCTACAG AAGGT GAGAC CACAGAACTCATAGT GGTGCTGCTGCTGCTGCT GCAAGGA AGCAGAGAAAA
44. Ah 475: (CTC)5, (GCT)6, and (TGG)4____________________________GTTCATCTGCTGCTGCTGCTGTTGCTGTTGCTGTGCCTTATTTCGCAGTTCTCGCTGCTGCTGCTGCTGCTGTTGATTGTGGTGCTGATGGTGGTGGTGGTCCTTGAAGAGGTCACTCAGCTGACTGGACAGCATCTGATTGCTGCCGCCACCACCGCCACCGCCGCCCACCTCATCCTCACTGTCGCCCATTGTTTTGGAGAG
92
Reproduced with permission of the copyright owner. Further reproduction prohibited without permission.

APPENDIX F continued
4 5 . A h 4 8 6 : ( T G C ) 6
AGGGGCCAGGGAGATGCTGCTGCTGCTGCTGCCAAAATTTGGCTTTGCTGGAGGGATGCACGGCTGGGCGAGGGCAATGCCTGAGCGTGGGTGGCTTTAACTTTCCCTGTTTCCTTTCTGCTGTGGCAGCGGGCTGGGGCGCTTCTGCTAGACTAGCAGAAGCAACATATAGCGATCAGCGTAATGGAGGAGACTGAAGTCTTCTCAGACGCGACAATCCCAGCCCAGCTCAGGCTGCACCTCTGCCCTTGTTCGCCCCGTACCTGTCCAGGTCGTAGAGTGTGGGAGTTCTCAATCACCACCTCCACGCCAGCCTCCTTGGCCAGTTTGACGATAGCTGCATCCCTCTCCTTACCAAATGGCTCCGAGTCGTATTCGAAGGTGAGACGAGTGACTCCCCATTCCTGCAAGAAACACAATACACACAGCTGTCAAAGAGAAGACTCTTTCTAACCAGCACAATTATGAATGAGGATGTCAGAATTCCTGGCCAGCGTTAAGTCCTGGAAGCTTAGAA
4 6 . A h 5 1 7 : ( T C ) , ; ___________________________________________________________________________
CTGCAGAAGAGTGTGAAATTAAAAGTATCAGACTAACACTTTAATTTCTGCCATCTTTCCTCTCCCAAAGTCACAAACCCCGGGTTTTCCATCATGCTTCCATCAATAGGTTCTCTCTCTCTCTCTCTCTCTCTCTCTCTCAGTCTCTTAGACATGCACATATTAGAAAAAACCTTATTTTCTAGACTTCATTTATAAGAAACAAGGGAAGGGAGATTATATTGCTCTACTGGTTTGTGCCTTTTAATAATGTGGGAGGTGCTCAGGTAATAGCATAGTAAGGGACACGTAAGTGGTTCCGTGACATAAATGCAATTCATTCTTGAACT
4 7 . A h 5 1 9 ; ( T C ) i 3___________________________________________________________________________
ACTTCTTCACCGAAAGGGTTGTCAGGCTCTGGAATGGGCTGCCCAGGGAG GTGGTCGAGTCCCCATCCCTGGAGGTATTTAAAAGAAGGATAGATGAGGT GCTTAGGGACATGGTTTAGTGGTGGGATGGCAGGGTTAGGTTAACGGTTG GACTTGATGGTCTTAAAGGTCTTTTCCAACCAAAGCAATTCTATGATTCT ACAGTGGAACTGTGAATGGCAACGGTTTATGTGGGTTCAAGAGGGCTTCT GCTAGCTAGCAGAAGCCCTTTTGCGCTCTCTTCCCTTCATCTCTCTCTCT CTCTCTCTCTCTCTCTGGTTGTACTGCTGTTTTCTCTTTTGGCTGCTTTT GCTGTGTAAATTCAGGTGAAGACCTGGAAAGAAATGATGGATCTACAGCA AAACCCTACTTCAT GTCA
93
Reproduced with permission of the copyright owner. Further reproduction prohibited without permission.

APPENDIX F continued
4 8 . A h 5 2 2 : ( T C T T Q z s
TCATGCTGAGCCTGCTGTCAACCAGCACCCCCAAATCCCTTTCTGCAGGGCTGCTGTCCAGCCACTCATCTCCCAATTTATGCTTGTGCCCAGCATTACTCTGTCCTAGGCAGAATCTAGCATTTTGACTTGTTAAATTTCATCCCATTAATCATAGCCCAATACTCCAGTCTATCTAGAACTCTCTGCAAGGCACCTAGTCCTTCAAGACATTCAACAGCACCTCCCAGTTTGGTATCACCAGCAAACTTGCTAATGATGCATTCAACTTCCGCATCCAGAAATAATCTAATAGCTTATCTGGCTACAACCAACCCACTCAGTGTCCAGGCACACAAAGCTGATTTAAAGATGTTCCATCCCCTCCTCAAGCACAAGGTACAGGTTTCAAACCCCACATTGCAGTGGGTTTTGCTCTCTTCTCTTCTCTTCTCTTCTCTTCTCTTCTCTTCTCTTCTCTTCTCTTCTCTTCTCTTCTCTTCTCTTCTCTTCTCTTCTCTTCTCTTCTCTTCTCTTCTCTTCTCTTCTCTTCTCTTCTCTTCCTACTGCATTCTGCTTCACTGTTTAGTCCCACAATCAATCACATCAGCAGAGACCAAGAAGGGANTGAGACCGAGACACAACAGGAAAAGAGAGAGAAAAAACAGCACAGGAAGGGAGTCTGGAAACATATTAG
4 9 . A h 5 2 6 : ( T C ) 2t____________________________________________________________________________
CCAAGGAGCAGTCATCACTGCTCAGGGACTGGCAGGGTGTTGGTTGGTGG GTGGCGAGCGGTTGCATCAACTTGTTTTCCCTGGGTTCTCTCTCTCTCTC TCTCTCTCTCTCTCTCTCTCTCTCTCTCTCTCTCTCTCTCTGTTTCCCAA TCATTACAAATTATTACTATTACAACATTTGAGTTATTAAATGGTTCTTA TCTCAACCGATGAGTTTTCCCACTTTTGCTCTTTCAGTTCTCTTCCCCAT TCCACTAGGGGGAGGCGGATAGGGTGTGAGCAACCGGCTGTGTCGTGCTT AGTTGCCAACTGGAGCCAAACCACAACAGACTCCAATGTCCTAGTGTAAA GGCTAGATCCCAATGTTTTCCAAGAAAACTGTATGTTAGCTGGACATTAT TTTTTTAAAAAAAGAAAATAACCAGCCTTTATTCCAATTACTTTATGGAC TTTTTCTAATTTGGGAAAGGACCAGGTAGTTTTCAGAATCACTAACAAAC CTCTGTTGTGCATATTACCATTTGCTGGCTGCAGCTTTTAGTATTCCAGC AGGGATGAATCAAACAAT GATAAAAAGTTTTTGTTTATCCTGTCAAGGGG AAAA
5 0 . A h 5 3 4 ; ( A C ) i 0 and ( G T ) 8( T A ) 5_____________________________________________________
CCCAGCAGTGCACTCGGATGCTCAGGACAGTAGCCCTTCTTTGTCCATGG TGTTGCACACTCCTGAGGGGCTGGTACATGGGGAAGCATGTTAGTTGTGG TGGGGGAATTGTGATTAGCAGACATGCGCGCATGTACACACACACACACA CACACATAATATAAAAATAGCTTACTTCAGATAATTTCAAGCAACTATTT TATATGAGTAGTTATTTTAAATAAGCTGCGACTGAATTAGTCTCAGCCAA AAAGGCTCAGCCTTACATGCAGCAAATTTGGAGAACTGCTTCTGCTAGCA GAAGCGCTTCATTTTGGTCCCCTCTGGCTGATCAGGGTGAAGGTCTACTA GT GT GAAGCAGTATACGT GTGTGTGTGTGT GTATATATATACGCAT GTAT AT GT GT GAT AC AT ACT AT CT ACGT AAGC AAT AT AC AT AT GT GTT AT AT GC ATAAAGCATGTATACACAACGTGGACCTCTCCAGTAGCTGAGCTCAGTCT GCCATTAACTGG
94
Reproduced with permission of the copyright owner. Further reproduction prohibited without permission.

APPENDIX F continued
51. Ah 536; (A Q UCCATAAAGGTTTCTCTAACCTCTGGTTGCCTAAGAGCCAGAGGTGGAGGAGCTTTAGAATTTGCATCCNGANGATATAGAAATAATATTCTGAAGAACCAAAATCGACCCTGGTTTAGATCACATGATGGAGTTACACACACACACACACACACACACACACAAATTTAAAAATAATGATAAGCAAAAGAACAGCATGAGATGGAACAGGTTGCCCAGAGAGGTTGTGGATGCCCCATGCCTGAAAACTANCAGAAGC
5 2 . A h 5 4 6 : (TC)27______________________________________________CCTGAGTCTGCCCTCAAGCGGAGTTATTTTGCCTCCAGAGCATCTCTCCCAATACCAGCAAACAAGGGTGTGATCCTGCAGGAAGAGTGAGAAATGGTCTGGATTTTGTTTCTCTCTCTCTCTCTCTCTCTCTCTCTCTCTCTCTCTCTCTCTCTCTCTCTCTCGTAAAATAGGAATGAAAAATGCACCCATCTTCCCTCCCGGCAGCCAGGAGAGAGGAAACAATCTGTTTATTTGACAATAAAAACCCA
5 3 . A h 5 5 0 : (TQ n_______________________________________________CCTCAACGGACACGACTGACACAATCGAAAGGCGGGAACAAGACTATAAAAGGCACGACTCAAAGGAGCCGAGTGCGTGCCCACCACCAGAGGATTAGGATTGCCACGTCCGTCAACATCATCGTGGGATCCAAAGGTGGTGATCTCTCTCTCTCTCTCTCTCTCTCTTTTCCTTTTTCTTCTCAG
5 4 . A h 5 5 6 : ( T C ) 6____________________________________________________________________________
CCCAAGTCCTTGTGACACTGAGGGGGGGAGCAATGCTGTGTGGGAGAGGAGACTAGGGAGTTGCTCTGGGGAAGGGGCTTTCACTGCAGGGGATGGCAAGGAGGTGTCCAAAATATCCTCTCCCACCACATTTCTAGGATCTCCTCCATCTCTCTCTCTCTGACAATGTCCCTGCTGGGAACT
5 5 . A h 5 7 3 : ( T A M A C h ____________________________________________________________________
CCAGCTAATGGGCAGACTGAGCTCAGCTACTGGAGAGGTCCACGTTGTGT ATACATGCTTTATGCATATAACACATATGTATATTGCTTACGTAGATAGT ATGTATCACACATATACATGCGTATATATATACACACACACACACACACA GTATACTGCTTCACACTAGTAGACCTTCACCCTGATCAGCCAGAGGGGAC CAAAAT GAAGC
9 5
Reproduced with permission of the copyright owner. Further reproduction prohibited without permission.

APPENDIX F continued
56. Ah 581: (ACbAAAAAATCAGCTCCTTTGCAGGATTCACAACATAGGCTCTTAGTGAGCCTTTGTGAGAAAGTGCACACAAACACACACACACACACACGTCTAAGCAGGAGGGACCAAAGGAGCAGGTTACCCTGACAATAAAGTGATGTTAGCCAAATGTGACCTAATTT
5 7 . A h 5 9 0 ; ( C A ) SC T ( C A ) | 0______________________________________________________________
TCACCTACATACACACACACACTCACACACACACACACACACAAGTGCACTTTGATGGGTGTCACACCTGGGCAACACTCATACTCCTGTTATCTAATGCAGTGCAATTTGTTAAGTGAATGTGAAAAGGATATGTTTTGNGCATATACC
5 8 . A h 5 9 4 ; ( C A ) n ___________________________________________________________________________
CTTGCTTCCTTCACCATGATGCCTGGCTGTGCACCATGAAAACACTTCTGCGTGCCCTCACCCTGCACACACACACACACACACACACTTTATCTCTACATTAGTGTTTTCCTCACTTGGGTTCATACCTCCCAAAACATTGAGAACACAAGGAGAACANACTCTGTANAANACCAA
5 9 . A h 6 0 3 : ( T C C ) 5__________________________________________________________________________
TACAGATGTCTACTGGCAGAGCCGCAGGCGTGATCTCCGACCGATGCACCTGTGTTGGCAAAAGCTCTTACGTGGGTGCAATTAAAGCAGCAAACCTGCACTTCCACTGAGGCTAATTTTAGTCTTTACTCCTGGGTGCCCAGGAATAAACTGCACTGGCTCATATAGGACATTGCCGGTGCCAGCTACATCCAAACTCATGTTTTAGCAACTTCTTTCTGTAGAGCATACCCGTACTGAAGAGTCCCCCCTTTCCCATACAACACTGCACACCCCTCCTTCTCTTCCTCCTCCTCCTCCTCTTTCTCCTTCTCTTCCTCCTCCTTCTCCCCGCTCTTAACTTTTGAGTCACAGCATATACAGACAGCAGCAATGACTTTCATGTAACTGATGGAAGGAAC
6 0 . A h 6 3 0 : ( T C ) n ___________________________________________________________________________
GGTGGTGGTGCTGT GAGTTATACAAGACC CAGTAGGAAGCAGCGGCAGGC AGTATTATTTCAGTGGTTTGAGCCAAAACTTTCTCTCTCTCTCTCTCTCT CTCTCATTAAATTACAACTAATGCAAGTAGCATTGTGAAGGAGGAATTTG GGAACTGTTGTTCATCATCCAATC
96
Reproduced with permission of the copyright owner. Further reproduction prohibited without permission.
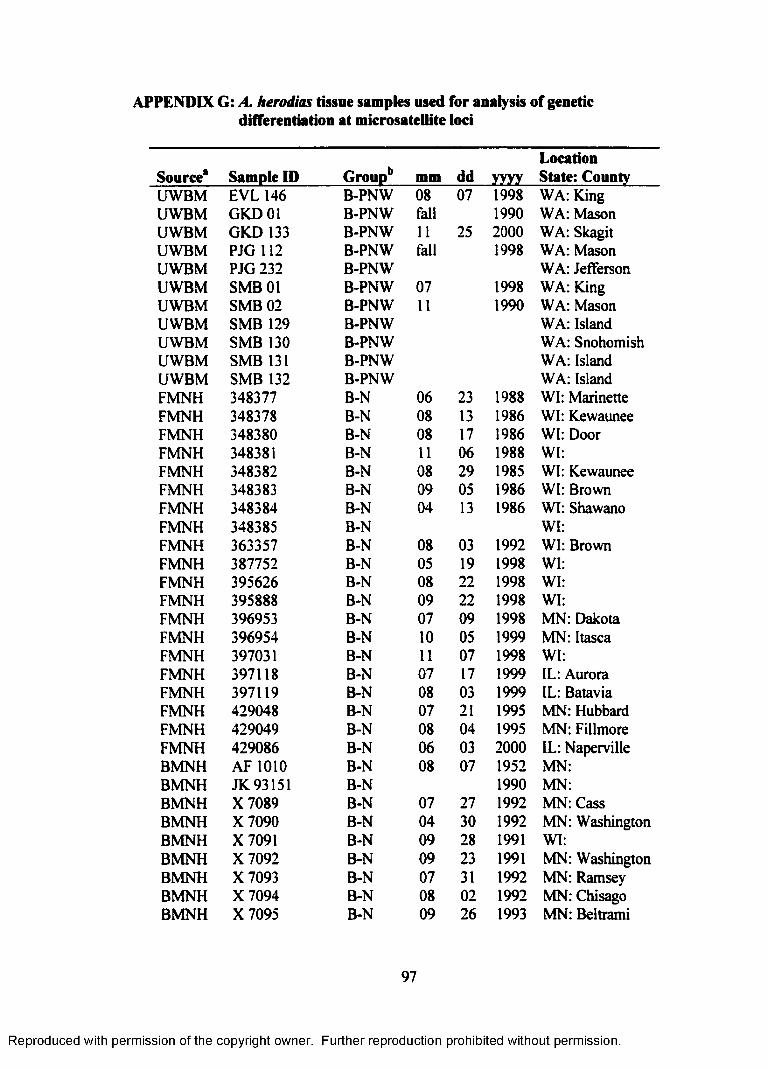
APPENDIX G: A. herodias tissue samples used for analysis of genetic differentiation at microsatellite loci
Source* Sample ID Groupb mm dd yyyyLocation State: County
UWBM EVL 146 B-PNW 08 07 1998 WA: KingUWBM GKD01 B-PNW fall 1990 WA: MasonUWBM GKD 133 B-PNW 11 25 2000 WA: SkagitUWBM PJG 112 B-PNW fall 1998 WA: MasonUWBM PJG 232 B-PNW WA: JeffersonUWBM SMB 01 B-PNW 07 1998 WA: KingUWBM SMB 02 B-PNW 11 1990 WA: MasonUWBM SMB 129 B-PNW WA: IslandUWBM SMB 130 B-PNW WA: SnohomishUWBM SMB 131 B-PNW WA: IslandUWBM SMB 132 B-PNW WA: IslandFMNH 348377 B-N 06 23 1988 WI: MarinetteFMNH 348378 B-N 08 13 1986 WI: KewauneeFMNH 348380 B-N 08 17 1986 WI: DoorFMNH 348381 B-N 11 06 1988 WI:FMNH 348382 B-N 08 29 1985 WI: KewauneeFMNH 348383 B-N 09 05 1986 WI: BrownFMNH 348384 B-N 04 13 1986 WI: ShawanoFMNH 348385 B-N WI:FMNH 363357 B-N 08 03 1992 WI: BrownFMNH 387752 B-N 05 19 1998 WI:FMNH 395626 B-N 08 22 1998 WI:FMNH 395888 B-N 09 22 1998 WI:FMNH 396953 B-N 07 09 1998 MN: DakotaFMNH 396954 B-N 10 05 1999 MN: ItascaFMNH 397031 B-N 11 07 1998 WI:FMNH 397118 B-N 07 17 1999 IL: AuroraFMNH 397119 B-N 08 03 1999 IL: BataviaFMNH 429048 B-N 07 21 1995 MN: HubbardFMNH 429049 B-N 08 04 1995 MN: FillmoreFMNH 429086 B-N 06 03 2000 IL: NapervilleBMNH AF 1010 B-N 08 07 1952 MN:BMNH JK 93151 B-N 1990 MN:BMNH X7089 B-N 07 27 1992 MN: CassBMNH X 7090 B-N 04 30 1992 MN: WashingtonBMNH X 7091 B-N 09 28 1991 WI:BMNH X 7092 B-N 09 23 1991 MN: WashingtonBMNH X 7093 B-N 07 31 1992 MN: RamseyBMNH X 7094 B-N 08 02 1992 MN: ChisagoBMNH X 7095 B-N 09 26 1993 MN: Beltrami
97
Reproduced with permission of the copyright owner. Further reproduction prohibited without permission.

APPENDIX G continued
LocationSource* Sample ID Groupb mm dd yyyy State: CountyBMNH X 7096 B-N 08 06 1992 MN: RamseyHLM 04 03 00N01 B-FP 04 03 2000 FL: DadeHLM 04 03 00 N02 B-FP 04 03 2000 FL: DadeHLM 04 03 00 N03 B-FP 04 03 2000 FL: DadeHLM 04 03 00 N04 B-FP 04 03 2000 FL: DadeHLM 04 03 00 N05 B-FP 04 03 2000 FL: DadeHLM 04 03 00 N06 B-FP 04 03 2000 FL: DadeHLM 04 03 00 N07 B-FP 04 03 2000 FL: DadeHLM 04 03 00 N08 B-FP 04 03 2000 FL: DadeHLM 04 03 00 N09 B-FP 04 03 2000 FL: DadeHLM 04 03 00 N10 B-FP 04 03 2000 FL: DadeHLM 04 03 00 N il B-FP 04 03 2000 FL: DadeHLM 04 03 00 N12 B-FP 04 03 2000 FL: DadeHLM 04 03 00 N13 B-FP 04 03 2000 FL: DadeHLM 04 03 00 N14 B-FP 04 03 2000 FL: DadeHLM 04 03 00NI5 B-FP 04 03 2000 FL: DadeHLM 04 03 00N16 B-FP 04 03 2000 FL: DadeHLM 04 03 00N17 B-FP 04 03 2000 FL: DadeHLM 04 03 00N18 B-FP 04 03 2000 FL: DadeHLM 04 03 00NI9 B-FP 04 03 2000 FL: DadeHLM 04 03 00 N21 B-FP 04 03 2000 FL: DadeHLM 04 04 00 N01 B-FP 04 04 2000 FL: DadeHLM 04 04 00 N02 B-FP 04 04 2000 FL: DadeHLM 04 04 00 N03 B-FP 04 04 2000 FL: DadeHLM 12 03 98 N2C1 B-FB 12 03 1998 FL: MonroeHLM 12 09 98 N1C1 B-FB 12 09 1998 FL: MonroeHLM 12 15 98 N1C1 B-FB 12 15 1998 FL: MonroeHLM 12 15 98 N2C1 B-FB 12 15 1998 FL: MonroeHLM 12 15 98 N3C1 B-FB 12 15 1998 FL: MonroeHLM 12 16 98 N1C1 B-FB 12 16 1998 FL: MonroeHLM 12 18 98 N3C1 B-FB 12 18 1998 FL: MonroeHLM 12 21 98N1C1 B-FB 12 21 1998 FL: MonroeHLM 01 10 99N2C1 B-FB 01 10 1999 FL: MonroeHLM 01 10 99N3C1 B-FB 01 10 1999 FL: MonroeHLM 01 10 99N4C1 B-FB 01 10 1999 FL: MonroeHLM 01 12 99N5C1 B-FB 01 12 1999 FL: MonroeHLM 01 14 99 N1C1 B-FB 01 14 1999 FL: MonroeHLM 01 21 99N1C1 B-FB 01 21 1999 FL: MonroeHLM 01 21 99N2C1 B-FB 01 21 1999 FL: MonroeHLM 01 21 99 N3C2 B-FB 01 21 1999 FL: MonroeHLM 01 21 99N4C1 B-FB 01 21 1999 FL: Monroe
Reproduced with permission of the copyright owner. Further reproduction prohibited without permission.

APPENDIX G continued
Source* Sample ID Group* mm dd yyyyLocation State: Couni
HLM 01 21 99N5C1 B-FB 01 21 1999 FL: MonroeHLM 01 27 99N1C1 B-FB 01 27 1999 FL: MonroeHLM 01 27 99N5C1 B-FB 01 27 1999 FL: MonroeHLM 01 27 99N6C1 B-FB 01 27 1999 FL: MonroeHLM 01 27 99N7C1 B-FB 01 27 1999 FL: MonroeHLM 02 03 99N4C1 B-FB 02 03 1999 FL: MonroeHLM 02 03 99N5C1 B-FB 02 03 1999 FL: MonroeHLM 02 03 99N6C1 B-FB 02 03 1999 FL: MonroeHLM 02 06 99 NIC 1 B-FB 02 06 1999 FL: MonroeHLM 02 06 99 N2C1 B-FB 02 06 1999 FL: MonroeHLM 02 06 99 N3C1 B-FB 02 06 1999 FL: MonroeHLM 02 06 99N4C1 B-FB 02 06 1999 FL: MonroeHLM 02 06 99 N6C1 B-FB 02 06 1999 FL: MonroeHLM 02 06 99 N8C1 B-FB 02 06 1999 FL: MonroeHLM 02 09 99 NIC2 B-FB 02 09 1999 FL: MonroeHLM 02 17 99NIC1 B-FB 02 17 1999 FL: MonroeHLM 02 17 99 N2C1 B-FB 02 17 1999 FL: MonroeHLM 02 17 99N3C1 B-FB 02 17 1999 FL: MonroeHLM 11 13 98N1C2 W-FB 11 13 1998 FL: MonroeHLM 11 13 98N2C1 W-FB 11 13 1998 FL: MonroeHLM 11 15 98 N1C1 W-FB 11 15 1998 FL: MonroeHLM 11 29 98 N1C1 W-FB 11 29 1998 FL: MonroeHLM 11 30 98N1C4 W-FB 11 30 1998 FL: MonroeHLM 11 30 98 N2C1 W-FB It 30 1998 FL: MonroeHLM 11 30 98 N3C1 W-FB 11 30 1998 FL: MonroeHLM 12 03 98N1C1 W-FB 12 03 1998 FL: MonroeHLM 12 03 98 N3C1 W-FB 12 03 1998 FL: MonroeHLM 12 05 98N1C1 W-FB 12 05 1998 FL: MonroeHLM 12 06 98N1C1 W-FB 12 06 1998 FL: MonroeHLM 12 06 98 N2CI W-FB 12 06 1998 FL: MonroeHLM 12 06 98 N3C1 W-FB 12 06 1998 FL: MonroeHLM 12 09 98 NIC1 W-FB 12 09 1998 FL: MonroeHLM 12 10 98 N1CI W-FB 12 10 1998 FL: MonroeHLM 12 13 98N1C1 W-FB 12 13 1998 FL: MonroeHLM 12 13 98N2C1 W-FB 12 13 1998 FL: MonroeHLM 12 16 98 N2CI W-FB 12 16 1998 FL: MonroeHLM 12 16 98N3CI W-FB 12 16 1998 FL: MonroeHLM 12 16 98N4C1 W-FB 12 16 1998 FL: MonroeHLM 12 1798 NIC1 W-FB 12 17 1998 FL: MonroeHLM 12 17 98N2C1 W-FB 12 17 1998 FL: MonroeHLM 12 17 98 N3CI W-FB 12 17 1998 FL: Monroe
Reproduced with permission of the copyright owner. Further reproduction prohibited without permission.

APPENDIX G continued
LocationSource* Sample ID Group* mm dd yyyy State: CouniHLM 12 18 98N1C1 W-FB 12 18 1998 FL: MonroeHLM 12 18 98N2C1 W-FB 12 18 1998 FL: MonroeHLM 12 19 98 N1C1 W-FB 12 19 1998 FL: MonroeHLM 12 20 98N1C1 W-FB 12 20 1998 FL: MonroeHLM 12 21 98 N2C1 W-FB 12 21 1998 FL: MonroeHLM 12 21 98 N3C1 W-FB 12 21 1998 FL: MonroeHLM 12 21 98N4C1 W-FB 12 21 1998 FL: MonroeHLM 12 21 98 N5C1 W-FB 12 21 1998 FL: MonroeHLM 12 21 98 N6C1 W-FB 12 21 1998 FL: MonroeHLM 12 22 98N1C1 W-FB 12 22 1998 FL: MonroeHLM 12 22 98 N2C1 W-FB 12 22 1998 FL: MonroeHLM 12 22 98 N3C1 W-FB 12 22 1998 FL: MonroeHLM 12 23 98N1C1 W-FB 12 23 1998 FL: MonroeHLM 12 23 98 N2C1 W-FB 12 23 1998 FL: MonroeHLM 1231 98N1C1 W-FB 12 31 1998 FL: MonroeHLM 01 06 99 NIC 1 W-FB 01 06 1999 FL: MonroeHLM 01 08 99 N1CI W-FB 01 08 1999 FL: MonroeHLM 01 10 99 NICl W-FB 01 10 1999 FL: MonroeHLM 01 12 99N1C1 W-FB 01 12 1999 FL: MonroeHLM 01 12 99N2C1 W-FB 01 12 1999 FL: MonroeHLM 01 12 99N3C1 W-FB 01 12 1999 FL: MonroeHLM 01 12 99N4C1 W-FB 01 12 1999 FL: MonroeHLM 01 12 99N6C1 W-FB 01 12 1999 FL: MonroeHLM 01 12 99N7C1 W-FB 01 12 1999 FL: MonroeHLM 01 13 99N1C1 W-FB 01 13 1999 FL: MonroeHLM 01 13 99N2C1 W-FB 01 13 1999 FL: MonroeHLM 01 14 99N2C1 W-FB 01 14 1999 FL: MonroeHLM 01 17 99 NICl W-FB 01 17 1999 FL: MonroeHLM 01 17 99N2C1 W-FB 01 17 1999 FL: MonroeHLM 01 17 99N3C1 W-FB 01 17 1999 FL: MonroeHLM 01 18 99 NICl W-FB 01 18 1999 FL: MonroeHLM 01 18 99N2C1 W-FB 01 18 1999 FL: MonroeHLM 01 18 99N3C1 W-FB 01 18 1999 FL: MonroeHLM 01 19 99 NICl W-FB 01 19 1999 FL: MonroeHLM 01 19 99N2C1 W-FB 01 19 1999 FL: MonroeHLM 01 19 99N3C1 W-FB 01 19 1999 FL: MonroeHLM 01 19 99N4C1 W-FB 01 19 1999 FL: MonroeHLM 01 20 99 NICl W-FB 01 20 1999 FL: MonroeHLM 01 26 99 NICl W-FB 01 26 1999 FL: MonroeHLM 01 26 99N2C1 W-FB 01 26 1999 FL: MonroeHLM 01 27 99N2C1 W-FB 01 27 1999 FL: Monroe
100
Reproduced with permission of the copyright owner. Further reproduction prohibited without permission.

APPENDIX G continued
Source* Sample ID Groupb mm dd yyyyLocation State: Count
HLM 01 27 99N3C1 W-FB 01 27 1999 FL: MonroeHLM 01 27 99N4C1 W-FB 01 27 1999 FL: MonroeHLM 01 29 99 NICl W-FB 01 29 1999 FL: MonroeHLM 01 31 99 NICl W-FB 01 31 1999 FL: MonroeHLM 01 31 99N2C1 W-FB 01 31 1999 FL: MonroeHLM 02 02 99 NICl W-FB 02 02 1999 FL: MonroeHLM 02 02 99 N2C1 W-FB 02 02 1999 FL: MonroeHLM 02 03 99 NICl W-FB 02 03 1999 FL: MonroeHLM 02 03 99 N2C1 W-FB 02 03 1999 FL: MonroeHLM 02 03 99 N3CI W-FB 02 03 1999 FL: MonroeHLM 02 06 99N5C1 W-FB 02 06 1999 FL: MonroeHLM 02 06 99N7C1 W-FB 02 06 1999 FL: MonroeHLM 02 07 99 NICl W-FB 02 07 1999 FL: MonroeHLM 12 26 96 -1 W-OK 12 26 1996 FL: MonroeHLM 12 30 96 N1C2 W-OK 12 30 1996 FL: MonroeHLM 12 30 96N2C1 W-OK 12 30 1996 FL: MonroeHLM 01 02 97 NICl W-OK 01 02 1997 FL: MonroeHLM 01 02 97 N2C1 W-OK 01 02 1997 FL: MonroeHLM 01 02 97 N3C1 W-OK 01 02 1997 FL: MonroeHLM 01 02 97N4C1 W-OK 01 02 1997 FL: MonroeHLM 01 02 97 N5C1 W-OK 01 02 1997 FL: MonroeHLM 01 04 97 NICl W-OK 01 04 1997 FL: MonroeHLM 01 06 97 NICl W-OK 01 06 1997 FL: MonroeHLM 01 06 97 N2C1 W-OK 01 06 1997 FL: MonroeHLM 01 07 97 NICl W-OK 01 07 1997 FL: MonroeHLM 01 12 98 NICl W-OK 01 12 1998 FL: MonroeHLM 01 1798 NICl W-OK 01 17 1998 FL: MonroeHLM 01 17 98N2C1 W-OK 01 17 1998 FL: MonroeHLM 01 17 98N3C1 W-OK 01 17 1998 FL: MonroeHLM 01 17 98N5C1 W-OK 01 17 1998 FL: MonroeHLM 01 17 98N6C1 W-OK 01 17 1998 FL: MonroeHLM 01 1898 NICl W-OK 01 18 1998 FL: MonroeHLM 01 18 98N2C1 W-OK 01 18 1998 FL: MonroeHLM 01 20 98 NICl W-OK 01 20 1998 FL: MonroeHLM 01 21 98N2C1 W-OK 01 21 1998 FL: MonroeHLM 01 31 98 NICl W-OK 01 31 1998 FL: MonroeHLM 01 31 98N2C1 W-OK 01 31 1998 FL: MonroeHLM 01 12 98N2C1 W-OK 01 12 1998 FL: MonroeHLM 02 26 99 N5C1 W-OK 02 26 1999 FL: MonroeHLM 02 08 99 NICl W-OK 02 08 1999 FL: MonroeHLM 02 19 99 NICl W-OK 02 19 1999 FL: Monroe
101
Reproduced with permission of the copyright owner. Further reproduction prohibited without permission.
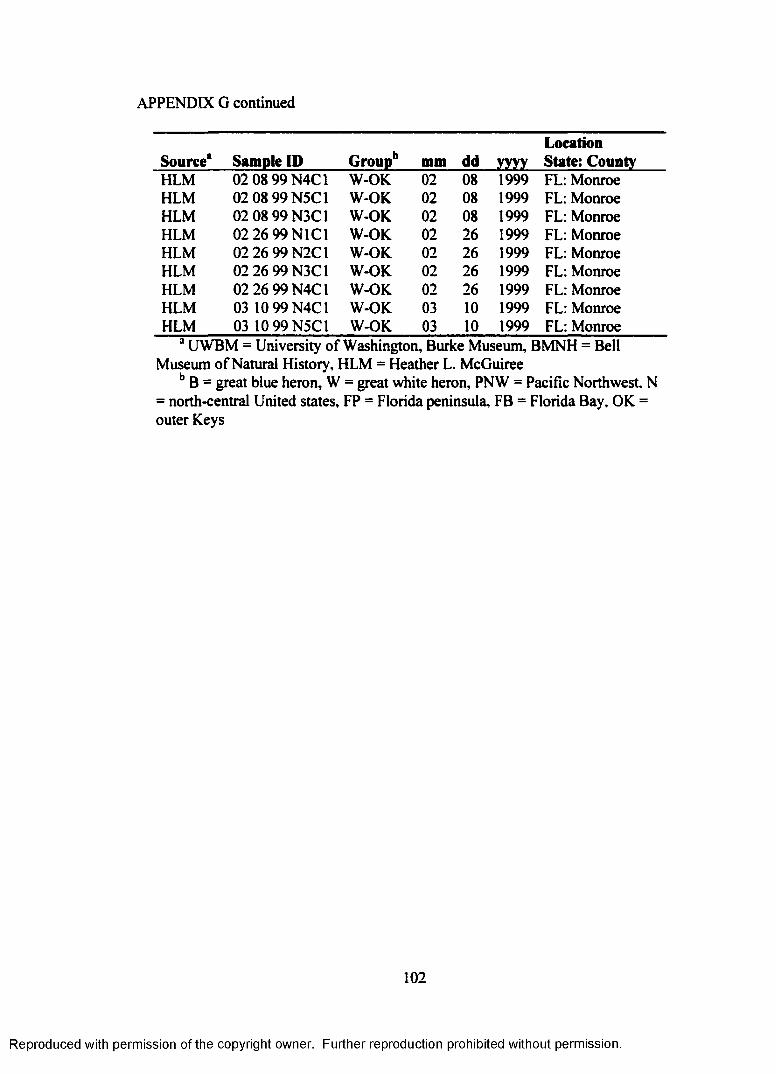
APPENDIX G continued
Source* Sample ID Groupb mm dd yyyyLocation State: County
HLM 02 08 99 N4C1 W-OK 02 08 1999 FL: MonroeHLM 02 08 99N5C1 W-OK 02 08 1999 FL: MonroeHLM 02 08 99 N3C1 W-OK 02 08 1999 FL: MonroeHLM 02 26 99 NICl W-OK 02 26 1999 FL: MonroeHLM 02 26 99 N2C1 W-OK 02 26 1999 FL: MonroeHLM 02 26 99N3C1 W-OK 02 26 1999 FL: MonroeHLM 02 26 99 N4C1 W-OK 02 26 1999 FL: MonroeHLM 03 10 99N4C1 W-OK 03 10 1999 FL: MonroeHLM 03 10 99N5C1 W-OK 03 10 1999 FL: Monroe
a UWBM = University of Washington, Burke Museum, BMNH = Bell Museum of Natural History, HLM = Heather L. McGuiree
b B = great blue heron, W = great white heron, PNW = Pacific Northwest, N = north-central United states, FP = Florida peninsula, FB = Florida Bay, OK = outer Keys
102
Reproduced with permission of the copyright owner. Further reproduction prohibited without permission.

APPENDIX H: Results of tests for independence of loci; Chi-square (X2), degrees of freedom (dff) and p-values for each locus pair across all populations
Locus pair X! df p-value Locus pair X df p-valueAh 205-A h 209 10.5 10 0.400 Ah 217 - Ah 517 10.7 10 0.378Ah 205 - Ah 211 8.2 10 0.606 Ah 320-A h 517 16.8 10 0.078Ah 209-A h 211 10.9 10 0.366 Ah 341 - Ah 517 4.1 10 0.942Ah 205-A h 217 8.0 10 0.626 Ah 343-A h 517 8.4 10 0.593Ah 209-A h 217 15.6 10 0.110 Ah 414 - Ah 517 12.4 10 0.276Ah 211 - Ah 217 9.4 10 0.498 Ah 421 - Ah 517 2.3 10 0.971Ah 205-A h 320 5.5 10 0.856 Ah 205-A h 526 11.0 08 0.202Ah 209 - Ah 320 10.1 10 0.430 Ah 209 - Ah 526 5.7 08 0.679Ah 211 - Ah 320 2.2 10 0.995 Ah 211-A h 526 16.9 08 0.031Ah 217-A h 302 8.2 10 0.611 Ah 217-A h 526 1.8 08 0.988Ah 205-A h 341 16.5 10 0.085 Ah 320 - Ah 526 4.9 08 0.767Ah 209 - Ah 341 5.3 10 0.870 Ah 341 - Ah 526 1.8 08 0.985Ah 211 - Ah 341 20.7 10 0.023 Ah 343 - Ah 526 10.6 08 0.226Ah 217 - Ah 341 13.4 10 0.202 Ah 414-A h 526 2.9 08 0.940Ah 320 - Ah 341 14.0 10 0.173 Ah 421 - Ah 526 0.9 06 0.989Ah 205 - Ah 343 5.3 10 0.871 Ah 517-A h 526 1.0 08 0.998Ah 209 - Ah 343 4.3 10 0.931 Ah 205 - Ah 536 3.3 10 0.974Ah 211 - Ah 343 3.0 10 0.982 Ah 209 - Ah 536 14.0 10 0.175Ah 217-A h 343 3.2 10 0.976 Ah 211 - Ah 536 4.6 10 0.915Ah 320 - Ah 343 5.6 10 0.844 Ah 217-A h 536 8.2 10 0.604Ah 341 - Ah 343 5.5 10 0.853 Ah 320 - Ah 536 10.1 10 0.436Ah 205-A h 414 6.5 10 0.770 Ah 341 - Ah 536 10.5 10 0.394Ah 209-A h 414 5.7 10 0.842 Ah 343 - Ah 536 6.3 10 0.788Ah 211 - Ah 414 7.2 10 0.711 Ah 414-A h 536 16.9 10 0.077Ah 217 - Ah 414 3.4 10 0.971 Ah 421 - Ah 536 8.3 08 0.403Ah 320-A h 414 6.7 10 0.750 Ah 517-A h 536 7.8 10 0.653Ah 341 - Ah 414 11.8 10 0.300 Ah 526 - Ah 536 7.0 08 0.538Ah 343 - Ah 414 12.8 10 0.238 Ah 205 - Ah 630 18.0 10 0.055Ah 205-A h 421 1.4 08 0.994 Ah 209 - Ah 630 5.4 10 0.863Ah 209-A h 421 5.4 08 0.714 Ah 211 - Ah 630 24.4 10 0.007Ah 211 - Ah 421 6.5 08 0.589 Ah 217-A h 630 5.4 10 0.866Ah 217-A h 421 8.2 08 0.413 Ah 320 - Ah 630 8.5 10 0.576Ah 320-A h 421 8.2 08 0.412 Ah 341 - Ah 630 6.7 10 0.752Ah 341 - Ah 421 8.7 08 0.354 Ah 343 - Ah 630 7.2 10 0.706Ah 343 -A h 421 6.1 08 0.628 Ah 414-A h 630 6.4 10 0.779Ah 414-A h 421 5.5 08 0.708 Ah 421 - Ah 630 5.0 08 0.750Ah 205-A h 517 12.6 10 0.249 Ah 517-A h 630 3.1 10 0.978Ah 209-A h 517 7.4 10 0.684 Ah 526 - Ah 630 9.6 08 0.292Ah211 - Ah517 1.6 10 0.998 Ah 536 - Ah 630 6.1 10 0.808
Reproduced with permission of the copyright owner. Further reproduction prohibited without permission.

Reproduced
with perm
ission of the
copyright ow
ner. Further
reproduction prohibited
without
permission.
APPENDIX I: Genotypes of the 213 Great White and Great Blue herons used for tests of population differentiation
The following table contains genotypes of 213 Great White and Great Blue herons at 13 microsatellite loci. Alleles at each locus are numbered consecutively and genotypes are expressed as a four digit number (for example, sample EVL 146 is homozygous for allele number 2 at locus Ah 205 and heterozygous for alleles 3 and 6 at locus Ah 209).
Ah Ah Ah Ah Ah Ah Ah Ah Ah Ah Ah Ah AhSource* Sample ID Croupb 205 209 211 217 320 341 343 414 421 517 526 536 630UWBM EVL 146 B-PNW 0202 0306 0707 0303 0202 0203 0407 0810 0303 0409 0506 0606 0303UWBM GKD0I B-PNW 0303 0507 0207 0303 0203 0203 0707 0808 0304 0409 0614 0506 0203UWBM GKD 133 B-PNW 0000 0510 0207 0303 0202 0202 0404 0810 0000 0409 0715 0305 0303UWBM PJG 112 B-PNW 0203 0000 0307 0303 0203 0203 0404 0608 0304 0309 0816 0306 0303UWBM PJG 232 B-PNW 0303 0310 0707 0304 0203 0202 0404 0810 0303 0309 0606 0303 0303UWBM SMB 01 B-PNW 0303 0810 0707 0404 0203 0203 0204 0606 0303 0609 0814 0306 0303UWBM SMB 02 B-PNW 0203 0708 0207 0304 0202 0202 0405 0710 0303 0407 0815 0303 0203UWBM SMB 129 B-PNW 0303 0606 0707 0303 0202 0202 0207 0708 0404 0509 1516 0606 0203UWBM SMB 130 B-PNW 0303 0505 0207 0303 0204 0203 0507 0408 0304 0509 0000 0304 0303UWBM SMB 131 B-PNW 0303 0608 0307 0303 0202 0202 0404 0610 0304 0409 1216 0304 0303UWBM SMB 132 B-PNW 0202 0606 0202 0304 0202 0202 0204 0408 0303 0607 0000 0406 0303FMNH 348377 B-N 0203 0508 0507 0304 0303 0202 0102 0910 0000 0404 0516 0505 0304FMNH 348378 B-N 0303 0808 0507 0304 0202 0203 0103 0000 0000 0306 0916 0505 0203FMNH 348380 B-N 0203 0508 0707 0102 0203 0202 0102 0710 0000 0308 0716 0303 0303FMNH 348381 B-N 0203 0508 0707 0304 0202 0202 0107 0808 0000 0404 0712 0606 0303FMNH 348382 B-N 0203 0508 0507 0304 0304 0102 0101 0608 0000 0404 0106 0505 0303FMNH 348383 B-N 0203 0510 0205 0103 0203 0103 0407 0000 0000 0608 1217 0303 0203FMNH 348384 B-N 0203 0000 0305 0304 0202 0303 0407 0707 0000 0306 0102 0305 0303FMNH 348385 B-N 0303 0608 0305 0303 0204 0303 0204 0310 0000 0107 1515 0405 0303FMNH 363357 B-N 0203 0808 0303 0303 0303 0202 0105 0308 0000 0609 0708 0505 0303FMNH 387752 B-N 0303 0000 0307 0304 0203 0203 0107 0609 0000 0707 0000 0506 0204FMNH 395626 B-N 0203 0303 0303 0304 0203 0203 0203 0608 0000 0404 1216 0303 0303

APPE
NDIX
1 c
ontin
ued
< 3
■C •£■ w• W>
co CO CO 3 CO© © © ©cn co cn co CN© © © © ©
co©
vC© 8 CO
© 3in© 8 in
©wo©CO CO CO CO wo tn tn in
© © © © © © © © ©
■B 2 ^ *»»
CO CN CO CO CN© © © © ©CO pn CN mm pn© © © © ©
o o r*1 mo oCO
3CO CO CO
3CO CO CO CO n CN© © © © © © © © © © ©CO CO CO CO CN CO <N CN CO CO cn CO© © © © © © © © © © © © ©
3 S 3 3wo © . <o © O o ©
CO to CO to© © © © ©*o CO to CO CO© © © © ©
CNoo o O N © t
^ ' © O M O ' O ’T - O O ’O ' O ' A ' ©^ _ _—» —* * o © ^ > t n v © © — i a 00 ‘ ® "
© 00 © tomm.© w
r -© 2 3© — — o — — — — © o o — — — o ©
3 S S 8 3 S 3 3 S 8 3 8 3 3 3 3 S 33 3 3 3 3 3 3 3 3 8 3 3 3 3 3 3 ? '
o o o o o o oO O O Q © - -o o o o o _0 * 0 0 0 0
© © ac © © —© oo o r - ao aoo o o o o o
CO CO CO CO CO CO CO CO CO CO CO© © © © © © © © © © ©CO CO co CO CO CO CO CO CO CO CO© © © © © © © © © o ©
00©06
08 00 © ©A ooA 003 3 ©© 3
wto©w3
w3
or«1o
r - o oo r» o> r - o>0 - 0 0 0 0 0r~ r - m vo r - ^ oeo o o o o o o
c-» r-* r** © tn © CO© © © © © © © © ©CO mm mm mm mm CO CN© © © © © © © © ©
3 3 3 r - CO in in CO <N PNo © © © © © © ©vo PN© © © © © © © ©
© © cn co © ©
CO CO CO CO CO CO CO CO co CO CO co CO© © © © © © © © © © © © ©CN <N CN CO CO CO pn CO PN CO pn CN© © © © © © © © © © © © ©
3pn©
© © pn co © ©
CN CN CO CN cn CN CO wo CO© © © © © © © © ©<N CN CO cn CN CN cn PN CN© © © © © © © © ©
CO CN CO CN co CO CO CO CO CO CN CO CO© © © © © © © © © © © © ©CO CN cn CN CO CN CN CN CN co CM CO CO© © © © © © © © © © © © ©
© © 3 3 3
CO©CO
3 CO©CO
©CO
CO©CN
CO©
© © © © © ©3 3 3co co pn © © ©
CO CO© © © ©CO CN CN CN© © © ©
CO CO CO wo r -© © © © ©CO CO mm CO wo© © © © ©
©©
CO wo co CO wo wo wo CO 3 in in CO© © © © © © © © © © © © © ©co CO CO co CO co v> co CO co CN in CO© © © © © © © © © © © © © © ©
00 00 00 00 00© © © © ©tn 3 CO 00© © © ©
CO CO CO CO CO© © © o ©CN CO CO <N PN© © © © ©
© © co © © ©
© ©
00 00 00 00 00 00 00 00 tn tn 00 00© © © © © © © © © © © ©tn tn 00 wo 3 tn tn 00 tn CO in 00© © © © © © © © © © ©oo©3
CN CN © ©
© © © © ©
CN CO CO CO CO CO CO CO TT CO© Q © © © © © © © ©CN CN <N CO CN CN co PN CO CO© © © © © © © © © ©
© 00 © ©3 3
Z Z Z Z Z Z Z Z Z Z Z Z Z Z Z Z Z Z Z & £ ! rC Q C O C O C Q C Q ISS C Q C Q C O C Q C Q eQ C Q C Q C Q C Q C Q C Q C Q C Q C Q C Q
00 CO 00 © 0000 m tn CO mm 300 © © © m mmin sO SO r*** r - ON© © © © © © nCO CO CO CO CO co 'T
O |r\£ S z: — ^ © —S S 2 « 2 2 2S 2 o> o o o* S “ ■ X ^ *■* ^^ ^ C r j x X X X X X X X
IN ^ t f l OS K ^ ^ ^© © © ©r - r*- r - r -
o©
x x x x x x x xz z z z z z z z2 2 2 2 2 2 2 2
X X X X X X X X X Xz z z z z z z z z z z2 2? Z 2 2 2 2 2li. ca CQ CQ CQ CQ CQ CQ CQ CQ CQ
— ci mo o oz z z© ©
co co co © © ©
3 3 3
j j _i X X X
1 0 5
Reproduced with permission of the copyright owner. Further reproduction prohibited without permission.
HLM
04 03
00N
04
B-FP
02
03
0808
03
07
0304
02
03
0203
02
04
0608
03
03
0309
08
13
0404
03
03
HLM
04 03
00 NO
S B-
FP
0202
08
08
0303
03
04
0202
02
03
0203
10
10
0303
00
00
0816
06
06
0303
HLM
04 03
00 N0
6 B-
FP
0203
05
05
0303
04
04
0102
03
03
0304
07
08
0304
05
09
1016
04
05
0303
HLM
04 03
00 N0
7 B-
FP
0303
05
08
0307
02
04
0303
02
02
0102
03
07
0303
04
06
1216
03
06
0203
HLM
04 03
00 N0
8 B-
FP
0103
07
07
0707
04
04
0202
02
02
0103
02
10
0303
04
08
0610
04
06
0203
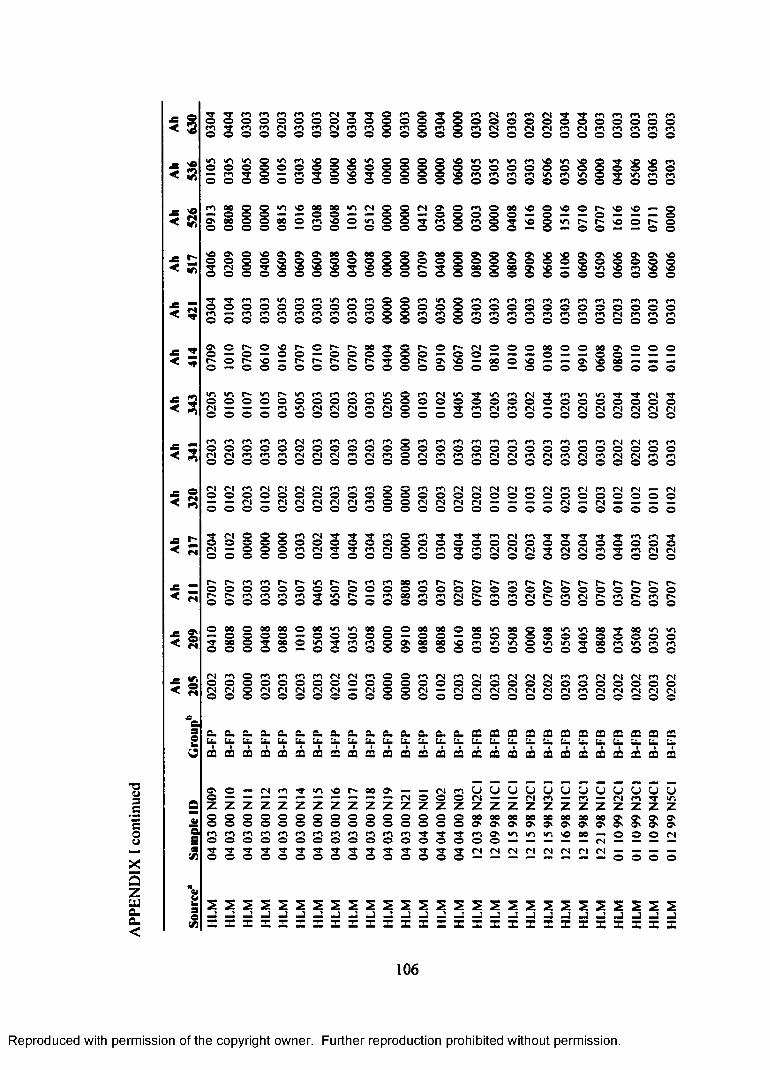
APP
END
IX
I con
tinue
d
tn
j s 2 ^ <»>
»*>
£ Is< 5
•B 2< s
03
3 3 S 3
cn cn cn cn cn CN© © © © © ©cn cn p i cn cn cn© © © © © ©
3 3cn cn o ocn CN cn cn CN 3 3 cn cn cn cn© © © © © © © © ©cn CN cn CN n cn n cn cn cn cn© © © © © © © © © © ©o o
— cn ^ © © ©
in in in cn 3 ©© © © © © ©cn cn cn cn in cn in© © © © © © ©
cn 00 © © in © 00 00 •n mmm © © Q a © © M S m© 00 © © 00 © cn © © in© © © © © © © ©
>© o p* © v© — o— — o — — — ov-> p* p* © © p** ©— © © — — © ©
3 3 .© — © •/> © © © ©
© ©© ©
3 3cn — O Ocn cn in cn cn «n cn cn© © © © © © © ©cn cn cn cn cn cn cn cn© © © © © © © ©
cn •n © cn cn cn cn cn cn cn cn cn cn cn© © © © © © © © © © © © © ©cn cn © cn cn cn cn cn cn cn cn rs cn cn© © © © © © © © © © © © © ©
© © © © © ©3 3 3
cn©cn©
© © P* © © P- O P- P* 00 5 p* © p* CN © © © 00 © © 00 © © © ©© mm © mm © © — © © © © © mm © © © © ©p* © P* © mm p* P* P- P* p* p ' © © 00 © © mm © © 00 mm mm ^m© © © © o © © © © © © © © © © © © © © © o © © © ©
in in P- in P* wn cn m cn cn •n © cn CN •n in cn CN cn in CN© © © © © © © © © © © © © © © © © © © © © © © © © © ©CN ^m mm mm cn in CN CN CN cn CN © mm mm cn CN cn CN CN CN p i CN CN CN PI© © © © © © © © © © © © © © © © © © © © © © © © © © ©
cn cn cn cn cn CN cn cn cn cn m © cn cn cn cn cn cn cn cn cn cn cn CN CN cn cn© © © © © © © © © © © © © © © © © © © © © © © © © © ©CN CN cn cn cn CN CN CN cn CN cn © CN cn cn cn p i CN cn CN cn CN cn CN CN cn cn© © © © © © © © © © © © © © © © © © © © © © © © © © ©
<N PI cn fN CN CN CN cn cn cn © © cn cn CN CN CN CN cn CN cn CN cn CN CN p i© © © © © © © © © © © © © © © © © © © © © © © © © © ©^m CN <N CN CN CN CN cn © © CN CN CN CN mm mm mm CN CN© © © © © © © © © © © © © © © © © © © © © © © © © © ©
^rmm PI ©mm ©AWPI©
W©
^ 38 3
©©
cn©
p i© 3 3 3 cn
©
00
00
cn©
©©
cn©
p i© © 3 cn
©CN©
CN©
cn©
cn CN cn TT TT 3 cn cn© © © © © © © © © ©cn p i CN CN n* CN PI cn cn p i© © © © o © © © © © ©
p>» p - m© © ©p- p* m© © ©
© 00 © — © © rr oo © © © ©
p* ©
. cn © ©
cn© p* in P* p* cn cn 00 cn p* p ' P* P- cn p* P* P* p* p* p* p*© © O © © © © © © © © © © © © © © © © ocn 3 in p* mm cn 00 cn cn CN P^ cn cn CN P* cn p i p** cn p^© © © © © © © © © © © © © © © © © © o
90 00 © © rr 00 © ©
© 00 in •n 00 © © 00 00 © 00 •n 00 © 00 •n in 00 00mm © © © © © mm © © © © © © © © © © © ©© in 3 cn cn o © 00 00 © cn in in © •n in 3 00 cn in
© © © © © © © © © © © © © © © © ©
p i cn © cn cn cn cn p i PI cn © o cn CN cn PI cn CN CN CN cn cn CN CN CN© © © © o © © © © © © © © © © © © © © © © © © © ©CN p i © p i PI p i p i CN mm p i Q © p i mm CN PI p i PI CN CN p i cn PI CN CN© © © © © © © © © © © © © © © © © © © © © © © © ©
© © cn P- © ©
© © cn cn © ©
© © p i r i © ©
a . a . a . a . a . a . A a . a .a . Li. La Li. Lb Li. Urn Li. Li.CQ CQ CQ CQ CQ CQ a a CQ
a. a. u . a .
a . a . a . a . a a a a a a a aLi. Li. Li. Li. Li. Li. Li. Li. Li. Li. Li.23 CQ CQ CQ CQ a a CQ a a a a
a .• iCQ CQ CO
a . a .CQ a .I I
CQ CQ
© © — c N m r r * / ' . n c p - o o © —
z z z z z z z z z z z z© © © © © © © © © © © ©© © © © © © © © © © © ©c n f n c n m c n c n c n c n c n m c n c n© © © © © © © © © © © ©
© © © © © © © © © © © ©
- n cn © © © z z z3 3 3
3 3©
u O U U 5 U U U U U u UfS mm mm CN cn mm cn CN cn r r inZ 2 2 2 2 2 2 2 2 2 2 290 00 00 00 00 00 00 00 © ©© ©O' © © © © © © © © © © ©r*»© •n in m © 00 © ©© CNo © — CN(N p i CN p i CN PI PI PI A.
■“ “ “ — — *■ — © © © ©
o —! — — — 3 —3 —3 — 3 —1 —J — —3 — — —3 —3 —1 —J —3 - J —2 —1 —1 — : ' ~ X X X X X X X X X X X X X X X X X X X X X X X X X X X
106
Reproduced with permission of the copyright owner. Further reproduction prohibited without permission.

Reproduced
with perm
ission of the
copyright ow
ner. Further
reproduction prohibited
without
permission.
APPENDIX I continued
Source* Sample ID GroupbAh205
Ah209
Ah211
HLM 01 14 99 NICl B-FB 0202 0308 0305HLM 01 21 99 NICl B-FB 0203 0808 0307HLM 01 21 99N2CI B-FB 0202 0305 0207HLM 01 21 99N3C2 B-FB 0202 0303 0707HLM 01 21 99N4CI B-FB 0202 0305 0505HLM 01 21 99 NSC 1 B-FB 0202 0308 0207HLM 01 27 99 NICl B-FB 0202 0408 0707HLM 01 27 99N5CI B-FB 0202 0808 0307HLM 01 27 99 N6CI B-FB 0203 0305 0305HLM 01 27 99N7CI B-FB 0203 0808 0707HLM 02 03 99 N4CI B-FB 0203 0108 0707HLM 02 03 99 NSC 1 B-FB 0202 0308 0707HLM 02 03 99 N6C1 B-FB 0202 0308 0707HLM 02 06 99 NICl B-FB 0203 0508 0507HLM 02 06 99 N2CI B-FB 0202 0305 0707HLM 02 06 99 N3C1 B-FB 0202 0608 0207HLM 02 06 99 N4C1 B-FB 0202 0508 0707HLM 02 06 99 N6CI B-FB 0203 0208 0303HLM 02 06 99 N8CI B-FB 0203 0608 0207HLM 02 09 99 N1C2 B-FB 0202 0303 0707HLM 02 17 99 NICl B-FB 0203 0305 0307HLM 02 I7 99N2CI B-FB 0202 0508 0307HLM 02 17 99 N3CI B-FB 0202 0308 0707HLM II I3 98NIC2 W-FB 0202 0308 0507HLM II I3 98N2CI W-FB 0202 0208 0707HLM II 15 98 NICl W-FB 0202 0305 0207HLM II 29 98 NICl W-FB 0203 0305 0303
Ah217
Ah320
Ah341
Ah343
Ah414
Ah421
Ah517
Ah526
Ah536
Ah630
0204 0202 0203 0102 0107 0303 0104 0406 0305 03030202 0202 0203 0104 0310 0303 0909 1216 0205 03030204 0303 0303 0105 0909 0303 0506 0614 0205 02030303 0204 0303 0405 0110 0303 0609 0516 0306 03030202 0203 0203 0202 0110 0303 0609 0305 0306 03030304 0203 0303 0205 0810 0303 0406 0608 0606 03030304 0303 0303 0305 0108 0303 0609 1216 0404 03030304 0103 0202 0205 1010 0303 0304 0616 0000 02030204 0303 0303 0204 0106 0303 0809 1616 0303 02030303 0303 0203 0304 0810 0303 0609 1216 0406 03040204 0103 0303 0202 0810 0303 0606 1116 0303 03030304 0202 0202 0204 1010 0303 0105 0516 0306 03030202 0204 0303 0205 1010 0303 0406 0814 0306 03030202 0203 0303 0405 0708 0303 0609 0306 0406 02030404 0303 0203 0202 0610 0303 0809 1015 0106 03030404 0203 0303 0104 0810 0303 0406 1016 0406 02030304 0303 0303 0405 0810 0303 0608 0516 0000 03030304 0304 0203 0104 0810 0303 0209 1516 0606 00000202 0203 0203 0202 0810 0303 0409 1216 0206 02030303 0203 0303 0404 0609 0303 0409 0808 0303 03030404 0203 0203 0102 0707 0303 0409 0816 0406 02020203 0303 0203 0407 0108 0303 0608 0000 0505 02020303 0202 0303 0203 0608 0303 0608 0312 0203 03030304 0203 0303 0407 0101 0303 0809 0511 0203 02030303 0103 0303 0407 0101 0303 0609 1516 0506 03030203 0102 0303 0202 1010 0303 0608 1114 0606 03040203 0102 0203 0202 1010 0303 0609 1016 0406 0203

APPE
NDIX
1 c
ontin
ued
< 3cn fN cn cn cn
3CN cn cn CN cn cn <n cn cn cn cn cno o o O o O o o O © © o o © O o © ©cn CN m cn cn cn CN cn cn CN cn m cn CN cn m cn cn CNO o o o o O O O © O o © © O © o © O O
cn cn cn cn cn cn cn cn cn cn cn cn cn cn cn cn cn cn cn cn cn cn cn cn© o © o o © © © © © © © © © © © © © © © © © © ©cn cn cn cn cn cn cn cn cn cn cn cn cn cn cn cn cn cn cn cn cn cn cn cno o o o o © © © © © © © © © © © © © © © © © © ©
cn cn cn cn cn cn cn© © © © © o ©cn CN fN cn cn cn cn© © © © © © ©
^ © 5 f N ,£ f n f n f n A A ' © © © A ^ A f n ^ f n ^ ' O c n s © A A ' ©o o o o o o o o o o o o o o o o o o o o o o o o o oO cn cn o o o S cn a m cn m cno o o o o o S sp cn A — © © © © 5 a cn O O cn cn cn cn a cno o o © o o 3 3
O VO
^ © © © © > © o e © o o o o o o o o _
i s s s s s l s s
a A v© so j 5 ©©2i 00
©Z 1i co 5 ©©
a>^ y0§ l £ (° S y6s09' °' O o e g e o M ' O M O ^ ^ S p 0 0 0 0 0 — 0 0 — 0 0 0
00© i
00© 3
©© 3 ©
©00© 3 ©
©00© 3 ©
©3 © 3 £ 3 cn
©SO©
cn© 3 00
© 3 3 r -©
S OO 00© o
cn cn cno o ocn cn cn o o o
s o © o o © © © © c n © ©O — © — ©© — © — — — — - O ' O ^ — r s r^oo 0 0 0 — 0 0 0 0 0 0o e © © © © © © — © — © o o — — o — — o o o o — — 30 o — — — — 5 — 5 — — O o o o o o o o o o o o —
o o o —s 2
A n r * A •A A fN 3 A r - fN r i A r - •<r CN A fN© © © © © © © © © © © © © © © O © o © © © ©fN fN 3 mb fN PN mb fN fN fN cn ^ m fN fN m m fN CN cn cn fN CN PN© © © © © © © © © © © © © © © © © © © © © ©
o o r- 0 — 0<§ o o
t-*oo o
cn cn cn cn cn cn cn cn3
cn cn cn cn cn cn cn cn CN cn cn cn cn CN cn cn cn© © © © © © © © o © © © © © © © © © © © © © © © ©cn CN fN cn cn CN cn cn
3CN mm cn cn fN fN fN CN fN cn cn cn m fN cn n cn
© © © © © © © © © © © © © © © © © © © © © © © © ©
r N c n r N c n f n c N ^ c n c n f N C N m f N ^ r c n c N e n c N f N f N f N — n f s n n no o o o o o o o o o o o o o o o o o o o o o o o o o or i ( N - n - - M - N - r i f n f N f n ( N - n r i r i - M - - - r i n -o o o o o o o o o o o o o o o o o o o o o o o o o o o
cn cn 3 n* m cn cn© © © © © ©cn cn A cn cn CN cn© © © © © O ©
3 3 3 3 3cn cn <n fN cno o o o o
n- n- fN cno o o oS n n n o o o3 3 t 5 t rr rf_ _ o o © o o o o ^cnf n*Tf nf ncnf Nf n o o o o o o o o o
T cno o3 3
O O O O O O O O O O O O O O O O O O O O O O O O O O OO O O O O O O O O O O O O O O O O O O O O O O O O O O
o o00 A cn A 00 00 A 3 cn A 00 00© © © © © © © © © © ©A cn CN cn 00 CN A © A A cn cn© © © © © © © © © © © ©
00 A 3 00 A 00 A A© © © © © © © ©00 m © A cn cn 00 CN cn© © © © © © © © ©
c i n c-i <n r*i r i <n r s n r i r i <n r s <n r»i r i m m n o o o o o o o o o o o o o o o o o o oP I N N N N N P I N N N n M N N P I N N N No o o o o o o o o o o o o o o o o o ~
CN © cn cn CN cn CN fN A© © © © © © © © ©CN © fN CN CN CN CN IN fN© © © © © © © © ©
CQ CQ CQ © CQ CQ CQ CQ CQ CQ CQ CQ CQ CQ CQ CQ CQ CQ CQa. Lb a . a . a. Lb a. a . a. a. a . Lb a. Lb Lb a. Lb Lb Lb
* 3* St s t sfc St * * St * St 5* =t Sfc s& St St £ 5*
CQ 22Li. ll.
CQLb
CQLb
CQLb
CQLb
CQLb
CQLb
St Sfc £ 5* * *
TT MB —— — _u U u u U u u U u U u u u u u u u U U CJ U o u u U u ufN m m~ m mm mm CN m ^ m MB mm fN CN cn n* ^m fN cn fN CN cn Az z Z Z Z z z z Z z z z z z Z Z z z Z z z z z z Z z z00 00 00 00 00 00 00 00 00 00 00 00 00 00 00 00 00 00 00 00 00 90 00 00 00 00 00© © © © © © © © © © © © © © © © © © © © © © © © © ©© © © m cn A sO £ so © © cn cn SO SO © r - r** r** 00 00 2 © mm mm __cn m cn © © © © © © © — —— — — — — — — — — r i r i CN CN Al— — — CN CN CN fN CN fN fN fN fN fN CN CN CN CN CN CN CN fN CN CN CN CN CN" *“ MB —
o —3 —5 —^ —3 —1 —5 —] —J —5 —5 —5 —1 —1 —5 —1 —5 —5 —5 —5 —5 - J —1 —1 —5 —5 —5 —5' * X X X X X X X X X X X X X X X X X X X X X X X X X X X
108
Reproduced with permission of the copyright owner. Further reproduction prohibited without permission.

APP
END
IX
I con
tinue
d
r -^ 5!
< N
s
m m m ^ m m m m m ? m m m m m m ? m m m m m m m m m mO O O O O O O O O O O O O O O O O O O O O O O O O O Or si m m m m m m m m c ‘i < N m f N ( N m c N f N m m m r N m f s m m m mO O O O O O O O O O O O O O O O O O O O O O O O O O O
0 9 0 0 o o o o? m m © o o o o
© irt w-j m o o o o m m o o
O O O O? m O ( N ? ( N m m o c N mo o o o o o o o o o o
O o v* m O ^ «r>© © o o o o o
3m vn m O O O O •/> m
o o
s O ' O O O s O O O O i n v C C ' O O O — O ^ O O ^ T — o o o o ^ o o o— — — © © — © — — © — — — — — — — — — — o — — © — — —o o ^ o o o a o o ^ o — — m n ? ‘n « n o o o o o m ' 0 0 0 0 — o— — o o o — o o — © — © o o — o o o — o o — — © — — o
© © r -© © © _so so © mo o o o o
S o© © o © oo © o o o o ©o o o o ? -© o o o ©
o e v o o o o c © o e o e © ©o o o o o o o o oo o 3 3 o 3 3 3 o
m m m m m m m m m m m m m m m m m m m m m m m m m m m O O O O O O O O O O O O O O O O O O O O O O O O O O O m m m m m m m m r s m f s m m m m m m m m m m m m — m m m O O O O O O O O O O O O O O O O O O O O O O O O O O O
o o m o o o ' c o o o r ^ o r ^ o o o o o o o o o o o r ^ o o o — — o o — o — — — o — o — — — — o — — o — o — o — — —© qe — — — — O P ^ — © — — o o — © — — © ? © oo r**— o o o o0 0 0 0 0 0 - 0 0 0 0 0 0 - 0 0 0 - 0 0 0 0
04 r-*o or i ? o o
m m o o m m o o
m cs © ori — o ©
w-i r-» ^ © © ©S <N fN
O ©
m m m O O O m m n O O O
r s n n o o o- M N O O O
o o f N m w t f N ? ? * / ^ ^ ™ ^ ?O O O O O O O O O O O O« N N - N N ? i n ^ M i f t nO O O O O O O O O O O O
m m m m ©© © © © ©m m f N m ©o o o o o
§ m m m m m mo o o o o o
© m m m m m mo o o o o o o
n ri - - - n m N n n ri nO O O O O O O O O O O O r i — — — mi — oi r i —O O O O O O O O O O O O
O O O O O O O O O O(S M M N N M ? M n — O O O O O O O O O O
m m m r N m n m r i m m O O O O O O O O O O m r N m — m f N — r s m m O O O O O O O O O O
M N N M M f'l N N n n O O O O O O O O O O M - - M M M N - - M O O O O O O O O O O
r ^ ^ m ? ? ? m ? m m ? m ? ? m m m r 4 m m m ? ? ? ^ m m O O O O O O O O O O O O O O O O O O O O O O O O O O O < N m r N m m m m m m f N m m m m m m m < N f N m m f N m m — mm O O O O O O O O O O O O O O O O O O O O O O O O O O O
p * * r ** r - ‘ r * * * r ^ r - r ^ r - r ^ r * * - r * * * r * - r , r * * r - r ^ r * - r ^ r * - t ^ ‘n t ^ r * * m r ^ r * - r -o o o o o o o o o o o o o o o o o o o o o o o o o o or " * r * * r - * t n ^ r - r * ‘ m r - r ^ r - * m r * * m m r - r ~ r ^ w ^ — m t - ' r - m m m r - ' O O O O O O O O O O O O O O O O O O O O O O O O O O O
m 9 0 0 9 0 i r i n n 9 0 90 m9em90^90<09000i A9090909090i Ai n90 O O O O O O O O O O O O O O O O O O O O O O O O O O O m » o © a o — m m m ^ m m n o o m v ^ m o o o o r i m m o e m o o ^ ^ i no o o o o o o o o o o o o o o o o o o o o o o o o o o
m m fN fN fN cn rN n cn rN m n n <n m ri fN fN fN fN cn m fN ri m fN mo o o o o o o o o o o o o o o o o o o o o o o o o o oN N N N M N N H n M n N N N N N N N (N M (N M N M m M PNO O O O O O O O O O O O O O O O O O O O O O O O O O O
C Q f l C S f l S C Q f l S S f l S C Q f f i f l f i f i CQ CQ CQ CQ■m U.
CQ CQ CQ ffi CQ U- i i . U. L&. Li.
£ £ £ £ £ £ £ £ £ £ £ £ £ £ £ £ £ £ £ £ £ £ £ £ £ £ £
u u u u u u u u u u u u u u u u u u u' O - M m - f N — — N m ^ ' O P * — M Mz z z z z z z z z z z z z z z z z z z 00 00 00 00 00 00 0 0 © © © © © © © © © © © ©— fN cn pn m m — so ooCNCNCNfNCNfNmo©CNCNfNfNfNfNCN — — — — — — — — — — — — — — — — — — — —— — — — — — — o o o o o o o o o o o o o o o o o o o o
O n M (N <N CN cn C*1 C*l * T
u u u u u u un n — n cn - nz z z z z
r*> c** oo oo oo
z zO' O' O' O' O' O'
z z z x z x z z z x x x z z x z x x x x x x z x x z z
109
Reproduced with permission of the copyright owner. Further reproduction prohibited without permission.

APPE
NDIX
I c
ontin
ued
cn cn cn cn cn cn cn cn cn cn m cn cn cn cn 3 CNo o o o o o © © © © © © © © © ©cn cn m cn CN CN n fN cn CN cn cn cn CN CN cn CNo o © © © © © © © © © © © © © © ©
j : ve S N < IT)
cn cn cn cn cn wi cn cn cn cn cn cn cn cn cn cn cn cn© © © © © © © © © © © © © © © © © ©CN cn cn cn cn cn cn cn cn cn cn cn cn cn cn cn cn cn© © © © © © © © © © © © © © © © © ©
£ f"< 5
£ g< s
m m ^ cn cn o o © o oo o o o ®
O O O O O O O O O O O O O O O O O Q O O O On m r s n n >o ® O O © © © O
so — vo © 'O >c
r n c N c n f N c n c n m c n ©o o o o o o o o o r n m rn O O O
o — — © 00 CN v© wi r - ©00© i
—© 00
©CN ©
00_ _ © © — O O W 1 © © © W 1 0 O O O O O © © 0 O 0 C 0 O © © 0 e C N © © — — © © © — — © © © © © — © © © © — © — — ©
© © p - f * - © © © © © © ' © ^ © © o o o o © o o © © ^ ©o o o o o o o o o o o o o o o o o o o o o of n c n © © 5 5 ^ , ^ r ^ o o © ^ ^ © © ^ 5 ^ — — ^ ^o o o o o o o o o o o o o o o o o o o o o o
m ^ cno o om cn cno o o
© © © © ©— — o o —© 3 © © ©
O ' O O O O O O O O O O O O ' O ' O O ' O C o — — — — — — — — — — — O O — o o— — o o o — <o — — ao — — a o o o a o o — —0 0 0 0 0 0 0 0 0 0 0 0 0 0 — 0 0
<N r- i/I Tf WI CN CN wi WI CN WI pn cp n fN© © © © G © © © © © © © © © © © © © © <5 © ©mm 3
mm CN CN CN rr mm cn CN 3 CN WI fN CN C5 cn fN© © O © © © © © © © © © © © © © © C5 © ©
cn cn cn cn cn cn cn cn cn cn cn cn cn PN cn cn cn cn cn cn cn m© © © © © © © © © © © © © © © © © © © © © ©cn cn CN cn cn cn cn CN cn fN cn cn cn fN cn cn cn CN cn cn cn© © © © © © © © © © © © © © © © © © © © © ©
CN cn CN cn fN3
cn cn CN cn cn CN cn cn cn3
cn fN CN© © © © © © © © © © © © © © © © © © © ©mm mm cn CN fN fN CN CN CN cn mm CN cn fN cn cn fN© © © © © © © © © © © © © © © © © © © © © ©
cn ^r cn cn3 3
CN r r cn cn cn cn cn cn3
cn© © © © © © © © © © © © © © ©cn cn cn cn fN r r •mm fN cn CN cn CN fN3
cn cn cn cn© © © © © © © © © O © © © © © © ©
TT ' T -To o o o ^ m m o o o o
r - r - c** r - r** r** r** r** r*** r*« WI r - r - r - r -© © © © © © © o © © © © © © © © © © © © © ©r - cn cn r** r*» cn cn cn r - cn cn r** r* r** cn c - cn r** r -© © © © © © © © © © © © © © © © © © © © © ©
00 00 wi 00 wi WI 00 00 00 00 cn cn WI WI 00 wi 003
© 00 00© © © © © © © © © © © © © © © © © © © ©cn cn cn wi 00 cn cn r** WI cn 00 cn cn WI cn cn WI WI fN 00 wi cn© © © © © © © © © © © © © © © © © © © © © ©
cn cn fN CN cn fN cn WI fN fN cn CN cn PN CN CN cn cn CN cn CN CN© © © © © © © © © © © © © © © © © © © © © ©fN fN <N <N PN PN fN fN fN CN fN CN PN CN CN cn CN PN PN fN CN© © © © © © © © © © © © © © © © © © © © © ©
CQ CQ CQ CQ CQ CQ © © © © © © © © © © © © ©L^ Li. Li. Ci. Li. Li. Li. Li. Li. Li. Li. Li. Li. Li. Li. Urn Li. Li. Li.
* St St sfc * * * =s £ Sfc 5* * * * £ * * S*
u *o o
u u 5 u 5 u u u u u u U u u U u U u yCNy Ucn r r mm CN n cn Tf mm mm n •mm fN ^m CN cn WI CN
Z Z z z z Z Z Z z z Z z z z z Z z z z i z z©©©
©©©
©©©
©©©
©©©
©©r**
©©
©©p-*
©©©
$ ©©CN
©©CN
©©cn
©©cn
©©cn
©©©
©©©
©©r**
©©©
©©©
©©©— — CN CN CN CN CN CN CN r-i © © © © © © © © CN cn cn
mm mm mm mm CN CN CN PN CN PN CN CN fN CN CN© © © © © © © © © © © © © © © © © © ©
z x x x x x x x x x x x x x x x x x z z x x
110
Reproduced with permission of the copyright owner. Further reproduction prohibited without permission.
HLM
01 02
97 NI
C I
W-OK
02
02
OOOO
07
07
0303
01
03
0203
02
05
0110
OO
OO
OOOO
OO
OO
0303
03
03HL
M 01
02 97
N2CI
W-
OK
0202
03
05
0707
03
04
0202
02
03
0202
01
01
0304
06
06
0816
01
03
0303
HLM
01 02
97 N3
CI
W-OK
02
02
0303
07
07
0304
01
03
0303
04
04
0612
03
04
0609
05
05
0606
03
03HL
M 01
02 97
N4CI
W-
OK
0203
03
08
0707
03
04
0202
03
03
0202
08
10
0303
04
06
1616
0101
03
03HL
M 01
02 97
N5CI
W-
OK
0202
03
03
0303
00
00
0203
03
03
0205
06
12
0303
06
06
0816
06
06
0203
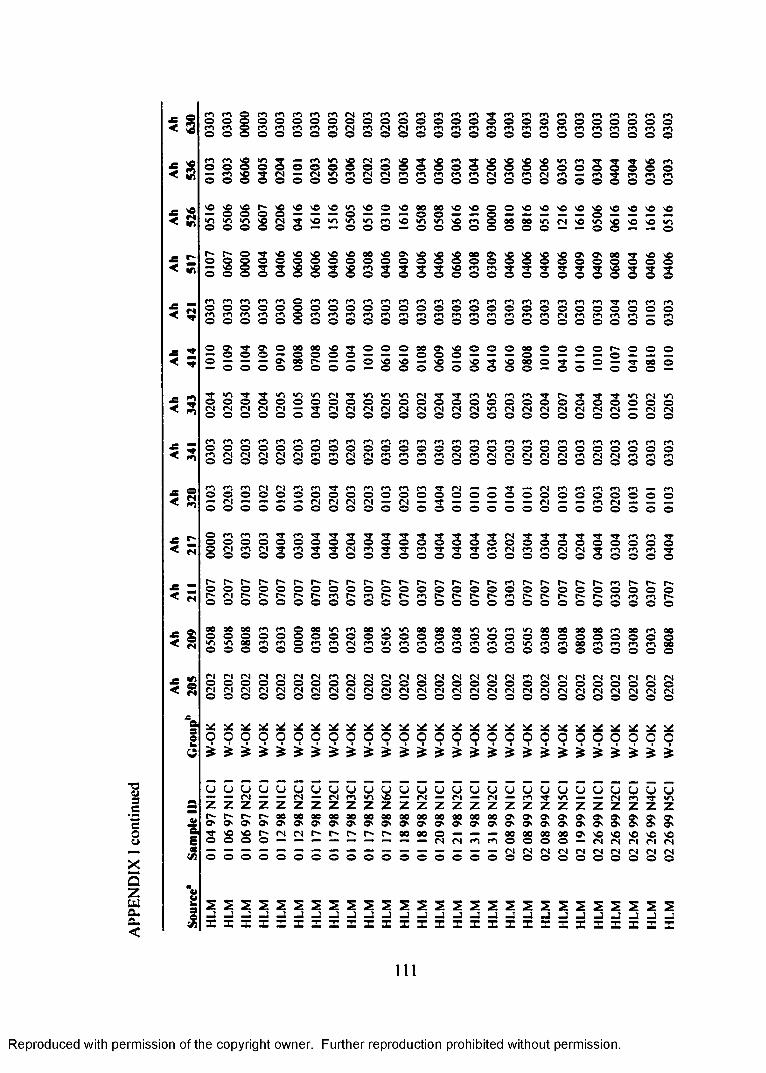
APPE
NDIX
I c
ontin
ued
cn m cn m m O rn m m rn m m rn rn rn rn rn rn m m m cn rn tp mO O O O O O 0 O O 0 O O 0 0 0 0 0 0 O O O O 0 O Orn rn rn rn m O m rn m rn m m m m m m m m rn m CN m m m mO O 0 0 O O O 0 O 0 O O O O O O O O 0 O O O O O O
£ S< rn
< s
5 S^ fN
1C
m rn cp m m m m m CN rn m rn rn m m m3
m m m m m m m mO 0 c O O 0 O 0 0 0 0 0 O O O O O O O 0 O O Om m c5 m m cn m rn CN rn PS PN m m rn rn rn rn m rn rn m m m rnO 0 £5 O 0 O O 0 0 0 0 0 O O 0 0 0 0 O 0 0 O 0 O 0
m cn o ocn cno o
O O O O O O O O O O O O O O O O O O O O O O O O O O O— w ^ 5 n - P S A r n P S P s m c n m m m c s c n c n c i m — m ^ m m cn O O O O O O O O O O O O O O O O O O O O O O O O O O O
NO ^ NO C- — O O O n© NO £ NO a NO O NO 00 00 NO NO <S 0 NO £ NO NO
05
06 NO 2 NO0
PS0 3
S3 AO•AO
•AO
mO £
0AO
0AO O
m C O C
5 oo 5 0
000
AO
CN s o3
O ao
p*- r - ©o o o
5 0 00 0 0 O O O O O O O nO nO nOOOOnO nO ' O nO O O O O ^
_ _ _ _ _ - O O O O O O O O O O O O O O O O O O O ^ ^
5 © § 3 3 o 3 3 ® 3 3 3 3 3 © 3 3 3 3 3 3 3 3 3 3 3 3NOo
© O ^ O O O O O O n©— 0 0 0 — 0 0 0 _O — — — © oo c* — — o — 0 0 0 0 0 0 0 0 —
o o — rn o o
^ o o o o o o s o o o o o o o o o o r ^ o o o o — — — 0 0 0 — — — o — — — — o — — —s O s O — VO — O ^ r v O O O O0 0 0 0 0 0 0 0 0 — t - O - ^ 00 o 0 0 — 0 0 0 —Tp A tp 2 A A A Cl A A A Cl TP m A A rn p C-O O 0 0 O O O O 0 O O O 0 0 O O O O 0 0 OCN PS Cl Cl Cl M3 Cl Cl PS Cl PS PS PS Cl PS A PS PS PS PSO 0 O O 0 O O 0 0 O O O 0 0 0 0 O O 0 0 0
rn rn rn rn A rn rn rn A rn rn rn m rn rn rn A rn A m m0 O 0 O O O 0 O O 0 0 0 O 0 0 0 O 0 0 O Om Cl Cl Cl Cl Cl m m Cl Cl m m m m Cl m PS Cl Cl Cl ClO O O O O O O O O 0 O O O O 0 O O 0 0 O O
A rn m Cl Cl rn m tp rn A rn m m TP Cl _ _ Tp PS mO 0 © 0 0 0 O O 0 O 0 O O O 0 O O 0 0 0 OMWCl MWmm» WMMWCl Cl Cl C| mmmCl w Tp MMW ClO O O O O 0 0 0 0 0 O 0 0 O O O O 0 0 0 O
O m rn rn m Tp 3 p 'T TP TP CN Tp TpO O 0 0 O O 0 O 0 0 0 0 O O O O O 0 0 0 OO Cl rn Cl Tp m Cl m rn rn Cl m m CNO O 0 O O O 0 O 0 O 0 0 0 O O O 0 0 O O Or** r* r- r*** c* c* C* c* p** c* p- c- c- p- rn r* p- C*O O O O 0 O 0 O 0 0 0 0 0 0 O 0 0 0 O O Or Cl c* c* c* c* rn P A p p- m c** p p m r*** r-* P**O O 0 O 0 0 0 0 0 O 0 0 O 0 0 0 0 O O O O
00 00 00 m A 0 00 A A 00 A A 00 00 00 A A rn A 00 000 O 0 O O 0 0 O 0 0 O O 0 0 0 O 0 0 O 0 0A A 00 m A 0 m m Cl rn A m m m m m m m A rn mO O 0 O O 0 0 O O 0 O O O O O O O O O 0 O
Cl Cl CN CNCl PS CN m PS PS Cl Cl CN PS Cl Cl Cl PS m CN ClO O O O O 0 O O 0 0 O O O 0 0 O O 0 O 0 OCl Cl Cl Cl PS CN CN PS Cl PS CN PS PS PS Cl Cl PS CN PS Cl PS0 0 0 0 0 O O 0 0 0 O 0 O 0 0 0 0 O O 0 0
U * * * U u 2 U U X U * * 2 u UO 0 0 0 0 O 0 O 0 0 O O O 0 0 O 0 O O 0 O=t St St =t =t * 3* £ Z =£ St Z £ St St St_ _ _ _ _O U U U U u U U U U U U U U U U U u u U UWPN ■MMWCN w Cl A A NO PN Cl PS m Az z z z z z z Z z z Z z z Z Z z Z z Z Z zr** c* c* 00 00 00 00 00 00 00 00 00 00 00 00 00 On ON On 0© On On ON O' ON On On On On ON ON ON On On On ON ON O On ONTp >C NO c* PS Cl C* C- r** r - 00 00 O mmm 00 00 00 00O O O 0 — — — — — — — — PS PS m m 0 0 O 0_ mm* M MWMWMWmmm W amm_ WMCl PS Cl CNO O O 0 O O O O 0 0 0 0 O 0 0 0 O 0 0 0 O
S 2 5 2 2 2 2 2 2_2 -3 -3 -3 -j mj -3 -3 - J - J -3 -3 -3 -3 -3 - 3 -3 mJ -jX X X X X X X X X X X X X X X X X n* X
3 3 t « PIo o o o
0 0 0 0 0 0
0 0 0 0 0 0m r*i ps fn m m0 0 0 0 0 0
o o o o— cno o
0 0 0 0 0 0
^ tp m m tp0 0 0 0 0S n n n t
o o o o
r-* p-* m p-* r-* r**0 0 0 0 0 0 c* c- m m m r-*0 0 0 0 0 0
oe 00 m oe m 00 0 0 0 0 0 0 00 m m m m 00 O O O O O O
O O O O O O c i C l CN PN c i CN O O O O O O
^ ^ ^ ^ 20 0 0 0 0 01 1 1 1 1 1
u u u u u u— - M n t IA2 Z Z Z Z Z
O O1 ^O nO nQ so nC nQ— cn cn n n nCN PN C l CN CN <NO O O O O O
- 3 - 3 _3 J _J _3 I X X X X X
111
Reproduced with permission of the copyright owner. Further reproduction prohibited without permission.

Reproduced
with perm
ission of the
copyright ow
ner. Further
reproduction prohibited
without
permission.
APPENDIX I continued
Ah Ah Ah Ah Ah Ah Ah Ah Ah Ah Ah Ah AhSource* Sample ID Group* 20S 209 211 217 320 341 343 414 421 517 526 536 630HLM 03 I0 99N4CI W-OK 0202 0508 0707 0404 0101 0303 0205 0109 0303 0404 1616 0306 0303HLM 03 I0 99N5CI W-OK 0202 0308 0507 0304 0103 0303 0202 0609 0303 0407 1116 0303 0203
8 UWBM = University of Washington, Burke Museum, BMNH = Bell Museum of Natural History, HLM = Heather L.McGuire
b B = great blue heron, W = great white heron, PNW = Pacific Northwest, N = north-central United states, FP = Florida peninsula, FB = Florida Bay, OK = outer Keys

APPENDIX J: Allele frequencies at 12 microsatellite loci for six A herodias groups
The following tables contain allele frequencies at 12 microsatellite loci for six A. herodias groups (number of individuals genotyped in parentheses). Abbreviations: B = Great Blue Heron, W = Great White Heron, PNW = Pacific Northwest, N = north- central United states, FP = Florida peninsula, FB = Florida Bay, OK = outer Keys.
Allele frequencies at locus Ah 205(10) (30) (19) (35) (76) (37)
Allele B-PNW B-N B-FP B-FB W-FB W-OK01 0.07902 0.300 0.383 0.474 0.814 0.789 0.94603 0.700 0.600 0.447 0.186 0.197 0.05404 0.017 0.00705 0.007
Allele frequencies at locus Ah 209
Allele(10)
B-PNW(28)B-N
(20)B-FP
(34)B-FB
(71)W-FB
(35)W-OK
01 0.015 0.00702 0.015 0.049 0.01403 0.100 0.050 0.265 0.310 0.45704 0.089 0.100 0.044 0.02105 0.200 0.054 0.150 0.265 0.282 0.18606 0.300 0.268 0.025 0.02907 0.100 0.018 0.050 0.000 0.00708 0.150 0.554 0.475 0.368 0.324 0.32909 0.02510 0.150 0.018 0.125 0.014
Allele frequencies at locus Ah 217
Allele(11)
B-PNW(30)B-N
(18)B-FP
(35)B-FB
(77)W-FB
(35)W-OK
01 0.050 0.028 0.01302 0.100 0.222 0.329 0.156 0.10003 0.773 0.450 0.278 0.314 0.545 0.34304 0.277 0.400 0.472 0.357 0.286 0.557
113
Reproduced with permission of the copyright owner. Further reproduction prohibited without permission.

APPENDIX J continued
Allele frequencies at locus Ah 320
Allele(11)
B-PNW(30)B-N
(21)B-FP
(35)B-FB
(77)W-FB
(37)W-OK
01 0.095 0.171 0.247 0.36502 0.773 0.550 0.571 0.400 0.513 0.27003 0.182 0.400 0.333 0.386 0.208 0.31104 0.045 0.033 0.043 0.032 0.05405 0.017
Allele frequencies at locus Ah 341(11) (30) (22) (35) (74) (37)
Allele B-PNW B-N B-FP B-FB W-FB W-OK01 0.067 0.020 0.01402 0.773 0.417 0.364 0.300 0.209 0.23003 0.227 0.517 0.636 0.700 0.770 0.757
Allele frequencies at locus Ah 343
Allele(11)
B-PNW(30)B-N
(22)B-FP
(35)B-FB
(77)W-FB
(36)W-OK
01 0.283 0.205 0.100 0.071 0.02802 0.136 0.100 0.273 0.386 0.377 0.54203 0.133 0.227 0.100 0.058 0.04204 0.545 0.200 0.091 0.243 0.221 0.18105 0.091 0.117 0.159 0.157 0.149 0.19406 0.017 0.00607 0.227 0.133 0.045 0.014 0.110 0.01408 0.00609 0.017
Reproduced with permission of the copyright owner. Further reproduction prohibited without permission.

APPENDIX J continued
AUele frequencies at locus Ah 414
Allele(H )
B-PNW(27)B-N
(22)B-FP
(35)B-FB
(77)W-FB
(37)W-OK
01 0.023 0.171 0.247 0.20302 0.023 0.014 0.01303 0.056 0.023 0.014 0.00604 0.091 0.019 0.068 0.032 0.06805 0.01906 0.182 0.222 0.091 0.086 0.071 0.13507 0.091 0.167 0.409 0.057 0.065 0.02708 0.409 0.278 0.091 0.214 0.078 0.12209 0.074 0.091 0.071 0.123 0.09510 0.227 0.148 0.182 0.371 0.364 0.32411 0.01912 0.027
Allele frequencies at locus Ah 421(10) (10) (20) (35) (77) (35)
Allele B-PNW B-N B-FP B-FB W-FB W-OK01 0.025 0.006 0.01402 0.014 0.019 0.01403 0.700 1.000 0.825 0.986 0.968 0.91404 0.300 0.075 0.05705 0.075 0.006
Allele frequencies at locus Ah 517
Allele(11)
B-PNW(30)B-N
(17)B-FP
(34)B-FB
(74)W-FB
(35)W-OK
01 0.017 0.044 0.034 0.02902 0.017 0.029 0.01503 0.091 0.083 0.029 0.029 0.047 0.04304 0.227 0.300 0.235 0.118 0.169 0.35705 0.091 0.017 0.059 0.04406 0.091 0.217 0.265 0.338 0.365 0.40007 0.091 0.067 0.029 0.041 0.04308 0.200 0.118 0.103 0.142 0.04309 0.409 0.083 0.235 0.309 0.203 0.086
115
Reproduced with permission of the copyright owner. Further reproduction prohibited without permission.

APPENDIX J continued
Allele frequencies at locus Ah 526
AUele(9)
B-PNW(29)B-N
(17)B-FP
(31)B-FB
(70)W-FB
(35)W-OK
01 0.034 0.00702 0.017 0.007 0.01403 0.059 0.081 0.014 0.02904 0.059 0.032 0.014 0.01405 0.056 0.069 0.059 0.065 0.043 0.18606 0.222 0.034 0.088 0.081 0.086 0.11407 0.056 0.069 0.065 0.01408 0.167 0.069 0.206 0.097 0.171 0.10009 0.052 0.059 0.03610 0.138 0.118 0.065 0.086 0.02911 0.034 0.032 0.086 0.01412 0.056 0.103 0.118 0.081 0.007 0.02913 0.029 0.00714 0.111 0.069 0.032 0.05715 0.167 0.052 0.088 0.048 0.064 0.01416 0.167 0.241 0.118 0.323 0.314 0.42917 0.017 0.014
Allele frequencies at locus Ah 536
Allele(11)
B-PNW(30)B-N
(15)B-FP
(32)B-FB
(74)W-FB
(37)W-OK
01 0.067 0.016 0.007 0.09502 0.063 0.068 0.09503 0.409 0.367 0.133 0.328 0.358 0.39204 0.136 0.083 0.267 0.125 0.108 0.10805 0.091 0.417 0.200 0.188 0.135 0.06806 0.364 0.133 0.333 0.281 0.324 0.243
Allele frequencies at locus Ah 630
Allele(11)
B-PNW(30)B-N
(19)B-FP
(34)B-FB
(77)W-FB
(36)W-OK
01 0.02602 0.136 0.183 0.158 0.235 0.214 0.08303 0.864 0.700 0.632 0.721 0.747 0.88904 0.117 0.184 0.044 0.039 0.028
116
Reproduced with permission of the copyright owner. Further reproduction prohibited without permission.

VITA
Heather L. McGuire was bom in Randolph, Vermont, IS April 1961. She graduated
from Queensbury High School, Queensbury, New York, in 1979 and earned a
Bachelor of Arts in Biology from the University o f Rochester, Rochester, New York,
in 1983. Heather was employed as a research technician in the Department of
Surgery, Strong Memorial Hospital, University of Rochester School of Medicine and
Dentistry, Rochester, New York, until 1987. She entered the graduate program of the
College of William and Mary, Virginia Institute of Marine Science (VIMS),
Gloucester Point, Virginia, in the fall of 1987. She was employed as a graduate
research assistant for the Department of Ocean and Coastal Law, VIMS (1987-1990),
served as a graduate intern with the King William County Planning Department, King
William, Virginia (1989), and earned a Master of Arts in Marine Science from VIMS
in 1990. Heather was employed as a marine scientist, Department of Biological
Sciences, VIMS (1990), a field assistant for the United States Department of the
Interior, Bureau of Land Management, Northern Field Office, Fairbanks, Alaska
(1991), an instructor for the Department of Natural Resources, Planing, and
Interpretation, Humboldt State University, Areata, California (1992), and a biologist
for the United States Department of the Interior, National Park Service, Redwood
National Park, Orick, California (1993-1994). In 1995, Heather entered the Ph.D.
program in Wildlife and Fisheries Science, School of Forestry, Wildlife, and Fisheries,
Louisiana State University and Agricultural and Mechanical College, Baton Rouge,
Louisiana.
117
Reproduced with permission of the copyright owner. Further reproduction prohibited without permission.
DOCTORAL EXAMINATION AND DISSERTATION REPORT
C a n d id a te : Heather L. McGuire
M a jo r P ia ld : Wildlife & Fisheries Science
T i t l e o f D is s e r t a t io n : Evaluating the Taxonomic Status of the Great White Heron ( Ardea herodias occidentalis ) Using Morphological, Behavioral and Genetic Evidence.
i jo r P r o fe s s o r an d C h a irm a n
G ra d u a te S c h o o lD ean o f'
EXAMINING COMMITTEE:
t S J -----
D a te o f K r a n in a t io n :
2M O c+cber 2ooi
Reproduced with permission of the copyright owner. Further reproduction prohibited without permission.