evaluating the adaptation of hov lanes to hot lanes ... · or institutional) and an overall score...
TRANSCRIPT

– 1 –
High-occupancy/toll (HOT) lanes offer drivers the option of traveling on a high-occupancy vehicle (HOV) lane for a toll when they would normally not meet the occupancy requirements of the lane. These characteristics have led to the growing perception that HOT lanes offer both substantial revenue opportunities and a solution to a common concern about underused HOV lanes.
The complexities and costs associated with adapting HOV lanes to HOT lanes necessitate detailed evaluations of such projects. Further, the importance/relevance of the numerous factors that must be considered varies from one project to the next. Though a detailed analysis of the factors is essential prior to dedicating financial resources, there is a need for a sketch-planning tool that can evaluate the multiple factors (quantitative and qualitative) involved in implementing an adaptation project.
This research project evolved from more than two decades of experience with HOV lanes in Texas, during which time the Texas Transportation Institute (TTI) teamed with the Texas Department of Transportation (TxDOT) and the transit authorities in Houston and Dallas to perform ongoing, comprehensive evaluations of existing and proposed HOV
lanes and HOT lanes. The project captured the benefits of this extensive experience in a manner that is applicable not only in Texas but nationwide.
What We Did…The research team initially
developed a list of the most likely goals behind the adaptation of an HOV lane to a HOT lane. These goals included:
• increase corridor mobility,• increase corridor safety,• generate revenue,• make environmental
improvements, and• provide travel options.
Researchers developed a list of the primary measures of effectiveness of these goals and issues/elements that would affect the attainment of each goal. They then grouped these factors into three main categories as shown in Table 1.
In addition to these factors, it was necessary to develop an analytical tool to allow public agencies to evaluate the tradeoffs among the project objectives. Since it is unlikely that any potential HOV lane project represents an ideal combination of all features, demands, and characteristics to assure success as a HOT lane, this tool allows the analyst to assess the relative significance of tradeoffs among facility, performance,
Project Summary Report 0-4898-S URL: http://tti.tamu.edu/documents/0-4898-S.pdf
Project 0-4898: Criteria for Adapting HOV Lanes to HOT Lanes
Authors: William R. Stockton, P.E., William L. Eisele, Ph.D., P.E., and Hannah T. Wilner, E.I.T.
Evaluating the Adaptation of HOV Lanes to HOT Lanes: Summary of Development and Application of HOT START Software Tool
Project Summary Report 0-4898-S April 2006
Table 1. Categories and Factors Considered in Adaptation of an HOV Lane to a HOT Lane.
Facility Performance InstitutionalData and analysis by technical staff
Data and analysis by technical staff
Data by technical staff,analysis by district engineer
Cross section HOV lane utilization Public acceptanceLane separation Travel time Environmental justiceFacility access: origin-destination patterns
Benefits Revenue use
Enforcement Willingness to pay tolls Interagency cooperationTraffic control Safety Media awarenessPricing strategy Environment Public education/
informationIncident managementMaintenance
– 2 –Project Summary Report 0-4898-S
and institutional objectives and considerations in reaching the most appropriate recommendations.
What We Found…The tool developed is a computer
program called the High-Occupancy/Toll STrategic Analysis Rating Tool (HOT START), and it is designed to be easily tailored to local needs. The software is a Microsoft Windows®–based program that is built on the Visual Basic.NET® platform (Microsoft Corporation, Redmond, Washington). HOT START guides the analyst through the process of evaluating an HOV facility for possible adaptation to a HOT facility.
The underlying principle of HOT START is to prioritize the important factors by assigning them weights relative to one another. Then, through a series of questions, the analyst scores each factor. HOT START accounts for interactions and produces individual scores for each category of considerations (facility, performance, or institutional) and an overall score so that alternatives within the same weighting profile can be compared.
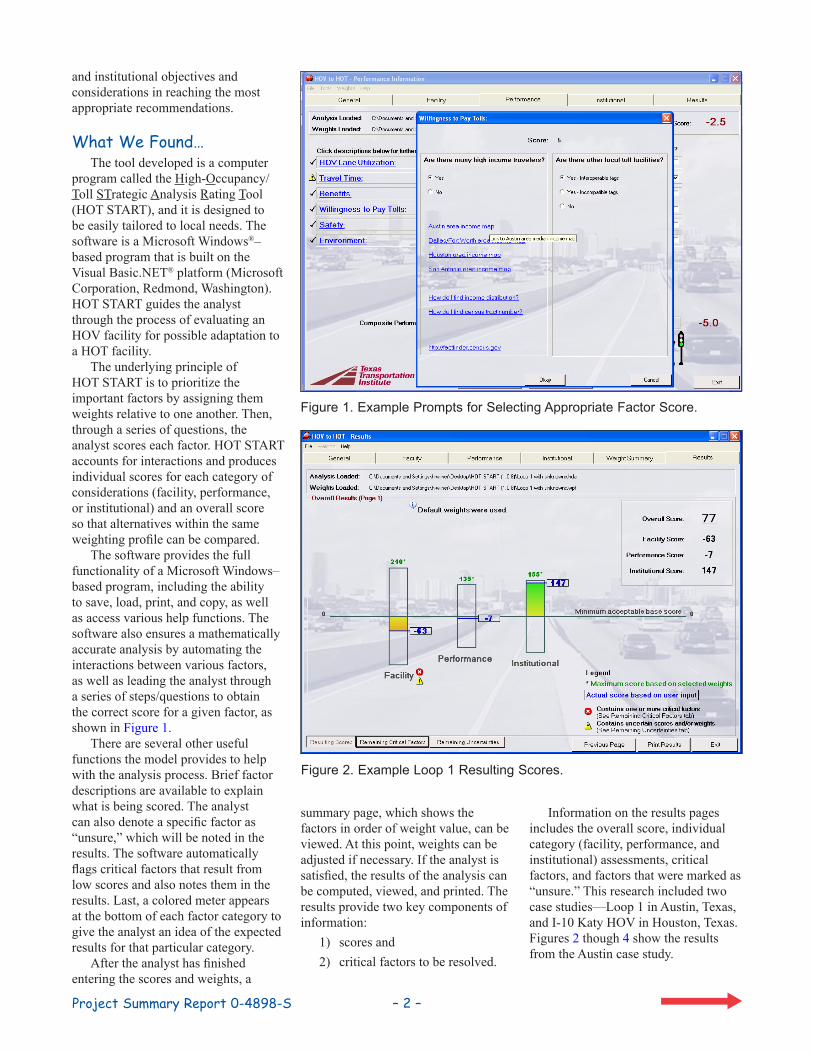
The software provides the full functionality of a Microsoft Windows–based program, including the ability to save, load, print, and copy, as well as access various help functions. The software also ensures a mathematically accurate analysis by automating the interactions between various factors, as well as leading the analyst through a series of steps/questions to obtain the correct score for a given factor, as shown in Figure 1.
There are several other useful functions the model provides to help with the analysis process. Brief factor descriptions are available to explain what is being scored. The analyst can also denote a specific factor as “unsure,” which will be noted in the results. The software automatically flags critical factors that result from low scores and also notes them in the results. Last, a colored meter appears at the bottom of each factor category to give the analyst an idea of the expected results for that particular category.
After the analyst has finished entering the scores and weights, a
summary page, which shows the factors in order of weight value, can be viewed. At this point, weights can be adjusted if necessary. If the analyst is satisfied, the results of the analysis can be computed, viewed, and printed. The results provide two key components of information:
1) scores and 2) critical factors to be resolved.
Information on the results pages includes the overall score, individual category (facility, performance, and institutional) assessments, critical factors, and factors that were marked as “unsure.” This research included two case studies—Loop 1 in Austin, Texas, and I-10 Katy HOV in Houston, Texas. Figures 2 though 4 show the results from the Austin case study.
Figure 1. Example Prompts for Selecting Appropriate Factor Score.
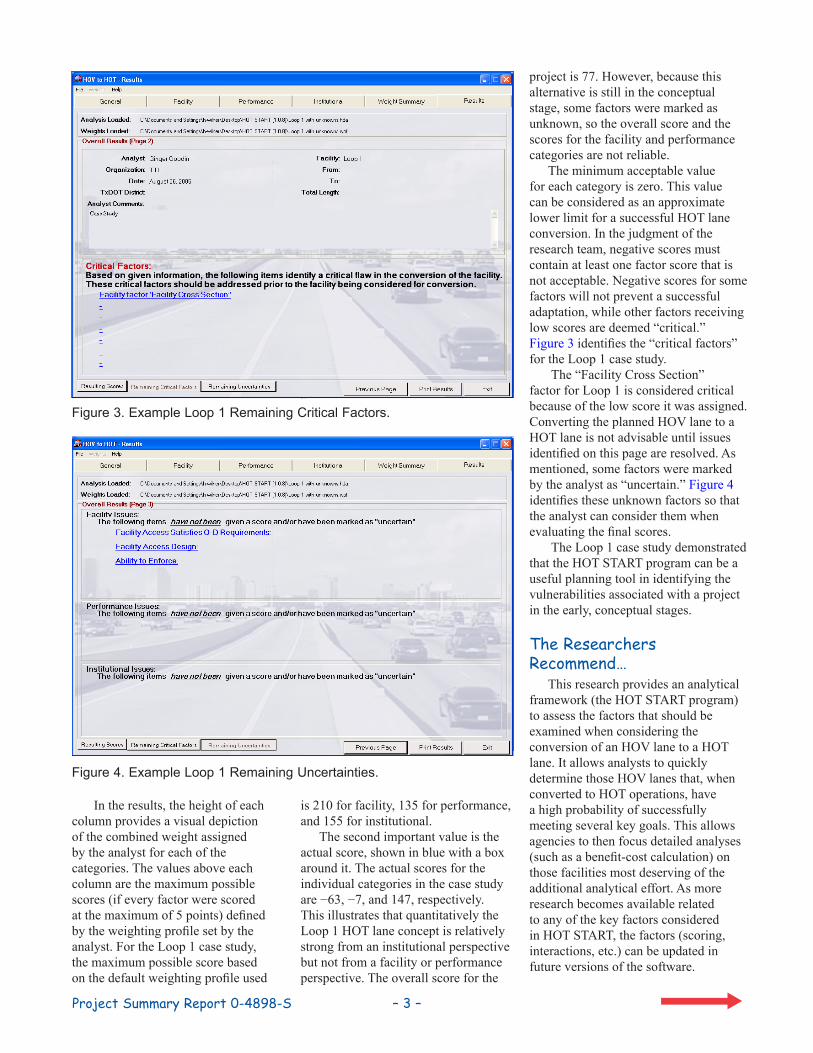
Figure 2. Example Loop 1 Resulting Scores.
– 3 –Project Summary Report 0-4898-S
In the results, the height of each column provides a visual depiction of the combined weight assigned by the analyst for each of the categories. The values above each column are the maximum possible scores (if every factor were scored at the maximum of 5 points) defined by the weighting profile set by the analyst. For the Loop 1 case study, the maximum possible score based on the default weighting profile used
is 210 for facility, 135 for performance, and 155 for institutional.
The second important value is the actual score, shown in blue with a box around it. The actual scores for the individual categories in the case study are −63, −7, and 147, respectively. This illustrates that quantitatively the Loop 1 HOT lane concept is relatively strong from an institutional perspective but not from a facility or performance perspective. The overall score for the
project is 77. However, because this alternative is still in the conceptual stage, some factors were marked as unknown, so the overall score and the scores for the facility and performance categories are not reliable.
The minimum acceptable value for each category is zero. This value can be considered as an approximate lower limit for a successful HOT lane conversion. In the judgment of the research team, negative scores must contain at least one factor score that is not acceptable. Negative scores for some factors will not prevent a successful adaptation, while other factors receiving low scores are deemed “critical.” Figure 3 identifies the “critical factors” for the Loop 1 case study.
The “Facility Cross Section” factor for Loop 1 is considered critical because of the low score it was assigned. Converting the planned HOV lane to a HOT lane is not advisable until issues identified on this page are resolved. As mentioned, some factors were marked by the analyst as “uncertain.” Figure 4 identifies these unknown factors so that the analyst can consider them when evaluating the final scores.
The Loop 1 case study demonstrated that the HOT START program can be a useful planning tool in identifying the vulnerabilities associated with a project in the early, conceptual stages.
The Researchers Recommend…
This research provides an analytical framework (the HOT START program) to assess the factors that should be examined when considering the conversion of an HOV lane to a HOT lane. It allows analysts to quickly determine those HOV lanes that, when converted to HOT operations, have a high probability of successfully meeting several key goals. This allows agencies to then focus detailed analyses (such as a benefit-cost calculation) on those facilities most deserving of the additional analytical effort. As more research becomes available related to any of the key factors considered in HOT START, the factors (scoring, interactions, etc.) can be updated in future versions of the software.
Figure 3. Example Loop 1 Remaining Critical Factors.
Figure 4. Example Loop 1 Remaining Uncertainties.

PS
R 0
-489
8-SThe contents of this report reflect the views of the authors, who are responsible for the facts and the accuracy of the
data presented herein. The contents do not necessarily reflect the official views or policies of the Texas Department of Transportation (TxDOT) or the Federal Highway Administration (FHWA). This report does not constitute a standard, specification, or regulation. The engineer in charge of this project was William R. Stockton, P.E. (Texas #41188).
Texas Transportation Institute/TTI CommunicationsThe Texas A&M University System3135 TAMUCollege Station, TX 77843-3135
The research is documented in: Report 0-4898-1, Evaluating Criteria for Adapting HOV Lanes to HOT Lanes: Development and Application of HOT START Software Tool Report 0-4898-P1, Guidebook for HOV to HOT Lane Adaptation: HOT START Software User’s Guide
Research Supervisor: William R. Stockton, P.E., TTI, [email protected], (979) 845-9947Researchers: William L. Eisele, Ph.D., P.E., TTI, [email protected], (979) 845-8550
Mark W. Burris, Ph.D., P.E., TTI, [email protected], (979) 845-9875 Michael J. Bolin, P.E., TTI, [email protected], (979) 845-9875 Hannah T. Wilner, E.I.T., TTI, [email protected], (979) 845-2644 Ginger D. Goodin, P.E., TTI, [email protected], (512) 467-0946 Tina Collier, TTI, [email protected], (512) 467-0946
TxDOT Project Director: David Rodgers, TxDOT, [email protected], (713) 802-5413TxDOT Research Engineer: Wade Odell, P.E., Research and Technology Implementation Office, [email protected], (512) 465-7403To obtain copies of reports, contact Nancy Pippin, Texas Transportation Institute, TTI Communications, at (979) 458-0481 or [email protected]. See our online catalog at http://tti.tamu.edu.
YOUR INVOLVEMENT IS WELCOME!
For More Details...
Disclaimer
1. http://www.valuepricing.org.2. W.R. Stockton, R.J. Benz, L.R. Rilett, D.A. Skowronek, S.R. Vadali, and V.F. Daniels. Investigating the General
Feasibility of High-Occupancy/Toll Lanes in Texas, Report 4915-1, Texas Transportation Institute, College Station, Texas, 2000.
3. T. Collier and G. Goodin. Managed Lanes: A Cross-Cutting Study, FHWA-HOP-05-037, Federal Highway Administration, Washington, D.C., 2004.
4. B. Perez and G. Sciara. A Guide for HOT Lane Development, FHWA-OP-03-009, Federal Highway Administration, Washington, D.C., 2003.
Related Research