lao hov lanes in california: are they achieving their goals?
TRANSCRIPT
Elizabeth G. HillLegislative Analyst
AnLAO
Report
HOV Lanes in California:Are They Achieving Their Goals?
LAO Findings
Background
LAORecommendations
January 7, 2000
High occupancy vehicle (HOV) lanes are one of the primary tools usedto reduce traffic congestion on the state highway system and improveair quality. However, in recent years, HOV lanes’ effectiveness in achiev-ing these goals has come into question.
Based on our review of available data, we conclude that the perfor-mance of HOV lanes is mixed:
v On average, California’s HOV lanes carry 2,518 persons per hourduring peak hours—substantially more people than a congestedmixed-flow lane and roughly the same number of people as atypical mixed-flow lane operating at maximum capacity.
v In terms of vehicles carried, however, California’s HOV lanes areoperating at only two-thirds of their capacity.
v Regional data indicate that HOV lanes do induce people tocarpool, but the statewide impact on carpooling is unknown dueto lack of data.
v The exact impact of HOV lanes on air quality is unknown.
v Caltrans should improve its HOV data collection efforts, conductperiodic statewide surveys to determine the impact of HOV laneson carpooling, and report on lanes that fail Caltrans’ minimumcriteria of carrying 800 vehicles per hour.
v Caltrans and regional transportation planning agencies (RTPAs)should be more flexible in adjusting the hours of operation ofHOV lanes.
v The Legislature should create more High Occupancy Toll laneson HOV lanes that have unused capacity and are adjacent tocongested mixed-flow lanes.
v Caltrans should work with RTPAs to:
• Develop a statewide plan to promote carpool lane usage.
• Compile a set of performance measures and most cost-effec-tive practices to increase carpool lane usage.
• Consider converting underutilized HOV lanes to mixed flowwhere congestion is not present in mixed-flow lanes.
2
INTRODUCTIONHigh occupancy vehicle (HOV) lanes have
been a central part of California’s strategy for
alleviating congestion. Today, HOV lanes cover
925 lane miles of the state highway system and
plans are underway to double this system over the
next 20 years. Given population projections for
the state (expected to grow by over 30 percent by
2020) and the limited amount of capacity on the
state highway system, the Legislature, the Depart-
ment of Transportation (Caltrans), and regional
transportation planning agencies (RTPAs) ought to
take a closer look at the degree to which HOV
lanes are achieving the goals of congestion relief
and improved air quality. (For an index of acronyms,
see page 24.)
This report examines the performance of the
state’s HOV lanes. It provides options to modify
their use in order to ensure that the existing HOV
lane infrastructure is used most efficiently and any
future investments in HOV lanes will further the
goal of congestion relief and improved air quality.
CONGESTION IN CALIFORNIACalifornia residents consistently rank congestion
among their top concerns. Available data support
this view. For example, three of the ten worst
commutes in the country are located in California,
according to a 1999 report on urban roadway
congestion from the Texas Transportation Institute.
Additionally, a 1998 congestion study by Caltrans
found that:
u Vehicle hours of delay on California’s
urban freeways more than doubled, from
about 186,800 to 418,000 between 1987
and 1998.
u Congestion on the state highway system
has increased at an annual rate of 10 per-
cent since 1995. (Congestion was defined
as 15 minute intervals during peak com-
mute periods in which vehicles travel at
speeds of 35 mph or lower.)
u Approximately 40 percent of the state’s
urban freeways are congested. This state-
wide average obscures even worse con-
gestion in parts of the state such as
Los Angeles and Orange County where
between 60 percent to 84 percent of
freeway lane miles are congested.
A number of factors contribute to worsening
congestion. First, the total number of miles driven,
measured in vehicle miles traveled (VMT), consis-
tently outpaces population growth. From 1967 to
1997, the state’s population grew by 70 percent,
while VMT grew by 184 percent. The rapid
growth in VMT is a function of a number of
factors other than population growth, including
economic growth resulting in increased auto
ownership and mobility per household, and the
growing gap between where people live versus
where they work.
In addition, as auto ownership has increased,
average vehicle occupancy (AVO) has decreased,
resulting in an even higher number of cars on the
road relative to population. While statewide data

Legislative Analyst’s Office
3
are not available, nationwide statistics indicate
that AVO for home to work trips declined from
1.3 in 1977 to about 1.14 in 1995. In Southern
California, AVO in 1995 was approximately 1.13.
Declining AVO is a result of various factors which
make carpooling inconvenient, including less
centralized employment centers, less regular work
hours, and increased affluence which makes
commuters less sensitive to the cost of driving.
CONGESTION RELIEF EFFORTSThe state makes use of a variety of strategies to
relieve congestion on state highways. These
strategies can be divided into those that target
recurrent delay—resulting from the number of cars
on the road—and those that target nonrecurrent
delay—resulting from unique events, such as
special events or accidents. Approximately 50 per-
cent of congestion is due to nonrecurrent delay.
Such delays are best addressed by clearing acci-
dents as soon as possible through the use of
roaming tow trucks to respond promptly to
accidents and by providing the public with timely
traffic information (through changeable message
signs, for example) to encourage motorists to take
alternate routes.
To date, the majority of the state’s resources to
relieve congestion have been directed towards
recurrent delay. Construction of HOV lanes,
designed to reduce the number of cars on the
road by providing a time-savings incentive to
carpool, has been one of the primary strategies for
relieving congestion in California. To date, Caltrans
has spent almost $2.3 billion in state and federal
transportation funds on the construction of HOV
lanes.
OVERVIEW OF CALIFORNIA’S HOV LANESGOAL OF HOV LANES: REDUCE CON-GESTION AND IMPROVE AIR QUALITY
According to state law, the goal of HOV lanes is
twofold: reduce congestion and improve air
quality. State law declares that HOV lanes are “to
stimulate and encourage the development of ways
and means of relieving traffic congestion on
California highways and, at the same time, to
encourage individual citizens to pool their vehicu-
lar resources and thereby conserve fuel and lessen
emission of air pollutants.” State and federal law
also encourage the usage of buses on HOV lanes
as a way to carry more people.
Caltrans has defined the goal of HOV lanes
more specifically as follows:
u Increase the people-moving capacity of
the freeway system.
u Reduce overall vehicular congestion and
motorist delay by encouraging greater
HOV use through carpooling.

4
u Provide time and commute cost savings to
the users of HOV lanes.
u Increase overall efficiency of the system by
allowing HOVs to bypass congestion on
lanes designed for their use.
u Improve air quality by decreasing vehicular
emissions.
With respect to the last goal, it is worth noting
that strategies to reduce congestion are generally
consistent with the goal of reducing vehicular
emissions since vehicles emit less pollutants when
traveling at faster speeds. However, air quality can
also be addressed through technological ad-
vances, such as low- or zero-emission vehicles,
which have the potential to significantly reduce
the negative environmental
impact of vehicular travel.
GEOGRAPHICDISTRIBUTION OFCURRENT HOVLANE SYSTEM
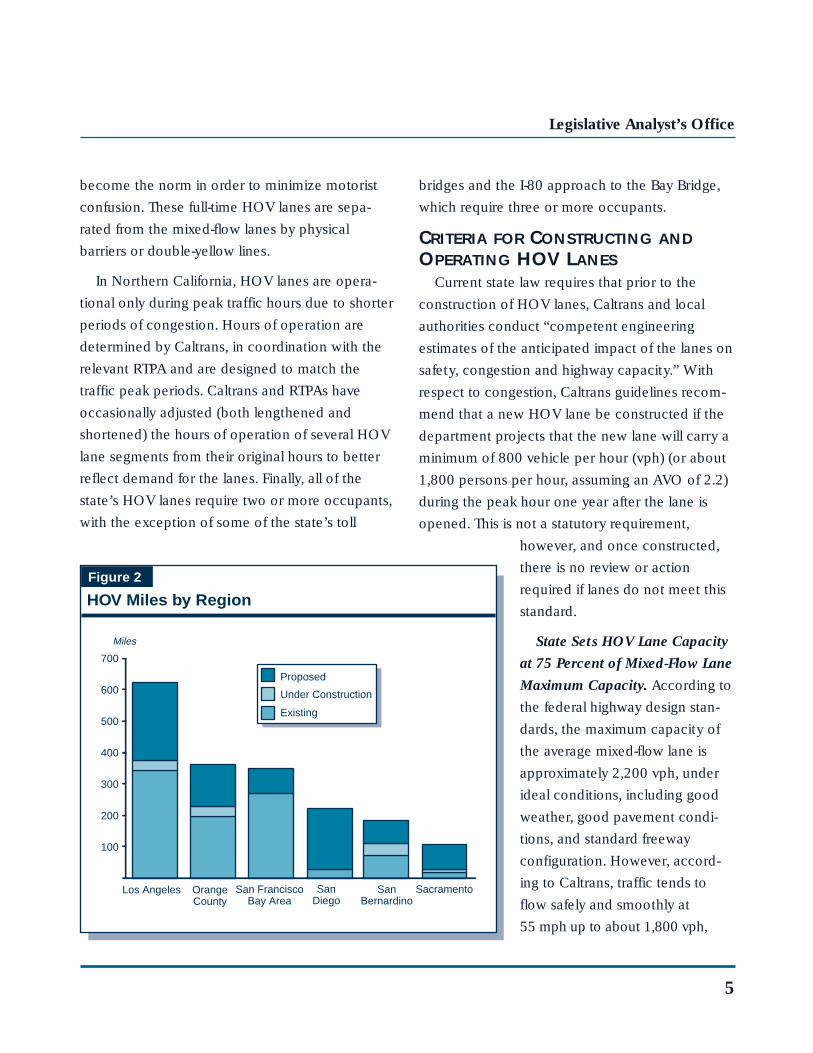
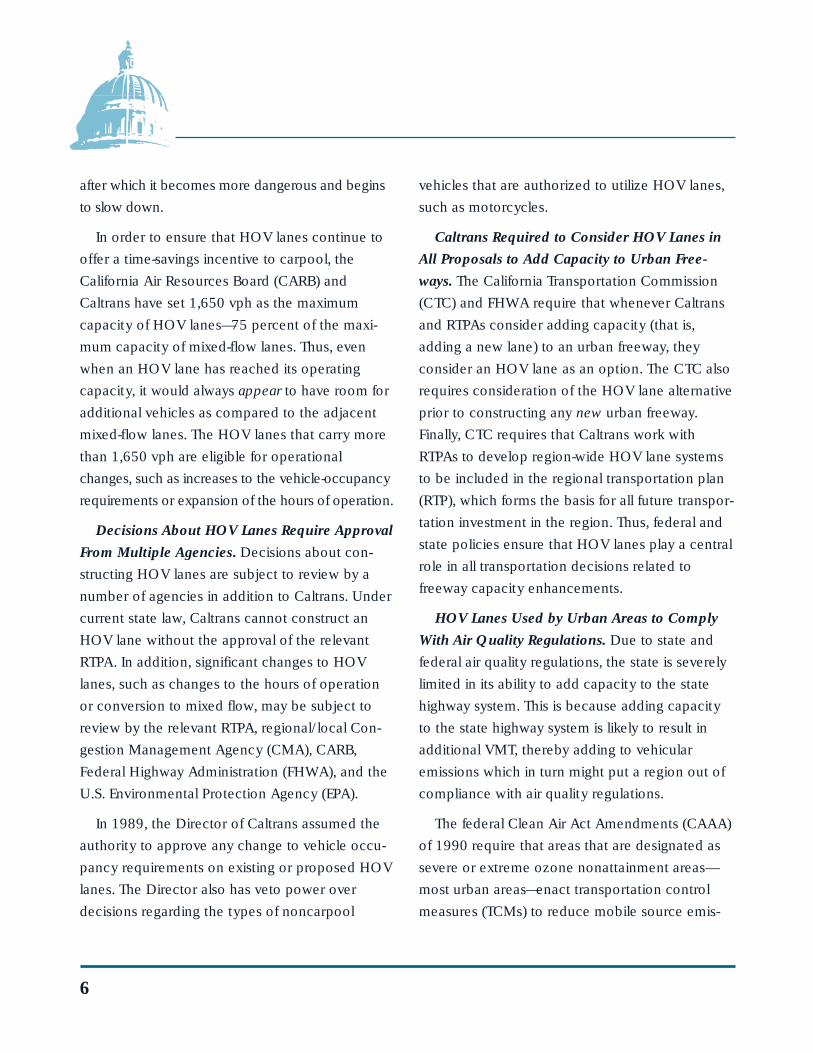
California currently has 925
HOV lane miles, approximately
1.9 percent of the state highway
system’s total lane miles. As
indicated in Figure 1, about
70 percent of the existing HOV
lanes are in Southern California
(in the Caltrans district areas of
Los Angeles, San Diego, San
Bernardino and Orange County)
while the remaining 30 percent
are located in the Bay Area and
the Sacramento region. In addition to the existing
HOV lanes, 110 miles of HOV lanes are currently
under construction, while another 809 miles have
been proposed. Of the proposed HOV miles,
approximately 70 percent are scheduled in the
1998 State Transportation Improvement Program
(STIP) for construction between 2000 and 2003.
Figure 2 shows the number of HOV lane miles in
operation, under construction, and proposed in the
different regions.
In Southern California, HOV lanes are opera-
tional 24 hours a day, seven days a week. Accord-
ing to Caltrans, this is because traffic peak periods
are so long in Southern California that part-time
operation would be impractical. Full-time opera-
tion of HOV lanes in Southern California has also
by Caltrans District Area
Figure 1
Statewide Distribution of HOV Lane Miles
San FranciscoBay Area
Los Angeles
San Bernardino
San Diego
Sacramento
Orange County
Legislative Analyst’s Office
5
become the norm in order to minimize motorist
confusion. These full-time HOV lanes are sepa-
rated from the mixed-flow lanes by physical
barriers or double-yellow lines.
In Northern California, HOV lanes are opera-
tional only during peak traffic hours due to shorter
periods of congestion. Hours of operation are
determined by Caltrans, in coordination with the
relevant RTPA and are designed to match the
traffic peak periods. Caltrans and RTPAs have
occasionally adjusted (both lengthened and
shortened) the hours of operation of several HOV
lane segments from their original hours to better
reflect demand for the lanes. Finally, all of the
state’s HOV lanes require two or more occupants,
with the exception of some of the state’s toll
bridges and the I-80 approach to the Bay Bridge,
which require three or more occupants.
CRITERIA FOR CONSTRUCTING ANDOPERATING HOV LANES
Current state law requires that prior to the
construction of HOV lanes, Caltrans and local
authorities conduct “competent engineering
estimates of the anticipated impact of the lanes on
safety, congestion and highway capacity.” With
respect to congestion, Caltrans guidelines recom-
mend that a new HOV lane be constructed if the
department projects that the new lane will carry a
minimum of 800 vehicle per hour (vph) (or about
1,800 persons per hour, assuming an AVO of 2.2)
during the peak hour one year after the lane is
opened. This is not a statutory requirement,
however, and once constructed,
there is no review or action
required if lanes do not meet this
standard.
State Sets HOV Lane Capacity
at 75 Percent of Mixed-Flow Lane
Maximum Capacity. According to
the federal highway design stan-
dards, the maximum capacity of
the average mixed-flow lane is
approximately 2,200 vph, under
ideal conditions, including good
weather, good pavement condi-
tions, and standard freeway
configuration. However, accord-
ing to Caltrans, traffic tends to
flow safely and smoothly at
55 mph up to about 1,800 vph,
Figure 2
HOV Miles by Region
100
200
300
400
500
600
700
Los Angeles OrangeCounty
SacramentoSanBernardino
SanDiego
San FranciscoBay Area
Proposed
Under Construction
Existing
Miles
6
after which it becomes more dangerous and begins
to slow down.
In order to ensure that HOV lanes continue to
offer a time-savings incentive to carpool, the
California Air Resources Board (CARB) and
Caltrans have set 1,650 vph as the maximum
capacity of HOV lanes—75 percent of the maxi-
mum capacity of mixed-flow lanes. Thus, even
when an HOV lane has reached its operating
capacity, it would always appear to have room for
additional vehicles as compared to the adjacent
mixed-flow lanes. The HOV lanes that carry more
than 1,650 vph are eligible for operational
changes, such as increases to the vehicle-occupancy
requirements or expansion of the hours of operation.
Decisions About HOV Lanes Require Approval
From Multiple Agencies. Decisions about con-
structing HOV lanes are subject to review by a
number of agencies in addition to Caltrans. Under
current state law, Caltrans cannot construct an
HOV lane without the approval of the relevant
RTPA. In addition, significant changes to HOV
lanes, such as changes to the hours of operation
or conversion to mixed flow, may be subject to
review by the relevant RTPA, regional/local Con-
gestion Management Agency (CMA), CARB,
Federal Highway Administration (FHWA), and the
U.S. Environmental Protection Agency (EPA).
In 1989, the Director of Caltrans assumed the
authority to approve any change to vehicle occu-
pancy requirements on existing or proposed HOV
lanes. The Director also has veto power over
decisions regarding the types of noncarpool
vehicles that are authorized to utilize HOV lanes,
such as motorcycles.
Caltrans Required to Consider HOV Lanes in
All Proposals to Add Capacity to Urban Free-
ways. The California Transportation Commission
(CTC) and FHWA require that whenever Caltrans
and RTPAs consider adding capacity (that is,
adding a new lane) to an urban freeway, they
consider an HOV lane as an option. The CTC also
requires consideration of the HOV lane alternative
prior to constructing any new urban freeway.
Finally, CTC requires that Caltrans work with
RTPAs to develop region-wide HOV lane systems
to be included in the regional transportation plan
(RTP), which forms the basis for all future transpor-
tation investment in the region. Thus, federal and
state policies ensure that HOV lanes play a central
role in all transportation decisions related to
freeway capacity enhancements.
HOV Lanes Used by Urban Areas to Comply
With Air Quality Regulations. Due to state and
federal air quality regulations, the state is severely
limited in its ability to add capacity to the state
highway system. This is because adding capacity
to the state highway system is likely to result in
additional VMT, thereby adding to vehicular
emissions which in turn might put a region out of
compliance with air quality regulations.
The federal Clean Air Act Amendments (CAAA)
of 1990 require that areas that are designated as
severe or extreme ozone nonattainment areas—
most urban areas—enact transportation control
measures (TCMs) to reduce mobile source emis-
Legislative Analyst’s Office
7
sions. The HOV lanes are among 16 TCMs which
can be used to bring an area into compliance.
Other TCMs include programs to improve public
transit, pedestrian and bicycling facilities, trip
reduction ordinances, and employer-based pro-
grams to permit flexible work schedules. Failure to
comply with CAAA can result in sanctions against
the state, including the withholding of federal
highway funding.
A region could add mixed-flow lanes if it is able
to offset the additional emissions through other
control or emission mitigation measures. In
practice, however, this would be very difficult
since vehicular emissions account for such a large
share (as much as 50 percent of ozone and
90 percent of carbon monoxide) of overall emis-
sions. As a result, the majority of the new capacity
added to the state highway system over the last
15 years has been through the construction of
HOV lanes. (According to Caltrans, mixed-flow
lanes have increased by about 1 percent in the
last 15 years—between 300 to 500 lane-miles.)
CRITICISM OF HOV LANESIn recent years, the performance of HOV lanes
has come into question. Various states have taken
actions to reexamine the effectiveness of HOV
lanes in reducing congestion and improving air
quality.
EMPTY LANE SYNDROMESome argue that, far from relieving congestion,
HOV lanes make congestion worse by forcing
single occupant vehicles (SOVs) to crowd together
in the mixed-flow lanes, while the adjacent
carpool lane appears to remain largely
underutilized. This so-called “empty lane syn-
drome” has led some to conclude that conversion
of HOV lanes to mixed flow would alleviate
congestion by making better use of the excess
capacity. The potential consequences of this
proposal have been the subject of much debate.
In particular, there are concerns that eliminating
the carpool lane would:
u Cause many carpoolers to revert to SOVs.
u Attract new vehicles to the corridor as a
result of the additional capacity.
u Cause all freeway lanes to be congested,
while eliminating a free-flowing lane
available as an alternative to those who
choose to carpool.
HOV LANE CONVERSION—THE NEW JERSEY EXPERIENCE
In November 1998, the New Jersey Depart-
ment of Transportation (NJDOT) converted two of
its HOV facilities (one on I-80 and one on I-287)
to mixed-flow lanes. In determining whether or
not to convert the lanes to mixed flow, the NJDOT
identified three objectives that HOV facilities must
meet. Specifically, a successful HOV lane should:

8
u Induce people to carpool.
u Carry 700 vph, or at least the same num-
ber of people as the average of the mixed-
flow lanes.
u Reduce or at least not worsen the overall
level of congestion in the corridor.
The NJDOT found that neither the I-80 nor
I-287 HOV lanes met all three objectives. The
review further concluded that due to
underutilization, the HOV lanes actually had a
negative impact on traffic congestion and air
quality by increasing traffic volume in the mixed-
flow lanes thereby leading to slower travel speed,
greater congestion, and higher emissions.
In the case of I-287, which failed all three
objectives, the HOV facility carried about 300 vph
and, in some sections, as few as 32 vph. Although
I-80 met the threshold of 700 vph, it did not meet
the requirements of inducing people to carpool or
reducing congestion. As a result, the department
concluded that converting the HOV lanes on
these two highways to mixed flow would provide
short-term (two to four years) congestion relief. In
addition, by improving the overall traffic flow,
NJDOT concluded that air quality for the corridor
would also be improved. Although NJDOT is not
conducting a formal evaluation of the impact of
conversion, preliminary observations suggest that
conversion of the I-80 HOV lane to mixed flow
has resulted in a growth in the number of vehicles
in the corridor above the historic-growth level. This
is likely due to a combination of carpools disband-
ing and new vehicles drawn to the freeway to take
advantage of the additional capacity.
New Jersey is not the only state reconsidering
its approach to HOV lanes. Legislation has been
proposed in Minnesota to convert all HOV lanes
to mixed flow. In Tennessee, legislation was
proposed in 1999 to reduce the fine for SOVs
traveling in HOV lanes to $1 and allow the lane to
be used as a passing lane for all vehicles.
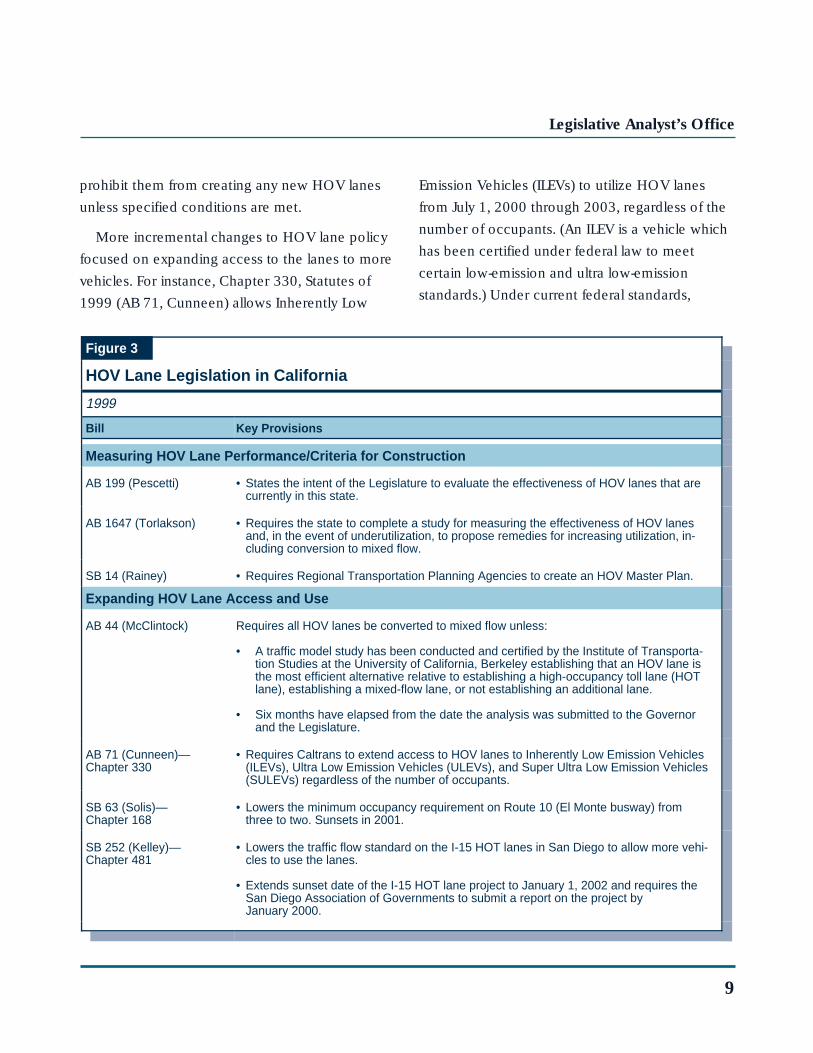
RECENT LEGISLATION IN CALIFORNIASeven bills related to HOV lanes were intro-
duced by the state Legislature during 1999. These
bills took two general forms, as Figure 3 shows,
and generally reflected a dissatisfaction with
(1) the information available to assess the perfor-
mance of the HOV lanes and (2) the current
performance of HOV lanes. The first group of
measures recommended increased study of HOV
lanes in order to measure their performance and
develop criteria for determining when and where
to construct HOV lanes in the future. The second
group sought to increase utilization of the lanes by
expanding access to more vehicles through
various approaches.
This latter group of bills offer a wide range of
approaches to reforming HOV lanes—from opera-
tional changes in the hours of operation and
vehicle occupancy requirements to wholesale
conversion of the HOV system to mixed flow.
Assembly Bill 44 (McClintock), for example, would
require Caltrans and local authorities to convert all
existing HOV lanes to mixed flow and would
Legislative Analyst’s Office
9
prohibit them from creating any new HOV lanes
unless specified conditions are met.
More incremental changes to HOV lane policy
focused on expanding access to the lanes to more
vehicles. For instance, Chapter 330, Statutes of
1999 (AB 71, Cunneen) allows Inherently Low
Emission Vehicles (ILEVs) to utilize HOV lanes
from July 1, 2000 through 2003, regardless of the
number of occupants. (An ILEV is a vehicle which
has been certified under federal law to meet
certain low-emission and ultra low-emission
standards.) Under current federal standards,
Figure 3
HOV Lane Legislation in California
1999
Bill Key Provisions
Measuring HOV Lane Performance/Criteria for Construction
AB 199 (Pescetti) • States the intent of the Legislature to evaluate the effectiveness of HOV lanes that arecurrently in this state.
AB 1647 (Torlakson) • Requires the state to complete a study for measuring the effectiveness of HOV lanesand, in the event of underutilization, to propose remedies for increasing utilization, in-cluding conversion to mixed flow.
SB 14 (Rainey) • Requires Regional Transportation Planning Agencies to create an HOV Master Plan.
Expanding HOV Lane Access and Use
AB 44 (McClintock) Requires all HOV lanes be converted to mixed flow unless:
• A traffic model study has been conducted and certified by the Institute of Transporta-tion Studies at the University of California, Berkeley establishing that an HOV lane isthe most efficient alternative relative to establishing a high-occupancy toll lane (HOTlane), establishing a mixed-flow lane, or not establishing an additional lane.
• Six months have elapsed from the date the analysis was submitted to the Governorand the Legislature.
AB 71 (Cunneen)—Chapter 330
• Requires Caltrans to extend access to HOV lanes to Inherently Low Emission Vehicles(ILEVs), Ultra Low Emission Vehicles (ULEVs), and Super Ultra Low Emission Vehicles(SULEVs) regardless of the number of occupants.
SB 63 (Solis)—Chapter 168
• Lowers the minimum occupancy requirement on Route 10 (El Monte busway) fromthree to two. Sunsets in 2001.
SB 252 (Kelley)—Chapter 481
• Lowers the traffic flow standard on the I-15 HOT lanes in San Diego to allow more vehi-cles to use the lanes.
• Extends sunset date of the I-15 HOT lane project to January 1, 2002 and requires theSan Diego Association of Governments to submit a report on the project byJanuary 2000.
10
natural gas vehicles and electric vehicles are the
only type of vehicles that are classified as ILEVs.
There are an estimated 2,000 ILEVs currently in
the state and thus the addition of these vehicles
statewide is not expected to hamper the free flow
of HOV lanes. From 2004 through 2007, Ultra
Low Emission Vehicles (ULEVs) and Super Ultra
Low Emission Vehicles (SULEVs), which meet even
more stringent emission standards than ILEVs, will
be granted access to HOV lanes.
MEASURING PERFORMANCE OF HOV LANESThere are several ways to measure the extent to
which HOV lanes are achieving the goals of
reducing congestion and improving air quality.
With respect to reducing congestion, HOV lane
performance can be evaluated based on (1) usage
of the lanes and (2) their impact on carpooling.
Usage can be measured in two primary ways: the
number of persons per hour moving through the
HOV lane and the number of vehicles per hour
moving through the HOV lane. The impact of
HOV lanes on carpooling is most accurately
measured through surveys of motorists’ commut-
ing choices. With respect to improving air quality,
the impact of HOV lanes has not been measured
empirically, but rather estimated using mathemati-
cal models.
USAGE BASED ONPEOPLE THROUGHPUT
On Average, HOV Lanes Carry More People
Than a Congested Mixed-Flow Lane. One mea-
sure of the performance of HOV lanes is to
compare the number of persons they carry per
hour with the number of persons transported
through mixed-flow lanes. Caltrans, however, has
no statewide estimate of the average number of
persons carried by HOV lanes or mixed-flow
lanes. Based on AVO data from Caltrans, we have
developed such an estimate. Our calculations
assume that AVO on HOV lanes is 2.3 persons
and on mixed-flow lanes is 1.14 persons.
We estimate that the state’s HOV lanes carry
an average of about 2,518 persons per hour
during peak hours. This is substantially more than
the number of people carried by a congested
mixed-flow lane—between 1,368 and 1,938
persons per hour—and roughly equivalent to the
number of people carried by a mixed-flow lane
operating at maximum capacity (2,508 persons
per hour).
The next section examines two HOV lanes that
have achieved high vehicle occupancy and can be
considered successful from the perspective of
person throughput.
El Monte Busway and the San Francisco-
Oakland Bay Bridge. Because of the potential for
very high occupancy, HOV lanes can be very
efficient from the perspective of person through-
put when combined with bus service. An example
is the HOV lane on Route 10 (the San Bernardino

Legislative Analyst’s Office
11
freeway). This lane, known as the El Monte
busway, was originally constructed in 1973 for
buses only. Due to a bus strike in 1976, access
was expanded to include vehicles with three or
more occupants.
According to a traffic count conducted by
Caltrans in 1997, the westbound HOV lane
carried 49 percent of people in the freeway
corridor during peak hours, while the remaining
51 percent were carried by the four mixed-flow
lanes combined. By contrast, the HOV lane
carried only 15 percent of the vehicles in the
corridor, 5 percent less than its share of roadway
capacity. Approximately 48 percent of the people
traveling in the carpool lane were bus passengers,
while the remaining 52 percent rode in carpools,
vanpools, or by motorcycle.
Another example of the substantial people
throughput potential of HOV lanes, even without
substantial transit usage, is the Bay Bridge toll
plaza. In 1998, the four HOV lanes on the toll
plaza carried approximately 63 percent of all
people crossing the bridge westbound (almost
16 percent each) during the morning commute,
compared to 18 mixed-flow lanes which carried
the remaining 36 percent of the people (an
average of only 2 percent each lane). According to
a 1995-96 survey of Bay Area commuters con-
ducted for Caltrans, among drivers traveling
westbound on the San Francisco-Oakland Bay
Bridge, 48 percent of carpoolers formed their
carpool by picking up riders at transit stops in the
East Bay. These carpoolers not only save time
when crossing the bridge, but also avoid toll costs
since carpools travel free. Although this “casual”
carpooling results in higher HOV lane usage, it has
been criticized for taking away potential transit
patrons.
The relative success of the El Monte busway
and HOV lanes on the San Francisco-Oakland Bay
Bridge is due in part to some unique features. The
El Monte busway is unique in terms of its bus
patronage, while the Bay Bridge is unique in terms of
the existence of a system of casual carpooling. To the
extent that other HOV facilities can replicate these
types of features, they will be more successful.
USAGE BASED ONVEHICLE THROUGHPUT
While person throughput is an important
measure, HOV lanes should also be evaluated
based on the number of vehicles they carry. This is
because excess vehicular capacity in an HOV lane
means that the lane is not fully utilized. For in-
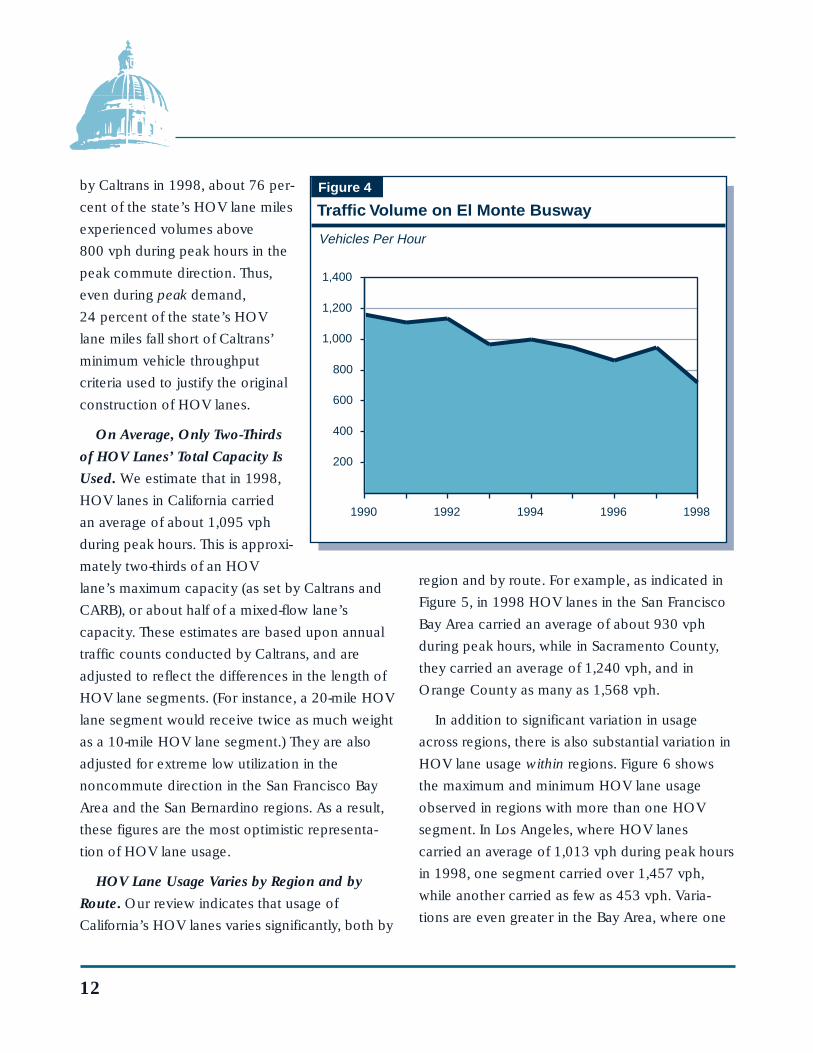
stance, while the El Monte busway carried about
49 percent of the people on the entire corridor in
1997, vehicular volume on this busway has been
steadily declining over the last decade, as indi-
cated in Figure 4 (see page 12). To the extent
there is excess vehicle capacity on an HOV lane,
both vehicle and person throughput of the lane
can be improved. Given the limited capacity
available on the state highway system, it is essen-
tial that the existing vehicle capacity of HOV lanes
be used most efficiently.
Approximately 24 Percent of State HOV Lane
Segments Fail Minimum Vehicle Throughput
Criteria. According to vehicle counts conducted
12
Vehicles Per Hour
Figure 4
Traffic Volume on El Monte Busway
200
400
600
800
1,000
1,200
1,400
1990 1992 1994 1996 1998
by Caltrans in 1998, about 76 per-
cent of the state’s HOV lane miles
experienced volumes above
800 vph during peak hours in the
peak commute direction. Thus,
even during peak demand,
24 percent of the state’s HOV
lane miles fall short of Caltrans’
minimum vehicle throughput
criteria used to justify the original
construction of HOV lanes.
On Average, Only Two-Thirds
of HOV Lanes’ Total Capacity Is
Used. We estimate that in 1998,
HOV lanes in California carried
an average of about 1,095 vph
during peak hours. This is approxi-
mately two-thirds of an HOV
lane’s maximum capacity (as set by Caltrans and
CARB), or about half of a mixed-flow lane’s
capacity. These estimates are based upon annual
traffic counts conducted by Caltrans, and are
adjusted to reflect the differences in the length of
HOV lane segments. (For instance, a 20-mile HOV
lane segment would receive twice as much weight
as a 10-mile HOV lane segment.) They are also
adjusted for extreme low utilization in the
noncommute direction in the San Francisco Bay
Area and the San Bernardino regions. As a result,
these figures are the most optimistic representa-
tion of HOV lane usage.
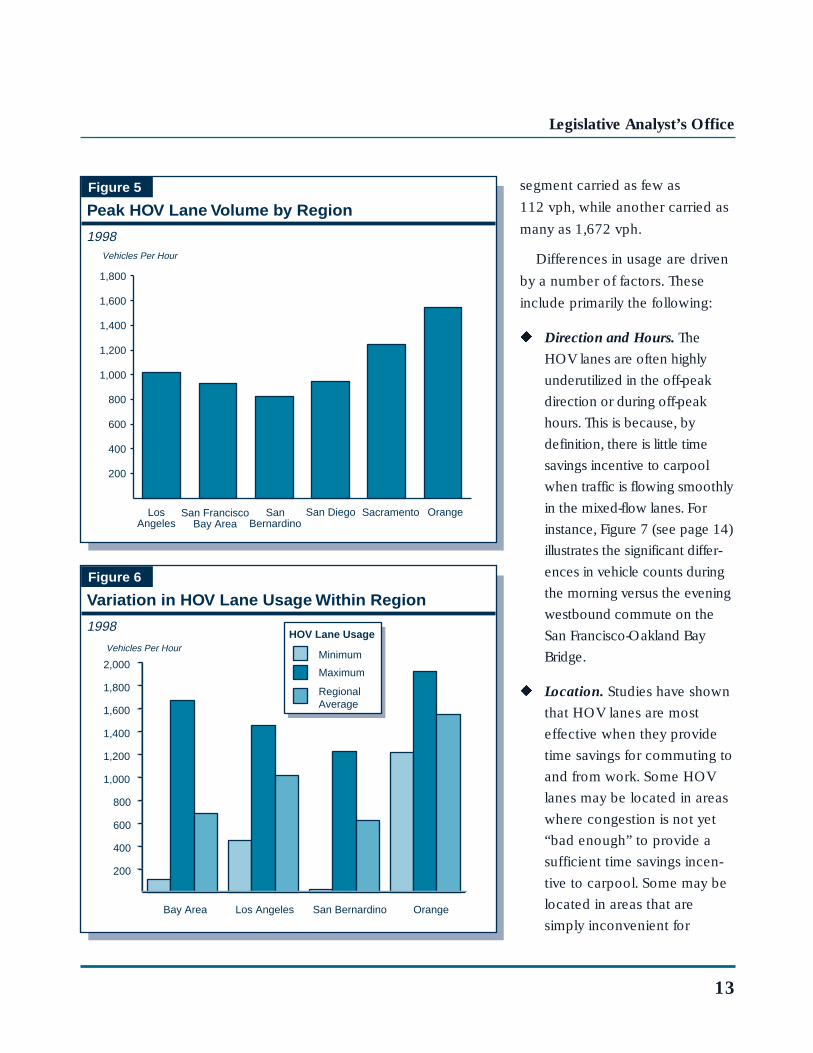
HOV Lane Usage Varies by Region and by
Route. Our review indicates that usage of
California’s HOV lanes varies significantly, both by
region and by route. For example, as indicated in
Figure 5, in 1998 HOV lanes in the San Francisco
Bay Area carried an average of about 930 vph
during peak hours, while in Sacramento County,
they carried an average of 1,240 vph, and in
Orange County as many as 1,568 vph.
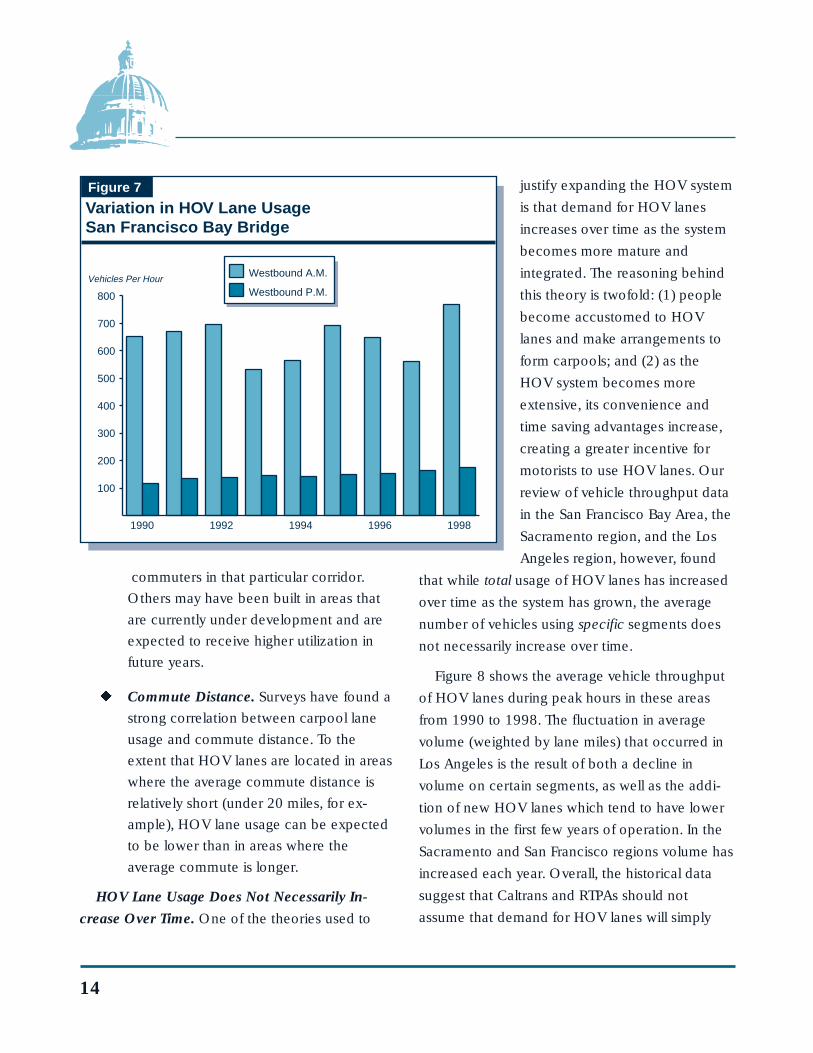
In addition to significant variation in usage
across regions, there is also substantial variation in
HOV lane usage within regions. Figure 6 shows
the maximum and minimum HOV lane usage
observed in regions with more than one HOV
segment. In Los Angeles, where HOV lanes
carried an average of 1,013 vph during peak hours
in 1998, one segment carried over 1,457 vph,
while another carried as few as 453 vph. Varia-
tions are even greater in the Bay Area, where one
Legislative Analyst’s Office
13
segment carried as few as
112 vph, while another carried as
many as 1,672 vph.
Differences in usage are driven
by a number of factors. These
include primarily the following:
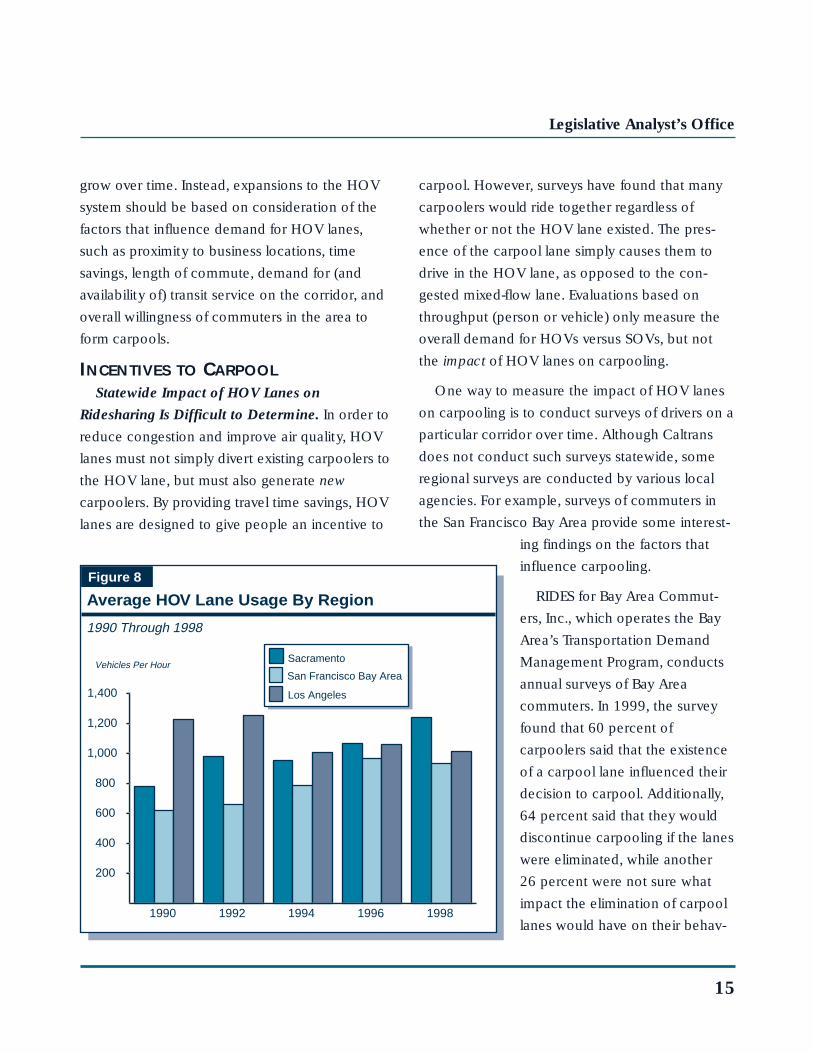
u Direction and Hours. The
HOV lanes are often highly
underutilized in the off-peak
direction or during off-peak
hours. This is because, by
definition, there is little time
savings incentive to carpool
when traffic is flowing smoothly
in the mixed-flow lanes. For
instance, Figure 7 (see page 14)
illustrates the significant differ-
ences in vehicle counts during
the morning versus the evening
westbound commute on the
San Francisco-Oakland Bay
Bridge.
u Location. Studies have shown
that HOV lanes are most
effective when they provide
time savings for commuting to
and from work. Some HOV
lanes may be located in areas
where congestion is not yet
“bad enough” to provide a
sufficient time savings incen-
tive to carpool. Some may be
located in areas that are
simply inconvenient for
1998
200
400
600
800
1,000
1,200
1,400
1,600
1,800
LosAngeles
San FranciscoBay Area
SanBernardino
San Diego Sacramento Orange
Vehicles Per Hour
Figure 5
Peak HOV Lane Volume by Region
1998
Vehicles Per Hour
Figure 6
Variation in HOV Lane Usage Within Region
200
400
600
800
1,000
1,200
1,400
1,600
1,800
2,000
Bay Area Los Angeles San Bernardino Orange
Minimum
HOV Lane Usage
Maximum
RegionalAverage
14
Figure 7
Vehicles Per Hour
Variation in HOV Lane UsageSan Francisco Bay Bridge
Westbound A.M.
Westbound P.M.
100
200
300
400
500
600
700
800
1990 1992 1994 1996 1998
commuters in that particular corridor.
Others may have been built in areas that
are currently under development and are
expected to receive higher utilization in
future years.
u Commute Distance. Surveys have found a
strong correlation between carpool lane
usage and commute distance. To the
extent that HOV lanes are located in areas
where the average commute distance is
relatively short (under 20 miles, for ex-
ample), HOV lane usage can be expected
to be lower than in areas where the
average commute is longer.
HOV Lane Usage Does Not Necessarily In-
crease Over Time. One of the theories used to
justify expanding the HOV system
is that demand for HOV lanes
increases over time as the system
becomes more mature and
integrated. The reasoning behind
this theory is twofold: (1) people
become accustomed to HOV
lanes and make arrangements to
form carpools; and (2) as the
HOV system becomes more
extensive, its convenience and
time saving advantages increase,
creating a greater incentive for
motorists to use HOV lanes. Our
review of vehicle throughput data
in the San Francisco Bay Area, the
Sacramento region, and the Los
Angeles region, however, found
that while total usage of HOV lanes has increased
over time as the system has grown, the average
number of vehicles using specific segments does
not necessarily increase over time.
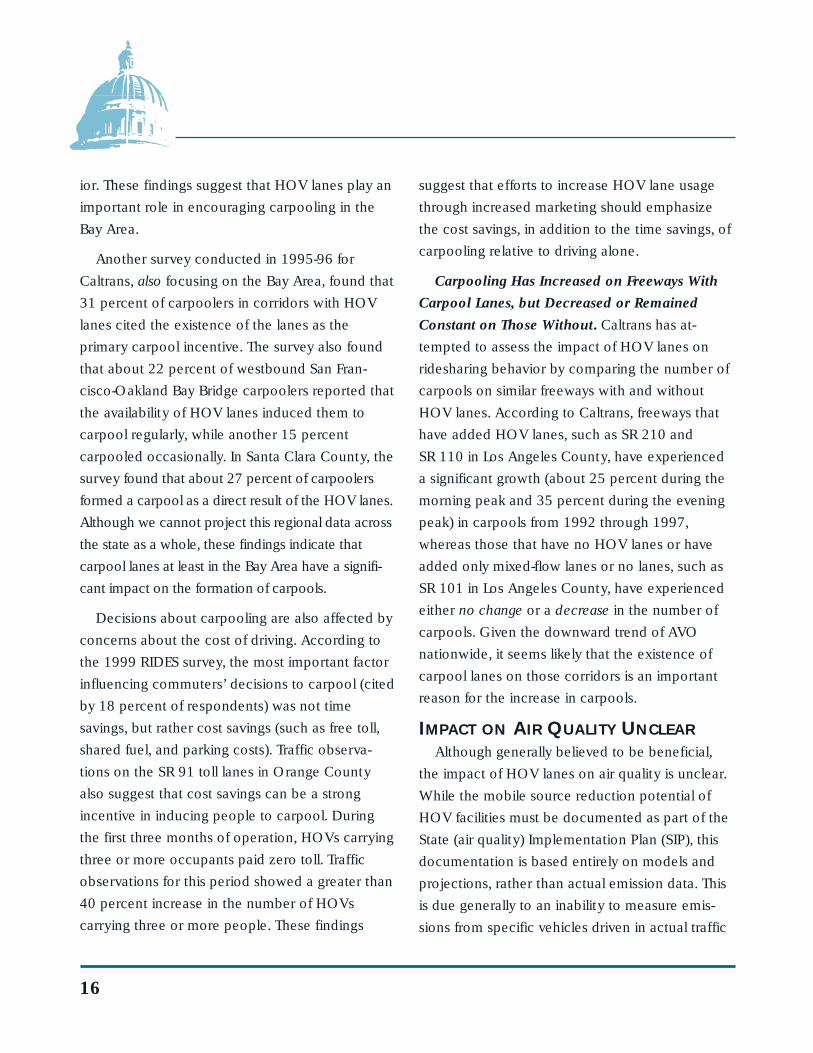
Figure 8 shows the average vehicle throughput
of HOV lanes during peak hours in these areas
from 1990 to 1998. The fluctuation in average
volume (weighted by lane miles) that occurred in
Los Angeles is the result of both a decline in
volume on certain segments, as well as the addi-
tion of new HOV lanes which tend to have lower
volumes in the first few years of operation. In the
Sacramento and San Francisco regions volume has
increased each year. Overall, the historical data
suggest that Caltrans and RTPAs should not
assume that demand for HOV lanes will simply
Legislative Analyst’s Office
15
grow over time. Instead, expansions to the HOV
system should be based on consideration of the
factors that influence demand for HOV lanes,
such as proximity to business locations, time
savings, length of commute, demand for (and
availability of) transit service on the corridor, and
overall willingness of commuters in the area to
form carpools.
INCENTIVES TO CARPOOLStatewide Impact of HOV Lanes on
Ridesharing Is Difficult to Determine. In order to
reduce congestion and improve air quality, HOV
lanes must not simply divert existing carpoolers to
the HOV lane, but must also generate new
carpoolers. By providing travel time savings, HOV
lanes are designed to give people an incentive to
carpool. However, surveys have found that many
carpoolers would ride together regardless of
whether or not the HOV lane existed. The pres-
ence of the carpool lane simply causes them to
drive in the HOV lane, as opposed to the con-
gested mixed-flow lane. Evaluations based on
throughput (person or vehicle) only measure the
overall demand for HOVs versus SOVs, but not
the impact of HOV lanes on carpooling.
One way to measure the impact of HOV lanes
on carpooling is to conduct surveys of drivers on a
particular corridor over time. Although Caltrans
does not conduct such surveys statewide, some
regional surveys are conducted by various local
agencies. For example, surveys of commuters in
the San Francisco Bay Area provide some interest-
ing findings on the factors that
influence carpooling.
RIDES for Bay Area Commut-
ers, Inc., which operates the Bay
Area’s Transportation Demand
Management Program, conducts
annual surveys of Bay Area
commuters. In 1999, the survey
found that 60 percent of
carpoolers said that the existence
of a carpool lane influenced their
decision to carpool. Additionally,
64 percent said that they would
discontinue carpooling if the lanes
were eliminated, while another
26 percent were not sure what
impact the elimination of carpool
lanes would have on their behav-
1990 Through 1998
Vehicles Per Hour
Figure 8
Average HOV Lane Usage By Region
Sacramento
San Francisco Bay Area
Los Angeles
200
400
600
800
1,000
1,200
1,400
1990 1992 1994 1996 1998
16
ior. These findings suggest that HOV lanes play an
important role in encouraging carpooling in the
Bay Area.
Another survey conducted in 1995-96 for
Caltrans, also focusing on the Bay Area, found that
31 percent of carpoolers in corridors with HOV
lanes cited the existence of the lanes as the
primary carpool incentive. The survey also found
that about 22 percent of westbound San Fran-
cisco-Oakland Bay Bridge carpoolers reported that
the availability of HOV lanes induced them to
carpool regularly, while another 15 percent
carpooled occasionally. In Santa Clara County, the
survey found that about 27 percent of carpoolers
formed a carpool as a direct result of the HOV lanes.
Although we cannot project this regional data across
the state as a whole, these findings indicate that
carpool lanes at least in the Bay Area have a signifi-
cant impact on the formation of carpools.
Decisions about carpooling are also affected by
concerns about the cost of driving. According to
the 1999 RIDES survey, the most important factor
influencing commuters’ decisions to carpool (cited
by 18 percent of respondents) was not time
savings, but rather cost savings (such as free toll,
shared fuel, and parking costs). Traffic observa-
tions on the SR 91 toll lanes in Orange County
also suggest that cost savings can be a strong
incentive in inducing people to carpool. During
the first three months of operation, HOVs carrying
three or more occupants paid zero toll. Traffic
observations for this period showed a greater than
40 percent increase in the number of HOVs
carrying three or more people. These findings
suggest that efforts to increase HOV lane usage
through increased marketing should emphasize
the cost savings, in addition to the time savings, of
carpooling relative to driving alone.
Carpooling Has Increased on Freeways With
Carpool Lanes, but Decreased or Remained
Constant on Those Without. Caltrans has at-
tempted to assess the impact of HOV lanes on
ridesharing behavior by comparing the number of
carpools on similar freeways with and without
HOV lanes. According to Caltrans, freeways that
have added HOV lanes, such as SR 210 and
SR 110 in Los Angeles County, have experienced
a significant growth (about 25 percent during the
morning peak and 35 percent during the evening
peak) in carpools from 1992 through 1997,
whereas those that have no HOV lanes or have
added only mixed-flow lanes or no lanes, such as
SR 101 in Los Angeles County, have experienced
either no change or a decrease in the number of
carpools. Given the downward trend of AVO
nationwide, it seems likely that the existence of
carpool lanes on those corridors is an important
reason for the increase in carpools.
IMPACT ON AIR QUALITY UNCLEARAlthough generally believed to be beneficial,
the impact of HOV lanes on air quality is unclear.
While the mobile source reduction potential of
HOV facilities must be documented as part of the
State (air quality) Implementation Plan (SIP), this
documentation is based entirely on models and
projections, rather than actual emission data. This
is due generally to an inability to measure emis-
sions from specific vehicles driven in actual traffic
Legislative Analyst’s Office
17
conditions. Moreover, many of the variables
critical to such models, such as the percentage of
vehicles that shifted from SOVs to HOVs, are
estimated based on very limited data.
There are other difficulties in estimating the
impact of HOV lanes on air quality, depending on
the baseline for comparison. For example, a new
HOV lane may result in higher emissions com-
pared to a no-build scenario, but lower emissions
than a new mixed-flow lane. This is because HOV
lanes that are added to the existing freeway
capacity can be expected to increase demand for
driving, albeit less so than construction of a new
mixed-flow lane. On the other hand, increases in
driving (or in VMT) do not necessarily result in
higher emissions since emissions are a function of
speed, as well as VMT. Finally, there is a potential
negative air quality impact resulting from the
congestion caused during the construction of the
HOV lanes. Given these difficulties, more research
is needed in order to determine the impact of
HOV lanes on air quality.
SUMMARY OF FINDINGSOur review found that the average HOV lane in
California carries 1,095 vph and approximately
2,518 persons per hour, during peak hours. These
findings indicate that, on average, California’s
HOV lanes:
u Carry substantially more people than a
congested mixed-flow lane and about the
same number of people as a mixed-flow
lane operating at maximum capacity.
u In terms of vehicles carried, however,
California’s HOV lanes are operating at
only two-thirds of their capacity—a level
that is equivalent to half of a mixed-flow
lane’s capacity under ideal conditions.
While our findings indicate that the common
perception of HOV lanes as “empty” is not
accurate, it also reveals that many HOV lanes in
California have substantial unused capacity. This
capacity could potentially be used by other
vehicles (HOVs or SOVs) while still ensuring that
vehicles in the lane are able to travel smoothly at
55 mph, providing a time savings incentive for
motorists to carpool. Additionally, we find that
about 24 percent of the state’s HOV lanes do not
meet Caltrans’ minimum vehicle volume standard
during peak hours.
In addition, our review found that HOV lanes
do appear to have a positive impact on
carpooling, although the statewide impact is
unknown due to a lack of data. Finally, we found
that the exact impact of HOV lanes on air quality,
though widely believed to be positive, is unknown
due to lack of actual emission data.
EVALUATION OF HOV LANESINADEQUATE
Despite current law’s clear articulation of goals,
Caltrans does not adequately evaluate HOV lanes
to determine how successful they are at achieving
these goals. While Caltrans requires that each of
its district offices operating HOV lanes publish an
annual report on the usage of the lanes, our
review found that not all districts comply with this

18
requirement. For example, District 4 in the Bay
Area has published a detailed HOV annual report
since 1990 whereas District 8 (San Bernardino
County), District 11 (San Diego County), and
District 12 (Orange County) had little if any data
available prior to 1998 despite each having
operated HOV lanes for the last five years.
In order for the state to determine how to make
better use of HOV lanes, Caltrans should:
u Establish uniform data collection method-
ologies and reporting requirements.
u Conduct before and after vehicle and
occupancy studies on new HOV facilities
to determine the impact of the lanes on
carpooling. Such data should be included
in the department’s annual reports on
HOV lanes.
u Report on lanes that do not meet the
800 vph requirement and recommend
steps to increase utilization or convert to
mixed flow.
In addition, Caltrans should conduct periodic
statewide surveys of commuters to determine the
factors influencing the public’s decisions to drive,
carpool, use transit, or other modes of transporta-
tion. Such surveys are the most appropriate way to
assess how effective HOV lanes are in encourag-
ing carpooling and the factors that influence HOV
lane usage.
OPTIONS FOR CALIFORNIA’S HOV LANESAlthough many of California’s HOV lanes can
be considered successful from the perspective of
vehicle and person throughput, others are sub-
stantially underutilized. This section discusses the
various options available to make better use of the
state’s HOV lanes.
One option currently used by Caltrans which
may warrant greater application is to adjust the
hours of operation to better reflect demand. In
this connection, Caltrans and RTPAs should take a
flexible, experimental approach to optimize HOV
lane usage. Modifications to HOV lane operations
should be based not only on consideration of the
long-term impact on congestion and air quality,
but should also give adequate attention to short-
term benefits. For example, a temporary reduction
in the hours of operation today may be worth-
while even if longer hours will be needed in
several years when demand for the HOV lane
increases.
As part of the effort to increase people through-
put on HOV lanes, Caltrans and RTPAs should
take an active interest in promoting bus service on
HOV lanes where demand for such service can be
demonstrated. The example of the El Monte
busway, discussed previously, demonstrates the
potential of HOV lanes to carry significant num-
bers of people, when coupled with frequent bus
Legislative Analyst’s Office
19
service. Since HOV lanes virtually guarantee a
congestion-free ride, they play a very important role
in the reliability of bus service, known to be a critical
factor in influencing a person’s decision to use
transit.
Other options, discussed below, include in-
creased outreach and marketing of HOV lanes,
high occupancy toll (HOT) lanes, and conversion
to mixed-flow lanes.
PROMOTE RIDESHARING ANDPARK AND RIDE FACILITIES
Until 1996, the state provided grants to regional
agencies to promote carpooling as part of the
Transportation Demand Management program.
The grant funds were used to provide motorists
access to and information about carpools and
vanpools as an alternative to driving alone. State
funding for the rideshare program, which ranged
from about $14 million to $40 million annually
was eliminated in 1996-97. This was due to two
factors: (1) Chapter 607, Statutes of 1995 (SB 437,
Lewis) removed the state requirement that Califor-
nia employers adopt trip reduction programs; and
(2) a survey found that only 2 percent of rideshare
applicants actually changed their transportation
choices to utilize rideshare services. As a result,
funding for ridesharing promotion is now the
responsibility of the RTPAs.
While a variety of funds (state and federal) may
be used to promote ridesharing, RTPAs must now
choose between funding rideshare programs and
other transportation priorities, including highway
construction projects and any projects related to
air quality improvements such as transit capital
enhancements. Our review shows that since
becoming a regional discretionary program,
overall funding for rideshare promotion has
declined substantially—by over 50 percent. This
decrease in funding may have resulted in less
awareness of commuter services. For instance,
according to the 1999 RIDES survey, awareness of
the RIDES program and commuter information
services peaked in 1992 when funding was twice
the existing level, and reached a low in 1999.
In addition to rideshare programs, HOV lane
performance is also affected by the availability
and condition of facilities that support HOV lane
usage such as transit service and park and ride
lots. According to Caltrans, there are approxi-
mately 450 park and ride lots statewide. Of these,
210 are owned by Caltrans, 120 by local govern-
ment or transit agencies, and the remaining 120
are owned privately. Caltrans is planning to ex-
pend over $1 million for additional park and ride
lots over the next several years. According to
Caltrans, about 62 percent of available park and
ride spaces were used in 1994 (the last year for
which data are available), and the extent of use
appears to be declining. It is not clear what
accounts for this decline, but Caltrans cited the
lack of promotion as one possibility. Other pos-
sible explanations may be inconvenient location
or inaccessibility by transit. In order to better
manage these facilities, Caltrans should conduct
annual reviews of their usage.
As long as HOV lanes continue to be state
policy, Caltrans should pursue efforts to encour-
20
age carpooling and otherwise increase HOV lane
usage. We recommend that Caltrans work with
RTPAs and rideshare program managers to de-
velop a statewide plan for carpool lane promotion.
Additionally, the group should compile a set of
performance measures and most cost-effective
practices for carpool promotion and HOV lane
usage. This information could be used in the
future to evaluate funding proposals if the state
were to establish a statewide grant program.
MAKING USE OF EXCESSCAPACITY: HOT LANES
In our 1998 report After the Transportation
Blueprint: Developing and Funding an Efficient
Transportation System, we recommended that
legislation be enacted to authorize the construc-
tion (or conversion) of HOT lanes as a pilot
program. HOT lanes provide an option to maxi-
mize usage of HOV lanes, while also relieving
congestion in the mixed-flow lanes. Specifically,
where HOV lanes have excess capacity, one
option is to “sell” (by charging a toll) the addi-
tional capacity to noncarpool vehicles—SOVs or
vehicles with two occupants, in the case of HOV
lanes that require a minimum of three occupants.
These HOT lanes benefit users and nonusers
alike. Specifically, HOT lanes:
u Offer motorists the option of paying to
drive in a “congestion free” lane.
u Generate revenue which can be used to
finance other transportation projects.
In order to maintain a free flow of traffic at all
times, tolls on HOT lanes can be structured to
vary according to the level of traffic in the HOT
lane. As traffic volume approaches capacity, the
HOT LANE CASE STUDY: INTERSTATE 15 IN SAN DIEGOThe Interstate 15 (I-15) HOT lane is a feder-
ally funded, $9.95 million, demonstrationproject. The project began in 1991 when theSan Diego Association of Governments(SANDAG) was developing air quality transpor-tation control measures, in accordance withstate and federal air quality regulations. At thetime, the I-15 HOV lanes were underutilized,while the mixed-flow lanes on the corridorexperienced severe congestion during peaktraffic hours. There was also relatively littletransit service operating on the corridor. Inresponse, SANDAG proposed to implement aHOT lane with the following goals:
u Maximize the use of the existingcapacity on the HOV lanes.
u Improve transit and HOV servicesalong I-15.
u Relieve congestion along I-15.
California state law allows only vehicles oftwo or more occupants or motorcycles to useHOV lanes. In order to allow SOVs to use theI-15 HOV facility as a HOT lane, Chapter 962,Statutes of 1993 (AB 713, Goldsmith), autho-rized a four-year demonstration project from1994 through 1998. This legislation also
Legislative Analyst’s Office
21
required that the lanes maintain a particulartraffic flow. Beginning in 2000, Chapter 481,Statutes of 1999 (SB 252, Kelley) will allowCaltrans and SANDAG to lower the traffic flowstandard moderately and extends the project’ssunset date though 2001.
Characteristics of the I-15 HOT Lane. TheI-15 HOT lane facility consists of an eight-milestretch of two lanes located in the freewaymedian. The lanes operate only during peakhours in the direction of the commute. From5:45 A.M to 9 A.M., all vehicles in the two HOTlanes travel southbound, while from 3 P.M. to7 P.M. they travel northbound. Entry and exitare restricted to the two endpoints of thefacility. Use of the facility is free to carpools oftwo or more occupants, buses, and motor-cycles, while a fee is charged to SOVs. Feescharged to SOVs are deducted from electronictransponders which are attached to a vehicle’swindshield and allow for direct payment from acustomer’s account.
Congestion Pricing Enables Control ofTraffic. The goal of the variable fees is to keepthe lanes free-flowing while maximizing theiruse. Fees are set to maintain a specified trafficflow at all times. The fee, which ranges from50 cents to $4, varies every six minutes accord-ing to the level of congestion in the lanes, asmonitored by loop detectors in the pavement.The fee is displayed on electronic signs beforethe entry to the lanes and typically changes at25 cent intervals. However, if traffic exceedsthe specified traffic flow, such as after a severeaccident, the fee may be raised to $8. If thisfee is not sufficient to deter additional SOVs
HOT Lane Case Study: Interstate 15 in San Diego (continued)
and maintain the traffic flow, the lanes areclosed to SOVs. Revenues from tolls averageabout $5,000 per month and are used tofinance transit service on the corridor.
Large Increase in Usage of Lanes. Cur-rently, the I-15 project has issued over 6,700accounts for SOVs with approximately 11,000transponders in circulation. (Because eachtransponder is assigned to a specific vehicle,some customers, particularly private busi-nesses, have more than one transponder.)
The SOVs currently represent about 20 per-cent of the total vehicles using the I-15 HOTlanes. Since their opening, daily traffic on theHOT lanes has increased by 53 percent, from9,215 vehicles per day in October 1996, to14,096 in July 1999. Interestingly, the addi-tional vehicles on the lanes are primarilycarpools and not SOVs. From fall 1996 to fall1997, the average daily traffic volume on themixed-flow lanes decreased by 2 percent inthe morning peak period and 3 percent in theevening peak period.
Public Response Has Been Favorable. A1997 survey by SANDAG of 1,500 commutersin the San Diego region, including 500 regis-tered HOT lane customers, found that 89 per-cent viewed the program as a success. Addi-tionally, over 70 percent of commuters feltthat the program was fair to both travelers onthe I-15 mixed-flow lanes and on the I-15HOV lanes. Finally, no complaints have beenreceived regarding the dynamic pricingstructure.

22
tolls can be adjusted to deter entry by additional
SOVs into the lane. This method of structuring the
tolls, known as congestion pricing, ensures that
the lane offers a faster and more reliable trip than
the mixed-flow lanes. This is necessary in order for
the lanes to preserve a time savings incentive to
carpool and attract paying customers. Additionally,
it provides an incentive for vehicles to use the
lanes during off-peak hours. The HOT lane con-
cept could also be restricted to certain types of
vehicles, such as trucks or low emission vehicles.
California’s experience with congestion pricing
and HOT lanes in San Diego (see box page 20),
suggests that HOT lanes warrant further applica-
tion on congested corridors that have substantial
excess capacity on HOV lanes.
Are HOT Lanes Unfair? The most common
objection raised against HOT lanes is that they
unfairly discriminate against the poor, by restrict-
ing access to those who can afford to pay for
them. Recent surveys support the view that HOT
lane users are likely to have higher incomes than
non-HOT lane users. A 1997 SANDAG survey
found that SOV users of the I-15 HOT lanes
typically have higher incomes, more years of
education, and are more likely to be homeowners
than drivers in the I-15 mixed-flow lanes.
A survey of the users of the SR 91 Express lanes
in Orange County (where all users, including
HOVs are charged a toll) had similar findings. The
1997 SR 91 survey found that high-income com-
muters were twice as likely as low-income com-
muters to be frequent users of the toll lanes—
23 percent compared to 10 percent. Although this
clearly indicates a relationship between income
and frequency of toll lane use, the survey also
found that 25 percent of the lowest income
travelers (with a household income of less than
$25,000) make frequent (defined as 40 percent or
more of their trips on the corridor) use of the toll
lanes, while 50 percent of the highest income
travelers (with a household annual income of over
$100,000) never or infrequently use the toll lanes.
In addressing the question of fairness, subsidies
or reduced toll rates could be provided to low-
income drivers to ensure that they have equal
access to congestion-free lanes. However, provid-
ing a subsidy or reducing tolls for low-income
drivers could undermine the cost-saving incentive
to carpool. It is important to note that although
HOT lanes only grant access to SOVs that are
willing or able to pay, they remain free for
carpoolers. Additionally, HOT lanes benefit both
their users as well as other vehicles in the mixed-
flow lanes. This is because vehicles using the HOT
lane free up room in the mixed-flow lanes for other
motorists.
CONVERSION TO MIXED-FLOW LANESWhere HOV lanes are greatly underutilized,
one option is to convert them to mixed flow. This
option should be considered when congestion is
not present in the mixed-flow lanes and traffic
projections indicate that neither demand for the
HOV lane nor congestion is likely to increase in
the near term. This was the case in a recent
decision by the Metropolitan Transportation
Commission to decommission an HOV lane on
I-580 which typically carries fewer than 300 vph.
Legislative Analyst’s Office
23
In this case, the HOV lane offered no substantial
time savings since there is no significant conges-
tion in the mixed-flow lanes. Moreover, traffic
forecasts indicate that congestion in this location
is not expected over the next 20 years. Although
the HOV lane did not impede traffic flow in the
mixed-flow lanes, high violation rates and low
HOV volumes in the lanes led the commission to
conclude that conversion to mixed-flow lanes was
the best solution to underutilization.
Congestion Relief From Conversion Is Prob-
ably Short-Lived. The impact of conversion is
more problematic in areas where HOV lanes are
underutilized and the mixed-flow lanes are con-
gested. While conversion would likely result in
some immediate congestion relief by allowing all
vehicles to use the lane, evidence suggests that
this relief would be only temporary. This is be-
cause conversion to mixed flow would induce a
net gain in traffic volume on the corridor, resulting
from a combination of carpools disbanding and
reverting to SOVs, and additional drivers using the
corridor who want to take advantage of the new
capacity.
This conclusion is based on the theory of
induced travel demand which holds that in the
long run (five years or more), expansion of the
transportation system rarely alleviates congestion
because increases in the system’s capacity are
subsequently consumed by drivers’ demand for
better mobility. Recent studies have found evi-
dence to support this view. A 1995 study at
UC Berkeley, based on annual data from 30
California urban counties from 1973 to 1990,
found that a 1 percent increase in lane miles
induces a 0.9 percent increase in VMT in metro-
politan areas within five years. Another study
conducted by the EPA in 1999 found that about
25 percent of new VMT can be attributed to
induced demand. Taken together, these findings
suggest that conversion of the state’s HOV lanes to
mixed-flow may provide short-term congestion relief,
but would be unlikely to provide long-term benefits.
State Does Not Have Authority to Unilaterally
Convert HOV Lanes to Mixed-Flow. HOV lanes
are often approved as specific transportation
control measures in the SIP. As a result, conver-
sion of HOV lanes to mixed flow would require
that the impact on regional air quality of such a
conversion be assessed, in order to ensure the
continued viability of the SIP. Any reevaluation of
air quality conformity of the SIP would require
input and review by multiple agencies, including
Caltrans, RTPAs, air quality management districts,
CARB, FHWA, and the EPA. Additionally, where
exceptions to design standards have been granted
by FHWA for HOV lanes, conversion to mixed-
flow lanes would require reassessment by FHWA
of the design standards. As a result, the state does
not have the authority to unilaterally convert
existing HOV lanes to mixed-flow lanes.
Similarly, on projects where federal funds were
used, the state cannot convert HOV lanes to
mixed-flow lanes without FHWA approval. Be-
cause many HOV lane segments have been
constructed using federal funds for congestion
mitigation and air quality improvement, conver-
sion to mixed-flow lanes would disqualify the
Acknowledgments
This report was prepared by Rebecca Long,under the supervision of Dana Curry. TheLegislat ive Analyst’s Office (LAO) is anonpartisan office which provides fiscal andpolicy informat ion and advice to theLegislature.
LAO Publications
To request publications call (916) 445-2375.
This report and others, as well as an E-mailsubscription service, are available on theLAO’s internet site at www.lao.ca.gov. TheLAO is located at 925 L Street, Suite 1000,Sacramento, CA 95814.
v
24
project from using these funds. The amount of any
payback of federal funds would be determined by
FHWA on a case-by-case basis. Caltrans estimated
that the amount could be over $2 billion if all
HOV lanes were converted to mixed flow. The
FHWA agreed to waive repayment of the federal
funds used to construct the HOV lanes in New
Jersey. However, this was a one-time waiver and
does not indicate a general policy with respect to
HOV lane conversion. Thus far, it appears that
exceptions would be granted by FHWA for HOV
lanes which, after operating for five years, carry
fewer person-trips than a typical mixed-flow lane.
Index to Acronyms
AVO Average Vehicle OccupancyCAAA Clean Air Act AmendmentsCARB California Air Resources BoardCMA Congestion Management AgencyEPA United States Environmental
Protection AgencyFHWA United States Federal Highway
AdministrationHOT High Occupancy TollHOV High Occupancy VehicleILEV Inherently Low Emission Vehicle
MTC Metropolitan Transportation CommissionNJDOT New Jersey Department of TransportationRTPA Regional Transportation Planning AgencySANDAG San Diego Association of GovernmentsSIP State Implementation PlanSOV Single Occupancy VehicleTCM Transportation Control MeasureTDM Transportation Demand ManagementULEV Ultra Low Emission VehicleVMT Vehicle Miles Traveled
CONCLUSIONHOV lanes are currently one of the primary
tools that the state uses to relieve congestion and
improve air quality. Given annual increases in
congestion and plans to double the number of
HOV lanes over the next 20 years, we recom-
mend that the Legislature, Caltrans, and RTPAs
consider the options outlined above. This should
help to ensure that the freeway capacity utilized
by HOV lanes is managed most efficiently and
that any expansion to the HOV lane system be
closely tied to evidence that the lanes are achiev-
ing their goals.