evaluating land-use change scenarios for the puget sound
TRANSCRIPT

U.S. Department of the Interior U.S. Geological Survey
Evaluating Land-Use Change Scenarios for the Puget Sound Basin, Washington, within the Ecosystem Recovery Target Model-Based Framework
By Miguel L. Villarreal, William B. Labiosa, and Danielle Aiello
Open-File Report 2017–1057

U.S. Department of the Interior RYAN K. ZINKE, Secretary
U.S. Geological Survey William H. Werkheiser, Acting Director
U.S. Geological Survey, Reston, Virginia: 2017
For more information on the USGS—the Federal source for science about the Earth, its natural and living resources, natural hazards, and the environment—visit https://www.usgs.gov/ or call 1–888–ASK–USGS (1–888–275–8747).
For an overview of USGS information products, including maps, imagery, and publications, visit https://store.usgs.gov.
Any use of trade, firm, or product names is for descriptive purposes only and does not imply endorsement by the U.S. Government.
Although this information product, for the most part, is in the public domain, it also may contain copyrighted materials as noted in the text. Permission to reproduce copyrighted items must be secured from the copyright owner.
Suggested citation: Villarreal, M.L., Labiosa, W.B, and Aiello, D., 2017, Evaluating land-use change scenarios for the Puget Sound Basin, Washington, within the ecosystem recovery target model-based framework: U.S. Geological Survey Open-File Report 2017–1057, 14 p., https://doi.org/10.3133/ofr20171057.
ISSN 2331-1258 (online)

iii
Acknowledgments
We thank Ken Pierce of the Washington Department of Fish and Wildlife for his help in clarifying the techniques and approaches for interpreting the Puget Sound Watershed Characterization Model (Wilhere and others, 2013) within the ecosystem recovery target developed by the Puget Sound Partnership. We also thank the Land Change Science Program of the U.S. Geological Survey for funding this research.

iv
Contents Acknowledgments .......................................................................................................................................... iii Abstract ......................................................................................................................................................... 1 Introduction .................................................................................................................................................... 1
Modeling Approach .................................................................................................................................... 3 Caveats ...................................................................................................................................................... 3
Methods and Datasets ................................................................................................................................... 3 Ecologically Important Lands ..................................................................................................................... 3 ENVISION Growth Scenarios .................................................................................................................... 4 Analysis ...................................................................................................................................................... 4
Results ........................................................................................................................................................... 5 Conclusions ................................................................................................................................................. 13 References Cited ......................................................................................................................................... 14
Figures 1. Map of the Puget Sound Basin, Washington, region showing counties, major cities, and waterways. ... 2
2. Map of the Puget Sound Basin, Washington, showing area of projected development (undeveloped land use/land cover, in 2000 that changed to developed in 2060) for the status-quo growth scenario intersected with the four ecological-value/development pressure categories ...................................... 6 3. Map of the Puget Sound Basin, Washington, showing area of projected development (undeveloped land use/land cover in 2000 that changed to developed in 2060) for the managed-growth scenario intersected with the four ecological-value/development pressure categories ...................................... 7 4. Map of the Puget Sound Basin, Washington, showing area of projected development (undeveloped land use/land cover in 2000 that changed to developed in 2060) for the unconstrained-growth scenario intersected with the four ecological-value/development pressure categories ....................... 8 5. Graph showing the total area (in square kilometers) of land in the Puget Sound Basin, Washington, that changed from undeveloped to developed between 2000 and 2060 for each growth scenario projection ............................................................................................................................................ 9 6. Graph showing the percent change in the Puget Sound Basin, Washington, of undeveloped to developed land from the status-quo growth scenario for the managed growth and unconstrained growth scenarios between 2000 and the 2060 projections under each of the ecological value/development pressure categories ............................................................................................. 9
Tables 1. Percentage of land-use/land-cover change in the Puget Sound Basin, Washington, for the three growth scenarios, within the ecologically important/high development pressure category. ................ 10 2. Percentage of land-use/land-cover change in the Puget Sound Basin, Washington, for the three growth scenarios, within the ecologically important/low development pressure category. ................. 10 3. Percentage of land-use/land-cover change in the Puget Sound Basin, Washington, for the three growth scenarios, within the low ecological importance/high development pressure category. ......... 11 4. Percentage of land-use/land-cover change in the Puget Sound Basin, Washington, for the three growth scenarios, within the low ecological importance/low development pressure category. ........... 13

v
Abbreviations and Acronyms AU Assessment unit EIHP Ecologically important/high development pressure EILP Ecologically important/low development pressure EVDP Ecological value/development pressure LIHP Low ecological importance/high development pressure LILP Low ecological importance/low development pressure MG Managed growth NOAA National Oceanic and Atmospheric Administration OSU Oregon State University PSEPM Puget Sound Ecosystem Portfolio Model PSNERP Puget Sound Nearshore Ecosystem Restoration Project PSP Puget Sound Partnership SQ Status quo UG Unconstrained growth UGA Urban growth area USGS U.S. Geological Survey
1
Evaluating Land-Use Change Scenarios for the Puget Sound Basin, Washington, within the Ecosystem Recovery Target Model-Based Framework
By Miguel L. Villarreal, William B. Labiosa, and Danielle Aiello
Abstract The Puget Sound Basin, Washington, has experienced rapid urban growth in recent decades,
with varying impacts to local ecosystems and natural resources. To plan for future growth, land managers often use scenarios to assess how the pattern and volume of growth may affect natural resources. Using three different land-management scenarios for the years 2000–2060, we assessed various spatial patterns of urban growth relative to maps depicting a model-based characterization of the ecological integrity and recent development pressure of individual land parcels. The three scenarios depict future trajectories of land-use change under alternative management strategies—status quo, managed growth, and unconstrained growth. The resulting analysis offers a preliminary assessment of how future growth patterns in the Puget Sound Basin may impact land targeted for conservation and how short-term metrics of land-development pressure compare to longer term growth projections.
Introduction The Puget Sound Basin, Washington, contains approximately 4,000 kilometers of shoreline,
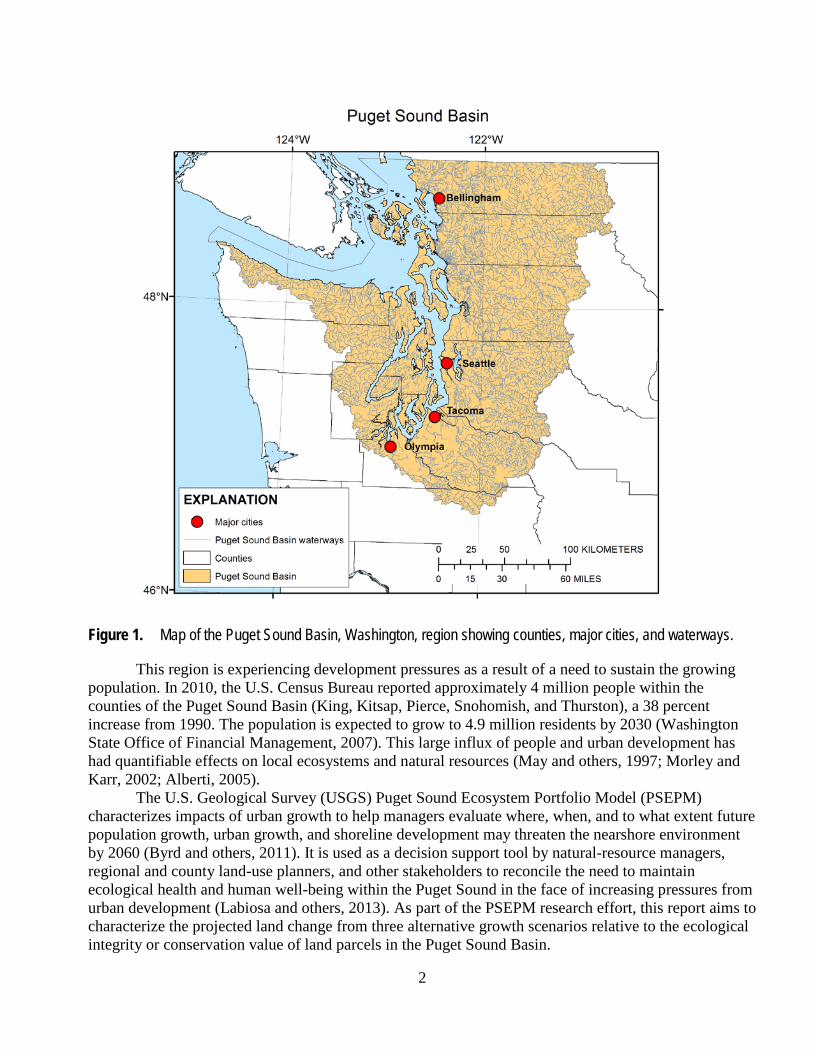
which includes bluffs, beaches, mudflats, kelp and eelgrass beds, salt marshes, gravel spits, and estuaries. This highly biodiverse and productive zone supports variety of valuable ecosystem services, such as shellfishing, fin fishing, shoreline recreation, and cultural activities like subsistence fishing by local tribes (Ruckelshaus and McClure, 2007). The nearshore ecosystem supplies the substrate for eelgrass and kelp beds, spawning habitats for forage fish, supports shellfish production, and provides habitat for juvenile salmon. Thousands of streams and rivers drain a land area of about 35,500 square kilometers into Puget Sound (fig. 1), which is designated by the U.S. Environmental Protection Agency (EPA) as an Estuary of National Significance.
2
Figure 1. Map of the Puget Sound Basin, Washington, region showing counties, major cities, and waterways.
This region is experiencing development pressures as a result of a need to sustain the growing population. In 2010, the U.S. Census Bureau reported approximately 4 million people within the counties of the Puget Sound Basin (King, Kitsap, Pierce, Snohomish, and Thurston), a 38 percent increase from 1990. The population is expected to grow to 4.9 million residents by 2030 (Washington State Office of Financial Management, 2007). This large influx of people and urban development has had quantifiable effects on local ecosystems and natural resources (May and others, 1997; Morley and Karr, 2002; Alberti, 2005).
The U.S. Geological Survey (USGS) Puget Sound Ecosystem Portfolio Model (PSEPM) characterizes impacts of urban growth to help managers evaluate where, when, and to what extent future population growth, urban growth, and shoreline development may threaten the nearshore environment by 2060 (Byrd and others, 2011). It is used as a decision support tool by natural-resource managers, regional and county land-use planners, and other stakeholders to reconcile the need to maintain ecological health and human well-being within the Puget Sound in the face of increasing pressures from urban development (Labiosa and others, 2013). As part of the PSEPM research effort, this report aims to characterize the projected land change from three alternative growth scenarios relative to the ecological integrity or conservation value of land parcels in the Puget Sound Basin.

3
Modeling Approach Spatially explicit land-use scenarios produced by Oregon State University (OSU) and parcel-
based ecological value maps (based on measures of conservation value and development pressures) produced by the PSEPM were combined as pseudo-data to produce new maps, which address projected growth in the Puget Sound area for the 60- year period of 2000–2060. Land-use scenarios (three sets) were joined with ecological-value maps to determine where new development is projected to occur in different classes of ecologically sensitive areas and to compare the differences among the three scenarios.
The first set of spatially explicit land-use scenario outputs were produced by Oregon State University (OSU) and consist of decadal land-use projections for the Puget Sound through 2060 (Bolte and others, 2010). The datasets include three scenarios—(1) status quo, which assumes current trends continue into the future; (2) managed growth, which assumes an aggressive set of policies are enacted to target growth to existing urban areas while protecting a variety of conservation lands; and (3) unconstrained growth, which assumes loose regulations on where development can occur, tending towards low-density expansion patterns.
The second set of spatially explicit model outputs were produced by the Washington Department of Ecology and the Washington Department of Fish and Wildlife and are based on a Puget Sound “watershed characterization” assessment, which classified land-use/cover units based on several metrics that reflect “ecological value” (Wilhere and others, 2013). The watershed assessment was used by the Puget Sound Partnership to bin existing land-use parcels based on “ecological value” classes and “development pressure” classes into four “ecological value/development pressure” (EVDP) categories, allowing the creation of “ecologically important land” classification maps.
Caveats The input datasets and the resulting analysis are not meant to predict the actual conversion of a
particular parcel to an urban land use, but rather to help land managers understand the key drivers and possible regional patterns of urban development. This is a regional-scale assessment and does not attempt to address the effects of land-use change on individual habitats, which are best addressed through finer scale analysis. This work is meant to demonstrate the potential use of spatial data for ecosystem services assessment at a regional scale. Further scenario development and refinement of spatial datasets by partners and stakeholders in the Puget Sound region is needed to support more meaningful analyses.
Methods and Datasets Ecologically Important Lands
The ecologically important lands maps were developed to support “land development and cover indicators” of the Puget Sound Partnership’s (PSP) suite of “vital signs” (http://www.psp.wa.gov/vitalsigns/index.php). Ecological values were modeled within the watershed assessment using data on water resources (water flow and water quality) and habitat (fish and wildlife) in terrestrial, freshwater, and marine shoreline environments within the Puget Sound Basin. The assessments are in map form (vector), where the relative value of land parcels was classified based on multiple indices of conservation value (that is, open-space fragmentation, land use). Relative conservation value was calculated in three stages:

4
1. Land uses were identified (such as commercial forest, agriculture, parks, and designated open space) that maintain natural or quasinatural vegetation to serve as wildlife habitat;
2. The ecological integrity of parcel units was assessed based on the degree to which a site can support and maintain a biological community, which has species composition, diversity, and functional organization comparable to those of natural landscapes in a region; and
3. The landscape integrity of open-space sites was combined with spatial data for priority species. The resulting product was an index of relative conservation value for assessment units (AUs), which were at the parcel scale (for specific details on the methods see Wilhere and others, 2013).
The PSP’s EVDP assessment also identifies parcels under high pressure from development. The EVDP maps are meant to track the fate of ecologically important lands under development pressure in Puget Sound watersheds. The development pressure measure is defined as the proportion of vegetated cover on undeveloped lands identified as under high pressure from development for residential, commercial, and industrial uses, which is converted in a given time period to developed cover. The rate of conversion of vegetated cover was estimated using National Oceanic and Atmospheric Administration (NOAA) Coastal Change Analysis Program data from 30-meter Landsat satellite imagery. The conversion rate is calculated over a 5-year period from 2006 to 2011. Areas under high pressure from development included parcels with less than 35-percent impervious surfaces in private ownership with limited or no ownership-based regulatory protection. For example, undeveloped parcels with significant riparian land would be included in the high-pressure category, despite protections due to critical-areas designations. On the basis of a combination of the ecological-importance and development-pressure indicators, each parcel was categorized into one of the following EVDP categories:
1. Ecologically important/high development pressure (EIHP) 2. Ecologically important/low development pressure (EILP) 3. Low ecological importance/high development pressure (LIHP) 4. Low ecological importance/low development pressure (LILP)
ENVISION Growth Scenarios The ENVISION model was used by Bolte and Vache (2010) to create three alternative future
landscape projection scenarios (2000–2060) to support the evaluation of future land-use change implications for the Puget Sound Nearshore Ecosystem Restoration Project (PSNERP; http://www.pugetsoundnearshore.org). ENVISION is a spatially and temporally explicit modeling toolset designed to facilitate alternative futures analyses. Details on the input data, model parameters, and assumptions of the Puget Sound ENVISION scenarios can be found in the Bolte and Vache (2010). Their alternative future landscape projection scenarios are:
1. Status quo (SQ), with current trends continuing into the future. 2. Managed growth (MG), characterized by aggressive land-use management policies to protect
and restore ecosystem functions, with particular focus in urban growth areas (UGAs) and near centers of regional growth.
3. Unconstrained growth (UG), characterized by limited protection of ecosystem functions through relaxed land use management policies.
Analysis For each of Bolte and Vache’s (2010) growth scenarios (SQ, MG, and UG), we created a land-
cover change file of “undeveloped” to “developed” between 2000 and 2060 and these areas were

5
intersected with the EVDP categories for the first set of overlays. The overlays resulted in the area in square kilometers of projected development within the four EVDP categories. The area of each land cover class that converted to developed is quantified within each EVDP category for each scenario.
Results Maps depicting projected development for each of the three growth scenarios illustrate spatial
patterns of development on the four EVDP categories (figs. 2–4). A majority of the land in the Puget Sound region was considered EILP, and as a consequence, for all three growth scenarios a majority of land that went from undeveloped in 2000 to developed in 2060 occurred in the EILP category (fig. 4). However, within the EILP category there was considerable difference in area converted between the MG scenario and the SQ and UG scenarios (fig. 4). The SQ and UG scenarios are very similar in terms of spatial patterning and amount of land converted to developed (figs. 2 and 4), this is particularly pronounced in the two ecologically important categories (fig. 4). One difference between the SQ and UG scenarios occurs within the LIHP category, where more land is converted to developed under the SQ scenario (fig. 2). The main difference between the two scenarios is the pattern of infill under the SQ scenario, which occurs within the existing urban footprint of Seattle and Tacoma (fig. 1). Patterns of unconstrained growth occur on the peripheries of the developed areas (fig. 3) rather than inside and therefore more area is within the ecologically important categories (fig. 4).

6
Figure 2. Map of the Puget Sound Basin, Washington, showing area of projected development (undeveloped land use/land cover, in 2000 that changed to developed in 2060) for the status-quo growth scenario intersected with the four ecological-value/development pressure categories. The developed class includes areas that remained developed throughout the growth scenarios. The undeveloped class includes areas that did not change to a developed class by the 2060 projection.

7
Figure 3. Map of the Puget Sound Basin, Washington, showing area of projected development (undeveloped land use/land cover in 2000 that changed to developed in 2060) for the managed-growth scenario intersected with the four ecological-value/development pressure categories. The developed class includes areas that remained developed throughout the growth scenarios. The undeveloped class includes areas that did not change to a developed class by the 2060 projection.

8
Figure 4. Map of the Puget Sound Basin, Washington, showing area of projected development (undeveloped land use/land cover in 2000 that changed to developed in 2060) for the unconstrained-growth scenario intersected with the four ecological-value/development pressure categories. The developed class includes areas that remained developed throughout the growth scenarios. The undeveloped class includes areas that did not change to a developed class by the 2060 projection.
Comparison of MG and UG relative to the SQ scenario shows that the MG scenario would have considerably less impact on all ecological value categories (fig. 5). UG, although similar to SQ, shows more than 20 percent less land converted in the LIHP category (fig. 6).

9
Figure 5. Graph showing the total area (in square kilometers) of land in the Puget Sound Basin, Washington, that changed from undeveloped to developed between 2000 and 2060 for each growth scenario projection (see figs. 2–4) within each ecological value/development pressure category (EIHP, ecologically important/high development pressure; EILP, ecologically important/low development pressure; LILP, low ecological importance/high development pressure; LIHP, low ecological importance/low development pressure).
Figure 6. Graph showing the percent change in the Puget Sound Basin, Washington, of undeveloped to developed land from the status-quo growth scenario for the managed growth and unconstrained growth scenarios between 2000 and the 2060 projections under each of the ecological value/development pressure categories (EIHP, ecologically important/high development pressure; EILP, ecologically important/low development pressure; LILP, low ecological importance/high development pressure; LIHP, low ecological importance/low development pressure). %, percent.

10
Conversion rates within the EVDP categories varied by land-cover class. For the EIHP category across all three scenarios, most conversations came from barren land, cultivated crops, and hay/pasture (table 1). Other classes with considerable changes were deciduous forest, herbaceous, and mixed forest. Woody wetlands declined by 16 percent in the UG scenario and 7 percent in the SQ scenario but did not decline in the MG scenario (table 1). Likewise, emergent herbaceous wetland declined by 21 percent in the UG scenario and 9 percent in the SQ scenario but did not decline in the MG scenario (table 1).
Table 1. Percentage of land-use/land-cover change in the Puget Sound Basin, Washington, between 2000 and 2060 for the three growth scenarios, within the ecologically important/high development pressure category. [%, percent]
Land-cover class
Growth scenario Managed growth
Status quo
Unconstrained growth
Barren land -33% -52% -54% Cultivated crops -33% -54% -58% Deciduous forest -7% -14% -12% Developed, high intensity 24% 56% 45% Developed, low intensity 17% 78% 39% Developed, medium intensity 482% 365% 913% Developed, open space 20% 61% 17% Emergent herbaceous wetland 0% -9% -21% Evergreen forest -5% -8% -7% Hay/pasture -16% -26% -28% Herbaceous -6% -10% -10% Mixed forest -7% -11% -9% Open water -1% -2% -2% Snow/ice 0% 0% 0% Shrub/scrub -5% -9% -10% Woody wetlands 0% -7% -16%
For the EILP category across all three scenarios, most conversations came from cultivated crops,
deciduous forest, mixed forest, herbaceous, scrub/shrub and evergreen forest (table 2). Similar to the EIHP category, woody wetlands declined by 26 percent in the UG scenario and 12 percent in the SQ scenario but did not decline in the MG scenario (table 2). Likewise, emergent herbaceous wetland declined by 20 percent in the UG scenario and 8 percent in the SQ scenario but did not decline in the MG scenario (table 2).
Table 2. Percentage of land-use/land-cover change in the Puget Sound Basin, Washington, between 2000 and 2060 for the three growth scenarios, within the ecologically important/low development pressure category. [%, percent]
Land-cover class
Growth scenario Managed growth
Status quo
Unconstrained growth
Barren land -3% -6% -6% Cultivated crops -20% -33% -32% Deciduous forest -17% -35% -35%

11
Land-cover class
Growth scenario Managed growth
Status quo
Unconstrained growth
Developed, high intensity 83% 5% 233% Developed, low intensity 1,190% 3,713% 1,728% Developed, medium intensity 7,585% 5,257% 22,665% Developed, open space 185% 926% 264% Emergent herbaceous wetland 0% -8% -20% Evergreen forest -7% -15% -15% Hay/pasture -13% -20% -23% Herbaceous -12% -23% -24% Mixed forest -16% -31% -32% Open water -6% -8% -11% Snow/ice 0% 0% 0% Shrub/scrub -11% -23% -24% Woody wetlands 0% -12% -26%
For the LIHP category across all three scenarios, most conversations came from cultivated crops,
barren land, hay/pasture, and mixed deciduous forest, and hay/pasture (table 3). Deciduous forest declined by 11 percent in the MG scenario and 15 percent in the SQ scenario but declined by only 4 percent in the UG scenario. Similar patterns exist for mixed forest and evergreen forest (table 3). Woody wetlands increased in the MG (11 percent) and SQ scenarios (3 percent) but declined 4 percent in the UG scenario. Emergent herbaceous wetland increased 7 percent in the MG scenario but declined slightly in both the SQ (2 percent) and UG (7 percent) scenarios (table 3).
Table 3. Percentage of land-use/land-cover change in the Puget Sound Basin, Washington, between 2000 and 2060 for the three growth scenarios, within the low ecological importance/high development pressure category. [%, percent]
Land-cover class
Growth scenario Managed growth
Status quo
Unconstrained growth
Barren land -53% -61% -56% Cultivated crops -43% -52% -57% Deciduous forest -11% -15% -4% Developed, high intensity 7% 22% 10% Developed, low intensity -37% -22% -29% Developed, medium intensity 136% 118% 145% Developed, open space 31% 30% 15% Emergent herbaceous wetland 7% -2% -7% Evergreen forest -9% -12% -5% Hay/pasture -23% -27% -32% Herbaceous -3% -5% -6% Mixed forest -10% -13% -4% Open water -1% -2% -2%

12
Land-cover class
Growth scenario Managed growth
Status quo
Unconstrained growth
Snow/ice 0% 0% 0% Shrub/scrub -2% -4% -4% Woody wetlands 11% 3% -4%
For the LILP category across all three scenarios, most conversations came from cultivated crops
and hay/pasture, with only slight decreases in evergreen forest, deciduous forest, herbaceous, and shrub/ scrub (table 4). Woody wetlands and emergent herbaceous wetland decreased only in the UG scenario (table 4).

13
Table 4. Percentage of land-use/land-cover change in the Puget Sound Basin, Washington, between 2000 and 2060 for the three growth scenarios, within the low ecological importance/low development pressure category. [%, percent]
Land-cover class
Growth scenario Managed growth
Status quo
Unconstrained growth
Barren land -1% -1% -1% Cultivated crops -30% -29% -17% Deciduous forest -5% -7% -4% Developed, high intensity 4% 12% 13% Developed, low intensity -7% 17% 1% Developed, medium intensity 113% 107% 190% Developed, open space 14% 32% 11% Emergent herbaceous wetland 6% 1% -3% Evergreen forest -3% -8% -8% Hay/pasture -18% -20% -23% Herbaceous -2% -3% -3% Mixed forest -6% -9% -5% Open water -1% -1% -1% Snow/ice 0% 0% 0% Shrub/scrub -5% -9% -10% Woody wetlands 5% 5% -2%
Conclusions We have demonstrated the use of land-use change scenarios to project potential land-use
conversions within the different classes of ecological value/development pressure, which are used within the land-use change target framework used by the PSP. Ideally, this analysis would support the exploration of possible regional and subregional land-use changes within the context of the PSP’s land-use change target. However, the ENVISION scenarios developed to support the PSNERP were not intended to be interpreted subregionally, so the results presented here are intended to be illustrative of what could be done with subregionally meaningful land-use change scenarios. This work should be viewed as a proof-of-concept that could be built on for a more rigorous analysis. With this goal in mind, we provide our observations from the analysis.
The MG scenario, which assumes policies intended to concentrate growth (Bolte and Vache, 2010), showed smaller amounts of land conversions relative to the other scenarios and had associated lower growth in the EIHP and EILP lands by 40–50 percent over the SQ scenario. Wetlands in particular appear to have a high risk of conversion under the UG and SQ scenarios.
The EVDP dataset developed by the Washington Department of Fish and Wildlife (Wilhere and others, 2013) and used for the PSP’s vital-signs assessments provides a contemporary measure of development pressure on lands of different conservation value. The three ENVISION scenarios, particularly the SQ and the UG scenarios, suggest (with the caveats already provided) that by 2060 ecologically important lands that are currently considered to have low development pressure may experience considerable conversion of natural land cover to developed. These results demonstrate the usefulness of considering spatially explicit scenarios of land-use change to explore questions about

14
whether or not we should expect land-use change recovery goals to be met under different recovery strategies.
References Cited Alberti, M., 2005, The effects of urban patterns on ecosystem function: International Regional Science
Review, v. 28, no. 2, p. 168-192. [Also available at https://doi.org/10.1177/0160017605275160.] Bolte J.P., and Vache, K., 2010, Envisioning Puget Sound alternative futures: Oregon State University,
50 p. Byrd, K.B., Kreitler, J.R., and Labiosa, W.B., 2011, Tools and methods for evaluating and refining
alternative futures for coastal ecosystem management—The Puget Sound Ecosystem Portfolio Model: U.S. Geological Survey Open-File Report 2011–1279, 47 p., accessed April 4, 2017, at http://pubs.usgs.gov/of/2011/1279/.
Labiosa, W.B., Forney, W.M., Esnard, A.-M., Mitsova-Boneva, D., Bernknopf, R., Hearn, P., Hogan, D., Pearlstine, L., Strong, D., Gladwin, H., and Swain, E., 2013, An integrated multi-criteria scenario evaluation web tool for participatory land-use planning in urbanized areas—The Ecosystem Portfolio Model: Environmental Modelling & Software, v. 41, p. 210–222. [Also available at https://doi.org/10.1016/j.envsoft.2012.10.012.]
May, C.W., Horner, R.R., Karr, J.R., Mar, B.W., and Welch, E.B., 1997, Effects of urbanization on small streams in the Puget Sound lowland ecoregion: Watershed Protection Techniques, v. 2, p. 483–494.
Morley, S.A., and Karr, J.R., 2002. Assessing and restoring the health of urban streams in the Puget Sound basin: Conservation Biology, v. 16, no. 6, p. 1498–1509. [Also available at https://doi.org/10.1046/j.1523-1739.2002.01067.x.]
Ruckelshaus, M.H., and McClure, M.M., 2007, Sound Science—Synthesizing ecological and socioeconomic information about the Puget Sound ecosystem: Washington, D.C., U.S. Department of Commerce, Silver Springs, Md., National Oceanic and Atmospheric Administration, National Marine Fisheries Service, and Seattle, Wash., Northwest Fisheries Science Center, 93 p.
Washington State Office of Financial Management, 2007, Final 2007 GMA population projections (RCW 43.62.035): Olympia, Wash., Washington State Office of Financial Management, Forecasting Division, p. 51–56, accessed April 4, 2017, at http://www.ofm.wa.gov/pop/gma/pugetsound.pdf.
Wilhere, G.F., Quinn, T., Gombert, D., Jacobson, J., and Weiss, A., 2013, Puget Sound watershed characterization, vol. 2—A coarse-scale assessment of the relative value of small drainage areas and marine shorelines for the conservation of fish and wildlife habitats in Puget Sound Basin: Olympia, Wash., Washington Department Fish and Wildlife, Habitat Program, 194 p., accessed April 4, 2017, at https://doi.org/10.13140/RG.2.2.26736.25609.

ISSN 2331-1258 (online) https://doi.org/10.3133/ofr20171057