evaluating constructability and properties of warm mix … · evaluating constructability and...
TRANSCRIPT

Final Report
Evaluating Constructability and Properties of
Warm Mix Asphalt
Submitted to
The Office of Materials and Research The Georgia Department of Transportation
Prepared By
Dr. James Tsai and Dr. James Lai Georgia Institute of Technology Atlanta, Georgia 30332-0355
Tel: (912) 963-6777; (770) 416-9805
June 2010

1. Report No.: FHWA-GA-10-0904
2. Government Accession No.:
3. Recipient's Catalog No.:
4. Title and Subtitle: Evaluating Constructability and Properties of Warm Mix Asphalt
5. Report Date: June 2010
6. Performing Organization Code:
7. Author(s): James S. Lai, James Y. Tsai and Zhaohua Wang
8. Performing Organ. Report No.: 09-04
9. Performing Organization Name and Address: Dr. James Lai and Dr. James Tsai Georgia Institute of Technology Atlanta, Georgia 30332-0355
10. Work Unit No.:
11. Contract or Grant No.:
12. Sponsoring Agency Name and Address: Georgia Department of Transportation Office of Materials & Research 15 Kennedy Drive Forest Park, GA 30297-2534
13. Type of Report and Period Covered: Final; September 2009 – June 2010 14. Sponsoring Agency Code:
15. Supplementary Notes: 16. Abstract:
This report presents the second pilot study initiated by the Georgia Department of Transportation (GDOT) for assessing the potential use of warm mix asphalt (WMA) mixes in Georgia highway pavements. The pilot study included paving three different WMA mixes (the Evotherm WMA (developed by MeadWestvaco Co.), the Rediset WMA (developed by AkzoNobel) and the Cecabase RT WMA (developed by CECA)) and a 9.5 mm Superpave control mix. The three WMA mixes for the test sections used the same 9.5 mm Superpave mix design. The main objective of this research study was to assess the constructability of these three WMA mixture types.
All the asphalt mixes were produced by an Astec continuous drum plant with a production rate of 220 tons per hour. The production temperature for the 9.5 mm Superpave mix was 310 oF and that for the Evotherm, Rediset and Cecabase RT WMA were 260 oF, 280 oF and 260 oF respectively.
The paving of 9.5mm Superpave mix was quite smooth and without any problem. The paving of Evotherm WMA mix was also considered acceptable though occasional blemish occurred. The paving of Rediset WMA mix was considered unacceptable with many blemishes occurring behind the paver. Material Transfer Vehicle (MTV) was used during the paving of the Evotherm WMA and the Rediset WMA. No MTV was used during the paving of Cecabase RT WMA mix and many cold asphalt clumps were presented in the hopper and auger chamber. The reasons that the three WMA test sections didn’t achieve the desired paving quality as the control section might be due to the fact that either the WMA additive dosage rates used were insufficient or the introduction of WMA additive during the mixing process was ineffective.
A series of laboratory tests were performed on the three WMA mixes and the control mix that were collected from the asphalt plant during the construction, and the cores that were taken from the four test sections after construction. The tests and mix properties evaluated included, basic mix properties, moisture susceptibility, APA rutting tests, Hamburg tests, fatigue tests, and bond strength tests.
Recommendations for improving the quality of the WMA paving operation and performance were offered.
17. Key Words: Warm Mix Asphalt, Bituminous Construction
18. Distribution Statement:
19. Security Classification (of this report): Unclassified
20. Security Classification (of this page): Unclassified
21. Number of Pages:
130
22. Price:
Form DOT 1700.7 (8-69)

i
TABLE OF CONTENTS
GLOSSARY OF ABBREVIATIONS ............................................................................ iii
LIST OF FIGURES ......................................................................................................... iv
LIST OF TABLES .............................................................................................................v
EXECUTIVE SUMMARY ............................................................................................ vii
Background ................................................................................................................... vii
Objective of Proposed Research Program ..................................................................... vii
Major Findings ............................................................................................................. viii
Recommendations .......................................................................................................... xi
Chapter 1 INTRODUCTION........................................................................................1
1.1 Background .......................................................................................................... 1
1.2 Objective and Pilot Test Program ........................................................................ 2
1.3 Organization of Report ......................................................................................... 3
Chapter 2 PREPARATION AND PRE-CONSTRUCTION ACTIVITIES ....... ......4
2.1 Development of Pilot Test Plan ........................................................................... 4
2.2 Description of Evotherm, Rediset and Cecabase RT WMA Mixes ..................... 4
2.3 WMA and HMA Material Sources and Properties .............................................. 5
2.4 Mix Design ........................................................................................................... 6
Chapter 3 ASSESSING ASPHALT PLANT AND PAVING OPERATIONS DURING CONSTRUCTION ................................................................8
3.1 Locations of Test Section Sites ............................................................................ 8
3.2 Asphalt Plant and Mix Production ....................................................................... 9
3.3 Paving Operations of Test Sections ................................................................... 14
3.4 Discussions and Conclusions ............................................................................. 28
Chapter 4 POST-CONSTRUCTION EVALUATION .............................................31
4.1 Basic Asphalt Mix Properties ............................................................................. 31
4.2 Moisture Susceptibility Tests ............................................................................. 33
4.3 APA Test ............................................................................................................ 33
4.4 Bond Strength Test ............................................................................................. 34
4.5 Assessment of Short Term Aging Effect of Asphalt Binders ............................ 34

ii
4.6 Fatigue Test ........................................................................................................ 35
4.7 Hamburg Wheel-Tracking Test .......................................................................... 37
4.8 Discussions and Conclusions ............................................................................. 38
Chapter 5 EVALUATION OF WARM MIX HYDROCARBON EMISSION ......4 1
5.1 Introduction ........................................................................................................ 41
5.2 Measurement Approach ..................................................................................... 41
5.3 Results ................................................................................................................ 45
5.4 Conclusions ........................................................................................................ 47
Chapter 6 CONCLUSIONS AND RECOMMENDATIONS ...................................48
6.1 Conclusions ........................................................................................................ 48
6.2 Recommendations .............................................................................................. 51
REFERENCES .................................................................................................................53
APPENDIX A MIX DESIGN AND PRODUCTION ................................................54
APPENDIX B LABORATORY TEST RESULTS .....................................................66
APPENDIX C WARM-MIX ASPHALT HYDROCARBON EMISSIONS SCOPING STUDY ...........................................................................................................91

iii
GLOSSARY OF ABBREVIATIONS AC – Asphalt Content
ANOVA – ANalysis Of VAriance
APA – Asphalt Pavement Analyzer
CO – Carbon Monoxide
CO2 – Carbon Dioxide
DAT – Dispersed Asphalt Technology
ET – Emulsion Technology
Evotherm 3G – Third Generation Evotherm
G* – Complex shear modulus
G*/sinδ – Elastic portion of complex shear modulus. δ is the phase angle
Gmb – Bulk specific gravity
Gmm – Maximum specific density
HMA – Hot Mix Asphalt
IRI – International Roughness Index
JMF – Job Mix Formula
MTV – Material Transfer Vehicle
Ndesign – The design number of gyrations required to produce a sample with the same density as that expected in the field
Ninitial – The number of gyrations used as a measure of mixture compactability during construction
Nmax – The number of gyrations required to produce a laboratory density that should never be exceeded in the field.
NOx – Nitrous Oxides
PG – Performance Grading
RAP – asphalt pavement
SO2 – Sulfur Dioxide
S.S.D – Saturated, Surface Dry
TSR – Tensile Strength Ratio
VFA – Voids Filled with Asphalt
VMA – Voids in Mineral Aggregate
VOC – Volatile Organic Compounds
VTM – Voids in Total Mix
WMA – Warm Mix Asphalt
wt% – Weight Percent

iv
LIST OF FIGURES Figure 3-1 Locations of test sections .................................................................................. 8
Figure 3-2 Locations of asphalt plant and test section sites ................................................ 9
Figure 3-3 Blemishes from throw back (Evotherm mix) .................................................. 17
Figure 3-4 Blemishes from throw back (Evotherm mix) .................................................. 17
Figure 3-5 Blemishes from throw back (Evotherm mix) .................................................. 17
Figure 3-6 Blemishes from throw back (Evotherm mix) .................................................. 18
Figure 3-7 IR image on truck load crust (Evotherm mix) ................................................ 18
Figure 3-8 IR image of Evotherm mix behind screed ....................................................... 18
Figure 3-9 Pulling on Rediset WMA test section ............................................................. 20
Figure 3-10 Gearbox stripping on Rediset WMA test section .......................................... 21
Figure 3-11 Blemish on Rediset WMA test section ......................................................... 21
Figure 3-12 Blemish on Rediset WMA test section ......................................................... 21
Figure 3-13 Blemish on Rediset WMA test section ......................................................... 22
Figure 3-14 IR image on truck load crust (Rediset WMA) .............................................. 22
Figure 3-15 IR image of Rediset WMA behind screed .................................................... 22
Figure 3-16 Cold mix clumps of Cecabase RT WMA in hopper ..................................... 23
Figure 3-17 Removal of cold Cecabase RT WMA clumps from hopper ......................... 24
Figure 3-18 Blemish on Cecabase RT test section ........................................................... 24
Figure 3-19 Blemish on Cecabase RT test section ........................................................... 24
Figure 3-20 Pulling on Cecabase RT test section ............................................................. 25
Figure 3-21 IR image on truck load when Cecabase mix was being unloaded ................ 25
Figure 3-22 IR image of Cecabase mix behind screed ..................................................... 25
Figure 3-23 IR image on truck load when mix was unloaded .......................................... 27
Figure 3-24 IR image on placement mat behind the screed.............................................. 27
Figure 3-25 Paving of 9.5 mm Superpave mix ................................................................. 27
Figure 4-1 Fatigue test results ........................................................................................... 36
Figure 4-2 Hamburg test results ........................................................................................ 38

v
LIST OF TABLES Table 2-1 Property of Aggregates ....................................................................................... 5
Table 2-2 Aggregates Used for the Mixes .......................................................................... 6
Table 2-3 Aggregate Gradation and Asphalt Contents ....................................................... 6
Table 2-4 Volumetric Mix Design Data ............................................................................. 7
Table 3-1 Construction Dates and Locations of Test Sections ........................................... 9
Table 3-2 Aggregate Stockpile Moisture Contents ........................................................... 10
Table 3-3 9.5 mm Superpave Mix Plant Production Information .................................... 10
Table 3-4 9.5 mm Superpave Mix QC Test Results at Asphalt Plant............................... 11
Table 3-5 Evotherm WMA Mix Plant Production Information........................................ 11
Table 3-6 Evotherm WMA Mix QC Test Results at Asphalt Plant .................................. 12
Table 3-7 Rediset WMA Mix Plant Production Information ........................................... 12
Table 3-8 Rediset WMA Mix QC Test Results at Asphalt Plant ..................................... 13
Table 3-9 Cecabase RT WMA Mix Plant Production Information .................................. 13
Table 3-10 Cecabase RT WMA Mix QC Test Results at Asphalt Plant .......................... 14
Table 3-11 Weather Condition during Construction ........................................................ 14
Table 3-12 Summary of Laydown /Compaction Information for All Sections ................ 15
Table 3-13 Summary of Evotherm WMA Mix Test Section Paving Information ........... 19
Table 3-14 Summary of Rediset WMA Mix Test Section Paving Information ............... 20
Table 3-15 Summary of Cecabase RT WMA Mix Test Section Paving Information ...... 26
Table 3-16 Summary of 9.5 Superpave Mix Control Section Paving Information .......... 28
Table 3-17 Compare Paving Quality of WMA Mixes with Control mix ......................... 30
Table 4-1 Laboratory Test Programs ................................................................................ 31
Table 4-2 Basic Volumetric Mix Properties ..................................................................... 32
Table 4-3 Aggregation Gradation ..................................................................................... 32
Table 4-4 Moisture Susceptibility Test ............................................................................. 33
Table 4-5 Rutting Susceptibility Test ............................................................................... 34
Table 4-6 Bond Strength Test Results .............................................................................. 34
Table 4-7 Dynamic Shearing Rheometer Test .................................................................. 35
Table 4-8 Fatigue Test ...................................................................................................... 36
Table 4-9 Hamburg Test ................................................................................................... 37

vi
Table 4-10 Summaries of Post-Construction Laboratory Test Results ............................ 38
Table 5-1 VOC Emission Study Conditions ..................................................................... 44
Table 5-2 VOC Measurements at Asphalt Plant – Evotherm WMA ................................ 45
Table 5-3 VOC Measurements at Asphalt Plant and Paving Site–Control Mix ............... 45
Table 5-4 Rediset Additive VOC Measurements ............................................................. 46
Table 5-5 Cecabase RT Additive VOC Measurements .................................................... 47
Table 6-1 Summary of Asphalt Plant Production and Paving Data.................................. 48
Table 6-2 Summaries of Post-Construction Laboratory Test Results .............................. 49

vii
EXECUTIVE SUMMARY
Background
Rising energy costs and increased awareness of emission problems in the production of Hot Mix Asphalt (HMA) have brought attention to the potential benefits of Warm Mix Asphalt (WMA) in the United States. A number of new WMA processes and products have become available that have the capability of reducing the temperatures at which asphalt mixes are produced and paved without compromising the performance of the pavement. These new products can reduce production temperatures by as much as 50°F or more. Lower plant mixing temperatures would reduce the fuel consumption by as much as 30 percent or more and thus reduce the operation costs. Lower plant mixing temperatures would also reduce gas emission, which represents significant cost savings to an asphalt plant for its emission control facility. WMA will also allow longer haul distances and a longer construction season than if the mixes are produced at normal operating temperatures. Lowering the mixing temperature would reduce oxidative hardening of the asphalt and thus could result in improving the pavement’s performance by reduced thermal cracking and block cracking.
However, lowering the mix temperatures, in drying the aggregates and in the mixing
operation, could potentially cause WMA to be more susceptible to moisture damage and rutting. These potential distresses as well as the issues related to the constructability of WMA are important and need to be carefully evaluated to ensure the viability and long term performance of WMA mixes.
Objective of Proposed Research Program
The research study presented in this report was the second pilot study initiated by the Georgia Department of Transportation (GDOT) for assessing the potential use of WMA in Georgia highway pavements. The pilot study included placing pavement test sections using the following three WMA mixes (the Evotherm WMA (developed by MeadWestvaco Co.), the Rediset WMA (developed by AkzoNobel) and the Cecabase RT WMA (developed by CECA)) and a 9.5 mm Superpave control mix. The three WMA test sections and the control section were a part of the 9.5 mm Superpave mix overlay construction project on State Route 42 in Monroe County, Georgia. The project consists of 12.091 miles of milling, inlay, HMA resurfacing, and shoulder reconstruction on State Route 42 beginning North of State Route 74 and extending to State Route 18.
The objective of this research study was to assess these three WMA mixtures through (1) assessing the constructability of the WMA mixes, (2) evaluating the properties of the WMA mixes through laboratory testing of the mixes produced during the construction of the test sections, and (3) conducting initial assessment of the performance of the WMA pavements.

viii
Major Findings
(1) The three WMA mixes studied in this pilot project used the same 9.5 Superpave mix design. The reason for using the same mix design was that the amount of additives used in these three mixes was very small and should not affect the mix characteristics.
(2) The asphalt mixes for the four test sections were produced by the Astec continuous drum plant with a production rate of 220 tons per hour. The relevant mix production and paving data for the four mixes are summarized in Table A below. The quality control testing was performed on the mixes produced in the asphalt plant, and the test results indicated that deviations from the Job Mix Formula (JMF) for the asphalt content and aggregate gradation were within the acceptance limits for all four tested mixes.
Table A Summary of Asphalt Plant Production and Paving Data
Results
Mix Type 9.5 mm
Superpave Evotherm Rediset Cecabase RT
Paving Date 10/30/2009 10/29/2009 11/3/2009 11/4/2009
Tonnage produced 1098.7 ton 1715 ton 1592.05 ton 1696.32 ton
Additive dosage, wt% of mix n/a 0.6% 0.2% 0.44%
Fuel consumption, gal / ton Not available Not available Not available Not available
Mix Temperatures oF -Production 315 260 280 260
-At load out 300 240 - 255 265 - 270 265 - 260
-Behind screed 295 230 – 250 240 - 255 230 - 245
Length of paved test section 0.7 miles 1.3 miles 0.3 miles 1.8 miles
Use MTV no yes yes no
Compacted mat thickness 1 ¼ inch 1 ¼ inch 1 ¼ inch 1 ¼ inch
In-place VTM 5.7% 7.1% 5.8% 5.8%
Surface defects no Occasional blemishes
Frequent blemishes, pulling and stripping
Frequent blemishes and pulling
Time when opened to traffic 2 hrs. 2 hrs. 2 hrs. 2 hrs.
Pavement smoothness 623 mm/km 732 mm/km 845 mm/km 821 mm/km
(3) Paving of the 9.5 mm Superpave mix control section was successful and did not
encounter any problems during the paving operation. Paving of the Evotherm WMA mix was considered acceptable. A Material Transfer Vehicle (MTV) was used in the paving train and had helped improving the paving operation. Even with that, some blemishes still occurred on the asphalt mat behind the screed requiring some hand work to correct them. An MTV was used also in the paving train during the paving of the Rediset WMA mix. However, the paving quality was in general unsatisfactory. Blemishes occurred more frequently behind the screed than the case when Evotherm

ix
mix was used. Paving of the Cecabase RT WMA mix did not utilize an MTV. The quality of paving with the mix produced at 260 oF was poor with a large number of cold mix clumps present in the hopper requiring the paving crew to remove the clumps. Severe blemishes and pulling were observed on the asphalt mat behind the screed.
(4) Compared with the first pilot study conducted in 2008, blemishes occurred much less
frequently for the Evotherm WMA mix test section. Other than the different WMA additive used in this pilot study, use of an MTV in the paving operation had improved the paving quality. However, compared with the 9.5 mm Superpave control section, blemish and pulling still occurred. This would indicate that the WMA additives used in this pilot project were inadequate toward producing the intended effects. This could be due to either of the following two reasons: (1) the applied dosage rates could be insufficient for the three WMA additives used in this pilot project. The adequate dosage rates recommended by the additive suppliers should be validated in a laboratory prior to the field implementation; or (2) the methods for introducing the Rediset and Cecabase RT additives into the mixing operation could be ineffective.
(5) Laboratory tests were performed on the asphalt mix collected from the asphalt plant
during the construction and the cores taken from the four test sections. Table B summarizes the post-construction laboratory test results.
Table B Summary of Post-Construction Laboratory Test Results
9.5 mm
Superpave Evotherm
WMA Rediset WMA
Cecabase RT WMA
Volumetric Properties
-% AC 5.46 5.81 5.88 5.83
-VTM, % 2.3 1.6 1.4 1.9
-VMA, % 14.5 14.7 13.0 13.4
Recovery Binder
-Viscosity, poises 5646 5343 5272 5671
Moisture Susceptibility
-Tensile splitting-control, psi 110.6 85.3 76.9 80.9
-Tensile splitting-conditioned, psi 120.5 99.2 89.7 87.8 -TSR, % 109 116 116 109
APA Rutting, mm 5.78 6.55 5.79 5.93
Hamburg test, Rut @ 10000 cyl., in.
0.40 0.20 0.35 0.53
Bond Strength, psi 208.6 132.2 115.5 127.2
Fatigue Testing
-cyls. to failure 14773 13470 22490 29813
-Stiffness, MPa 1585 2323 1139 951

x
• The air voids for all three WMA mixes compacted at Ndesign (design number of gyrations) of 65 were less than 2.0%, much less than the 4.0% design air voids. Therefore, rutting susceptibility should be closely monitored in the next summer or two on these test sections. The control mix compacted under the same conditions having VTM (Voids in Total Mix) at 2.3% would also indicate this mix has marginal rutting resistance.
• The dynamic shear Rheometer tests were performed on the asphalt binders recovered from the mixes produced at the plant. The results in terms of G* and G*/sinδ indicate that there is no significant difference between the asphalt binder of the control mix and that of the three WMA mixes after the short term aging during the production of the mixes in the asphalt plant.
• Results of the GDT-66 moisture susceptibility tests indicate that the 9.5 mm
Superpave control mix has a higher tensile stability values for both the unconditioned (control) specimens and the conditioned specimens than that of the WMA mixes. The test results also indicate that the moisture conditioned specimens have higher stability values than that of the unconditioned (control) specimens for each type of the mixes used in this pilot test program, including the 9.5 mm Superpave control mix and the three WMA mixes. Thus, the Tensile Strength Ratio (TSR) values are over 100% for each of the four mixes. Regarding the unusual TSR values, one engineer in OMR explained that it happens at times on finer and “tender” mixes such as 9.5 mm mix. It was thought that the conditioning of the testing pills actually stiffens the mix to some extent. In the meantime, given the higher AC contents in conjunction with hydrated lime, the tensile stability for the conditioned specimen becomes higher. The Cecabase RT mix shows moderate stripping with considerable stripping on coarse particles and moderate stripping on fine particles. The other mixes shows only slight stripping. According the GDOT standard (Section 828), all these mixes meet the acceptance requirements with a minimum tensile strength of 60 psi and a minimum TSR of 80%.
• Results from the APA (Asphalt Pavement Analyzer) rutting tests indicate that all
four mixes meet the GDOT acceptance requirements. Evotherm WMA mix has a slightly higher rut depth value than the other three mixes.
• Results from the Hamburg tests indicate that the Evotherm WMA mix has the
lowest rutting and the highest stripping inflection point, and Cecabase RT WMA mix has the highest rutting and the stripping inflection point was close to what Rediset has, which is the lowest one. This indicates that the Cecabase RT WMA mix could be more susceptible to moisture than the other mixes, which is consistent with the finding from the GDT-66 moisture susceptibility tests. Results from this testing showed the Evotherm WMA has much lower total rutting at 10,000 cycles than the other mixes, which is opposite to the finding from the APA rutting test results.
xi
• Results of the bond strength testing show the bond strengths from all the four mixes all exceed 100 psi. The control mix has the highest value of 208 psi and the three WMA mixes have the strengths around 115 psi to 132 psi. Average bond strength of 100 psi is the typical bond strength between HMA pavement layers against slippage failure.
• The fatigue tests were performed on all four mixes following the AASHTO T321-
07 standard. The rankings of cycles to failure from high to low among these four mixes are: Cecabase RT mix, Rediset mix, Control mix and Evotherm mix. An ANOVA was performed on the cycles to failure among the four mixes. The significance level of the ANOVA was 0.05. The result showed that the p-value, about 0.03, is less than the significance threshold of 0.05, but is not exceptionally low (less than 0.01). Thus, we can say that the cycles to failure among the 4 mixes show a statistical difference at a moderate significant level.
(6) A preliminary study was conducted by Georgia Tech Research Institute (GTRI) to
evaluate the relative magnitude of Volatile Organic Compounds (VOC) emissions during the production of WMA and the control mix at the asphalt plant and during the paving operations. Results of the VOC emissions measurements for the four mixes indicate that VOC emissions generated from any of the WMA mixes used in this project at the asphalt plant and at the paving site are not significantly different from that of the control mix.
Recommendations
The following recommendations are offered with an aim toward better understanding and improving the quality of the WMA paving operation and performance. (1) Continuous pavement condition monitoring on the test sections is highly needed to
thoroughly evaluate the actual performance. It is especially important to closely monitor the rutting susceptibility in the next summer or two.
(2) There was problem mixing the additives uniformly into the mixing drum during the test of Rediset. It is recommended to develop a test method to quantitatively measure the percentage of additive applied right after the additives are fully mixed in the drum to ensure the right percentage of additives is introduced uniformly into the drum in the plant.
(3) When WMA is used in a paving project, the following information in addition to that stipulated under GDOT Standard Specifications Section 400.1.03 should be included when the contractor submits the JMF after the contract has been awarded:
• The amount of WMA additive as percent of net binder used in the mix or the percent of the total mix weights used, particularly when Reclaimed Asphalt Pavement (RAP) is used.

xii
• A viscosity vs. temperature chart for the binder incorporating the specified WMA additive dosage.
• The procedure for incorporating the WMA additive into the mix, the mixing temperature and mixing process in the laboratory mixing operations.
• Temperature and duration of aging, if different from the standard for aged at 135oC (275oF) in an oven for 2 hours after mixing and prior to compaction.
• Any deviation from the Superpave mix design procedures.
(4) Submit the proposed JMF for approval at least 4 weeks (instead of 2 weeks) before the beginning the asphalt plant mixing operation. This would allow the Office of Materials and Research (OMR) sufficient time to conduct more thorough mix design verification testing.
(5) It would be desirable to request that the WMA additive supplier conduct the mix
design verification testing based on the JMF, the aggregates, and the binder submitted by the contractor, and forward the verification mix design results to the OMR. It would be highly desirable that the WMA additive suppliers also provide the following information for using the WMA additive during the construction.
• Minimum threshold mix temperature behind the screed • Maximum allowable storage time in silo • Maximum allowable storage time in truck
(6) OMR should perform mix design verification testing based on the JMF, aggregates,
and binder submitted by the contractor and compare the results with those from the WMA additive suppliers. The mixing temperature and the compaction temperature as suggested by the WMA additive suppliers should be carefully evaluated during the laboratory mix design. Workability of the mix should also be carefully evaluated.
(7) It may be desirable to intentionally vary the temperatures of the mix at load out,
behind the screed, and during the holding time to assess the sensitivity of the temperatures and the storage time on the constructability of the WMA mix in the test section of a construction project. This would provide valuable information for the contractor and for the Quality Control Technician during the mainline paving. If the results indicate that the WMA mix used is too sensitive to the temperature variations, the project engineer perhaps should consider requesting the contractor to use a MTV to mitigate the temperature sensitivity of the WMA mix used for the project.
(8) OMR and the Office of Maintenance should cooperate to place additional WMA sections to gain experience of using different types of WMA mixes. The proposed research program for this pilot study presented in this report, including the Post-Construction Laboratory Testing and Evaluation Program, can be used to evaluate the constructability and the properties of the mixes.
1
Chapter 1 INTRODUCTION
1.1 Background
Rising energy costs and increased awareness of emission problems in the production of Hot Mix Asphalt (HMA) have brought attention to the potential benefits of Warm Mix Asphalt (WMA) in the United States. A number of new WMA processes and products have become available that have the capability of reducing the temperature at which asphalt mixes are produced and paved without compromising the performance of the pavement. These new products can reduce production temperatures by as much as 50°F or more (1-6). Lower plant mixing temperatures would reduce fuel consumption by as much as 30 percent or more and thus reduce the operation costs. Lower plant mixing temperatures would also reduce gas emission by as much as 90 percent (4). The typical expected reductions of various emissions as presented in (6) were: 30 to 40 percent for Carbon Dioxide (CO2) and Sulfur Dioxide (SO2), 50 percent for Volatile Organic Compounds (VOC), 10 to 30 percent for Carbon Monoxide (CO), 60 to 70 percent for Nitrous Oxides (NOx), and 20 to 25 percent for dust. Lowering the emissions represents a significant cost savings to an asphalt plant for its emission control facility. Lower emissions may allow asphalt plants to be built in non-attainment areas, where there are strict air pollution regulations. WMA will also allow longer haul distances and a longer construction season than the mixes that are produced at normal operating temperatures. Lowering the mixing temperature would reduce oxidative hardening of the asphalt and thus could result in improving the pavement’s performance by reduced thermal cracking and block cracking. There are some other benefits, such as allowing more Reclaimed Asphalt Pavement (RAP) to be incorporated in the mixes.
However, lowering the operation temperature, in drying the aggregates and in the plant mixing operation, could potentially cause WMA to be more susceptible to moisture damage and rutting (2-4). These potential distresses are important and need to be carefully evaluated to ensure the viability and long term performance of WMA.
WMA was originated in Europe in late 1990 and introduced to the U.S in 2002 when a study tour to Europe to examine WMA technologies was conducted by the National Asphalt Pavement Association (NAPA) (6). A WMA Technical Working Group (TWG) was formed by the Federal Highway Administration (FHWA) and NAPA to oversee WMA investigations and field trials in the U.S., which is led by the experts from NAPA, the State Departments of Transportation (DOTs), FHWA, the National Center for Asphalt Technology (NCAT), and the American Association of State Highway and Transportation Officials (AASHTO) (http://www.warmmixasphalt.com). Up to now, many State highway agencies and even some municipalities in the U.S. have placed trial WMA sections.
The following list some warm mix additives and processes available in the U.S. (5,
http://www.warmmixasphalt.com/WmaTechnologies.aspx): • Advera, a synthetic zeolite.

2
• Aspha-min, a zeolite additive that releases small amount of water into the mix. • Astec foamed-asphalt, small quantities of water injected into the liquid asphalt
stream of an Astec Double-Barrel plant. • Cecabase RT, a surface active agent. • Evotherm, a chemical additive that includes ingredients to improve coating and
workability, adhesion promoters, and emulsification agents (the chemical is delivered in an emulsion).
• Rediset, a warm mix additive that also functions as an anti-strip agent. • REVIX, the additives (broadly encompassing surfactants, polymers, acids,
processing aids, waxes, etc.) incorporated into the asphalt binder that would improve coating and spreading over aggregate surfaces at reduced temperatures.
• Sasobit, a wax based additive. • Aquablack WMA, a WMA system using Microbubble foaming technology. • EcoFoam-II, a WMA system for continuous flow plants using the static inline
vortex asphalt blender. • Low-Energy Asphalt, a sequential mixing process. • Shell Thiopave, a system that utilizes pelletized, sulphur based product as an
asphalt binder extender, mixture modifier and a WMA technology.
1.2 Objective and Pilot Test Program
The research study presented in this report was the second pilot study initiated by the Georgia Department of Transportation (GDOT) for assessing the potential use of WMA in Georgia highway pavements. This pilot study included placing test sections using three different WMA mixes (the Evotherm WMA (developed by MeadWestvaco Co.), the Rediset WMA (developed by AkzoNobel) and the Cecabase RT WMA (developed by CECA)) and a 9.5 mm Superpave control mix. The three WMA test sections and the control section were a part of the 9.5 mm Superpave mix overlay construction project on State Route 42 in Monroe County. The objective of this research study was to assess these three WMA mixtures through (1) assessing the constructability of the WMA mixes, (2) evaluating the properties of the WMA mixes through laboratory testing of the mixes that are produced during the construction of the test sections, and (3) conducting initial assessment of the performance of the WMA pavements. The proposed work for this study consists of following 4 tasks:
Task 1: Pre-construction Preparation: This task consists of preparing a detailed plan covering all phases of the pilot study.
Task 2: Assessing WMA Constructability during Construction: Efforts will be made in this task to obtain as completely as possible the construction related information, subject to the availability of resources and time permitted during the construction. This would provide important information related to the performance of the WMA test sections and the control section.
3
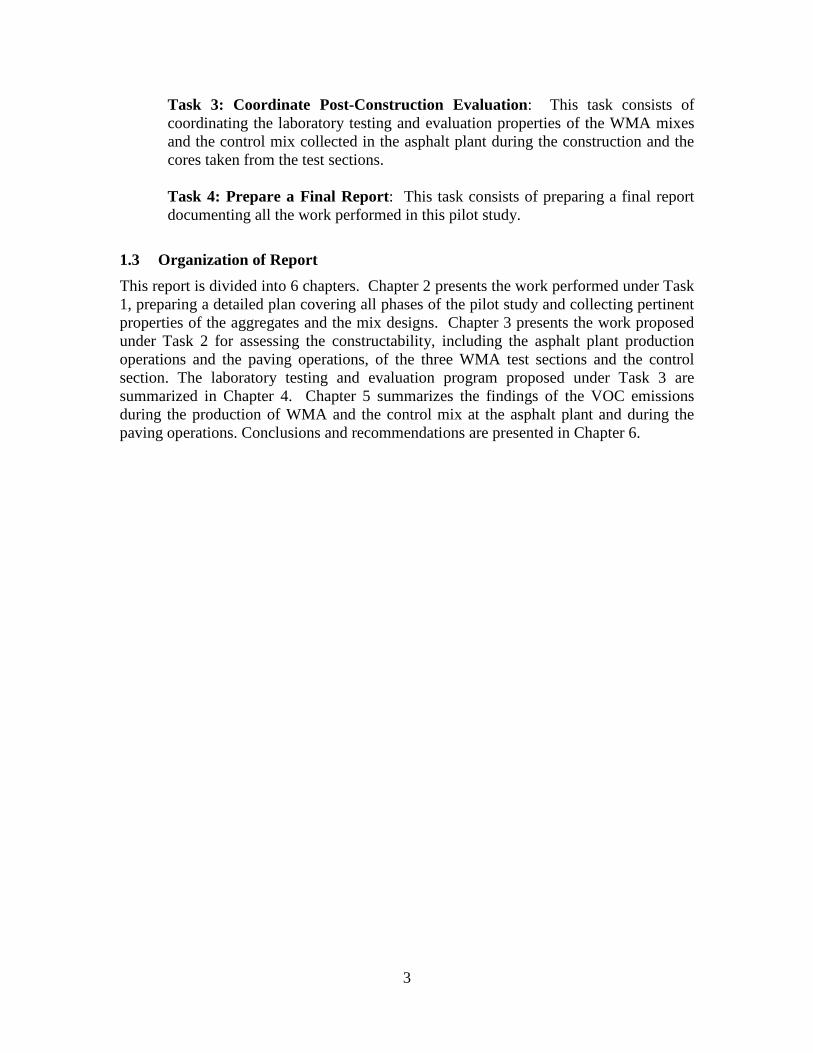
Task 3: Coordinate Post-Construction Evaluation: This task consists of coordinating the laboratory testing and evaluation properties of the WMA mixes and the control mix collected in the asphalt plant during the construction and the cores taken from the test sections.
Task 4: Prepare a Final Report: This task consists of preparing a final report documenting all the work performed in this pilot study.
1.3 Organization of Report
This report is divided into 6 chapters. Chapter 2 presents the work performed under Task 1, preparing a detailed plan covering all phases of the pilot study and collecting pertinent properties of the aggregates and the mix designs. Chapter 3 presents the work proposed under Task 2 for assessing the constructability, including the asphalt plant production operations and the paving operations, of the three WMA test sections and the control section. The laboratory testing and evaluation program proposed under Task 3 are summarized in Chapter 4. Chapter 5 summarizes the findings of the VOC emissions during the production of WMA and the control mix at the asphalt plant and during the paving operations. Conclusions and recommendations are presented in Chapter 6.

4
Chapter 2 PREPARATION AND PRE-CONSTRUCTION ACTIVITIES
This chapter presents the work performed under Task 1 – Pre-construction Preparation.
2.1 Development of Pilot Test Plan
A detailed plan covering all phases of the pilot study was prepared and submitted to OMR on September 11, 2009. The plan included the activities for evaluating WMA technology in the following three phases.
• Pre-construction data collection and laboratory evaluation of material properties. • Evaluating mix production, paving and compaction operations, and performing
quality control during the construction of the test sections. • Post-construction evaluations of the performance of the WMA test sections and
the control section. The activities conducted and the results obtained during the pre-construction phase are presented in this chapter, and those during the construction phase and post-construction phases are presented in later chapters.
2.2 Description of Evotherm, Rediset and Cecabase RT WMA Mixes
Evotherm WMA
The Evotherm WMA additive was co-developed in Europe by MeadWestvaco Co. and Eurovia in 2003. MeadWestvaco reports that field testing has demonstrated a 100° F reduction in production temperatures. MeadWestvaco also reports that the decreased production temperatures of the Evotherm process can lead to plant energy savings of 55 percent; a 45 percent reduction in CO2 and SO2 emissions, a 60% reduction in NOx, a 41% reduction in total organic material, and benzene soluble fractions below detectable limits.
Three versions of Evotherm additives are available: 1) Evotherm ET (Emulsion Technology); 2) Evotherm DAT (Dispersed Asphalt Technology); and 3) Evotherm 3G (third generation). Evotherm ET is a high Asphalt Content (AC) content and water-based asphalt emulsion (around 70% solids). It requires no plant modifications for using this product and simply replaces the liquid asphalt in the HMA design. Evotherm DAT is a concentrated solution of additives in-line injected at the mix plant. Evotherm 3G was co-developed by MeadWestvaco, Paragon Technical Services and Mathy Technology & Engineering. This water-free form of additive is suitable to be introduced at the mix plant or asphalt terminal. The Evotherm 3G was used in producing the WMA mix in this project. The Evotherm additive was introduced into the liquid asphalt at the asphalt terminal and was delivered to the hot mix plant in a ready-to-use form. The quantity of

5
Evotherm used in producing the WMA mix in this project was 0.6% by weight of total asphalt mix.
Rediset WMA
The Rediset WMA additive was developed by AkzoNobel. Rediset uses surfactants and organic additives in pellet form. The surfactants improve the wetting ability of the asphalt for better coating with the aggregates, and the organic additives provide a reduction of the binder viscosity and a lubricating effect for easier coating and compaction. Rediset can be blended directly into the asphalt or directly into the mixing drum near where the asphalt is introduced. The HMA plant does not have to be modified. Studies have shown that Rediset WMA can lower the mix production temperature by 54° F and reduce fuel consumption by at least 20%. The dosage is around 1 to 2% of the binder. The mix design does not need to be modified because Rediset can maintain the Performance Grading (PG) of the binder. The quantity of Rediset used in producing the WMA mix in this project was 0.2% by weight of total mix. Cecabase RT WMA
Cecabase RT WMA additive is a relative new product developed in 2006 by CECA. It is a liquid chemical additive that can be directly added into the binder at a dosage rate from 0.2 to 0.5 weight percent (wt%) of bitumen. It is claimed that Cecabase RT can lower mix production temperature by 122° F. The dosage rate used in producing the WMA mix in this project was 0.44% by weight of total asphalt mix.
2.3 WMA and HMA Material Sources and Properties
The three WMA test sections used the same aggregates and asphalt binder that was used for the 9.5 mm Superpave mix for this project. The source and properties of aggregate and asphalt binder, and the mix properties are presented below.
Aggregate
All the aggregates used for producing the mixes were from Aggregates USA at the Hitchcock Quarry (GDOT QPL Source Code 028C) at Postell, Georgia. The general character of the aggregates is Mylonite Gneiss/Amphibolite, and is classified as Group II aggregate in accordance with GDOT Spec 800.2.01.A. The properties of the aggregates are summarized in Table 2-1.
Table 2-1 Property of Aggregates
Specific Gravity Percent Absorption
LA Abrasion Loss, %
Mg-Sulfate Soundness Loss, % Bulk S.S.D. App.
2.693 2.709 2.736 0.059 17 1.1

6
Asphalt Binder
The asphalt binder used was a PG 67-22 from NuStar at Savannah Plant (GDOT QPL Source Code 0002). Reclaimed Asphalt Pavement (RAP)
The RAP used in all three mixes was from the Reeves Construction Co. Postell Plant (GDOT QPL Source Code 004R)
2.4 Mix Design
9.5 mm Superpave Mix
The control section, which is a part of the normal overlay construction project on State Route 42 in Monroe County, used a 9.5 mm Superpave mix. The amount of different sizes of aggregates and the RAP used for the mix is shown in Table 2-2. The aggregate gradation and optimum ACs used for the mix design are shown in Table 2-3. The Job Mix Formula (JMF) for this mix submitted by Reeves Construction Company to the OMR is included in Table A-1 in Appendix A of this report. Table 2-4 summarizes some key mix design parameters that are also shown in Table A-2 in Appendix A. Note that the AC (5.6%) in the JMF submitted by Reeves was 0.46% higher than that of the original approved mix design (5.14%).
Table 2-2 Aggregates Used for the Mixes
RAP 15% #7 5% #89 34% M10 21% W10 37%
Hydrated Lime 1.0%
Table 2-3 Aggregate Gradation and Asphalt Contents
Sieve Size, mm JMF, % Passing
19.0 100 12.5 99 9.5 92 4.75 66 2.36 45 0.075 7
Optimum AC, % 5.6

7
Table 2-4 Volumetric Mix Design Data
% AC Gmm
% Gmb @
Nini tial
% Gmb @
Ndesign Gmb
% Air Voids
VMA VFA Dust Ratio
5.00 2.525 88.7 95.6 2.413 4.4 16.1 72.5 1.05
5.50 2.506 90.5 97.0 2.429 3.0 16.0 80.9 0.96
5.14 4.0
• Optimum Asphalt Cement (AC) Content = 5.14% • Air Voids at Optimum AC = 4.0% • Aggregate Effective Specific Gravity = 2.732 • Ninitial = 6 • Ndesign = 65
Mix Design for Evotherm, Rediset and Cecabase RT Mixes
The three WMA mixes in this pilot study used the same 9.5 Superpave mix design. The reason for using the same mix design was that the amount of additives used in these three WMA mixes was very small and should not affect the mix characteristics. However, other research studies (4) indicated that the air voids could be affected under the same compaction efforts, even with adjusting the mixing and compaction temperatures to account for the improved workability when using the WMA additives. Chapter 3 and Chapter 4 of this report will present the results and comparisons of the characteristics of the three WMA mixes and the control mix.

8
Chapter 3 ASSESSING ASPHALT PLANT AND PAVING OPERATIONS DURING CONSTRUCTION
3.1 Locations of Test Section Sites
The three WMA test sections and the control test section were a part of the 9.5 mm Superpave mix overlay construction project on State Route 42 in Monroe County, Georgia. The project consists of 12.091 miles of milling, inlay, plant mix resurfacing and shoulder reconstruction on State Route 42 beginning North of State Route 74 and extending to State Route 18. The locations of the construction project and the test sections are shown in Figure 3-1. The milepost range for each test section can also be found in Table 3-1. Reeves Construction Co. was the project contractor. The Evotherm WMA test section was constructed on October 29, 2009. The control section was constructed on October 30, 2009. The Rediset WMA test section was then placed on November 3, 2009. On November 4, 2009, the Cecabase RT test section was completed. The pavement sections that were constructed on rainy days were not counted. The weather during the construction of these test sections was sunny, and the temperature was about 50oF in the early morning and increased to about 70oF in the afternoon.
Figure 3-1 Locations of test sections
Monroe County
Evotherm, SBL
Rediset, NBL
Cecabase RT, SBL
Control, SBL

9
Table 3-1 Construction Dates and Locations of Test Sections
Date Test Section Milepost From Milepost To Orientation 10/29/2009 Evotherm 11.5 10.2 Southbound (SB) 10/30/2009 Control 9.3 8.4 SB 11/3/2009 Rediset 2.5 (SB) 2.2 (NB) SB then NB 11/4/2009 Cecabase RT 3.4 5.2 Northbound (NB)
3.2 Asphalt Plant and Mix Production
The asphalt plant was located at Postell, Georgia, about 40 miles from the test section sites, see Figure 3-2. It would take about 1 hour for the truck to deliver the mix from the asphalt plant to the test section sites.
Figure 3-2 Locations of asphalt plant and test section sites
The asphalt mixes were produced by an Astec continuous drum plant with a
production rate of 220 tons per hour. As mentioned in Section 2.3, all the aggregates used for producing the mixes were from Rinker Materials Co. at the Hitchcock Quarry at Postell, Georgia. The moisture contents of the aggregate stockpile were determined, and the results are presented in Table 3-2.
Test Sections
Asphalt Plant
10
Table 3-2 Aggregate Stockpile Moisture Contents
Aggregate Type Moisture Contents, % #7 0.1 #89 1.1 W10 5.7 M10 2.3 RAP 0.8
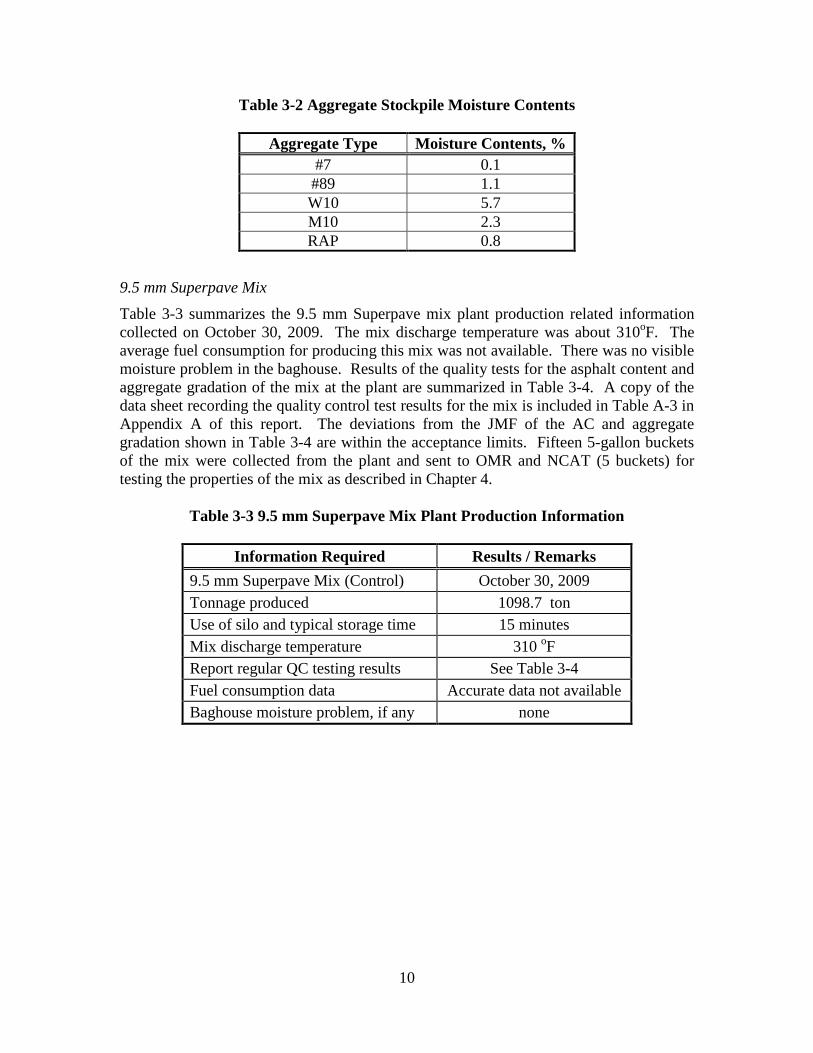
9.5 mm Superpave Mix
Table 3-3 summarizes the 9.5 mm Superpave mix plant production related information collected on October 30, 2009. The mix discharge temperature was about 310oF. The average fuel consumption for producing this mix was not available. There was no visible moisture problem in the baghouse. Results of the quality tests for the asphalt content and aggregate gradation of the mix at the plant are summarized in Table 3-4. A copy of the data sheet recording the quality control test results for the mix is included in Table A-3 in Appendix A of this report. The deviations from the JMF of the AC and aggregate gradation shown in Table 3-4 are within the acceptance limits. Fifteen 5-gallon buckets of the mix were collected from the plant and sent to OMR and NCAT (5 buckets) for testing the properties of the mix as described in Chapter 4.
Table 3-3 9.5 mm Superpave Mix Plant Production Information
Information Required Results / Remarks
9.5 mm Superpave Mix (Control) October 30, 2009 Tonnage produced 1098.7 ton Use of silo and typical storage time 15 minutes Mix discharge temperature 310 oF Report regular QC testing results See Table 3-4 Fuel consumption data Accurate data not available Baghouse moisture problem, if any none

11
Table 3-4 9.5 mm Superpave Mix QC Test Results at Asphalt Plant
Sieve Size, mm
Percent passing JMF Average (1) Deviation
19.0 100 100 0 12.5 99 98.2 0.8 9.5 92 91.9 0.1 4.75 66 67 1 2.36 45 46.2 1.2 0.075 7 6.9 0.1
Optimum AC, % 5.60 5.66 0.06 Note (1): Average of 2 samples, see Table A-3 in Appendix A Evotherm WMA Mix
Production of the Evotherm WMA mix at the asphalt plant was started at about 7 a.m. on October 29, 2009. The plant operation for producing this mix was the same as that for producing the 9.5 mm Superpave mix, except the temperatures were lower. Table 3-5 summarizes the plant production related information collected during the production of this mix. The mix discharge temperature was about 260oF, about 50oF lower than that for the 9.5 mm Superpave mix. The average fuel consumption was not available. There was no visible moisture problem in the baghouse. Results of the quality tests for the asphalt content and aggregate gradation of the mix at the plant are summarized in Table 3-6. A copy of the data sheet recording the quality control test results for the mix is included in Table A-4 in Appendix A of this report. The deviations from the JMF of the asphalt content and aggregate gradation shown in Table 3-6 are within the acceptance limits. Fifteen 5-gal buckets of the mix were collected from the plant and sent to the GDOT OMR laboratory and NCAT (5 buckets) for testing the properties of the mix as described in Chapter 4.
Table 3-5 Evotherm WMA Mix Plant Production Informa tion
Information Required Results / Remarks
Evotherm Warm Mix Asphalt October 29, 2009
Tonnage produced 1715 ton
Method of introducing additive to the mix Mixed with Liquid Asphalt
Use of silo and typical storage time 15 minutes
Mix discharge temperature 260oF
Report regular QC testing results See Table 3-6
Fuel consumption data Accurate data not available
Baghouse moisture problem, if any none

12
Table 3-6 Evotherm WMA Mix QC Test Results at Asphalt Plant
Sieve Size, mm Percent passing
JMF Average (1) Deviation 19.0 100 100 0 12.5 99 97 2 9.5 92 90.8 1.2 4.75 66 62.6 3.4 2.36 45 41.9 3.1 0.075 7 6.2 0.8
Optimum AC, % 5.60 5.59 0.01 Note (1): Average of 3 samples, see Table A-4 Rediset WMA Mix
Production of the Rediset WMA mix at the plant started at about 7 a.m. on November 3, 2009. The plant operation for producing this mix was the same as that for producing the 9.5 mm Superpave mix, except that the temperatures were lower. Table 3-7 summarizes the plant production related information collected during the production of this mix. The mix discharge temperature was about 280oF, about 30oF lower than that for the 9.5 mm Superpave mix. The average fuel consumption was not available. There was no visible moisture problem in the baghouse. Results of the quality tests for the asphalt content and aggregate gradation of the mix at the plant are summarized in Table 3-8. A copy of the data sheet recording the quality control test results for the mix is included in Table A-5 in the Appendix A. The deviations from the JMF of the asphalt content and aggregate gradation shown in Table 3-8 are within the acceptance limits. Fifteen 5-gal buckets of the mix were collected from the plant and sent to OMR and NCAT (5 buckets) for testing the properties of the mix as described in Chapter 4.
Table 3-7 Rediset WMA Mix Plant Production Information
Information Required Results / Remarks
Rediset Warm Mix Asphalt November 3, 2009
Tonnage produced 1592.05 ton
Method of introducing additive to the mix Mixed with Liquid Asphalt
Use of silo and typical storage time 15 minutes
Mix discharge temperature 280oF
Report regular QC testing results See Table 3-8
Fuel consumption data Accurate data not available
Baghouse moisture problem, if any none

13
Table 3-8 Rediset WMA Mix QC Test Results at Asphalt Plant
Sieve Size, mm Percent passing
JMF Average (1) Deviation 19.0 100 100 0 12.5 99 98 1 9.5 92 91.7 0.3 4.75 66 64.7 1.3 2.36 45 44.8 0.2 0.075 7 7 0 Optimum AC, % 5.60 5.65 0.05
Note (1) Average of 3 samples, see Table A-5 Cecabase RT WMA Mix
Production of the Cecabase RT WMA mix at the plant started at about 7 a.m. on November 4, 2009. The plant operation for producing this mix was the same as that for producing the 9.5 mm Superpave mix, except that the temperatures were lower. Table 3-9 summarizes the plant production related information collected during the production of this mix. The mix discharge temperature was about 280oF, about 30oF lower than that for the 9.5 mm Superpave mix. The average fuel consumption was not available. There was no visible moisture problem in the baghouse. Results of the quality tests for the asphalt content and aggregate gradation of the mix at the plant are summarized in Table 3-10. A copy of the data sheet recording the quality control test results for the mix is included in Table A-6 in the Appendix A. The deviations from the JMF of the asphalt content and aggregate gradation shown in Table 3-10 are within the acceptance limits. Fifteen 5-gal buckets of the mix were collected from the plant and sent to OMR and NCAT (5 buckets) for testing the properties of the mix as described in Chapter 4.
Table 3-9 Cecabase RT WMA Mix Plant Production Information
Information Required Results / Remarks
Cecabase RT Warm Mix Asphalt November 4, 2009
Tonnage produced 1696.32 ton
Method of introducing additive to the mix Mixed with Liquid Asphalt
Use of silo and typical storage time 15 minutes
Mix discharge temperature 280oF
Report regular QC testing results See Table 3-10
Fuel consumption data Accurate data not available
Baghouse moisture problem, if any none

14
Table 3-10 Cecabase RT WMA Mix QC Test Results at Asphalt Plant
Sieve Size, mm Percent passing
JMF Average (1) Deviation 19.0 100 100 0 12.5 99 98.3 0.7 9.5 92 90 2 4.75 66 63.7 2.3 2.36 45 43.9 1.1 0.075 7 6.8 0.2 Optimum AC, % 5.60 5.57 0.03
Note (1) Average of 3 samples, see Table A-6
3.3 Paving Operations of Test Sections
Paving for the test sections started on October 29, 2009. The Evotherm WMA was first paved in the Morning of October 29 and continued to the afternoon. The 9.5 mm Superpave control section was paved on October 30. Due to raining, the paving operation was suspended until November 3. The Rediset WMA section was paved on November 3 and the Cecabase RT WMA section on November 4. Locations of the test sections are shown in Figure 3-1 and Table 3-1. The weather and the temperatures during the paving of each test section are listed in Table 3-11. .
Table 3-11 Weather Condition during Construction
Date Temperature (oF)
Weather Lowest Highest Mean
10/29/2009 57 81 67 Sunny
10/30/2009 58 80 65 Cloudy - Raining
11/3/2009 42 76 56 Sunny
11/4/2009 42 76 57 Sunny
Paving operations on all WMA test sections and the control section were about the same, except that the temperatures of the mixes at load out and behind the screed were different.
Table 3-12 summarizes the common paving operation information collected during
the construction. Tandem end-dump trucks were used for hauling the asphalt mixes. The hauling distance from the asphalt plant to the paving sites was about 40 miles and the hauling time was somewhere between 1 hour to 1 hour and 30 minutes. The mixes in the trucks were properly covered with tarpaulins during the hauling and waiting to be discharged into the paver. The PG 67-22 paving grade asphalt was used for the tack coat and the tack rate was between 0.04 and 0.06 gal/yd2. With the lesson learned in the first

15
pilot study, contractor used a Material Transfer Vehicle (MTV) for paving the Evotherm and Rediset test sections but not the Cecabase RT WMA test section because the MTV was unexpectedly out of order on November 4. The compacted mat thickness for all sections was 1 ¼ inch.
Table 3-12 Summary of Laydown /Compaction Information for All Sections
Information Required Results / Remarks
Project location SR 42 Monroe Co.
Contractor Reeves Construction Company Truck type Tandem end-dump trucks Haul distance/Haul time 40 miles, 1 hr to 1 hr 30 min
Release agent used (if any) #1 Asphalt Release, Comp Technologies
Material sticking in truck beds? No
Use of transfer vehicles Yes, SB-2500 Road Tec (for
Evotherm and Rediset WMA mixes) Paver type and model Blaw-Knox PF-3200 Use vibratory screed / heated screed? Yes/ Yes Compacted mat thickness 1 ¼ inch
Roller Train 2 vibratory rollers, 1 pneumatic
roller,
-Vibratory roller / pattern Ingersoll Rand DD-130
4 passes of vibration rolling
-Pneumatic roller Ingersoll Rand PT-125
Continuous rolling Time when opened to traffic About 2 hours after compaction
Paving operations and information related to the quality of paving for each test
sections are presented below. Paving Evotherm Test Section
Paving of Evotherm test section started on the southbound lane at about 10:00 am on October 29, 2009. The starting milepost was MP 13.4. At the beginning, the mix production temperature in the plant was the same as that for the conventional HMA, about 310 oF. After 22 truck loads, the mix production temperature was lowered to 280
oF. The temperature was further lowered to 260 oF after the 57th truck load. The corresponding milepost range for the WMA at 260 oF was between MP 11.5 and 10.2. When the mix was produced at the high temperature, the placement and compaction of the WMA mix were similar to that of the conventional HMA. Hence, the focus was on observing the characteristics and quality of paving and compaction operations of the mix produced at this lower temperature (260 oF).

16
During the paving operation, temperatures of the mix at load out and behind the screed were frequently monitored. For the mix produced at 260 oF, temperatures of the mix at the load out were between 240oF and 255oF and those behind the screed were between 230oF and 250oF. These were about 40oF to 50oF lower than that for the paving of the conventional 9.5 mm Superpave mix. The paving operation was quite smooth. Occasional blemishes were occurring as shown in Figure 3-3 to Figure 3-6, and requiring hand work to correct them by taking mix out of the spreader box and shoveling it onto the blemished areas to repair the mat. However, the situation was not as bad when compared with the blemish problem that occurred during the paving of the same WMA mix in the first pilot study in 2008. Several engineers from GDOT at the paving site considered the paving quality acceptable.
In addition to taking the temperature readings at various locations using a digital
thermometer, infrared images were also taken at the truck load out and behind the screed. Figure 3-7 shows the temperature distribution of the mix at the truck load crust. This infrared image indicated the highest temperature at the crust was about 187 oF, and about 157 oF near the edges. Figure 3-8 is the infrared image of the uncompacted mat behind the screed. The highest temperature was about 236 oF with about 13 oF temperature difference between the high and the low across the mat.
Compaction of the mat was followed immediately behind the paver. A 15-ton
Ingersoll Rand DD-130 vibratory roller was used for the breakdown rolling, which consisted of 4 passes of vibratory compaction. Then a pneumatic tire roller was used for the intermediate rolling, and the rolling was completed with a steel wheel roller.
Density of the compacted mat was determined using a nuclear density gage. A total
of 5 gage readings were taken, and the air voids for these 5 readings were from 5.9 % to 7.7% with the averaged air voids of 7.1 % (see Table A-9). Pavement smoothness was measured using the laser road profiler at every 0.1 mile. The average value was 732 mm/km (the smoothness test result can also be found in Appendix A-7). Table 3-13 summarizes the pertinent data related to the construction of the Evotherm test section.
Figure 3-3 Blemishes from throw back (Evotherm mix)

17
Figure 3-3 Blemishes from throw back (Evotherm mix)
Figure 3-4 Blemishes from throw back (Evotherm mix)
Figure 3-5 Blemishes from throw back (Evotherm mix)

18
Figure 3-6 Blemishes from throw back (Evotherm mix)
Figure 3-7 IR image on truck load crust (Evotherm mix)
Figure 3-8 IR image of Evotherm mix behind screed

19
Table 3-13 Summary of Evotherm WMA Mix Test Section Paving Information
Information Required Results / Remarks
Paving date and time 10/29/2009, 10 am to 3:00 pm Temperature range at load out 240 to 255oF Mix temperature behind screed 230 to 250oF Test section length paved 1.3 miles Compacted mat thickness 1 ¼ inch Quality of compacted pavement surface -In-place density by nuclear gage Avg. air voids 7.1%
-Any surface defects Occasional blemishes due to cold
clumps dragging Time when opened to traffic 2 hr. after paving
Pavement smoothness 732 mm/km
Paving Rediset Test Section
Paving of the Rediset test section started on the southbound lane at about 9:00 am on November 3. The starting milepost was MP 4.6. The starting production temperature was the same as that of the conventional HMA. Then, the temperature at the plant was lowered to 280 oF and the corresponding pavement section was from southbound lane MP 2.5 to the south end, then back to MP 2.2 on northbound lane. However, the quality of the asphalt mat paved with this low temperature was poor. Therefore, the contractor decided not to further lower the mix production temperature. The following observations were based on the Rediset WMA produced at 280 oF.
During the paving process, temperatures of the mix at load out and behind the screed were frequently monitored. Temperatures of the mix at the load out were between 265oF and 270oF and behind the screed between 240oF and 255oF. These were about 20oF to 30oF lower than that for the paving of the conventional 9.5 mm Superpave mix. The paving quality was in general unsatisfactory. Figure 3-9 shows the effect of pulling on the mat by the right extension screed, and Figure 3-10 shows the effects of the gear box stripping. Blemishes happened more frequently on this test section as shown in Figure 3-11 to Figure 3-13. These construction defects have severely affected the paving quality and required extensive corrective actions. At about 3:00 pm, the contractor decided to raise the production temperature to 310 oF after the 56th truck load of the mix was paved.
In addition to taking the temperature readings at various locations using a digital
thermometer, infrared images were also taken at the truck load out and behind the screed. Figure 3-14 shows the mat temperature distribution at the truck load crust. This infrared image indicated that the highest temperature at the crust was about 284 oF and the temperature at the edges about 180 oF. The temperature distribution of the uncompacted mat behind the screed is shown in Figure 3-15. The highest temperature was about 256 oF and there was about 20 oF temperature difference on the mat.

20
Compaction of the mat was immediately followed behind the paver. The same rollers and patterns were used as that for compacting the Evotherm test section. The density of the compacted mat was determined using a nuclear density gage. A total of 5 gage readings were taken, and the air voids ranged from 4.7% to 6.6% with the averaged air voids of 5.8 % (see Table A-10). Pavement smoothness was measured using the laser road profiler at every 0.1 mile. The average value was 845 mm/km (the smoothness test result can also be found in Appendix A-7). Table 3-14 summarizes the pertinent data related to the construction of the Rediset test section.
Table 3-14 Summary of Rediset WMA Mix Test Section Paving Information
Information Required Results / Remarks
Paving date and time November 3, 2009, 9 am to 3:00
pm Temperature range at load out 265 to 270oF Mix temperature behind screed 240 to 255oF Test section length paved 0.3 miles Compacted mat thickness 1 ¼ inch Quality of compacted pavement surface - In-place density by nuclear gage Avg. air voids 5.8%
- Any surface defects Frequent blemishes due to cold clumps dragging, pulling and
gearbox stripping Time when opened to traffic 2 hr. after paving
Pavement smoothness 845 mm/km
Figure 3-9 Pulling on Rediset WMA test section

21
Figure 3-10 Gearbox stripping on Rediset WMA test section
Figure 3-11 Blemish on Rediset WMA test section
Figure 3-12 Blemish on Rediset WMA test section

22
Figure 3-13 Blemish on Rediset WMA test section
Figure 3-14 IR image on truck load crust (Rediset WMA)
Figure 3-15 IR image of Rediset WMA behind screed

23
Paving Cecabase RT Test Section
Paving of the Cecabase RT test section started on the northbound lane at about 9:00 am on November 4. The starting milepost was MP 2.2. Although a total of 1,696 ton of the mix was produced, only 4 truck loads (from 33rd to 36th truck load) had the production temperature of 260 oF while the major portion of the mix was produced at higher temperatures. The following observation was based on the paving operation in the segment where the production temperature was at 260 oF
One change of the paving process was that the MTV was not used because it was unexpectedly out of order. Temperatures of the mix at the load out were between 245oF and 260oF and that behind the screed between 230oF and 245oF. These were about 20oF to 50oF lower than that for the paving of the conventional 9.5 mm Superpave mix. A large amount of cold mix clumps were present in the hopper and the paving crew had to stop the paver and remove those clumps from the hopper as shown in Figure 3-17. These had caused severe blemish and pulling problems on the mat behind the screed as shown in Figure 3-18 to Figure 3-20.
During the paving process, infrared images were taken at the truck load surface and at
the mat behind the screed. Figure 3-21 shows the temperature distribution of truck load when mix was being unloaded. It shows a large number of small clumps of mix with temperature at about 200 oF. The highest temperature was about 268 oF. The temperature distribution of the asphalt mat behind the screed is shown in Figure 3-22. The highest temperature was about 250 oF with about 30 oF temperature difference across the mat.
Compaction of the mat was immediately followed behind the paver. The same rollers
and patterns were used as the Evotherm test section. The density of the compacted mat was determined using a nuclear density gage. A total of 5 gage readings were taken, and the air voids ranged from 5.0% to 6.1% with the averaged air voids of 5.8 % (see Table A-11). Pavement smoothness was measured using the laser road profiler at every 0.1 mile. The average value was 821 mm/km (the smoothness test result can also be found in Appendix A-7). Table 3-15 summarizes the pertinent data related to the construction of the Cecabase RT test section.
Figure 3-16 Cold mix clumps of Cecabase RT WMA in hopper

24
Figure 3-17 Removal of cold Cecabase RT WMA clumps from hopper
Figure 3-18 Blemish on Cecabase RT test section
Figure 3-19 Blemish on Cecabase RT test section

25
Figure 3-20 Pulling on Cecabase RT test section
Figure 3-21 IR image on truck load when Cecabase mix was being unloaded
Figure 3-22 IR image of Cecabase mix behind screed

26
Table 3-15 Summary of Cecabase RT WMA Mix Test Section Paving Information
Information Required Results / Remarks
Paving date and time November 4, 2009, 9 am to 3 pm Temperature range at load out 245 to 260 oF Mix temperature behind screed 230 to 245 oF Test section length paved 1.8 miles Compacted mat thickness 1 ¼ inch Quality of compacted pavement surface - In-place density by nuclear gage Avg. air voids 5.8%
- Any surface defects Frequent blemishes due to cold clumps dragging and pulling
Time when opened to traffic 2 hr. after paving
Pavement smoothness 821 mm/km
Paving 9.5 mm Superpave Mix Control Section
Paving of the 9.5 mm Superpave mix control section was on October 30, 2009. Regrettably the researchers were not there during the construction of this control section. Since it was still raining in the morning of the day and the contractor was uncertain if the weather would allow for the paving operation, the researchers left the construction site. By the time the researchers were informed that the construction was resumed it was too late for them to rush back to the site. Therefore, the information pertaining to the construction operations for this test section was provided by Mark Bruce in OMR.
Temperatures of the mix at the load out were about 300 oF and that behind the screed about 295 oF. Figure 3-23 and Figure 3-24 show the IR images of the mix at the truck load out and the asphalt mat behind the screed. The paving progressed quite smoothly, and no noticeable defects were observed. The mat was quite uniform and smooth and no blemish was observed during the entire paving of the control section, see Figure 3-25.
Compaction of this section was identical to that of the WMA test sections. Density of the compacted mat was determined using a nuclear density gage. A total of 5 gage readings were taken, and the air voids ranged from 5.3% to 6.1% with the averaged air voids of 5.7 % (see Table A-8). Pavement smoothness was measured using the laser road profiler at every 0.1 mile. The average smoothness was 623 mm/km (the smoothness test result can also be found in Appendix A-7). Table 3-16 summarizes the pertinent data related to the construction of the control test section.

27
Figure 3-23 IR image on truck load when mix was unloaded
Figure 3-24 IR image on placement mat behind the screed
Figure 3-25 Paving of 9.5 mm Superpave mix
28
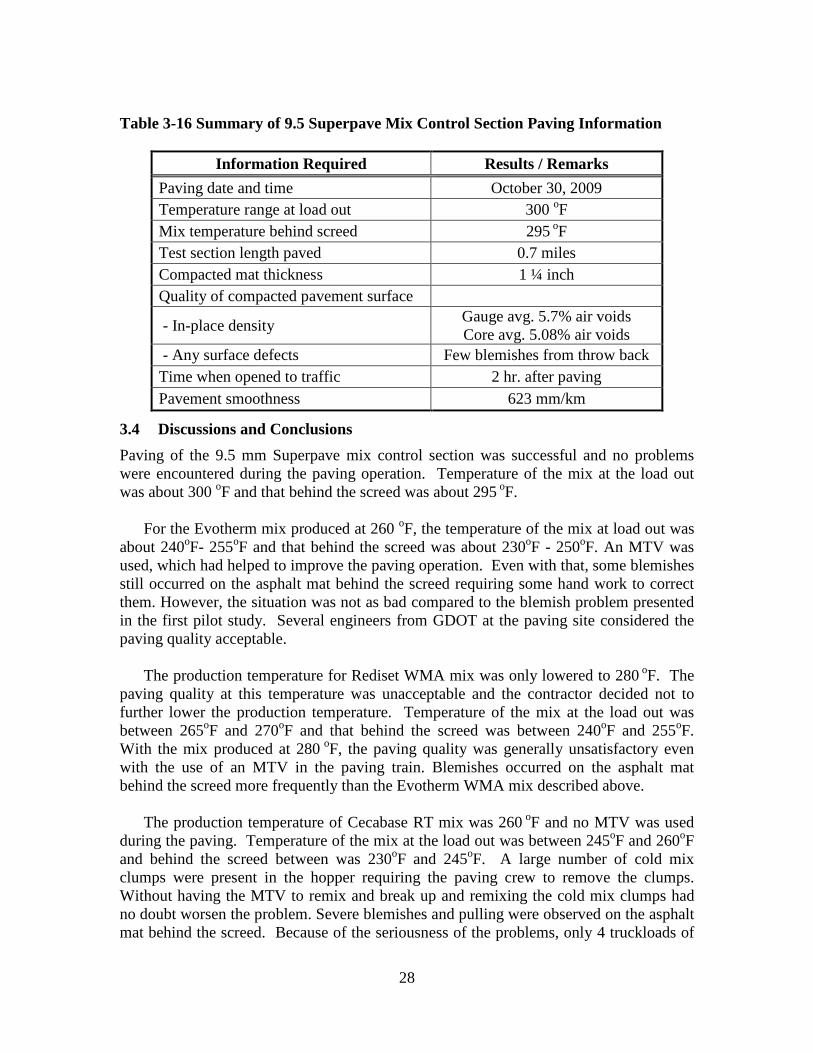
Table 3-16 Summary of 9.5 Superpave Mix Control Section Paving Information
Information Required Results / Remarks
Paving date and time October 30, 2009 Temperature range at load out 300 oF Mix temperature behind screed 295 oF Test section length paved 0.7 miles Compacted mat thickness 1 ¼ inch Quality of compacted pavement surface
- In-place density Gauge avg. 5.7% air voids Core avg. 5.08% air voids
- Any surface defects Few blemishes from throw back Time when opened to traffic 2 hr. after paving Pavement smoothness 623 mm/km
3.4 Discussions and Conclusions
Paving of the 9.5 mm Superpave mix control section was successful and no problems were encountered during the paving operation. Temperature of the mix at the load out was about 300 oF and that behind the screed was about 295 oF.
For the Evotherm mix produced at 260 oF, the temperature of the mix at load out was
about 240oF- 255oF and that behind the screed was about 230oF - 250oF. An MTV was used, which had helped to improve the paving operation. Even with that, some blemishes still occurred on the asphalt mat behind the screed requiring some hand work to correct them. However, the situation was not as bad compared to the blemish problem presented in the first pilot study. Several engineers from GDOT at the paving site considered the paving quality acceptable.
The production temperature for Rediset WMA mix was only lowered to 280 oF. The
paving quality at this temperature was unacceptable and the contractor decided not to further lower the production temperature. Temperature of the mix at the load out was between 265oF and 270oF and that behind the screed was between 240oF and 255oF. With the mix produced at 280 oF, the paving quality was generally unsatisfactory even with the use of an MTV in the paving train. Blemishes occurred on the asphalt mat behind the screed more frequently than the Evotherm WMA mix described above.
The production temperature of Cecabase RT mix was 260 oF and no MTV was used
during the paving. Temperature of the mix at the load out was between 245oF and 260oF and behind the screed between was 230oF and 245oF. A large number of cold mix clumps were present in the hopper requiring the paving crew to remove the clumps. Without having the MTV to remix and break up and remixing the cold mix clumps had no doubt worsen the problem. Severe blemishes and pulling were observed on the asphalt mat behind the screed. Because of the seriousness of the problems, only 4 truckloads of

29
the mix produced at 260 oF were paved in this test section. If the MTV were used in this paving operation, the quality of the paving could have been improved, although it is doubtful if all the problems observed could have been completely eliminated.
Table 3-17 summarizes the quality of the test sections in terms of the air voids
measured by the nuclear gage and the smoothness measured by the laser road profiler. The 9.5 mm Superpave control section has the lowest International Roughness Index (IRI) reading and the least variations of air voids determined using the nuclear density gage. Among the three WMA test sections, the Cecabase RT section seems to have the lowest variations in the air voids. But one must recognize that only a small portion of this test section (4 truckloads of the mix) had the production temperature of 260 oF. The production temperatures for the mix used in the remaining portion of this test section were higher. On the other hand, no MTV was used in this test section.
Compared with the first pilot study conducted in 2008, blemishes occurred much less frequently for the Evotherm WMA mix test section. Other than the different WMA additive used in this pilot study, use of an MTV in the paving operation had improved the paving quality. Use of an MTV in the paving train could help break up the cold mix clumps during the load out and thus reduce, if not completely eliminate, the cold mix clumps in the hopper and the auger chamber, and also reduce the blemishes developed behind the screed. However, compared with the 9.5 mm Superpave test section, blemish and pulling still occurred. This would indicate that the WMA additives used in this pilot project were still inadequate toward producing the intended effects. This could be due to either of the following two reasons:
(1) The applied dosage rates could be insufficient for the three WMA additives used
in this pilot project. Without sufficient dosage of WMA additives, the viscosity of asphalt binder cannot be reduced sufficiently at the prescribed temperatures at the load out and in the auger chamber to allow for smooth paving operation to proceed. The dosage rates used in this pilot project were 0.6%, 0.2%, and 0.44% by weight of the total mix respectively for Evotherm, Rediset and Cecabase RT. The adequate dosage rates recommended by the additive suppliers should be validated in laboratory prior to the field implementation.
(2) The methods for introducing the Rediset and Cecebase RT additives into the mixing operation could be ineffective. One GDOT engineer mentioned that there were some problems with mixing Rediset uniformly in the drum, which delayed the production for 8 hours.

30
Table 3-17 Compare Paving Quality of WMA Mixes with Control mix
9.5 mm
Superpave Evotherm
WMA Rediset WMA
Cecabase RT WMA (1)
Additive dosage by wt% of mix
- 0.6% 0.2% 0.44%
Mix Temperatures - Production 315oF 260 oF 280 oF 260 oF (1) - At load out 300oF 240-255 oF 265-270 oF 245-260 oF - Behind screed 295oF 230-250 oF 240-255 oF 230-245 oF Use of MTV No Yes Yes No Cold mix clumps in Hopper
No Some Many Many
Blemishes behind screed
No Some Severe Severe
% Air Void, by nuclear gage
- Average 5.7 7.1 5.8 5.8 - Range 0.8 1.8 1.9 1.1 Smoothness (mm/km)
623 732 845 821
(1) Only 4 truckloads of Cecabase RT WMA mix was produced at 260oF. The remaining large portion of the mix was produced at higher temperatures.

31
Chapter 4 POST-CONSTRUCTION EVALUATION Certain pertinent properties of the WMA mixes and the control mix were evaluated by performing a series of laboratory tests with the samples prepared in the laboratory using the mixes collected from the asphalt plant during the construction and from the cores taken from the test sections. Table 4-1 summarizes the laboratory tests performed in this study.
Table 4-1 Laboratory Test Programs
Item Test / Information Required
1 Obtain and determine basic mix properties
2 Moisture susceptibility tests (GDT-66) 3 Prepare 6-150 mm dia. samples for APA tests 4 Perform APA tests (GDT-115) 5 Prepare 4-150 mm dia. samples for Hamburg tests 6 Conduct Hamburg tests by NCAT 7 Conduct fatigue testing by NCAT 8 Cut 10-150 mm dia. cores from test section 9 Conduct bond strength tests
10 Test recovered binder to assess aging effect
4.1 Basic Asphalt Mix Properties
These tests were to determine the basic asphalt mix properties including the Maximum Specific Gravity (Gmm), AC, VTM (Voids in Total Mix), VMA (Voids in Mineral Aggregate), VFA (Voids Filled with Asphalt) and aggregate gradation. The tests were conducted at the GDOT OMR laboratory using the asphalt mixes collected in the asphalt plant during the construction. The detailed test results are presented in Appendix B. Test results of basic volumetric mix properties Table 4-2 summarizes the basic volumetric mix properties determined from the laboratory test. The detailed test results are presented in Table B-1 to Table B-4 in Appendix B. According to Table A-2 for the 9.5 mm Superpave mix design, the Ndesign was 65. Therefore, 65 number of gyration, which is corresponding to the Ndesign for the approved Superpave mix, was used for preparing the samples reported in Table B-1 to Table B-4.
According to Table A-2 for the 9.5 mm Superpave mix design, the VTM should be at 4.0%; and according to GDOT Standard Specifications Section 828.2.02, VMA should be ≥15 and VFA between 65 and 80 for a 9.5 mm Superpave mix. The results shown in Table 4-2 indicate that the VTM values for all four mixes (between 2.3% and 1.4%) are

32
much lower than the 4%. These low VTM values have contributed to the lower VMA (between 13.0 and 14.7) and higher VFA (between 84.1 and 89.2) than those are permitted by the GDOT Specifications referenced above. Based on the Superpave mix design criteria, VTM should be no less than 2.0% when the samples were compacted to the Nmax. The results shown in Table 4-2 indicated that the VTM for all three WMA mixes compacted at Ndesign of 65 have the VTM values less than 2.0 %, which was much less than the 4.0% design air voids. It would indicate that these mixes could be susceptible to rutting under the design traffic load. Even for the control mix with the VTM at 2.3% for the samples compacted at the same conditions could indicate the control mix is also marginal for rutting resistance.
Table 4-2 Basic Volumetric Mix Properties
Mix Type % AC G mm Gmb Gse VTM, % VMA,% VFA,%
Control 5.46 2.493 2.436 2.715 2.3 14.5 84.1
Evotherm 5.81 2.479 2.440 2.714 1.6 14.7 89.1
Rediset 5.88 2.490 2.455 2.731 1.4 13.0 89.2
Cecabase RT
5.83 2.477 2.430 2.713 1.9 13.4 85.8
Aggregate gradation Table 4-3 summarizes the tested aggregate gradations for all test mixes. According to the GDOT standard (Section 828), the aggregation gradations for all test mixes meet the acceptance requirements.
Table 4-3 Aggregation Gradation
Sieve Size, mm
Control, % Passing
Evotherm, %Passing
Rediset, %Passing
Cecabase RT, %Passing
JMF, % Passing
19.0 100.0 100.0 100.0 100 100 12.5 98.6 98.2 99.1 98.4 99 9.5 92.0 91.5 91.4 94.3 92 4.75 66.6 61.6 64.4 69.0 66 2.36 45.9 42.1 44.1 46.5 45 1.18 32.7 30.3 31.5 32.8 31 0.600 24.3 22.8 23.7 24.3 22 0.300 18.0 17.0 17.9 18.1 16 0.150 12.8 12.1 12.8 12.8 10 0.075 7.7 7.6 7.8 8.0 7.0
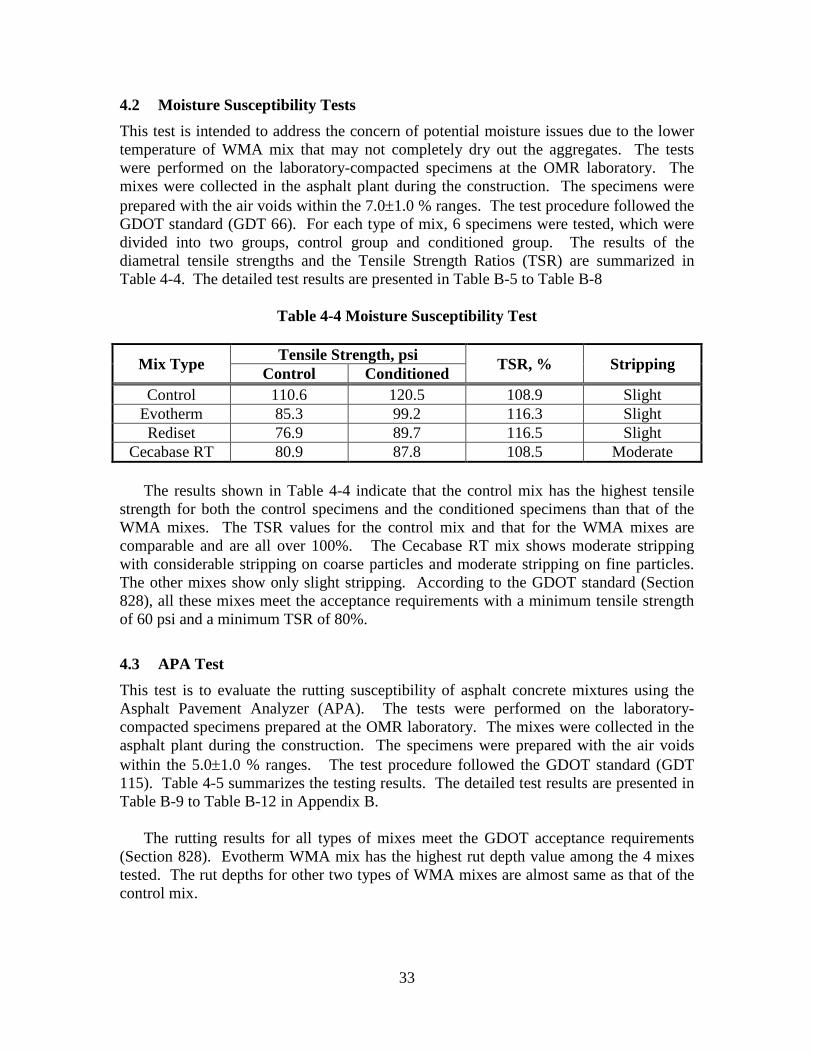
33
4.2 Moisture Susceptibility Tests
This test is intended to address the concern of potential moisture issues due to the lower temperature of WMA mix that may not completely dry out the aggregates. The tests were performed on the laboratory-compacted specimens at the OMR laboratory. The mixes were collected in the asphalt plant during the construction. The specimens were prepared with the air voids within the 7.0±1.0 % ranges. The test procedure followed the GDOT standard (GDT 66). For each type of mix, 6 specimens were tested, which were divided into two groups, control group and conditioned group. The results of the diametral tensile strengths and the Tensile Strength Ratios (TSR) are summarized in Table 4-4. The detailed test results are presented in Table B-5 to Table B-8
Table 4-4 Moisture Susceptibility Test
Mix Type Tensile Strength, psi
TSR, % Stripping Control Conditioned
Control 110.6 120.5 108.9 Slight Evotherm 85.3 99.2 116.3 Slight Rediset 76.9 89.7 116.5 Slight
Cecabase RT 80.9 87.8 108.5 Moderate
The results shown in Table 4-4 indicate that the control mix has the highest tensile strength for both the control specimens and the conditioned specimens than that of the WMA mixes. The TSR values for the control mix and that for the WMA mixes are comparable and are all over 100%. The Cecabase RT mix shows moderate stripping with considerable stripping on coarse particles and moderate stripping on fine particles. The other mixes show only slight stripping. According to the GDOT standard (Section 828), all these mixes meet the acceptance requirements with a minimum tensile strength of 60 psi and a minimum TSR of 80%.
4.3 APA Test
This test is to evaluate the rutting susceptibility of asphalt concrete mixtures using the Asphalt Pavement Analyzer (APA). The tests were performed on the laboratory-compacted specimens prepared at the OMR laboratory. The mixes were collected in the asphalt plant during the construction. The specimens were prepared with the air voids within the 5.0±1.0 % ranges. The test procedure followed the GDOT standard (GDT 115). Table 4-5 summarizes the testing results. The detailed test results are presented in Table B-9 to Table B-12 in Appendix B.
The rutting results for all types of mixes meet the GDOT acceptance requirements (Section 828). Evotherm WMA mix has the highest rut depth value among the 4 mixes tested. The rut depths for other two types of WMA mixes are almost same as that of the control mix.

34
Table 4-5 Rutting Susceptibility Test
Mix Type Rutting, mm Control 5.78
Evotherm 6.55 Rediset 5.79
Cecabase RT 5.93
4.4 Bond Strength Test
This test is intended to assess the adhesive strength between the newly paved resurfacing mixes and the existing pavement surface. Six 6-inch-diameter cores were cut from each test sections two months after the construction. The bond strength tests were performed in the OMR laboratory using the Marshall Tester fitted with a shear head. The tests were performed at the loading speed of 2 in./min and at 77 oF temperature. Some core samples contained a thin layer of surface treatment material between the existing pavement and the resurfacing layer. Presence of the surface treatment layer at the interface could have affected the bond strength. Actually, some cores taken from the Rediset test section were disintegrated due to the poor bonding at the interface, and 5 new cores had to be re-cut from the Rediset test section for the bond strength testing. Table 4-6 summarizes the bond strength testing results for the four mixes. The results indicate that the control mix had higher bond strength than that of the WMA mixes. The bond strengths among the three WMA mixes are about the same. According to the NCAT study (9), average bond strength of 100 psi is the typical bond strength between HMA pavement layers against slippage failure.
Table 4-6 Bond Strength Test Results
Mix Type Shear Strength, psi
#5 #6 #7 #8 #9 #10 Average Std. Dev. Control 170.6 333.5 148.7 123.8 145.7 329.3 208.6 87.89
Evotherm 156.0 122.5 127.2 112.6 135.0 140.0 132.2 13.76 Rediset 125.9 126.7 120.2 111.3 101.4 107.7 115.5 9.42
Cecabase RT 156.3 107.5 114.8 116.0 125.2 143.4 127.2 17.23
4.5 Assessment of Short Term Aging Effect of Asphalt Binders
This test is intended to assess the short term aging effect of the asphalt binders used in the control mix and in the WMA mixes during the production of the mixes at the plant. The Abson recovery test was conducted for recovering the asphalt binders from the mixes collected at the asphalt plant. The Dynamic Shear Rheometer test was then performed on the recovered binders. The tests were performed at the OMR laboratory using Bohlin Dynamic Shearing Rheometer. Two samples were tested for each type of asphalt binder. Table 4-7 summarizes the testing results. The detailed test results are presented in Table B-13 to Table B-20 in Appendix B. The results in terms of G* and G*/sinδ show that

35
there is no significant difference between the asphalt binder of the control mix and that of the three WMA mixes after the short term aging during the production of the mixes at the asphalt plant. This indicates that incorporating the WMA additives in the asphalt binder and the mixing of the WMA mixes at lower temperature did not cause “reduced aging effect” of the binder properties. This would imply that the WMA mixes probably would have no effects in terms of improving rutting resistance, nor reducing low temperature cracking and block cracking compared with the control mix.
Table 4-7 Dynamic Shearing Rheometer Test
Mix Type G*, Pascal
G*/sinδ, Pascal
Sample 1 Sample 2 Sample 1 Sample 2 Control 5599 5333 5637 5371
Evotherm 5348 5337 5389 5378 Rediset 5271 5273 5353 5353
Cecabase RT 5620 5722 5736 5841 Test parameters:
• Strain controlled at the amplitude = 10.00 percent • Plate diameter = 25.0 mm; • Plate gap = 1.000 mm • Test temperature = 60 oC • Equilibrium time = 10 minutes
4.6 Fatigue Test
This test was performed by NCAT. Three beam samples for each type of mixes were fabricated using the asphalt mixes collected in the asphalt plant during the construction. The testing procedures follow the AASHTO standard (AASHTO T321-07). The following are some key parameters for this test:
• Air voids of the compacted beam samples: 6.0 ± 0.5% • Test temperature: 20 oC ± 0.5 oC • Controlled strain amplitude: 800 µs • Number of samples to be tested: 3
The cycles to failure were computed according to both the AASHTO T321-07 and
ASTM D 7460-08. Table 4-8 and Figure 4-1 summarize the testing results. The rankings of cycles to failure from high to low among these 4 mixes are: Cecabase RT mix, Rediset mix, Control mix and Evotherm mix. An ANOVA was performed on the cycles to failure among the 4 mixes. The significance level of the ANOVA was 0.05. The result showed that the p-value, about 0.03, is less than the significance threshold of 0.05, but is not exceptionally low (less than 0.01). Thus, we can say that the cycles to failure among the four mixes show a statistical difference at a moderate significant level.
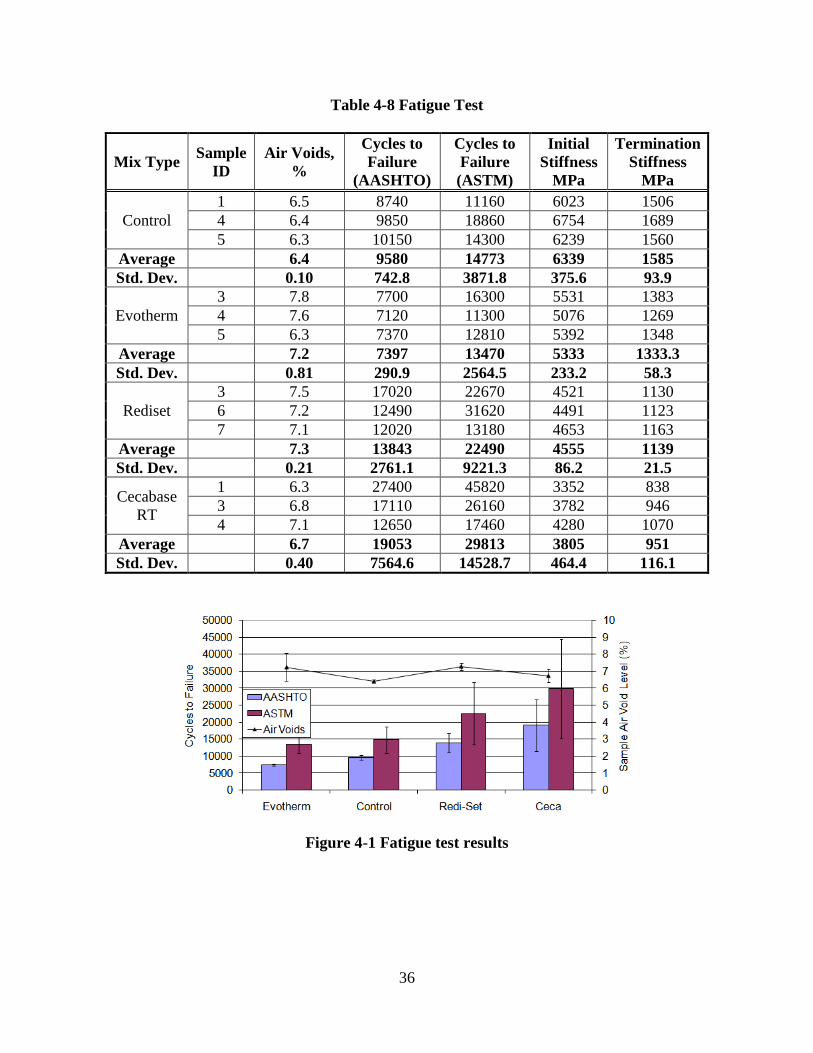
36
Table 4-8 Fatigue Test
Mix Type Sample ID
Air Voids, %
Cycles to Failure
(AASHTO)
Cycles to Failure (ASTM)
Initial Stiffness
MPa
Termination Stiffness
MPa
Control 1 6.5 8740 11160 6023 1506 4 6.4 9850 18860 6754 1689 5 6.3 10150 14300 6239 1560
Average 6.4 9580 14773 6339 1585 Std. Dev. 0.10 742.8 3871.8 375.6 93.9
Evotherm 3 7.8 7700 16300 5531 1383 4 7.6 7120 11300 5076 1269 5 6.3 7370 12810 5392 1348
Average 7.2 7397 13470 5333 1333.3 Std. Dev. 0.81 290.9 2564.5 233.2 58.3
Rediset 3 7.5 17020 22670 4521 1130 6 7.2 12490 31620 4491 1123 7 7.1 12020 13180 4653 1163
Average 7.3 13843 22490 4555 1139 Std. Dev. 0.21 2761.1 9221.3 86.2 21.5
Cecabase RT
1 6.3 27400 45820 3352 838 3 6.8 17110 26160 3782 946 4 7.1 12650 17460 4280 1070
Average 6.7 19053 29813 3805 951 Std. Dev. 0.40 7564.6 14528.7 464.4 116.1
Figure 4-1 Fatigue test results

37
4.7 Hamburg Wheel-Tracking Test
This test was performed to assess the moisture susceptibility and rutting susceptibility of the mixes. Four 6-inch-diameter cores taken from each test section were tested. The tests were performed by NCAT. The testing procedures followed the AASHTO standard (AASHTO T324-04).
The test results are presented in Table 4-9 and Figure 4-2. On average, Evotherm WMA mix has the lowest rutting and the highest stripping inflection point, and Cecabase RT WMA mix has the highest rutting and the stripping inflection point was close to what Rediset has, which is the lowest one. This indicates that Cecabase RT WMA mix could be more susceptible moisture to than the other mixes. This also confirms the moisture susceptibility test results presented in Section 4.2. In this test the Evotherm WMA has much lower total rutting at 10,000 cycles than the other mixes, while the APA test results have shown the opposite.
Table 4-9 Hamburg Test
Sample ID Mix Type
Sample Air Voids
(%)
Average Air Voids
(%)
Rutting Rate, in/hr
Total Rutting @ 10,000, in
Stripping Inflection
Point, cycles CC1 Cecabase RT 5.2
5.4 0.099 0.394 4400 CC4 Cecabase RT 5.5
CC2 Cecabase RT 6.8 7.5 0.168 0.666 4600
CC3 Cecabase RT 8.1
Cecabase Average
0.134 0.530 4500 CS2 Control 6.3
5.6 0.122 0.484 5560 CS4 Control 4.9
CS1 Control 4.7 4.4 0.077 0.307 4650
CS3 Control 4.1
Control Average
0.100 0.396 5105 EV1 Evotherm 7.7
7.8 0.067 0.267 5450 EV3 Evotherm 7.8
EV2 Evotherm 7.5 7.8 0.032 0.128 6750
EV4 Evotherm 8.1
Evotherm Average 0.050 0.198 6100 RS1 Rediset 4.5
6.6 0.089 0.352 4000 RS3 Rediset 8.6
RS2 Rediset 6.1 6.0 0.086 0.342 4775
RS4 Rediset 5.9 Rediset Average 0.088 0.347 4388

38
Figure 4-2 Hamburg test results
4.8 Discussions and Conclusions
Table 4-10 summarizes the post-construction laboratory test results.
Table 4-10 Summaries of Post-Construction Laboratory Test Results
Sample Source
9.5 mm Superpave
Evotherm WMA
Rediset WMA
Cecabase RT WMA
Volumetric Properties
Plant
-% AC 5.46 5.81 5.88 5.83 -VTM, % 2.3 1.6 1.4 1.9 -VMA, % 14.5 14.7 13.0 13.4 Recovery of Binder
Plant
-Viscosity, poises 5646 5343 5272 5671 Moisture Susceptibility
Plant
-Tensile splitting-control, psi 110.6 85.3 76.9 80.9 -Tensile splitting-conditioned, psi 120.5 99.2 89.7 87.8 -TSR, % 109 116 116 109 APA Rutting, mm Plant 5.78 6.55 5.79 5.93 Hamburg test, Rut @ 10000 cyl, in.
Core 0.40 0.20 0.35 0.53
Bond Strength, psi Core 208.6 132.2 115.5 127.2 Fatigue Testing
Plant
-Cyls. to failure 14773 13470 22490 29813 -Stiffness, MPa 1585 2323 1139 951
Determination of the basic asphalt mix properties from the asphalt mixes collected in
the asphalt plant during construction indicated that the air voids for all three WMA mixes compacted at Ndesign of 65 were less than 2.0%, much less than the 4.0% design air voids.
39
Therefore, rutting susceptibility should be closely monitored in the next summer or two on these test sections. The control mix compacted under the same conditions has the VTM at 2.3% and would also indicate that this mix has marginal rutting resistance. The aggregate gradations from all four mixes determined from the mixes produced at the plant were very close to that determined from the quality control tests of the mixes conducted at the plant and both sets of the aggregate gradations are very close to that of the JMF submitted by the contractor.
The dynamic shear Rheometer tests were performed on the asphalt binders recovered from the mixes produced at the plant. The results in terms of G* and G*/sinδ indicate that there is no significant difference between the asphalt binder of the control mix and that of the three WMA mixes after the short term aging during the production of the mixes in the asphalt plant. This indicates that incorporating the WMA additives in the asphalt binder and the mixing of the WMA mixes at lower temperature did not cause “reduced aging effect” of the binder properties.
Results of the GDT-66 moisture susceptibility tests indicate the 9.5 mm Superpave control mix has higher tensile stability values for both the unconditioned (control) specimens and the conditioned specimens than that of the WMA mixes. The test results also indicate that the moisture conditioned specimens have higher stability values than that of the unconditioned (control) specimens for each type of the mixes used in this pilot test program, including the 9.5 mm Superpave control mix and the 3 WMA mixes. Thus, the TSR values are over 100% for each of the four mixes. Regarding the unusual TSR values, one engineer in OMR explained that it happens at times on finer and “tender” mixes such as 9.5 mm mix. It was thought that the conditioning of the testing pills actually stiffens the mix to some extent. In the meantime, given the higher AC contents in conjunction with hydrated lime, the tensile stability for the conditioned specimen becomes higher. The Cecabase RT mix shows moderate stripping with considerable stripping on coarse particles and moderate stripping on fine particles. The other mixes show only slight stripping. According to the GDOT standard (Section 828), all these mixes meet the acceptance requirements with a minimum tensile strength of 60 psi and a minimum TSR of 80%.
Results from the APA rutting tests indicate that all four mixes meet the GDOT acceptance requirements. Evotherm WMA mix has a slightly higher rut depth value compared with the other three mixes. The rut depths for the other two types of WMA mixes are almost same as that of the control mix.
Results from the Hamburg tests indicated that Evotherm WMA mix has the lowest rutting and the highest stripping inflection point, and Cecabase RT WMA mix has the highest rutting and the stripping inflection point was close to what Rediset has, which is the lowest one. This indicates that Cecabase RT WMA mix would be more susceptible to moisture than the other mixes, which is consistent with the finding from the GDT-66 moisture susceptibility tests. Results from this testing showed that the Evotherm WMA has much lower total rutting at 10,000 cycles than the other mixes, which is opposite to the finding from the APA rutting test results.

40
Results of the bond strength testing show the bond strengths from the four mixes all
exceed 100 psi, with the control mix having the highest value of 208 psi and the three WMA mixes having the strengths around 115 psi to 132 psi. According to the NCAT study (9), average bond strength of 100 psi is the typical bond strength between HMA pavement layers against slippage failure.
The fatigue tests were performed on all 4 mixes collected at the asphalt plant. The testing procedures followed the AASHTO standard (AASHTO T321-07). The rankings of cycles to failure from high to low among these 4 mixes are: Cecabase RT mix, Rediset mix, Control mix and Evotherm mix. An ANOVA was performed on the cycles to failure among the 4 mixes. The significance level of the ANOVA was 0.05. The result showed that the p-value, about 0.03, is less than the significance threshold of 0.05, but is not exceptionally low (less than 0.01). Thus, we can say that the cycles to failure among the 4 mixes show a statistical difference at a moderate significant level.

41
Chapter 5 EVALUATION OF WARM MIX HYDROCARBON EMISSION
This chapter presents the results of a preliminary study that was conducted by Alexander Samoylov and Michael Rodgers of Georgia Tech Research Institute (GTRI) for evaluating the relative magnitude of VOC emissions during the production of WMA and the control mix at the asphalt plant and during the paving operations. A report entitled, “Warm-Mix Asphalt Hydrocarbon Emissions Scoping Study,” submitted by the investigators is included in Appendix C of this report.
5.1 Introduction
One of the important considerations in using WMA is the potential for reducing the emissions of VOC that are important precursors to photochemical smog and the creation of secondary fine particulate matter (PM2.5). Therefore, it is important to be able to assess the extent of the reduction of the pollutants for using WMA and compare that with the conventional HMA during the construction of asphalt pavements.
However, determination of absolute emissions rates from industrial processes,
including the production of asphalt mixtures in the plant and the paving operations, is normally a time consuming, costly and difficult process as these emission rates are often strongly impacted by local environmental conditions and normal variations in the process being measured. For this reason, scoping studies are often undertaken to ascertain whether emissions from a new process are likely to be substantially different from the one that it replaces. This study was conceived as a scoping study to determine and compare VOC emissions from the WMA mixtures used in the pilot project and the control mix.
5.2 Measurement Approach
The basic study approach was to compare the observed VOC concentrations just above surface of various WMA mixes with those associated with a control mix using both free air and an open topped chamber (cone). Measurements of surface fluxes using near surface concentration measurements normally require the use of eddy correlation, gradient or Bowen ratio methods that require substantial ancillary micrometeorological measurements in addition to the concentration measurements. In the case of asphalt mixtures, this need for extensive supporting meteorological measurements is greatly reduced since the surface temperature of the asphalt mix (260 to 300 oF) is much higher than that of the ambient air and the near surface energy balance is almost completely controlled by the asphalt mix at least so long as the surface winds are not too high. Thus, for this scoping study, measurements were limited to the evaluation of the near surface concentration gradients and exhaust concentrations from the open topped chambers based on the assumption that ventilation rates induced by the surface temperature conditions were comparable for all the mixtures.

42
All VOC concentration measurements made during the study were performed using a Siemens Ultramat 23® Non-Dispersive Infrared (NDIR) detector equipped with a heated type 316 stainless steel inlet system. Measurements were made at distances 1, 3, 10, 30, and 100 cm above the surface of the asphalt mixtures in open air and at the exhaust from a variety of simple open-topped chambers with a six second measurement update cycle. These VOC concentration measurements were conducted at the asphalt plant when these mixes were produced and at the paving during the paving operations.
Regarding the VOC measurement protocol, Michael Rodgers further explained as
follows: “Current AP-42 emissions factors for asphalt paving are still based on a series of grab sample enclosure measurements conducted during the 1970’s. Since then EPA has issued substantial technical guidance on conducting stack emissions testing at asphalt plants but has not provided any guidance or standard protocols for field testing of emissions from asphalt transport and pavements. In the mid 1990's NSF and the National Strategic Highway Research Program sponsored a study conducted in collaboration with the South Coast Air Quality Management District and the University of Southern California to establish a protocol for pavement emissions measurements but the resulting protocol, based on grab sampling and gas chromatographic testing, was never adopted by U.S. EPA. The NDIR measurement techniques used in this study are derived from EPA standard methods used for dynamometer testing of vehicle emissions (EPA-75 test procedure) and are considered EPA equivalent methods for this purpose.”1 Asphalt Plant Measurements
The VOC measurements at the asphalt plant were made within 1-2 minutes after the mix was discharged from the silo into the truck. All measurements were made near the center of the truck bed at distances of 1, 3, 10, 30, and 100 centimeters from the asphalt surface using a heated stainless steel line and a Siemens Ultramat 23® NDIR detector. In addition to these open air measurement some semi-controlled measurements were performed using open topped chambers (cones) resting on the asphalt surface. Several measurements were excluded from the data set because delay between truck loading and the time the vehicle was made available for the measurements was too long (i.e. more than 20 minutes). Paving Site Measurements
Measurements at the paving site were conducted using the same general approach as that used for at the asphalt plant. In this case the stainless steel inlet was placed close to the centerline of the freshly paved asphalt mat. Measurements were performed in two separate stages, on the uncompacted asphalt mat immediately behind the screed and after the rollers had compacted the mat at least once.
1 The explanation on the VOC measurement protocol was provided by Michael Rodgers when the final report was reviewed by GDOT. It was not included in the Appendix C that is the report prepared by Michael Rodgers.

43
Table 5-1 shows more specific information regarding the measurement program including the measurement day, general environmental conditions, asphalt temperatures and pavement status.

44
Table 5-1 VOC Emission Study Conditions
Day# Date Additive Measured
Temp Morning, (deg F)
Temp Afternoon,
(deg F)
Wind Conditions
Humidity
Asphalt Temperature
(deg F) Pavement Rolled
Pavement Unrolled
300 280 260
1 10/29/2009 Evotherm 40-45 55-60 Strong Medium X X X
2 10/30/2009
Low Rediset / Control
Mix
40-45 50-55 Light High X X X
3 11/3/2009 Rediset 40-45 55-60 Moderate Medium X X X X
4 11/4/2009 CECA 45-50 60-65 Light Medium X X X X X

45
5.3 Results
Evotherm Additive
The Evotherm WMA mix was tested on October 29th 2009. In the morning hours, ambient temperatures ranged from 40-45 oF and were associated with the very strong winds. The wind moderated significantly in the afternoon and ambient temperatures rose to 55-60 oF. VOC concentration measurements were conducted at three different WMA temperatures: 300oF, 280oF and 260oF and were conducted only at the asphalt plant. The results of the measurements are summarized in Table 5-2.
Table 5-2 VOC Measurements at Asphalt Plant – Evotherm WMA
Temperature oF
Distance, cm Cone
1 3 10 30 100 260 19 18 15 12 10 17 280 26 25 18 15 13 21 300 11 9 11 9 7 -
Control Mix
Measurements of the control mix were performed on October 30th. Weather conditions for that day were considerably different from the day before. Temperatures were between 45 oF and 55 oF with high humidity and light drizzle that became light rain at times. Winds were very light.
Results of the VOC concentration measurements at the plant and at the paving site are presented in Table 5-3. Results of the VOC measurements on uncompacted and compacted mat at the paving site are very similar. Compacted mat appears to generate a slightly stronger source of VOC emission but given the variability of external conditions and the small absolute difference, the differences between uncompacted and compacted conditions are minimal.
Table 5-3 VOC Measurements at Asphalt Plant and Paving Site–Control Mix
Temperature
oF Distance, cm
Cone 1 3 10 30 100
Plant 300 oF 14.3 12.3 9.2 7.3 6.1 13.2 Paving Site Uncompacted - - 27 26 24 29 Compacted - - 27 26 27 28
Rediset Additive
The Rediset WMA mix was first produced in the morning of October 30. By 10 a.m. the weather turned to light drizzle and paving was switched to the conventional mix. It became apparent the next day that an incorrect proportion, only about 30% of the required dosage of Rediset additive was used for the mix. Paving of Rediset WMA mix was resumed on November
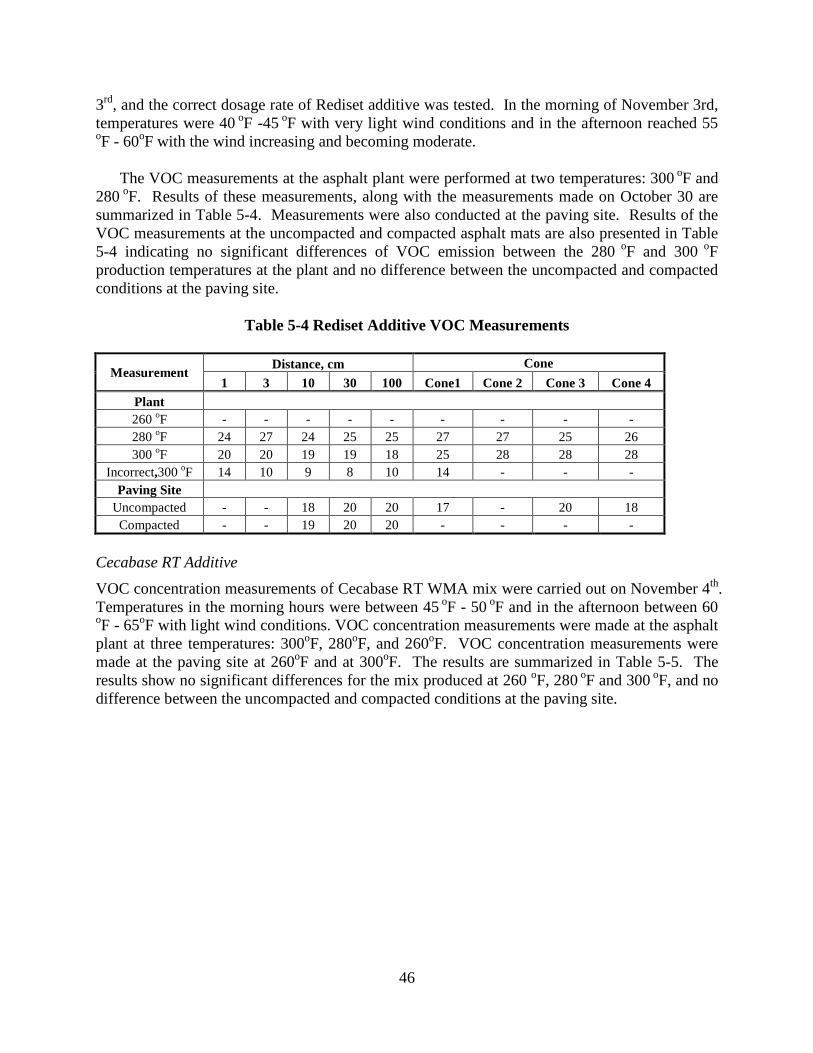
46
3rd, and the correct dosage rate of Rediset additive was tested. In the morning of November 3rd, temperatures were 40 oF -45 oF with very light wind conditions and in the afternoon reached 55 oF - 60oF with the wind increasing and becoming moderate.
The VOC measurements at the asphalt plant were performed at two temperatures: 300 oF and 280 oF. Results of these measurements, along with the measurements made on October 30 are summarized in Table 5-4. Measurements were also conducted at the paving site. Results of the VOC measurements at the uncompacted and compacted asphalt mats are also presented in Table 5-4 indicating no significant differences of VOC emission between the 280 oF and 300 oF production temperatures at the plant and no difference between the uncompacted and compacted conditions at the paving site.
Table 5-4 Rediset Additive VOC Measurements
Measurement Distance, cm Cone
1 3 10 30 100 Cone1 Cone 2 Cone 3 Cone 4 Plant 260 oF - - - - - - - - - 280 oF 24 27 24 25 25 27 27 25 26 300 oF 20 20 19 19 18 25 28 28 28
Incorrect,300 oF 14 10 9 8 10 14 - - - Paving Site
Uncompacted - - 18 20 20 17 - 20 18 Compacted - - 19 20 20 - - - -
Cecabase RT Additive
VOC concentration measurements of Cecabase RT WMA mix were carried out on November 4th. Temperatures in the morning hours were between 45 oF - 50 oF and in the afternoon between 60
oF - 65oF with light wind conditions. VOC concentration measurements were made at the asphalt plant at three temperatures: 300oF, 280oF, and 260oF. VOC concentration measurements were made at the paving site at 260oF and at 300oF. The results are summarized in Table 5-5. The results show no significant differences for the mix produced at 260 oF, 280 oF and 300 oF, and no difference between the uncompacted and compacted conditions at the paving site.
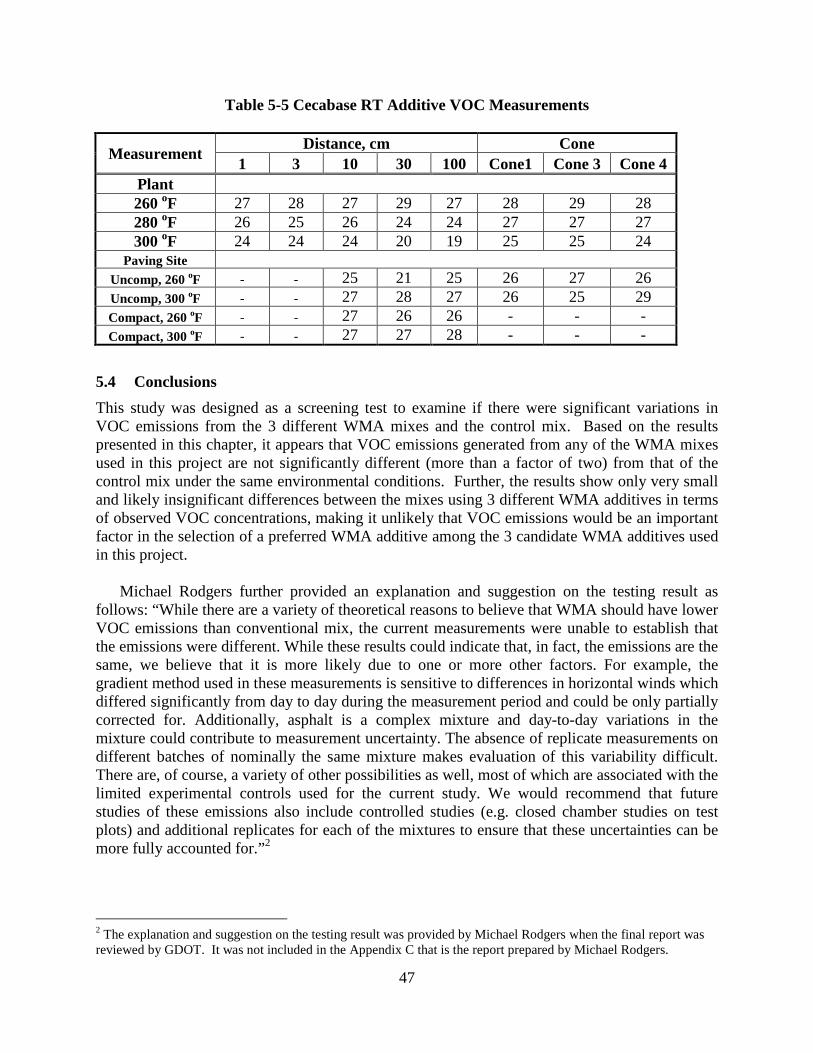
47
Table 5-5 Cecabase RT Additive VOC Measurements
Measurement Distance, cm Cone
1 3 10 30 100 Cone1 Cone 3 Cone 4 Plant 260 oF 27 28 27 29 27 28 29 28 280 oF 26 25 26 24 24 27 27 27 300 oF 24 24 24 20 19 25 25 24
Paving Site
Uncomp, 260 oF - - 25 21 25 26 27 26 Uncomp, 300 oF - - 27 28 27 26 25 29 Compact, 260 oF - - 27 26 26 - - - Compact, 300 oF - - 27 27 28 - - -
5.4 Conclusions
This study was designed as a screening test to examine if there were significant variations in VOC emissions from the 3 different WMA mixes and the control mix. Based on the results presented in this chapter, it appears that VOC emissions generated from any of the WMA mixes used in this project are not significantly different (more than a factor of two) from that of the control mix under the same environmental conditions. Further, the results show only very small and likely insignificant differences between the mixes using 3 different WMA additives in terms of observed VOC concentrations, making it unlikely that VOC emissions would be an important factor in the selection of a preferred WMA additive among the 3 candidate WMA additives used in this project.
Michael Rodgers further provided an explanation and suggestion on the testing result as follows: “While there are a variety of theoretical reasons to believe that WMA should have lower VOC emissions than conventional mix, the current measurements were unable to establish that the emissions were different. While these results could indicate that, in fact, the emissions are the same, we believe that it is more likely due to one or more other factors. For example, the gradient method used in these measurements is sensitive to differences in horizontal winds which differed significantly from day to day during the measurement period and could be only partially corrected for. Additionally, asphalt is a complex mixture and day-to-day variations in the mixture could contribute to measurement uncertainty. The absence of replicate measurements on different batches of nominally the same mixture makes evaluation of this variability difficult. There are, of course, a variety of other possibilities as well, most of which are associated with the limited experimental controls used for the current study. We would recommend that future studies of these emissions also include controlled studies (e.g. closed chamber studies on test plots) and additional replicates for each of the mixtures to ensure that these uncertainties can be more fully accounted for.”2
2 The explanation and suggestion on the testing result was provided by Michael Rodgers when the final report was reviewed by GDOT. It was not included in the Appendix C that is the report prepared by Michael Rodgers.

48
Chapter 6 CONCLUSIONS AND RECOMMENDATIONS
6.1 Conclusions
The following conclusions are offered based on the work that has been performed for this study. (1) The asphalt mixes for the four test sections were produced by the Astec continuous drum
plant with a production rate of 220 tons per hour. The relevant mix production and paving data for the four mixes are summarized in Table 6-1 below. The quality control testing was performed on the mixes produced in the asphalt plant, and the test results indicated that deviations from the JMF for the asphalt content and aggregate gradation were within the acceptance limits for all four mixes tested.
Table 6-1 Summary of Asphalt Plant Production and Paving Data
Results
Mix Type 9.5 mm Superpave
Evotherm Rediset Cecabase RT
Paving Date 10/30/2009 10/29/2009 11/3/2009 11/4/2009
Tonnage produced 1098.7 ton 1715 ton 1592.05 ton 1696.32 ton
Additive dosage, wt% of mix 0.6% 0.2% 0.44%
Fuel consumption, gal / ton Not available Not available Not available Not available
Mix Temperatures oF -Production 315 260 280 260
-At load out 300 240 - 255 265 - 270 265 - 260
-Behind screed 295 230 – 250 240 - 255 230 - 245
Test section length paved 0.7 miles 1.3 miles 0.3 miles 1.8 miles
Use of MTV no yes yes no
Compacted mat thickness 1 ¼ inch 1 ¼ inch 1 ¼ inch 1 ¼ inch
In-place VTM 5.7% 7.1% 5.8% 5.8%
Surface defects no Occasional blemishes
Frequent blemishes, pulling and stripping
Frequent blemishes and pulling
Time opened to traffic 2 hrs. 2 hrs. 2 hrs. 2 hrs.
Pavement smoothness 623 mm/km 732 mm/km 845 mm/km 822 mm/km
(2) Paving of the 9.5 mm Superpave mix control section was successful and did not encounter
any problems during the paving operation. Paving of the Evotherm WMA mix was considered acceptable. An MTV was used in the paving train and that had helped improve the paving operation. Even with that, some blemishes still occurred on the asphalt mat behind the screed and required some hand work to correct them. An MTV was used also in the paving train during the paving of the Rediset WMA mix. However, the paving quality was generally unsatisfactory. Blemishes occurred on the asphalt mat behind the screed more

49
frequently than occurred on the Evotherm mix. Paving of the Cecabase RT WMA mix did not utilize an MTV. The quality of paving with the mix produced at 260 oF was poor with a large number of cold mix clumps present in the hopper requiring the paving crew to remove the clumps. Severe blemishes and pulling was observed on the asphalt mat behind the screed.
(3) Compared with the first pilot study conducted in 2008, blemishes occurred much less
frequently for the Evotherm WMA mix test section. Other than the different WMA additive used in this pilot study, use of an MTV in the paving operation had improved the paving quality. However, compared with the 9.5 mm Superpave control section, blemish and pulling still occurred. This would indicate that the WMA additives used in this pilot project were inadequate toward producing the intended effects. This could be due to either of the following two reasons: (1) the applied dosage rates could be insufficient for the three WMA additives used in this pilot project. The adequate dosage rates recommended by the additive suppliers should be validated in the laboratory prior to the field implementation; or (2) the methods for introducing the Rediset and Cecabase RT additives into the mixing operation could be ineffective.
(4) Laboratory tests were performed on the asphalt mix collected from the asphalt plant during
the construction and the cores taken from the four test sections. Table 6-2 summarizes the post-construction laboratory test results.
Table 6-2 Summaries of Post-Construction Laboratory Test Results
9.5 mm
Superpave Evotherm
WMA Rediset WMA
Cecabase RT WMA
Volumetric Properties -% AC 5.46 5.81 5.88 5.83 -VTM, % 2.3 1.6 1.4 1.9 -VMA, % 14.5 14.7 13.0 13.4 Recovery of Binder -Viscosity, poises 5646 5343 5272 5671 Moisture Susceptibility -Tensile splitting-control, psi 110.6 85.3 76.9 80.9 -Tensile splitting-conditioned, psi 120.5 99.2 89.7 87.8 -TSR, % 109 116 116 109
APA Rutting, mm 5.78 6.55 5.79 5.93
Hamburg test, Rut @ 10000 cyl. , in.
0.40
0.20
0.35
0.53
Bond Strength, psi 208.6 132.2 115.5 127.2 Fatigue Testing -cyls. to failure 14773 13470 22490 29813 -Stiffness, MPa 1585 2323 1139 951
• The air voids for all three WMA mixes compacted at Ndesign of 65 were less than 2.0%, much less than the 4.0% design air voids. Therefore, rutting susceptibility should be closely monitored in the next summer or two on these test sections. The control mix

50
compacted under the same conditions has the VTM at 2.3% and would also indicate this mix has marginal rutting resistance.
• The dynamic shear Rheometer tests were performed on the asphalt binders recovered
from the mixes produced at the plant. The results in terms of G* and G*/sinδ indicate that there are no significant differences between the asphalt binder of the control mix and that of the three WMA mixes after the short term aging during the production of the mixes in the asphalt plant.
• Results of the GDT-66 moisture susceptibility tests indicate the 9.5 mm Superpave
control mix has higher tensile stability values for both the unconditioned (control) specimens and the conditioned specimens than that of the WMA mixes. The test results also indicate that the moisture conditioned specimens have higher stability values than that of the unconditioned (control) specimens for each type of the mixes used in this pilot test program, including the 9.5 mm Superpave control mix and the three WMA mixes. Thus, the TSR values are over 100% for each of the four mixes. Regarding the unusual TSR values, one engineer in OMR explained that it happens at times on finer and “tender” mixes such as 9.5 mm mix. It was thought that the conditioning of the testing pills actually stiffens the mix to some extent. In the meantime, given the higher AC contents in conjunction with hydrated lime, the tensile stability for the conditioned specimen becomes higher. The Cecabase RT mix shows moderate stripping with considerable stripping on coarse particles and moderate stripping on fine particles. The other mixes show only slight stripping. According to the GDOT standard (Section 828), all these mixes meet the acceptance requirements with a minimum tensile strength of 60 psi and a minimum TSR of 80%.
• Results from the APA rutting tests indicated that all 4 mixes meet the GDOT acceptance
requirements. Evotherm WMA mix has a slightly higher rut depth value compared with the other three mixes.
• Results from the Hamburg tests indicated that the Evotherm WMA mix has the lowest
rutting and the highest stripping inflection point, and Cecabase RT WMA mix has the highest rutting and the stripping inflection point was close to what Rediset has, which is the lowest one. This indicates that Cecabase RT WMA mix could have more moisture susceptibility than the other mixes, which is consistent with the finding from the GDT-66 moisture susceptibility tests. Results from this testing showed that the Evotherm WMA has much lower total rutting at 10,000 cycles than the other mixes, which is opposite to the finding from the APA rutting test results.
• Results of the bond strength testing showed that the bond strengths from all the 4 mixes
exceed 100 psi, with the control mix having the highest value of 208 psi and the 3 WMA mixes having the strengths around 115 psi to 132 psi. Average bond strength of 100 psi is the typical bond strength between HMA pavement layers against slippage failure.
• The fatigue tests were performed on all 4 mixes following the AASHTO T321-07
standard. The rankings of cycles to failure from high to low among these 4 mixes are:

51
Cecabase RT mix, Rediset mix, Control mix and Evotherm mix. An ANOVA was performed on the cycles to failure among the four mixes. The significance level of the ANOVA was 0.05. The result showed that the p-value, about 0.03, is less than the significance threshold of 0.05, but is not exceptionally low (less than 0.01). Thus, we can say that the cycles to failure among the 4 mixes show a statistical difference at a moderate significant level.
(5) A preliminary study was conducted by GTRI to evaluate the relative magnitude of VOC
emissions during the production of WMA and the control mix at the asphalt plant and during the paving operations. Results of the VOC emissions measurements for the four mixes indicate that VOC emissions generated from any of the WMA mixes used in this project at the asphalt plant and at the paving site are not significantly different from that of the control mix.
6.2 Recommendations
The following recommendations are offered with an aim toward better understanding and improving the quality of the WMA paving operation and performance. (1) Continuous pavement condition monitoring on the test sections is highly needed to
thoroughly evaluate the actual performance. It is especially important to closely monitor the rutting susceptibility in the next summer or two.
(2) There was problem mixing the additives uniformly into the mixing drum during the test of Rediset. It is recommended to develop a test method to quantitatively measure the percentage of additive applied right after the additives are fully mixed in the drum to ensure the right percentage of additives is introduced uniformly into the drum in the plant.
(3) When WMA is used in a paving project, the following information in addition to that stipulated under GDOT Standard Specifications Section 400.1.03 should be included when the contractor submits the JMF after the contract has been awarded:
• The amount of WMA additive as percent of net binder used in the mix or the percent of the total mix weights used, particularly when RAP is used.
• A viscosity vs. temperature chart for the binder incorporating the specified WMA additive dosage.
• The procedure for incorporating the WMA additive into the mix, the mixing temperature and mixing process in the laboratory mixing operations.
• Temperature and duration of aging, if different from the standard for aged at 135oC (275oF) in an oven for 2 hours after mixing and prior to compaction.
• Any deviation from the Superpave mix design procedures.
(4) Submit the proposed JMF for approval at least 4 weeks (instead of 2 weeks) before the beginning of the asphalt plant mixing operation. This would allow the OMR sufficient time to conduct more thorough mix design verification testing.

52
(5) It would be desirable to request the WMA additive supplier to conduct the mix design verification testing based on the JMF, the aggregates, and the binder submitted by the contractor, and forward the verification mix design results to the OMR. It would be highly desirable that WMA additive suppliers also provide the following information for using the WMA additive during the construction.
• Minimum threshold mix temperature behind the screed • Maximum allowable storage time in silo • Maximum allowable storage time in truck
(6) OMR should perform mix design verification testing based on the JMF, aggregates, and
binder submitted by the contractor and compare the results with those from the WMA additive suppliers. The mixing temperature and the compaction temperature as suggested by the WMA additive suppliers should be carefully evaluated during the laboratory mix design. Workability of the mix should also be carefully evaluated.
(7) It may be desirable to intentionally vary the temperatures of the mix at load out, behind the
screed, and during the holding time to assess the sensitivity of the temperatures and the storage time on the constructability of the WMA mix in the test section of a construction project. This would provide valuable information for the contractor and for the Quality Control Technician during the mainline paving. If the results indicate that the WMA mix used is too sensitive to the temperature variations, the project engineer perhaps should consider requesting the contractor to use an MTV to mitigate the temperature sensitivity of the WMA mix used for the project.
(8) OMR and the Office of Maintenance should cooperate in using additional WMA sections to gain experience of using different types of WMA mixes. The proposed research program for this pilot study presented in this report, including the Post-Construction Laboratory Testing and Evaluation Program, can be used to evaluate the constructability and the properties of the mixes.

53
REFERENCES
1. Hurley, G.C. and B. D. Prowell. “Evaluation of Potential Processes for Warm Mix Asphalt,” Presented at the 2006 Annual Meeting of the Association of Asphalt Paving Technologists.
2. Prowell, B.D., Hurley, G.C., and Crews, E. “Field Performance of Warm Mix Asphalt at the NCAT Test Track” Presented at the 86th Annual Meeting of the Transportation Research Board, January 21-25, 2007, Washington, DC.
3. Hurley, G.C. and B. D. Prowell. “Field Performance of Warm Mix Asphalt,” Presented at the TRB 2008 Annual Meeting.
4. Muench, Stephen T., et al. “Assessing the Potential for Warm Mix Asphalt Technology Adoption,” TRB 2007 Annual Meeting. January 2007.
5. Brown, D. C. “Warm Mix: the Lights are Green, Hot Mix Asphalt Technology,” Jan/Feb 2008.
6. Corrigan, M., et al. “Warm-Mix Asphalt: European Practice,” Federal Highway Administration Technical Report, FHWA-PL-08-007, February 2008.
7. Diefenderfer, S.D., K.K. McGhee, and B.M. Donaldson. “Installation of Warm Mix Asphalt Projects in Virginia,” Virginia Transportation Research Council, Report No FHWA/VTRC 07-R25, April 2007.
8. Swanson, Malcolm. “Double Barrel Green System – An Equipment Means to Produce Warm Mix,” a PowerPoint Presentation, ASTEC Industrial, Inc.
9. West, R.C., J. Zhang, and J. Moore, ”Evaluation of Bond Strength between pavement Layers,” NCAT Report 05-08, National Center for Asphalt Technology, Dec 2005.

54
APPENDIX A MIX DESIGN AND PRODUCTION Table A-1 9.5 mm Superpave Mix Job Mix Formula Submitted by Reeves Construction Co. Table A-2 9.5 mm Superpave Mix Design Table A-3 9.5 mm Superpave Mix Asphalt Plant QC Test Results Table A-4 Evotherm WMA Mix Asphalt Plant QC Test Results Table A-5 Rediset WMA Mix Asphalt Plant QC Test Results Table A-6 Cecabase RT WMA Mix Asphalt Plant QC Test Results Table A-7 Smoothness Test Result Table A-8 9.5 mm Superpave Mix Compaction QC Test Results Table A-9 Evotherm WMA Mix Compaction QC Test Results Table A-10 Rediset WMA Mix Compaction QC Test Results Table A-11 Cecabase RT WMA Mix Compaction QC Test Results

55
Table A-1 9.5 mm Superpave Mix Job Mix Formula Submitted by Reeves Construction Co.

56
Table A-2 9.5 mm Superpave Mix Design

57
Table A-3 9.5 mm Superpave Mix Asphalt Plant QC Test Results

58
Table A-4 Evotherm WMA Mix Asphalt Plant QC Test Results

59
Table A-5 Rediset WMA Mix Asphalt Plant QC Test Results

60
Table A-6 Cecabase RT WMA Mix Asphalt Plant QC Test Results

61
Table A-7 Smoothness Test Result

62
Table A-8 9.5 mm Superpave Mix Compaction QC Test Results GDOT150 - Control Strip and Asphaltic Compaction (ENGLISH) Plant 4 Project CSSTP-M003-00(837)01 Type 9.5mm SP Level: N/A Lot 07 County 207 District Number: 3 Sample 10/30/2009 Contract ID: B13260-08-000-0 Contractor 2RE390 Ctr. Name: REEVES Area Engineer 314 Item No.: 400 Tech. ID: 3H Blend: RAP Plant MACON Percent 5.6 Gauge No.: 24991 Mode (inches): BS Density Standard 2349 Correction Factor : 31 Corrected Std. 2380 Calibration Factor 1: -1.812613 Calibration Factor 1.272415 Control Strip: N Max % air voids: 7.8 Use Nuclear Or Core Nuclear Theo. 154.9 Target Density Test # Tech ID Sam. # Year Begin (ft.) End (ft.) Length (ft) Lane Location Rnd. No. Rnd Sta. (ft) Trans. Loc 1 3H 705 2009 SBL 9+88
Nuclear Left Center Right Average DensityCR Density(lb/ft³) % % Void Results 599 615 602 605 0.2543 145.7 5.9 Core WtAir (g) WtSurf (g) WtWater(g) Diff (g) SpecGrav Density(lb/ft³) % % Void Results Test # Tech ID Sam. # Year Begin (ft.) End (ft.) Length (ft) Lane Location Rnd. No. Rnd Sta. (ft) Trans. Loc 2 3H 706 2009 SBL 9+73
Nuclear Left Center Right Average DensityCR Density(lb/ft³) % % Void Results 588 602 615 602 0.2528 146.1 5.7 Core WtAir (g) WtSurf (g) WtWater(g) Diff (g) SpecGrav Density(lb/ft³) % % Void Results Test # Tech ID Sam. # Year Begin (ft.) End (ft.) Length (ft) Lane Location Rnd. No. Rnd Sta. (ft) Trans. Loc 3 3H 707 2009 SBL 9+45
Nuclear Left Center Right Average DensityCR Density(lb/ft³) % % Void Results 591 612 622 608 0.2556 145.5 6.1 Core WtAir (g) WtSurf (g) WtWater(g) Diff (g) SpecGrav Density(lb/ft³) % % Void Results Test # Tech ID Sam. # Year Begin (ft.) End (ft.) Length (ft) Lane Location Rnd. No. Rnd Sta. (ft) Trans. Loc 4 3H 708 2009 SBL 8+85
Nuclear Left Center Right Average DensityCR Density(lb/ft³) % % Void Results 578 600 605 594 0.2497 146.7 5.3 Core WtAir (g) WtSurf (g) WtWater(g) Diff (g) SpecGrav Density(lb/ft³) % % Void Results Test # Tech ID Sam. # Year Begin (ft.) End (ft.) Length (ft) Lane Location Rnd. No. Rnd Sta. (ft) Trans. Loc 5 3H 709 2009 SBL 8+69
Nuclear Left Center Right Average DensityCR Density(lb/ft³) % % Void Results 588 600 606 598 0.2513 146.4 5.5 Core WtAir (g) WtSurf (g) WtWater(g) Diff (g) SpecGrav Density(lb/ft³) % % Void Results
% of Theo. Average 5.7 Range % 0.8 Remarks Testing Group Testing Management Meets Pass Verified BLJ By

63
Table A-9 Evotherm WMA Mix Compaction QC Test Results
GDOT150 - Control Strip and Asphaltic Compaction (ENGLISH) Plant 4 Project CSSTP-M003-00(837)01 Type 9.5mm SP Level: N/A Lot 06 County 207 District Number: 3 Sample 10/29/2009 Contract ID: B13260-08-000-0 Contractor 2RE390 Ctr. Name: REEVES Area Engineer 314 Item No.: 400 Tech. ID: 3H Blend: RAP Plant MACON Percent 5.6 Gauge No.: 24991 Mode (inches): BS Density Standard 2349 Correction Factor : -63 Corrected Std. 2286 Calibration Factor 1: -1.812613 Calibration Factor 1.272415 Control Strip: N Max % air voids: Use Nuclear Or Core Nuclear Theo. 154.9 Target Density Test # Tech ID Sam. # Year Begin (ft.) End (ft.) Length (ft) Lane Location Rnd. No. Rnd Sta. (ft) Trans. Loc 1 3H 687 2009 SBL 13+00
Nuclear Left Center Right Average DensityCR Density(lb/ft³) % % Void Results 585 571 589 582 0.2544 145.7 5.9 Core WtAir (g) WtSurf (g) WtWater(g) Diff (g) SpecGrav Density(lb/ft³) % % Void Results Test # Tech ID Sam. # Year Begin (ft.) End (ft.) Length (ft) Lane Location Rnd. No. Rnd Sta. (ft) Trans. Loc 2 3H 688 2009 SBL 12+12
Nuclear Left Center Right Average DensityCR Density(lb/ft³) % % Void Results 612 616 601 610 0.2667 143.1 7.6 Core WtAir (g) WtSurf (g) WtWater(g) Diff (g) SpecGrav Density(lb/ft³) % % Void Results Test # Tech ID Sam. # Year Begin (ft.) End (ft.) Length (ft) Lane Location Rnd. No. Rnd Sta. (ft) Trans. Loc 3 3H 689 2009 SBL 11+84
Nuclear Left Center Right Average DensityCR Density(lb/ft³) % % Void Results 587 582 607 592 0.2590 144.7 6.6 Core WtAir (g) WtSurf (g) WtWater(g) Diff (g) SpecGrav Density(lb/ft³) % % Void Results Test # Tech ID Sam. # Year Begin (ft.) End (ft.) Length (ft) Lane Location Rnd. No. Rnd Sta. (ft) Trans. Loc 4 3H 690 2009 SBL 11+36
Nuclear Left Center Right Average DensityCR Density(lb/ft³) % % Void Results 606 602 626 611 0.2674 143.0 7.7 Core WtAir (g) WtSurf (g) WtWater(g) Diff (g) SpecGrav Density(lb/ft³) % % Void Results Test # Tech ID Sam. # Year Begin (ft.) End (ft.) Length (ft) Lane Location Rnd. No. Rnd Sta. (ft) Trans. Loc 5 3H 691 2009 SBL 10+48
Nuclear Left Center Right Average DensityCR Density(lb/ft³) % % Void Results 609 610 613 611 0.2671 143.0 7.7 Core WtAir (g) WtSurf (g) WtWater(g) Diff (g) SpecGrav Density(lb/ft³) % % Void Results
% of Theo. Average 7.1 Range % 1.8 Remarks FIRST LOT OF ADJUSTMENT Testing Group Testing Management Meets Pass Verified BLJ By

64
Table A-10 Rediset WMA Mix Compaction QC Test Results GDOT150 - Control Strip and Asphaltic Compaction (ENGLISH) Plant 4 Project CSSTP-M003-00(837)01 Type 9.5mm SP Level: N/A Lot 09 County 207 District Number: 3 Sample 11/3/2009 Contract ID: B13260-08-000-0 Contractor 2RE390 Ctr. Name: REEVES Area Engineer 314 Item No.: 400 Tech. ID: 3H Blend: RAP Plant MACON Percent 5.6 Gauge No.: 24991 Mode (inches): BS Density Standard 2352 Correction Factor : 31 Corrected Std. 2383 Calibration Factor 1: -1.812613 Calibration Factor 1.272415 Control Strip: N Max % air voids: 7.8 Use Nuclear Or Core Nuclear Theo. 154.9 Target Density Test # Tech ID Sam. # Year Begin (ft.) End (ft.) Length (ft) Lane Location Rnd. No. Rnd Sta. (ft) Trans. Loc 1 3H 715 2009 SBL 4+46
Nuclear Left Center Right Average DensityCR Density(lb/ft³) % % Void Results 599 625 617 614 0.2575 145.0 6.4 Core WtAir (g) WtSurf (g) WtWater(g) Diff (g) SpecGrav Density(lb/ft³) % % Void Results Test # Tech ID Sam. # Year Begin (ft.) End (ft.) Length (ft) Lane Location Rnd. No. Rnd Sta. (ft) Trans. Loc 2 3H 716 2009 SBL 3+91
Nuclear Left Center Right Average DensityCR Density(lb/ft³) % % Void Results 630 588 580 599 0.2515 146.3 5.5 Core WtAir (g) WtSurf (g) WtWater(g) Diff (g) SpecGrav Density(lb/ft³) % % Void Results Test # Tech ID Sam. # Year Begin (ft.) End (ft.) Length (ft) Lane Location Rnd. No. Rnd Sta. (ft) Trans. Loc 3 3H 717 2009 SBL 3+37
Nuclear Left Center Right Average DensityCR Density(lb/ft³) % % Void Results 617 589 600 602 0.2526 146.1 5.7 Core WtAir (g) WtSurf (g) WtWater(g) Diff (g) SpecGrav Density(lb/ft³) % % Void Results Test # Tech ID Sam. # Year Begin (ft.) End (ft.) Length (ft) Lane Location Rnd. No. Rnd Sta. (ft) Trans. Loc 4 3H 718 2009 SBL 3+05
Nuclear Left Center Right Average DensityCR Density(lb/ft³) % % Void Results 626 617 609 617 0.2591 144.7 6.6 Core WtAir (g) WtSurf (g) WtWater(g) Diff (g) SpecGrav Density(lb/ft³) % % Void Results Test # Tech ID Sam. # Year Begin (ft.) End (ft.) Length (ft) Lane Location Rnd. No. Rnd Sta. (ft) Trans. Loc 5 3H 719 2009 SBL 2+59
Nuclear Left Center Right Average DensityCR Density(lb/ft³) % % Void Results 599 588 571 586 0.2459 147.6 4.7 Core WtAir (g) WtSurf (g) WtWater(g) Diff (g) SpecGrav Density(lb/ft³) % % Void Results
% of Theo. Average 5.8 Range % 1.9 Remarks Testing Group Testing Management Meets Pass Verified BLJ By

65
Table A-11 Cecabase RT WMA Mix Compaction QC Test Results GDOT150 - Control Strip and Asphaltic Compaction (ENGLISH) Plant 4 Project CSSTP-M003-00(837)01 Type 9.5mm SP Level: N/A Lot 10 County 207 District Number: 3 Sample 11/4/2009 Contract ID: B13260-08-000-0 Contractor 2RE390 Ctr. Name: REEVES Area Engineer 314 Item No.: 400 Tech. ID: 3H Blend: RAP Plant MACON Percent 5.6 Gauge No.: 24991 Mode (inches): BS Density Standard 2342 Correction Factor : 31 Corrected Std. 2373 Calibration Factor 1: -1.812613 Calibration Factor 1.272415 Control Strip: N Max % air voids: 7.8 Use Nuclear Or Core Nuclear Theo. 154.9 Target Density Test # Tech ID Sam. # Year Begin (ft.) End (ft.) Length (ft) Lane Location Rnd. No. Rnd Sta. (ft) Trans. Loc 1 3H 720 2009 NBL 2+50
Nuclear Left Center Right Average DensityCR Density(lb/ft³) % % Void Results 610 611 590 604 0.2544 145.7 5.9 Core WtAir (g) WtSurf (g) WtWater(g) Diff (g) SpecGrav Density(lb/ft³) % % Void Results Test # Tech ID Sam. # Year Begin (ft.) End (ft.) Length (ft) Lane Location Rnd. No. Rnd Sta. (ft) Trans. Loc 2 3H 721 2009 NBL 2+59
Nuclear Left Center Right Average DensityCR Density(lb/ft³) % % Void Results 588 610 622 607 0.2557 145.4 6.1 Core WtAir (g) WtSurf (g) WtWater(g) Diff (g) SpecGrav Density(lb/ft³) % % Void Results Test # Tech ID Sam. # Year Begin (ft.) End (ft.) Length (ft) Lane Location Rnd. No. Rnd Sta. (ft) Trans. Loc 3 3H 722 2009 NBL 3+21
Nuclear Left Center Right Average DensityCR Density(lb/ft³) % % Void Results 589 622 601 604 0.2545 145.7 5.9 Core WtAir (g) WtSurf (g) WtWater(g) Diff (g) SpecGrav Density(lb/ft³) % % Void Results Test # Tech ID Sam. # Year Begin (ft.) End (ft.) Length (ft) Lane Location Rnd. No. Rnd Sta. (ft) Trans. Loc 4 3H 723 2009 NBL 3+28
Nuclear Left Center Right Average DensityCR Density(lb/ft³) % % Void Results 588 625 600 604 0.2547 145.7 6.0 Core WtAir (g) WtSurf (g) WtWater(g) Diff (g) SpecGrav Density(lb/ft³) % % Void Results Test # Tech ID Sam. # Year Begin (ft.) End (ft.) Length (ft) Lane Location Rnd. No. Rnd Sta. (ft) Trans. Loc 5 3H 724 2009 NBL 3+86
Nuclear Left Center Right Average DensityCR Density(lb/ft³) % % Void Results 588 590 588 589 0.2481 147.1 5.0 Core WtAir (g) WtSurf (g) WtWater(g) Diff (g) SpecGrav Density(lb/ft³) % % Void Results
% of Theo. Average 5.8 Range % 1.1 Remarks Testing Group Testing Management Meets Pass Verified BLJ By

66
APPENDIX B LABORATORY TEST RESULTS
Table B-1 GDOT Basic Mix Volumetric Test – Control Mix
Table B-2 GDOT Mix Volumetric Test – Evotherm WMA Mix
Table B-3 GDOT Mix Volumetric Test – Rediset WMA Mix
Table B-4 GDOT Mix Volumetric Test – Cecabase RT WMA Mix
Table B-5 GDOT Moisture Susceptibility Test– Control Mix
Table B-6 GDOT Moisture Susceptibility Test– Evotherm WMA Mix
Table B-7 GDOT Moisture Susceptibility Test– Rediset WMA Mix
Table B-8 GDOT Moisture Susceptibility Test– Cecabase RT WMA Mix
Table B-9 GDOT Rutting Susceptibility Test (APA) – Control Mix
Table B10 GDOT Rutting Susceptibility Test (APA) – Evotherm WMA Mix
Table B-11 GDOT Rutting Susceptibility Test (APA) – Rediset WMA Mix
Table B-12 GDOT Rutting Susceptibility Test (APA) – Cecabase RT WMA Mix
Table B-13 GDOT DSR Test – Control Mix (1)
Table B-14 GDOT DSR Test – Control Mix (2)
Table B-15 GDOT DSR Test – Evotherm WMA Mix (1)
Table B-16 GDOT DSR Test – Evotherm WMA Mix (2)
Table B-17 GDOT DSR Test – Rediset WMA Mix (1)
Table B-18 GDOT DSR Test – Rediset WMA Mix (2)
Table B-19 GDOT DSR Test – Cecabase RT WMA Mix (1)
Table B-20 GDOT DSR Test – Cecabase RT WMA Mix (2)

67
Table B-1 GDOT Basic Mix Volumetric Test – Control Mix
Asphalt Content
Test Result: 5.18%
Calibration Factor: -0.28%
Adjusted %AC: 5.46%
AASHTO T-209 Test Results
Theorectical Max. Specific Gravity, Bowl Determination
Binder Content, %AC 5.46% 5.46%
Bowl Number 1 2
Weight of Bowl in Air, g 2192 2197.1
Weight of Bowl in Water, g 1383.9 1387
Test Weights
Weight of Sample + Bowl in Air, g 3711.8 3713.3
Weight of Sample + Bowl in Water, g 2293 2295.9
Calculations
Weight of Sample in Air, g 1519.8 1516.2
Weight of Sample in Water, g 909.1 908.9 Theoretical Max. Specific Gravity,
Gmm 2.489 2.497
Average Gmm 2.493
Effective Stone Gravity Calculations (Gse)
Binder Content, %AC 5.46%
Specific Gravity of AC 1.031
Theoretical Max. Specific Gravity, Gmm 2.493
Effective Stone Gravity, Gse 2.715
AASHTO T-166 Test Results
Bulk Specific Gravity of Compacted Bituminous Mixtures
Binder Content, %AC 5.46% 5.46%
Dry Weight in Air, g 4803.0 4798.5
Submerged Weight, g 2836.3 2834.0
SSD Weight, g 4808.5 4803.6
Bulk Specific Gravity, Gmb 2.435 2.436
% Water Absorbed by Volume 0.28% 0.26%
Theoretical Max. Specific Gravity, Gmm 2.493 2.493
% Voids in Total Mix (VTM) 2.3 2.3
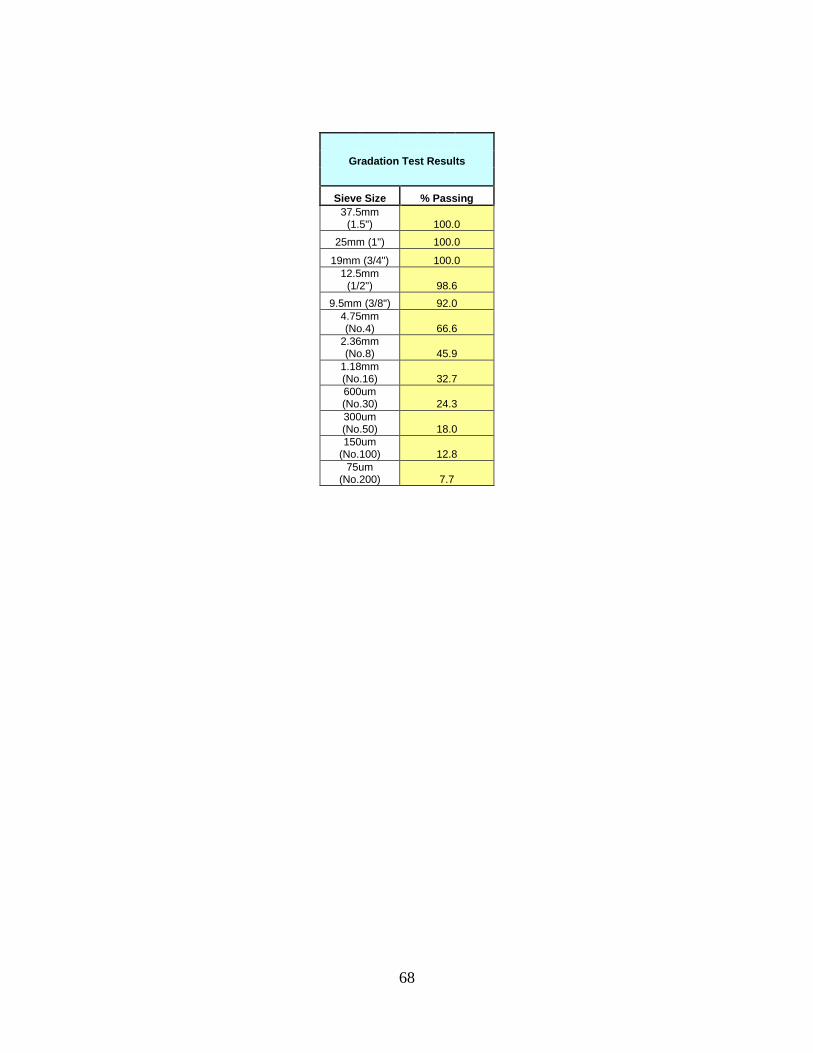
68
Gradation Test Results
Sieve Size % Passing 37.5mm
(1.5") 100.0
25mm (1") 100.0
19mm (3/4") 100.0 12.5mm
(1/2") 98.6
9.5mm (3/8") 92.0 4.75mm (No.4) 66.6
2.36mm (No.8) 45.9
1.18mm (No.16) 32.7 600um (No.30) 24.3 300um (No.50) 18.0 150um
(No.100) 12.8 75um
(No.200) 7.7

69
Table B-2 GDOT Basic Mix Volumetric Test – Evotherm Mix
Asphalt Content
Test Result: 5.53%
Calibration Factor: -0.28%
Adjusted %AC: 5.81%
AASHTO T-209 Test Results
Theorectical Max. Specific Gravity, Bowl Determination
Binder Content, %AC 5.81% 5.81%
Bowl Number 1 2
Weight of Bowl in Air, g 2192 2197.1
Weight of Bowl in Water, g 1383.9 1387
Test Weights
Weight of Sample + Bowl in Air, g 3707.6 3712.6
Weight of Sample + Bowl in Water, g 2287.5 2291.7
Calculations
Weight of Sample in Air, g 1515.6 1515.5
Weight of Sample in Water, g 903.6 904.7 Theoretical Max. Specific Gravity,
Gmm 2.476 2.481
Average Gmm 2.479
Effective Stone Gravity Calculations (Gse)
Binder Content, %AC 5.81%
Specific Gravity of AC 1.031 Theoretical Max. Specific Gravity,
Gmm 2.479
Effective Stone Gravity, Gse 2.714
AASHTO T-166 Test Results
Bulk Specific Gravity of Compacted Bituminous Mixtures
Binder Content, %AC 5.81% 5.81%
Dry Weight in Air, g 5046.0 5042.2
Submerged Weight, g 2978.5 2983.9
SSD Weight, g 5050.2 5046.7
Bulk Specific Gravity, Gmb 2.436 2.444
% Water Absorbed by Volume 0.20% 0.22% Theoretical Max. Specific Gravity,
Gmm 2.479 2.479
% Voids in Total Mix (VTM) 1.7 1.4

70
Gradation Test Results
Sieve Size % Passing 37.5mm
(1.5") 100.0
25mm (1") 100.0
19mm (3/4") 100.0 12.5mm
(1/2") 98.2
9.5mm (3/8") 91.5 4.75mm (No.4) 61.6
2.36mm (No.8) 42.1
1.18mm (No.16) 30.3 600um (No.30) 22.8 300um (No.50) 17.0 150um
(No.100) 12.1 75um
(No.200) 7.6

71
Table B-3 GDOT Basic Mix Volumetric Test – Rediset Mix
Asphalt Content
Test Result: 5.60%
Calibration Factor: -0.28%
Adjusted %AC: 5.88%
AASHTO T-209 Test Results
Theorectical Max. Specific Gravity, Bowl Determination
Binder Content, %AC 5.88% 5.88%
Bowl Number 1 2
Weight of Bowl in Air, g 2192 2197.1
Weight of Bowl in Water, g 1383.9 1387
Test Weights
Weight of Sample + Bowl in Air, g 3709.3 3714
Weight of Sample + Bowl in Water, g 2291.5 2295
Calculations
Weight of Sample in Air, g 1517.3 1516.9
Weight of Sample in Water, g 907.6 908 Theoretical Max. Specific Gravity,
Gmm 2.489 2.491
Average Gmm 2.490
Effective Stone Gravity Calculations (Gse)
Binder Content, %AC 5.88%
Specific Gravity of AC 1.031 Theoretical Max. Specific Gravity,
Gmm 2.490
Effective Stone Gravity, Gse 2.731
AASHTO T-166 Test Results
Bulk Specific Gravity of Compacted Bituminous Mixtures
Binder Content, %AC 5.88% 5.88%
Dry Weight in Air, g 4800.7 4800.8
Submerged Weight, g 2850.8 2848.5
SSD Weight, g 4805.6 4805.3
Bulk Specific Gravity, Gmb 2.456 2.453
% Water Absorbed by Volume 0.25% 0.23% Theoretical Max. Specific Gravity,
Gmm 2.490 2.490
% Voids in Total Mix (VTM) 1.4 1.5

72
Gradation Test Results
Sieve Size % Passing 37.5mm
(1.5") 100.0
25mm (1") 100.0
19mm (3/4") 100.0 12.5mm
(1/2") 99.1
9.5mm (3/8") 91.4 4.75mm (No.4) 64.4
2.36mm (No.8) 44.1
1.18mm (No.16) 31.5 600um (No.30) 23.7 300um (No.50) 17.9 150um
(No.100) 12.8 75um
(No.200) 7.8

73
Table B-4 GDOT Basic Mix Volumetric Test – Cecabase RT Mix
Asphalt Content
Test Result: 5.55%
Calibration Factor: -0.28%
Adjusted %AC: 5.83%
AASHTO T-209 Test Results
Theorectical Max. Specific Gravity, Bowl Determination
Binder Content, %AC 5.83% 5.83%
Bowl Number 1 2
Weight of Bowl in Air, g 2192 2197.1
Weight of Bowl in Water, g 1383.9 1387
Test Weights
Weight of Sample + Bowl in Air, g 3710.3 3713
Weight of Sample + Bowl in Water, g 2289.4 2290.7
Calculations
Weight of Sample in Air, g 1518.3 1515.9
Weight of Sample in Water, g 905.5 903.7 Theoretical Max. Specific Gravity,
Gmm 2.478 2.476
Average Gmm 2.477
Effective Stone Gravity Calculations (Gse)
Binder Content, %AC 5.83%
Specific Gravity of AC 1.031 Theoretical Max. Specific Gravity,
Gmm 2.477
Effective Stone Gravity, Gse 2.712
AASHTO T-166 Test Results
Bulk Specific Gravity of Compacted Bituminous Mixtures
Binder Content, %AC 5.83% 5.83%
Dry Weight in Air, g 4801.5 4799.4
Submerged Weight, g 2829.4 2830.0
SSD Weight, g 4806.1 4804.1
Bulk Specific Gravity, Gmb 2.429 2.431
% Water Absorbed by Volume 0.23% 0.24% Theoretical Max. Specific Gravity,
Gmm 2.477 2.477
% Voids in Total Mix (VTM) 1.9 1.8

74
Gradation Test Results
Sieve Size % Passing 37.5mm
(1.5") 100.0
25mm (1") 100.0
19mm (3/4") 100.0 12.5mm
(1/2") 98.4
9.5mm (3/8") 94.3 4.75mm (No.4) 69.0
2.36mm (No.8) 46.5
1.18mm (No.16) 32.8 600um (No.30) 24.3 300um (No.50) 18.1 150um
(No.100) 12.8 75um
(No.200) 8.0

75
Table B-5 GDOT Moisture Susceptibility Test– Control Mix
Control Conditioned Sample Number 2 3 4 1 5 6
Binder Content, % 5.46% 5.46% 5.46% 5.46% 5.46% 5.46% Height (mm) 95.0 95.0 95.1 95.0 95.0 95.0
Dry Weight in Air 3792.8 3789.0 3787.7 3786.3 3788.0 3791.4 Submerged
Weight 2183.8 2162.6 2169.4 2173.9 2171.7 2176.6 SSD Weight 3821.3 3811.7 3811.9 3813.5 3813.6 3815.5 Bulk Specific
Gmb 2.316 2.298 2.306 2.309 2.307 2.313 Theoretical Gmm 2.493 2.493 2.493 2.493 2.493 2.493 % Voids (VTM) 7.077 7.823 7.485 7.355 7.444 7.191
Control Conditioned Sample 2 3 4 1 5 6
Stability (lbs) 3886 3847 3967 3880 4415 4447 Height (inches) 3.74 3.74 3.74 3.74 3.74 3.74
Strip Rating - - - 1 1 1 PSI 110.237 109.131 112.417 110.595 110.067 125.244 126.152 120.487
Average Average
%Retained 108.9%

76
Table B-6 GDOT Moisture Susceptibility Test– Evotherm Mix
Control Conditioned Sample Number 3 4 5 1 2 6
Binder Content, % 5.81% 5.81% 5.81% 5.81% 5.81% 5.81% Height (mm) 95.0 95.0 95.1 95.0 95.0 95.0
Dry Weight in Air 3793.7 3791.2 3789.2 3789.7 3789.2 3789.5 Submerged
Weight 2172.2 2170.1 2164.5 2174.4 2166.8 2168.0 SSD Weight 3820.6 3808.1 3806.1 3814.8 3806.5 3807.4 Bulk Specific
Gmb 2.301 2.315 2.308 2.310 2.311 2.312 Theoretical Gmm 2.479 2.479 2.479 2.479 2.479 2.479 % Voids (VTM) 7.156 6.628 6.882 6.801 6.774 6.749
Control Conditioned Sample 3 4 5 1 2 6
Stability (lbs) 3384 2836 2803 3578 3215 3693 Height (inches) 3.74 3.74 3.74 3.74 3.74 3.74
Strip Rating - - - 1 1 1 PSI 95.997 80.451 79.431 85.293 101.500 91.202 104.762 99.155
Average Average
%Retained 116.3%
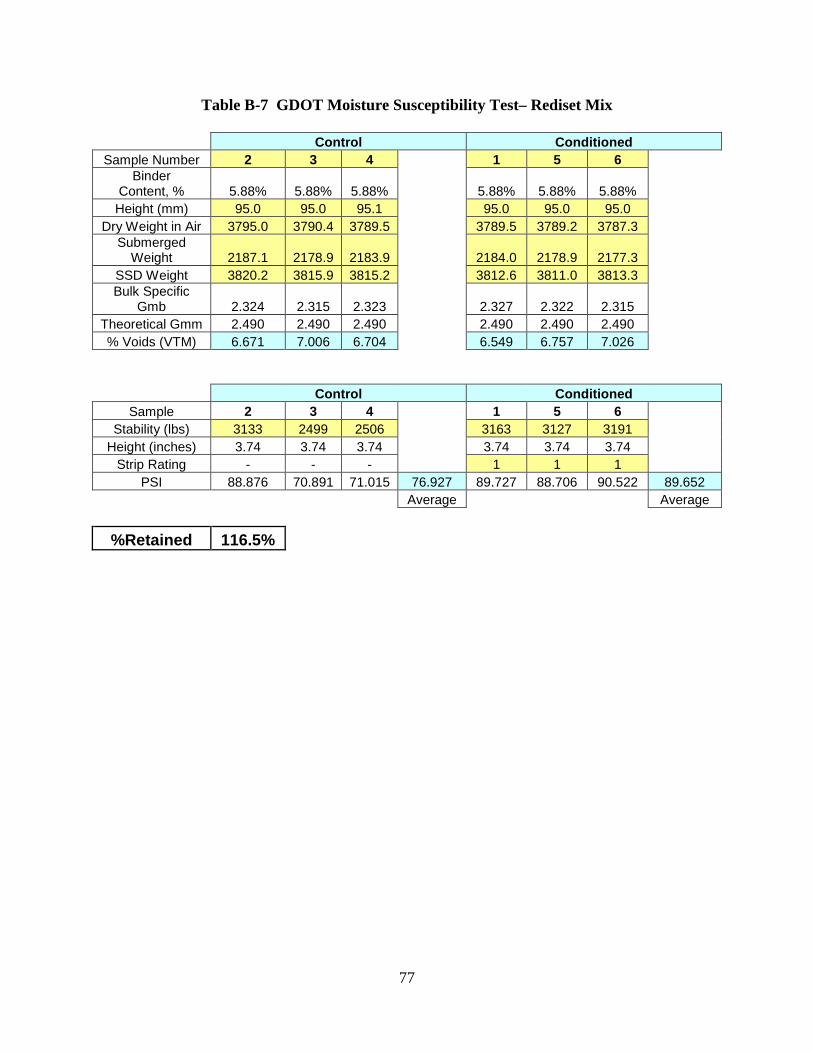
77
Table B-7 GDOT Moisture Susceptibility Test– Rediset Mix
Control Conditioned Sample Number 2 3 4 1 5 6
Binder Content, % 5.88% 5.88% 5.88% 5.88% 5.88% 5.88% Height (mm) 95.0 95.0 95.1 95.0 95.0 95.0
Dry Weight in Air 3795.0 3790.4 3789.5 3789.5 3789.2 3787.3 Submerged
Weight 2187.1 2178.9 2183.9 2184.0 2178.9 2177.3 SSD Weight 3820.2 3815.9 3815.2 3812.6 3811.0 3813.3 Bulk Specific
Gmb 2.324 2.315 2.323 2.327 2.322 2.315 Theoretical Gmm 2.490 2.490 2.490 2.490 2.490 2.490 % Voids (VTM) 6.671 7.006 6.704 6.549 6.757 7.026
Control Conditioned Sample 2 3 4 1 5 6
Stability (lbs) 3133 2499 2506 3163 3127 3191 Height (inches) 3.74 3.74 3.74 3.74 3.74 3.74
Strip Rating - - - 1 1 1 PSI 88.876 70.891 71.015 76.927 89.727 88.706 90.522 89.652
Average Average
%Retained 116.5%

78
Table B-8 GDOT Moisture Susceptibility Test– Cecabase RT Mix
Control Conditioned Sample Number 1 3 6 2 5 4
Binder Content, % 5.83% 5.83% 5.83% 5.83% 5.83% 5.83% Height (mm) 95.0 95.0 95.1 95.0 95.0 95.0
Dry Weight in Air 3790.8 3788.2 3785.7 3791.7 3788.8 3789.4 Submerged
Weight 2170.2 2168.2 2163.8 2169.4 2167.6 2170.9 SSD Weight 3812.6 3808.8 3804.9 3812.0 3810.1 3811.2 Bulk Specific
Gmb 2.308 2.309 2.307 2.308 2.307 2.310 Theoretical Gmm 2.477 2.477 2.477 2.477 2.477 2.477 % Voids (VTM) 6.815 6.777 6.867 6.805 6.870 6.731
Control Conditioned Sample 1 3 6 2 5 4
Stability (lbs) 3268 2695 2597 3208 3054 3020 Height (inches) 3.74 3.74 3.74 3.74 3.74 3.74
Strip Rating - - - 2 1 2 PSI 92.706 76.451 73.594 80.917 91.004 86.635 85.671 87.770
Average Average
%Retained 108.5%
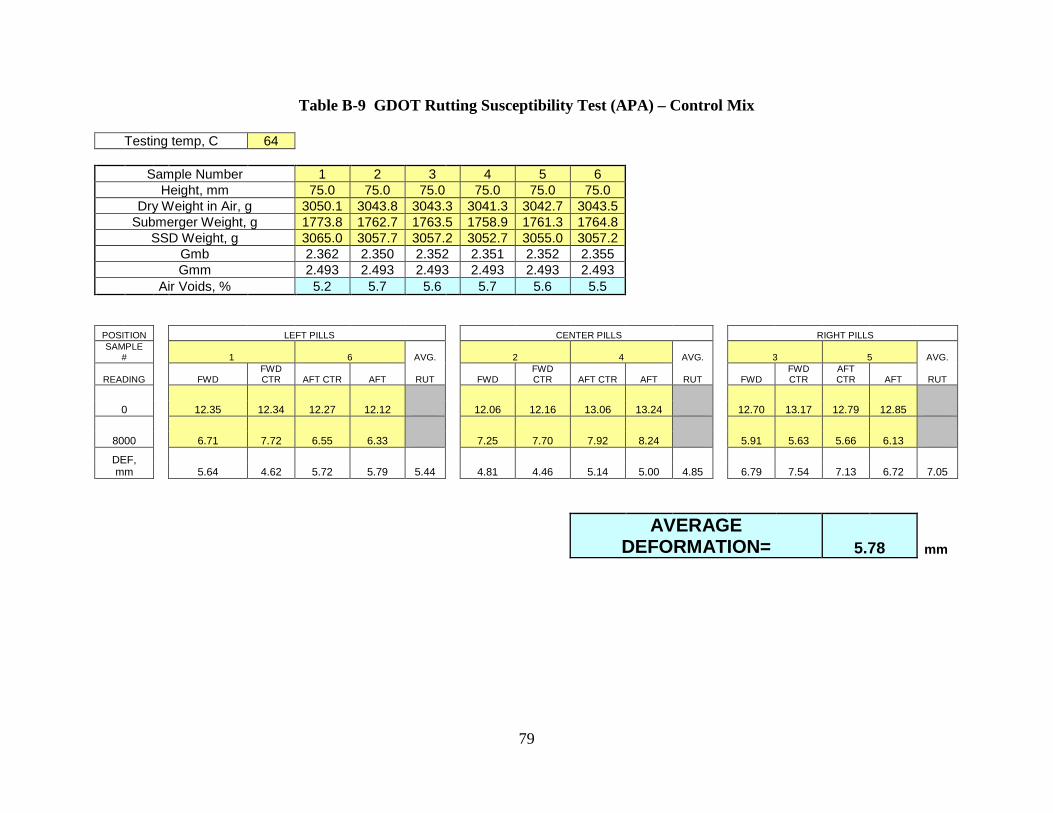
79
Table B-9 GDOT Rutting Susceptibility Test (APA) – Control Mix
Testing temp, C 64
Sample Number 1 2 3 4 5 6 Height, mm 75.0 75.0 75.0 75.0 75.0 75.0
Dry Weight in Air, g 3050.1 3043.8 3043.3 3041.3 3042.7 3043.5 Submerger Weight, g 1773.8 1762.7 1763.5 1758.9 1761.3 1764.8
SSD Weight, g 3065.0 3057.7 3057.2 3052.7 3055.0 3057.2 Gmb 2.362 2.350 2.352 2.351 2.352 2.355 Gmm 2.493 2.493 2.493 2.493 2.493 2.493
Air Voids, % 5.2 5.7 5.6 5.7 5.6 5.5
POSITION LEFT PILLS CENTER PILLS RIGHT PILLS SAMPLE
# 1 6 AVG. 2 4 AVG. 3 5 AVG.
READING FWD FWD CTR AFT CTR AFT RUT FWD
FWD CTR AFT CTR AFT RUT FWD
FWD CTR
AFT CTR AFT RUT
0 12.35 12.34 12.27 12.12 12.06 12.16 13.06 13.24 12.70 13.17 12.79 12.85
8000 6.71 7.72 6.55 6.33 7.25 7.70 7.92 8.24 5.91 5.63 5.66 6.13
DEF, mm 5.64 4.62 5.72 5.79 5.44 4.81 4.46 5.14 5.00 4.85 6.79 7.54 7.13 6.72 7.05
AVERAGE DEFORMATION= 5.78 mm

80
Table B-10 GDOT Rutting Susceptibility Test (APA) – Evotherm Mix
Testing temp, C 64
Sample Number 1 2 3 4 5 6 Height, mm 75.0 75.0 75.0 75.0 75.0 75.0
Dry Weight in Air, g 3047.9 3044.9 3045.6 3044.9 3044.0 3044.3 Submerger Weight, g 1761.9 1759.8 1759.8 1760.9 1756.4 1756.9
SSD Weight, g 3057.6 3053.7 3053.7 3053.8 3053.9 3052.3 Gmb 2.352 2.353 2.354 2.355 2.346 2.350 Gmm 2.479 2.479 2.479 2.479 2.479 2.479
Air Voids, % 5.1 5.1 5.0 5.0 5.4 5.2
POSITION LEFT PILLS CENTER PILLS RIGHT PILLS SAMPLE
# 1 2 AVG. 3 6 AVG. 4 5 AVG.
READING FWD FWD CTR AFT CTR AFT RUT FWD
FWD CTR AFT CTR AFT RUT FWD
FWD CTR
AFT CTR AFT RUT
0 11.02 12.18 12.63 12.82 12.50 12.31 12.94 13.33 12.26 12.37 12.65 13.08
8000 6.09 6.63 6.63 7.14 7.09 7.09 6.81 7.14 4.30 4.52 3.59 4.45
DEF, mm 4.93 5.55 6.00 5.68 5.54 5.41 5.22 6.13 6.19 5.74 7.96 7.85 9.06 8.63 8.38
AVERAGE DEFORMATION= 6.55 mm

81
Table B-11 GDOT Rutting Susceptibility Test (APA) – Rediset Mix
Testing temp, C 64
Sample Number 1 2 3 4 5 6 Height, mm 75.0 75.0 75.0 75.0 75.0 75.0
Dry Weight in Air, g 3043.1 3037.6 3039.6 3043.7 3041.0 3042.3 Submerger Weight, g 1760.6 1755.3 1753.1 1760.3 1759.3 1763.5
SSD Weight, g 3055.6 3048.1 3048.8 3052.0 3051.7 3053.2 Gmb 2.350 2.350 2.346 2.356 2.353 2.359 Gmm 2.490 2.490 2.490 2.490 2.490 2.490
Air Voids, % 5.6 5.6 5.8 5.4 5.5 5.3
POSITION LEFT PILLS CENTER PILLS RIGHT PILLS SAMPLE
# 1 2 AVG. 3 5 AVG. 4 6 AVG.
READING FWD FWD CTR AFT CTR AFT RUT FWD
FWD CTR AFT CTR AFT RUT FWD
FWD CTR
AFT CTR AFT RUT
0 11.65 12.57 12.71 12.67 12.46 12.62 12.98 12.96 11.88 11.91 12.91 12.99
8000 6.66 7.72 6.59 6.69 7.07 6.74 6.30 6.66 6.54 6.27 6.52 7.02
DEF, mm 4.99 4.85 6.12 5.98 5.49 5.39 5.88 6.68 6.30 6.06 5.34 5.64 6.39 5.97 5.84
AVERAGE DEFORMATION= 5.79 mm
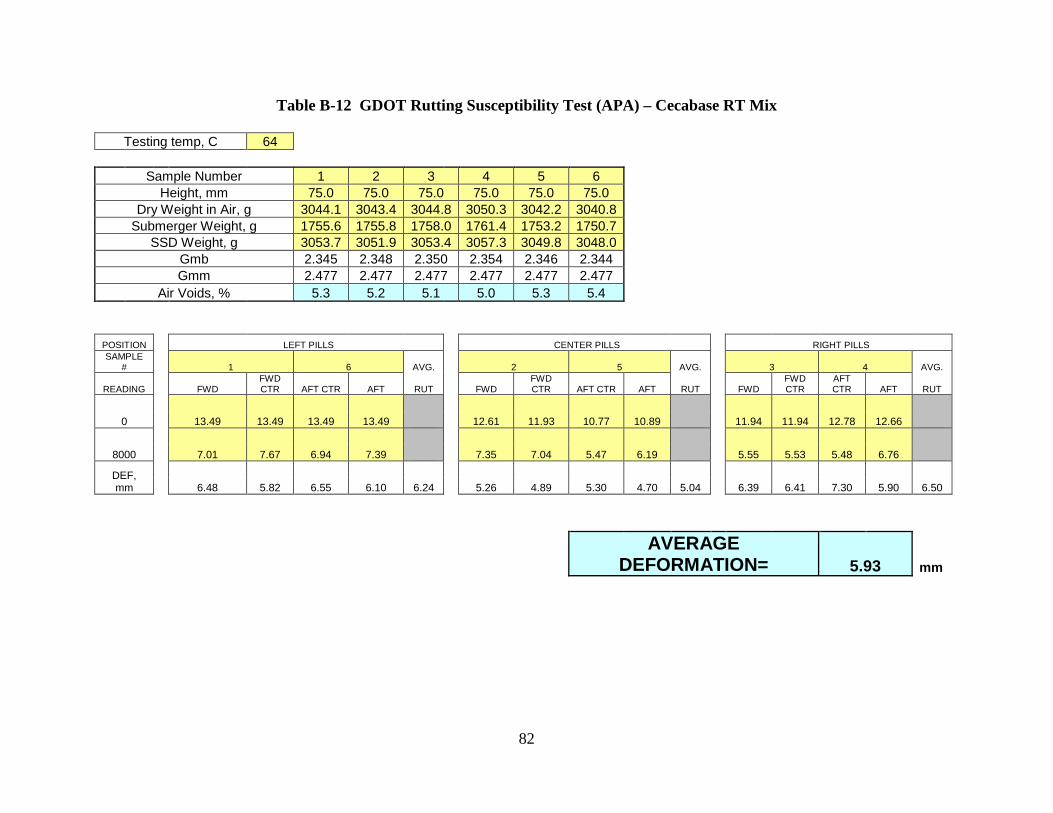
82
Table B-12 GDOT Rutting Susceptibility Test (APA) – Cecabase RT Mix
Testing temp, C 64
Sample Number 1 2 3 4 5 6 Height, mm 75.0 75.0 75.0 75.0 75.0 75.0
Dry Weight in Air, g 3044.1 3043.4 3044.8 3050.3 3042.2 3040.8 Submerger Weight, g 1755.6 1755.8 1758.0 1761.4 1753.2 1750.7
SSD Weight, g 3053.7 3051.9 3053.4 3057.3 3049.8 3048.0 Gmb 2.345 2.348 2.350 2.354 2.346 2.344 Gmm 2.477 2.477 2.477 2.477 2.477 2.477
Air Voids, % 5.3 5.2 5.1 5.0 5.3 5.4
POSITION LEFT PILLS CENTER PILLS RIGHT PILLS SAMPLE
# 1 6 AVG. 2 5 AVG. 3 4 AVG.
READING FWD FWD CTR AFT CTR AFT RUT FWD
FWD CTR AFT CTR AFT RUT FWD
FWD CTR
AFT CTR AFT RUT
0 13.49 13.49 13.49 13.49 12.61 11.93 10.77 10.89 11.94 11.94 12.78 12.66
8000 7.01 7.67 6.94 7.39 7.35 7.04 5.47 6.19 5.55 5.53 5.48 6.76
DEF, mm 6.48 5.82 6.55 6.10 6.24 5.26 4.89 5.30 4.70 5.04 6.39 6.41 7.30 5.90 6.50
AVERAGE DEFORMATION= 5.93 mm

83
Table B-13 GDOT DSR Test – Control Mix (1)

84
Table B-14 GDOT DSR Test – Control Mix (2)

85
Table B-15 GDOT DSR Test – Evotherm Mix (1)

86
Table B-16 GDOT DSR Test – Evotherm Mix (2)

87
Table B-17 GDOT DSR Test – Rediset Mix (1)

88
Table B-18 GDOT DSR Test – Rediset Mix (2)

89
Table B-19 GDOT DSR Test – Cecabase RT Mix (1)

90
Table B-20 GDOT DSR Test – Cecabase RT Mix (2)

91
APPENDIX C WARM-MIX ASPHALT HYDROCARBON EMISSIONS SCOPING STUDY
Report entitled, “Warm-Mix Asphalt Hydrocarbon Emissions Scoping Study” prepared by A. Samoylov and M. Rodgers

92
Warm-Mix Asphalt Hydrocarbon Emissions Scoping Study
Alexander Samoylov & Michael Rodgers, Ph.D
Air Quality Group
Aerospace, Transportation and Advanced Systems Laboratory
February 2010
93
TABLE OF CONTENTS
Introduction ............................................................................................................................... 94
Measurement Approach ............................................................................................................ 94
Asphalt Plant Measurements ..................................................................................................... 97
Paving Site Measurements......................................................................................................... 97
Evotherm Additive ..................................................................................................................... 98
Control Mix and Low Concentration Rediset Additive ............................................................. 100
Rediset Additive……….. ............................................................................................................. 104
CECA Additive……………………. .................................................................................................... 106
Conclusions………………………………………………………………………………………………………………………… 109
Appendix .................................................................................................................................. 110
Cone Descriptions…………………………………………………………………………………………………….. ...... 110
Data Tables……….. ................................................................................................................ 111

94
Introduction
This report provides results of a preliminary scoping study to determine the relative magnitude of hydrocarbon emissions arising from the use of various warm mix asphalt (WMA) blends being considered for use by the Georgia Department of Transportation. An important consideration in the use of all asphalt mixtures is their potential for emissions of Volatile Organic Compounds (VOC) that are important precursors to photochemical smog and the creation of secondary fine particulate matter (PM2.5). Significant increases or decreases in VOC emissions from these WMA mixtures relative to current asphalts could either positively or negatively impact their desirability as a replacement for current mixtures. Determination of absolute emissions rates from industrial processes is normally a costly and difficult process as these emissions rates are often strongly impacted by local environmental conditions and normal variations in the process being measured. This natural variability means that obtaining good quantitative results normally requires a large number of replicate measurements across a range of environmental and process conditions with extensive micrometeorological support and specialized instrumentation and apparatus. As a result, these quantitative experiments tend to be time consuming and costly and tend to be limited to those emissions that are both significant and likely to be substantially different from other processes in which the emissions rates are already known. For this reason, scoping studies are often undertaken to ascertain whether emissions from a new process are likely to be substantially different from the one that it replaces. This study was conceived as a “first look” or scoping study to determine whether VOC emissions from these WMA mixtures were significantly higher, lower or comparable to those observed from a current asphalt mix and to ascertain the need for a more comprehensive study.
Measurement Approach
The basic study approach was to compare observed VOC concentrations just above surface of various WMA blends with those associated with a control mix using both free air and an open topped chamber (cone). Measurements of surface fluxes using near surface concentration measurements normally require the use of eddy correlation, gradient or Bowen ratio methods that require substantial ancillary micrometeorological measurements in addition to the concentration measurements. In the case of asphalt mixtures, this need for extensive supporting meteorological measurements is greatly reduced since the surface temperature of the asphalt mix (260 to 300 degrees Fahrenheit) is so high relative to that of the ambient air that the near surface energy balance is almost completely controlled by the asphalt mix at least so long as the surface winds are not too high. Thus for this scoping study measurements were limited to evaluation of the near surface concentration gradients and exhaust concentrations from the open topped chambers based on the assumption that ventilation rates induced by the surface temperature conditions were comparable for all of the mixtures. While, of course, this approximation is not strictly true due to variations in environmental conditions, it is believed to be a sufficiently accurate to determine if the relative emissions from the WMA mixtures were significantly (i.e. more than a factor of two) higher or lower or comparable to that of the control mix.

95
All VOC measurements made during the study were performed using a Siemens Ultramat 23® Non-Dispersive Infrared (NDIR) detector equipped with a heated type 316 stainless steel inlet system. Measurements were made at distances 3, 10, 30, and 100 cm above the surface of the asphalt mixtures in open air and at the exhaust from a variety of simple open-topped chambers3 with a six second measurement update cycle. These VOC measurements were conducted on WMA mixtures containing three different additives as well as a control mixture that was a regular mixture approved by Georgia Department of Transportation for use on state roads. The additives used in the WMA mixtures used in this study were provided by Evotherm, Rediset, and CECA. The VOC measurements on the asphalt mixtures were performed in two separate locations. The first of these locations was at the asphalt plant operated by Aggregate USA near Macon, GA. The second location was at a paving site on State Route 42 near Forsyth, GA. Both locations are illustrated on Figure 1 below.
Figure 1: Location of asphalt plant and paving site used for study measurements
Table 1 gives more specific information regarding the measurement program including measurement day, general environmental conditions, asphalt temperatures and pavement status.
3 These chambers were employed to reduce the impact of wind conditions. As many of these chambers were standard traffic cones these chambers are marked in this report as cones (See cone description in Appendix A).
Aggregate USA Asphalt Plant Paving Site

96
Table 3: Study Conditions
Day# Date Additive Measured
Temp Morning, (deg F)
Temp Afternoon,
(deg F)
Wind Conditions
Humidity Asphalt Temperature
Pavement Rolled
Pavement Unrolled
300F 280F 260F
1 10/29/2009 Evotherm 40-45 55-60 Strong Medium X X X
2 10/30/2009
Low Rediset / Control
Mix
40-45 50-55 Light High X X X
3 11/3/2009 Rediset 40-45 55-60 Moderate Medium X X X X
4 11/4/2009 CECA 45-50 60-65 Light Medium X X X X X

97
Asphalt Plant Measurements
The VOC measurements at the asphalt plant shortly after, usually within 1-2 minutes, the asphalt was dispensed from the surge bin to ensure that the deviations between sampling and measured temperatures were minimized. All measurements were made near the center of the truck bed at distances of 1, 3, 10, 30, and 100 centimeters from the asphalt surface using a heated stainless steel line and a Siemens Ultramat 23® NDIR detector4. In addition to these open air measurement some semi-controlled measurements were performed using open topped chambers (cones) resting on the asphalt surface. Several measurements were excluded from the data set because delay between truck loading and the time the vehicle was made available for the measurements was too great (i.e. more than 20 minutes).
Figure 2: Reeves Asphalt Plant near Macon, GA
Paving Site Measurements
Measurements at the paving site were done on location by using the same general approach as that used for the asphalt plant measurements. In this case the stainless steel inlet was placed close to the centerline of the freshly dispensed asphalt. Measurements were performed in two separate stages. Stage one (labeled unrolled in the tables) was conducted after the asphalt mix was dispensed from the paver but before rollers had a chance to compact the asphalt. In the second stage (labeled rolled in the tables) was performed after the rollers had completed at least one pass and packed down the asphalt. Figure 3 shows a typical view of the sample paving site location.
4 This NDIR system evaluates hydrocarbon concentrations through optical absorption in the middle infrared spectral region associated with the C-H stretch and reports values in terms of concentration of an equivalent reference gas (n-hexane).

98
Figure 3: View of paving site near Forsyth, GA
Evotherm Additive
The Evotherm additive WMA was tested on October 29th 2009. In the morning hours, ambient temperature ranged from 40-45 oF and were associated with the very strong winds. These winds moderated significantly in the afternoon and ambient temperatures rose to 55-60 oF. VOC measurements were conducted at three different WMA temperature ranges: 300oF, 280oF and 260oF and were conducted only at the asphalt plant. The results of the measurements are shown in Figures 4, 5 and 6 respectively. These data are also tabulated in Tables 2, 3, and 4 in the appendix.

99
Evotherm Additive HC Emissions Asphalt Plant
0
5
10
15
20
25
30
1 3 10 30 100 Cone
Distance, cm
HC
, ppm 300F
280F
260F
Figure 4: Evotherm Additive VOC concentrations at asphalt plant by temperature
Evotherm Additive HC Emissions Asphalt Plant
0
5
10
15
20
25
30
0 20 40 60 80 100 120
Distance, cm
HC
, ppm 300F
280F
260F
Figure 5: Evotherm Additive VOC concentrations at asphalt plant by distance above asphalt surface

100
Evotherm Additive HC Emissions Asphalt Plant
0
5
10
15
20
25
30
1 10 100
Log Scale
HC
, ppm
300F
280F
260F
Figure 6: Evotherm Additive asphalt plant VOC concentrations Log Scale
Control Mix and Low Concentration Rediset Additive
Measurements of the control mix and low concentration of Rediset additive were done on October 30th, 2009. Weather conditions for that day were considerably different from the day before. Temperatures were between 45 oF and 55 oF with the high humidity and light drizzle that became light rain at times. Winds were very light. The Rediset Additive WMA mixture at 300 o F was measured first. However, it became apparent the next day that an incorrect proportion of Rediset additive was added to asphalt mix. Only approximately 30% of Rediset additive dissolved in the asphalt mix. Measurement results for this low Rediset additive can be seen on Figure 7 and in Table 5 of the appendix. Measurements for the Regular/Control mix were also made in the same day. Results from the control mix are presented in Figures 8 and 9 and in Table 6 of the appendix. As for the low concentration Rediset additive, the control mix was measured only at 300 o F.

101
Asphalt Plant Rediset Low Dose and Control Mix HC Emissions
0
2
4
6
8
10
12
14
16
1 3 10 30 100 Cone
Distance, cm
HC
, ppm
RediSet with Low Dose of Additive Control mix
Figure 7: Incorrect Rediset Additive Asphalt Plant VOC Measurements
Asphalt Plant Rediset Low Dose and Control Mix HC Emissions
0
2
4
6
8
10
12
14
16
0 20 40 60 80 100 120
Distance, cm
HC
, ppm
RediSet with Low Dose of Additive Control mix
Figure 8: Incorrect Rediset Additive Asphalt Plant VOC Measurements

102
Asphalt Plant Rediset Low Dose and Control Mix HC Emissions, Log Scale
0
2
4
6
8
10
12
14
16
1 10 100
Log Scale
HC
, ppm
RediSet with Low Dose of Additive Control mix
Figure 9: Incorrect Rediset Additive Asphalt Plant VOC Measurements Log Scale In addition to the asphalt plant measurements, measurements at the paving site were also performed using both open air and chamber measurements. These data are summarized in Figure 10 and in Table 7 and Table 8 of the Appendix.
Paving Site HC Measurements
1
6
11
16
21
26
31
10 30 100 Cone
Distance
HC
, ppm Unrolled
Rolled
Figure 10: Regular Control Mix Paving Site VOC Measurements

103
Paving Site HC Measurements
20
21
22
23
24
25
26
27
28
29
30
0 10 20 30 40 50 60 70 80 90 100
Distance
HC
, ppm Unrolled
Rolled
Figure 11: Regular Control Mix Paving Site VOC Measurements
Paving Site HC Measurements Log Scale
20
21
22
23
24
25
26
27
28
29
30
10 100
Log Scale
HC
, ppm Unrolled
Rolled
Figure 12: Regular Control Mix Paving Site VOC Measurements Log Scale
These results show a high degree of consistency between the low concentration of Rediset additive and regular mix asphalt from the asphalt plant. In other words, low concentration of the

104
Rediset additive did not have any measureable effect on VOC concentration compared to the control mix. When we look at the results from the paving site we also see that rolled and unrolled measurements of VOC concentrations are very similar. Rolled asphalt appears to be a slightly stronger source of VOC emission but given the variability of external conditions and the small absolute difference, the differences between rolled and unrolled asphalt are minimal.
Rediset Additive
The correct concentration of Rediset additive was tested on November 30th, 2009. In the morning temperatures were 40 oF -45 oF with very light wind conditions and in the afternoon it reached 55 oF - 60oF with the wind increasing and becoming moderate. The Rediset additive asphalt plant VOC measurements were performed at two temperatures points of 300 oF and 280 oF. Results of these measurements are summarized in Figure 13 and in Tables 9 and 10 in the Appendix. Measurements were also conducted at the paving site. Results from these rolled and unrolled measurements are compared with the plant results in Figures 14 and 15 and in more detail in Table 11 (unrolled) and Table 12 (rolled) in the Appendix.
Rediset Plant Meas at 300F and 280F
0
5
10
15
20
25
30
1 3 10 30 100 Cone1 Cone 2 Cone 3 Cone 4
Distance, cm
C6
H1
4, p
pm
300F
280F
Figure 13:3 Rediset Additive Asphalt Plant VOC Measurements

105
Rediset Additive Day 3 HC Measurements
0
5
10
15
20
25
30
0 20 40 60 80 100 120
Distance, cm
C6
H1
4, p
pm 280F
300F
Unrolled
Rolled
Figure 14: Rediset Additive VOC Measurements
Rediset Additive Day 3 HC Measurements
0
5
10
15
20
25
30
1 10 100
Log Scale
C6
H1
4, p
pm 280F
300F
Unrolled
Rolled
Figure 15: Rediset VOC Measurements Log Scale
From these results we observe no significant differences between the 280 oF and 300 oF WMA mixtures with the Rediset additive. Likewise, there was no difference for rolled and unrolled paving conditions.

106
CECA Additive
CECA additive measurements were carried out on November 4th, 2009. Temperatures in the morning hours were between 45 oF - 50 oF and in the afternoon between 60 oF - 65oF with light wind conditions. Measurements of asphalt mix containing CECA additive were made at the asphalt plant for all three temperature ranges: 300oF, 280oF, and 260oF (Tables 13, 14, 15 in the Appendix). Open air and results from three different cones are illustrated in Figures 16 and 17. VOC concentration measurements were made at the paving site for mixtures of CECA additive at 260oF and at 300oF. Detailed results are presented in Tables 16-19 of the Appendix. The same results are shown in Figure 18 (linear height scale) and Figure 19 (log height scale) for the open air measurements. Figure 20 shows results for the cone measurements at the asphalt plant measurements and rolled and unrolled pavement measurements.
CECA Additive Asphalt Plant HC Measurements
0.0
5.0
10.0
15.0
20.0
25.0
30.0
35.0
0 20 40 60 80 100 120
Distance, cm
HC
, pp
m 300F
280F
260F
Figure 16: CECA Additive Asphalt Plant VOC Measurements
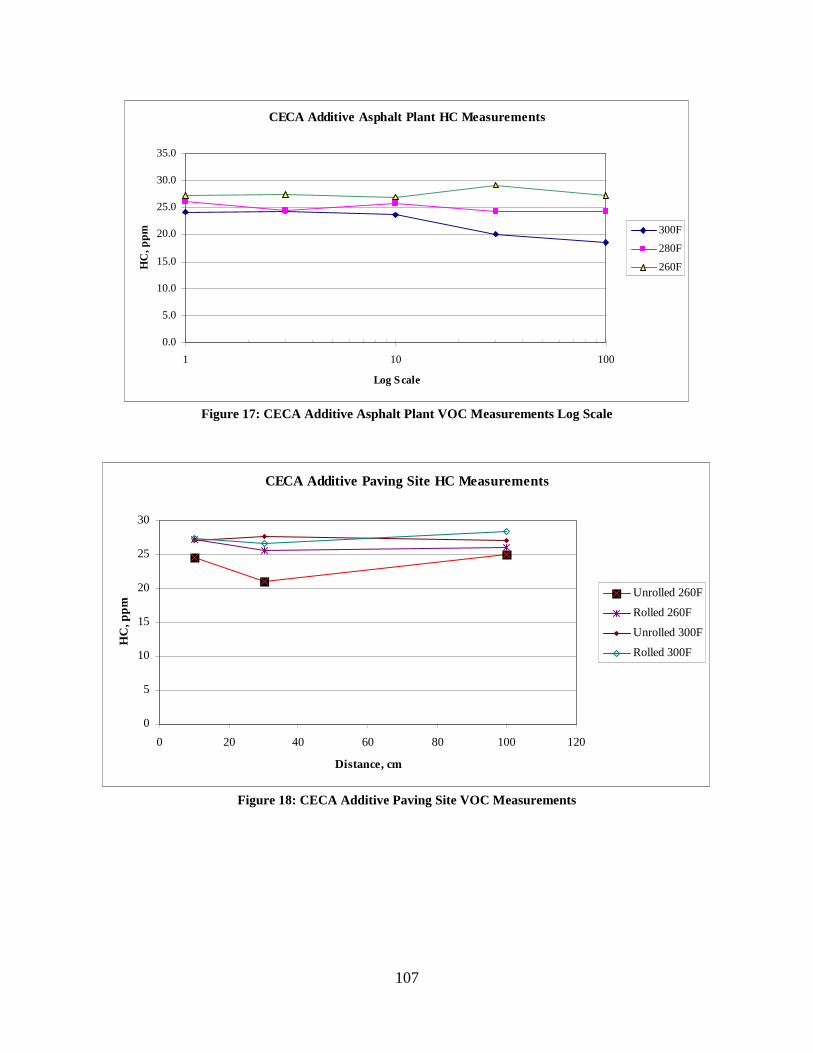
107
CECA Additive Asphalt Plant HC Measurements
0.0
5.0
10.0
15.0
20.0
25.0
30.0
35.0
1 10 100
Log Scale
HC
, ppm
300F
280F
260F
Figure 17: CECA Additive Asphalt Plant VOC Measurements Log Scale
CECA Additive Paving Site HC Measurements
0
5
10
15
20
25
30
0 20 40 60 80 100 120
Distance, cm
HC
, pp
m
Unrolled 260F
Rolled 260F
Unrolled 300F
Rolled 300F
Figure 18: CECA Additive Paving Site VOC Measurements

108
CECA Additive Paving Site HC Measurements
0
5
10
15
20
25
30
10 100
Log Scale
HC
, pp
m
Unrolled 260F
Rolled 260F
Unrolled 300F
Rolled 300F
Figure 19: CECA Additive Paving Site VOC Measurements Log Scale
CECA Additive Cone Measurements1-Cone 1, 2-Cone 3, 3-Cone4
0
5
10
15
20
25
30
35
1 2 3
HC
, ppm
300F
280F
260F
Unrolled 260F
Unrolled 300F
Figure 20: CECA Additive VOC Cone Measurements
Even though some minor differences can be observed between the conditions, these differences are likely to be within the variability between mixtures and thus insignificant from an emissions perspective. CECA additive at different temperatures demonstrated the same VOC emission behaviors.

109
Conclusions
This study was designed as a screening test to examine if there were significant variations in VOC emissions from different additives such as Evotherm, Rediset, and CECA used to produce WMA and to examine the effect of mixture temperature on emissions from these mixtures. Based on the results of this study, it appears unlikely that any of the WMA mixtures using any of the tested additives VOC emissions are significantly different (more than a factor of two) from the existing control mix for the same environmental conditions. Further, the results show only very small, and likely insignificant, differences between the additives in terms of observed VOC concentrations making it unlikely that VOC emissions would be an important factor in the selection of a preferred additive for a WMA mixture, at least among these candidates, and that the selection should be made based on other characteristics of the mixtures. Of course, much smaller emissions differences could be important for air quality purposes and additional, more controlled, studies of VOC emissions should be considered once a particular mixture and application temperature are selected. These additional measurements, made under the final selected conditions, are the best way to ensure that accuracy of future air quality emissions inventories.

110
Appendix
Cone Descriptions Cone 1 is a 29” traffic cone with the 10” base and 2” top with a 1” top opening.
Cone 1 Cone 2 is a 29” traffic cone with 7” base and 1 ¾ inch top with a 1” top opening.
Cone 2 Cone 3 is a 19” traffic cone with 7” base and 2” top with 1” top opening.
Cone 3

111
Cone 4 is an inverted 7” tall ceramic flower pot with an 8” base (as shown) and 4.5” top with a 1” top opening.
Cone 4
6.2.1 Data Tables Table 4 Evotherm Additive at 300 F Asphalt Plant VOC Measurements
Meas # Distance, cm
1 3 10 30 100 1 9 10 9 10 10 2 8 13 12 11 10 3 8 8 8 8 7 4 12 8 10 11 6 5 20 9 19 9 3
Average 11 9 11 9 7
Table 5 Evotherm Additive at 280 F Asphalt Plant VOC Measurements
Meas # Distance, cm
Cone 1 3 10 30 100
1 26 22 17 16 14 20 2 28 28 26 19 16 20 3 28 28 18 15 13 20 4 27 27 16 13 10 20 5 25 25 12 13 12 19 6 19 18 16 14 12 25
Average 26 25 18 15 13 21

112
Table 6 Evotherm Additive at 260 F
Meas # Distance, cm
Cone 1 3 10 30 100
1 23 23 21 18 8.6 12 2 18 18 13 8.8 8.8 18 3 20 20 18 12 8.8 18 4 17 16 11 8.6 8.6 17 5 15 14 13 11 8.8 17 6 20 18 14 12 12 14 7 22 18 14 14 14 23
Average 19 18 15 12 10 17 Table 7 Incorrect Portion of Rediset Additive 300F Asphalt Plant VOC Measurements
Meas # Distance, cm
Cone 1 3 10 30 100
1 17 14 7 10 10 2 20 15 12 10 5 15 3 12 12 7 12 10 14 4 9 7 6 6 9 10 5 17 8 9 9 15 13 6 11 11 13 8 13 16 7 12 11 6 6 7 18
Average 14 10 9 8 10 14 Table 8 Regular Control Mix Asphalt Plant VOC Measurements
Meas # Distance, cm
Cone 1 3 10 30 100
1 12.5 8 6 4 4 9 2 12.5 13 6.5 6 6 11 3 13 10 8 6 6 14 4 13 14 8 7.5 5 14 5 15 13 8.5 8 6 14 6 16 13 12.5 9 8 14 7 15 13.5 13 11 8 13.5 8 17 14 11 7 6 16
Average 14.3 12.3 9.2 7.3 6.1 13.2 Below are measurements of VOC from the paving site. They include unrolled and rolled measurements. Unrolled measurements are the data taken after asphalt was distributed to the paving surface from the paver but before rollers had a chance to roll it. Rolled data was taken after rollers passed at least once and between each subsequent roll.

113
Table 9 Regular Control Mix Paving Site VOC Measurements UNROLLED
Meas # Distance, cm
Cone 10 30 100
1 20.5 21 16 28 2 27 21 19 31 3 25 23 23 4 25 28 23 5 32 29 28 27 6 34 33 26 7 29 27 34 8 23 27 24 28
Average 27 26 24 29 Table 10 Regular Control Mix Paving Site VOC Measurements ROLLED
Meas # Distance, cm
Cone 10 30 100
1 27 25 23 28 2 20 26 25 3 31 26 23 4 21 22 23 5 34 28 32 6 29 24 32 7 25 32 29 8 29 28 28
Average 27 26 27 28 Table 11 Rediset Additive 300F VOC Measurements
Meas # Distance, cm Cone
1 3 10 30 100 Cone1 Cone 2 Cone 3 Cone 4 1 19 21 19 18 18 38 36 44 50 2 21 20 19 23 21 34 38 36 34 3 26 28 28 24 21 22 21 25 28 4 21 20 20 17 18 22 27 24 22 5 17 21 18 17 13 19 22 18 21 6 29 23 24 22 24 26 26 29 23 7 16 17 13 17 16 18 21 26 8 18 15 14 20 17 25 22 17 9 17 17 20 14 15 25 33 30
Average 20 20 19 19 18 25 28 28 28

114
Table 12 Rediset Additive 280F Asphalt Plant VOC Measurements
Meas # Distance, cm Cone
1 3 10 30 100 Cone1 Cone 2 Cone 3 Cone 4 1 24 28 23 24 23 34 30 25 30 2 24 35 23 22 27 21 23 21 27 3 23 32 28 27 27 29 29 25 26 4 25 27 26 27 25 26 27 29 25 5 23 22 22 25 28 23 24 27 23 6 21 20 24 24 23 29 27 29 7 27 22 23 26 24 28 22 24
Average 24 27 24 25 25 27 27 25 26 Table 13 Rediset Paving Site VOC Measurements UNROLLED
Meas # Distance, cm Cone
10 30 100 Cone1 Cone 3 Cone 4 1 16 17 18 17 17 17 2 16.5 21 19.5 17 22 19.5 3 20 21 21
Average 18 20 20 17 20 18 Table 14 Rediset Paving Site VOC Measurements ROLLED
Meas # Distance, cm 10 30 100 1 19 20 21 2 18.5 18.5 19 3 19 20 21
Average 19 20 20 Table 15 Day 4 CECA Additive 300F Plant VOC measurements
Meas # Distance, cm Cone
1 3 10 30 100 Cone1 Cone 3 Cone 4 1 27 31 28 16 14 21 25 28 2 23 21 20 20 16 23 23 21 3 26 23 25 21 21 25 23 24 4 21 21 21 22 21 26 25 22 5 24 26 24 21 21 28 27 23
Average 24 24 24 20 19 25 25 24

115
Table 16 CECA Additive 280F Plant VOC Measurements
Meas # Distance, cm Cone
1 3 10 30 100 Cone1 Cone 3 Cone 4 1 29 24 25 24 20 28 27 27 2 28 26 23 24 23 28 27 27 3 28 29 26 28 28 28 29 26 4 27 27 28 28 27 30 29 27 5 21 19 23 24 29 23 24 29 6 21 27 23 20 24 24 26 24 7 29 28 28 26 23 32 27 29 8 27 18 28 18 19 21 27 25 9 24 23 28 28 27 29 26 28
Average 26 25 26 24 24 27 27 27 Table 17 CECA Additive 260F Plant VOC Measurements
Meas # Distance, cm Cone
1 3 10 30 100 Cone1 Cone 3 Cone 4 1 25 28 29 29 27 29 27 28 2 28 28 24 29 26 27 31 29 3 27 28 28 31 29 27 28 27 4 29 26 27 28 27 28 29 27
Average 27 28 27 29 27 28 29 28 Table 18 CECA Additive 260F Paving Site VOC Measurements UNROLLED
Meas # Distance, cm Cone
10 30 100 Cone1 Cone 3 Cone 4 1 22 21 29 24 29 25 2 27 21 21 27 24 26
Average 25 21 25 26 27 26 Table 19 CECA Additive 260F Paving Site VOC Measurements ROLLED
Meas # Distance, cm
10 30 100 1 28 26 25 2 27 26 26 3 25 23 23 4 28 25 28 5 27 27 26 6 28 25 28 7 27 27 26
Average 27 26 26

116
Table 20 CECA Additive 300F Paving Site VOC Measurements UNROLLED
Meas # Distance, cm Cone
10 30 100 Cone1 Cone 3 Cone 4 1 26 27 25 26 25 29 2 26 27 29 26 25 29 3 29 29 27
Average 27 28 27 26 25 29 Table 21 CECA Additive 300F Paving Site VOC ROLLED
Meas # Distance, cm
10 30 100 1 27 27 29 2 27 25 28 3 28 28 28
Average 27 27 28