european renewable ethanol — key figures 2016 · 99.9% of the crops used were grown by european...
TRANSCRIPT

Installed production capacity Total production
Certified average greenhouse gas emission savings of renewable European ethanol compared to fossil fuel
Weighted average of the GHG emissions from the production and use of fuel ethanol have reached 28.3 gCO2eq/MJ in 2016, equivalent to 66% average certified GHG emission savings against the current fossil fuel comparator, and 70% GHG emission savings against the proposed fossil fuel comparator for the RED post-2020.Source: Aggregated and audited data of ePURE members
Since 2011 the average certified greenhouse gas emission savings of renewable ethanol against fossil fuel have increased continuously, reaching 66% in 2016.Source: Aggregated and audited data of ePURE members, compared to a fossil fuel comparator of 83.8 gCO2eq/MJ
Feedstock used to produce renewable ethanol
Renewable ethanol production by end-use
Main output of European renewable ethanol plants
Installed capacity and total production – ePURE members
In 2016, ePURE members produced 5.2 billion litres of renewable ethanol, operating at 82% of their installed capacities.Source: Aggregated and audited data of ePURE members (pure alcohol)
Weighted average certified emissions from the production and use of fuel ethanol compared to fossil fuel (gCO2eq/MJ)
Weighted average certified emission savings in %
78%
11%
11%
In 2016, ePURE members produced 5.2 billion litres of ethanol, 78% of which was for fuel use. Other markets, such as beverages and industrial applications each represented 11% of the production use.Source: Aggregated and audited data of ePURE members (pure alcohol)
Fuel 4.07 billion litres
Industrial 0.57 billion litres
Food and beverages 0.56 billion litres
11%
15%
74%
Nearly all (99.9%) feedstock used to produce renewable ethanol by ePURE members was grown in Europe.Source: Aggregated and audited data of ePURE members
Cereals 9.85 million tonnes
Sugars 1.93 million tonnes (sugar equivalent)
Ligno-cellulosic, Other RED Annex IX-A feedstock, Others 1.46 million tonnes
European renewable ethanol — key figures 2016
In 2016, ePURE members produced 5.2 billion litres of ethanol, 78% of which was for fuel use, with an average of 66% GHG savings compared to petrol and co-producing 5.5 million tonnes of co-products, of which 4 million tonnes was high-protein, GMO free animal feed. 99.9% of the crops used were grown by European farmers.
Animal feed makes up the largest share of renewable ethanol co-products produced by ePURE members. Of the 5.5 million tonnes of co-products produced in 2016, 4 million tonnes were animal feed.Source: Aggregated and audited data of ePURE members (ethanol - pure alcohol; animal feed co-products - dry matter equivalent; other co-products - commercial equivalent)
Ethanol4.13 million tonnes
Vinasse 0.51 million tonnes
CO2
0.40 million tonnes
Other non-animal feed 0.57 million tonnes
Animal feed4.05 million tonnes
Share of European renewable ethanol produced from each feedstock type
In 2016, 32% of the ethanol produced was from wheat, followed by corn (31%) and sugar (24%).Source: Aggregated and audited data of ePURE members (pure alcohol)
Wheat ethanol1.66 billion litres
Corn ethanol1.61 billion litres
Sugars-based ethanol
1.24 billion litres
Other cereals and starch-rich crops ethanol
0.44 billion litres
Ethanol from ligno-cellulosic/
Other RED Annex IX-A/
Other feedstock0.24 billion
litres
32% 31%24%
8% 5%
100
80
30
90
40
70
20
60
10
50
02009 2010 2011 2012 2013 2014 2015 2016
40.1g 41.3g 42.2g37.5g 36.4g 34.4g
30.1g 28.3g
66%64%
59%
57%55%
50%51%52%
45%
50%
55%
60%
65%
70%
2009 2010 2011 2012 2013 2014 2015 2016
2016 0
1
2
3
4
5
6
7
5.2 billion litres
6.3 billion litres
Proposed Fossil Fuel comparator RED post-2020 (94.1 gCO2eq/MJ)
Current Fossil Fuel comparator (83.8 gCO2eq/MJ)
Weighted average of the GHG emissions from the production and use of fuel ethanol
TOTAL 9,171
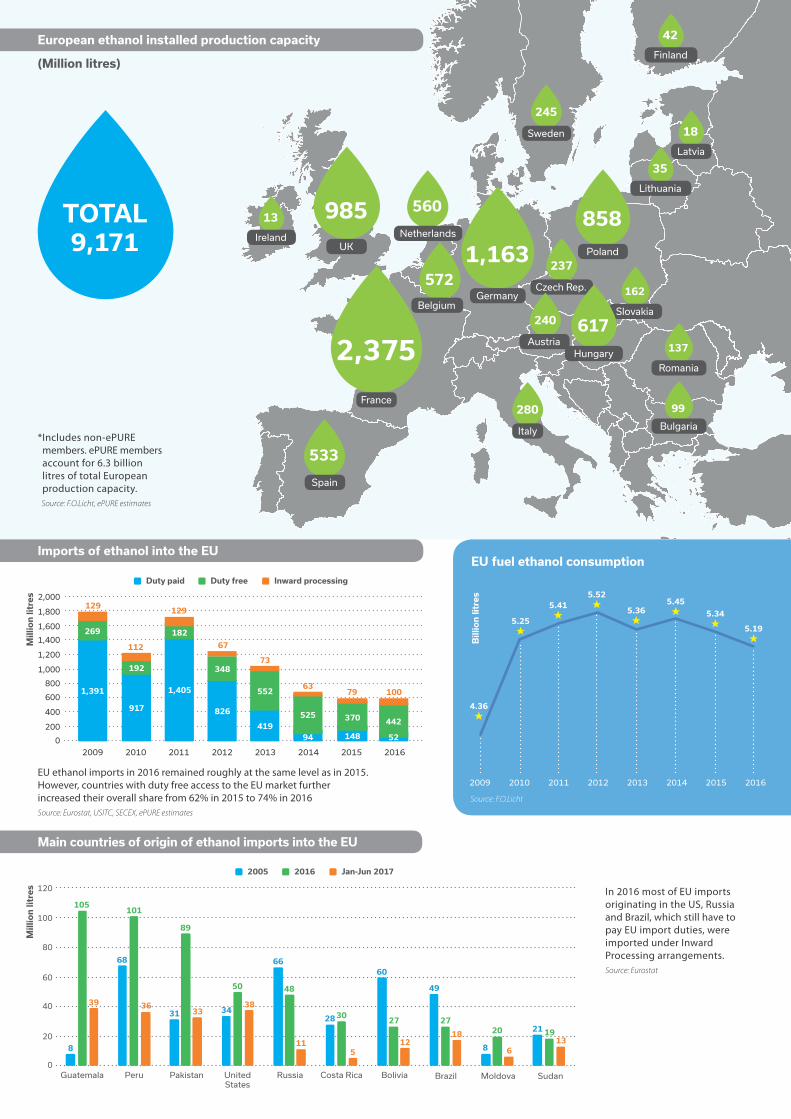
* Includes non-ePURE members. ePURE members account for 6.3 billion litres of total European production capacity.Source: F.O.Licht, ePURE estimates
Main countries of origin of ethanol imports into the EU
Imports of ethanol into the EUEU fuel ethanol consumption
In 2016 most of EU imports originating in the US, Russia and Brazil, which still have to pay EU import duties, were imported under Inward Processing arrangements. Source: Eurostat
Source: F.O.Licht
Bil
lio
n li
tre
s
EU ethanol imports in 2016 remained roughly at the same level as in 2015. However, countries with duty free access to the EU market further increased their overall share from 62% in 2015 to 74% in 2016Source: Eurostat, USITC, SECEX, ePURE estimates
Duty paid Duty free Inward processing
2005 2016 Jan-Jun 2017
572
Belgium
European ethanol installed production capacity
(Million litres)
162
Slovakia
2,375
France
237
Czech Rep.
1,163
Germany
985UK
858
Poland
617
Hungary
560
Netherlands
533
Spain
280
Italy
245
Sweden
240
Austria137
Romania
99
Bulgaria
42
Finland
35
Lithuania
18
Latvia
13
Ireland
2009 2010 2011 2012 2013 2014 2015 2016
2,000
1,400
800
1,800
1,200
600
200
1,600
1,000
400
0
1,391
269
192
182
348
552
525 370 442
1,405
826917
41914894 52
129
112
129
67
73
6379 100
2009 2010 2011 2012 2013 2014 2015 2016
5.45
5.34
5.19
5.36
5.525.41
5.25
4.36
Mil
lio
n li
tre
sM
illi
on
litr
es
Guatemala Peru Pakistan United States
Costa RicaRussia Bolivia Brazil Moldova Sudan
120
80
20
100
40
60
0
89
101
8
39
68
3631 33
50
38
66
48
11
28 30
5
60
27
12
49
27
1821 19
136
20
8
34
105