european renewable ethanol – key figures 2017 · source: eurostat, usitc, secex, epure estimates...
TRANSCRIPT
European renewable ethanol – key figures 2017
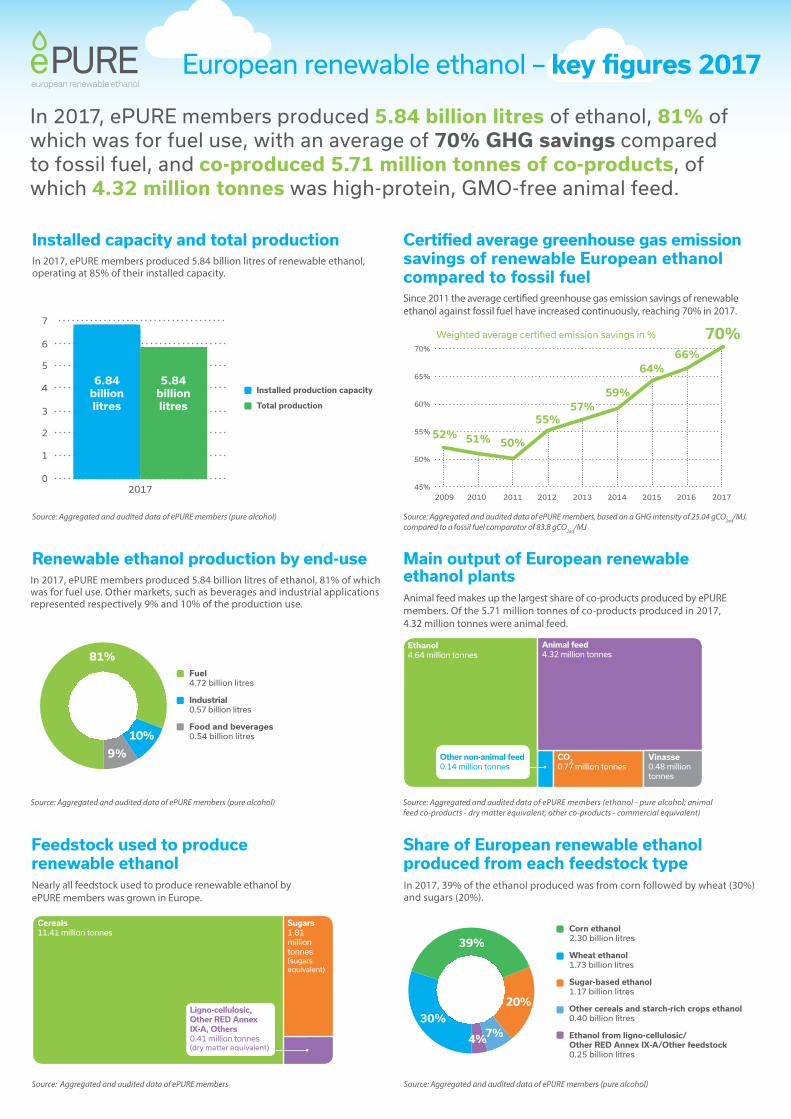
In 2017, ePURE members produced 5.84 billion litres of ethanol, 81% of which was for fuel use, with an average of 70% GHG savings compared to fossil fuel, and co-produced 5.71 million tonnes of co-products, of which 4.32 million tonnes was high-protein, GMO-free animal feed.
Certified average greenhouse gas emission savings of renewable European ethanol compared to fossil fuel
Source: Aggregated and audited data of ePURE members, based on a GHG intensity of 25.04 gCO2eq/MJ, compared to a fossil fuel comparator of 83.8 gCO2eq/MJ
Since 2011 the average certified greenhouse gas emission savings of renewable ethanol against fossil fuel have increased continuously, reaching 70% in 2017.
Renewable ethanol production by end-useIn 2017, ePURE members produced 5.84 billion litres of ethanol, 81% of which was for fuel use. Other markets, such as beverages and industrial applications represented respectively 9% and 10% of the production use.
Source: Aggregated and audited data of ePURE members (pure alcohol)
Fuel 4.72 billion litres
Industrial 0.57 billion litres
Food and beverages 0.54 billion litres
81%
9%
10%
In 2017, 39% of the ethanol produced was from corn followed by wheat (30%) and sugars (20%).
Source: Aggregated and audited data of ePURE members (pure alcohol)
Share of European renewable ethanol produced from each feedstock type
Corn ethanol 2.30 billion litres
Wheat ethanol 1.73 billion litres
Sugar-based ethanol 1.17 billion litres
Other cereals and starch-rich crops ethanol 0.40 billion litres
Ethanol from ligno-cellulosic/ Other RED Annex IX-A/Other feedstock 0.25 billion litres
81%
9%
10%
30%
39%
20%
7%4%
Animal feed makes up the largest share of co-products produced by ePURE members. Of the 5.71 million tonnes of co-products produced in 2017, 4.32 million tonnes were animal feed.
Source: Aggregated and audited data of ePURE members (ethanol - pure alcohol; animal feed co-products - dry matter equivalent; other co-products - commercial equivalent)
Main output of European renewable ethanol plants
Feedstock used to produce renewable ethanol Nearly all feedstock used to produce renewable ethanol by ePURE members was grown in Europe.
Source: Aggregated and audited data of ePURE members
Cereals11.41 million tonnes
Sugars1.81 million tonnes (sugars equivalent)
Installed capacity and total production
0
1
2
3
4
5
6
7
2017
6.84 billion litres
5.84 billion litres
Installed production capacity
Total production
Source: Aggregated and audited data of ePURE members (pure alcohol)
In 2017, ePURE members produced 5.84 billion litres of renewable ethanol, operating at 85% of their installed capacity.
66%
70%
64%
59%57%
55%
50%51%
45%
50%
55%
60%
65%
70%
2009 2010 2011 2012 2013 2014 2015 2016 2017
52%
Weighted average certified emission savings in %
Ligno-cellulosic, Other RED Annex IX-A, Others0.41 million tonnes (dry matter equivalent)
Ethanol4.64 million tonnes
Animal feed4.32 million tonnes
Vinasse 0.48 million tonnes
CO2
0.77 million tonnesOther non-animal feed 0.14 million tonnes
For more information:
Craig Winneker Director of Communications [email protected]
Rue de la Loi 223, Brussels B-1040, Belgium www.epure.org | ©2018 ePURE Designed by ACW, London
590
Belgium
312
Sweden
253
Czech Rep.
168
Slovakia
2,055
France
1,180
Germany
985UK
869
Poland
590
Netherlands
587
Spain
250
Austria
376
Italy
12
Romania
18
Estonia
61
Finland
117
Bulgaria
33
Lithuania
17
Latvia
10
Ireland
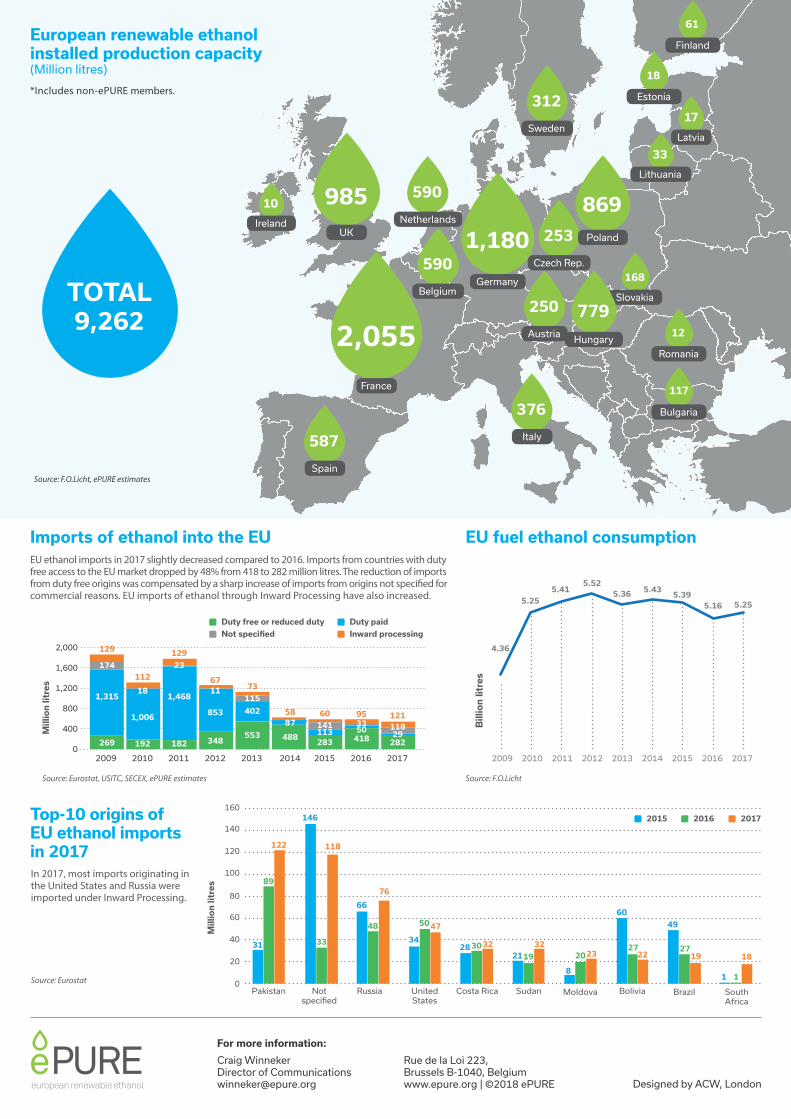
TOTAL 9,262
Source: F.O.Licht, ePURE estimates
* Includes non-ePURE members.
European renewable ethanol installed production capacity (Million litres)
Imports of ethanol into the EU EU fuel ethanol consumption
Source: Eurostat, USITC, SECEX, ePURE estimates
EU ethanol imports in 2017 slightly decreased compared to 2016. Imports from countries with duty free access to the EU market dropped by 48% from 418 to 282 million litres. The reduction of imports from duty free origins was compensated by a sharp increase of imports from origins not specified for commercial reasons. EU imports of ethanol through Inward Processing have also increased.
Source: F.O.Licht
Bil
lio
n li
tre
s
5.435.39
5.16 5.255.36
5.525.41
5.25
4.36
2009 2010 2011 2012 2013 2015 2016 20172014
Top-10 origins of EU ethanol imports in 2017In 2017, most imports originating in the United States and Russia were imported under Inward Processing.
Source: EurostatPakistan Not
specifiedRussia United
StatesSudanCosta Rica Bolivia BrazilMoldova South
Africa
120
140
160
80
20
100
40
60
0
48
3331
122
146
118
66
76
5047
28 30322119
32
8
2023
60
2722
1 1
181927
49
34
89
020406080
100120140160
Mil
lio
n li
tre
s
2,000
800
1,200
1,600
400
02009
174
1,315
269
129
2010
1,006
18
192
112
2011
23
1,468
182
129
2012
853
11
348
67
2013
115
402
553
73
2014
87
488
58
2015
283113141
60
2016
418503395
2017
28229
118121
Mil
lio
n li
tre
s
Duty paidDuty free or reduced duty
Inward processingNot specified
2015 2016 2017
779
Hungary