euro-indicators working group - circabc.europa.eu filepreliminary estimation of the single block (2...
TRANSCRIPT
Eurostat – Unit C4 Key indicators for European policies
Euro-indicators Working Group
Luxembourg,11th & 12th June 2012
Eurostat – Unit C4 Key indicators for European policies
Item 9.2 of the Agenda
The new ISTAT forecasting
activities
By Fabio Bacchini
Doc 345/12
IntroductionMEMo-ItDiffusion
Conclusion
The new Istat forecasting activities
Bacchini, Bovi, Brandimarte, Crivelli, De Santis, Fioramanti,Gilardi, Golinelli, Jona-Lasinio, Mancini, Pappalardo, Rossi,
Ventura, Vicarelli
Econometric Studies and Economic Forecasting Division
EurostatLuxembourg 12 June 2012
12 June 2012 Istat forecasting activity
IntroductionMEMo-ItDiffusion
Conclusion
Ouline
1 Introduction
2 MEMo-It
3 Diffusion
12 June 2012 Istat forecasting activity
IntroductionMEMo-ItDiffusion
Conclusion
Why Istat forecasting activity
In 2011 - Isae (National Institute for Economic Analysis)became part of Istat
Isae funtions moved to Istat
forecasting activity : EZEO; price; Italy’s economic outlook
12 June 2012 Istat forecasting activity
IntroductionMEMo-ItDiffusion
Conclusion
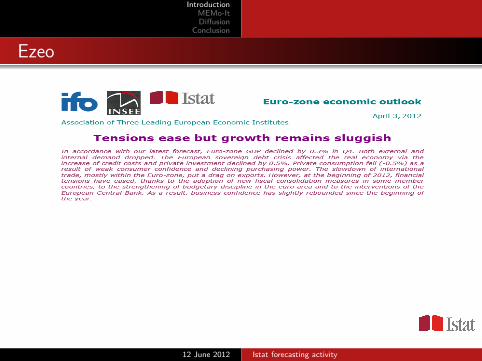
Ezeo
12 June 2012 Istat forecasting activity
IntroductionMEMo-ItDiffusion
Conclusion
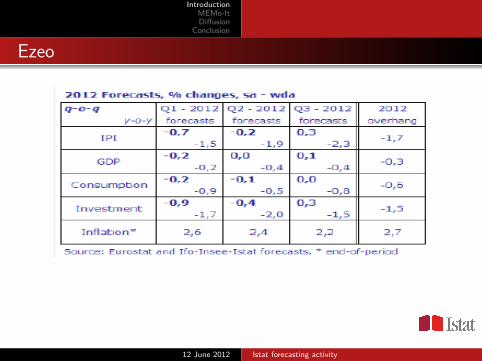
Ezeo
12 June 2012 Istat forecasting activity
IntroductionMEMo-ItDiffusion
Conclusion
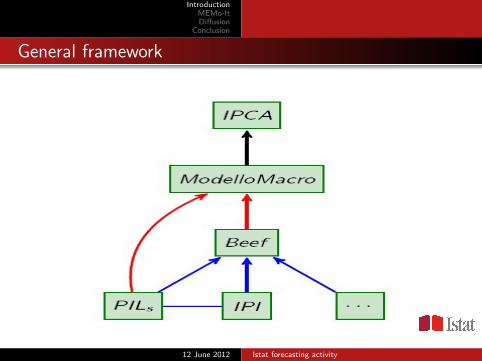
General framework
12 June 2012 Istat forecasting activity
IntroductionMEMo-ItDiffusion
Conclusion
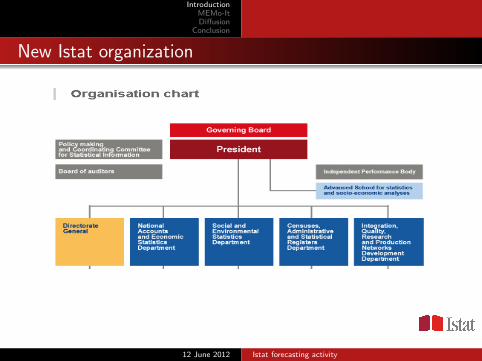
New Istat organization
12 June 2012 Istat forecasting activity
IntroductionMEMo-ItDiffusion
Conclusion
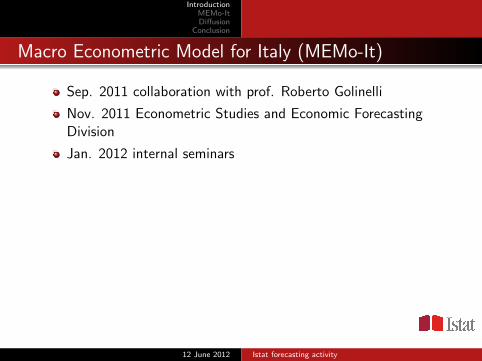
Macro Econometric Model for Italy (MEMo-It)
Sep. 2011 collaboration with prof. Roberto Golinelli
Nov. 2011 Econometric Studies and Economic ForecastingDivision
Jan. 2012 internal seminars
12 June 2012 Istat forecasting activity
IntroductionMEMo-ItDiffusion
Conclusion
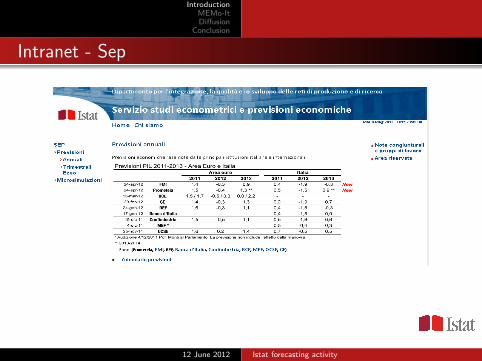
Intranet - Sep
12 June 2012 Istat forecasting activity
IntroductionMEMo-ItDiffusion
Conclusion
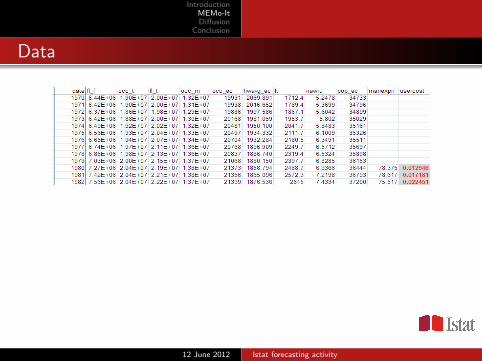
Data
Chinese walls
annual data
preliminary test (NA till 2010 Nace 1.1)
link ai template che CN invia ad Eurostat
new data set updated on regular basis
back-casting 1992
final input
12 June 2012 Istat forecasting activity
IntroductionMEMo-ItDiffusion
Conclusion
Data
12 June 2012 Istat forecasting activity
IntroductionMEMo-ItDiffusion
Conclusion
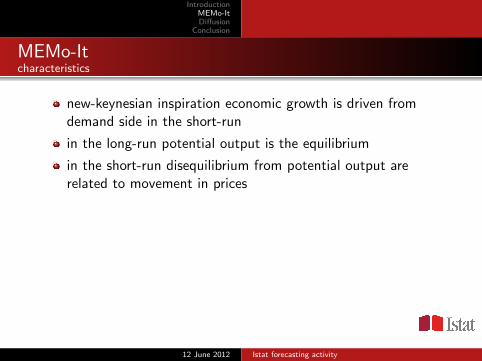
MEMo-Itcharacteristics
new-keynesian inspiration economic growth is driven fromdemand side in the short-run
in the long-run potential output is the equilibrium
in the short-run disequilibrium from potential output arerelated to movement in prices
12 June 2012 Istat forecasting activity
IntroductionMEMo-ItDiffusion
Conclusion
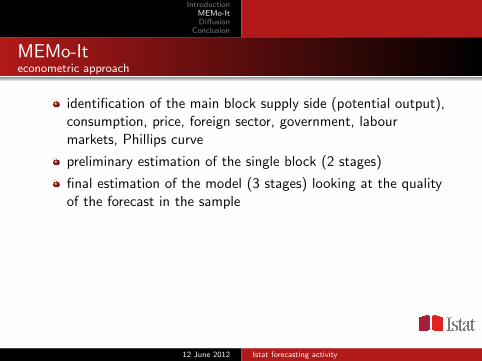
MEMo-Iteconometric approach
identification of the main block supply side (potential output),consumption, price, foreign sector, government, labourmarkets, Phillips curve
preliminary estimation of the single block (2 stages)
final estimation of the model (3 stages) looking at the qualityof the forecast in the sample
12 June 2012 Istat forecasting activity
IntroductionMEMo-ItDiffusion
Conclusion
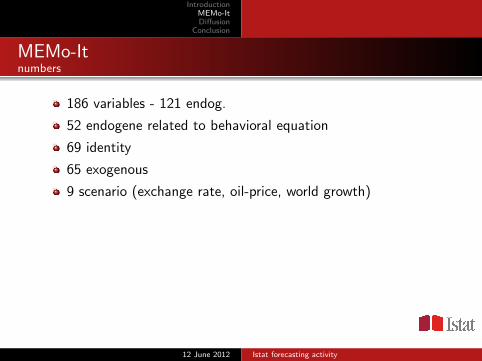
MEMo-Itnumbers
186 variables - 121 endog.
52 endogene related to behavioral equation
69 identity
65 exogenous
9 scenario (exchange rate, oil-price, world growth)
12 June 2012 Istat forecasting activity
IntroductionMEMo-ItDiffusion
Conclusion
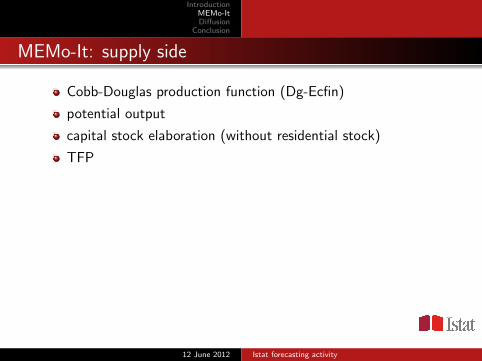
MEMo-It: supply side
Cobb-Douglas production function (Dg-Ecfin)
potential output
capital stock elaboration (without residential stock)
TFP
12 June 2012 Istat forecasting activity
IntroductionMEMo-ItDiffusion
Conclusion
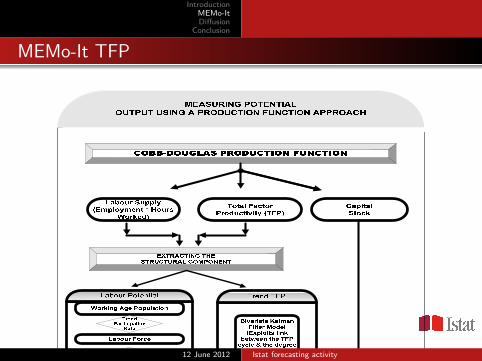
MEMo-It TFP
!
8
SECTION 1 : A SHORT OVERVIEW OF THE OVERALL PRODUCTION FUNCTION APPROACH
1.1 Main Features of Methodology2 Instead of making statistical assumptions on the time series properties of trends and their
correlation with the cycle, the production function approach makes assumptions based on
economic theory. This latter approach focuses on the supply potential of an economy and has
the advantage of giving a more direct link to economic theory but the disadvantage, as
explained earlier, is that it requires assumptions on the functional form of the production
technology, returns to scale, trend technical progress (TFP) and the representative utilisation
of production factors. As shown in the diagram below, with a production function, potential
GDP can be represented by a combination of factor inputs, multiplied with the technological
level or total factor productivity (TFP). The parameters of the production function essentially
determine the output elasticities of the individual inputs, with the trend components of the
individual production factors, except capital, being estimated. Since the capital stock is not
detrended, estimating potential output amounts therefore to removing the cyclical component
from both labour and TFP.
2
This PF methodology is applicable to all of the "old" EU15 member states, with these 15 countries accepting the use of the PF approach as
the reference method for the assessment of their stability and convergence programmes. The HP filter approach is only used as a “back-up”
method and only for a short (unfortunately still to be defined) transition period. A modified PF methodology is applicable to all 12 of the
”new” Member States - in parallel with the HP filter approach. This modified PF framework tries to overcome a number of serious statistical
problems associated with the availability of only short time series for the new Member States. A common starting date of 1995 was imposed
for all 12 countries since too many transitional issues were biasing the pre-1995 data. The main modifications to the methodology, relative to
that which applies to the EU15 countries, include firstly, a simpler NAIRU methodology based on wage elasticities (it was not possible to
use the more sophisticated Kalman Filter based approach applied to the “old” Member States); secondly, trend TFP is generally estimated
using a moving average based, stochastic trend, approach (compared with the proposed new Kalman filter method which will be used for the
EU15 countries); and finally, the capital stock is estimated using a capital/output ratio which is fixed in the base year of 1995.
12 June 2012 Istat forecasting activity
IntroductionMEMo-ItDiffusion
Conclusion
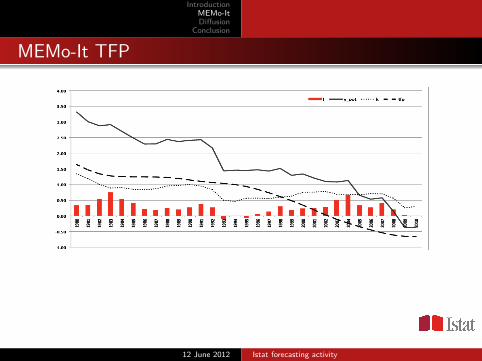
MEMo-It TFP
12 June 2012 Istat forecasting activity
IntroductionMEMo-ItDiffusion
Conclusion
MEMo-It Demand
12 June 2012 Istat forecasting activity
IntroductionMEMo-ItDiffusion
Conclusion
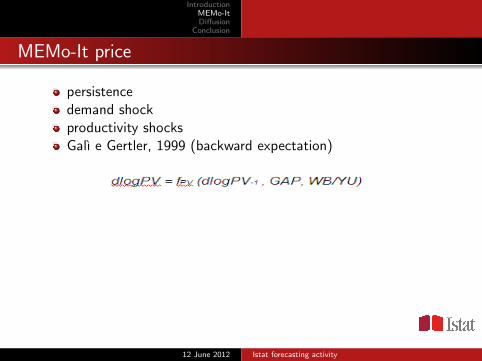
MEMo-It price
persistencedemand shockproductivity shocksGal̀ı e Gertler, 1999 (backward expectation)
12 June 2012 Istat forecasting activity
IntroductionMEMo-ItDiffusion
Conclusion
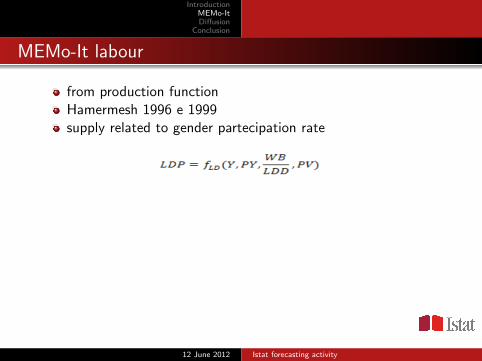
MEMo-It labour
from production functionHamermesh 1996 e 1999supply related to gender partecipation rate
12 June 2012 Istat forecasting activity
IntroductionMEMo-ItDiffusion
Conclusion
MEMo-It institutional sector
government
external block
families
12 June 2012 Istat forecasting activity
IntroductionMEMo-ItDiffusion
Conclusion
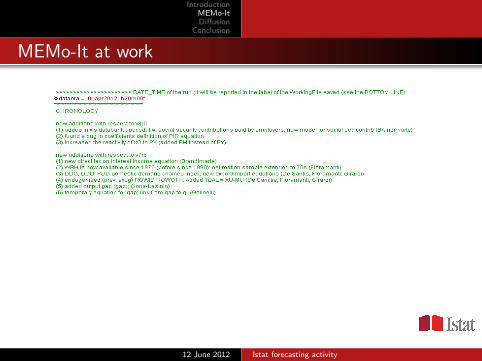
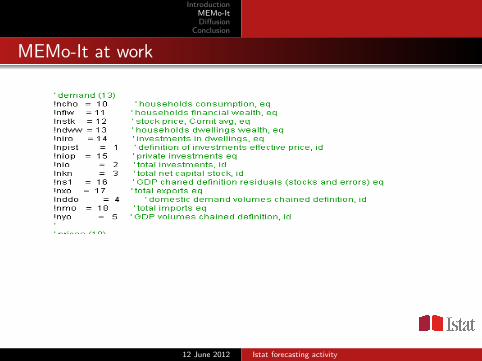
MEMo-It at work
12 June 2012 Istat forecasting activity
IntroductionMEMo-ItDiffusion
Conclusion
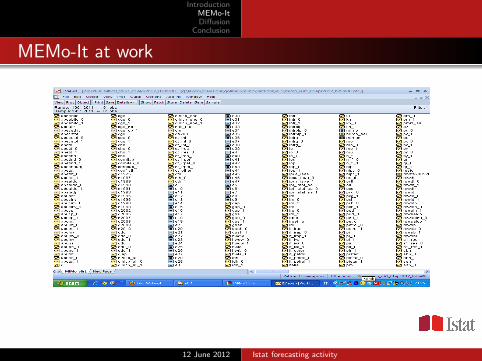
MEMo-It at work
12 June 2012 Istat forecasting activity
IntroductionMEMo-ItDiffusion
Conclusion
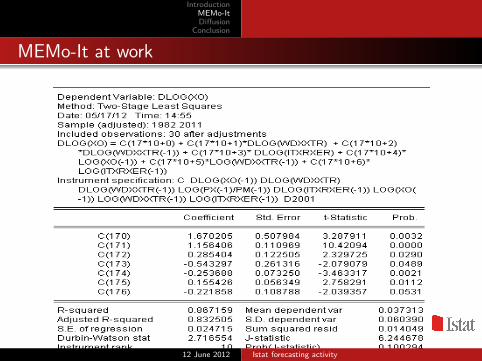
MEMo-It at work
12 June 2012 Istat forecasting activity
IntroductionMEMo-ItDiffusion
Conclusion
MEMo-It at work
12 June 2012 Istat forecasting activity
IntroductionMEMo-ItDiffusion
Conclusion
Key elements
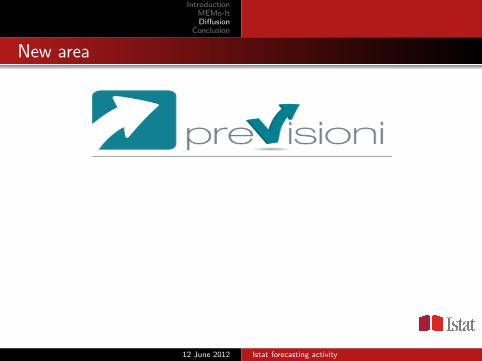
define a new diffusion area
time: 2 release; first one 22 May together with the AnnualReport; second one 5 Nov.
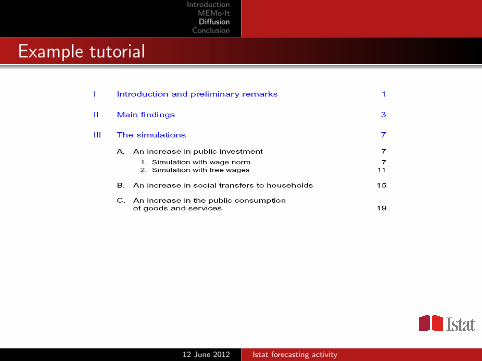
3 documents: short presentation of results (5 pages),methodological note (14 pages), tutorial with simulationresults (to be released in November)
12 June 2012 Istat forecasting activity
IntroductionMEMo-ItDiffusion
Conclusion
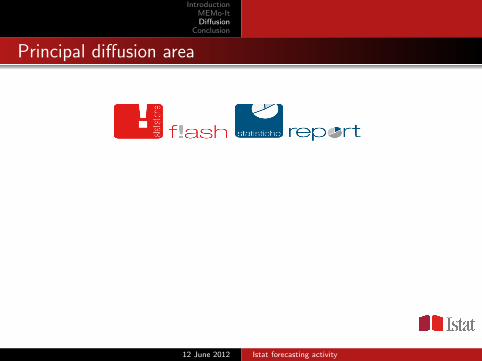
Principal diffusion area
12 June 2012 Istat forecasting activity
IntroductionMEMo-ItDiffusion
Conclusion
New area
12 June 2012 Istat forecasting activity
IntroductionMEMo-ItDiffusion
Conclusion
Example tutorial
12 June 2012 Istat forecasting activity
IntroductionMEMo-ItDiffusion
Conclusion
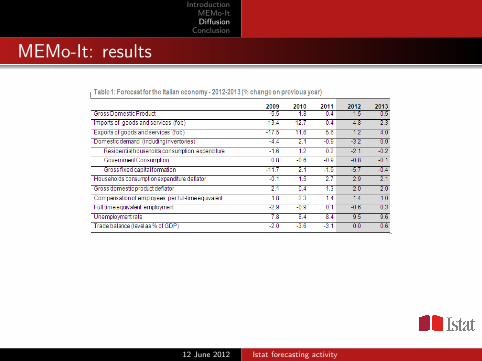
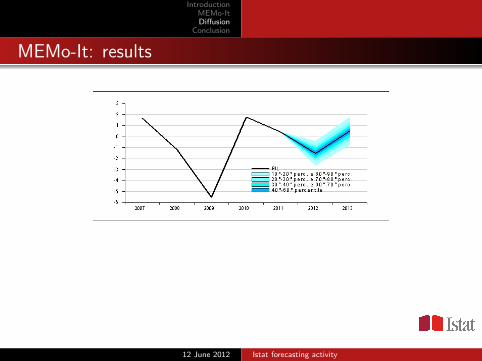
MEMo-It: results
12 June 2012 Istat forecasting activity
IntroductionMEMo-ItDiffusion
Conclusion
MEMo-It: results
12 June 2012 Istat forecasting activity
IntroductionMEMo-ItDiffusion
Conclusion
next steps
next release 5 Nov.
relation between short-run model and annual model
improvements on supply side
tutorial (general how to communicate forecasting activity)
12 June 2012 Istat forecasting activity
IntroductionMEMo-ItDiffusion
Conclusion
MEMo-It: conclusion
12 June 2012 Istat forecasting activity