eu and myanmar 2009
TRANSCRIPT

8/3/2019 EU and Myanmar 2009
http://slidepdf.com/reader/full/eu-and-myanmar-2009 1/11
MYANMAR MAIN ECONOMIC INDICATORS
Surface Area: 676,6 1000 sq km ** * : IMF (World Economic Outlook) *** : IMF (DoTS & WEO)
Population: 60,0 Millions of inhabitants - 2009 (estimates after 2006) * ** : World Bank (World Development Indicatotrs)
Current GDP: 19,8 Billions of euros - 2009 (estimates after 2008) * **** : Trade-to-GDP ratio = (Exports + Imports) / GDP
GDP per capita: 329,3 Euros - 2009 (estimates after 2006) *
2006 2007 2008 2009
Exports-to-GDP ratio: 19,7 % (2009) *** Real GDP growth (%, estimates after 2008) * 13,1 11,9 3,6 4,8
Imports-to-GDP ratio: 23,1 % (2009) *** Inflation rate (%, estimates after 2008) * 26,3 32,9 22,5 7,9
Trade-to-GDP ratio: 42,7 % (2009) **** Current account balance (% of GDP, estimates after 2008) * 7,1 0,6 -2,5 -1,0
GDP BY SECTOR
Source: World Bank (World Development Indicators)
TRADE IN GOODS
Source: IMF (Direction of Trade Statistics - DoTS) Source: Eurostat, Statistical Regime 4
% OF THE WORLD (excluding Intra-EU Trade) 2007 2008 2009 % OF TOTAL EXTRA-EU27 2007 2008 2009
Imports 0,1% 0,1% 0,1% Imports 0,0% 0,0% 0,0%
Exports 0,0% 0,1% 0,1% Exports 0,0% 0,0% 0,0%
EU27 MERCHANDISE TRADE WITH MYANMAR BY PRODUCT (2009)
Source: Eurostat, statistical regime 4
SITC Rev. 3: Agricultural products: 0, 1, 2, 4, excl. 27, excl. 28; Fuels and mining products: 3, 27, 28, 68; Chemicals: 5; Machinery and transport equipment: 7; Textiles & Clothing: 65, 84
TRADE IN COMMERCIAL SERVICES (SERVICES EXCLUDING "GOVERNMENT SERVICES")
MYANMAR WITH THE WORLD EU27 WITH MYANMAR
MYANMAR WITH THE WORLD EU27 WITH MYANMAR
0,3
0,20,2
-0,1-0,1 -0,1
0,10,1
0,2
-0,2
-0,1
-0,1
0,0
0,1
0,1
0,2
0,2
0,3
0,3
2007 2008 2009
Imports Exports BalanceBillions of euros
1989
57,0%
11,0%
32,0%
Agriculture, valueadded (% of GDP)
Industry, value added(% of GDP)
Services, value added
(% of GDP)
2004
48,4%
16,2%
35,4%
1999
59,9%
9,0%
31,1%
4,0
4,7 4,6
-0,6-0,2
-0,7
3,9
4,5
3,5
-1,0
0,0
1,0
2,0
3,0
4,0
5,0
2007 2008 2009
Imports Exports BalanceBillions of euros
190 0 2
129
632
519
-13
127 31
-124
136 127
-150,0
-100,0
-50,0
0,0
50,0
100,0
150,0
Agricultural products Fuels and mining products Chemicals Machinery and transport
equipment
Textiles & Clothing Other Products
Imports Exports BalanceMillions of euros
#N/A #N/A #N/A#N/A #N/A #N/A#N/A#N/A#N/A0,0
0,2
0,4
0,6
0,8
1,0
1,2Imports Exports BalanceBillions of euros
0,4
#N/A #N/A
-0 2
#N/A #N/A
0,2
#N/A #N/A
-0,3
-0,2
-0,1
0,0
0,1
0,2
0,3
0,4
0,5Imports Exports BalanceBillions of euros
8/3/2019 EU and Myanmar 2009
http://slidepdf.com/reader/full/eu-and-myanmar-2009 2/11
MYANMAR 15-Sep-10
EU BILATERAL TRADE AND TRADE WITH THE WORLD DG TRADE
TOTAL MERCHANDISE TRADE, 2005-20091. Evolution of the EU's Trade Balance with Myanmar
2. Evolution of the Myanmar's Trade Balance
GEOGRAPHIC BREAKDOWN OF TRADE, 2009
3. EU Trade with Main Partners
4. Myanmar's Trade with Main Partners
SECTORAL BREAKDOWN OF TRADE
Sitc Rev3, Sections and Product Grouping
5. European Union, Trade with the World and Myanmar, by Sitc Section
6. European Union Imports, by Product Grouping
7. European Union Exports, by Product Grouping
8. Rank of Myanmar in European Union Trade
Harmonized System, Sections
9. EU Trade with the World and EU Trade with Myanmar (2009)

8/3/2019 EU and Myanmar 2009
http://slidepdf.com/reader/full/eu-and-myanmar-2009 3/11
EU'S TRADE BALANCE WITH MYANMAR
European Union, Trade with Myanmar millions of euro, %
Period ImportsVariation
(%, y-o-y)
Share of total
EU Imports
(%)
ExportsVariation
(%, y-o-y)
Share of total
EU Exports
(%)
Balance Trade
2005 288 -37,5 0,0 84 8,2 0,0 -204 372
2006 306 6,4 0,0 81 -3,4 0,0 -225 387
2007 263 -14,2 0,0 164 102,1 0,0 -99 426
2008 185 -29,7 0,0 104 -36,3 0,0 -80 289
2009 157 -15,0 0,0 91 -12,9 0,0 -66 248
2009Q1 45 - 0,0 19 - 0,0 -26 64
2009Q2 34 - 0,0 20 - 0,0 -14 55
2009Q3 46 - 0,0 24 - 0,0 -21 70
2009Q4 32 - 0,0 27 - 0,0 -5 59
2010Q1 42 -7,1 0,0 16 -17,5 0,0 -27 58
2010Q2 33 -3,5 0,0 17 -18,2 0,0 -16 502010Q3 - - - - - - - -
2010Q4 - - - - - - - -
Average annual growth (2005-2009) -14,1 2,0 -9,7
European Union, Trade with the World millions of euro, %
Period ImportsVariation
(%, y-o-y)Exports
Variation
(%, y-o-y)Balance Trade
2005 1.179.569 14,8 1.052.720 10,5 -126.849 2.232.289
2006 1.352.787 14,7 1.160.101 10,2 -192.686 2.512.887
2007 1.433.402 6,0 1.240.541 6,9 -192.861 2.673.942
2008 1.564.946 9,2 1.309.818 5,6 -255.128 2.874.764
2009 1.199.288 -23,4 1.094.229 -16,5 -105.059 2.293.517
2009Q1 303.604 - 255.507 - -48.097 559.112
2009Q2 286.689 - 267.654 - -19.034 554.343
2009Q3 297.689 - 273.670 - -24.019 571.3592009Q4 311.306 - 297.397 - -13.909 608.703
2010Q1 331.949 9,3 294.612 15,3 -37.336 626.561
2010Q2 371.113 29,4 335.756 25,4 -35.357 706.870
2010Q3 - - - - - -
2010Q4 - - - - - -
Average annual growth (2005-2009) 0,4 1,0 0,7
-300
-200
-100
0
100
200
300
400
2005 2006 2007 2008 2009
Imports Exports Balance

8/3/2019 EU and Myanmar 2009
http://slidepdf.com/reader/full/eu-and-myanmar-2009 4/11
MYANMAR'S TRADE BALANCE
MYANMAR, Trade with the European Union millions of euro, %
Period ImportsVariation
(%, y-o-y)
EU Share of
total Imports
(%)
ExportsVariation
(%, y-o-y)
EU Share of
total Exports
(%)
Balance Trade
2005 92 6,8 3,3 251 -37,7 8,5 159 3432006 89 -3,5 2,9 259 3,1 7,4 170 348
2007 180 102,3 4,5 239 -7,8 6,9 59 419
2008 115 -36,3 2,5 168 -29,7 3,7 53 282
2009 100 -12,9 2,2 143 -15,1 3,7 43 242
2009Q1 21 - 1,9 41 - 4,5 20 62
2009Q2 23 - 1,9 31 - 3,1 8 53
2009Q3 27 - 2,5 41 - 3,9 15 68
2009Q4 30 - 2,5 29 - 3,2 -1 58
2010Q1 - - - - - - - -
2010Q2 - - - - - - - -2010Q3 - - - - - - - -
2010Q4 - - - - - - - -
Average annual growth (2005-2009) 2,0 -13,2 -28,0
MYANMAR, Trade with the World millions of euro, %
Period ImportsVariation
(%, y-o-y)Exports
Variation
(%, y-o-y)Balance Trade
2005 2.806 3,4 2.947 17,3 140 5.753
2006 3.063 9,1 3.487 18,3 424 6.550
2007 4.021 31,3 3.465 -0,6 -556 7.486
2008 4.665 16,0 4.480 29,3 -185 9.146
2009 4.561 -2,2 3.890 -13,2 -671 8.451
2009Q1 1.093 - 920 - -173 2.013
2009Q2 1.209 - 1.004 - -205 2.213
2009Q3 1.100 - 1.068 - -32 2.1682009Q4 1.159 - 898 - -261 2.056
2010Q1 - - - - - -
2010Q2 - - - - - -
2010Q3 - - - - - -
2010Q4 - - - - - -
Average annual growth (2005-2009) 12,9 7,2 #NUM!
0
50
100
150
200
250
300
2005 2006 2007 2008 2009
Imports Exports Balance

8/3/2019 EU and Myanmar 2009
http://slidepdf.com/reader/full/eu-and-myanmar-2009 5/11
EU TRADE WITH MAIN PARTNERS (2009)
The Major Imports Partners The Major Exports Partners The Major Trade Partners
Rk Partners Mio euro % Rk Partners Mio euro % Rk Partners Mio euro %
Extra EU27 1.199.288,0 100,0% Extra EU27 1.094.228,9 100,0% Extra EU27 2.293.516,9 100,0%
1 China 214.749,3 17,9% 1 United States 204.467,7 18,7% 1 United States 364.001,7 15,9%
2 United States 159.534,0 13,3% 2 Switzerland 88.291,9 8,1% 2 China 296.381,9 12,9%3 Russia 115.279,7 9,6% 3 China 81.632,6 7,5% 3 Russia 180.760,7 7,9%
4 Switzerland 73.753,5 6,1% 4 Russia 65.481,0 6,0% 4 Switzerland 162.045,4 7,1%
5 Norway 68.651,5 5,7% 5 Turkey 43.780,5 4,0% 5 Norway 106.166,7 4,6%6 Japan 55.842,9 4,7% 6 Norway 37.515,3 3,4% 6 Japan 91.789,7 4,0%7 Turkey 36.086,0 3,0% 7 Japan 35.946,8 3,3% 7 Turkey 79.866,5 3,5%8 South Korea 32.074,9 2,7% 8 India 27.486,3 2,5% 8 South Korea 53.592,9 2,3%9 Brazil 25.678,0 2,1% 9 United Arab Emirat 25.032,0 2,3% 9 India 52.873,2 2,3%
10 India 25.386,8 2,1% 10 Canada 22.428,5 2,0% 10 Brazil 47.234,0 2,1%11 Libya 19.995,8 1,7% 11 Australia 21.784,0 2,0% 11 Canada 40.205,4 1,8%12 Canada 17.776,8 1,5% 12 Brazil 21.555,9 2,0% 12 Singapore 35.019,8 1,5%
13 Taiwan 17.550,9 1,5% 13 South Korea 21.518,0 2,0% 13 Algeria 32.011,4 1,4%14 Algeria 17.355,6 1,4% 14 Singapore 20.425,4 1,9% 14 South Africa 30.976,6 1,4%15 South Africa 14.927,0 1,2% 15 Hong Kong 19.624,9 1,8% 15 Saudi Arabia 30.488,0 1,3%16 Malaysia 14.646,8 1,2% 16 Saudi Arabia 19.498,7 1,8% 16 Australia 29.863,4 1,3%17 Singapore 14.594,5 1,2% 17 South Africa 16.049,6 1,5% 17 Hong Kong 29.178,0 1,3%18 Thailand 14.277,8 1,2% 18 Mexico 15.868,9 1,5% 18 United Arab Emirat 28.819,4 1,3%19 Indonesia 11.642,8 1,0% 19 Algeria 14.655,8 1,3% 19 Taiwan 27.551,8 1,2%20 Saudi Arabia 10.989,3 0,9% 20 Ukraine 13.902,5 1,3% 20 Libya 26.466,7 1,2%21 Nigeria 10.452,7 0,9% 21 Egypt 12.624,8 1,2% 21 Mexico 25.747,7 1,1%
22 Kazakhstan 10.322,7 0,9% 22 Morocco 11.910,8 1,1% 22 Malaysia 24.337,7 1,1%
23 Mexico 9.878,8 0,8% 23 Israel 11.463,9 1,0% 23 Thailand 21.918,0 1,0%
24 Hong Kong 9.553,1 0,8% 24 Croatia 10.734,9 1,0% 24 Ukraine 21.774,9 0,9%25 Israel 8.852,8 0,7% 25 Iran 10.354,2 0,9% 25 Israel 20.316,6 0,9%
26 Iran 8.475,1 0,7% 26 Taiwan 10.000,9 0,9% 26 Nigeria 19.604,9 0,9%
27 Argentina 8.186,6 0,7% 27 Malaysia 9.690,8 0,9% 27 Iran 18.829,2 0,8%
28 Australia 8.079,4 0,7% 28 Nigeria 9.152,2 0,8% 28 Egypt 18.737,1 0,8%
29 Tunisia 7.890,7 0,7% 29 Tunisia 8.931,4 0,8% 29 Morocco 18.421,1 0,8%
30 Ukraine 7.872,5 0,7% 30 Thailand 7.640,2 0,7% 30 Indonesia 16.900,2 0,7%
31 Vietnam 7.774,8 0,6% 31 Serbia 6.586,3 0,6% 31 Tunisia 16.822,1 0,7%
32 Chile 7.445,1 0,6% 32 Libya 6.470,9 0,6% 32 Kazakhstan 15.703,6 0,7%33 Azerbaijan 7.297,3 0,6% 33 Kazakhstan 5.380,9 0,5% 33 Croatia 15.120,6 0,7%34 Morocco 6.510,3 0,5% 34 Qatar 5.312,5 0,5% 34 Argentina 12.937,0 0,6%35 Egypt 6.112,4 0,5% 35 Indonesia 5.257,4 0,5% 35 Chile 11.956,8 0,5%36 Iraq 5.920,2 0,5% 36 Angola 5.186,8 0,5% 36 Vietnam 11.531,5 0,5%37 Bangladesh 5.812,6 0,5% 37 Belarus 4.987,5 0,5% 37 Angola 10.103,0 0,4%38 Angola 4.916,2 0,4% 38 Argentina 4.750,4 0,4% 38 Serbia 9.796,9 0,4%39 Croatia 4.385,7 0,4% 39 Chile 4.511,7 0,4% 39 Azerbaijan 8.901,4 0,4%40 Colombia 3.965,2 0,3% 40 Lebanon 4.187,7 0,4% 40 Iraq 8.580,1 0,4%41 Venezuela 3.862,3 0,3% 41 Vietnam 3.756,6 0,3% 41 Qatar 8.514,6 0,4%42 Philippines 3.821,9 0,3% 42 Kuwait 3.708,4 0,3% 42 Venezuela 7.548,0 0,3%43 United Arab Emirat 3.787,3 0,3% 43 Venezuela 3.685,7 0,3% 43 Belarus 7.539,2 0,3%44 Pakistan 3.318,0 0,3% 44 Pakistan 3.611,9 0,3% 44 Colombia 7.267,2 0,3%45 Serbia 3.210,6 0,3% 45 Gibraltar 3.393,7 0,3% 45 Pakistan 6.929,9 0,3%46 Qatar 3.202,2 0,3% 46 Colombia 3.301,9 0,3% 46 Bangladesh 6.816,4 0,3%
47 Peru 3.170,7 0,3% 47 Syria 3.062,6 0,3% 47 Philippines 6.780,6 0,3%48 Ivory Coast 3.055,5 0,3% 48 Philippines 2.958,7 0,3% 48 Kuwait 6.554,0 0,3%
49 Kuwait 2.845,6 0,2% 49 Bosnia-Herzegovina 2.940,1 0,3% 49 Syria 5.371,2 0,2%
50 Costa Rica 2.784,0 0,2% 50 Iraq 2.659,9 0,2% 50 New Zealand 4.827,9 0,2%
119 Myanmar 156,9 0,0% 150 Myanmar 90,7 0,0% 138 Myanmar 247,6 0,0%
EU Imports from … EU Exports to … Imports + Exports
P i Mi % P i Mi % P i Mi %

8/3/2019 EU and Myanmar 2009
http://slidepdf.com/reader/full/eu-and-myanmar-2009 6/11
MYANMAR'S TRADE WITH MAIN PARTNERS (2009)
The Major Imports Partners The Major Export Partners The Major Trade Partners
Rk Partners Mio euro % Rk Partners Mio euro % Rk Partners Mio euro %
World (all countrie 4.561,0 100,0% World (all countrie 3.889,7 100,0% World (all countrie 8.450,7 100,0%
1 China 1.535,1 33,7% 1 Thailand 1.825,7 46,9% 1 Thailand 3.038,0 35,9%
2 Thailand 1.212,3 26,6% 2 India 510,4 13,1% 2 China 1.888,4 22,3%3 Singapore 701,7 15,4% 3 China 353,3 9,1% 3 Singapore 778,9 9,2%
4 Malaysia 174,5 3,8% 4 Japan 222,9 5,7% 4 India 657,7 7,8%
5 South Korea 168,9 3,7% 5 EU27 142,6 3,7% 5 Japan 381,1 4,5%6 Japan 158,2 3,5% 6 Malaysia 86,6 2,2% 6 Malaysia 261,2 3,1%7 India 147,3 3,2% 7 Singapore 77,2 2,0% 7 EU27 242,4 2,9%8 Indonesia 138,4 3,0% 8 South Korea 66,6 1,7% 8 South Korea 235,6 2,8%9 EU27 99,8 2,2% 9 Bangladesh 46,0 1,2% 9 Indonesia 156,6 1,9%
10 North Korea 38,1 0,8% 10 Vietnam 43,5 1,1% 10 North Korea 69,9 0,8%11 Australia 36,8 0,8% 11 Ivory Coast 41,7 1,1% 11 Vietnam 66,0 0,8%12 Hong Kong 30,5 0,7% 12 Pakistan 39,6 1,0% 12 Hong Kong 57,7 0,7%
13 Vietnam 22,5 0,5% 13 North Korea 31,8 0,8% 13 Bangladesh 51,8 0,6%14 Russia 15,8 0,3% 14 Hong Kong 27,2 0,7% 14 Australia 51,0 0,6%15 Ukraine 11,5 0,3% 15 United Arab Emirat 22,4 0,6% 15 Pakistan 42,3 0,5%16 Turkey 9,1 0,2% 16 Indonesia 18,2 0,5% 16 Ivory Coast 41,8 0,5%17 Philippines 7,4 0,2% 17 Australia 14,3 0,4% 17 United Arab Emirat 22,4 0,3%18 Brazil 6,2 0,1% 18 Turkey 11,3 0,3% 18 Turkey 20,4 0,2%19 Saudi Arabia 6,1 0,1% 19 Argentina 7,0 0,2% 19 Russia 19,0 0,2%20 Bangladesh 5,8 0,1% 20 Ghana 5,8 0,2% 20 Ukraine 11,6 0,1%21 United States 5,6 0,1% 21 Kuwait 5,4 0,1% 21 Philippines 9,8 0,1%
22 New Zealand 4,6 0,1% 22 Egypt 5,0 0,1% 22 Brazil 7,2 0,1%
23 Israel 3,7 0,1% 23 South Africa 3,9 0,1% 23 Argentina 7,1 0,1%
24Switzerland 3,6 0,1%
24Sri Lanka 3,6 0,1%
24Saudi Arabia 7,1 0,1%25 Pakistan 2,7 0,1% 25 Russia 3,2 0,1% 25 Ghana 5,8 0,1%
26 Oman 2,5 0,1% 26 Philippines 2,4 0,1% 26 United States 5,7 0,1%
27 Namibia 1,7 0,0% 27 Qatar 2,0 0,1% 27 Kuwait 5,4 0,1%
28 Tanzania 1,3 0,0% 28 Cameroon 1,9 0,0% 28 New Zealand 5,3 0,1%
29 Costa Rica 1,2 0,0% 29 Mauritius 1,5 0,0% 29 Egypt 5,1 0,1%
30 Sri Lanka 0,4 0,0% 30 Oman 1,5 0,0% 30 Oman 4,0 0,0%
31 Croatia 0,4 0,0% 31 Brazil 1,0 0,0% 31 Sri Lanka 4,0 0,0%
32 Argentina 0,2 0,0% 32 Saudi Arabia 1,0 0,0% 32 South Africa 3,9 0,0%33 Ivory Coast 0,2 0,0% 33 Bahrain 0,9 0,0% 33 Israel 3,8 0,0%34 Belarus 0,1 0,0% 34 Lebanon 0,8 0,0% 34 Switzerland 3,8 0,0%35 Jordan 0,1 0,0% 35 Croatia 0,8 0,0% 35 Qatar 2,0 0,0%36 Canada 0,1 0,0% 36 Macao 0,8 0,0% 36 Cameroon 1,9 0,0%37 Egypt 0,1 0,0% 37 Central African Rep 0,7 0,0% 37 Namibia 1,7 0,0%38 Norway 0,1 0,0% 38 New Zealand 0,7 0,0% 38 Mauritius 1,5 0,0%39 Brunei 0,0 0,0% 39 Nigeria 0,6 0,0% 39 Tanzania 1,3 0,0%40 Cambodia 0,0 0,0% 40 Jordan 0,3 0,0% 40 Costa Rica 1,2 0,0%41 Zimbabwe 0,0 0,0% 41 Norway 0,2 0,0% 41 Croatia 1,2 0,0%42 Macao 0,0 0,0% 42 Brunei 0,2 0,0% 42 Bahrain 0,9 0,0%43 Iceland 0,0 0,0% 43 Chile 0,2 0,0% 43 Lebanon 0,8 0,0%44 44 Switzerland 0,2 0,0% 44 Macao 0,8 0,0%45 45 Uruguay 0,1 0,0% 45 Central African Rep 0,7 0,0%46 46 Tunisia 0,1 0,0% 46 Nigeria 0,6 0,0%
47 47 Israel 0,1 0,0% 47 Jordan 0,4 0,0%48 48 Iran 0,1 0,0% 48 Norway 0,3 0,0%
49 49 Cambodia 0,1 0,0% 49 Brunei 0,2 0,0%
50 50 Colombia 0,1 0,0% 50 Belarus 0,2 0,0%
Myanmar's Imports from … Myanmar's Exports to … Myanmar's Trade with…
P i Mi % P i Mi % P i Mi %
8/3/2019 EU and Myanmar 2009
http://slidepdf.com/reader/full/eu-and-myanmar-2009 7/11
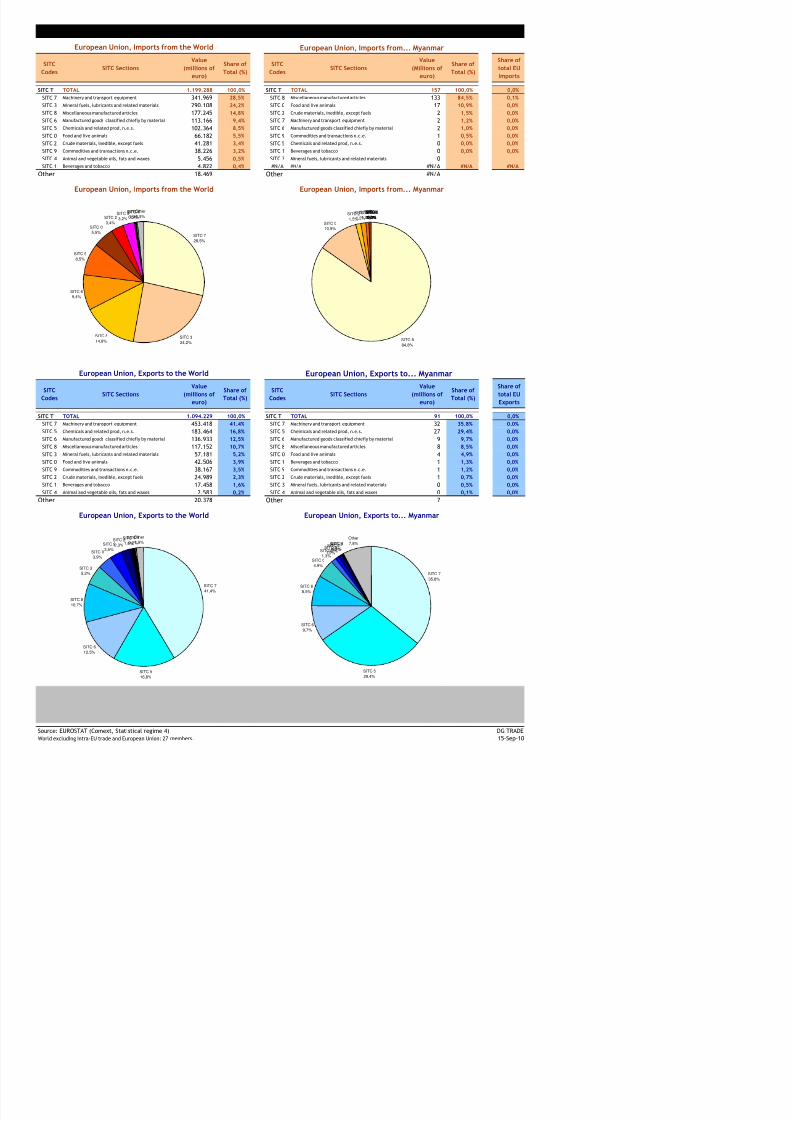
EUROPEAN UNION, TRADE WITH THE WORLD AND MYANMAR, BY SITC SECTION (2009)
European Union, Imports from the World European Union, Imports from... Myanmar
SITC
CodesSITC Sections
Value
(millions of
euro)
Share of
Total (%)
SITC
CodesSITC Sections
Value
(Millions of
euro)
Share of
Total (%)
Share of
total EU
Imports
SITC T TOTAL 1.199.288 100,0% SITC T TOTAL 157 100,0% 0,0%
SITC 7 Machinery and transport equipment 341.969 28,5% SITC 8 Miscellaneous manufactured articles 133 84,5% 0,1%SITC 3 Mineral fuels, lubricants and related materials 290.108 24,2% SITC 0 Food and live animals 17 10,9% 0,0%
SITC 8 Miscellaneous manufactured articles 177.245 14,8% SITC 2 Crude materials, inedible, except fuels 2 1,5% 0,0%
SITC 6 Manufactured goods classified chiefly by material 113.166 9,4% SITC 7 Machinery and transport equipment 2 1,2% 0,0%
SITC 5 Chemicals and related prod, n.e.s. 102.364 8,5% SITC 6 Manufactured goods classified chiefly by material 2 1,0% 0,0%
SITC 0 Food and live animals 66.182 5,5% SITC 9 Commodities and transactions n.c.e. 1 0,5% 0,0%
SITC 2 Crude materials, inedible, except fuels 41.281 3,4% SITC 5 Chemicals and related prod, n.e.s. 0 0,0% 0,0%
SITC 9 Commodities and transactions n.c.e. 38.226 3,2% SITC 1 Beverages and tobacco 0 0,0% 0,0%
SITC 4 Animal and vegetable oils, fats and waxes 5.456 0,5% SITC 3 Mineral fuels, lubricants and related materials 0
SITC 1 Beverages and tobacco 4.822 0,4% #N/A #N/A #N/A #N/A #N/A
Other 18.469 Other #N/A
European Union, Imports from the World European Union, Imports from... Myanmar
European Union, Exports to the World European Union, Exports to... Myanmar
SITCCodes
SITC Sections
Value
(millions of
euro)
Share of Total (%)
SITCCodes
SITC Sections
Value
(millions of
euro)
Share of Total (%)
Share of
total EU
Exports
SITC T TOTAL 1.094.229 100,0% SITC T TOTAL 91 100,0% 0,0%
SITC 7 Machinery and transport equipment 453.418 41,4% SITC 7 Machinery and transport equipment 32 35,8% 0,0%
SITC 5 Chemicals and related prod, n.e.s. 183.464 16,8% SITC 5 Chemicals and related prod, n.e.s. 27 29,4% 0,0%
SITC 6 Manufactured goods classified chiefly by material 136.933 12,5% SITC 6 Manufactured goods classified chiefly by material 9 9,7% 0,0%
SITC 8 Miscellaneous manufactured articles 117.152 10,7% SITC 8 Miscellaneous manufactured articles 8 8,5% 0,0%
SITC 3 Mineral fuels, lubricants and related materials 57.181 5,2% SITC 0 Food and live animals 4 4,9% 0,0%
SITC 0 Food and live animals 42.506 3,9% SITC 1 Beverages and tobacco 1 1,3% 0,0%
SITC 9 Commodities and transactions n.c.e. 38.167 3,5% SITC 9 Commodities and transactions n.c.e. 1 1,2% 0,0%
SITC 2 Crude materials, inedible, except fuels 24.989 2,3% SITC 2 Crude materials, inedible, except fuels 1 0,7% 0,0%
SITC 1 Beverages and tobacco 17.458 1,6% SITC 3 Mineral fuels, lubricants and related materials 0 0,5% 0,0%
SITC 4 Animal and vegetable oils, fats and waxes 2.583 0,2% SITC 4 Animal and vegetable oils, fats and waxes 0 0,1% 0,0%
Other 20.378 Other 7
European Union, Exports to the World European Union, Exports to... Myanmar
SITC 7
28,5%
SITC 3
24,2%
SITC 8
14,8%
SITC 6
9,4%
SITC 5
8,5%
SITC 0
5,5%
SITC 2
3,4%
SITC 9
3,2%
SITC 4
0,5%
SITC 1
0,4%
Other
1,5%
SITC 8
84,8%
SITC 0
10,9%
SITC 2
1,5%
SITC 7
1,2%
SITC 6
1,0%
SITC 9
0,5%
SITC 5
0,0%
SITC 1
0,0%
SITC 3
0,0%
#N/A
0,0%
Other
0,0%
SITC 0
SITC 9
3,5%
SITC 2
2,3%
SITC 1
1,6%
SITC 4
0,2%
Other
1,9%
SITC 1
1 3%
SITC 9
1,2%
SITC 2
0,7%
SITC 3
0,5%
SITC 4
0,1%
Other
7,8%
8/3/2019 EU and Myanmar 2009
http://slidepdf.com/reader/full/eu-and-myanmar-2009 8/11
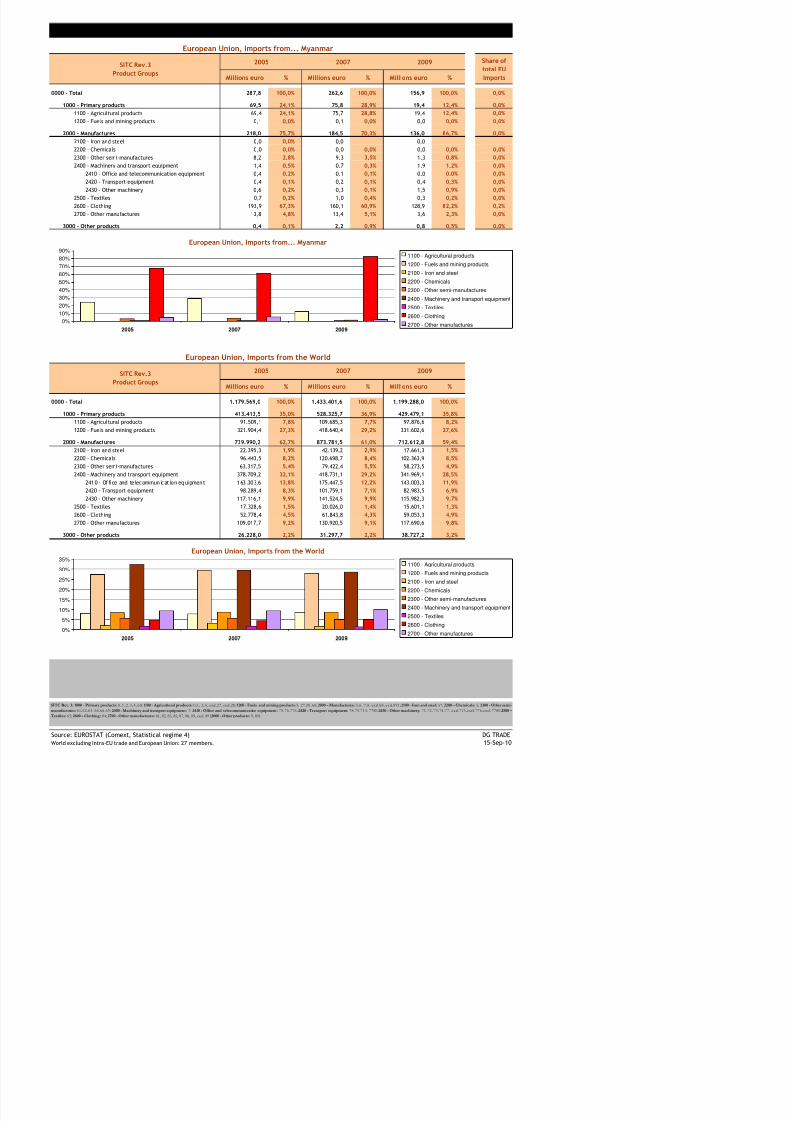
EUROPEAN UNION IMPORTS, BY PRODUCT GROUPING
European Union, Imports from... Myanmar
Millions euro % Millions euro % Millions euro %
0000 - Total 287,8 100,0% 262,6 100,0% 156,9 100,0% 0,0%
1000 - Primary products 69,5 24,1% 75,8 28,9% 19,4 12,4% 0,0%
1100 - Agricultural products 69,4 24,1% 75,7 28,8% 19,4 12,4% 0,0%
1200 - Fuels and mining products 0,1 0,0% 0,1 0,0% 0,0 0,0% 0,0%
2000 - Manufactures 218,0 75,7% 184,5 70,3% 136,0 86,7% 0,0%
2100 - Iron and steel 0,0 0,0% 0,0 0,0
2200 - Chemicals 0,0 0,0% 0,0 0,0% 0,0 0,0% 0,0%
2300 - Other semi-manufactures 8,2 2,8% 9,3 3,5% 1,3 0,8% 0,0%
2400 - Machinery and transport equipment 1,4 0,5% 0,7 0,3% 1,9 1,2% 0,0%
2410 - Office and telecommunication equipment 0,4 0,2% 0,1 0,1% 0,0 0,0% 0,0%
2420 - Transport equipment 0,4 0,1% 0,2 0,1% 0,4 0,3% 0,0%
2430 - Other machinery 0,6 0,2% 0,3 0,1% 1,5 0,9% 0,0%
2500 - Textiles 0,7 0,2% 1,0 0,4% 0,3 0,2% 0,0%
2600 - Clothing 193,9 67,3% 160,1 60,9% 128,9 82,2% 0,2%
2700 - Other manufactures 13,8 4,8% 13,4 5,1% 3,6 2,3% 0,0%
3000 - Other products 0,4 0,1% 2,2 0,9% 0,8 0,5% 0,0%
European Union, Imports from... Myanmar
European Union, Imports from the World
Millions euro % Millions euro % Millions euro %
0000 - Total 1.179.569,0 100,0% 1.433.401,6 100,0% 1.199.288,0 100,0%
1000 - Primary products 413.413,5 35,0% 528.325,7 36,9% 429.479,1 35,8%
1100 - Agricultural products 91.509,1 7,8% 109.685,3 7,7% 97.876,6 8,2%
1200 - Fuels and mining products 321.904,4 27,3% 418.640,4 29,2% 331.602,6 27,6%
2000 - Manufactures 739.990,2 62,7% 873.781,5 61,0% 712.612,8 59,4%
2100 - Iron and steel 22.395,3 1,9% 42.139,2 2,9% 17.661,3 1,5%
2200 - Chemicals 96.443,5 8,2% 120.698,7 8,4% 102.363,9 8,5%
2300 - Other semi-manufactures 63.317,5 5,4% 79.422,4 5,5% 58.273,5 4,9%
2400 - Machinery and transport equipment 378.709,2 32,1% 418.731,1 29,2% 341.969,1 28,5%
2410 - Office and telecommunicat ion equipment 163.303,6 13,8% 175.447,5 12,2% 143.003,3 11,9%
2420 - Transport equipment 98.289,4 8,3% 101.759,1 7,1% 82.983,5 6,9%
2430 - Other machinery 117.116,1 9,9% 141.524,5 9,9% 115.982,3 9,7%
2500 - Textiles 17.328,6 1,5% 20.026,0 1,4% 15.601,1 1,3%
2600 - Clothing 52.778,4 4,5% 61.843,8 4,3% 59.053,3 4,9%
2700 - Other manufactures 109.017,7 9,2% 130.920,5 9,1% 117.690,6 9,8%
3000 - Other products 26.228,0 2,2% 31.297,7 2,2% 38.727,2 3,2%
European Union, Imports from the World
2009
SITC Rev.3
Product Groups
SITC Rev.3
Product Groups
2005 2007
Share of
total EU
Imports
2005 2007 2009
0%
10%
20%
30%
40%
50%
60%
70%
80%
90%
2005 2007 2009
1100 - Agricultural products
1200 - Fuels and mining products
2100 - Iron and steel
2200 - Chemicals
2300 - Other semi-manufactures
2400 - Machinery and transport equipment
2500 - Textiles
2600 - Clothing
2700 - Other manufactures

8/3/2019 EU and Myanmar 2009
http://slidepdf.com/reader/full/eu-and-myanmar-2009 9/11
EUROPEAN UNION EXPORTS, BY PRODUCT GROUPING
European Union, Exports to... Myanmar
Millions euro % Millions euro % Millions euro %
0000 - Total 83,7 100,0% 163,5 100,0% 90,7 100,0% 0,0%
1000 - Primary products 4,4 5,3% 5,0 3,0% 6,9 7,6% 0,0%
1100 - Agricultural products 4,2 5,0% 4,3 2,6% 6,2 6,8% 0,0%
1200 - Fuels and mining products 0,3 0,3% 0,7 0,4% 0,6 0,7% 0,0%
2000 - Manufactures 67,6 80,7% 156,1 95,4% 75,7 83,4% 0,0%
2100 - Iron and steel 0,0 0,0% 0,0 0,0% 0,6 0,6% 0,0%
2200 - Chemicals 19,1 22,8% 18,4 11,2% 26,7 29,4% 0,0%
2300 - Other semi-manufactures 2,5 2,9% 4,1 2,5% 6,1 6,7% 0,0%
2400 - Machinery and transport equipment 34,8 41,5% 121,4 74,2% 32,5 35,8% 0,0%
2410 - Office and telecommunication equipment 1,9 2,3% 1,6 1,0% 2,0 2,2% 0,0%
2420 - Transport equipment 3,7 4,5% 19,0 11,6% 2,9 3,2% 0,0%
2430 - Other machinery 29,1 34,7% 100,7 61,6% 27,6 30,5% 0,0%
2500 - Textiles 2,5 2,9% 1,8 1,1% 2,2 2,4% 0,0%
2600 - Clothing 4,5 5,4% 5,2 3,2% 3,2 3,5% 0,0%
2700 - Other manufactures 4,2 5,1% 5,3 3,2% 4,5 4,9% 0,0%
3000 - Other products 11,3 13,5% 1,3 0,8% 1,1 1,3% 0,0%
European Union, Exports to... Myanmar
European Union, Exports to the World
Millions euro % Millions euro % Millions euro %
0000 - Total 1.052.719,5 100,0% 1.240.540,6 100,0% 1.094.228,9 100,0%
1000 - Primary products 135.179,8 12,8% 177.901,8 14,3% 158.755,8 14,5%
1100 - Agricultural products 67.553,3 6,4% 80.070,8 6,5% 76.785,9 7,0%
1200 - Fuels and mining products 67.626,6 6,4% 97.831,0 7,9% 81.970,0 7,5%
2000 - Manufactures 886.036,5 84,2% 1.029.530,2 83,0% 875.245,0 80,0%
2100 - Iron and steel 30.976,6 2,9% 38.215,7 3,1% 28.822,1 2,6%
2200 - Chemicals 164.852,5 15,7% 197.917,2 16,0% 183.463,9 16,8%
2300 - Other semi-manufactures 86.672,8 8,2% 100.686,0 8,1% 80.701,6 7,4%
2400 - Machinery and transport equipment 470.323,2 44,7% 543.165,6 43,8% 453.417,8 41,4%
2410 - Office and telecommunication equipment 94.006,5 8,9% 86.398,9 7,0% 64.548,5 5,9%
2420 - Transport equipment 162.616,9 15,4% 184.750,9 14,9% 145.481,1 13,3%
2430 - Other machinery 210.975,7 20,0% 268.909,9 21,7% 240.101,1 21,9%
2500 - Textiles 16.441,2 1,6% 17.371,8 1,4% 13.059,1 1,2%
2600 - Clothing 15.396,6 1,5% 18.186,0 1,5% 15.152,1 1,4%
2700 - Other manufactures 101.040,1 9,6% 113.680,1 9,2% 100.232,3 9,2%
3000 - Other products 31.685,4 3,0% 33.114,1 2,7% 39.849,8 3,6%
European Union, Exports to the World
S are o
total EU
Exports
2008
2005 2007 2009SITC Rev.3
Product Groups
SITC Rev.3
Product Groups
2005 2007 2009
0%
10%
20%
30%
40%
50%
60%
70%
80%
2005 2007 2009
1100 - Agricultural products
1200 - Fuels and mining products
2100 - Iron and steel
2200 - Chemicals
2300 - Other semi-manufactures
2400 - Machinery and transport equipment
2500 - Textiles
2600 - Clothing
2700 - Other manufactures

8/3/2019 EU and Myanmar 2009
http://slidepdf.com/reader/full/eu-and-myanmar-2009 10/11
RANK OF MYANMAR IN EUROPEAN UNION TRADE (2009)
EU Imports EU Exports EU Balance
SITC Rev.3
Product GroupsRank
Millions
of euro
Share in
Total
Share of
total EU
Imports
RankMillions
of euro
Share in
Total
Share of
total EU
Exports
Millions
of euro
TOTAL 119 156,9 100,0% 0,0% 150 90,7 100,0% 0,0% -66,2
1000 - Primary products 139 19,4 12,4% 0,0% 164 6,9 7,6% 0,0% -12,6
1100 - Agricultural products 115 19,4 12,4% 0,0% 157 6,2 6,8% 0,0% -13,2
1110 - Food 109 19,2 12,2% 0,0% 157 5,8 6,4% 0,0% -13,3
1111 - Fish 65 12,1 7,7% 0,1% 146 0,0 0,1% 0,0% -12,0
1112 - Other food products and live animals 116 7,1 4,5% 0,0% 157 5,8 6,4% 0,0% -1,3
1120 - Raw materials 126 0,3 0,2% 0,0% 143 0,4 0,4% 0,0% 0,1
1200 - Fuels and mining products 177 0,0 0,0% 0,0% 161 0,6 0,7% 0,0% 0,6
1210 - Ores and other minerals 174 0,0 0,0% 131 0,2 0,2% 0,0% 0,2
1220 - Fuels 131 0,0 0,0% 151 0,5 0,5% 0,0% 0,5
1221 - Petroleum and petroleum products 126 0,0 0,0% 150 0,5 0,5% 0,0% 0,5
1222 - Other fuels 77 0,0 0,0% 148 0,0 0,0% 0,0
1230 - Non ferrous metals 122 0,0 0,0% 0,0% 198 0,0 0,0% 0,0% -0,0
2000 - Manufactures 76 136,0 86,7% 0,0% 146 75,7 83,4% 0,0% -60,4
2100 - Iron and steel 132 0,0 0,0% 144 0,6 0,6% 0,0% 0,6
2200 - Chemicals 182 0,0 0,0% 0,0% 117 26,7 29,4% 0,0% 26,7
2210 - Pharmaceuticals 137 0,0 0,0% 0,0% 117 10,8 11,9% 0,0% 10,8
2220 - Plastics 138 0,0 0,0% 0,0% 112 4,2 4,6% 0,0% 4,2
2230 - Other chemicals 185 0,0 0,0% 117 11,7 13,0% 0,0% 11,7
2300 - Other semi-manufactures 113 1,3 0,8% 0,0% 146 6,1 6,7% 0,0% 4,8
2400 - Machinery and transport equipment 131 1,9 1,2% 0,0% 151 32,5 35,8% 0,0% 30,6
2410 - Office and telecommunication equipment 176 0,0 0,0% 0,0% 160 2,0 2,2% 0,0% 1,9
2411 - Electronic data processing and office equipment 171 0,0 0,0% 0,0% 148 1,0 1,1% 0,0% 1,0
2412 - Telecommunications equipment 166 0,0 0,0% 0,0% 159 0,9 1,0% 0,0% 0,9
2413 - Integrated circuits and electronic components 152 0,0 0,0% 0,0% 159 0,0 0,0% 0,0% 0,0
2420 - Transport equipment 118 0,4 0,3% 0,0% 168 2,9 3,2% 0,0% 2,5
2421 - Automotive products 159 0,0 0,0% 0,0% 183 0,2 0,2% 0,0% 0,2
2422 - Other transport equipment 104 0,4 0,3% 0,0% 151 2,7 3,0% 0,0% 2,3
2430 - Other machinery 107 1,5 0,9% 0,0% 130 27,6 30,5% 0,0% 26,2
2431 - Power generating machinery 67 1,4 0,9% 0,0% 125 3,4 3,8% 0,0% 2,0
2432 - Non electrical machinery 182 0,0 0,0% 0,0% 126 20,2 22,3% 0,0% 20,2
2433 - Electrical machinery 157 0,0 0,0% 0,0% 140 4,0 4,4% 0,0% 3,9
2500 - Textiles 81 0,3 0,2% 0,0% 105 2,2 2,4% 0,0% 1,9
2600 - Clothing 26 128,9 82,2% 0,2% 89 3,2 3,5% 0,0% -125,7
2700 - Other manufactures 85 3,6 2,3% 0,0% 155 4,5 4,9% 0,0% 0,9
2710 - Personal and household goods 54 2,7 1,7% 0,0% 170 0,2 0,2% 0,0% -2,4
2720 - Scientific and controlling instruments 176 0,0 0,0% 0,0% 132 2,9 3,2% 0,0% 2,9
2730 - Miscellaneous manufactures 96 0,9 0,6% 0,0% 173 1,4 1,5% 0,0% 0,4
3000 - Other products 119 0,8 0,5% 0,0% 150 1,1 1,3% 0,0% 0,4
EU Trade with... Myanmar
19
0 0 0 1 2 0
129
4 1
32
11 1
27
5 2 1 03 461 1 26
27
-13
31
-50
0
50
100
150
m i l l i o n s o f e u r o

8/3/2019 EU and Myanmar 2009
http://slidepdf.com/reader/full/eu-and-myanmar-2009 11/11