ethnic variation in the contribution of cardiorespiratory fitness and muscular strength to diabetes:...
TRANSCRIPT

Ethnic variation in the contribution of Cardiorespiratory fitness and muscular
strength to diabetes: crossectional study of 68,116 UK Biobank participants
Uduakobong Ntuk,
Institute of Health and Wellbeing ,University of Glasgow
International Conference on Epidemiology & Public Health
Valencia Spain, 2015

OutlineBackgroundStudy AimsMethodsResultDiscussionStrengths and LimitationsConclusion

Background Type 2 diabetes is a major public health problem
Diabetes prevalence◦ Black (2x White European)
◦ South Asian (4x White European)


Background (cont’d)• Low cardiorespiratory fitness • involved in the progression from normal glucose metabolism to
type 2 diabetes (T2D);
• predictors of cardiovascular events and premature mortality in T2D individuals.
• Muscular strength is a predictor of all-cause mortality,
as well as disability.
No epidemiological studies on ethnic variation and diabetes prevalence
Rantanen T, et al; Sayer AA, et al; Ghouri N, et al; Wander PL, et al

Study Aims To determine the associations of (a) cardiorespiratory
fitness (b) muscular strength on diabetes risk in White European, Black and South Asian.
To determine the extent to which ethnic differences in fitness and muscle strength might account for observed differences in diabetes prevalence
Whether the strength of these relationships similar across ethnic groups

MethodsData Source
UK Biobank◦ Large sample size data >500,000◦ Aged between 40 and 70 years◦ Representative of the UK population in terms of age-band, sex and
ethnic structure◦ Self-identified as White, South Asian or black background living in the
UK
Data Analysis◦ Multivariate logistic regression model◦ Adjusting for :
Age, Sex ,Deprivation quintile , Smoking , Alcohol consumption, BMI and Percentage body fat

Results
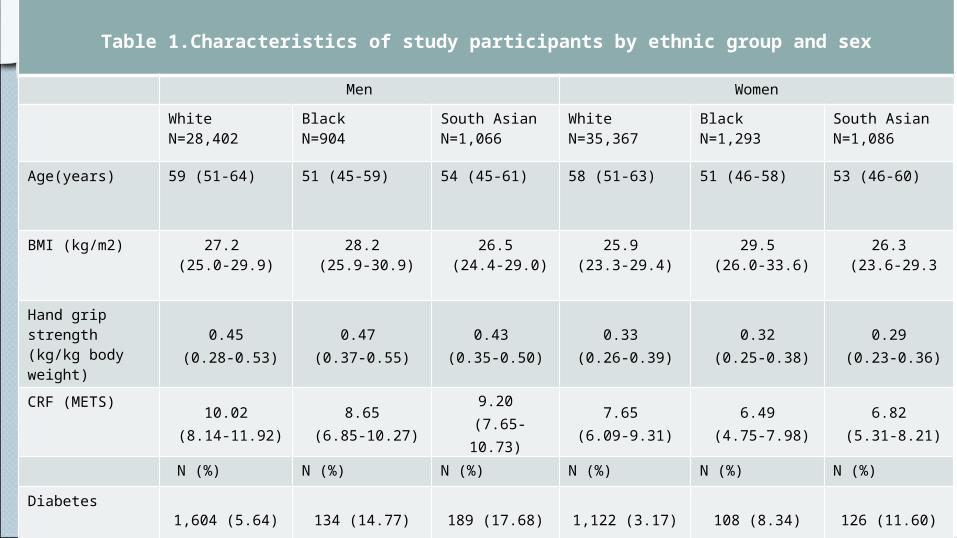
Table 1.Characteristics of study participants by ethnic group and sex
Men Women
WhiteN=28,402
Black N=904
South Asian N=1,066
White N=35,367
Black N=1,293
South Asian N=1,086
Age(years) 59 (51-64) 51 (45-59) 54 (45-61) 58 (51-63) 51 (46-58) 53 (46-60)
BMI (kg/m2) 27.2 (25.0-29.9)
28.2 (25.9-30.9)
26.5 (24.4-29.0)
25.9 (23.3-29.4)
29.5 (26.0-33.6)
26.3 (23.6-29.3
Hand grip strength (kg/kg body weight)
0.45 (0.28-0.53)
0.47 (0.37-0.55)
0.43 (0.35-0.50)
0.33 (0.26-0.39)
0.32 (0.25-0.38)
0.29 (0.23-0.36)
CRF (METS)10.02
(8.14-11.92)8.65
(6.85-10.27)9.20
(7.65-10.73)7.65
(6.09-9.31)6.49
(4.75-7.98)6.82
(5.31-8.21)
N (%) N (%) N (%) N (%) N (%) N (%)
Diabetes1,604 (5.64) 134 (14.77) 189 (17.68) 1,122 (3.17) 108 (8.34) 126 (11.60)

High strength
Moderate strength
Low strength
0
1
2
3
4
5
6
7
8
High fitness
Low fitness
1.88
3.654.78
2.493.76
5.022.70
3.90
5.86
Dia
bete
s o
dd
s r
ati
o
Black men
High
stre
ngth
Mod
erat
e st
reng
th
Low s
treng
th
0
2
4
6
8
High fitness
Low fitness1.00 1.06 1.64
1.00 1.24 1.76
1.32 1.94 2.41
Dia
bete
s o
dd
s r
ati
o
White men
High
stre
ngth
Mod
erat
e st
reng
th
Low stren
gth
0
1
2
3
4
5
6
7
8
High fitness
Low fitness
3.023.94 4.543.43 4.04
6.29
3.49
6.51 6.72
Dia
bete
s o
dd
s r
ati
o
South Asian men
Impact of fitness & strength on risk of diabetes (Men)

High
stre
ngth
Mod
erat
e st
reng
th
Low stren
gth
0
2
4
6
8
High fitness
Low fitness
1.14 2.11 2.621.27
3.312.96
3.52
5.88
4.05
Dia
bete
s o
dd
s r
ati
o
Black women
High
stre
ngth
Mod
erat
e st
reng
th
Low stren
gth
0
2
4
6
8
High fitness
Low fitness1.00 1.03 1.33
1.09 1.04 1.68
1.36 1.31 2.10
Dia
bete
s o
dd
s r
ati
o White women
High strength
Moderate strength
Low strength
0
1
2
3
4
5
6
7
8
High fitness
Moderate fitness
Low fitness
2.533.73
5.373.54
4.59
6.223.90
5.286.45
Dia
bete
s o
dd
s r
ati
o
South Asian women
Impact of fitness & strength on risk of diabetes (Women)

Breakdown of participantsby fitness & strength (men)
High
stre
ngth
Mod
erat
e st
reng
th
Low stren
gth
05
10152025303540
High fitness
Low fitness3.8 10.8
15.73.5 8.1
17.42.1
9.6
29.1
Pro
port
ion
of
pop
ula
tion
in
cate
gory
(%
)
Black men
High
stre
ngth
Mod
erat
e st
reng
th
Low stren
gth
0
10
20
30
40
High fitness
Low fitness
12.49.4
6.1
12.3 11.99.9
10.1 12.1 15.7
Pro
port
ion
of
pop
ula
tion
in
cate
gory
(%
)
White men
High
stre
ngth
Mod
erat
e st
reng
th
Low stren
gth
0
5
10
15
20
25
30
35
40
High fitness
Low fitness3.0 5.2
4.5
7.5 10.7 13.76.1
15.0
34.3
Pro
port
ion
of
pop
ula
tion
in
cate
gory
(%
)
South Asian women

Breakdown of participantsby fitness & strength (women)
High
stre
ngth
Mod
erat
e st
reng
th
Low stren
gth
0
5
10
15
20
25
30
35
40
High fitness
Low fitness4.4 6.2 7.1
4.911.1 14.06.3
15.8
30.2
Pro
port
ion
of
pop
ula
tion
in
cate
gory
(%
)
South Asian men
High
stre
ngth
Mod
erat
e st
reng
th
Low stren
gth
0
5
10
15
20
25
30
35
40
High fitness
Low fitness3.9
2.7 3.1
7.3 8.98.1
10.1
19.9
36.0
Pro
port
ion
of
pop
ula
tion
in
cate
gory
(%
)
Black women
High
stre
ngth
Mod
erat
e st
reng
th
Low stren
gth
05
10152025303540
High fitness
Low fitness
14.212.2
8.4
9.5 12.4 11.85.9 9.7
15.9
Pro
port
ion
of
pop
ula
tion
in
cate
gory
(%
)
White women

Table 2. Attributable risk and attributable fraction of low-to-moderate cardiorespiratory fitness and low-to-moderate muscular strength for diabetes in
White, Black and South Asian men and women
Men Women
White Black South Asian White Black South Asian
Attributable risk (diabetes cases per 100 people)
1.4 (0.5-2.3) 4.1 (3.5-10.9) 8.2 (2.3-18.6) 1.0 (0.5-1.5) 4.3 (2.2-7.8) 5.0 (2.8-12.5)
Attributable fraction for diabetes risk (%)
24.5 (6.3-39.1)
28.1 (22.5-60.4)
45.7 (18.8-81.2)
27.3 (5.1-44.3)42.6 (20.1-
79.9)47.2 (20.8-
86.6)

Discussion Findings suggest a graded association between weaker
muscular strength, low cardiorespiratory fitness and diabetes risk, particularly in South Asian and Black ethnic groups.◦ remained significant after adjustment for adiposity (BMI
and %body fat).
Need to include strength-training exercises, as well as aerobic physical activity, in future lifestyle interventions trials for diabetes prevention.
Need to target black and south Asian adults for interventions to increase strength and fitness.
Result (contd)

Strengths and Limitations Strength of study:– Primary predictors objectively measured – Large sample size– Ethnic diversity
Limitations:– Cross sectional study– Can not determine causal association– Selection bias?

Conclusion Independent associations between fitness and muscular
strength on diabetes risk in white European, south Asian and black adults
Low-to-moderate fitness and strength could importantly contribute to a disproportionately large proportion of diabetes cases in the south Asian and black groups
A clear case for future randomised controlled trials of interventions to improve both strength and fitness in non-white populations

Translating research into practice ……

The rest of the team ….. Jason M.R. Gill, Daniel F. Mackay, Naveed Sattar, Jill P. Pell
