estuary survey - teaching guide and activity sets · the hardest part of any big project is to...
TRANSCRIPT

�
Estuary Survey Resource kit and teaching guide
JUNE 2007

�
Estuary Survey RESouRcE kit and tEaching guidE
by Rika Milne
ISBN: 978-0-478-�423�-0

2
Tuesday 4 December 2001
With nearly 50 per cent of all of the peoples of the world now living in towns or cities, we wanted to begin the process of bringing people back the appreciation of nature that may be missing from many daily lives.
We want to restart people caring for the environment, as it must be cared for.
And at the same time we want to do this through adventure, through participation, through education and through enjoyment.
To win, you have to believe you can do it. You have to be passionate about it. You really have to “want” the result – even if this means years of work.
The hardest part of any big project is to begin. We have begun - we are underway – we have passion. We want to make a difference. We hope that you and as many of your friends as possible will join us.
Kind regards
Peter
FRoM SiR PeteR Blake’S log

3

4

�
Contents
introduction 7
Guide to using the resource kit and running MarineWatch programmes 7
karakia 10
activity Set a – Marine life and marine surveying 11
Activity A� – What do we know about Tangaroa and his domain the sea? �4
Teacher Instruction – Tangaroa 16
Activity A2 – Marine animal groups and habitat �7
Activity A3 – Marine animal biology and ecology �9
Activity A4 – Species ID 2�
Activity A� – MarineWatch 22
Information Sheet – What is MarineWatch? 23
Worksheet – What is MarineWatch? 24
Activity A6 – Marine Surveying 2�
Activity A7 – Species diversity, density and abundance 26
Information Sheet – Marine life and marine surveys 27
Worksheet – Marine life and marine surveys 29
Activity A8 – Estuary Survey 32
Information Sheet – Introduction to the MarineWatch estuary survey 33
Worksheet – Introduction to the MarineWatch estuary survey 34
Activity A9 – How to do the survey 36
Transect and site data sheet 38
Information Sheet – How to do the estuary survey 41
Worksheet – How to do the estuary survey 43
Activity A�0 – Estimating abundance 4�
Activity A�� – Survey site research 47
Activity A�2– Survey site – past and present human activity 49
Worksheet – Venn diagram 51
Activity A�3 – Alien marine species �2
Information Sheet – Alien Species – looking for the big eight 53
Worksheet – Alien Species – looking for the big eight 56
Activity A�4 – Survey site – current and past management �8
activity Set B – Field survey activity 60
Activity B� – MarineWatch estuary field survey 6�
Teacher Instruction – Risk management guidelines 66

6
activity Set C – Data entry 68
Activity C� – About data entry 69
Information Sheet – MarineWatch data 70
Worksheet – MarineWatch data 74
Activity C2 – Entering data and the presence and absence of species 76
Activity C3 – Working out species abundance 78
Activity C4 – Investigating the distribution of species between high and low tide 8�
activity Set D –kaitiakitanga & taking action 83
Activity D� – Conservation of marine biodiversity and marine protected areas 84
Activity D2 – Taking action to improve the local marine environment 8�
Worksheet – Action Planner 87
appendices
Bibliography 88
teacher feedback form 89
glossary – a list of scientific words 90

7
MarineWatch is about building relationships between people and the sea. Increasingly we are recognising the importance of the ocean as a taonga or treasure that must be cared for. Acting with a spirit of Kaitiakitanga or guardianship is one way in which we may work towards resolving the oceans environmental problems. MarineWatch combines science, experience and action for the environment and aims to encourage connectedness and sensitivity with the sea.
MarineWatch was initiated by DOC in 2003. Several MarineWatch training packages were developed and piloted by the Bay of Plenty Polytechnic Marine Studies Department. This kit is the product of further development and trials conducted in celebration of SeaWeek 2003 – 2006. MarineWatch programmes aim to:
• Develop individual and collective knowledge about the marine environment through observation, experience, surveying and monitoring
• Empower local communities with knowledge, experience and strategies for action to achieve marine conservation aims
• Encourage education for sustainability and action for the environment
For more information about MarineWatch or this resource contact either your local Department of Conservation office or Indigo Pacific, PO BOX ��-378, Papamoa 3���; Phone: 07 �72 43��; or email [email protected].
intRoduction
guide to using the resource kit & running MarineWatch programmes
QuiCk guiDe to the PRogRaMMe
The MarineWatch estuary survey involves the following:
• Learning about marine life and marine surveying
• A marine survey in the local estuarine environment
• Learning about data entry and data manipulation
• Presentation to the school or local community about what has been learnt – including a plan of action for protecting the local environment
The teaching and learning resources have been divided into individual activities to allow teachers to determine which aspects of the programme they wish to deliver. To assist teachers in working out which activities require prior learning, this is indicated under the heading ‘prior learning’ at the top of each activity. Extension activities and possible next steps are also suggested (located at the bottom of each activity).
“He aroaro ka huri ki te wa kainga e kore e tau ki raro”“If an objective is compelling, one pursues it without pausing”

8

9
• Sustainability – using the estuarine environment a
utilise and depend on the estuarine ecosystem
With the estuarine environment, enhancing theenvironment and taking actions in partnership with the
in the estuarine environment, where valuable learning
about the estuarine environment, the animals and

�0
“He panahe toki, ka tu te tangitangi kai” “Minimal effort with patience and perseverance can result in big returns”
karakia
This Karakia may be said at the start of each MarineWatch session acknowledging our Whakapapa and connection with the environment including Tangaroa, the sea.
Ko RangiKo PapaKa Puta ko RongoKo TanemahutaKo TawhirimateaKo TangaroaKo HaumietiketikeKo TumatauengaKo te Rangi ki rungaKo te Papa ki raroKa Puta te ira tangataKi te whaiao, ki te ao maramaTihei mauri ora

��
ac
tiv
ity S
Et
a –
Ma
Rin
E l
ifE
an
d M
aR
inE
Su
RvE
yin
g
Nat
ure
of A
ctiv
ity
Focu
ssin
g Q
uest
ion
Envi
ronm
enta
l Edu
catio
n as
pect
an
d co
ncep
tC
urric
ulum
Are
aSu
gges
ted
Cur
ricul
um
Leve
l
Page
Act
ivity
Titl
e
a2
M
ari
ne
an
ima
l g
rou
ps
an
d h
ab
ita
tPo
wer
Poin
t pr
esen
tatio
n
Smal
l gro
up p
oste
r m
akin
g ac
tivity
Dis
cuss
ion
Wha
t gr
oups
of
anim
als
live
in
the
sea?
Wha
t is
a s
peci
es a
nd w
hat
is a
sp
ecie
s ha
bita
t?
Abo
ut t
he E
nviro
nmen
t
Inte
rdep
ende
nce;
Bio
dive
rsity
Engl
ish
Scie
nce
Any
a3
M
ari
ne
an
ima
l b
iolo
gy
an
d e
colo
gy
Rese
arch
exe
rcis
eW
hat
feat
ures
and
life
ch
arac
teris
tics
have
ani
mal
s de
velo
ped
to e
nabl
e th
em to
live
in
the
sea
?
Abo
ut t
he E
nviro
nmen
t
Inte
rdep
ende
nce;
Bio
dive
rsity
Engl
ish
Scie
nce
The
Art
s
Any
a4
S
pe
cie
s ID
ID re
cogn
ition
ID te
st
Mat
chin
g ca
rd g
ame
Wha
t sp
ecie
s liv
e in
our
loca
l es
tuar
ine
envi
ronm
ent?
Abo
ut t
he E
nviro
nmen
t
Biod
iver
sity
Scie
nce
Any
a5
Ma
rin
eW
atc
hW
orks
heet
and
in
form
atio
n sh
eet
exer
cise
Wha
t is
Mar
ineW
atch
?A
bout
and
With
the
en
viro
nmen
t
Taki
ng p
erso
nal a
nd s
ocia
l re
spon
sibi
lity
for
actio
n;
Biod
iver
sity
; Int
erde
pend
ence
; Su
stai
nabi
lity
Soci
al S
cien
ceA
ny
a6
M
ari
ne
su
rvey
ing
Pow
erPo
int
pres
enta
tion,
w
orks
heet
and
in
form
atio
n sh
eet
exer
cise
Wha
t do
we
mea
n by
‘mar
ine
surv
eyin
g’ a
nd ‘m
arin
e m
onito
ring’
?
How
can
we
surv
ey a
loca
l es
tuar
y?
Abo
ut t
he e
nviro
nmen
t
Taki
ng p
erso
nal a
nd s
ocia
l re
spon
sibi
lity
for
actio
n;
Biod
iver
sity
; Int
erde
pend
ence
; Su
stai
nabi
lity
Scie
nce
Engl
ish
Any
a1
Wh
at
do
we
kn
ow
a
bo
ut
Tan
ga
roa
an
d
his
do
ma
in t
he
se
a?
Brai
nsto
rm &
di
scus
sion
Wha
t do
we
know
abo
ut
Tang
aroa
and
the
sea
?
Wha
t do
we
know
abo
ut t
he
estu
arin
e en
viro
nmen
t?
Abo
ut t
he E
nviro
nmen
t
Inte
rdep
ende
nce;
Bio
dive
rsity
Engl
ish
Scie
nce
Soci
al S
cien
ce
Any
�4 �7 �9 2� 2�22

�2
Nat
ure
of A
ctiv
ity
Focu
ssin
g Q
uest
ion
Envi
ronm
enta
l Edu
catio
n as
pect
an
d co
ncep
tC
urric
ulum
Are
aSu
gges
ted
Cur
ricul
um
Leve
l
Page
Act
ivity
Titl
e
a M
arin
e lif
e an
d m
arin
e su
rvey
ing
a8
E
stu
ary
su
rvey
W
orks
heet
and
in
form
atio
n sh
eet
exer
cise
Why
obs
erve
and
sur
vey
mar
ine
life?
Wha
t ar
e th
e ai
ms
of t
he
estu
ary
surv
ey?
Abo
ut a
nd W
ith t
he e
nviro
nmen
t
Taki
ng p
erso
nal a
nd s
ocia
l re
spon
sibi
lity
for
actio
n;
Biod
iver
sity
; Int
erde
pend
ence
; Su
stai
nabi
lity
Scie
nce
Engl
ish
Any
a9
H
ow
to
do
th
e
surv
ey
Wor
kshe
et a
nd
info
rmat
ion
shee
t ex
erci
se
How
do
we
cond
uct
the
estu
ary
surv
ey?
Abo
ut a
nd W
ith t
he e
nviro
nmen
t
Taki
ng p
erso
nal a
nd s
ocia
l re
spon
sibi
lity
for
actio
n;
Biod
iver
sity
; Int
erde
pend
ence
; Su
stai
nabi
lity
Scie
nce
Any
a10
Est
ima
tin
g
ab
un
da
nce
Pr
actic
al e
xerc
ise
How
can
we
estim
ate
abun
danc
e fo
r co
asta
l and
m
arin
e pl
ants
?
Abo
ut a
nd W
ith t
he
envi
ronm
ent
Biod
iver
sity
, Sus
tain
abili
ty
Mat
hs
Scie
nce
Any
a11
Su
rvey
sit
e r
ese
arc
hRe
sear
ch a
nd m
ap
mak
ing
exer
cise
Wha
t ar
e th
e ph
ysic
al
char
acte
ristic
s of
the
sur
vey
site
ar
ea?
Abo
ut t
he e
nviro
nmen
t
Biod
iver
sity
; Int
erde
pend
ence
; Su
stai
nabi
lity
Soci
al S
cien
ce
Engl
ish
Scie
nce
Any
a7
S
pe
cie
s d
ive
rsit
y,
de
nsi
ty a
nd
a
bu
nd
an
ce
Pow
erPo
int
Pres
enta
tion
& d
iscu
ssio
n;
wor
kshe
et a
nd
info
rmat
ion
shee
t
Wha
t is
spe
cies
div
ersi
ty?
Wha
t is
spe
cies
abu
ndan
ce?
Wha
t is
spe
cies
den
sity
?
Abo
ut t
he E
nviro
nmen
t
Inte
rdep
ende
nce;
Bio
dive
rsity
; Su
stai
nabi
lity
Engl
ish
Scie
nce
Mat
hem
atic
s
Any
a12
Su
rvey
sit
e –
pa
st
an
d p
rese
nt
hu
ma
n
act
ivit
y
Rese
arch
and
Ven
n di
agra
m e
xerc
ise
Wha
t ar
e th
e pa
st a
nd c
urre
nt
uses
of
the
Mar
ineW
atch
sur
vey
site
and
sur
roun
ding
land
and
w
ater
?
Wha
t im
pact
has
cha
ngin
g us
e ha
d on
the
site
?
Abo
ut a
nd W
ith t
he e
nviro
nmen
t
Sust
aina
bilit
y; In
terd
epen
denc
e
Soci
al S
cien
ce
Engl
ish
Mat
hs
Any
26 32 36 4� 4947

�3
Nat
ure
of A
ctiv
ity
Focu
ssin
g Q
uest
ion
Envi
ronm
enta
l Edu
catio
n as
pect
an
d co
ncep
tC
urric
ulum
Are
aSu
gges
ted
Cur
ricul
um
Leve
l
Page
Act
ivity
Titl
e
a M
arin
e lif
e an
d m
arin
e su
rvey
ing
a14
Su
rvey
sit
e
– c
urr
en
t a
nd
pa
st
ma
na
ge
me
nt
Rese
arch
exe
rcis
eH
ow is
the
sur
vey
site
cur
rent
ly
man
aged
and
by
who
m?
Abo
ut a
nd W
ith t
he e
nviro
nmen
t
Inte
rdep
ende
nce;
Sus
tain
abili
ty
Soci
al S
cien
ce
Engl
ish
Any
a13
Alie
n m
ari
ne
sp
eci
es
Dis
cuss
ion,
w
orks
heet
and
in
form
atio
n sh
eet
exer
cise
Wha
t ar
e al
ien
mar
ine
spec
ies?
How
do
alie
n m
arin
e sp
ecie
s po
se a
thr
eat
to o
ur lo
cal
mar
ine
envi
ronm
ent?
Abo
ut a
nd W
ith t
he
envi
ronm
ent
Taki
ng p
erso
nal a
nd s
ocia
l re
spon
sibi
lity
for
actio
n;
Biod
iver
sity
; Int
erde
pend
ence
; Su
stai
nabi
lity
Scie
nce
Engl
ish
Any
�2 �8

�4
AcTIvITy: A1
Activity Title: What do we know about Tangaroa and his domain the sea?
Environmental Education Aspect: About the environment
Environmental Education Concept: Interdependence; Biodiversity
Curriculum Links: Social Science, English; Science
Suggested Curriculum Level: Any
Focusing Questions
What do we know about Tangaroa and the sea? What do we know about the estuarine environment?
Resources
• Large sheets of paper and pens
• Tangaroa teacher information resource
Prior learning
Students will need to know the basics of brainstorming to complete this activity to ensure students are able to work in cooperative and supportive ways. If the class or groups are not used to brainstorming, some basic instructions will be required to ensure:
• Everyone’s ideas count equally
• Only positive comments or discussion should occur when an idea is put forward
• Where the board or paper is used, the person who came up with the idea can chose to write it down
Method
�. The objective of this activity is to inquire into Tangaroa (Atua kaitiaki) and his domain -–the sea; and to explore what students already know about the estuarine environment.
2. Explain to students that before starting a new area of learning it is useful to look at what we already know.
3. Brainstorm as a class what we know about the sea and Tangaroa (Atua kaitiaki – of the sea) (some information about Tangaroa is included on the Tangaroa teacher information sheet).
4. As a class, come up with a definition for the sea OR; put the class into groups. Each group brainstorms a definition of ‘the sea’ using large sheets of paper.
After fifteen minutes of brainstorming ask groups to report back their definition of ‘the sea’. These can be written on the white board or their large sheets of paper stuck to the classroom wall.
�. Investigate:
• Has each group used the same words? Or included the same concepts in their definition?
6. Then as a class brainstorm the different marine environments that exist. These might include: the sandy beach, rocky shores or estuaries.
7. In small groups brainstorm the characteristics of the estuarine environment. Use the following questions as a guide:
• Write a list of words that describe the physical characteristics of the estuary?
• What animals and plants would you find on the estuary?
• What activities might people do on this type of coastline?
• What type of sea water movement is there around estuaries? Is the water rough, calm, moving or still?

��
8. Groups report back to the class.
9. Reflection:
• Were you surprised by how much you already knew?
• What new things did you learn?
�0. Discussion:
• What kawa or protocols do you follow when visiting the realm of Tangaroa?
• What experiences have you had around the estuarine environment?
• How many people have been collecting kai moana around an estuary? – What did you see?
extension exercises and possible next steps
• A2 – Marine animal groups, species and habitat – Activities and a set of PowerPoint slides introducing some of the main groups of animals that are found in the realm of Tangaroa.
• Create a play that acts out the emergence of Tangaroa as Atua Kaitiaki of the sea and marine life.
AcTIvITy: A1 (conTD.)

�6
The information on this information sheet has been reproduced with kind permission from Department of Conservation, Te Papa Atawhai
Tangaroa is an important Atua kaitiaki.
According to the Maori view of creation, Tangaroa and the other Atua Kaitiaki were brought into the world as their parents separated to bring light into the world. Te Ao Marama or the world of enlightenment occurred after the separation of Ranginui (the sky father) and Papatuanuku (earth mother) who had lain in parental embrace leading to the procreation of the line of lesser (male) deity. This was the start-point for whakapapa, the common descent line for supernatural beings and for human kind.
Rangi and Papa had seventy sons who lived in a world of perpetual darkness. It was Tane who successfully separated Rangi and Papa – creating light. Six brothers (including Tane and Tangaroa) emerged as dominant deities from competition and conflict within the family. These are the Atua Kaitiaki or spiritual guardians.
Tangaroa presides over the beings of the ocean and inland waters, that is to say, marine ilfe. Tangaroa is often referred to as Tangaroa-whakamau-tai (Tangaroa – controller of the tides).
It is important to note that not all oral and written accounts of the creation agree. According to Te Wai Pounamu (South Island) traditions, Tangaroa took Papa the earth mother to wife and Rangi the sky father was her second husband.
tangaRoa – tEachER infoRMation RESouRcE
teaCheR iNStRuCtioNS

�7
AcTIvITy: A2
Activity Title: Marine animal groups and habitat
Environmental Education Aspect: About the environment
Environmental Education Concept: Interdependence; Biodiversity
Curriculum Links: Science, English
Suggested Curriculum Level: Any
Focusing Questions
What groups of animals live in the sea? What is a species and what is a species habitat?
Resources
• PowerPoint slide set – A2
• Large poster paper and materials for poster making
Prior learning
A� – What do we know about Tangaroa and his domain the sea?
Method
�. The objective of this activity is to begin investigating the groups of animals that live in the sea (and around the estuarine environment). This activity also explores the concept of ‘species’ and ‘species habitat’.
2. View the PowerPoint slide set A2 before using it with the class. Identify good places to stop for discussion. Additional information and discussion and reflection questions for each slide are provided as teacher notes on the following page.
3. Use the PowerPoint Presentation to overview the different groups of animals that live in the marine environment and introduce the concepts of species and species habitat.
4. Having viewed the PowerPoint slides, divide into small groups. Allocate to each group one or two of the animal groups looked at in the slides (Including: sea anemones, chitons, snails, slugs, bivalves, cephalopods, crustracea, echinoderms, sea-squirts, sponges, bony fish, cartilaginous fish, birds and mammals). In small groups create a poster about what you now know about the group of animals. Use the following questions as a guide:
• What do these animals look like? (shape, colour, size, texture – draw an example)
• Write down 2 examples of species that belong to this group of animals?
• Where do these animal live? – What type of habitat?
• How do these animals live? (do they move around or are they stationary)
• What other distinguishing and interesting characteristics does this group of animals have?
�. Present the poster to the rest of the class.
6. Discussion and reflection
• What new things did you learn from this activity?
• What was surprising about the group of animals you researched?
• What would you still like to learn about these animals?

�8
AcTIvITy: A2 (conTD.)
extension exercises and possible next steps
• Extend the exercise into a research exercise where students collect information from the library, books, internet etc and include this information on their poster.
• Create paintings, poems, songs, or other artwork illustrating the characteristics of a group of marine animals.
• A3 Marine animal biology and ecology activity – builds on the knowledge from this activity, encouraging students to investigate further the biology and ecology of an individual species of animal from the groups investigated here.

�9
AcTIvITy: A3
Activity Title: Marine animal biology and ecology
Environmental Education Aspect: About the environment
Environmental Education Concept: Interdependence; Biodiversity
Curriculum Links: Science, English, the Arts
Suggested Curriculum Level: Any
Focusing Questions
What features and life characteristics have animals developed to enable them to live in the sea?
Resources
• Research material – books, websites...
Prior learning
A� – What do we know about Tangaroa and his domain the sea?
A2 – Marine animal groups and habitat
Method
�. The objective of this activity is to explore the biology and ecology of a marine animal found in New Zealand or in the local marine environment.
2. Research independently (using websites, books, magazines and other research material) the biology and ecology of a New Zealand marine animal from one of the animal groupings studied in activity A2. Ideally this should be an animal found in the local marine environment. You may wish to focus on estuary animals. Use the following tasks as a guide:
• What is the common, Maori and scientific name of the animal?
• What animal grouping does this animal belong to (eg is it an echinoderm or a shellfish?)?
• Find pictures or draw pictures of the inside and outside of the animal and label its various parts?
• How does the animal move?
• Describe the place the animal lives (habitat) and draw a map of where it is found in New Zealand.
• What does the animal eat and what eats it? Draw a simple food chain.
• How does the animal reproduce itself?
3. Present the research in one of the following forms: poster, seminar, written report, scrapbook, collage, information pamphlet, picture story or other.
4. Discussion and reflection
• What new things did you learn from this activity?
• What was surprising about the animal you researched?
• What would you still like to learn about this animal?

20
AcTIvITy: A3 (conTD.)

2�
aCtivity: a4
Activity Title: Species ID
Environmental Education Aspect: About the environment
Environmental Education Concept: Biodiversity
Curriculum Links: Science
Suggested Curriculum Level: Any
Focusing Questions
What species live in our local estuarine environment?
Resources
• ID slides (for your area)
• Print out of id images and species names, cut and made into cards. One set of cards with pictures on them and one set with names on them (laminate for future use).
Prior learning
A3 – Marine animal biology and ecology
A2 – Marine animal groups and habitat
Method
�. The objective of this activity is to investigate what animals and plants can be found in the local estuarine environment and to gain skill at identifying these species for conducting a marine survey.
2. View the PowerPoint Species ID slides before using them with the class. You may wish to alter the species to suit a specific site that you plan to visit. Identify good places to stop for discussion.
3. Go through the ID slides as a class.
4. Conduct the identification test at the end of the slides.
�. Print out the pictures of the species (in black and white is fine), cut out the images and make into cards that can be laminated for future use. Do the same with the names of the species. Mix them up and practice matching the pictures to their correct names.
6. Discussion and reflection
• How many of these species have you seen before? Were you aware that these species live in the local marine environment?
extension exercises and possible next steps
• Practice the ID test and matching game regularly leading up to the marine survey
• A7 – Species diversity, density and abundance – an activity that uses a set of PowerPoint slides, worksheet, information sheet and class discussion to investigate these concepts.
• A� – What is MarineWatch? – an activity investigating the concept of MarineWatch.

22
AcTIvITy: A5
Activity Title: MarineWatch
Environmental Education Aspect: About the environment; With the environment
Environmental Education Concept: Taking personal and social responsibility for action; Biodiversity; Interdependence; Sustainability
Curriculum Links: Social Science
Suggested Curriculum Level: Any
Focusing Questions
What is MarineWatch?
Resources Required
• Copies of the MarineWatch Information sheet (or to save paper – make one copy onto an OHT)
• Copies of the MarineWatch Worksheet (or to save paper – make one copy onto an OHT)
Prior learning
A2 – Marine animal groups and habitat
A4 – Species ID
Method
�. The objective of this activity is to investigate the concept of MarineWatch.
2. Read the MarineWatch information sheet and answer the questions on the worksheet.
3. The correct answers form the word ‘SEA’
4. Discussion and reflection
• Why do you think keeping an eye on the animals and plants that live around the coast might be a good thing?
• What natural and human activities might impact on estuary animal and plant communities?
extension exercises and possible next steps
• A6 Marine surveying – an activity investigating the concepts of marine surveying and monitoring

23
infoRMation ShEEt

24
WoRkSheet

2�
AcTIvITy: A6
Activity Title: Marine surveying
Environmental Education Aspect: About the environment
Environmental Education Concept: Taking personal and social responsibility for action; Biodiversity; Interdependence; Sustainability
Curriculum Links: Science, English
Suggested Curriculum Level: Any
Focusing Questions
What do we mean by ‘marine surveying’ and ‘marine monitoring’? How can we survey a local estuary?
Resources required
• PowerPoint slide set A6
Prior learning
A2 – Marine animal groups and habitat
A4 – Species ID
A� – What is MarineWatch?
Method
�. The objective of this activity is to investigate the concepts of marine surveying and monitoring.
2. View the PowerPoint slide set A6 before using it with the class. Identify discussion and reflection questions for each slide.
3. Use the PowerPoint Presentation to review information about MarineWatch and investigate the concept of marine surveying and monitoring.
4. Discussion and reflection
• What types of information might we gather from a marine survey?
• Why might it be important to monitor the marine environment over time?
• Why might conducting the survey at the same time each year be considered important?
• How might we overcome some of the problems identified on the final slide?
extension exercises and possible next steps
• Investigate which government agencies have responsibilities that might lead them to conduct marine surveying and monitoring (such as DOC or Ministry of Fisheries)
• A7 – Species diversity, density and abundance – builds on the knowledge gained in this activity and explores in more depth these concepts as researched through marine surveying
• A8 – Estuary survey – an activity that introduces the method for conducting the Estuary survey.
• View the marine reserves and marine surveying DVD produced by Bay of Plenty Polytechnic for schools (contact: Andree Withington, Curriculum Alignment Officer, Bay of Plenty Polytechnic – 0800 BOP POLY).

26
AcTIvITy: A7
Activity Title: Species diversity, density and abundance
Environmental Education Aspect: About the environment
Environmental Education Concept: Interdependence; Biodiversity; Sustainability
Curriculum Links: Science, English, Mathematics
Suggested Curriculum Level: Any
Focusing Questions
What is species diversity? What is species abundance? What is species density?
Resources required
• PowerPoint slides – A7
• Copies of the information sheet – Marine life and marine surveys (or to save paper – make one copy on an OHT)
• Copies of the work sheet – Marine life and marine surveys (or to save paper – make one copy on an OHT)
Prior learning
A� – What do we know about Tangaroa and his domain the sea?
A2 – Marine animal groups, species and habitat
A3 – Marine animal biology and ecology
Method
�. The objective of this activity is explore the concepts of species diversity and abundance
2. View the PowerPoint slide set A7 before using it with the class. Identify discussion and reflection questions.
3. Use the PowerPoint Presentation to overview the concepts of density, diversity and abundance.
4. To reinforce key points – read the ‘Marine life and marine surveying’ information sheet and answer the questions on the worksheet.
�. The correct answers form the word ‘INVERTEBRATES’
6. Discussion and reflection
• Why might diversity be an important thing to protect?
• How do we get around the difficulty of counting every individual to find out the population of an animal?
• Why might we want to work out species density?
• How is quadrat size important for determining species abundance?
extension exercises and possible next steps
• Extend the exercise to research biodiversity and the different values of marine biodiversity.
• Look at pictures of different marine habitats and evaluate them for their diversity
• D� – Conservation of marine biodiversity and marine protected areas – this activity includes PowerPoint slides on marine biodiversity – what we do and don’t know and looks at marine biodiversity in the context of marine conservation.
• A8 – Estuary Survey – looks at the aims of the MarineWatch Estuary Survey

27
infoRMation ShEEt

28
Why SurvEy ThE InTErTIDAL zonE In ESTuArIES
or hArBourS?
There are some pretty cool animals and plants that hang out on the estuary or harbour beach. Have you heard about the whelk parties that happen every day down on the beach? Mud whelks are particularly good at smelling out their food. Interestingly they can only sense food in a wet environment! Once they sense food they move towards the food object and begin feeding. Sometimes as many as �0-60 whelks can be found at a whelk feeding party. Try and count the individual mud whelks on your beach and find the biggest party.
The intertidal zone is a pretty special place as it is the only part of the marine environment that is sometimes covered in water and sometimes not. The animals and plants that live there are extra clever as they can cope with living under and above water.
What life exists there and how it changes over time can tell us a lot about the health of the marine environment. The number or abundance of some animals or plants can act as an indicator of an area’s health. For this reason, some animals and plants are known by scientists as indicator species.
There are many threats facing New Zealand’s oceans, these include: over-harvesting and overfishing of fish and shellfish species; pollution from storm water, sewage and industrial outlets and coastal developments such as the building of marinas and causeways that result in disturbing marine life and habitats. MarineWatch is one way we can keep an eye on marine life to help make sure that it is not being harmed by human activity.
SpECIES AnD ThEIr hABITAT
The number and diversity of animals and plants living in a place is influenced by the type of home they have. Just like we can be affected by our home environment, the air we breathe, the food we eat, the water we drink, so too are marine animals and plants. Protecting marine animals and plants often means looking after their home or habitat.
Habitat is the word used by scientists to describe the natural environment where an animal or plant lives. There are lots of different types of habitats - for example, sandy seafloors, mangrove forests, estuarine mudflats, kelp forests and rocky reefs.
What type of animals and plants live in a place will be determined by their habitat or home and whether it is sandy, rocky, cold, warm, dark, light, rough, calm, shallow or deep. Here are some examples of the different types of habitats marine animals have. Some starfish like the spiny starfish (whose scientific name is Coscinasterias calamaria) live on sandy bottoms whilst others like the reef star (Stichaster australis) live on rocky reefs. Kina (Evechinus chloroticus) like living in barren bouldery places. Black footed paua (Haliotis iris) like boulders too especially in the shallows amongst big waves. Mud snails (Amphibola crenata) prefer to live on mudflats in between the high and low tide. Some fish species like Orange Roughy (Haplostethus atlanticus) live in deep offshore ocean trenches hundreds of metres below the surface whilst others, like Kahawai (Arripis trutta), live in shallow coastal waters.
In the estuary, some animals like to live near the low tide whilst others prefer life near the high tide. From your survey see if you can work out where different animals like to live.

29
MaRinE lifE and MaRinE SuRvEyS
instructions:
Read the information sheet called ‘Marine life and marine surveys’ and answer the following questions. Circle the letter of the correct answer to each question like this: (r) If you put all the letters together at the bottom of the worksheet you will find they spell a word. To find out what the word is, write each letter in the space provided.
Questions
�. Which words below correctly fill the gaps in this sentence? ‘Marine surveying means looking in the to find out what and plants live there, how many of them there are and what sort of they live in.’
I. sea, animals, conditions
M. sky, birds, trees
R. rivers, freshwater weeds, caves
2. Which words correctly fill the gap in this sentence? ‘A marine survey is .’
S. Looking many times at the state of the whole environment
N. A single one off snapshot of marine life
T. Counting freshwater crayfish or koura in a lake
3. Find the correct word to fill in the gap: ‘When several snapshots are taken over time, for example once a year, this is known as .’
S. Freshwater surveying
V. Marine monitoring
I. Intertidal surveying
4. Is this statement true or false? ‘Species is the scientific term for a group of animals or plants that are able to breed together.’
E. True
P. False
�. Which words correctly complete this sentence? ‘The variety of different animals and plants living in an area is known as .’
X. Genetic abundance
U. Ecosystem diversity
R. Species diversity
WoRkSheet

30
6. Which words correctly complete this sentence? ‘In the estuary we are particularly interested in how different animals and plants are distributed between the high and low tide. The distribution of animals between the high and low tide is called .”
A. Abundance
F. Colour
G. Latin name
T. Zonation
7. Which words correctly complete this sentence? ‘When surveying an estuary or harbour beach we are also interested in how many individuals from a species might live in the area. Species is the scientist’s term for the number of individuals of a species living in a certain place.’
E. Abundance
V. Number
I. Diversity
8. Which words correctly complete this sentence? ‘We can look at what percentage of a small square is covered by a plant (such as mangroves). This is called finding the
.’
D. Overall area
G. Total amount
B. Percentage cover
9. Which word correctly completes this sentence? ‘To get an idea of how many individuals of an animal species there are living on our beach we can also look at the of shellfish within a square. This will mean counting how many shellfish there are in a square of estuary.’
R. Density
A. Colour
P. Diversity
�0. Species have different types of names. The three different types of names that a species has are:
A. Common names, Maori names and scientific names
R. Latin names, scientific names and common names
B. Common names, English names and Maori names
WoRkSheet

3�
��. Why do scientific names sound so funny?
T. Because they are written in Latin
H. Because they are written in Italian
L. Because they are written in German
�2. is the word used by scientists to describe the natural environment where an animal or plant lives.
Z. House
E. Habitat
J. Home
�3. There are many threats facing New Zealand’s oceans, these include:
�. Over-harvesting and overfishing of fish and shellfish species;
2. Pollution from storm water, sewage and industrial outlets and
3. __________________________________________________
S. Coastal development such as causeways that result in disturbing marine life and habitats
G. A build up of algae in freshwater lakes
P. Landslides caused by deforestation
The letter circled for each answer spells:
This is the scientific word for a group of animals. 97% of all animals are estimated to fall within this group. Many marine animals are part of this group of animals, which includes shellfish. None of these animals have a backbone.
WoRkSheet

32
AcTIvITy: A8
Activity Title: Estuary Survey
Environmental Education Aspect: About the environment, With the environment
Environmental Education Concept: Interdependence; Biodiversity, Sustainability, personal and social responsibility for action
Curriculum Links: Science, English
Suggested Curriculum Level: Any
Focusing Questions
Why observe and survey marine life? What are the aims of the estuary survey?
Resources required
• PowerPoint slide set A8
• Copies of the information sheet – Introduction to the MarineWatch estuary survey (or to save paper – make one copy on an OHT)
• Copies of the work sheet – Introduction to the MarineWatch estuary survey (or to save paper – make one copy on an OHT)
Prior learning
A2 – Marine animal groups and habitat
A4 – Species ID
A� – What is MarineWatch?
A6 – Marine surveying
A7 – Species diversity, density and abundance
Method
�. The objective of this activity is inquire into why we might observe and survey marine life. The activity also investigates the aims of the estuary survey.
2. View the PowerPoint slide set A8 before using it with the class. Identify discussion and reflection questions for each slide.
3. Use the PowerPoint Presentation to explore why we might observe and survey marine life.
4. Read the MarineWatch introductory estuary survey information sheet and answer the questions on the worksheet.
�. The correct answers form the word ‘GASTROPOD’
6. Discussion and reflection
• What interesting things might you learn from just observing marine life?
• What might we learn from conducting the estuary survey?
extension exercises and possible next steps
A9 – How to do the survey – An activity that outlines the methodology for conducting the survey.

33
AIM of ThE ESTuAry SurvEy
The aim of the MarineWatch estuary survey is not just to get our feet wet and have fun. It’s about having a good look at animals living around a sandy estuary area. Using this survey we can look at diversity, abundance and zonation of key estuarine animals and plants.
Every scientific survey has a question that it aims to answer. For example, the question might be, how many mud snails are there per metre of mudflat? Or how many species of reef fish can we find on a section of reef? In the case of this survey we are interested in the diversity, abundance and distribution (or zonation) of estuarine animals and plants between high and low tide.
WhEn To SurvEy?
When comparing data over time we want to keep things the same. This way, if changes are found (like for example, all of a sudden there are no mud snails where in the past there were lots) it’s more likely these changes can be said to be due to the number of a species present rather than other factors such as time of year.
SpECIAL EquIpMEnT
Special equipment will be needed to do the MarineWatch estuary survey. We will need:
• A pencil
• A MarineWatch slate; and
• Some scientific survey equipment like quadrats and transect lines
We will be using ‘transect lines’ and ‘quadrats’ to do this survey. Scientists use these pieces of equipment regularly.
Transect lines are really just long tape measures. You will be lying a transect line between the high and low tide. Using a transect line means we can work out at exactly what distance from high tide do the mangroves stop and the pipi start? Or at what distance from the high tide line do mud snails prefer to live?
Quadrats can be circular, rectangular or square. Our quadrats are square. Scientists use quadrats so they know the size of an area in which they might be counting or measuring animals or plants. Our quadrats are 3�� mm x 3�� mm so we know the area we are surveying each time is one hundredth of a square metre. We will be placing quadrats over and over again along our transect line and counting animals and plants within those quadrats.
rECorDIng ChAngES ovEr TIME
If we repeat the survey more than once we can look at changes occurring in our area with time. Surveying marine life for changes over time is called monitoring. By monitoring an area we may find for example, a reduction in mud snails or a complete absence of cockles where once there were many. Ideally we will survey the same site at least once a year to look for changes.
If we are to monitor changes over time then we need to make sure that:
• The survey is conducted in the same way each time
• The same site is surveyed
• The survey is done at roughly the same time each month or year (for example, this might mean doing the survey at the beginning of every March)
From this survey some of the things we might discover include:
• The diversity of flora and fauna and how this alters over time
• The density and zonation of estuarine animals
• The zonation and percentage cover of estuarine plants
• Changes in the cover and zonation of estuarine plants
• Changes in the density and zonation of estuarine animals
infoRMation ShEEt

34
intRoduction to thE MaRinEWatch EStuaRy SuRvEy
instructions:
Read the information sheet called ‘The MarineWatch estuary survey’ and answer the following questions. Circle the letter of the correct answer to each question like this: (r) If you put all the letters together at the bottom of the worksheet you will find they spell a word. To find out what the word is, write each letter in the space provided.
Questions
�. Which is the correct word to complete this sentence? ‘Every scientific survey has a that it aims to answer”.
G. Question
L. Answer
E. Marine survey
2. Complete the following sentence: ‘In the case of this survey we are interested in the, and of estuarine animals and plants between high and
low tide.’
B. Size, colour and texture
R. Size, abundance and colour
Z. Abundance, diversity and density
A. Diversity, abundance and distribution (or zonation)
3. If we repeat the survey more than once we can look at changes occurring in our area with time. Surveying marine life for changes over time is called .
S. Monitoring
U. Abundance
R. Diversity
4. If we are to monitor changes over time then which of the following is something we DON’T want to do:
D. Conduct the survey in the same way each time
K. Survey the same site
T. Count different animals at a different time of year
W. Conduct the survey at the same time each month or year
WoRkSheet
3�
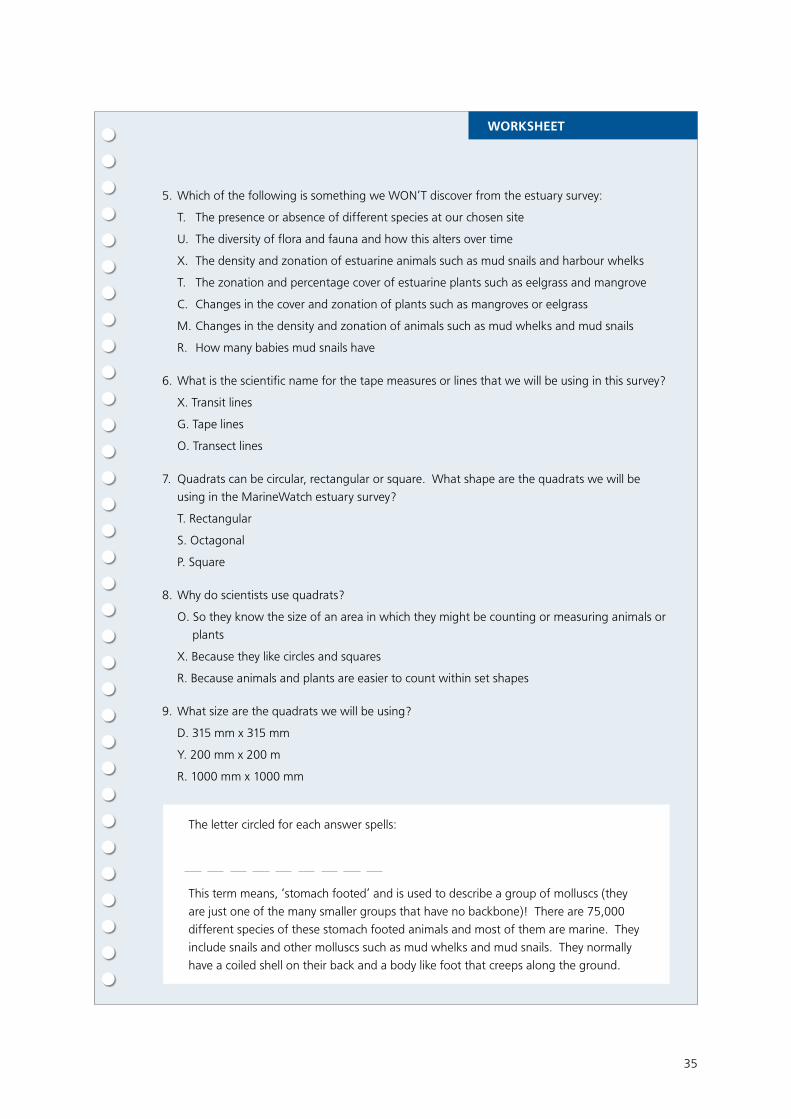
�. Which of the following is something we WON’T discover from the estuary survey:
T. The presence or absence of different species at our chosen site
U. The diversity of flora and fauna and how this alters over time
X. The density and zonation of estuarine animals such as mud snails and harbour whelks
T. The zonation and percentage cover of estuarine plants such as eelgrass and mangrove
C. Changes in the cover and zonation of plants such as mangroves or eelgrass
M. Changes in the density and zonation of animals such as mud whelks and mud snails
R. How many babies mud snails have
6. What is the scientific name for the tape measures or lines that we will be using in this survey?
X. Transit lines
G. Tape lines
O. Transect lines
7. Quadrats can be circular, rectangular or square. What shape are the quadrats we will be using in the MarineWatch estuary survey?
T. Rectangular
S. Octagonal
P. Square
8. Why do scientists use quadrats?
O. So they know the size of an area in which they might be counting or measuring animals or plants
X. Because they like circles and squares
R. Because animals and plants are easier to count within set shapes
9. What size are the quadrats we will be using?
D. 3�� mm x 3�� mm
Y. 200 mm x 200 m
R. �000 mm x �000 mm
The letter circled for each answer spells:
This term means, ‘stomach footed’ and is used to describe a group of molluscs (they are just one of the many smaller groups that have no backbone)! There are 7�,000 different species of these stomach footed animals and most of them are marine. They include snails and other molluscs such as mud whelks and mud snails. They normally have a coiled shell on their back and a body like foot that creeps along the ground.
WoRkSheet

36
AcTIvITy: A9
Activity Title: how to do the survey
Environmental Education Aspect: About the environment, With the environment
Environmental Education Concept: Interdependence; Biodiversity, Sustainability, personal and social responsibility for action
Curriculum Links: Science
Suggested Curriculum Level: Any
Focusing Questions
How do we conduct the estuary survey?
Resources required
• PowerPoint slide set A9
• Copies of the information sheet – How to do the survey (or to save paper – make one copy on an OHT)
• Copies of the work sheet – How to do the survey (or to save paper – make one copy on an OHT)
• Transect and site data information sheet (on the following page) – only needs completing once for each transect.
• MarineWatch data recording slates, string, rubber bands and pencils – to create the data recording slate: photocopy the templates on the following pages (these templates are also on the CD) onto paper or create your own template. Attach the paper to a clipboard using rubber bands to prevent it from blowing away. Attach a pencil to the clipboard with string
• This activity should be read along side the instructions for Activity B9
Prior learning
A2 – Marine animal groups and habitat
A4 – Species ID
A� – What is MarineWatch?
A6 – Marine surveying
A7 – Species density, diversity and abundance
A8 – MarineWatch estuary survey

37
AcTIvITy: A9 (conTD.)
Method
�. The objective of this activity is to investigate how to do the estuary survey.
2. View the PowerPoint slide set A9 before using it with the class. Read activity B9 to clarify details of the survey methodology. Identify discussion and reflection questions for each slide.
3. Use the PowerPoint Presentation to investigate how to do the survey.
4. Practice on dry land demonstrating how the survey would be conducted.
�. Read the ‘how to do the survey’ information sheet and answer the questions on the worksheet.
6. The correct answers form the word ‘BIVALVE
7. Discussion and reflection
• What might be hard or difficult about conducting the survey?
extension exercises and possible next steps
• A�0 – Estimating abundance – a simple practical exercise to practice estimating abundance when conducting the survey
• A�� – Survey site research – an activity investigating the physical characteristics of the survey site.

38

39

40

4�
infoRMation ShEEt

42
�. Starting at the high tide line you will place a 3�� x 3�� mm quadrat at regular intervals (approximately 8 times) along the transect line (see Figure �). Your teacher will tell you how to do this. Each time you place the quadrat you will count and record all surface plants and animals on the estuarine plant and animals survey data sheet (see sample on the following page).
6. Once you have completed the surface count for each quadrat, dig up the entire quadrat area to a depth of at least �� cm (approximately blade depth on your spade), and sieve it through a �mm sieve. You will record and count all animals left in the sieve and list these on the right hand column of your estuarine plant and animal survey data sheet (Figure 2).
Figure 2 – Estuarine plant and animal survey data sheet

43
hoW to do thE EStuaRy SuRvEy
instructions:
Read the information sheet “How to do the estuary survey” and answer the following questions. Circle the letter of the correct answer like this: (r) If you put all the letters together at the bottom of the page you will find they spell a word. To find out what the word is write each letter in the space provided.
Questions
�. How many students will you need in your survey group?
B. 3 - 4
H. 6 - 7
F. � - 2
2. Which words best complete this sentence? ‘Each group will need to draw a ______ of the survey area.’
I. Map
U. Description
A. Paragraph
W. Painting
3. Which words best complete this sentence? ‘Each group will run a tape between the and .’
X. Road and low tide line
H. Shore and low tide line
V. High and low tide line
4. Is this a true or false statement about what you will do in the estuary survey? ‘Walk along the transect line taking note where there are changes of habitat, surface water, substrate (which means what is the ground, is it sandy, muddy or stony) and so on.’
A. True
P. False
�. Is this statement true or false? ‘Grain size is important to consider when deciding what is the habitat type.’
L. True
P. False
WoRkSheet

44
6. Starting at the high tide line you will place a 3�� x 3�� mm quadrat at regular intervals along the transect line (see Figure �). Each time you place the quadrat what will you do with surface plants and animals?
I. Remove them and measure them
R. Remove them and record them on paper
V. Count and record them on the estuarine plant and animal survey data sheet
7. How will you place quadrats along the transect line?
T. Every one meter away from the line
E. At regular intervals along the transect line
S. Along the low tide mark
R. Along the high tide mark
The letter circled for each answer spells:
This is the name for animals that form another group of mollusc. They include clams, pipi, cockles, wedge shells, mussels and tuatua. A two-valve shell encloses them. Strong muscles are used to close the shell. These animals are filter feeders and have gills that are used to obtain oxygen and filter out particles of food from the water. Some are burrowers that will only be found once you start digging in the sand, others like mussels and oysters attach themselves to surfaces.
WoRkSheet

4�
AcTIvITy: A10
Activity Title: Estimating abundance
Environmental Education Aspect: About and With the environment
Environmental Education Concept: Biodiversity, Sustainability
Curriculum Links: Maths, Science
Suggested Curriculum Level: Any
Focusing Questions
How can we estimate abundance for coastal and marine plants?
Resources required
• Sticks, bamboo or lengths of plastic piping
• Leaves, flowers or seaweed
• Pen and paper
• Calculators
Prior learning
A� – Species abundance and diversity
A7 – Marine surveying
A8 – MarineWatch estuary survey
A9 – How to do the survey
Method
�. The objective of this activity is to practice estimating percentage cover of coastal and marine plants in a 3�6mm x 3�6mm square
2. Make a quadrat (square frame) (see figure �, picture (�)). You could use wire, sticks, bamboo or lengths of plastic piping to do this. Scatter leaves or flowers on the ground and then complete the following: Place the quadrat or square over the flowers or leaves.
3. Estimate how much of the ground is covered by leaves or flowers and write down the estimate.
4. Then divide the square into four equally sized smaller squares by placing sticks or piping or string in a cross shape over the original square. Get students to estimate and write down what percentage of each of these squares is covered by plants or flowers. (see figure �, picture (2)).
�. Divide squares again using sticks or string so that you now have �6 smaller squares and repeat the estimation exercise. (see figure �, picture (3)).
6. Compare the results of (�),(2) and (3)
7. Calculate the mean percentage cover of (2) and (3) and compare with (�).

46
AcTIvITy: A10 (conTD.)
(�) (2) (3)
Figure �. Imagine the first box above is a 3�6mm x 3�6mm square or quadrat (�). The second square (pictured in the middle) is divided into four (2) and the third (on the right) is divided into �6 (3) –
8. Discussion and reflection
• Did you get the same answer for each of the three approaches to estimating percentage cover?
• Which size quadrat or square do you think would yield the most accurate result? Would this always be the case? Why or why not?
extension exercises and possible next steps
• Extend the activity to for example, work out the different areas of the squares.
• A�� – Survey site research – an activity investigating the physical characteristics of the survey site.

47
AcTIvITy: A11
Activity Title: Survey site research
Environmental Education Aspect: About the environment
Environmental Education Concept: Interdependence; Sustainability; Biodiversity
Curriculum Links: Social Science, English; Science
Suggested Curriculum Level: Any
Focusing Questions
What are the physical characteristics of the survey site area?
Resources required
• Map of the survey area
• Research material – books, magazines, websites, city plans, maps etc
• Poster paper and materials for creating map
Prior learning
A� – What do we know about Tangaroa and his domain the sea?
A2 – Marine animal groups and habitat
A4 – Species ID
A6 – Marine surveying
A8 – Estuary survey
Method
�. The objective of this activity is to investigate the physical characteristics of the survey site and its surrounding area.
2. Obtain a nautical map or aerial photo of the beach (this will be useful for planning before you do the survey).
3. As a class (or in small groups) research any information that is known about the physical characteristics of the site including:
• Geology of the area
• Characteristics of the water catchment (including incoming streams, stormwater outlets and rivers)
• Characteristics of the shoreline (including topography, substrate, habitats, flora and fauna) – high tide and above
4. As a class create your own map with (or draw onto a map) the physical characteristics of the area.
�. Discussion and reflection
• In what ways are the land and sea interrelated?
• How might human activities conducted inland affect the sea and intertidal zone?

48
AcTIvITy: A11 (conTD.)
extension exercises and possible next steps
• Draw a diagram showing what happens to water in the catchment area you will survey – think about rain, streams, rivers, stormwater and seawater
• A�2 – Survey site – past and present human activity – an activity that inquires into past and present human activities and the impact these activities have had on the area.
• A�3 – Alien species – an activity investigating the impact of introduced species in the marine environment.

49
AcTIvITy: A12
Activity Title: Survey site – past and present human activity
Environmental Education Aspect: About the environment, With the environment
Environmental Education Concept: Interdependence; Sustainability
Curriculum Links: Science, English, Maths
Suggested Curriculum Level: Any
Focusing Questions
What are the past and current uses of the MarineWatch survey site and surrounding land and water? What impact has changing use had on the site?
Resources required
• Scrap book
• Local kaumatua, kuia, grandparents and residents
• Venn diagram template
Prior learning
A� – What do we know about Tangaroa and his domain the sea?
A�� – Survey site research
Method
�. The objective of this activity is to investigate past and current uses of the MarineWatch survey site and surrounding land and water and to explore what impact this changing use might have had on the area.•
2. Research current and past uses of the area creating a class scrapbook filled with newspaper articles, pictures and information
3. Invite local kaumatua and kuia and long time residents of the area to visit and speak about legends, history, stories, kawa and tikanga associated with the local marine environment
4. Invite grandparents to your school and listen to their oral histories of the area
�. Interview local people who fish and collect shellfish in the survey area? Do they know what the catch limits are and what do they catch and how many?
6. Using information from the scrapbook, kaumatua and grand-parents, as a class (or in small groups) make a list of past uses of the area – land and sea. And then write a list of current uses of the area – land and sea. Compare the two lists and consider the following:
• How has the areas use changed over time
• How many of these uses have stayed the same?
7. Use the Venn diagram template to compare current uses with past uses.
8. Discussion and reflection
• How have uses changed over time?
• What impact has changing use had on the area?

�0
AcTIvITy: A12 (conTD.)
extension exercises and possible next steps
• Write an essay about human impacts on the area – past and present
• Make a bibliography of books and written resources that have useful information in them about your area
• Having interviewed people who are knowledgeable about current fishing and shellfish collecting that occurs in your area, work out the number of people who harvest each different species and the average catch for different species and generate graphs and tables to illustrate these.
• Make a play that dramatises the human history of the area.
• A�4 – Survey site – current and past management – an activity that investigates management agencies and methods for the survey site area

��
veNN DiagRaM WoRkSheet

�2
AcTIvITy: A13
Activity Title: Alien marine species
Environmental Education Aspect: About the environment, With the environment
Environmental Education Concept: Taking personal and social responsibility for action; Biodiversity; Interdependence; Sustainability
Curriculum Links: Science, English
Suggested Curriculum Level: Any
Focusing Questions
What are alien marine species? How do alien marine species pose a threat to our local marine environment?
Resources required
• Copies of the ‘Alien Species – Looking for the Big Eight’ information sheet – (or to save paper – make one copy on an OHT)
• Copies of the ‘Alien Species – Looking for the Big Eight’ worksheet – (or to save paper – make one copy on an OHT)
Prior learning
A4 – Species ID
Method
�. The objective of this activity is to investigate what are alien marine species and how these species pose a threat to our local marine environment.
2. Read the ‘Alien Species – Looking for the Big Eight’ information sheet and answer the questions on the worksheet.
3. The correct answers form the word ‘UNDARIA’
4. Discussion and reflection
• What is one new thing you have learnt from this exercise?
• What alien species have been introduced on land that have had an impact?
• Do you know of any alien marine species that have already been introduced or become established in your local marine environment? What impact have these organisms had?
extension exercises and possible next steps
• Research what alien marine species have already been introduced or become established in your local marine environment and investigate the impact these organisms have had?.
• Check out the biosecurity website – www.biosecurity .govt.nz
• A�4 – Survey site – current and past management – an activity that investigates management agencies and methods for the survey site area.

�3
infoRMation ShEEt
When a species is introduced into New Zealand from overseas it can have devastating consequences for our environment. Think about the possum for example. The possum is not a native. In other words it was brought here by humans.
This animal was introduced into New Zealand from Australia. It is responsible for destroying our native forests. New Zealand bush provides the possum with lots of food and the possum has no natural predators here. These two factors mean we have a booming possum population in New Zealand! Each year we spend lots of money trying to control the number of possums so we can save our bush. Once a species is introduced here it is almost impossible to get rid of and very expensive to try and control.
In the marine environment there are eight species of marine organisms that have been identified as potential baddies! Each of these organisms is not native to our marine environment. Two of them have already arrived but are only found in a few places. If the others were brought here they could have a very bad impact on the sea – just like the possums did on land.
These species are unwanted because we have seen how they have multiplied and destroyed native marine environments in other countries where they are not native. It is likely that each of these marine species could arrive here at any time. These species are all ones that like living in environments just like ours. So they could easily settle here. We know that two of them are already here. The others might already be here and we might just not know it. We do know that each of these organisms could cause significant impact.

�4

��
Sea squirt the clubbed tunicate, Styela clava
This sea squirt is already present in New Zealand. It is in Auckland’s Hauraki Gulf and Christchurch’s Lyttelton Harbour. It has also been found in Tutukaka in Northland. It poses a threat to aquaculture.
What to do if you see any of these
creatures?
We will be looking out for these creatures
when we do the MarineWatch survey. If you
see any of these unwanted creatures (either
during the survey or at any other time) then
report them to Biosecurity New Zealand’s
hotline: 0800 80 99 66

�6
aliEn SpEciES – looking foR thE Big Eight
instructions:
Read the information sheet “Alien Species - Looking for the Big Eight” and answer the following questions. Circle the letter of the correct answer like this: (r) If you put all the letters together at the bottom of the page you will find they spell a word. To find out what the word is write each letter in the space provided.
Questions
�. An alien or introduced species that is not native and has been brought here by humans can cause problems for our native environment. Which of the following is NOT true?
R. Introduced species might nave no predators in their new environment and may multiply fast
K. Species introduced into New Zealand might like eating our native plants and animals too much - so our native populations suffer
L. Introduced species might carry diseases that can threaten native species
U. Once a species is introduced it is easy to get rid of
2. Possums are not native to New Zealand. Where were possums introduced from?
O. Africa
P. America
N. Australia
X. England
3. Of the eight marine species that have been identified - how many are already here?
D. Two
W. All of them
B. Six
S. None
4. Which of the following best completes this sentence about the big 8 unwanted marine species: “Each of these eight species likes to live in an environment just like ours which means that ”
A. These species could easily settle here
E. These species are unlikely to settle here
I. There is no way these species will settle here
WoRkSheet

�7
�. Is this statement true or false? “These eight species are unwanted because we have seen how they have multiplied and destroyed marine environments in other countries where they are not native”
R. True
T. False
6. Which of these seastars is the Northern Pacific seastar - which could pose a serious threat to our marine environment should it be introduced?
7. What should you do if you see any of the eight unwanted marine creatures?
A. Phone the biosecurity hotline - 0800 80 99 66
R. Nothing
I. Tell your best friend
WoRkSheet
The letter circled for each answer spells:
(This is the name of a marine organism that is not native to New Zealand. It is edible and can be used to make several popular Japanese dishes).
I. Y. E.

�8
AcTIvITy: A14
Activity Title: Survey site – current and past management
Environmental Education Aspect: About the environment, With the environment
Environmental Education Concept: Interdependence; Sustainability
Curriculum Links: Social Science, English
Suggested Curriculum Level: Any
Focusing Questions
How is the survey site currently managed and by whom?
Resources required
• Poster making material
• Research material – books, websites, magazines...
• Representatives from local management agencies
Prior learning
A� – What do we know about Tangaroa and his domain the sea?
A�� – Survey site research
A�2 – Survey site – past and present human activity
A�3 – Alien marine species
Method
�. The objective of this activity is to investigate how the MarineWatch survey site and wider area are managed and by whom
2. Find out which government agencies have responsibility for different aspects and activities conducted at the survey site. Include in your investigation the role of:
• Department of Conservation
• Ministry of Fisheries
• Regional Council
• District Council
3. Research whether there are any relevant planning documents such as: district plan, coastal plan, land plan and any relevant management plans for the area – learn how these affect the area. You could ask representatives from the council, local Department of Conservation or Ministry of Fisheries to visit and discuss management of the area.
4. In small groups make a poster showing the various responsibilities of the different government agencies in the area and the different planning documents that affect the area.
�. Discussion and reflection
• What issues have you uncovered that are currently affecting the area?
• Do you think the current management of the area is working well?
• What improvements could you suggest to agencies with responsibilities for managing the area?

�9
AcTIvITy: A14 (conTD.)
extension exercises and possible next steps
• Create a plan of action for acting on any issues that have been highlighted through this research (see activity E2 for an action planner template)
• E2 Taking action to improve the local marine environment – an activity to reflect on the unit of learning and create an action plan for taking action to improve the quality of the local marine environment

60
Nat
ure
of A
ctiv
ity
Focu
ssin
g Q
uest
ion
Envi
ronm
enta
l Edu
catio
n as
pect
an
d co
ncep
tC
urric
ulum
Are
aSu
gges
ted
Cur
ricul
um
Leve
l
Page
Act
ivity
Titl
e
B F
ield
su
rvey
act
ivit
ies
B1
M
ari
ne
Wa
tch
fie
ld
surv
eyFi
eld
activ
ityW
hat
is it
like
to c
ondu
ct a
su
rvey
of
mar
ine
life?
Wha
t is
it li
ke to
exp
lore
the
es
tuar
ine
envi
ronm
ent?
In t
he e
nviro
nmen
t; W
ith t
he
envi
ronm
ent
Taki
ng p
erso
nal a
nd s
ocia
l re
spon
sibi
lity
for
actio
n;
Biod
iver
sity
; Int
erde
pend
ence
Scie
nce,
Mat
hs,
Phys
ical
edu
catio
n an
d he
alth
Any
ac
tiv
ity S
Et
B –
fiE
ld
Su
RvE
y a
ctiv
ity
6�

6�
AcTIvITy: B1
Activity Title: MarineWatch estuary field survey
Environmental Education Aspect: With and In the environment
Environmental Education Concept: Taking personal and social responsibility for action; Biodiversity; Interdependence
Curriculum Links: Science, Maths, physical education and health
Suggested Curriculum Level: Any
Focusing Questions
What is it like to conduct a survey of marine life? What is it like to explore the estuarine environment?
Resources required
Students will need:
• Wetsuit booties or suitable footwear
• Sun block & hats – as required
• Warm clothes – as required
Teacher will need:
• Pencils with many spares • Slates for data recording
• Transect lines • Identification aids
• Refreshments • Adult supervision (ratio as required by school)
• Student list • First aid kit
• Quadrats • Shovels
• Buckets and sieves • A marker to mark the transect line at high tide
• GPS, camera or other means to record the exact site location
Prior learning
A4 – Species ID
A8 – Estuary survey
A9 – How to do the survey

62
AcTIvITy: B1 (conTD.)
Method
�. The objective of this activity is to conduct a MarineWatch estuary survey in the field. SPECIAL NOTE: Experiencing the wonders of the marine world is a rich and emotionally rewarding experience. Whilst the survey has scientific aims (outlined in PowerPoint slide set A8), the wider aim is to expose children to this unique marine environment.
Planning your survey
2. Ensure you have all the equipment required. Transect lines can be made from rope or strong string and quadrats can be created out of wire or plastic tubing (advice on how to do this can be obtained from you local Department of Conservation office).
3. If you haven’t already done so then complete a practice run of the survey in the school playing field with students (can be done as part of activity A9 also)
4. Select a site. Considerations for site selection may include:
• Habitat – is it a soft shore estuarine intertidal area? You could also conduct this survey on an ocean beach although the species would be different.
• Facilities – is there adequate parking and are there toilet facilities nearby?
• Relocation – is the site easily relocatable so the survey can be completed again next year?
• Physical safety – is the area safe for children? Consider for example: glass, sinking mud, class control and other relevant features of the area.
• Cultural and conservation safety – it would pay to contact your local kaumatua and Department of Conservation to ensure the site chosen is not waahi tapu or home to an endangered species!
• Impact – is the area changing due to human impact? Eg: the implementation of a rahui or marine reserve, new localised development or intensive shellfish harvesting. This can make the site particularly good to survey as it is likely you will see changes from year to year.
�. Select a day and time to conduct the survey based on tides. Start the survey on an outgoing tide so you can work down the beach towards the low tide line.
6. Plan how the survey will be conducted. Good planning is critical otherwise you could easily spend all the field survey time just setting up your sampling grid (it sounds a lot simpler than it is in practice!). As part of your planning a
7. Site visit before doing the survey is recommended. It is useful to get a nautical map or aerial photo of the beach and work out the general location/ spacing/orientation etc of the sampling grid before you go out into the field (this can be tied in with activity A��). It can be helpful to work out the general location/ spacing/orientation etc of the sampling grid before you go into the field. This can save a lot of field time and means you can have a good idea of approximately how far apart the transect lines will be & the logistical implications for example, how many teams you will need on each line or how to manage teams working on transect lines some distance apart. Nautical maps and aerials can give you an idea of the distance between low and high tide so that you know how long the transect lines need to be and what sampling intervals are reasonable.
8. You will need to record the location of the transects so they can be repeated in exactly the same place next year – if you are fortunate enough to have access to a GPS then co-ordinates can be recorded for each transect or use a camera to record the exact location of transects. (If you have GPS then you don’t even need transect lines! The coordinates for the sampling grid can be obtained before you go into the field from a GIS and entered into the GPS. Simply navigate to the sampling points using the GPS!).
9. Read the risk management guidelines on the following page.

63
AcTIvITy: B1 (conTD.)
Setting up and conducting the survey
�0. Conduct a safety briefing with adults and students (suggested briefing topics are outlined in the risk management guidelines on the following page).
��. Complete the top part of the data sheet before commencing the survey.
�2. Having completed a practice run (see above and activity A9), students will already be divided into survey groups. Each group has around four students in it. It is suggested you allocate one adult helper per survey group (but this will depend on your school Charter and the adult:student ratio required). Depending on your group allocate one or two groups to work down each transect line.
�3. Each group runs a transect line (or a long tape measure or rope) between the high and low tide line. Marine life will be surveyed along these lines. To be relocatable transect lines need to have a known, relocatable starting point and known orientation. High tide lines do not meet this criteria – as they are changeable. If necessary you could establish a baseline running along the beach first as a starting point for transects.
�4. Optional exercise – each group creates a map noting key landmarks, the location of the transect line and changes in habitat between the high and low tide are marked on the map. Students walk along the transect line taking note where there are changes of habitat, surface water, substrate (is it sandy, muddy or stony) and so on. Encourage students to decide how many distinct areas or habitats there are. Grain size (size of particles) is important to consider when deciding where these changes may occur – is it almost invisible like mud or larger and easy to see like sand? At what distance along the transect line does the habitat change? All of this is recorded on the map.
��. In order to get a good estimate of actual populations that inhabit the beach, the whole beach should be covered ideally by 6 to �0 transects which means approximately �0 sample sites should be surveyed across the beach. In reality, this is unrealistic for most groups given time and resources available. If less than six transect lines are used, some useful information can still be gained about the site but confident population estimates for the whole beach cannot be made. Between one and three transect lines – with eight sampling points on each – may prove sufficient.
�6. The transect lines should be parallel to each other. This means that if the beach is curved that the transect lines will not always be perpendicular to the shore.
�7. The spacing between the transect lines will vary beach to beach. For long beaches, transects could be spaced further than �00m apart and for small beaches they may be just �0m apart. The spacing between transects should be even but this is not critical. If it is easier to start transects near identifiable landmarks then do so, it doesn’t matter if the spacing between transects varies a bit. Where extensive eel grass of Zostera beds exist we recommend these are carefully recorded but not disturbed.
�8. A good approach would be to design a survey with 6–�0 parallel transects spaced over the whole beach. If resources are limited, it is probably best to focus the effort on one or two transects in areas of special interest, for example: there is a known history of finding cockles or mud snails.
�9. In summary therefore: it is recommended that you design your survey using 6–�0 parallel transects spaced over the whole beach.

64
AcTIvITy: B1 (conTD.)
Conducting the survey
20. Along each transect survey up to eight sampling points using a 3�6mm x 3�6mm quadrat. A maximum of eight sampling points per transect should give a reasonable representation of different ecological zones. Sampling points are evenly spaced along the transect line.
2�. Sampling intervals along each transect will vary depending on the steepness of the beach. Wide and flat beaches will have greater sampling intervals than narrower steeper sloped beaches. This might mean the distance between sampling points (sampling interval) might be �0m or more on wide beaches.
22. Locate quadrats haphazardly within 2m of the sample point. Students should throw the quadrat over their shoulder so they don’t inadvertently choose an area with lots or little obvious marine life.
23. At each sampling point students count and record all surface plants and animals on the estuarine plant and animal survey data sheet (see figure 2). Hold the quadrat in place and dig up the entire quadrat area to spade depth (��cm). This material is then sieved through a �mm sieve. All animals left in the sieve are counted and recorded on the data sheet (files are on the MarineWatch CD).
Figure 1 – sampling points placement of quadrats at regular intervals along the transect line
after the survey
24. Collect data for entry and analysis once back at school.
2�. Discussion and reflection
• What are some of the animals and plants you saw today?
• What is one thing you will remember from today?
• What is one new thing you learnt from today?
• Was the environment like you imagined it would be - what was different to what you imagined?

6�
AcTIvITy: B1 (conTD.)
extension exercises and possible next steps
• C� – About data entry activity – this activity introduces the concept of data entry and explores using a worksheet and information sheet what we might learn from a MarineWatch survey
• C2 – Entering data and the presence and absence of species – this is a practical activity requiring the input of data into a master spreadsheet and investigation into presence and absence of species.
• Write a poem that describes one of the most interesting things you saw during your MarineWatch survey
• Make a poster that describes your kaupapa for caring for the estuary and the life that lives there
• Write an essay that describes what you thought about the estuary before you did MarineWatch compared with what you think about it now

66
teaCheR iNStRuCtioNS
RiSk ManagEMEnt guidElinES – Staying SafE

67
teaCheR iNStRuCtioNS
• Use buddy system
• Give clear boundaries within which to operate
• Have adequate adult supervision
• Make sure kids have warm clothing
• Make sure kids have hats and sunscreen on
• Check area for glass and sharp objects, warn kids about glass and sharp objects, and/or get students to wear footwear
• Have first aid trained staff on site
• Have emergency phone numbers
• Have cellphone on site
• Have sunblock, hats and spare warm clothing and footwear
RiSk ManagEMEnt plan

68
ac
tiv
ity S
Et
c –
data
En
tR
y a
ctiv
itiE
S
Nat
ure
of A
ctiv
ity
Focu
ssin
g Q
uest
ion
Envi
ronm
enta
l Edu
catio
n as
pect
an
d co
ncep
tC
urric
ulum
Are
aSu
gges
ted
Cur
ricul
um
Leve
l
Page
Act
ivity
Titl
e
C D
ata
entr
y ac
tivi
ties
Prac
tical
dat
a en
try
activ
ityH
ow d
o w
e en
ter
data
fro
m a
m
arin
e su
rvey
?
How
can
we
anal
yse
pres
ence
an
d ab
senc
e of
spe
cies
ove
r tim
e?
Abo
ut a
nd W
ith t
he e
nviro
nmen
t
Taki
ng p
erso
nal a
nd s
ocia
l re
spon
sibi
lity
for
actio
n;
Biod
iver
sity
; Int
erde
pend
ence
; Su
stai
nabi
lity
Mat
hs
Scie
nce
Any
C3
W
ork
ing
ou
t sp
eci
es
ab
un
da
nce
Prac
tical
dat
a en
try
and
appl
ied
mat
hem
atic
s ac
tivity
How
do
we
wor
k ou
t th
e ab
unda
nce
of a
spe
cies
?A
bout
and
With
the
en
viro
nmen
t
Taki
ng p
erso
nal a
nd s
ocia
l re
spon
sibi
lity
for
actio
n;
Biod
iver
sity
; Int
erde
pend
ence
; Su
stai
nabi
lity
Mat
hs
Scie
nce
Any
C4
In
vest
iga
tin
g t
he
d
istr
ibu
tio
n o
f sp
eci
es
be
twe
en
h
igh
an
d lo
w t
ide
Prac
tical
dat
a en
try
and
appl
ied
mat
hem
atic
s ac
tivity
How
do
we
grap
h th
e di
strib
utio
n of
spe
cies
bet
wee
n hi
gh a
nd lo
w t
ide?
Wha
t ca
n w
e le
arn
from
gr
aphi
ng t
he d
istr
ibut
ion
of
spec
ies
betw
een
high
and
low
tid
e?
Abo
ut a
nd W
ith t
he
envi
ronm
ent
Mat
hs
Scie
nce
Any
C1
Ab
ou
t d
ata
en
try
Info
rmat
ion
shee
t an
d w
orks
heet
and
di
scus
sion
Wha
t is
dat
a?
Wha
t ca
n w
e le
arn
from
dat
a co
llect
ed?
Abo
ut a
nd W
ith t
he
envi
ronm
ent
Taki
ng p
erso
nal a
nd s
ocia
l re
spon
sibi
lity
for
actio
n;
Biod
iver
sity
; Int
erde
pend
ence
; Su
stai
nabi
lity
Mat
hs
Scie
nce
Engl
ish
Any
C2
E
nte
rin
g d
ata
an
d
the
pre
sen
ce a
nd
a
bse
nce
of
spe
cie
s
76 78 8�69
69
AcTIvITy: c1
Activity Title: About data entry
Environmental Education Aspect: About the environment; With the environment
Environmental Education Concept: Taking personal and social responsibility for action; Biodiversity; Interdependence; Sustainability
Curriculum Links: Science, Maths, English
Suggested Curriculum Level: Any
Focusing Questions
What is data? What can we learn from data collected?
Resources required
• Copies of the MarineWatch data information sheet – How to do the survey (or to save paper – make one copy on an OHT)
• Copies of the MarineWatch data worksheet – How to do the survey (or to save paper – make one copy on an OHT)
Prior learning
A4 – Species ID
A8 – Estuary survey
A9 – How to do the survey
SPECIAL NOTE. This activity can be conducted before or after the MarineWatch estuary field survey.
Method
�. The objective of this activity is to investigate what is data and to explore can we can learn from manipulation of data collected during an estuarine marine survey.
2. Read the ‘MarineWatch data’ information sheet and answer the questions on the worksheet.
3. The correct answers form the word ‘LITTORAL’
4. Discussion and reflection
• What is one new thing you have learnt from this exercise?
• Why is data collection an important part of marine surveying?
• What can we learn from data collected in marine surveys?
• How do you think the way that data is collected in a marine survey might be important?
extension exercises and possible next steps
• Work out the maths behind a 3�6mm x 3�6mm quadrat being 0.�m2
• C2 – Entering data and the presence and absence of species – this is a practical activity requiring the input of data into a master spreadsheet.

70
infoRMation ShEEt
Information collected in a scientific survey like this one is known as data. Data is taken from the underwater slate and entered onto a computer in a ‘spreadsheet’ or computerised table. From this graphs can be made. Graphs make pictures out of numbers. Adults and kids find data easier to understand when it’s made into pictures or graphs.
Information collected in a scientific survey like this one is known as data. Data is taken from your slate and entered onto a computer in a ‘spreadsheet’ or computerised table. From this graphs can be made. Graphs make pictures out of numbers. Adults and kids find data easier to understand when it’s made into pictures or graphs. From graphs we can start to see trends and changes in what happens on our estuary beach. Here are some examples of graphs you can create from your data for your estuary.
abundance (how many there were) of an individual species
Looking at the abundance of an individual species such as pipi involves working out the average number of pipi seen and the size of the area surveyed.
To work out the average number of pipi counted on a transect line; add up the number of pipi seen in each quadrat along that transect and divide this by the number of quadrats.
An example is done for you below:
pipi numbers for transect 1 transect �quadrat � 0quadrat 2 0quadrat 3 0quadrat 4 2quadrat � �quadrat 6 8quadrat 7 ��quadrat 8 9
total = 35
mean no. of pipi counted by students for transect �
= 0+0+0+2+�+8+��+9(=3�)
Number of quadrats (8) = 4.375

7�
abundance of a species such as pipi
To work out the abundance of a species (such as pipi for example) we then need to find out the size of the area that was surveyed.
An example of this is done below:
To determine the area surveyed [transect 1]
Area surveyed = (.3�� x .3��m) x 8 = 0.794 m2
.315m = width of quadrat
.315m = length of quadrat
8 = number of quadrats
To work out the abundance of pipi, divide the average number of animals counted by the size of the area surveyed.
An example of this is done below:
Mean no of pipi per m2 = mean no. of pipi counted
area surveyed
Transect 1
mean abundance = 4.37�
= 5.511 pipi per m2
0.794
The mean abundance of a species such as pipi can then be shown on a graph (see graph �). From this graph we can see there are more pipi found along some transect lines than others. Can you tell which transect line had the most and least pipi?
9876�432�0
Transect
�
Transect
�0
Transect
9
Transect
8
Transect
7
Transect
6
Transect
�
Transect
4
Transect
3
Transect
2
Mean abundance of pipi per m2 Memorial Park 2006
Transect number
Mea
n ab
unda
nce
of p
ipi
per
m2
�2
�0
8
6
4
2
0
Transect
�
Transect
�0
Transect
9
Transect
8
Transect
7
Transect
6
Transect
�
Transect
4
Transect
3
Transect
2
Mean abundance of pipi per m2 Memorial Park Beach 2004–2006
Mean abundance of pipi per m2
Tran
sect
num
ber
7.000
6.000
�.000
4.000
3.000
2.000
�.000
0.000
Mean abundance of pipi per m2
Memorial Park 2004–2006 (all transects)
year
Mea
n ab
unda
nce
per m
2
2004 200� 2006
2006 200� 2004
Graph 1 – The mean number of pipi on each transect line

72
9876�432�0
Transect
�
Transect
�0
Transect
9
Transect
8
Transect
7
Transect
6
Transect
�
Transect
4
Transect
3
Transect
2
Mean abundance of pipi per m2 Memorial Park 2006
Transect numberM
ean
abun
danc
e of
pip
ip
er m
2
�2
�0
8
6
4
2
0
Transect
�
Transect
�0
Transect
9
Transect
8
Transect
7
Transect
6
Transect
�
Transect
4
Transect
3
Transect
2
Mean abundance of pipi per m2 Memorial Park Beach 2004–2006
Mean abundance of pipi per m2
Tran
sect
num
ber
7.000
6.000
�.000
4.000
3.000
2.000
�.000
0.000
Mean abundance of pipi per m2
Memorial Park 2004–2006 (all transects)
year
Mea
n ab
unda
nce
per m
2
2004 200� 2006
2006 200� 2004
9876�432�0
Transect
�
Transect
�0
Transect
9
Transect
8
Transect
7
Transect
6
Transect
�
Transect
4
Transect
3
Transect
2
Mean abundance of pipi per m2 Memorial Park 2006
Transect number
Mea
n ab
unda
nce
of p
ipi
per
m2
�2
�0
8
6
4
2
0
Transect
�
Transect
�0
Transect
9
Transect
8
Transect
7
Transect
6
Transect
�
Transect
4
Transect
3
Transect
2
Mean abundance of pipi per m2 Memorial Park Beach 2004–2006
Mean abundance of pipi per m2
Tran
sect
num
ber
7.000
6.000
�.000
4.000
3.000
2.000
�.000
0.000
Mean abundance of pipi per m2
Memorial Park 2004–2006 (all transects)
year
Mea
n ab
unda
nce
per m
2
2004 200� 2006
2006 200� 2004

73
�4
�2
�0
8
6
4
2
0
Memorial Park Beach 2005 Distribution of Pipi (Paphies australis) between low and high tide
quadrat number (distance from high tide)
Ab
und
ance
of
spec
ies
per
m2
(Low tide)Quadrat 8
Quadrat 7 (High tide)Quadrat �
Quadrat 6 Quadrat � Quadrat 4 Quadrat 3 Quadrat 2
Transect � Transect 2 Transect 3 Transect 4 Transect �

74
MaRinEWatch data
instructions:
Read the information sheet called “MarineWatch data”. And answer the following questions. Circle the letter of the correct answer to each question like this: (r) If you put all the letters together at the bottom of the page you will find they spell a word. To find out what the word is write each letter in the space provided.
Questions
�. What word is used to describe information collected in a scientific survey like this one?
L. Data
R. Numerical fish
T. Information
F. Snail numbers
2. Which answer most correctly completes this sentence? “Information is taken from your slate and entered onto a computer in a computerised table known as a
.”
T. Wide sheet
N. Long sheet
I. Spreadsheet
M. Clean sheet
3. Is the following statement true or false: “Looking at the abundance of an individual species such as pipi involves working out the average number of pipi seen and the size of the area surveyed”?
T. True
P. False
4. Which of the following figures do you need to know to work out the size of the area surveyed along one transect?
T. Width of quadrat, length of quadrat, number of quadrats
L. Length of transect line, distance between high and low tide
Z. Number of transects on a beach, number of pipi in each quadrat
WoRkSheet

7�
�. Look at graph �. Which transect had the highest average number of pipi and which had the lowest average number of pipi?
H. Transect 2 had the highest, Transect 3 had the lowest
O. Transect 3 had the highest, Transect �0 had the lowest
T. Transect 6 had the highest, Transect 4 had the lowest
I. Transect 4 had the highest, Transect 6 had the lowest
6. Graph 2 and 3 shows what information collected over a number of years might look like. From this graph we can also tell what is happening to the abundance of pipi on the beach. Can you tell from this graph if there is a trend of more or less pipi on the beach in 2006 than 2004?
Y. The trend is towards less pipi on the beach in 2006 than 2004
R. The trend is towards more pipi on the beach in 2006 than 2004
B. There is no change in the number of pipi
7. The information collected in the MarineWatch estuary survey allows us to look at where different animals and plants live between the high and low tide lines. What is this called?
X. Diversity
A. Zonation
Y. Abundance
8. Look at graph 4. Which of the following statements best describes what happens to the abundance of pipi?
L. Pipi are more common near the low tide line
P. Pipi are more common near the high tide line
R. Pipi are spread evenly between the tides up the beach
The letter circled for each answer spells:
ZONE
(This is the scientific term for intertidal zone. It is defined as the area of sea floor that lies between the highest high and lowest low tides. This zone is unique among marine environments as it is regularly exposed to the air. Animals that live here have to be able to live underwater and above water.)
WoRkSheet

76
AcTIvITy: c2
Activity Title: Entering data and the presence and absence of species
Environmental Education Aspect: About the environment; With the environment
Environmental Education Concept: Taking personal and social responsibility for action; Biodiversity; Interdependence; Sustainability
Curriculum Links: Science, Maths
Suggested Curriculum Level: Any
Focusing Questions
How do we enter data from a marine survey? How can we analyse presence and absence of species over time?
Resources required
• MarineWatch data (from field survey activity C� or C2)
• Computer access
• Excel software
• MarineWatch CD with master spreadsheet file (Filename: C2Master Spreadsheet)
Prior learning
A4 – Species ID
A8 – Estuary survey
A9 – How to do the survey
B� – MarineWatch estuary field survey
C� – About data entry
Method
�. The objective of this activity is to enter data from a marine survey.
2. A master spreadsheet is provided for data entry. Enter data from the MarineWatch survey onto the master spreadsheet provided or make your own master spreadsheet) (see figure �). Pop up comments have been inserted with additional information about data entry – these are identified by a small red mark in the top right hand corner of a cell. Data from each year can be entered into this sheet. Columns are provided for students to record the names of those collecting, entering and verifying (checking) data – encouraging a sense of ownership over the data set.

77
AcTIvITy: c2 (conTD.)
Figure 1. Master spreadsheet for data entry
3. Discussion and reflection
• What have you learnt about collecting and entering data from this activity?
• Why is data entry an important aspect of a marine survey?
• What reasons can you think of for having a master data entry sheet?
• Are there large variations in numbers of a species recorded on different transects? Why might this be?
extension exercises and possible next steps
• C3 – Working out species abundance – this activity uses marine survey data to work out species abundance.
• Use data to create a table or pie chart showing the presence or absence of species of species along different transects
• Use data to work out percentages
• Compare results from different transects and draw conclusions about the confidence we can have in those results (high or low variability)

78
AcTIvITy: c3
Activity Title: Working out species abundance
Environmental Education Aspect: About the environment; With the environment
Environmental Education Concept: Taking personal and social responsibility for action; Biodiversity; Interdependence; Sustainability
Curriculum Links: Science, Maths
Suggested Curriculum Level: Any
Focusing Questions
How do we work out the abundance of a species?
Resources required
• MarineWatch data (from field survey activity B�)
• Computer access
• Excel software
• MarineWatch CD containing the following files: Filename: C3.�Calculating abundance instructions; Filename: C3.2 Individual species abundance and C3.3 Abundance by year
Prior learning
A4 – Species ID
A8 – Estuary survey
A9 – How to do the survey
B� – MarineWatch estuary field survey
C� – About data entry
C2 – Entering data and the presence and absence of species
Method
�. The objective of this activity is to work out the abundance of a species using data collected from a marine survey.
2. Review the ‘calculating abundance instructions’ spreadsheet (see figure 2) and calculate abundance for each species surveyed.

79
AcTIvITy: c3 (conTD.)
Figure 2. Calculating abundance spreadsheet
3. Having worked out how to calculate the abundance for a species, individual species abundance can be graphed. See File C3.2 which will generate one such graph for you. Simply follow the instructions provided. There are six sheets in this file. The first is a demonstration sheet (as pictured in figure 3) the next five sheets are set up for data entry and will automatically generate graphs like the ones shown on the demonstration sheet. The sheets are labelled Species abundance, species abundance (2), species abundance (3).....and can accessed by clicking on the white tabs at the bottom left of the spreadsheet. Comparing species abundance between transects are the only single species comparisons that can be made in the first year of the survey.
4. Once the survey has been conducted more than once, make comparisons between years. The spreadsheet entitled “C3.3 Abundance by year” enables these comparisons to be made. The mean abundance of a species per m2 can be compared per transect or for combined transects (see figure 3).
Figure 3. Individual species abundance year to year spreadsheet

80
AcTIvITy: c3 (conTD.)
�. Discussion and reflection
• Why might we want to work out species abundance?
• What can we learn about a species by comparing its abundance year by year?
• Why do you think regimenting data collection procedures might be important in terms of data and results of a survey?
• Why do you think scientists place such emphasis on being highly disciplined in their collection of data?
extension exercises and possible next steps
• Calculate the mean, medium and mode number of pipi (or any other species) counted by students
• Determine the size of the area surveyed in m2
• Calculate the average number of pipi (or any other species) per square metre
• Generate a graph that compares the average number of pipi (or any other species) found per square metre with other sites or over years, title graphs and label the axes.
• Compare abundance between species such as pipi and cockles and look for relationships
• Discuss the concept of outliers and their effect on data interpretation
• Use ratios to look at the relationship between predator and prey
• C4 – Investigating the distribution of species
• D� – Conservation of marine biodiversity and marine protected areas – a set of PowerPoint slides exploring what we know about marine biological diversity and introducing the concepts of marine reserves and marine protected areas.
• D2 – Taking action to improve the local marine environment – an opportunity to reflect on what has been learnt in this unit of study and to present to the local community, this learning and any actions required to protect the local marine environment.

8�
AcTIvITy: c4
Activity Title: Investigating the distribution of species between high and low tide
Environmental Education Aspect: About the environment; With the environment
Environmental Education Concept: Taking personal and social responsibility for action; Biodiversity; Interdependence; Sustainability
Curriculum Links: Science, Maths
Suggested Curriculum Level: Any
Focusing Questions
How do we graph the distribution of species between high and low tide? What can we learn from graphing the distribution of species between high and low tide?
Resources required
• MarineWatch data (from field survey activity B�)
• Computer access
• Excel software
• MarineWatch CD containing the following file: Filename:C4 Species Distribution
Prior learning
A4 – Species ID
A8 – Estuary survey
A9 – How to do the survey
B� – MarineWatch estuary field survey
C� – About data entry
C2 – Entering data and the presence and absence of species
C3 – Working out species abundance
Method
�. The objective of this activity is to use data collected from a survey to investigate the distribution of different organisms between high and low tide. In this activity we are specifically interested in how to graph the distribution of species between high and low tide and what can we learn from graphing the distribution of species between high and low tide.
2. Enter data into the spreadsheet provided called “C4 Species Distribution” (see figure 4).
3. Generate a graph demonstrating the distribution of a species between high and low tide.

82
AcTIvITy: c4 (conTD.)
Figure 4.Distribution of species along the transect line
4. Create graphs for several different species and compare. These graphs provide good opportunities for discussing wider ecological concepts such as ecological niche and habitat. Discussion and reflection:
• Are all species distributed evenly between high and low tide? Why or why not?
• Can you see a pattern of distribution for each species – for example are they more common near low or high tide?
• How does the distribution of each species between high and low tide differ? Why do you think this might be the case?
• Looking at the graphs – what can you say about the habitat of different animals surveyed?
• What might you be able to tell about the physiology of different animals from looking at their distribution between high and low tide?
• Why do you think some animals are more abundant than others at low tide, mid tide and high tide?
• What information about different species ecological niches can be gained from looking at species distribution between high and low tide?
extension exercises and possible next steps
• Research the ecological niche concept and examine the ecological niches of different estuarine animals
• D� – Conservation of marine biodiversity and marine protected areas – a set of PowerPoint slides exploring what we know about marine biological diversity and introducing the concepts of marine reserves and marine protected areas.
• D2 – Taking action to improve the local marine environment – an opportunity to reflect on what has been learnt in this unit of study and to present to the local community, this learning and any actions required to protect the local marine environment.

83
ac
tiv
ity S
Et
d –
ka
itia
kit
an
ga
an
d t
ak
ing
ac
tio
n
Nat
ure
of A
ctiv
ity
Focu
ssin
g Q
uest
ion
Envi
ronm
enta
l Edu
catio
n as
pect
an
d co
ncep
tC
urric
ulum
Are
aSu
gges
ted
Cur
ricul
um
Leve
l
Page
Act
ivity
Titl
e
D k
aiti
akiit
ang
a an
d t
akin
g a
ctio
n Brai
nsto
rm a
nd
disc
ussi
onW
hat
have
we
lear
nt a
bout
the
lo
cal e
stua
rine
envi
ronm
ent?
Wha
t ac
tion
can
we
take
to
impr
ove
or m
aint
ain
the
qual
ity o
f th
e lo
cal e
stua
rine
envi
ronm
ent?
Taki
ng p
erso
nal a
nd s
ocia
l re
spon
sibi
lity
for
actio
n;
Biod
iver
sity
; Int
erde
pend
ence
; Su
stai
nabi
lity
Engl
ish
Soci
al S
cien
ce
Any
D1
co
nse
rva
tio
n o
f m
ari
ne
bio
div
ers
ity
a
nd
ma
rin
e
pro
tect
ed
are
as
Pow
erPo
int
slid
es
and
disc
ussi
onH
ow m
uch
do w
e kn
ow a
bout
m
arin
e bi
olog
ical
div
ersi
ty?
Wha
t ar
e m
arin
e pr
otec
ted
area
s an
d ho
w d
o th
ey
cons
erve
the
mar
ine
envi
ronm
ent?
Abo
ut a
nd W
ith t
he
envi
ronm
ent
Taki
ng p
erso
nal a
nd s
ocia
l re
spon
sibi
lity
for
actio
n;
Biod
iver
sity
; Int
erde
pend
ence
; Su
stai
nabi
lity
Engl
ish
Scie
nce
Soci
al S
cien
ce
Any
D2
Ta
kin
g a
ctio
n t
o
imp
rove
th
e lo
cal
ma
rin
e e
nv
iro
nm
en
t
8�84

84
AcTIvITy: D1
Activity Title: Conservation of marine biodiversity and marine protected areas
Environmental Education Aspect: About the environment; With the environment
Environmental Education Concept: Taking personal and social responsibility for action; Biodiversity; Interdependence; Sustainability
Curriculum Links: Social Science, Science, English
Suggested Curriculum Level: Any
Focusing Questions
How much do we know about marine biological diversity? What are marine protected areas and how do they conserve the marine environment?
Resources required
PowerPoint slide set E�
Method
�. The objective of this activity is to explore in more detail how much we know about marine biological diversity and the role that marine protected areas can and do play in conserving marine biodiversity in New Zealand.
2. View the PowerPoint slide set D� before using it with the class. Identify good places to stop for discussion.
3. Use the PowerPoint Presentation to overview the marine biological diversity and marine protected areas.
4. As a class discuss and reflect on the following:
• How much do we really know about our marine biodiversity?
• Were you surprised to discover how little of the coastline has been surveyed?
• Where are your local marine reserves?
• Are there any other local marine protection mechanisms currently in place – such as marine parks or rahui?
• Do you think marine reserves are a good idea? Why or why not?
extension exercises and possible next steps
• Check out the Department of Conservation website for more information on marine biodiversity, marine reserves and marine protected areas – www.doc.govt.nz
• D2 – Taking action to improve the local marine environment – an opportunity to reflect on what has been learnt in this unit of study and to present to the local community, this learning and any actions required to protect the local marine environment.

8�
AcTIvITy: D2
Activity Title: Taking action to improve the local marine environment
Environmental Education Aspect: About the environment; With the environment
Environmental Education Concept: Taking personal and social responsibility for action; Biodiversity; Interdependence; Sustainability
Curriculum Links: English, Social Science
Suggested Curriculum Level: Any
Focusing Questions
What have we learnt about the local estuarine environment? What action can we take to improve or maintain the quality of the local estuarine environment?
Resources required
• Large paper and pens or white board
• Action planner template (reproduced on the following page)
Prior learning
ALL
Method
�. The objective of this reflect on what we have learnt about the local estuarine environment and use this knowledge to determine what action can be taken to improve or maintain the quality of the local estuarine environment.
2. Reflect on the learning and experiences during this unit of study.
3. In small groups conduct a brainstorming exercise reflecting on what has been learnt whilst studying about the estuarine environment. Record answers on the board or A3 paper. The following questions can be used to guide this inquiry:
• What are the most interesting, surprising and important things you have learnt about estuarine environment?
• What information can you report about the state of your local estuarine environment?
• Develop a plan of action. (The action planner template on the following page might be useful here.) What action at an individual, group and community level do you feel can be taken to conserve your local estuarine environment (including the animals and plants that live there)?
• Develop an implementation strategy. How do you propose this action be taken? What will you take on as a group and as individuals to do, to help conserve your local estuarine environment?
4. Nominate a spokesperson and present back to the rest of the class.
�. As a class discuss:
• What actions you wish to take and develop an action plan
6. Discuss with students the idea of sharing their learning and plan of action in a presentation to be delivered to the rest of the school and/or their whanau and family and/or marae or wider local community.

86
7. From this exercise develop the presentation and deliver to the school or local community
8. Discussion and reflection
• How have our attitudes and knowledge about the marine environment altered through the course of this unit of learning?
• What new things have we learnt?
extension exercises and possible next steps
• Explore the use of marine protected areas (MPAs) & marine reserves as a marine conservation tool for your local area.
• Discuss careers in the marine environment
• Make a poster illustrating the problems facing your marine environment that describes – what the problem is, what impact it has on the marine environment and how it could be remedied
• Decorate your classroom as though it was the marine environment
• Dress up, act and move to music like a marine animal – guess what animal your classmates are pretending to be
• Make a play or write a song that shows what you see is happening in your marine environment
• Write an essay about marine protected areas. What are they, where are they and what are they like?
• Draw a flow chart illustrating how to go about getting a marine reserve
• Watch a video or DVD about marine protected areas
• Take action to improve the quality of your marine environment. For example you could conduct a beach clean up, make a submission or write an article or letter for the paper
AcTIvITy: D2 (conTD.)

87
WoRkSheet
action planner template (adapted from an action Planner produced in environment Bay of Plenty, Rotorua lakes education Resource)
What skills do we need?
Who will be involved in making the final decision?
How will we know what people think and feel?
Who do we need to involve?
What resources or information do we need?
How can we communicate with others about our project?
What is our vision?

88

89
Plea
se c
ircle
the
app
ropr
iate
num
ber
�
4
3
2
�
Exce
llent
Ave
rag
e P
oor
Plea
se c
ircle
the
app
ropr
iate
num
ber
�
4
3
2
�
Very
use
ful
use
ful
Not
ver
y us
eful
Plea
se c
ircle
the
app
ropr
iate
num
ber
�
4
3
2
�
Very
use
ful
use
ful
Not
ver
y us
eful
Plea
se c
ircle
the
app
ropr
iate
num
ber
�
4
3
2
�
Won
derf
ul
Ave
rag
e P
oor

90
gloSSaRy – a liSt of SciEntific WoRdS
abundance – the number of individuals of a species in a location
Common species name – names given to individual species that are commonly used by people such as snapper or gurnard (different to scientific names)
Data – a word used by scientists to describe information collected from a marine survey
Diversity – in this case we are talking about species diversity, meaning the variety of animals and plants
habitat – the natural environment where an animal or plant lives
indicator species – an animal or plant whose abundance or presence can be used to assess the general state of the environment
Marine survey – surveying marine life means looking at the number, size or variety of marine animals or plants in an area
Monitoring – monitoring means looking at the number, size or variety of marine animals over time
Scientific name – names given to species by scientists so that each species can be identified by it’s own special name. These names are written in Latin and there are no two species names that are the same.
Species – the name for a group of animals or plants that can breed together
Survey area – survey areas are sites chosen for survey with clear boundaries
Species names – Species have common names, like ‘spotty’, Maori names like ‘Pâkirikiri’ and scientific names like ‘Notolabrus celidotus’. Scientific names are in Latin.
Spreadsheet – a computerised table for entry of data or information collected from a marine survey. Graphs can be created from information entered onto spreadsheets.
transect line – a line used by scientists in marine surveying. A transect line is normally a specified length (like �0m) and has markings along it just like a tape measure.