hitting the poorest places hardest
TRANSCRIPT
1
2
HITTING THE POOREST PLACES HARDEST
The local and regional impact of welfare reform
Christina Beatty and Steve Fothergill
Centre for Regional Economic and Social Research Sheffield Hallam University
April 2013
DOI: 10.7190/cresr.2017.6378897426
The research on which the report is based was funded by Sheffield Hallam University, by the Scottish Parliament and by the Financial Times (by a grant from the Pulitzer Centre on Crisis
Reporting in Washington). The views expressed are those of the authors alone.

3
Note on the authors Christina Beatty is a Professor in the Centre for Regional Economic and Social Research (CRESR) at Sheffield Hallam University, and a statistician by background. Steve Fothergill is also a Professor within CRESR at Sheffield Hallam University, and an economist by background. Both authors have an extensive record of research and publication on local and regional trends across the UK, and on the benefits system. Their recent reports include Incapacity benefit reform: the local, regional and national impact and The Real Level of Unemployment 2012.
4
Key points
When the present welfare reforms have come into full effect they will take nearly £19bn a
year out of the economy. This is equivalent to around £470 a year for every adult of
working age in the country.
The biggest financial losses arise from reforms to incapacity benefits (£4.3bn a year),
changes to Tax Credits (£3.6bn a year) and the 1 per cent up-rating of most working-age
benefits (£3.4bn a year).
The Housing Benefit reforms result in more modest losses – an estimated £490m a year
arising from the ‘bedroom tax’ for example – but for the households affected the sums
are nevertheless still large.
Some households and individuals, notably sickness and disability claimants, will be hit by
several different elements of the reforms.
The financial impact of the reforms, however, varies greatly across the country. At the
extremes, the worst-hit local authority areas lose around four times as much, per adult of
working age, as the authorities least affected by the reforms.
Britain’s older industrial areas, a number of seaside towns and some London boroughs
are hit hardest. Much of the south and east of England outside London escapes
comparatively lightly.
Blackpool, in North West England, is hit worst of all – an estimated loss of more than
£900 a year for every adult of working age in the town.
The three regions of northern England alone can expect to lose around £5.2bn a year in
benefit income.
As a general rule, the more deprived the local authority, the greater the financial hit.
A key effect of the welfare reforms will be to widen the gaps in prosperity between the
best and worst local economies across Britain.
5
HITTING THE POOREST PLACES HARDEST
The local and regional impact of welfare reform
Scope and purpose of the report
The UK Government is implementing welfare reforms that apply to all parts of the country.
The impact of the reforms, however, will vary enormously from place to place, not least
because benefit claimants are so unevenly spread across Britain.
It is only reasonable to expect that the welfare reforms will hit the poorest parts of Britain
hardest. After all, one of the reasons why some places are so poor is that they have so
many people claiming benefits. On the other hand, the welfare reforms extend well beyond
just those who are out-of-work to include large swathes of the employed population as well.
So just how big will the impact be on different places? And just how much harder will the
reforms hit the poorer parts of Britain than more prosperous areas?
These are the questions to which this report provides answers. It provides figures not just
for Great Britain as a whole and for each of its constituent 379 local authority areas1. The
figures cover the number of households or individuals affected, and the total financial loss to
each local area. In the report itself a limited number of statistics are presented on the impact
of each of the individual benefit reforms in each local authority. The full dataset, by benefit
by authority, can however be accessed at:
http://www.shu.ac.uk/research/cresr/sites/shu.ac.uk/files/Welfare_Reform.xls
All the figures presented in the report are estimates, but in every case they are deeply rooted
in official statistics – for example in the Treasury’s own estimates of the financial savings, the
government’s Impact Assessments, and benefit claimant data.
Welfare reform is a deeply contentious issue and in documenting the impacts the report
does not attempt to comment on the merits of each of the reforms. However, it is important
that the impact on different places is fully exposed because this is a key dimension that is
too often overlooked. The impact on different places is also one of the yardsticks by which
the reforms should be judged.
1 Unitary authorities and district councils, excluding Isles of Scilly
6
The welfare reforms
The figures presented in the report cover all the major welfare reforms that are currently
underway. In brief, these are:
Housing Benefit – Local Housing Allowance
Changes to the rules governing assistance with the cost of housing for low-income
households in the private rented sector. The new rules apply to rent levels, ‘excess’
payments, property size, age limits for sole occupancy, and indexation for inflation.
Housing Benefit – Under-occupation
New rules governing the size of properties for which payments are made to working
age claimants in the social rented sector (widely known as the ‘bedroom tax’)
Non-dependant deductions
Increases in the deductions from Housing Benefit, Council Tax Benefit and other
income-based benefits to reflect the contribution that non-dependant household
members are expected to make towards the household’s housing costs
Household benefit cap
New ceiling on total payments per household, applying to the sum of a wide range of
benefits for working age claimants
Council Tax Benefit
Reductions in entitlement of working age claimants arising from 10 per cent reduction
in total payments to local authorities
Disability Living Allowance
Replacement of DLA by Personal Independence Payments (PIP), including more
stringent and frequent medical tests, as the basis for financial support to help offset
the additional costs faced by individuals with disabilities
Incapacity benefits
Replacement of Incapacity Benefit and related benefits by Employment and Support
Allowance (ESA), with more stringent medical tests, greater conditionality and time-
limiting of non-means tested entitlement for all but the most severely ill or disabled
Child Benefit
Three-year freeze, and withdrawal of benefit from households including a higher
earner
Tax Credits
Reductions in payment rates and eligibility for Child Tax Credit and Working Families
Tax Credit, paid to lower and middle income households
1 per cent up-rating
Reduction in annual up-rating of value of most working-age benefits

7
A fuller description of each of these reforms, including the timing of implementation and the
expected savings to the Exchequer, is contained in the appendix to the report.
The vast majority of these welfare reforms have been initiated by the present Coalition
government in Westminster, notably but not exclusively through the Welfare Reform Act
2012. Some of the incapacity benefit reforms, however, are Labour measures that pre-date
the 2010 general election but are only now taking full effect. They have been included here,
alongside the Coalition’s reforms, to provide a comprehensive view of the impact of the
reforms that are currently underway.
The figures the report presents show the impact when the reforms have come into full effect.
This is important because some of the reforms, particularly those affecting incapacity and
disability benefits, are being implemented in stages over a number of years. In most cases,
the figures show the expected impact in the 2014-15 financial year2.
A close observer of the list of reforms will note a number of apparent omissions. The most
significant of these is Universal Credit, which is scheduled to replace just about all means-
tested working age benefits and is arguably the single biggest reform of all. There are three
reasons for omitting Universal Credit:
Universal Credit is best understood as a repackaging of existing benefits. It
introduces for the first time a consistent benefit withdrawal rate, intended to ensure
that claimants are always financially better off in work, but the rules governing
eligibility are essentially carried over from the existing benefits it replaces.
Unlike the other welfare reforms covered here, Universal Credit is not expected to
result in a net reduction in benefit entitlement. At the level of the individual or
household there will winners and losers but on balance Universal Credit is expected
to result in slightly higher expenditure, particularly as transitional relief will be
available to existing claimants transferring across.
Most of the impact of Universal Credit will be felt well beyond 2015. Its introduction
begins in 2013 only in a small number of pilot areas and only for new claimants. The
full impact is unlikely before 2018.
Additionally, without local-level household data, which is not available, it is extremely difficult
to model the local impact of Universal Credit. That said, it should be noted that the intention
to pay the housing element of Universal Credit to tenants, rather than direct to landlords, is a
major cause of concern in the social housing sector.
Two further omissions are worth noting:
2 The exceptions are the DLA reforms, which will not impact fully until 2017-18, and the wider
application of means testing to ESA and the 1 per cent up-rating, both of which do not impact fully until 2015-16.
8
Income Support for lone parents. The qualifying age of the youngest child has been
reduced from under 7 to under 5. The effect is to transfer the lone parent from
Income Support to Jobseeker’s Allowance at the same payment rate.
RPI to CPI for benefits up-rating. This was introduced from 2011-12 but is really part
of a much wider accounting reform, including for example all public service pensions.
When fully implemented, the welfare reforms covered in this report are expected to save the
UK Treasury almost £19bn a year.
Measuring the impacts
The data sources and methods underpinning the estimates are set out in full in the appendix
to the report.
The government has in most cases not produced estimates of the local impact of the
reforms. It does however publish a range of statistics that allow the local impact to be
estimated. This information includes:
HM Treasury estimates of the overall financial saving arising from each element of
the reforms, published in the Budget or in the government’s Autumn Statement. The
estimates in the report are fully consistent with these Treasury figures3.
The Impact Assessment and (where available) Equality Impact Assessment that
government departments publish for each element of the reforms4
Benefit claimant numbers and expenditure, by local authority, published by DWP and
HMRC
Additional official statistics – for example on median earnings by local authority to
help calibrate the impact of the withdrawal of Child Benefit
DWP evidence from pilot schemes, in the context of the incapacity benefit reforms
As far as possible, for each benefit the figures presented in the report take account of the
overall financial saving to the UK Exchequer, the distribution of benefit claimants between
local authorities, and the extent to which claimants in each local authority are likely to be
affected by the reforms.
3 The estimates of the impact of the reforms to incapacity benefits, DLA and Council Tax Benefit are
subject to further detailed adjustment – see appendix. 4 Following official practice in the Impact Assessments, the estimates in the present report make no
allowance for the small share of the financial impact falling on Northern Ireland. The effect is to slightly overstate the impact on other parts of Great Britain, bearing in mind that Northern Ireland accounts for 3 per cent of the UK population.
9
In comparing the impact on different areas, the report looks in particular at the financial loss
per adult of working age5. A focus on adults of working age (16-64) is appropriate because
the welfare reforms impact almost exclusively on this group. By contrast, benefit claimants
of pensionable age are essentially unaffected6.
Some of the welfare reforms focus on households – the reforms to Housing Benefit for
example. Others – the reforms to incapacity benefits for example – are about the
entitlement of individuals. Additionally, several of the reforms are likely to impact
simultaneously on the same households and/or individuals. It is possible to estimate how
many people are affected by each element of the reforms, and how much they lose. The
financial losses can be added together but to avoid counting the same people twice the
number of households/individuals affected cannot be summed to an overall total.
Finally, in estimating the impact of the welfare reforms the report holds all other factors
constant. What this means in practice is that it makes no assumptions about the growth of
the economy or about future levels of employment and unemployment.
UK ministers take the view that the welfare reforms will increase the financial incentives to
take up employment and because more people will look for work more people will find work.
This assumes, of course, that extra labour supply leads to extra labour demand from
employers. Whether labour markets really do work in this way, especially at times of
recession or low growth, or in places where the local economy is relatively weak, is a moot
point and one that many economists would contest. Some individuals will undoubtedly find
work to compensate for the loss of benefit income but whether the overall level of
employment will be any higher as a result is questionable. More often than not, they will
simply fill vacancies that would have gone to other jobseekers. So the figures in this report
do not assume that loss of income from benefits will wholly or in part be replaced by
additional income from employment.
The impact of the reforms
Overall national impact
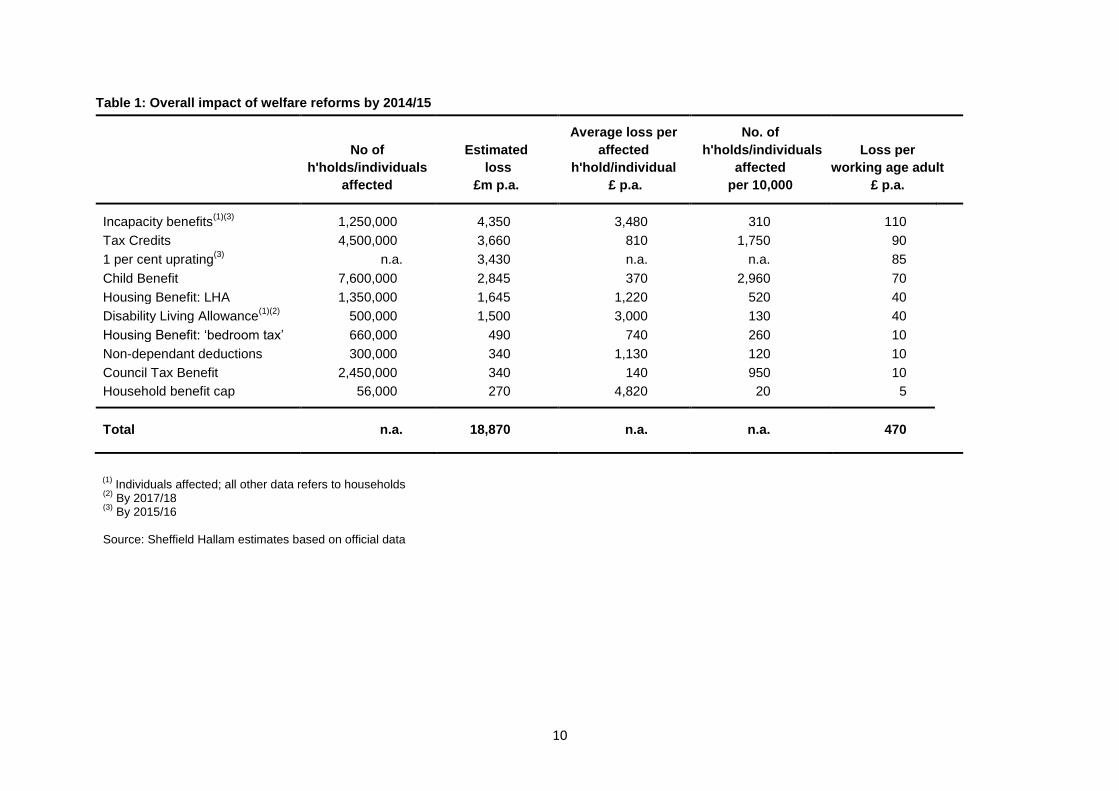
Table 1 shows the estimated impact of the welfare reforms across Great Britain as a whole.
As noted earlier, when the reforms have come into full effect it is estimated that they will
reduce spending by almost £19bn a year. This represents around £470 a year for every
adult of working age in the country.
The individual welfare reforms vary greatly in the scale of their impact, in the number of
individuals or households affected, and in the intensity of the financial loss imposed on those
5 In Scotland’s case, where only a limited range of 2011 Census data has so far been published, the
working age population figures for each authority are an estimate based on the overall population from the 2011 Census and the age distribution of the population in 2010 from the mid-year population estimates. In the rest of Britain the figures are all taken from the 2011 Census. 6 The main exceptions are a small minority (around 5%) of Housing Benefit recipients in the private
rented sector, affected by the reforms to Local Housing Allowance, and a small number of adults of pensionable age who receive Child Benefit.
10
Table 1: Overall impact of welfare reforms by 2014/15
No of
h'holds/individuals
affected
Estimated
loss
£m p.a.
Average loss per
affected
h'hold/individual
£ p.a.
No. of
h'holds/individuals
affected
per 10,000
Loss per
working age adult
£ p.a.
Incapacity benefits(1)(3)
1,250,000 4,350 3,480 310 110
Tax Credits 4,500,000 3,660 810 1,750 90
1 per cent uprating(3)
n.a. 3,430 n.a. n.a. 85
Child Benefit 7,600,000 2,845 370 2,960 70
Housing Benefit: LHA 1,350,000 1,645 1,220 520 40
Disability Living Allowance(1)(2)
500,000 1,500 3,000 130 40
Housing Benefit: ‘bedroom tax’ 660,000 490 740 260 10
Non-dependant deductions 300,000 340 1,130 120 10
Council Tax Benefit 2,450,000 340 140 950 10
Household benefit cap 56,000 270 4,820 20 5
Total n.a. 18,870 n.a. n.a. 470
(1) Individuals affected; all other data refers to households
(2) By 2017/18
(3) By 2015/16
Source: Sheffield Hallam estimates based on official data
11
affected. A great deal of media coverage has focussed on, for example, the ‘bedroom tax’
and the overall household benefit cap. In fact, the biggest financial impact comes from the
reform of incapacity benefits – an estimated reduction in spending of more than £4.3bn a
year. Changes to Tax Credits and the 1 per cent up-rating of most working-age benefits,
taking effect from April 2013, also account for substantial sums - £3.6bn and £3.4bn
respectively.
Child Benefit changes affect the largest number of households – some 7.6m. This is
because the three-year freeze in Child Benefit rates up to April 2014 (instead of up-rating
with inflation) impacts on all recipients.
The household benefit cap, by contrast, impacts on many fewer households – an estimated
56,000 – but the average financial loss for each of these households is relatively large.
Sickness and disability claimants can also expect to be hit hard. The individuals adversely
affected by the incapacity benefit reforms can expect to lose an average of £3,500 a year,
and those losing out as a result of the changeover from Disability Living Allowance to
Personal Independence Payments by an average of £3,000 a year. Often these will be the
same individuals: most DLA claimants of working age are out-of-work on incapacity benefits
and in both cases the groups most exposed to benefit reductions are those with less severe
disabilities or health problems.
The same individuals may also find that they encounter reductions in Housing Benefit
entitlement. The overall reductions in Housing Benefit are estimated to be more than £1.6bn
for those in the private rented sector (affected by LHA reforms), £490m for those in the
social rented sector (affected by the ‘bedroom tax’) and £340m by higher deductions for non-
dependants (which mostly impact on Housing Benefit). The losses for the households
affected – often £1,000 a year – are large.
The changes to Council Tax Benefit hit large numbers of households – approaching 2.5m,
though none in Scotland or Wales (where the devolved administrations have chosen not to
pass on the reductions). The average financial loss per household – and estimated £140 a
year – is more modest than the other benefit cuts, though still likely to be hard to find in
many cases.
Impact by local authority
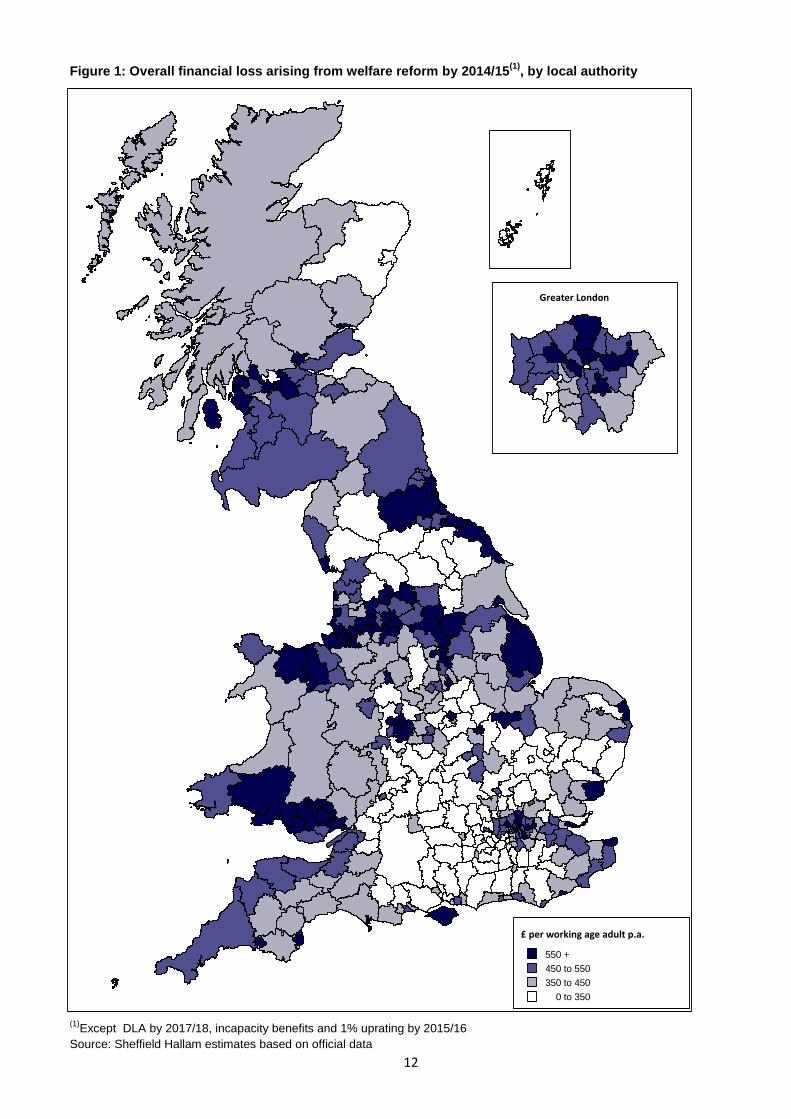
Figure 1 shows the overall impact of the welfare reforms by local authority district. The
measure used here is the financial loss per adult of working age so the data measures the
intensity of the financial impact in each area.
The overall impact of the welfare reforms presents a complex picture, not least because
different reforms impact on places in different ways. Nevertheless, the map shows clear
patterns that will be readily recognisable to anyone with a solid understanding of the
geography of Britain. Three types of area are hit hardest:
12
Figure 1: Overall financial loss arising from welfare reform by 2014/15(1)
, by local authority
(1)Except DLA by 2017/18, incapacity benefits and 1% uprating by 2015/16
Source: Sheffield Hallam estimates based on official data
550 +
450 to 550
350 to 450
0 to 350
Greater London
£ per working age adult p.a.
13
The older industrial areas of England, Scotland and Wales. These include
substantial parts of North West and North East England, the South Wales Valleys
and the Glasgow area in Scotland. Older industrial areas account for the largest
proportion of the worst-hit places.
A number of seaside towns. These include Blackpool, Torbay, Hastings, Great
Yarmouth and Thanet (which includes Margate). Not all seaside resorts are badly hit
but this group – which includes several of the least prosperous – matches the impact
on older industrial areas.
Some London boroughs. These include not just those that have traditionally been
identified as ‘deprived’ (eg Hackney) but also boroughs such as Westminster and
Brent.
At the other end of the spectrum, a substantial part of southern England outside London is
much less acutely affected by the welfare reforms. A number of rural areas in northern
England, including most of North Yorkshire and parts of Cumbria, plus the Aberdeen area in
Scotland, also escape relatively lightly.
The worst affected places
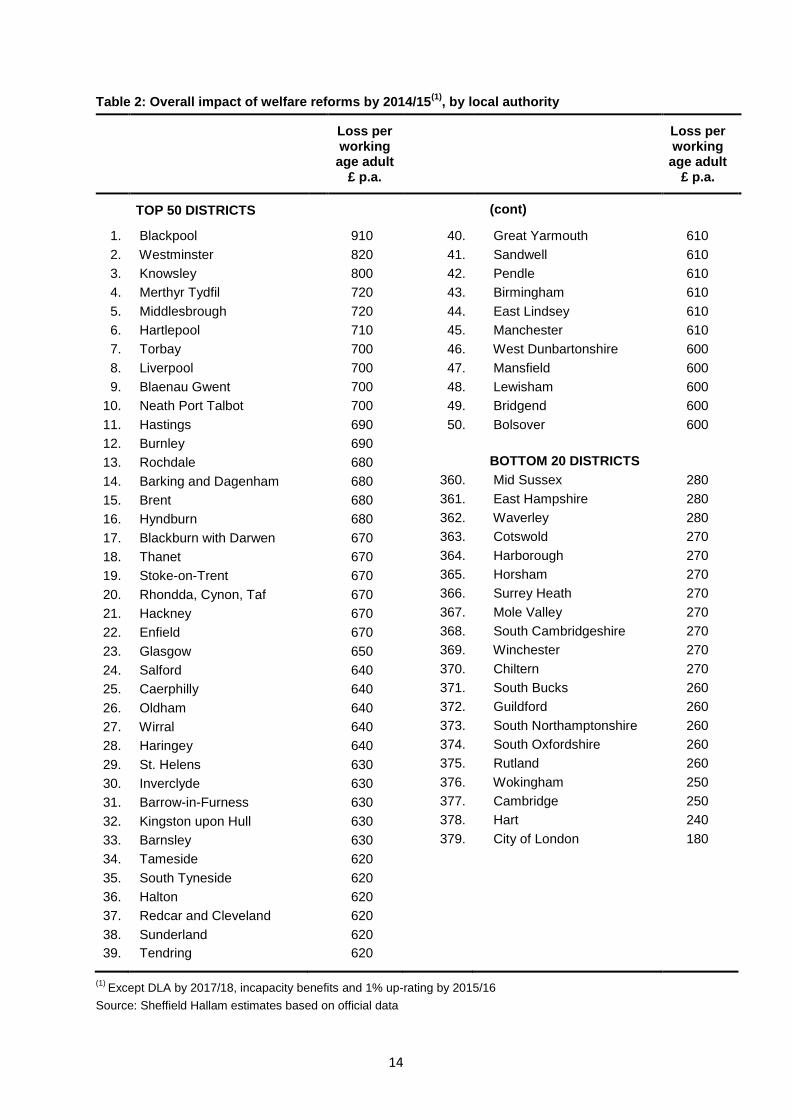
To underline the disparities, Table 2 lists the 50 local authority districts worst affected by the
reforms, measured on a per capita basis, and contrasts this with the 20 least affected.
At the very top of the list comes Blackpool, the famous seaside resort in North West
England, where the average loss per working age adult is estimated to be £914 a year.
Blackpool tops the list for a number of reasons. It has a high proportion of adults of working
age out-of-work on benefits, including one of the highest incapacity claimant rates in the
country. But unlike most of older industrial Britain, which shares the high rates out-of-work
on benefits, Blackpool has a particularly high proportion of households (including out-of-work
households) living in the private-rented sector, who are badly exposed to the reductions in
the Local Housing Allowance element of Housing Benefit. It is also worth noting that
Blackpool borough itself (to which the figures refer) is something of an ‘inner urban area’
within a larger built-up area that also includes Lytham St Anne’s and Fleetwood.
Westminster, at number two on the list, is the glaring exception to the general rule that the
poorest parts of Britain are hit hardest. But there are special factors at work. One is the
possibility that the 2011 Census population figures, used here, significantly under-estimate
the local population, as Westminster City Council has claimed7, in which case the benefit
losses in this table are being spread across too few people and the true figure could be £100
per head lower. But also the extremely high rents in Westminster mean that, more than
anywhere else in Britain, the Housing Benefit reforms and the household benefit cap lead to
7 The problem lies with possible under-recording by the Census in areas where there is a highly
transient population and difficulty in contacting households. Westminster is likely to be the extreme case in this regard.
14
Table 2: Overall impact of welfare reforms by 2014/15(1)
, by local authority
Loss per working age adult
£ p.a.
Loss per working age adult
£ p.a.
TOP 50 DISTRICTS
(cont)
1. Blackpool 910 40. Great Yarmouth 610
2. Westminster 820 41. Sandwell 610
3. Knowsley 800 42. Pendle 610
4. Merthyr Tydfil 720 43. Birmingham 610
5. Middlesbrough 720 44. East Lindsey 610
6. Hartlepool 710 45. Manchester 610
7. Torbay 700 46. West Dunbartonshire 600
8. Liverpool 700 47. Mansfield 600
9. Blaenau Gwent 700 48. Lewisham 600
10. Neath Port Talbot 700 49. Bridgend 600
11. Hastings 690 50. Bolsover 600
12. Burnley 690
13. Rochdale 680 BOTTOM 20 DISTRICTS
14. Barking and Dagenham 680 360. Mid Sussex 280
15. Brent 680 361. East Hampshire 280
16. Hyndburn 680 362. Waverley 280
17. Blackburn with Darwen 670 363. Cotswold 270
18. Thanet 670 364. Harborough 270
19. Stoke-on-Trent 670 365. Horsham 270
20. Rhondda, Cynon, Taf 670 366. Surrey Heath 270
21. Hackney 670 367. Mole Valley 270
22. Enfield 670 368. South Cambridgeshire 270
23. Glasgow 650 369. Winchester 270
24. Salford 640 370. Chiltern 270
25. Caerphilly 640 371. South Bucks 260
26. Oldham 640 372. Guildford 260
27. Wirral 640 373. South Northamptonshire 260
28. Haringey 640 374. South Oxfordshire 260
29. St. Helens 630 375. Rutland 260
30. Inverclyde 630 376. Wokingham 250
31. Barrow-in-Furness 630 377. Cambridge 250
32. Kingston upon Hull 630 378. Hart 240
33. Barnsley 630 379. City of London 180
34. Tameside 620
35. South Tyneside 620
36. Halton 620
37. Redcar and Cleveland 620
38. Sunderland 620
39. Tendring 620
(1) Except DLA by 2017/18, incapacity benefits and 1% up-rating by 2015/16
Source: Sheffield Hallam estimates based on official data
15
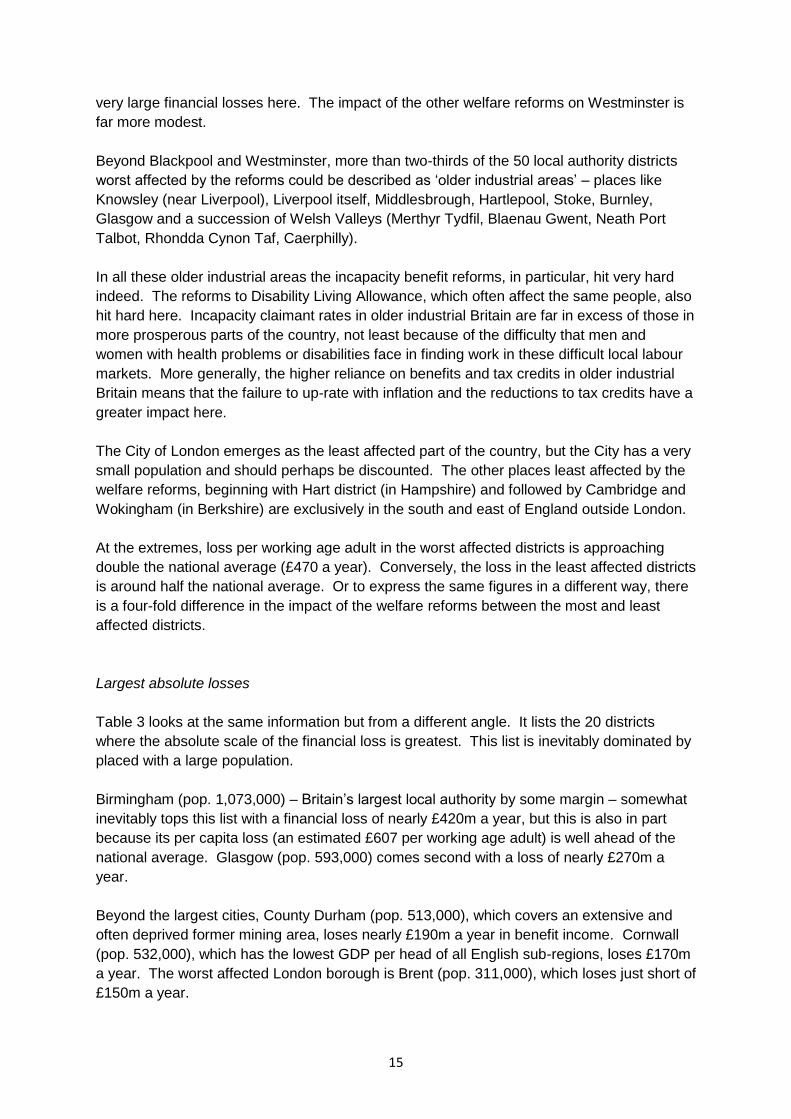
very large financial losses here. The impact of the other welfare reforms on Westminster is
far more modest.
Beyond Blackpool and Westminster, more than two-thirds of the 50 local authority districts
worst affected by the reforms could be described as ‘older industrial areas’ – places like
Knowsley (near Liverpool), Liverpool itself, Middlesbrough, Hartlepool, Stoke, Burnley,
Glasgow and a succession of Welsh Valleys (Merthyr Tydfil, Blaenau Gwent, Neath Port
Talbot, Rhondda Cynon Taf, Caerphilly).
In all these older industrial areas the incapacity benefit reforms, in particular, hit very hard
indeed. The reforms to Disability Living Allowance, which often affect the same people, also
hit hard here. Incapacity claimant rates in older industrial Britain are far in excess of those in
more prosperous parts of the country, not least because of the difficulty that men and
women with health problems or disabilities face in finding work in these difficult local labour
markets. More generally, the higher reliance on benefits and tax credits in older industrial
Britain means that the failure to up-rate with inflation and the reductions to tax credits have a
greater impact here.
The City of London emerges as the least affected part of the country, but the City has a very
small population and should perhaps be discounted. The other places least affected by the
welfare reforms, beginning with Hart district (in Hampshire) and followed by Cambridge and
Wokingham (in Berkshire) are exclusively in the south and east of England outside London.
At the extremes, loss per working age adult in the worst affected districts is approaching
double the national average (£470 a year). Conversely, the loss in the least affected districts
is around half the national average. Or to express the same figures in a different way, there
is a four-fold difference in the impact of the welfare reforms between the most and least
affected districts.
Largest absolute losses
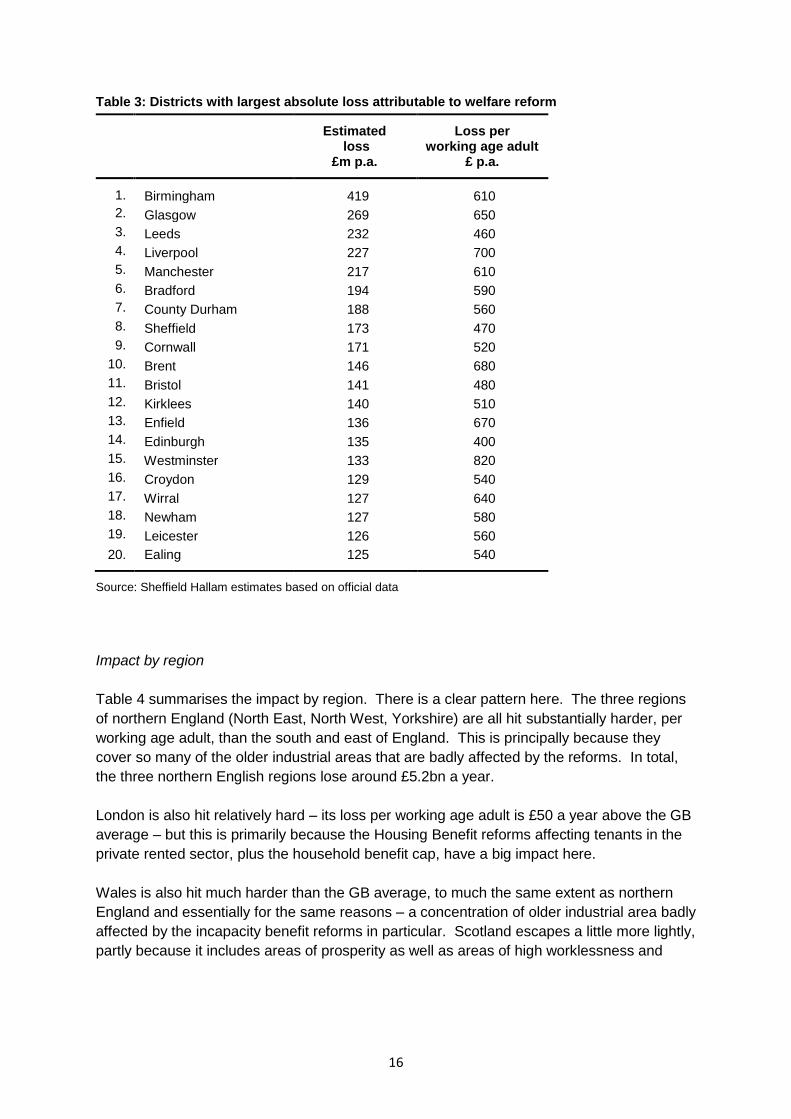
Table 3 looks at the same information but from a different angle. It lists the 20 districts
where the absolute scale of the financial loss is greatest. This list is inevitably dominated by
placed with a large population.
Birmingham (pop. 1,073,000) – Britain’s largest local authority by some margin – somewhat
inevitably tops this list with a financial loss of nearly £420m a year, but this is also in part
because its per capita loss (an estimated £607 per working age adult) is well ahead of the
national average. Glasgow (pop. 593,000) comes second with a loss of nearly £270m a
year.
Beyond the largest cities, County Durham (pop. 513,000), which covers an extensive and
often deprived former mining area, loses nearly £190m a year in benefit income. Cornwall
(pop. 532,000), which has the lowest GDP per head of all English sub-regions, loses £170m
a year. The worst affected London borough is Brent (pop. 311,000), which loses just short of
£150m a year.
16
Table 3: Districts with largest absolute loss attributable to welfare reform
Estimated loss
£m p.a.
Loss per working age adult
£ p.a.
1. Birmingham 419 610
2. Glasgow 269 650
3. Leeds 232 460
4. Liverpool 227 700
5. Manchester 217 610
6. Bradford 194 590
7. County Durham 188 560
8. Sheffield 173 470
9. Cornwall 171 520
10. Brent 146 680
11. Bristol 141 480
12. Kirklees 140 510
13. Enfield 136 670
14. Edinburgh 135 400
15. Westminster 133 820
16. Croydon 129 540
17. Wirral 127 640
18. Newham 127 580
19. Leicester 126 560
20. Ealing 125 540
Source: Sheffield Hallam estimates based on official data
Impact by region
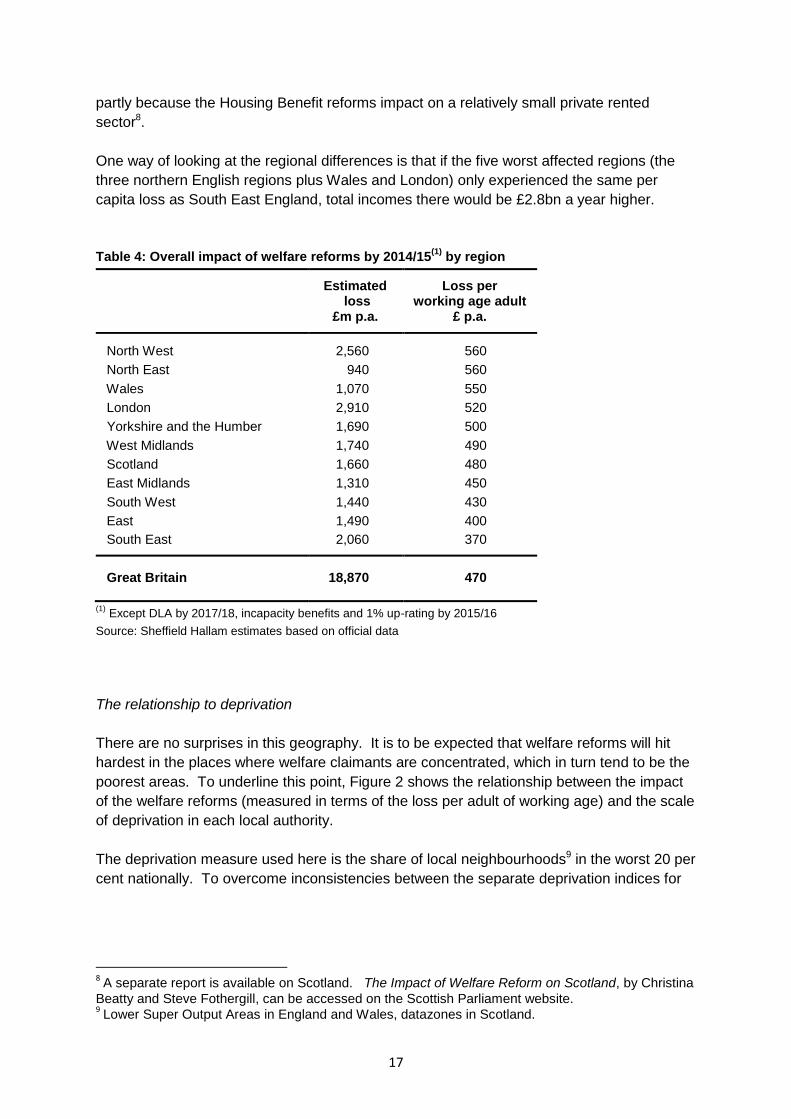
Table 4 summarises the impact by region. There is a clear pattern here. The three regions
of northern England (North East, North West, Yorkshire) are all hit substantially harder, per
working age adult, than the south and east of England. This is principally because they
cover so many of the older industrial areas that are badly affected by the reforms. In total,
the three northern English regions lose around £5.2bn a year.
London is also hit relatively hard – its loss per working age adult is £50 a year above the GB
average – but this is primarily because the Housing Benefit reforms affecting tenants in the
private rented sector, plus the household benefit cap, have a big impact here.
Wales is also hit much harder than the GB average, to much the same extent as northern
England and essentially for the same reasons – a concentration of older industrial area badly
affected by the incapacity benefit reforms in particular. Scotland escapes a little more lightly,
partly because it includes areas of prosperity as well as areas of high worklessness and
17
partly because the Housing Benefit reforms impact on a relatively small private rented
sector8.
One way of looking at the regional differences is that if the five worst affected regions (the
three northern English regions plus Wales and London) only experienced the same per
capita loss as South East England, total incomes there would be £2.8bn a year higher.
Table 4: Overall impact of welfare reforms by 2014/15(1)
by region
Estimated loss
£m p.a.
Loss per working age adult
£ p.a.
North West 2,560 560
North East 940 560
Wales 1,070 550
London 2,910 520
Yorkshire and the Humber 1,690 500
West Midlands 1,740 490
Scotland 1,660 480
East Midlands 1,310 450
South West 1,440 430
East 1,490 400
South East 2,060 370
Great Britain 18,870 470
(1)
Except DLA by 2017/18, incapacity benefits and 1% up-rating by 2015/16
Source: Sheffield Hallam estimates based on official data
The relationship to deprivation
There are no surprises in this geography. It is to be expected that welfare reforms will hit
hardest in the places where welfare claimants are concentrated, which in turn tend to be the
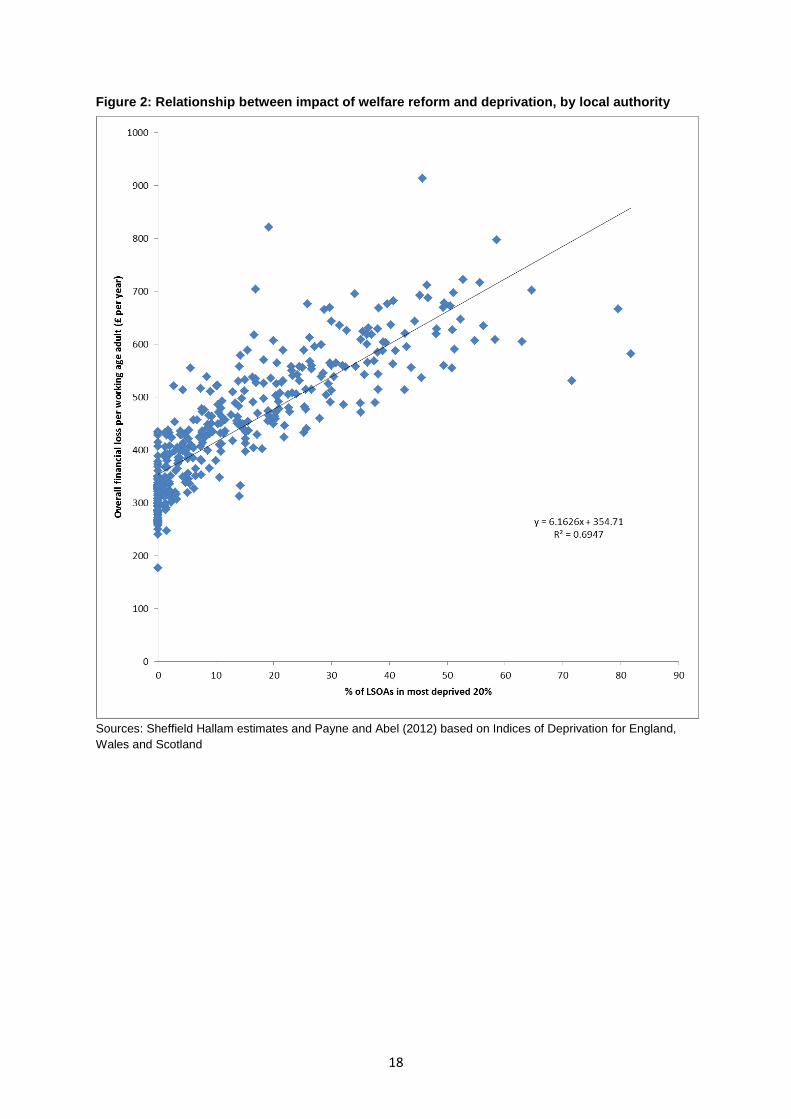
poorest areas. To underline this point, Figure 2 shows the relationship between the impact
of the welfare reforms (measured in terms of the loss per adult of working age) and the scale
of deprivation in each local authority.
The deprivation measure used here is the share of local neighbourhoods9 in the worst 20 per
cent nationally. To overcome inconsistencies between the separate deprivation indices for
8 A separate report is available on Scotland. The Impact of Welfare Reform on Scotland, by Christina
Beatty and Steve Fothergill, can be accessed on the Scottish Parliament website. 9 Lower Super Output Areas in England and Wales, datazones in Scotland.
18
Figure 2: Relationship between impact of welfare reform and deprivation, by local authority
Sources: Sheffield Hallam estimates and Payne and Abel (2012) based on Indices of Deprivation for England,
Wales and Scotland
19
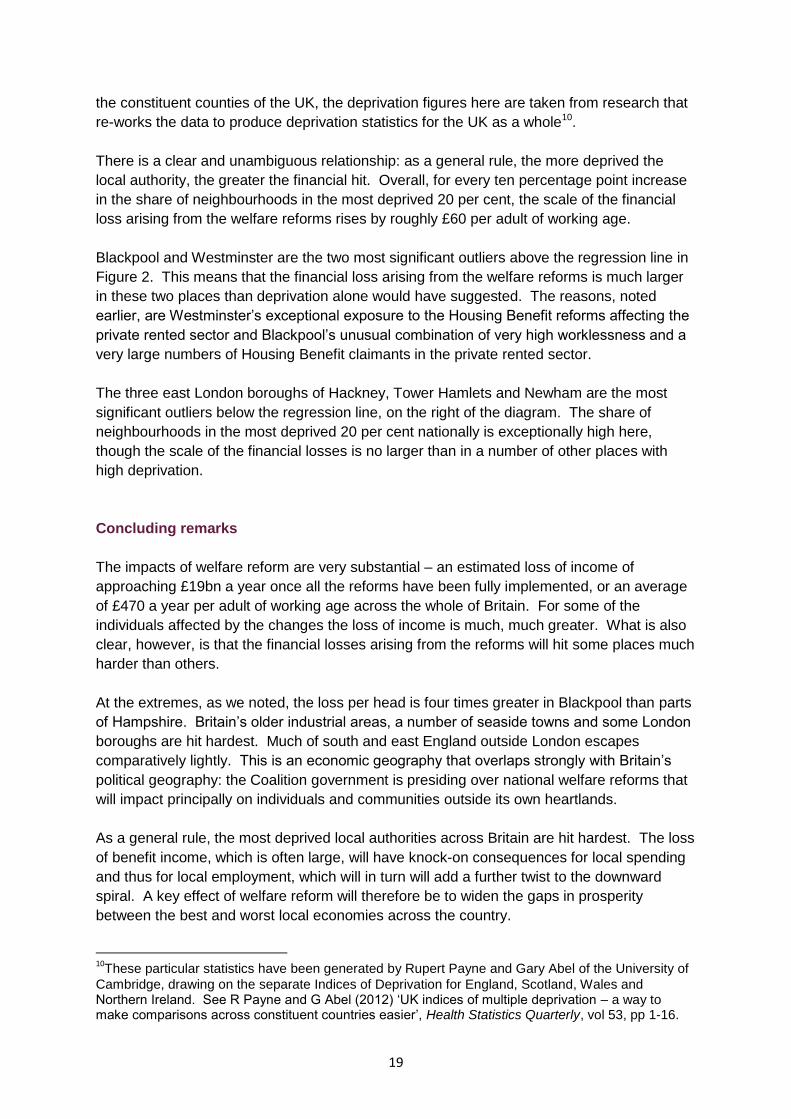
the constituent counties of the UK, the deprivation figures here are taken from research that
re-works the data to produce deprivation statistics for the UK as a whole10.
There is a clear and unambiguous relationship: as a general rule, the more deprived the
local authority, the greater the financial hit. Overall, for every ten percentage point increase
in the share of neighbourhoods in the most deprived 20 per cent, the scale of the financial
loss arising from the welfare reforms rises by roughly £60 per adult of working age.
Blackpool and Westminster are the two most significant outliers above the regression line in
Figure 2. This means that the financial loss arising from the welfare reforms is much larger
in these two places than deprivation alone would have suggested. The reasons, noted
earlier, are Westminster’s exceptional exposure to the Housing Benefit reforms affecting the
private rented sector and Blackpool’s unusual combination of very high worklessness and a
very large numbers of Housing Benefit claimants in the private rented sector.
The three east London boroughs of Hackney, Tower Hamlets and Newham are the most
significant outliers below the regression line, on the right of the diagram. The share of
neighbourhoods in the most deprived 20 per cent nationally is exceptionally high here,
though the scale of the financial losses is no larger than in a number of other places with
high deprivation.
Concluding remarks
The impacts of welfare reform are very substantial – an estimated loss of income of
approaching £19bn a year once all the reforms have been fully implemented, or an average
of £470 a year per adult of working age across the whole of Britain. For some of the
individuals affected by the changes the loss of income is much, much greater. What is also
clear, however, is that the financial losses arising from the reforms will hit some places much
harder than others.
At the extremes, as we noted, the loss per head is four times greater in Blackpool than parts
of Hampshire. Britain’s older industrial areas, a number of seaside towns and some London
boroughs are hit hardest. Much of south and east England outside London escapes
comparatively lightly. This is an economic geography that overlaps strongly with Britain’s
political geography: the Coalition government is presiding over national welfare reforms that
will impact principally on individuals and communities outside its own heartlands.
As a general rule, the most deprived local authorities across Britain are hit hardest. The loss
of benefit income, which is often large, will have knock-on consequences for local spending
and thus for local employment, which will in turn will add a further twist to the downward
spiral. A key effect of welfare reform will therefore be to widen the gaps in prosperity
between the best and worst local economies across the country.
10
These particular statistics have been generated by Rupert Payne and Gary Abel of the University of
Cambridge, drawing on the separate Indices of Deprivation for England, Scotland, Wales and Northern Ireland. See R Payne and G Abel (2012) ‘UK indices of multiple deprivation – a way to make comparisons across constituent countries easier’, Health Statistics Quarterly, vol 53, pp 1-16.
20
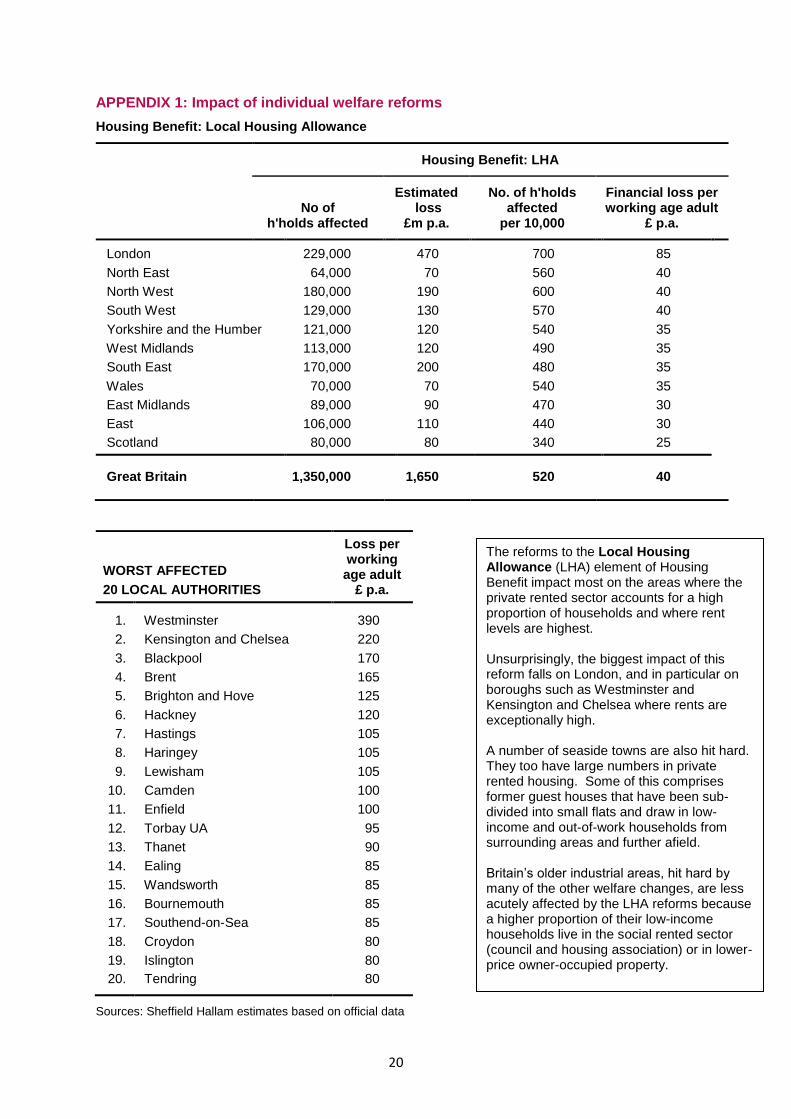
APPENDIX 1: Impact of individual welfare reforms
Housing Benefit: Local Housing Allowance
Housing Benefit: LHA
No of
h'holds affected
Estimated loss
£m p.a.
No. of h'holds affected
per 10,000
Financial loss per working age adult
£ p.a.
London 229,000 470 700 85
North East 64,000 70 560 40
North West 180,000 190 600 40
South West 129,000 130 570 40
Yorkshire and the Humber 121,000 120 540 35
West Midlands 113,000 120 490 35
South East 170,000 200 480 35
Wales 70,000 70 540 35
East Midlands 89,000 90 470 30
East 106,000 110 440 30
Scotland 80,000 80 340 25
Great Britain 1,350,000 1,650 520 40
WORST AFFECTED
20 LOCAL AUTHORITIES
Loss per working age adult
£ p.a.
1. Westminster 390
2. Kensington and Chelsea 220
3. Blackpool 170
4. Brent 165
5. Brighton and Hove 125
6. Hackney 120
7. Hastings 105
8. Haringey 105
9. Lewisham 105
10. Camden 100
11. Enfield 100
12. Torbay UA 95
13. Thanet 90
14. Ealing 85
15. Wandsworth 85
16. Bournemouth 85
17. Southend-on-Sea 85
18. Croydon 80
19. Islington 80
20. Tendring 80
Sources: Sheffield Hallam estimates based on official data
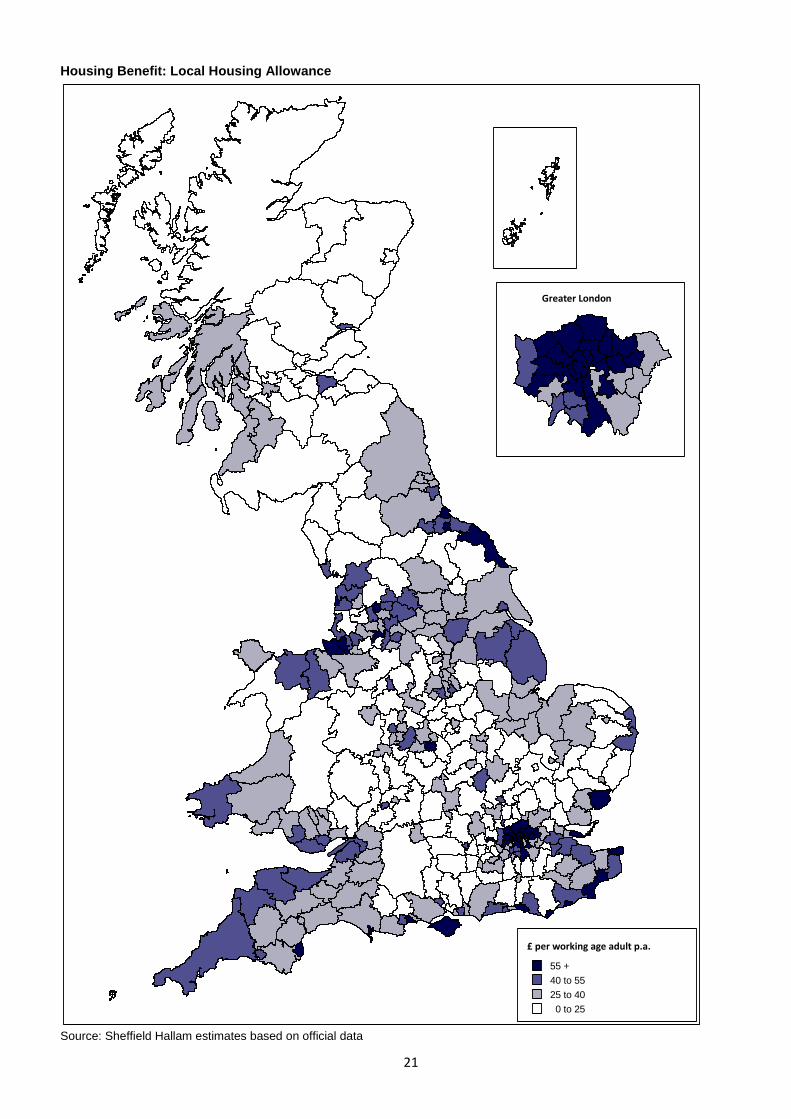
The reforms to the Local Housing Allowance (LHA) element of Housing Benefit impact most on the areas where the private rented sector accounts for a high proportion of households and where rent levels are highest. Unsurprisingly, the biggest impact of this reform falls on London, and in particular on boroughs such as Westminster and Kensington and Chelsea where rents are exceptionally high. A number of seaside towns are also hit hard. They too have large numbers in private rented housing. Some of this comprises former guest houses that have been sub-divided into small flats and draw in low-income and out-of-work households from surrounding areas and further afield. Britain’s older industrial areas, hit hard by many of the other welfare changes, are less acutely affected by the LHA reforms because a higher proportion of their low-income households live in the social rented sector (council and housing association) or in lower-price owner-occupied property.
21
Housing Benefit: Local Housing Allowance
Source: Sheffield Hallam estimates based on official data
55 +
40 to 55
25 to 40
0 to 25
Greater London
£ per working age adult p.a.
22
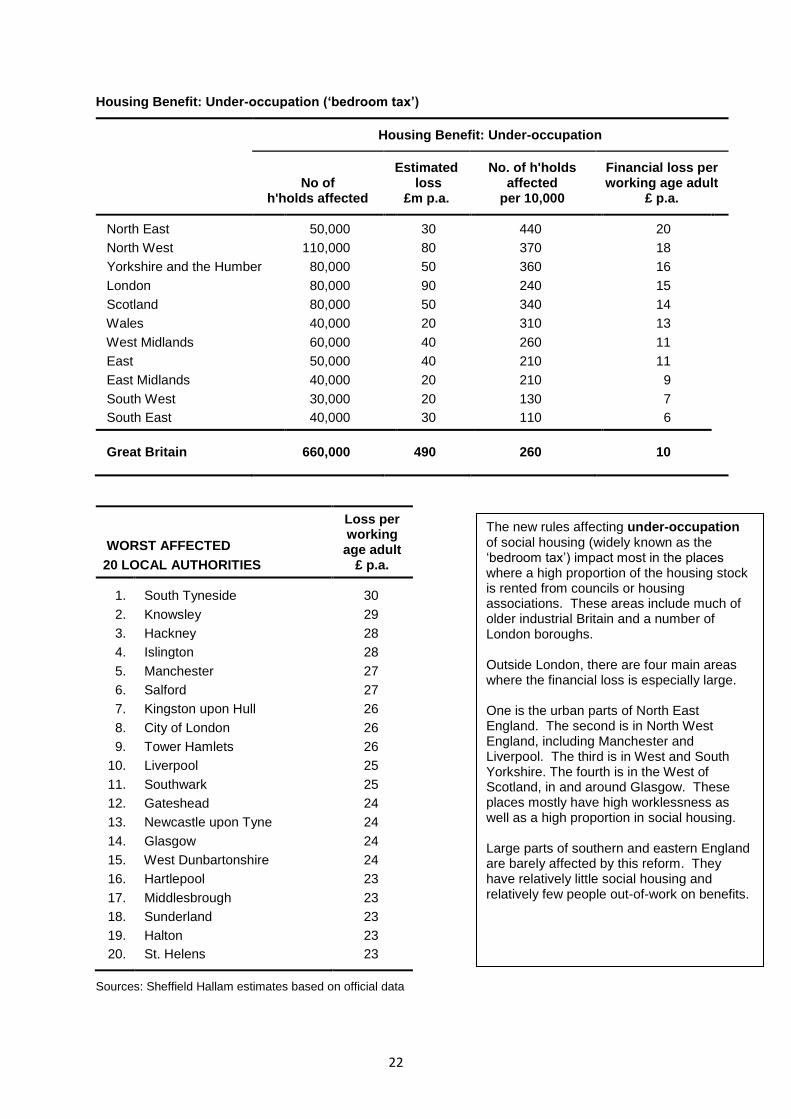
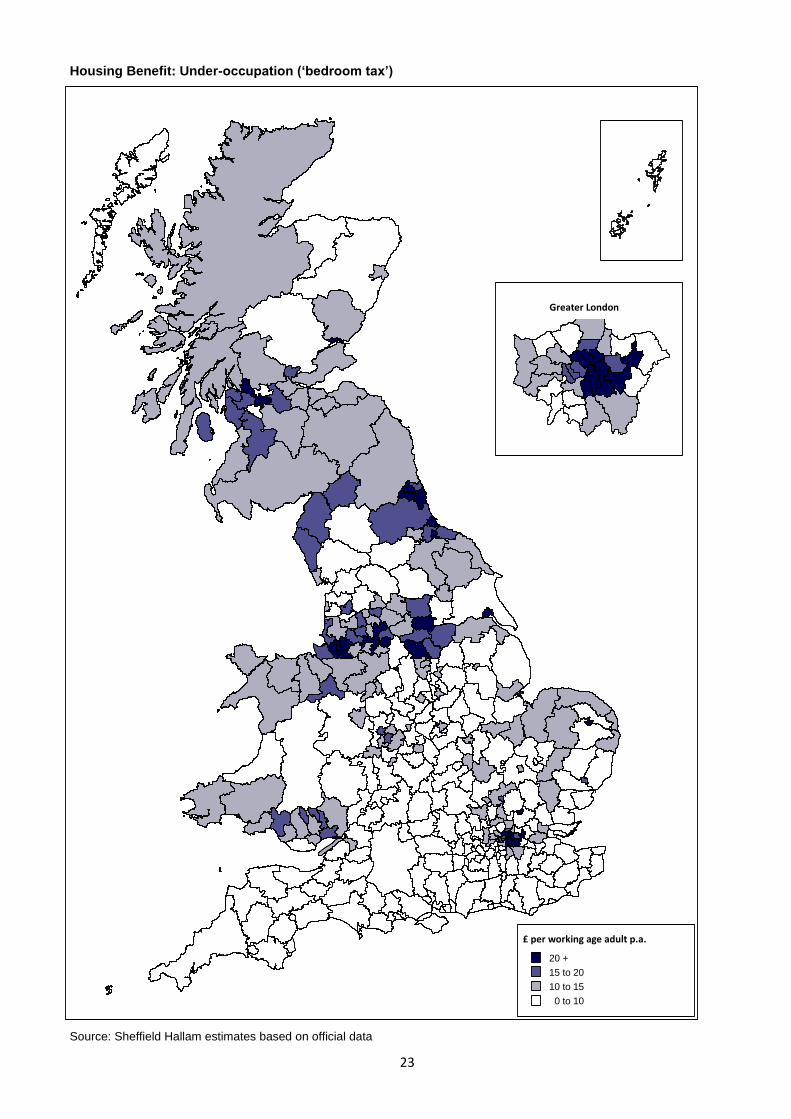
Housing Benefit: Under-occupation (‘bedroom tax’)
Housing Benefit: Under-occupation
No of
h'holds affected
Estimated loss
£m p.a.
No. of h'holds affected
per 10,000
Financial loss per working age adult
£ p.a.
North East 50,000 30 440 20
North West 110,000 80 370 18
Yorkshire and the Humber 80,000 50 360 16
London 80,000 90 240 15
Scotland 80,000 50 340 14
Wales 40,000 20 310 13
West Midlands 60,000 40 260 11
East 50,000 40 210 11
East Midlands 40,000 20 210 9
South West 30,000 20 130 7
South East 40,000 30 110 6
Great Britain 660,000 490 260 10
WORST AFFECTED
20 LOCAL AUTHORITIES
Loss per working age adult
£ p.a.
1. South Tyneside 30
2. Knowsley 29
3. Hackney 28
4. Islington 28
5. Manchester 27
6. Salford 27
7. Kingston upon Hull 26
8. City of London 26
9. Tower Hamlets 26
10. Liverpool 25
11. Southwark 25
12. Gateshead 24
13. Newcastle upon Tyne 24
14. Glasgow 24
15. West Dunbartonshire 24
16. Hartlepool 23
17. Middlesbrough 23
18. Sunderland 23
19. Halton 23
20. St. Helens 23
Sources: Sheffield Hallam estimates based on official data
The new rules affecting under-occupation of social housing (widely known as the ‘bedroom tax’) impact most in the places where a high proportion of the housing stock is rented from councils or housing associations. These areas include much of older industrial Britain and a number of London boroughs. Outside London, there are four main areas where the financial loss is especially large. One is the urban parts of North East England. The second is in North West England, including Manchester and Liverpool. The third is in West and South Yorkshire. The fourth is in the West of Scotland, in and around Glasgow. These places mostly have high worklessness as well as a high proportion in social housing. Large parts of southern and eastern England are barely affected by this reform. They have relatively little social housing and relatively few people out-of-work on benefits.
23
Housing Benefit: Under-occupation (‘bedroom tax’)
Source: Sheffield Hallam estimates based on official data
20 +
15 to 20
10 to 15
0 to 10
Greater London
£ per working age adult p.a.
24
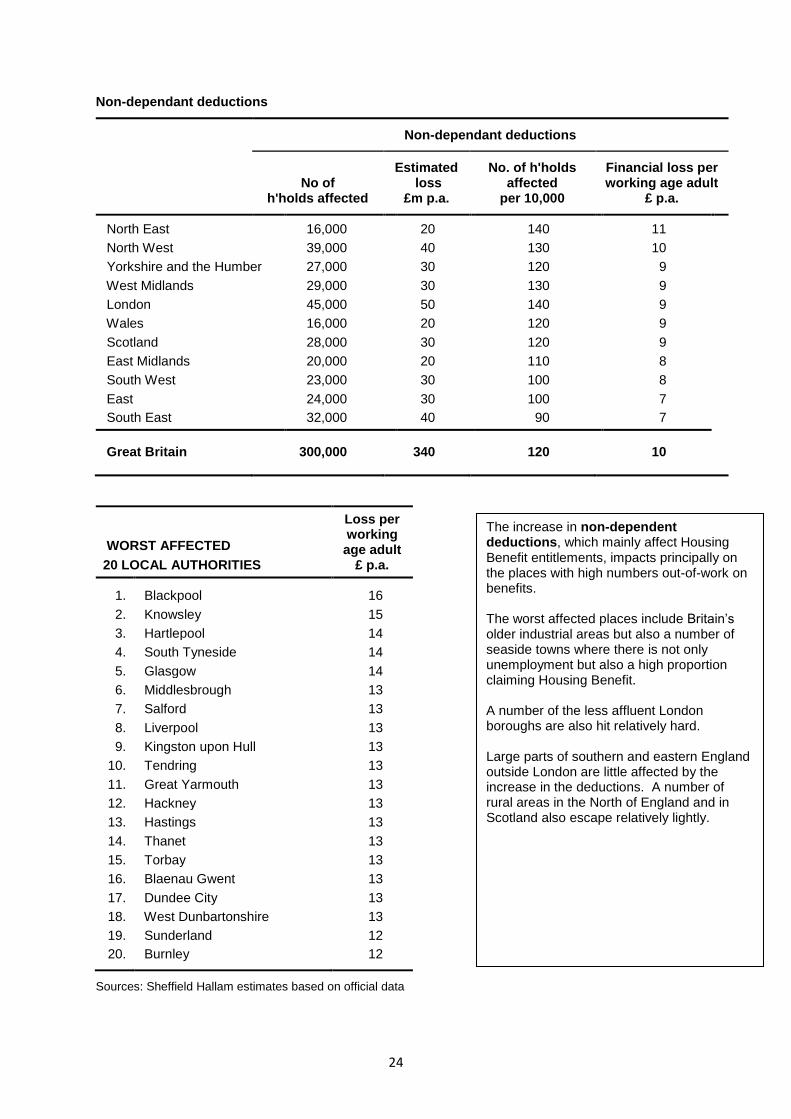
Non-dependant deductions
Non-dependant deductions
No of
h'holds affected
Estimated loss
£m p.a.
No. of h'holds affected
per 10,000
Financial loss per working age adult
£ p.a.
North East 16,000 20 140 11
North West 39,000 40 130 10
Yorkshire and the Humber 27,000 30 120 9
West Midlands 29,000 30 130 9
London 45,000 50 140 9
Wales 16,000 20 120 9
Scotland 28,000 30 120 9
East Midlands 20,000 20 110 8
South West 23,000 30 100 8
East 24,000 30 100 7
South East 32,000 40 90 7
Great Britain 300,000 340 120 10
WORST AFFECTED
20 LOCAL AUTHORITIES
Loss per working age adult
£ p.a.
1. Blackpool 16
2. Knowsley 15
3. Hartlepool 14
4. South Tyneside 14
5. Glasgow 14
6. Middlesbrough 13
7. Salford 13
8. Liverpool 13
9. Kingston upon Hull 13
10. Tendring 13
11. Great Yarmouth 13
12. Hackney 13
13. Hastings 13
14. Thanet 13
15. Torbay 13
16. Blaenau Gwent 13
17. Dundee City 13
18. West Dunbartonshire 13
19. Sunderland 12
20. Burnley 12
Sources: Sheffield Hallam estimates based on official data
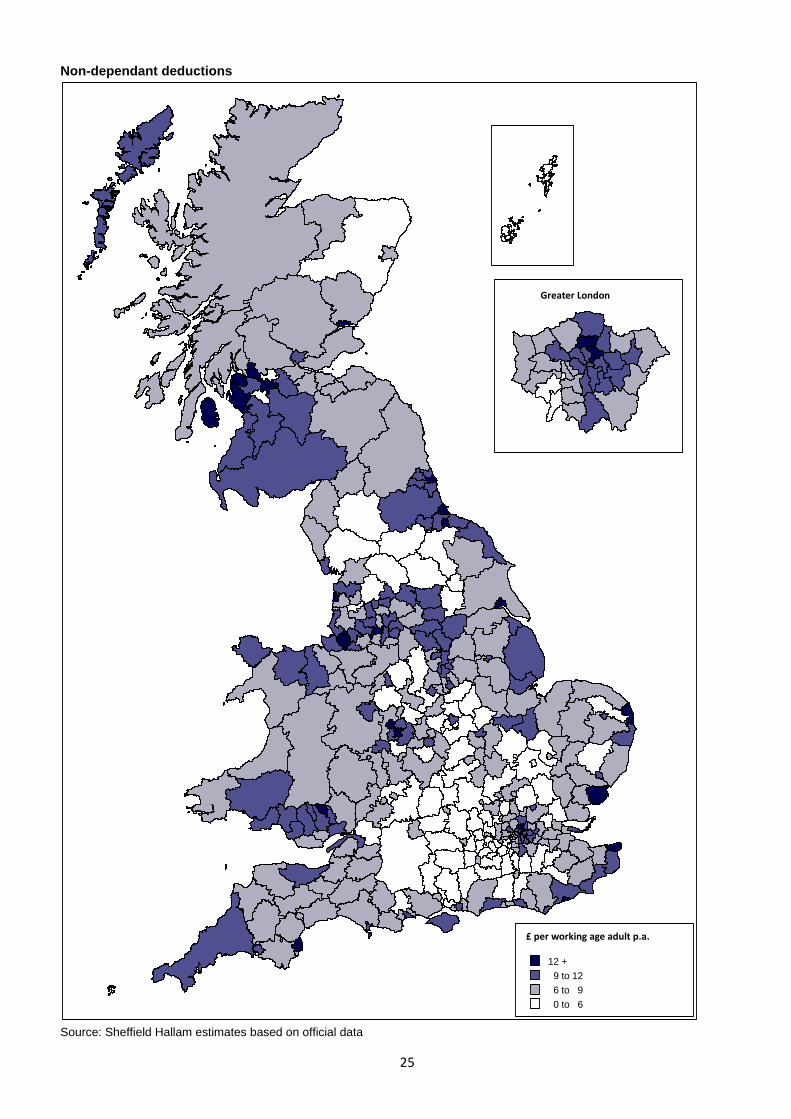
The increase in non-dependent deductions, which mainly affect Housing Benefit entitlements, impacts principally on the places with high numbers out-of-work on benefits. The worst affected places include Britain’s older industrial areas but also a number of seaside towns where there is not only unemployment but also a high proportion claiming Housing Benefit. A number of the less affluent London boroughs are also hit relatively hard. Large parts of southern and eastern England outside London are little affected by the increase in the deductions. A number of rural areas in the North of England and in Scotland also escape relatively lightly.
25
Non-dependant deductions
Source: Sheffield Hallam estimates based on official data
12 +
9 to 12
6 to 9
0 to 6
£ per working age adult p.a.
Greater London
26
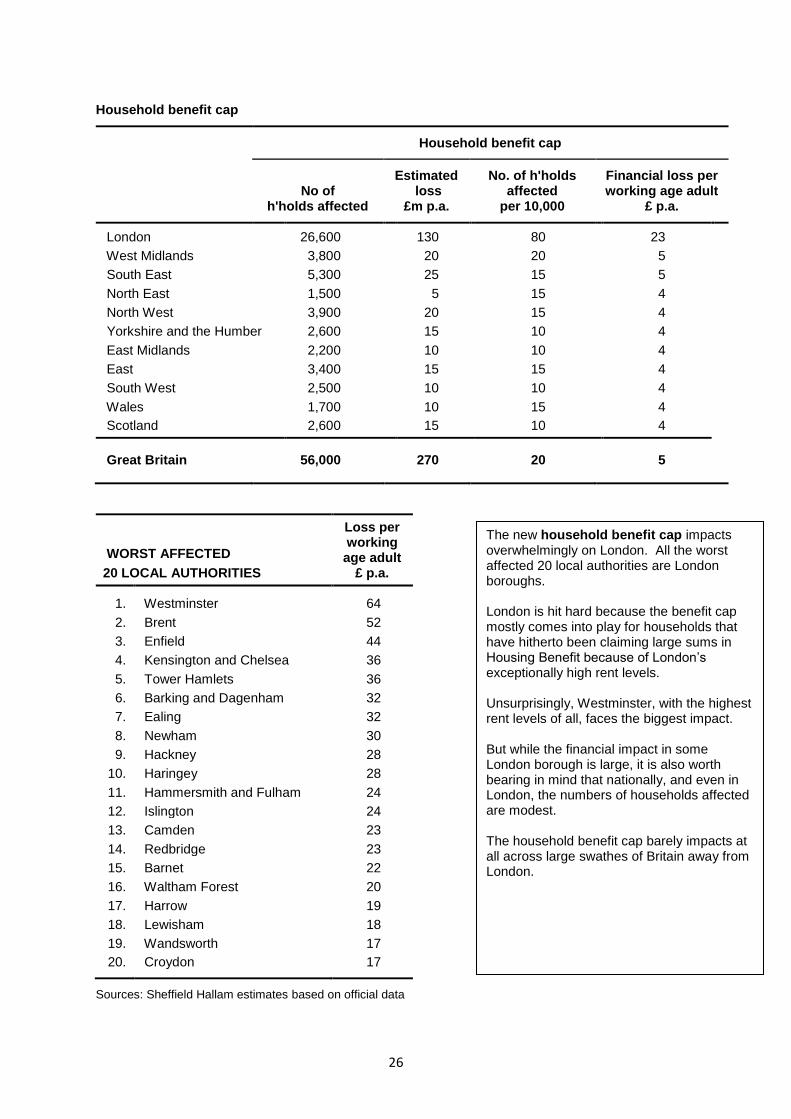
Household benefit cap
Household benefit cap
No of
h'holds affected
Estimated loss
£m p.a.
No. of h'holds affected
per 10,000
Financial loss per working age adult
£ p.a.
London 26,600 130 80 23
West Midlands 3,800 20 20 5
South East 5,300 25 15 5
North East 1,500 5 15 4
North West 3,900 20 15 4
Yorkshire and the Humber 2,600 15 10 4
East Midlands 2,200 10 10 4
East 3,400 15 15 4
South West 2,500 10 10 4
Wales 1,700 10 15 4
Scotland 2,600 15 10 4
Great Britain 56,000 270 20 5
WORST AFFECTED
20 LOCAL AUTHORITIES
Loss per working age adult
£ p.a.
1. Westminster 64
2. Brent 52
3. Enfield 44
4. Kensington and Chelsea 36
5. Tower Hamlets 36
6. Barking and Dagenham 32
7. Ealing 32
8. Newham 30
9. Hackney 28
10. Haringey 28
11. Hammersmith and Fulham 24
12. Islington 24
13. Camden 23
14. Redbridge 23
15. Barnet 22
16. Waltham Forest 20
17. Harrow 19
18. Lewisham 18
19. Wandsworth 17
20. Croydon 17
Sources: Sheffield Hallam estimates based on official data
The new household benefit cap impacts overwhelmingly on London. All the worst affected 20 local authorities are London boroughs. London is hit hard because the benefit cap mostly comes into play for households that have hitherto been claiming large sums in Housing Benefit because of London’s exceptionally high rent levels. Unsurprisingly, Westminster, with the highest rent levels of all, faces the biggest impact. But while the financial impact in some London borough is large, it is also worth bearing in mind that nationally, and even in London, the numbers of households affected are modest. The household benefit cap barely impacts at all across large swathes of Britain away from London.
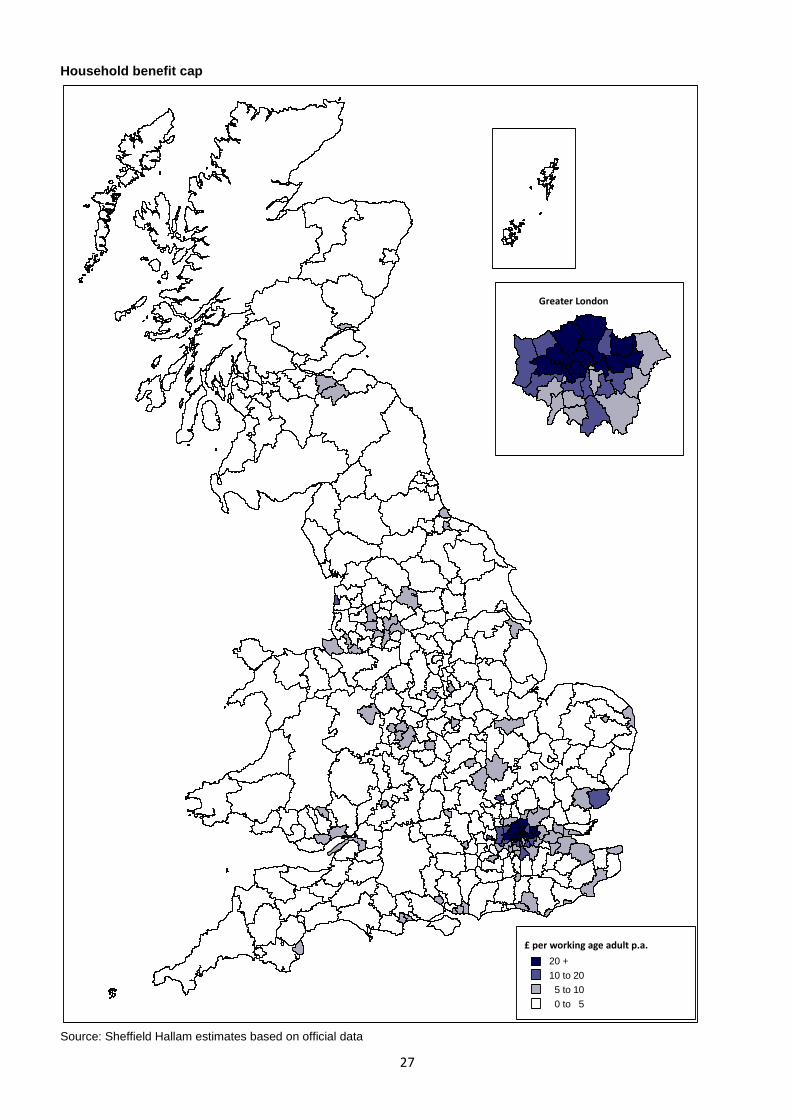
27
Household benefit cap
Source: Sheffield Hallam estimates based on official data
20 +
10 to 20
5 to 10
0 to 5
£ per working age adult p.a.
Greater London
28
Council Tax Benefit
Council Tax Benefit
No of
h'holds affected
Estimated loss
£m p.a.
No. of h'holds affected
per 10,000
Financial loss per working age adult
£ p.a.
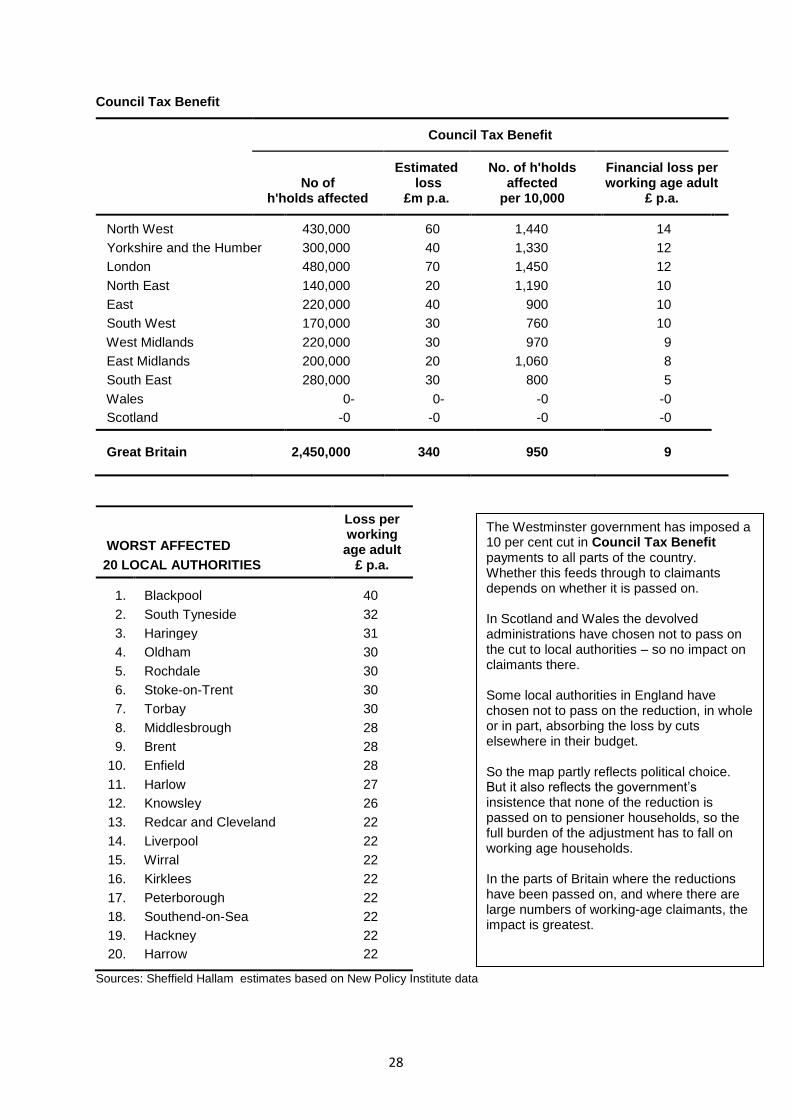
North West 430,000 60 1,440 14
Yorkshire and the Humber 300,000 40 1,330 12
London 480,000 70 1,450 12
North East 140,000 20 1,190 10
East 220,000 40 900 10
South West 170,000 30 760 10
West Midlands 220,000 30 970 9
East Midlands 200,000 20 1,060 8
South East 280,000 30 800 5
Wales 0- 0- -0 -0
Scotland -0 -0 -0 -0
Great Britain 2,450,000 340 950 9
WORST AFFECTED
20 LOCAL AUTHORITIES
Loss per working age adult
£ p.a.
1. Blackpool 40
2. South Tyneside 32
3. Haringey 31
4. Oldham 30
5. Rochdale 30
6. Stoke-on-Trent 30
7. Torbay 30
8. Middlesbrough 28
9. Brent 28
10. Enfield 28
11. Harlow 27
12. Knowsley 26
13. Redcar and Cleveland 22
14. Liverpool 22
15. Wirral 22
16. Kirklees 22
17. Peterborough 22
18. Southend-on-Sea 22
19. Hackney 22
20. Harrow 22
Sources: Sheffield Hallam estimates based on New Policy Institute data
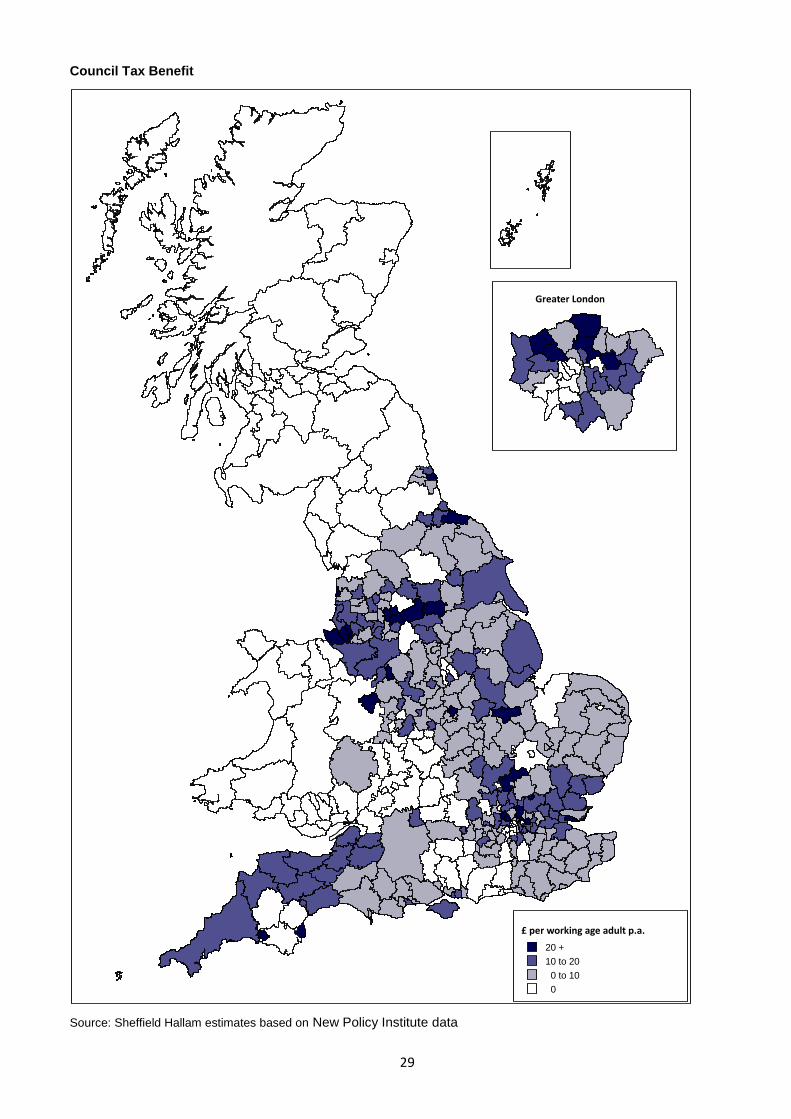
The Westminster government has imposed a 10 per cent cut in Council Tax Benefit payments to all parts of the country. Whether this feeds through to claimants depends on whether it is passed on. In Scotland and Wales the devolved administrations have chosen not to pass on the cut to local authorities – so no impact on claimants there. Some local authorities in England have chosen not to pass on the reduction, in whole or in part, absorbing the loss by cuts elsewhere in their budget. So the map partly reflects political choice. But it also reflects the government’s insistence that none of the reduction is passed on to pensioner households, so the full burden of the adjustment has to fall on working age households. In the parts of Britain where the reductions have been passed on, and where there are large numbers of working-age claimants, the impact is greatest.
29
Council Tax Benefit
Source: Sheffield Hallam estimates based on New Policy Institute data
20 +
10 to 20
0 to 10
0
£ per working age adult p.a.
Greater London
30
Disability Living Allowance
Disability Living Allowance
No of individuals
affected
Estimated loss
£m p.a.
No. of individuals affected
per 10,000
Financial loss per working age adult
£ p.a.
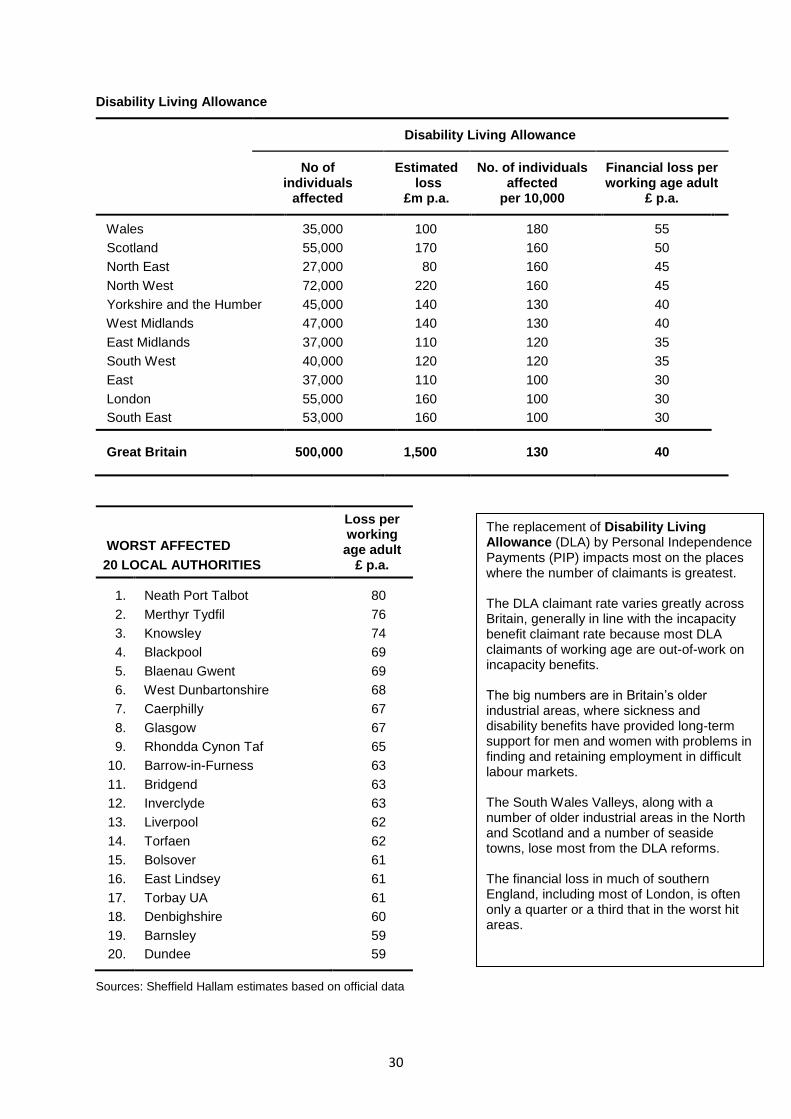
Wales 35,000 100 180 55
Scotland 55,000 170 160 50
North East 27,000 80 160 45
North West 72,000 220 160 45
Yorkshire and the Humber 45,000 140 130 40
West Midlands 47,000 140 130 40
East Midlands 37,000 110 120 35
South West 40,000 120 120 35
East 37,000 110 100 30
London 55,000 160 100 30
South East 53,000 160 100 30
Great Britain 500,000 1,500 130 40
WORST AFFECTED
20 LOCAL AUTHORITIES
Loss per working age adult
£ p.a.
1. Neath Port Talbot 80
2. Merthyr Tydfil 76
3. Knowsley 74
4. Blackpool 69
5. Blaenau Gwent 69
6. West Dunbartonshire 68
7. Caerphilly 67
8. Glasgow 67
9. Rhondda Cynon Taf 65
10. Barrow-in-Furness 63
11. Bridgend 63
12. Inverclyde 63
13. Liverpool 62
14. Torfaen 62
15. Bolsover 61
16. East Lindsey 61
17. Torbay UA 61
18. Denbighshire 60
19. Barnsley 59
20. Dundee 59
Sources: Sheffield Hallam estimates based on official data
The replacement of Disability Living Allowance (DLA) by Personal Independence Payments (PIP) impacts most on the places where the number of claimants is greatest. The DLA claimant rate varies greatly across Britain, generally in line with the incapacity benefit claimant rate because most DLA claimants of working age are out-of-work on incapacity benefits. The big numbers are in Britain’s older industrial areas, where sickness and disability benefits have provided long-term support for men and women with problems in finding and retaining employment in difficult labour markets. The South Wales Valleys, along with a number of older industrial areas in the North and Scotland and a number of seaside towns, lose most from the DLA reforms. The financial loss in much of southern England, including most of London, is often only a quarter or a third that in the worst hit areas.
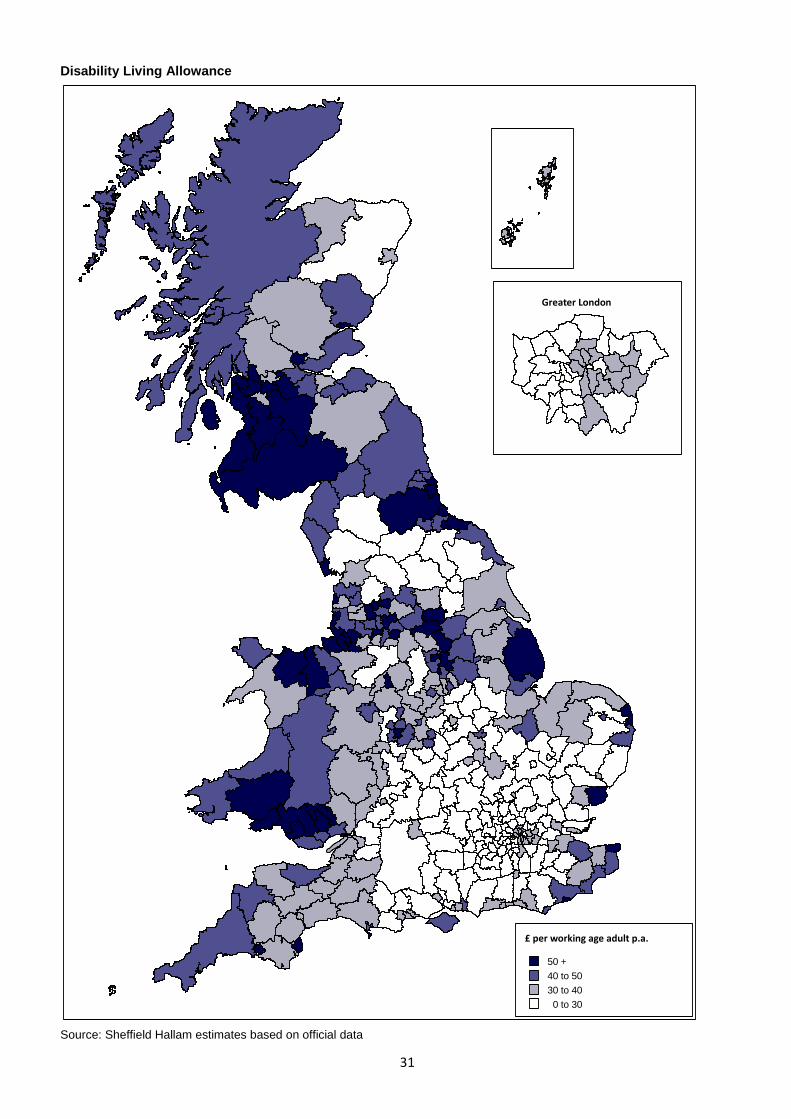
31
Disability Living Allowance
Source: Sheffield Hallam estimates based on official data
50 +
40 to 50
30 to 40
0 to 30
£ per working age adult p.a.
Greater London
32
Incapacity benefits
Incapacity benefits
No of individuals
affected
Estimated loss
£m p.a.
No. of individuals affected
per 10,000
Financial loss per working age adult
£ p.a.
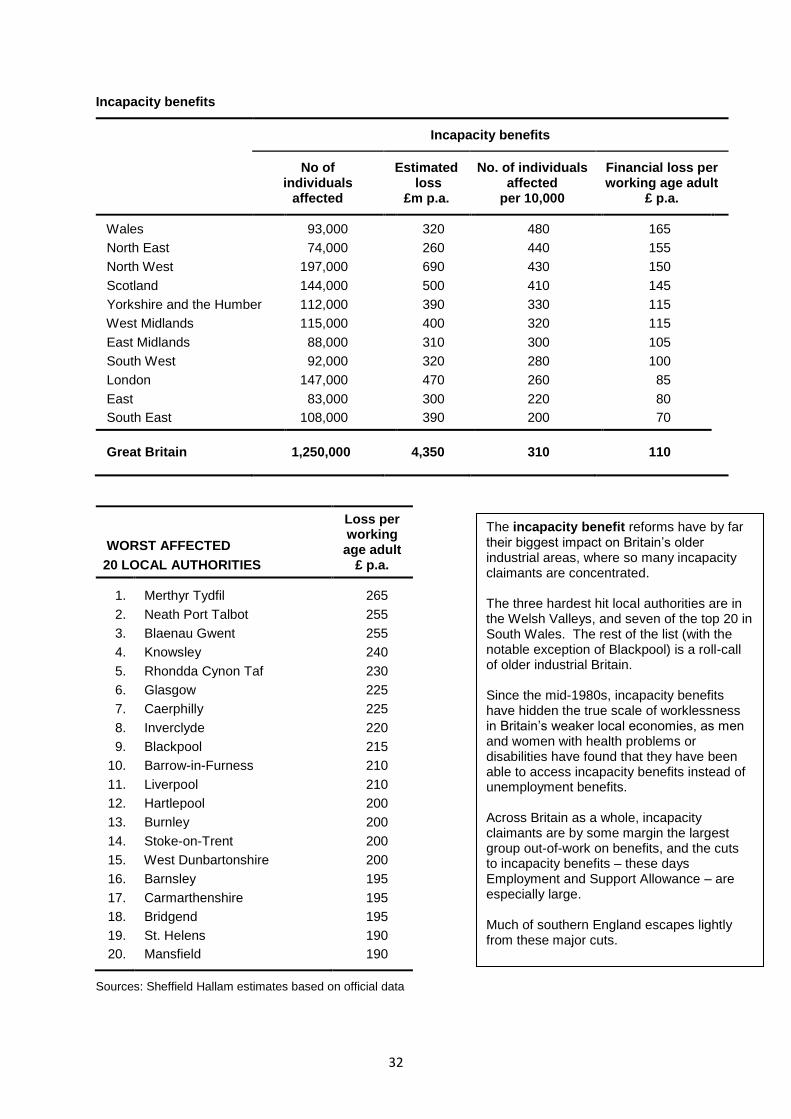
Wales 93,000 320 480 165
North East 74,000 260 440 155
North West 197,000 690 430 150
Scotland 144,000 500 410 145
Yorkshire and the Humber 112,000 390 330 115
West Midlands 115,000 400 320 115
East Midlands 88,000 310 300 105
South West 92,000 320 280 100
London 147,000 470 260 85
East 83,000 300 220 80
South East 108,000 390 200 70
Great Britain 1,250,000 4,350 310 110
WORST AFFECTED
20 LOCAL AUTHORITIES
Loss per working age adult
£ p.a.
1. Merthyr Tydfil 265
2. Neath Port Talbot 255
3. Blaenau Gwent 255
4. Knowsley 240
5. Rhondda Cynon Taf 230
6. Glasgow 225
7. Caerphilly 225
8. Inverclyde 220
9. Blackpool 215
10. Barrow-in-Furness 210
11. Liverpool 210
12. Hartlepool 200
13. Burnley 200
14. Stoke-on-Trent 200
15. West Dunbartonshire 200
16. Barnsley 195
17. Carmarthenshire 195
18. Bridgend 195
19. St. Helens 190
20. Mansfield 190
Sources: Sheffield Hallam estimates based on official data
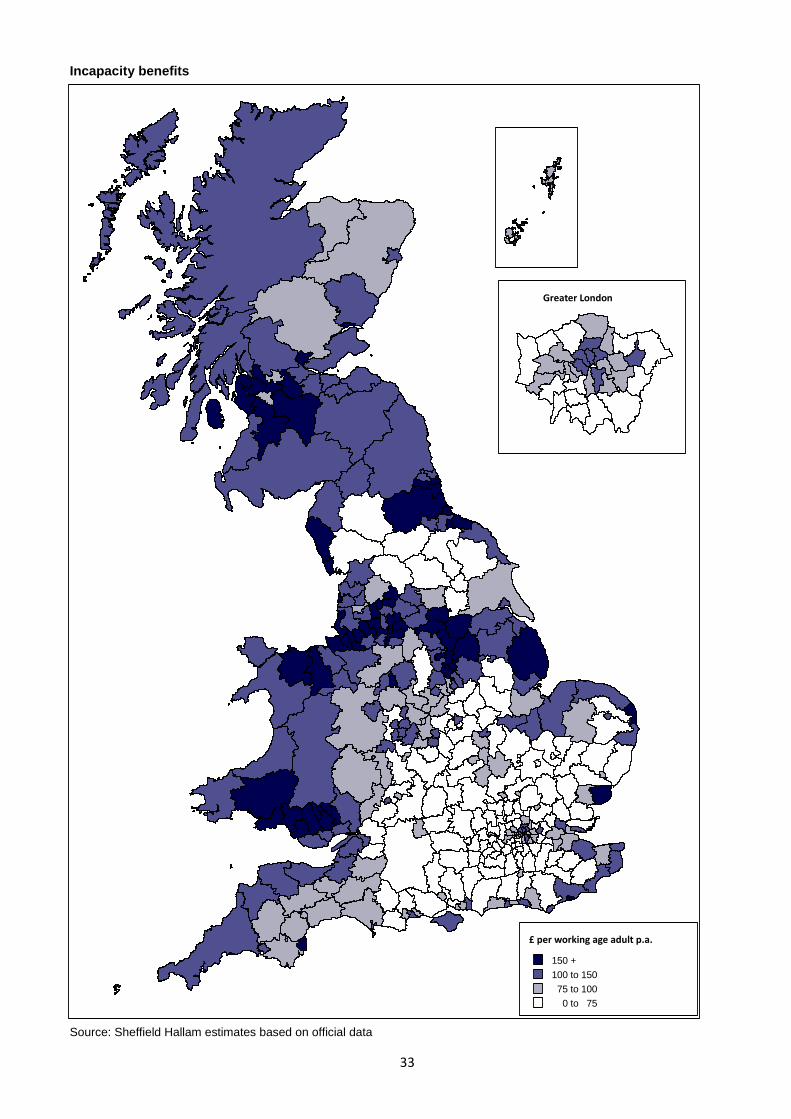
The incapacity benefit reforms have by far their biggest impact on Britain’s older industrial areas, where so many incapacity claimants are concentrated. The three hardest hit local authorities are in the Welsh Valleys, and seven of the top 20 in South Wales. The rest of the list (with the notable exception of Blackpool) is a roll-call of older industrial Britain. Since the mid-1980s, incapacity benefits have hidden the true scale of worklessness in Britain’s weaker local economies, as men and women with health problems or disabilities have found that they have been able to access incapacity benefits instead of unemployment benefits. Across Britain as a whole, incapacity claimants are by some margin the largest group out-of-work on benefits, and the cuts to incapacity benefits – these days Employment and Support Allowance – are especially large. Much of southern England escapes lightly from these major cuts.
33
Incapacity benefits
Source: Sheffield Hallam estimates based on official data
150 +
100 to 150
75 to 100
0 to 75
£ per working age adult p.a.
Greater London
34
Child Benefit
Child Benefit
No of
h'holds affected
Estimated loss
£m p.a.
No. of h'holds affected
per 10,000
Financial loss per working age adult
£ p.a.
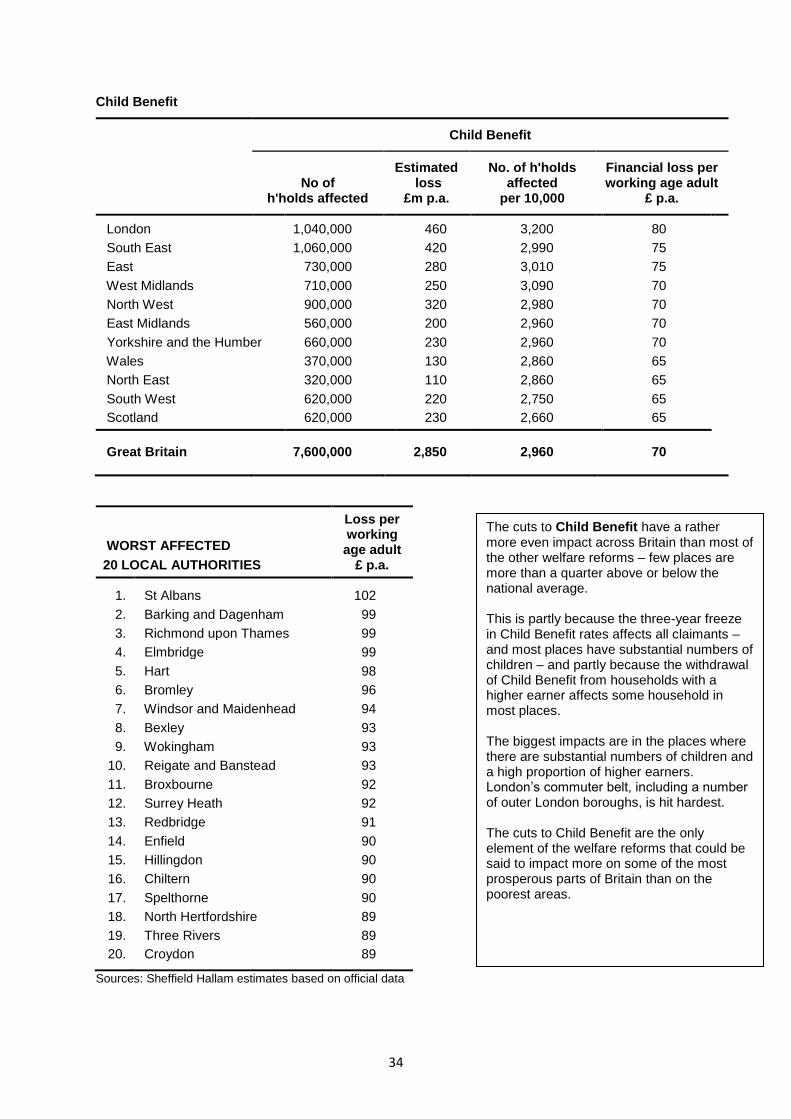
London 1,040,000 460 3,200 80
South East 1,060,000 420 2,990 75
East 730,000 280 3,010 75
West Midlands 710,000 250 3,090 70
North West 900,000 320 2,980 70
East Midlands 560,000 200 2,960 70
Yorkshire and the Humber 660,000 230 2,960 70
Wales 370,000 130 2,860 65
North East 320,000 110 2,860 65
South West 620,000 220 2,750 65
Scotland 620,000 230 2,660 65
Great Britain 7,600,000 2,850 2,960 70
WORST AFFECTED
20 LOCAL AUTHORITIES
Loss per working age adult
£ p.a.
1. St Albans 102
2. Barking and Dagenham 99
3. Richmond upon Thames 99
4. Elmbridge 99
5. Hart 98
6. Bromley 96
7. Windsor and Maidenhead 94
8. Bexley 93
9. Wokingham 93
10. Reigate and Banstead 93
11. Broxbourne 92
12. Surrey Heath 92
13. Redbridge 91
14. Enfield 90
15. Hillingdon 90
16. Chiltern 90
17. Spelthorne 90
18. North Hertfordshire 89
19. Three Rivers 89
20. Croydon 89
Sources: Sheffield Hallam estimates based on official data
The cuts to Child Benefit have a rather more even impact across Britain than most of the other welfare reforms – few places are more than a quarter above or below the national average. This is partly because the three-year freeze in Child Benefit rates affects all claimants – and most places have substantial numbers of children – and partly because the withdrawal of Child Benefit from households with a higher earner affects some household in most places. The biggest impacts are in the places where there are substantial numbers of children and a high proportion of higher earners. London’s commuter belt, including a number of outer London boroughs, is hit hardest. The cuts to Child Benefit are the only element of the welfare reforms that could be said to impact more on some of the most prosperous parts of Britain than on the poorest areas.
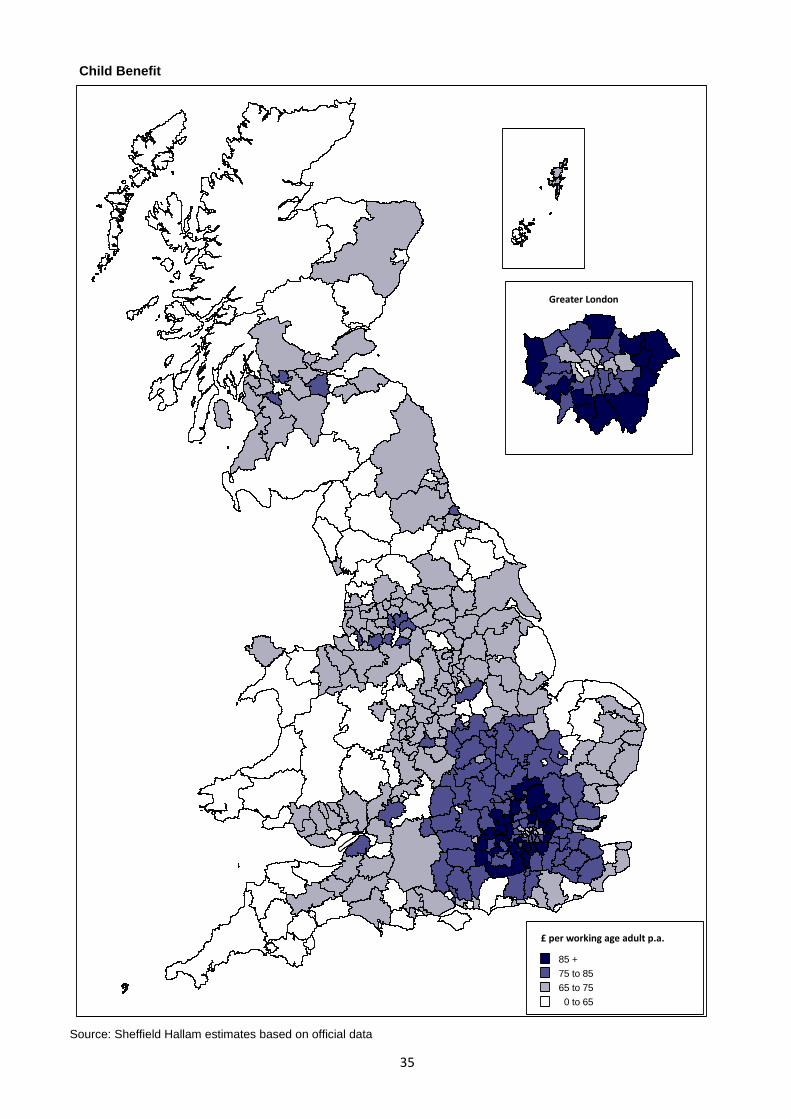
35
Child Benefit
Source: Sheffield Hallam estimates based on official data
85 +
75 to 85
65 to 75
0 to 65
£ per working age adult p.a.
Greater London
36
Tax Credits
Tax Credits
No of
h'holds affected
Estimated loss
£m p.a.
No. of h'holds affected
per 10,000
Financial loss per working age adult
£ p.a.
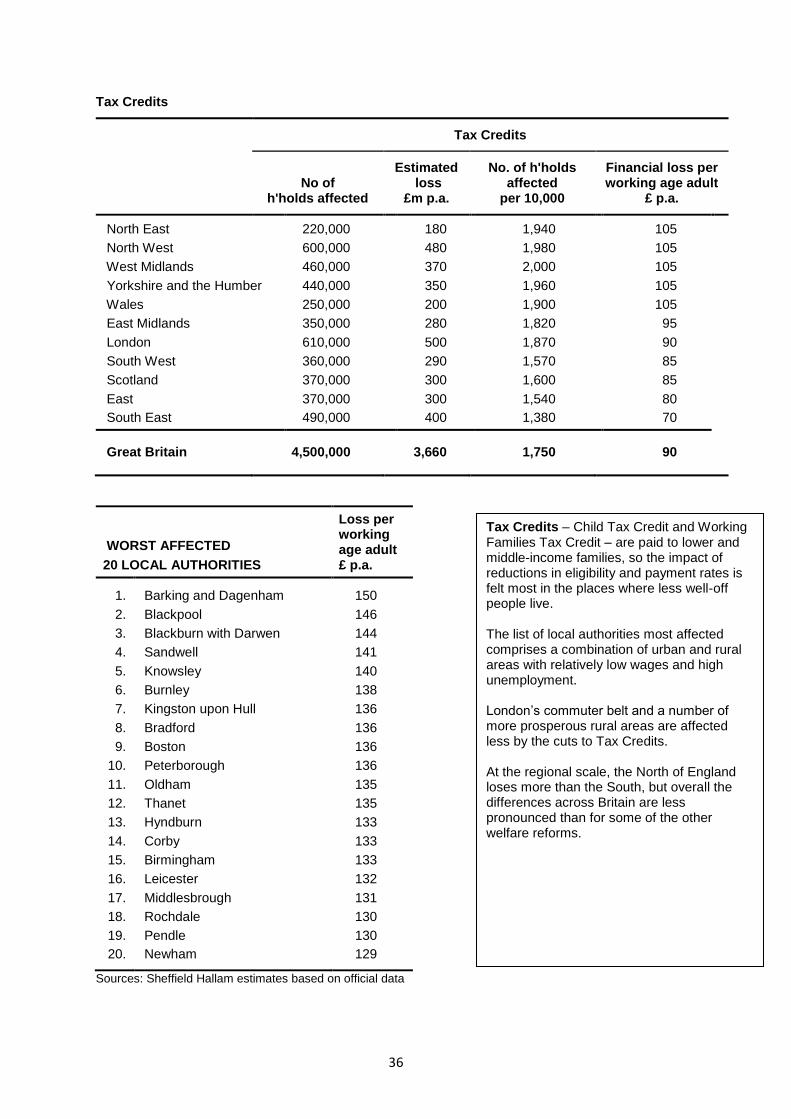
North East 220,000 180 1,940 105
North West 600,000 480 1,980 105
West Midlands 460,000 370 2,000 105
Yorkshire and the Humber 440,000 350 1,960 105
Wales 250,000 200 1,900 105
East Midlands 350,000 280 1,820 95
London 610,000 500 1,870 90
South West 360,000 290 1,570 85
Scotland 370,000 300 1,600 85
East 370,000 300 1,540 80
South East 490,000 400 1,380 70
Great Britain 4,500,000 3,660 1,750 90
WORST AFFECTED
20 LOCAL AUTHORITIES
Loss per working age adult £ p.a.
1. Barking and Dagenham 150
2. Blackpool 146
3. Blackburn with Darwen 144
4. Sandwell 141
5. Knowsley 140
6. Burnley 138
7. Kingston upon Hull 136
8. Bradford 136
9. Boston 136
10. Peterborough 136
11. Oldham 135
12. Thanet 135
13. Hyndburn 133
14. Corby 133
15. Birmingham 133
16. Leicester 132
17. Middlesbrough 131
18. Rochdale 130
19. Pendle 130
20. Newham 129
Sources: Sheffield Hallam estimates based on official data
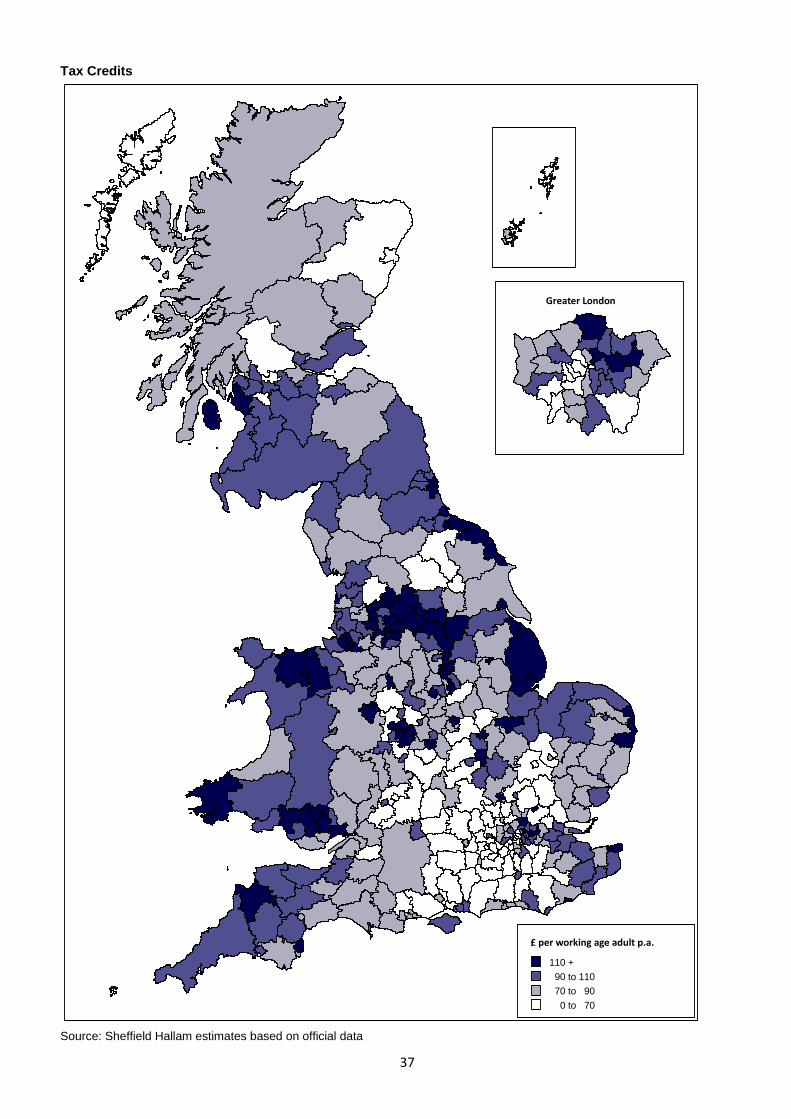
Tax Credits – Child Tax Credit and Working Families Tax Credit – are paid to lower and middle-income families, so the impact of reductions in eligibility and payment rates is felt most in the places where less well-off people live. The list of local authorities most affected comprises a combination of urban and rural areas with relatively low wages and high unemployment. London’s commuter belt and a number of more prosperous rural areas are affected less by the cuts to Tax Credits. At the regional scale, the North of England loses more than the South, but overall the differences across Britain are less pronounced than for some of the other welfare reforms.
37
Tax Credits
Source: Sheffield Hallam estimates based on official data
110 +
90 to 110
70 to 90
0 to 70
£ per working age adult p.a.
Greater London
38
1 per cent uprating
1 per cent uprating
No of
h'holds affected
Estimated loss
£m p.a.
No. of h'holds affected
per 10,000
Financial loss per working age adult
£ p.a.
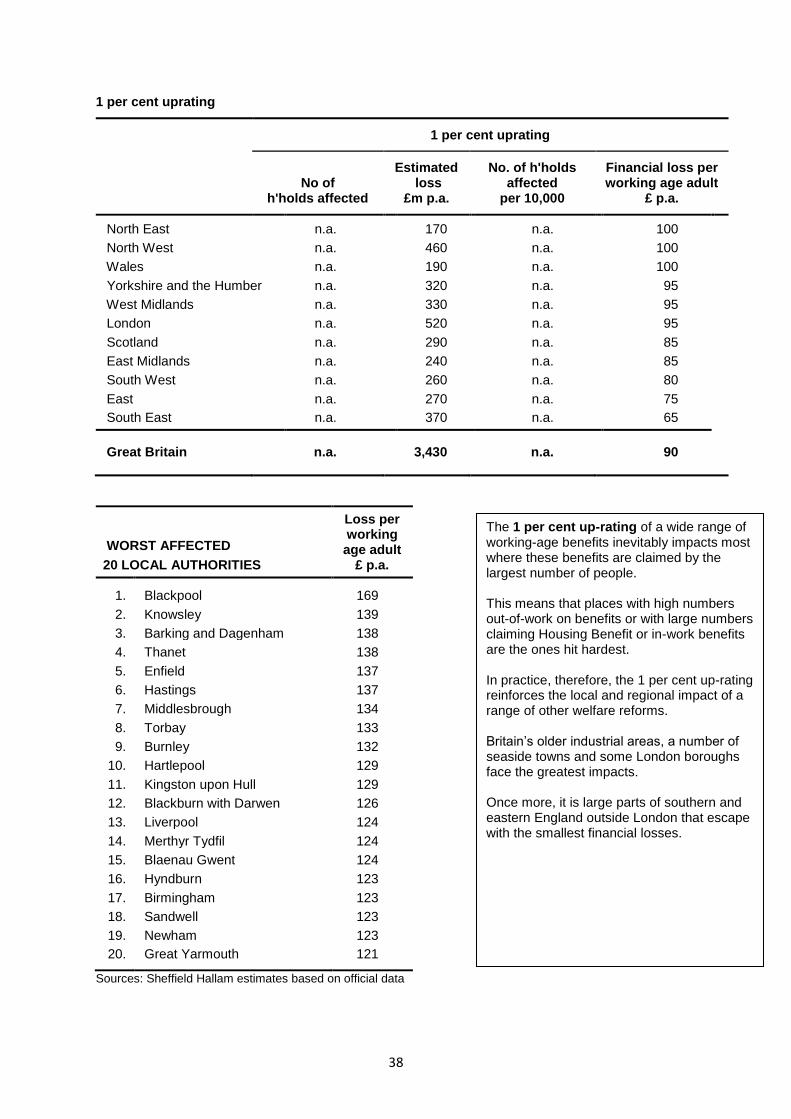
North East n.a. 170 n.a. 100
North West n.a. 460 n.a. 100
Wales n.a. 190 n.a. 100
Yorkshire and the Humber n.a. 320 n.a. 95
West Midlands n.a. 330 n.a. 95
London n.a. 520 n.a. 95
Scotland n.a. 290 n.a. 85
East Midlands n.a. 240 n.a. 85
South West n.a. 260 n.a. 80
East n.a. 270 n.a. 75
South East n.a. 370 n.a. 65
Great Britain n.a. 3,430 n.a. 90
WORST AFFECTED
20 LOCAL AUTHORITIES
Loss per working age adult
£ p.a.
1. Blackpool 169
2. Knowsley 139
3. Barking and Dagenham 138
4. Thanet 138
5. Enfield 137
6. Hastings 137
7. Middlesbrough 134
8. Torbay 133
9. Burnley 132
10. Hartlepool 129
11. Kingston upon Hull 129
12. Blackburn with Darwen 126
13. Liverpool 124
14. Merthyr Tydfil 124
15. Blaenau Gwent 124
16. Hyndburn 123
17. Birmingham 123
18. Sandwell 123
19. Newham 123
20. Great Yarmouth 121
Sources: Sheffield Hallam estimates based on official data
The 1 per cent up-rating of a wide range of working-age benefits inevitably impacts most where these benefits are claimed by the largest number of people. This means that places with high numbers out-of-work on benefits or with large numbers claiming Housing Benefit or in-work benefits are the ones hit hardest. In practice, therefore, the 1 per cent up-rating reinforces the local and regional impact of a range of other welfare reforms. Britain’s older industrial areas, a number of seaside towns and some London boroughs face the greatest impacts. Once more, it is large parts of southern and eastern England outside London that escape with the smallest financial losses.
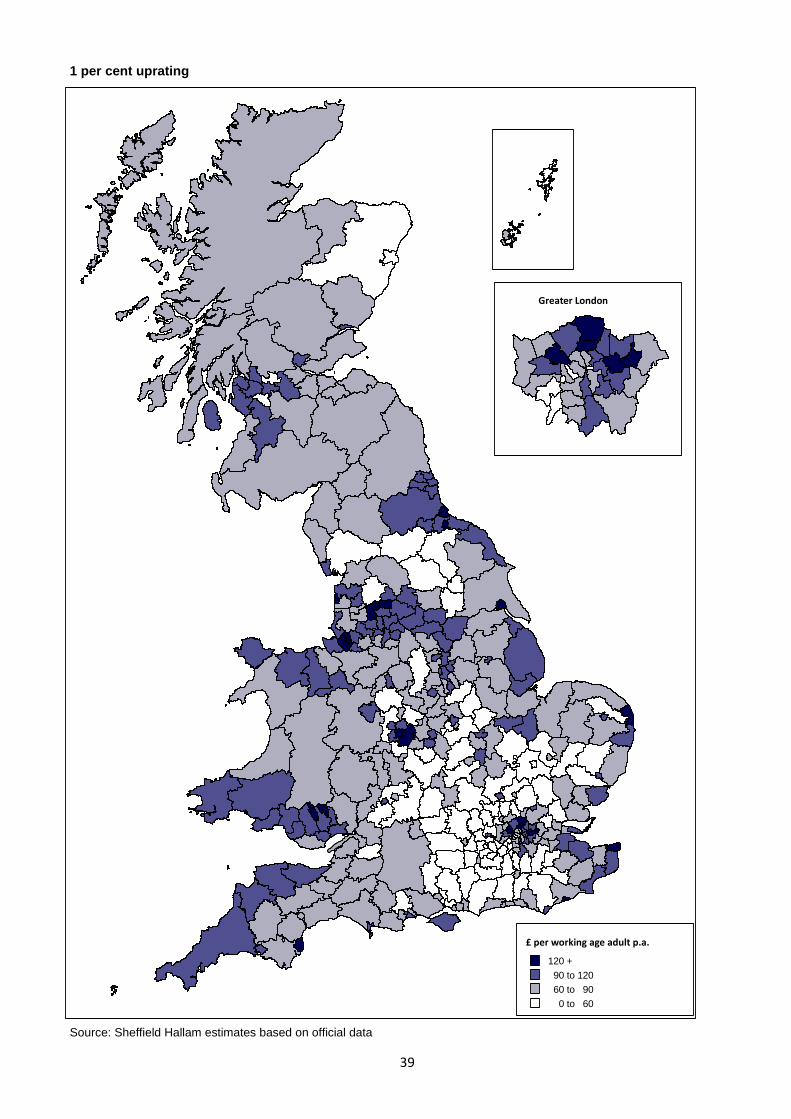
39
1 per cent uprating
Source: Sheffield Hallam estimates based on official data
120 +
90 to 120
60 to 90
0 to 60
£ per working age adult p.a.
Greater London
40
APPENDIX 2: Details of statistical sources and methods
HOUSING BENEFIT: (1) LOCAL HOUSING ALLOWANCE Rules governing assistance with the cost of housing for low-income households in the private rented sector Nature of reforms
Maximum rents set at 30th
percentile of local rents, rather than 50th percentile, from
2011-12
Caps on maximum rents for each property size, with 4-bed limit, from 2011-12
Abolition of £15 excess formerly retained by tenants paying below maximum LHA rent, from 2011-12
Increase age limit for shared room rate from 25 to 35, from January 2012
Switch from 30th percentile rents to CPI indexation for LHA, from 2013-14
Total estimated loss £1,645m a year by 2014-15 (Source: HM Treasury) Methods and data sources
Total loss arising from 30th percentile, size caps and £15 excess (£1040m pa) allocated to local
authorities on the basis of DWP estimates of the number of households affected and the average final loss (Source: DWP Impacts of Housing Benefit proposals: changes to LHA to be introduced in 2011-12)
Loss arising from increase in age limit for shared room rate (£215m pa) allocated to local authorities on the basis of estimates of the numbers losing and average loss per week in each authority (Source: DWP Housing Benefit equality impact assessment: increasing the shared accommodation rate age threshold to 35)
Loss arising from CPI indexation (£390m pa) allocated to local authorities on the basis of the number of Housing Benefit claims in the private rented sector in each authority in August 2012 (Source: DWP)
Number of affected households based on number of Housing Benefit claimants in August 2012 in the private rented sector in each authority and the national share receiving LHA (Source: DWP). NB All LHA recipients affected by shift to CPI indexation.
HOUSING BENEFIT: (2) UNDER-OCCUPATION
New rules governing the size of properties for which payments are made to working age claimants in the social rented sector (council and housing association) Nature of the reform
Limit Housing Benefit payments to working-age households in social rented accommodation to a level reflecting the number of bedrooms justified by the size and age composition of the household, from 2013-14
41
Total estimated loss £490m a year by 2014-15 (Source: HM Treasury) Methods and data sources
Estimated number of households affected in each region (Source: DWP Impact Assessment Housing Benefit: under-occupation of social housing, June 2012 update) allocated by region to each local authority on the basis of the number in social housing claiming Housing Benefit in August 2012 (Source: DWP)
Financial loss allocated to each local authority on the basis of estimated number of affected households (see above) and estimated average loss per claimant in each region (Source: DWP Impact Assessment, June 2012 update)
NON-DEPENDANT DEDUCTIONS Deductions from Housing Benefit, Council Tax Benefit and other income-based benefits to reflect the contribution that non-dependant household members are expected to make towards the household’s housing costs. Nature of reform
Up-rating the deductions in stages between April 2011 and April 2014 to reflect growth in rents and increases in Council Tax since 2001, when the deductions were frozen, and subsequent link to prices
Total estimated loss £340m a year by 2014-15 (Source: HM Treasury) Methods and data sources
Estimated 300,000 claimants affected (Source: DWP Equality Impact Assessment: income-related benefits: changes to the non-dependent deduction rates) allocated on the basis of the number of Housing Benefit and Council Tax Benefit claimants in each local authority in August 2012 (Source: DWP).
Financial loss allocated to local authorities on the basis of the estimated numbers affected (see above)
HOUSEHOLD BENEFIT CAP
New ceiling on total payments per household applying to wide range of benefits, including Child Benefit, Child Tax Credit, Employment and Support Allowance, Housing Benefit, Incapacity Benefit, Income Support and Jobseeker’s Allowance Nature of reforms
Total household benefit payments for working-age claimants capped so that workless households receive no more in benefit than the average weekly wage, after tax and national insurance, from 2013-14, administered through Housing Benefit payments

42
Total estimated loss £270m a year by 2014-15 (Source: HM Treasury) Methods and data sources
Loss allocated to local authorities on the basis of the number of individuals in each authority in receipt of a letter notifying them that they may be affected by the benefit cap (Source: DWP)
National total of 56,000 households expected to be capped in 2013/14 (Source: DWP Benefit Cap (Housing Benefit regulations 2012): impact assessment for the benefit cap) allocated to local authorities in proportion to letters of notification.
COUNCIL TAX BENEFIT Paid to households on low incomes to offset Council Tax bills, in whole or in part Nature of the reform
10 per cent reduction in expenditure by HM Treasury and transfer of responsibility for the scheme to local authorities, from 2013-14.
Reduction in entitlement only permitted for working-age households; entitlement of pensioner households fully protected.
Some local authorities in England have chosen not to pass on the reduction to claimants, in whole or in part, absorbing the cut within their budget. In Scotland and Wales the devolved administrations have made arrangements that avoid the reduction falling on claimants.
Total estimated loss £490m a year by 2014-15 (Source: HM Treasury) of which an estimated £340m a year is being passed on to claimants Methods and data sources
Number of households affected and average weekly loss, by authority, from statistics assembled by the New Policy Institute, as updated on 7
th February 2013 at www.npi.org.uk. The NPI
calculations are based on information assembled from each local authority.
The NPI data shows that some local authorities in England have chosen not to pass on the benefit reduction to claimants, in whole or in part, absorbing the cut elsewhere within their budget. In Scotland and Wales the devolved administrations have not passed on the cut to local authorities, thereby avoiding any impact on claimants.
Where the NPI identifies only ‘minor changes’ the impact has been set to zero. DISABILITY LIVING ALLOWANCE Payments intended to help offset the additional financial costs faced by individuals of all ages with disabilities, including those both in and out of work Nature of reform
Phased replacement of Disability Living Allowance (DLA) for working-age claimants by Personal Independence Payments (PIP), from 2013-14
43
Introduction of more stringent medical test and regular re-testing
Reduction in number of payment categories Total estimated loss £1,500m a year by 2017-18 (Source: DWP Impact Assessment Disability Living Allowance reform, adjusted for inflation and revised implementation timetable) Methods and data sources
Anticipated reduction in national caseload of working age to 1.7m (Source: DWP Impact Assessment) represents a 23 per cent reduction in anticipated numbers in absence of reform
Numbers affected refer to the 23 per cent reduction in claimants, allocated on the basis of stock of working age DLA claimants in each local authority in February 2012 (Source: DWP). Additionally, a number of claimants in receipt of PIP instead of DLA may experience a reduction in payment.
Financial loss allocated to each local authority on basis of reduction in claimant numbers (see above)
INCAPACITY BENEFITS Out-of-work payments to men and women of working age with health problems or disabilities, including Employment and Support Allowance (ESA) and its predecessors Incapacity Benefit, Income Support on grounds of disability, and Severe Disablement Allowance Nature of reforms
Introduction of ESA for new claimants and a new, tougher medical test (the Work Capability Assessment), from October 2008
Applying the Work Capability Assessment to existing incapacity claimants from autumn 2010 onwards, and migration to ESA if not deemed ‘fit for work’
Time-limiting to 12 months non-means tested entitlement for ESA Work Related Activity Group, from 2012-13
New conditionality for ESA Work Related Activity Group Total estimated loss £4,350m a year by 2015-16, comprising:
£2,600m a year from time limiting of non-means tested entitlement (Source: HM Treasury estimates for 2014-15, revised to take account of inflation and additional numbers affected by 2015-16)
c. £1,750m a year from remaining measures (see below)
Methods and data sources
By 2015-16, an estimated 700,000 will be affected by time limiting non-means tested ESA entitlement. Of these, 40 per cent are anticipated to lose benefit entirely and the remaining 60 per cent will experience a reduction in payment (Source: DWP Impact Assessment Time limit contributory Employment and Support Allowance to one year for those in the Work-Related Activity Group).
By 2014 an additional 550,000 are estimated to be denied ESA by other elements of the reforms, of which 30 per cent will not claim alternative benefits (Source: Beatty and Fothergill 2011,
44
Incapacity benefit reform: the local regional and national impact, CRESR, Sheffield Hallam University).
Numbers affected by local authority allocated on the basis of methods in Beatty and Fothergill (2011) based primarily on DWP claimant data, DWP impact assessments and DWP evidence from pilot areas.
Financial loss arising from time limiting allocated in 3:1 ratio between those losing benefit entirely and those retaining benefit at reduced rate, on the basis of estimated numbers in each group by local authority.
Financial loss arising from other elements of the reforms estimated to be two-thirds that arising from time limiting, given of numbers affected and proportion expected to be denied benefits. (Treasury or DWP estimates have not been published). Loss allocated in 2:1 ratio between those denied benefit entirely and those claiming other benefits at a lower rate, on the basis of estimated numbers in each group by local authority.
CHILD BENEFIT Paid to households on the basis of the number of children up to age 16 or, if they remain at school or in further education, up to 19 Nature of reforms
Freeze benefit rates for three years from 2011-12, instead of up-rate with inflation
Withdrawal of benefit from households including a higher earner (threshold at £50,000 and taper to £60,000), from January 2013
Total estimated loss £2,845m a year by 2014-15 (Source: HM Treasury) Methods and data sources
Numbers of families in receipt of Child Benefit, by local authority in August 2011, from HMRC (Source: HMRC Child Benefit Statistics: geographical analysis). NB All recipients affected by freeze.
Financial loss arising from freeze (£975m pa) allocated on basis of number of families in receipt of Child Benefit in each local authority (see above)
Financial loss arising from withdrawal of benefit from high earners (£1,870m pa) allocated on basis of number of families in receipt of Child Benefit multiplied by an index of median earnings in the three years 2010, 2011 and 2012 of residents in each local authority relative to the UK average (Source: Annual Survey of Hours and Earnings). County averages used where earnings data for districts is unavailable.
TAX CREDITS Payments through the tax system of Child Tax Credit (CTC) and Working Families Tax Credit (WFTC) to lower and middle income households Nature of reforms
Adjustments to thresholds, withdrawal rates, supplements, income disregards and backdating provisions, from 2011-12 onwards
45
Changes in indexation and up-rating, from 2011-12 onwards
Reductions in childcare element of WFTC, from 2011-12
Increase in working hours requirement for WFTC, from 2012-13 Total estimated loss £3,660m (net) a year by 2014-15 (Source: HM Treasury) Methods and data sources
Overall loss allocated on the basis of the total number of families in receipt of CTC or WFTC in December 2012, by local authority (Source: HMRC Child and Working Tax Credits Statistics: geographical analysis)
All families in receipt of CTC or WFTC affected by one or more of the changes 1 PER CENT UP-RATING Annual up-rating of value of benefits Nature of reform
1 per cent up-rating (instead of by CPI) for three years from 2013-14 for main working-age benefits, and for two years from 2014-15 for Child Benefit and for Local Housing Allowance within Housing Benefit
Total estimated loss £3,430m a year by 2015-16 (Source: HM Treasury) Methods and data sources
Total loss divided equally between DWP-administrated benefits and HMRC-administrated benefits (Child Benefit, CTC, WFTC), reflecting split of overall expenditure on relevant benefits (Sources: DWP and HMRC)
HMRC benefits loss allocated on basis of total number of families in receipt of CTC or WFTC in December 2012, (Source: HMRC Child and Working Tax Credits: geographical analysis)
DWP benefits loss divided 75:25 between working age benefits and Housing Benefit, reflecting split of overall expenditure on relevant benefits (Source: DWP)
DWP working age benefits loss allocated on basis of non-employed working age benefit numbers in February 2012, by local authority (Source: DWP)
Housing Benefit loss allocated on basis of estimated expenditure on claimants in the private rented sector, by local authority, derived from overall Housing Benefit expenditure data for 2011/12 and share of claimants in the private rented sector in August 2012 (Sources: DWP)