estimating the magnitude of the 100-year peak flow in the
TRANSCRIPT
DOE/ID–22181
ESTIMATING THE MAGNITUDE OF THE 100-YEAR PEAK FLOW IN THE BIG LOST RIVERAT THE IDAHO NATIONAL ENGINEERINGAND ENVIRONMENTAL LABORATORY,IDAHO
Prepared in cooperation withU.S. DEPARTMENT OF ENERGY
U.S. GEOLOGICAL SURVEYWater-Resources Investigations Report 02–4299
Estimating the Magnitude of the 100-Year Peak Flow in the Big Lost River at the Idaho National Engineering and Environmental Laboratory, Idaho By Jon E. Hortness and Joseph P. Rousseau
Water-Resources Investigations Report 02–4299
Prepared in cooperation with the U.S. DEPARTMENT OF ENERGY
Idaho Falls, Idaho 2003

U.S. DEPARTMENT OF THE INTERIOR GALE A. NORTON, Secretary
U.S. GEOLOGICAL SURVEY Charles G. Groat, Director
Any use of firm, trade, and brand names in this report is for identification purposes only and does not constitute endorsement by the U.S. Government.
Additional information can be obtained from:
U.S. Geological Survey INEEL, MS 1160 P.O. Box 2230 Idaho Falls, ID 83403-2230
Copies of this report can be purchased from:
U.S. Geological Survey Information Services Box 25286 Federal Center Denver, CO 80225 e-mail: [email protected]
Copies of this report also are available in PDF format, which can be viewed using Adobe Acrobat Reader at URL:
http://idaho.usgs.gov/public/reports.html

CONTENTS
Abstract . . . . . . . . . . . . . . . . . . . . . . . . . . . . . . . . . . . . . . . . . . . . . . . . . . . . . . . . . . . . . . . . . . . . . . . . . . . . . . . . . 1 Introduction . . . . . . . . . . . . . . . . . . . . . . . . . . . . . . . . . . . . . . . . . . . . . . . . . . . . . . . . . . . . . . . . . . . . . . . . . . . . . . 2
Purpose and scope . . . . . . . . . . . . . . . . . . . . . . . . . . . . . . . . . . . . . . . . . . . . . . . . . . . . . . . . . . . . . . . . . . . . . . 2 Description of the study area. . . . . . . . . . . . . . . . . . . . . . . . . . . . . . . . . . . . . . . . . . . . . . . . . . . . . . . . . . . . . . 2 Previous investigations . . . . . . . . . . . . . . . . . . . . . . . . . . . . . . . . . . . . . . . . . . . . . . . . . . . . . . . . . . . . . . . . . . 4
Historical peak flows . . . . . . . . . . . . . . . . . . . . . . . . . . . . . . . . . . . . . . . . . . . . . . . . . . . . . . . . . . . . . . . . . . . . . . . 5 Explanation of data . . . . . . . . . . . . . . . . . . . . . . . . . . . . . . . . . . . . . . . . . . . . . . . . . . . . . . . . . . . . . . . . . . . . . . . . 5
Gaging-station data . . . . . . . . . . . . . . . . . . . . . . . . . . . . . . . . . . . . . . . . . . . . . . . . . . . . . . . . . . . . . . . . . . . . . 5 Adjusted peak-flow data . . . . . . . . . . . . . . . . . . . . . . . . . . . . . . . . . . . . . . . . . . . . . . . . . . . . . . . . . . . . . . . . . 8 Estimation of error (confidence limits) . . . . . . . . . . . . . . . . . . . . . . . . . . . . . . . . . . . . . . . . . . . . . . . . . . . . . . 9
Estimation of the 100-year peak flow . . . . . . . . . . . . . . . . . . . . . . . . . . . . . . . . . . . . . . . . . . . . . . . . . . . . . . . . . . 9 Howell Ranch to Mackay Reservoir . . . . . . . . . . . . . . . . . . . . . . . . . . . . . . . . . . . . . . . . . . . . . . . . . . . . . . . . 9 Mackay Reservoir . . . . . . . . . . . . . . . . . . . . . . . . . . . . . . . . . . . . . . . . . . . . . . . . . . . . . . . . . . . . . . . . . . . . . . 12 Mackay Reservoir to Arco . . . . . . . . . . . . . . . . . . . . . . . . . . . . . . . . . . . . . . . . . . . . . . . . . . . . . . . . . . . . . . . 13 Arco to the Idaho National Engineering and Environmental Laboratory . . . . . . . . . . . . . . . . . . . . . . . . . . . . 15
Other considerations . . . . . . . . . . . . . . . . . . . . . . . . . . . . . . . . . . . . . . . . . . . . . . . . . . . . . . . . . . . . . . . . . . . . . . . 17 Effects of rainfall events . . . . . . . . . . . . . . . . . . . . . . . . . . . . . . . . . . . . . . . . . . . . . . . . . . . . . . . . . . . . . . . . . 17 Possible earthquake effects . . . . . . . . . . . . . . . . . . . . . . . . . . . . . . . . . . . . . . . . . . . . . . . . . . . . . . . . . . . . . . . 19
Summary . . . . . . . . . . . . . . . . . . . . . . . . . . . . . . . . . . . . . . . . . . . . . . . . . . . . . . . . . . . . . . . . . . . . . . . . . . . . . . . . 21 References cited. . . . . . . . . . . . . . . . . . . . . . . . . . . . . . . . . . . . . . . . . . . . . . . . . . . . . . . . . . . . . . . . . . . . . . . . . . . 22 Appendix 1. Calculations used in determining the 100-year peak-flow estimates and 95-percent
confidence intervals and limits at specified locations along the Big Lost River, Idaho . . . . . . . . . . . . . . . . . 27 Appendix 2. Annual peak-flow data and data adjustments for flow in the Big Lost River at the
Howell Ranch gaging station (13120500) and the gaging stations above Mackay Reservoir (13125500) for 40 corresponding years of record . . . . . . . . . . . . . . . . . . . . . . . . . . . . . . . . . . . . . . . . . . . . . 33
Appendix 3. Annual peak-flow data and data adjustments for flow in the Big Lost River at the gaging stations below Mackay Reservoir (13127000) and near Arco (13132500) for 51 corresponding years of record. . . . . . . . . . . . . . . . . . . . . . . . . . . . . . . . . . . . . . . . . . . . . . . . . . . . . . . . . . . . . 34
Appendix 4. Annual maximum daily mean flow in the Big Lost River at the gaging stations near Arco (13132500), at Idaho National Engineering and Environmental Laboratory (INEEL) diversion at head (13132513), and below INEEL diversion (13132520) for 8 corresponding years of record. . . . . . . . . . . . . . . . . . . . . . . . . . . . . . . . . . . . . . . . . . . . . . . . . . . . . . . . . . . . . . . . . . . . . . . . . 36
FIGURES
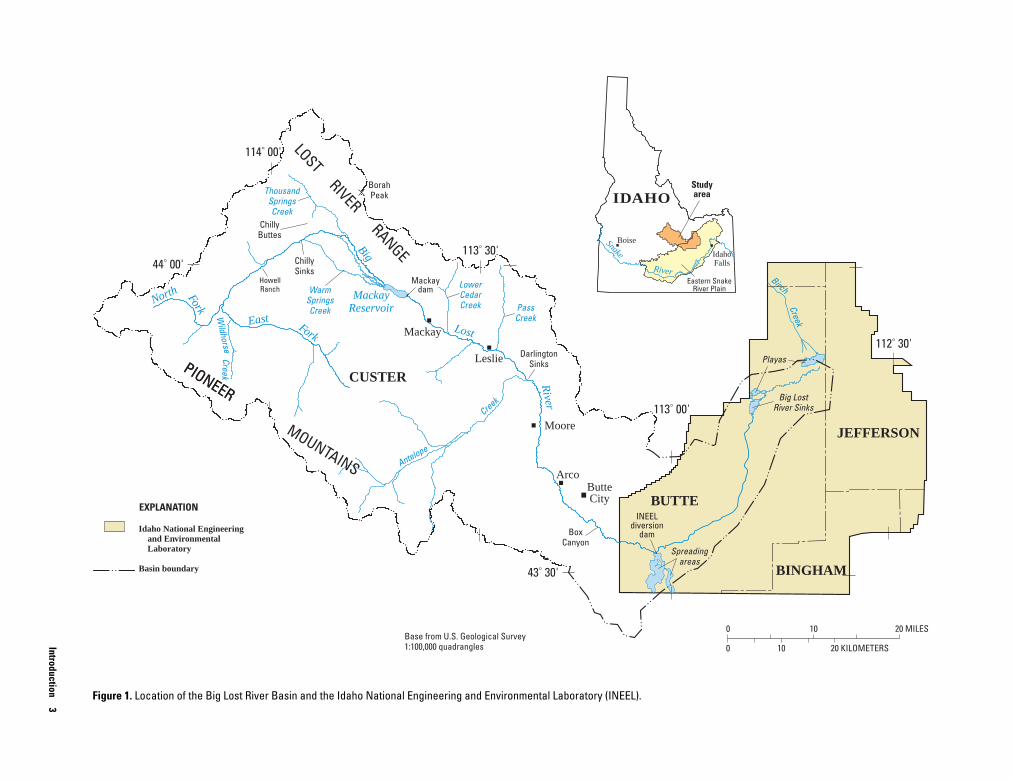
1. Map showing location of the Big Lost River Basin and the Idaho National Engineering and Environmental Laboratory (INEEL) . . . . . . . . . . . . . . . . . . . . . . . . . . . . . . . . . . . . . . . . . . . . . . . . . . . 3
2. Map showing location of gaging stations used in estimating peak flows of the Big Lost River, Idaho . . . . . . . . . . . . . . . . . . . . . . . . . . . . . . . . . . . . . . . . . . . . . . . . . . . . . . . . . . . . . . . . . . . . . . 6
3–11. Graphs showing: 3. Bulletin 17B flood-frequency curve and 95-percent confidence limits for Big Lost
River at Howell Ranch (13120500), Idaho. . . . . . . . . . . . . . . . . . . . . . . . . . . . . . . . . . . . . . . . . . 8 4. Attenuation of peak flows in the Big Lost River between Howell Ranch (13120500)
and above Mackay Reservoir (13125500) as a function of peak flows at Howell Ranch, Idaho. . . . . . . . . . . . . . . . . . . . . . . . . . . . . . . . . . . . . . . . . . . . . . . . . . . . . . . . . . . . . . . . . 10
Contents iii

5. Annual peak flows in the Big Lost River above Mackay Reservoir (13125500) as a function of annual peak flows in the Big Lost River at Howell Ranch (13120500), Idaho. . . . . . . . . . . . . . . . . . . . . . . . . . . . . . . . . . . . . . . . . . . . . . . . . . . . . . . . . . . . . . . . . . . . . . . 11
6. Attenuation of peak flows in the Big Lost River between below Mackay Reservoir (13127000) and near Arco (13132500) as a function of peak flows below Mackay Reservoir, Idaho . . . . . . . . . . . . . . . . . . . . . . . . . . . . . . . . . . . . . . . . . . . . . . . . . . . . . . . . . . . . . . 14
7. Annual peak flows in the Big Lost River near Arco (13132500) as a function of annual peak flows in the Big Lost River below Mackay Reservoir (13127000), Idaho . . . . . . . . . . . . . . . . . . . . . . . . . . . . . . . . . . . . . . . . . . . . . . . . . . . . . . . . . . . . 15
8. Attenuation of peak flows in the Big Lost River between near Arco (13132500) and below Idaho National Engineering and Environmental Laboratory (INEEL) diversion (13132520) and diversion at head (13132513) as a function of annual maximum daily mean flows near Arco, Idaho . . . . . . . . . . . . . . . . . . . . . . . . . . . . . . . . . . . . . . . . . . . . . . . 17
9. Combined maximum daily mean flows in the Big Lost River below Idaho National Engineering and Environmental Laboratory (INEEL) diversion (13132520) and INEEL diversion at head (13132513) as a function of annual maximum daily mean flows in the Big Lost River near Arco (13132500), Idaho. . . . . . . . . . . . . . . . . . . . . . . . . . . . . . 18
10. Daily mean flows in the Big Lost River at Howell Ranch (13120500) during the 30-day period immediately preceding and following the Borah Peak, Idaho, earthquake on October 28, 1983 . . . . . . . . . . . . . . . . . . . . . . . . . . . . . . . . . . . . . . . . . . . . . . . . . . . . . . . . . . . 19
11. Daily mean flows in the Big Lost River below Mackay Reservoir (13127000) and near Arco (13132500) preceding and following the Borah Peak, Idaho, earthquake on October 28, 1983 . . . . . . . . . . . . . . . . . . . . . . . . . . . . . . . . . . . . . . . . . . . . . . . . . . . . . . . . . . . 20
TABLES
1. Station and Bulletin 17B flood-frequency information for streamflow-gaging stations used in estimating the 100-year peak flow in the Big Lost River, Idaho . . . . . . . . . . . . . . . . . . . . . . . . . . . 7
2. Estimated 100-year peak flows in the Big Lost River at Howell Ranch and above Mackay Reservoir, Idaho . . . . . . . . . . . . . . . . . . . . . . . . . . . . . . . . . . . . . . . . . . . . . . . . . . . . . . . . . . . . . . . . . . 12
3. Estimated 100-year peak flows in the Big Lost River below Mackay Reservoir and near Arco, Idaho . . . . . . . . . . . . . . . . . . . . . . . . . . . . . . . . . . . . . . . . . . . . . . . . . . . . . . . . . . . . . . . . . . . . . . 16
4. Comparisons of same-event annual maximum daily mean flows in the Big Lost River near Arco with those in the Big Lost River near the Idaho National Engineering and Environmental Laboratory (INEEL) diversion dam, Idaho . . . . . . . . . . . . . . . . . . . . . . . . . . . . . . . . . . . . . . . . . . . . . . 16
5. Comparisons of final estimates of the 100-year peak flow and 95-percent confidence limits for the Big Lost River at the Idaho National Engineering and Environmental Laboratory (INEEL), Idaho . . . . . . . . . . . . . . . . . . . . . . . . . . . . . . . . . . . . . . . . . . . . . . . . . . . . . . . . . . . . . . . . . . . 18
iv Estimating the Magnitude of the 100-Year Peak Flow, Big Lost River, INEEL, Idaho

CONVERSION FACTORS AND VERTICAL DATUM
Multiply By To obtain
acre 0.004047 square kilometer (km2) acre-foot (acre-ft) 1,233 cubic meter (m3)
cubic foot per second (ft3/s) 0.02832 cubic meter per second (m3/s) cubic foot per second per mile [(ft3/s)/mi] 0.0176 cubic meter per second per kilometer [(m3/s)/km]
foot (ft) 0.3048 meter (m) foot per mile (ft/mi) 0.1894 meter per kilometer (m/km)
inch (in.) 2.54 centimeter (cm) mile (mi) 1.609 kilometer (km)
square mile (mi2) 2.590 square kilometer (km2)
Sea Level: In this report “sea level” refers to the National Geodetic Vertical Datum of 1929—a geodetic datum derived from a general adjustment of the first-order level nets of the United States and Canada, formerly called Sea Level Datum of 1929.
Contents v

Estimating the Magnitude of the 100-Y
ear Peak
Flow in the Big Lost River at the Idaho National
Engineering and Environmental Laboratory
, Idaho
By
Jon E. Hortness
and
Joseph P
. Rousseau
AbstractAbstract.
Accurate estimates of peak flows in the Big Lost River at the Idaho National Engineering and Environmental Laboratory (INEEL) are needed to assist planners and managers with evaluating pos-sible effects of flooding on facilities at the INEEL. A large difference of 4,350 cubic feet per second (ft3/s) between two previous estimates of the mag-nitude of the 100-year peak flow in the Big Lost River near the western boundary of the INEEL prompted the present study.
Regression models that compared annual peak flows and attenuation of annual peak flows between successive gaging stations for the same flow event were used to estimate the magnitude of the 100-year peak flow in the Big Lost River. The 100-year peak flow of 4,790 ft3/s at the Howell Ranch gaging station was used as the starting point for this analysis. This estimate was determined by using a three-parameter log-Pearson Type III dis-tribution as outlined in “Guidelines for Determin-ing Flood Flow Frequency” (Bulletin 17B by the Interagency Advisory Committee on Water Data).
The regression models indicated that, in the reach of the Big Lost River between Howell Ranch and Mackay Reservoir, downstream peak flows are lower than upstream peak flows. Peak-flow attenu-ation values for this reach of the river decreased nonlinearly as the magnitude of the peak flow increased. Extrapolation of the trend resulted in an attenuation estimate of 13 percent for this reach relative to the 100-year peak flow at the Howell Ranch gaging station.
In the lower reach of the Big Lost River between Mackay Reservoir and Arco, downstream peak flows are also lower than upstream peak flows. However, in contrast to the upper reach,
peak-flow attenuation values decreased linearly as the magnitude of the peak flow increased. Extrapo-lation of the data indicated that peak-flow attenua-tions in this reach of the river approach zero for flows approaching the 100-year peak-flow esti-mate immediately upstream and downstream from Mackay Reservoir.
A regression model of annual maximum daily mean flows between Arco and the INEEL diver-sion dam indicated that the attenuation values in this reach of the river are nearly the same for all flows of record. Extrapolation of the linear regres-sion of these values resulted in an attenuation esti-mate of 10 percent. Seepage measurements made during 1951 – 53 also resulted in a loss estimate of approximately 10 percent. This attenuation value, combined with the values from analyses of the upstream reaches, resulted in an estimate of the 100-year peak flow for the Big Lost River immedi-ately upstream from the INEEL diversion dam of 3,750 ft3/s; upper and lower 95-percent confidence limits were 6,250 ft3/s and 1,300 ft3/s, respectively.
Localized rainfall, even of high intensity, is not likely to produce large peak flows at the INEEL because of high loss rates (infiltration, bank storage, and channel storage) along much of the stream channel. The relatively short flow dura-tions resulting from rainstorms historically have not provided sufficient volumes of water to satisfy local storage demands (bank and channel storage). Only after these storage demands are met do the loss rates decrease enough for significant peak flows to reach the INEEL site.
An uncertain component of the present analy-sis is the effect of seismic activity on the 100-year peak-flow estimate. Analysis of the effect of the magnitude 7.3 Borah Peak earthquake in 1983 on
Abstract 1
normal flow conditions in the Big Lost River sug-gests that the joint occurrence of a large earth-quake and a 100-year peak flow could significantly increase the magnitude of the peak flow at the INEEL.
INTRODUCTIONIntroduction.
The Big Lost River flows onto the Idaho National Engineering and Environmental Laboratory (INEEL) site and the eastern Snake River Plain southeast of Arco, Idaho (fig. 1), and then northward across the INEEL where it terminates in a series of playas and sinks. Although flooding at the INEEL is rare, it is important to accurately define these rare flood events to assist planners and managers with evaluating the effects that flooding may have on facilities at the INEEL.
The Bureau of Reclamation (BOR) and the U.S. Geological Survey (USGS), in cooperation with the U.S. Department of Energy (DOE), recently conducted two separate studies to estimate the 100-year peak flow for the Big Lost River near the western boundary of the INEEL. The 100-year peak flow refers to the 100-year recurrence interval (1-percent annual exceedance prob-ability) peak discharge. The estimates for the 100-year peak flow ranged from 2,910 ft3/s in the BOR study (Ostenaa and others, 1999) to 7,260 ft3/s in the USGS study (Kjelstrom and Berenbrock, 1996). The present study was conducted by the USGS, in cooperation with DOE, to help resolve the large difference in the earlier estimates of the 100-year peak flow for the Big Lost River at the INEEL.
Purpose and Scope
The purpose of this report is to provide an esti-mate of the 100-year peak flow for the Big Lost River near the western boundary of the INEEL. The estimate was obtained by analyzing recorded and estimated peak-flow data, long-term gaging-station data, and doc-umented conditions in the basin during historical high-flow periods. Some assumptions were made with regard to reservoir levels and antecedent basin condi-tions. Regression models that compared annual peak flows between successive upstream and downstream gaging stations for the same flow event and peak-flow attenuation values as a function of upstream peak flows were used to estimate the magnitude of the 100-year
peak flow. The analysis integrated the cumulative effects of in-channel and bank storage, infiltration losses, and tributary inflows on the magnitude of peak flows for recurrence intervals that were presumed to be less than 100 years. Attenuation trends were extrapo-lated to predict attenuation effects on peak flows with an estimated recurrence interval of 100 years. Esti-mates obtained from application of guidelines in Bulle-tin 17B, “Guidelines for Determining Flood Flow Fre-quency” (Interagency Advisory Committee on Water Data, 1982), and regional regression flood-frequency analyses were also analyzed at specific locations.
Description of the Study Area
The Big Lost River is located on the northwestern side of the eastern Snake River Plain (fig. 1), about 60 mi west of Idaho Falls. The upper part of the Big Lost River Basin trends northwest to southeast and is bounded by mountains along its northern, western, and southern boundaries. Southeast of Arco, the Big Lost River flows onto the broad, undulating eastern Snake River Plain. Highly permeable and porous basaltic lava flows underlie much of the eastern Snake River Plain. As a result, streamflow from the Big Lost River that flows onto the eastern Snake River Plain either evapo-rates or infiltrates into the ground. The Big Lost River terminates in a series of interconnected playas located near the northern end of the INEEL (fig. 1).
The Big Lost River drains approximately 1,410 mi2 upstream from the USGS gaging station near Arco. The basin is mostly mountainous but contains a relatively flat, elongated valley varying in width between 2 and 10 mi. Elevations range from about 5,300 ft above sea level on the valley floor near Arco to more than 12,600 ft in the Lost River Range (fig. 1). The mean elevation of the basin is about 7,700 ft and the mean precipitation is approximately 20 in/yr. However, the mean elevation of the upper part of the basin (upstream from Howell Ranch, fig. 1) is about 8,600 ft, and the mean annual precipitation is about 27 in/yr. The area upstream from Howell Ranch produces about 65 per-cent of the annual water yield in the basin (Crosthwaite and others, 1970, p. 101). Many areas of the basin are underlain by highly jointed and solution-weathered carbonate rocks that readily absorb precipitation. This results in streamflow that is lower than would be expected from established altitude-precipitation rela-tions (Crosthwaite and others, 1970, p. 22). Because of
2 Estimating the Magnitude of the 100-Year Peak Flow, Big Lost River, INEEL, Idaho
Introduction
3
ButteCity
Arco
Leslie
Mackay
Moore
LowerCedarCreek Creek
Birch
Creek
BorahPeak
CreekW
ildhorse
PIONEER
Antelope
PassCreek
ThousandSpringsCreek
WarmSpringsCreek
ChillySinks
MackayReservoir
ChillyButtes
DarlingtonSinks
BoxCanyon
Spreadingareas
Big LostRiver Sinks
Playas
INEELdiversion
dam
HowellRanch
Mackaydam
Big
Lost
River
North Fork
EastFork
BUTTE
CUSTER
JEFFERSON
BINGHAM
LOSTRIVER
RANGE
PIONEER
MOUNTAINS
113° 30'
43° 30'
44° 00'
114° 00'
113° 00'
112° 30'
Boise
IDAHOStudyarea
Boise
Eastern SnakeRiver Plain
Snake
River
IdahoFalls
EXPLANATION
Idaho National Engineering and Environmental Laboratory
Basin boundary
0
0
10
10
20 KILOMETERS
20 MILESBase from U.S. Geological Survey1:100,000 quadrangles
Figure 1. Location of the Big Lost River Basin and the Idaho National Engineering and Environmental Laboratory (INEEL).
Figure 1.
Location of the Big Lost River Basin and the Idaho National Engineering and Environmental Laboratory (INEEL).

the local climate, numerous irrigation diversions, and relatively large channel infiltration losses, periods of zero flow often occur in the Big Lost River channel near Arco.
Mackay Reservoir is located about 30 mi upstream from Arco and is about halfway between Arco and the Big Lost River headwaters. Most of the inflow to the reservoir is the result of melting snowpack in the upper part of the basin. Crosthwaite and others (1970) reported that more than 75 percent of the basin’s annual water yield comes from the area upstream from Mackay Res-ervoir. Between 1956 and 1980, sedimentation reduced the active storage of the reservoir from approximately 43,500 acre-ft to approximately 38,500 acre-ft (Will-iams and Krupin, 1984, p. 72; U.S. Army Corps of Engineers, 1991, p. 1 – 4). At present, the active storage may be significantly less than 38,500 acre-ft because of additional sedimentation. Water stored in Mackay Res-ervoir is used to irrigate about 33,000 acres of land. In addition, several irrigation canals, mostly downstream from Mackay Reservoir, divert flow from the main channel of the Big Lost River and from several of its tributaries. The irrigation season typically runs from April through October (Kjelstrom and Berenbrock, 1996, p. 5).
Downstream from the gaging station near Arco, the Big Lost River enters Box Canyon, a deep, narrow gorge with nearly vertical walls cut into basalt rocks. The canyon averages about 125 ft wide and 75 ft deep. The river then flows through a channel cut into alluvial fill overlying the basalt and enters the INEEL at its western boundary. A flood-control diversion structure, INEEL diversion dam, was constructed at the INEEL in 1958 to reduce the threat of flooding from the Big Lost River. A diversion channel routes streamflow from the main channel of the Big Lost River to an intercon-nected series of spreading areas. Downstream from the INEEL diversion dam, the Big Lost River flows north-ward for about 18 mi to the Big Lost River Sinks and terminates in a series of interconnected playas.
Previous Investigations
Many studies of the water resources of the Big Lost River Basin have been conducted over the past 100 years. Wright (1903) reported on the effects of irrigation on gains and losses in the Big Lost River. Stearns and others (1938) estimated surface- and ground-water outflows from the Big Lost River Basin
as part of a study of the geology and ground-water re-sources of the eastern Snake River Plain. Lamke (1969) developed stage-discharge relations for the lower reach of the Big Lost River at the INEEL; Crosthwaite and others (1970) estimated surface-water outflows from 44 subbasins within the Big Lost River basin; and Ben-nett (1986) updated the stage-discharge relations for a short reach of the Big Lost River near the INEEL diver-sion dam.
Several other reports discuss flooding or the prob-ability of flooding in the Big Lost River Basin. The U.S. Army Corps of Engineers (1967) reported on the extent of flooding along the Big Lost River in 1967 and on antecedent conditions in the basin leading up to the flood event. The Corps of Engineers (1991) also pre-sented information on flood mitigation options avail-able for the Big Lost River Basin. Carrigan (1972), Druffel and others (1979), Nobel (1980), and Koslow and Van Haaften (1986) examined the probable hydro-logic effects of flooding arising from a hypothetical failure of Mackay Dam. Estimates of the attenuated peak flow 45 mi downstream at the INEEL boundary ranged from about 45,000 ft3/s (Koslow and Van Haaften, 1986) to about 54,000 ft3/s (Druffel and others, 1979). Rathburn (1989 and 1991) presented evidence for a late Pleistocene glacial-lake-outburst paleoflood with an estimated flow of between 2 and 4 million ft3/s in the Box Canyon area.
Two recent studies provide estimates of the 100-year peak flow for the Big Lost River near the western boundary of the INEEL. Kjelstrom and Berenbrock (1996) used flood-frequency curves and regional re-gression equations to estimate the 100-year peak flow in 23 of the 44 subbasins originally defined by Crosth-waite and others (1970). Kjelstrom and Berenbrock made several major assumptions with regard to their estimate. They assumed that Mackay Reservoir was full and that much of the area in the lower basin was completely saturated. Both of these conditions existed during the 1967 flood (U.S. Army Corps of Engineers, 1967, p. 2). They also assumed that water was not being diverted into the irrigation canals and that the peak flows from each of the subbasins would arrive at the INEEL boundary simultaneously. Their final esti-mate for the 100-year peak flow was 7,260 ft3/s.
Ostenaa and others (1999) estimated the 100-year peak flow for the Big Lost River using a combination of paleohydrologic data, gaging-station data, and the results of a two-dimensional numerical flow model. Radiocarbon dating of buried charcoal remnants in
4 Estimating the Magnitude of the 100-Year Peak Flow, Big Lost River, INEEL, Idaho
deposits adjacent to the main channel of the Big Lost River was used to establish the minimum age of flood-terrain features that might be susceptible to inundation and erosion during a peak flow. The two-dimensional model was used to determine the flow needed to over-top and erode these dated surfaces. Long-term preser-vation of these surfaces was used as evidence that floods would need to exceed a limiting flow to overtop and erode these surfaces. The age of the surface was used to define the minimum return period for the over-topping flood. These data were incorporated with peak-flow data from the gaging station near Arco to extend the period of record available for flood-frequency anal-ysis. Ostenaa and others (1999) estimated the 100-year peak flow to be approximately 2,910 ft3/s, less than half of the estimate of Kjelstrom and Berenbrock (1996).
HISTORICAL PEAK FLOWS
Streamflow records indicate that runoff from snowmelt is the cause of most of the peak flows in the Big Lost River. Most peak flows occur during the months of May, June, and July, and evidence suggests that generally there are two distinct annual snowmelt events: (1) an early snowmelt event primarily in the lower elevations of the basin, and (2) a later snowmelt event primarily in the higher elevations of the basin, most notably the part of the basin upstream from the Howell Ranch gaging station. The early snowmelt event also may signal the beginning of snowmelt in the area upstream from Howell Ranch; however, the annual peak flow from that area typically does not occur until mid- to late June, when solar radiation and snowmelt are maximal. Because Mackay Reservoir is relatively small, runoff preceding the annual peak is typically sufficient to fill the reservoir. Thus, the reser-voir provides little, if any, attenuation of the peak flow during the later snowmelt event.
Peak flows of record for the Big Lost River occurred at the Howell Ranch gaging station (13120500) on May 25, 1967 (4,420 ft3/s); at the gag-ing station below Mackay Reservoir (13127000) on June 10, 1921, and June 6, 1986 (2,990 ft3/s); and at the gaging station near Arco (13132500) on July 5, 1967 (1,890 ft3/s) (fig. 2).
A peak flow of 2,588 ft3/s was estimated for flow on June 12, 1921, at the Big Lost River above Mackay Reservoir site, which consists of two gaging stations (east channel, 13123500, and west channel, also called
Parsons Creek, 13124000) (fig. 2). A peak flow of 2,500 ft3/s was estimated by indirect methods for flow on June 29, 1965, at the present location of the gaging station near Arco, and a peak flow of 2,220 ft3/s was estimated for flow on the same date immediately up-stream from the INEEL diversion dam (Barraclough and others, 1967, p. 57).
EXPLANATION OF DATAExplanation of Data.
Annual peak-flow data from USGS streamflow-gaging stations were used in this analysis. Explanations of the data available and methods for determining adjusted annual peak flows are discussed in the follow-ing section.
Gaging-Station Data
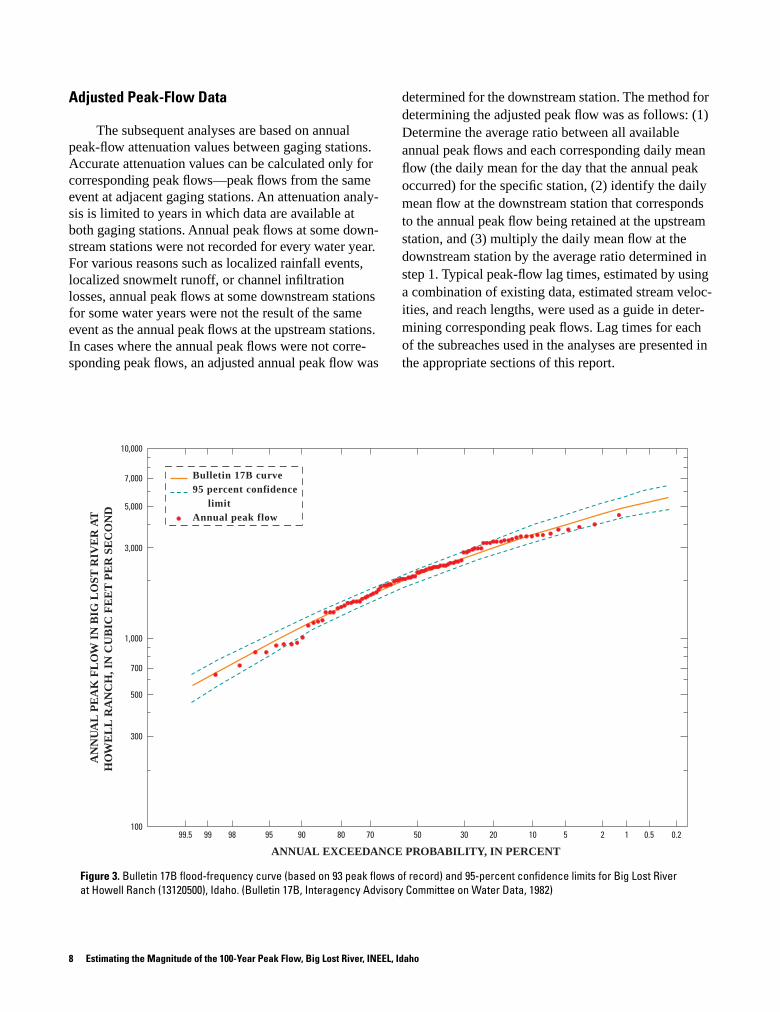
Streamflow data in the Big Lost River Basin have been recorded since the early 1900s. The Howell Ranch gaging station (13120500) has 93 years of record (table 1) and records all streamflow exiting the upper northwest part of the basin. The drainage area upstream from the Howell Ranch gaging station is about 450 mi2 and accounts for approximately 32 per-cent of the total drainage area of the Big Lost River Basin upstream from the gaging station near Arco (13132500/1,410 mi2). As stated previously, Crosth-waite and others (1970) reported that this area produces about 65 percent of the annual water yield in the basin. The Howell Ranch gaging station has a stable control section that has provided reliable, long-term measuring conditions. The long-term rating curve for the Howell Ranch gaging station is very stable; most instream flow measurements plot within 5 percent of the stage-dis-charge rating curve. The flood-frequency curve gener-ated for the Howell Ranch gaging station using Bulle-tin 17B guidelines (Interagency Advisory Committee on Water Data, 1982) is shown in figure 3. Analysis of this curve results in a 100-year peak-flow estimate of 4,790 ft3/s, and upper and lower 95-percent confidence limits of 5,510 ft3/s and 4,270 ft3/s, respectively (table 1). The confidence interval ranges from 10.8 percent below to 15.0 percent above the 100-year peak-flow estimate. In addition, a 100-year peak-flow estimate of 4,340 ft3/s was calculated using regional regression equations (Berenbrock, 2002). This estimate, with a standard error ranging from +71.8 percent to - 41.8 per-
Explanation of Data 5

6
Estimating the M
agnitude of the 100-Y
ear Peak Flow
, Big Lost River
, INEEL, Idaho
ButteCity
Arco
Leslie
Mackay
Moore
LowerCedarCreek
Creek
Antelope
PassCreek
ThousandSpringsCreek
WarmSpringsCreek
ChillySinks
ParsonsPoleStockyard
Creek CreekWarm
Springs
CreekMackayReservoir
MackayReservoir
Big
Lost
River
North Fork
East Fork
Big
Lost
River
LOST
RIVER
RANGE
PIONEER
MOUNTAINS
ChillyButtes
BorahPeak
CreekW
ildhorse
DarlingtonSinks
BoxCanyon
Spreadingareas
INEELdiversion
dam
HowellRanch Mackay
dam
44° 00'
43° 30'
114° 00'
113° 30'
113° 00'
EXPLANATION
Idaho National Engineering and Environmental Laboratory (INEEL)
Basin boundary
Gaging station and identification number1313250013132500
131205001312350013124000131245001312500013127000131325001313251313132520
Howell Ranch
above Mackay Reservoir (east channel)
above Mackay Reservoir (west channel, Parsons Creek)
Warm Springs Creek (east channel, Pole Stockyard Creek)
Warm Springs Creek (west channel)
below Mackey Reservoir
near Arco
INEEL diversion at head
below INEEL diversion
ABBREVIATED U.S. GEOLOGICAL SURVEYGAGING-STATION NAMES
0
0
10
10
20 KILOMETERS
20 MILES
Figure 2. Location of gaging stations used in estimating peak flows of the Big Lost River, Idaho.
1312050013120500
1312350013123500
1312700013127000
1313250013132500
1312450013124500
13132520/1313251313132520/13132513
1312400013124000
1312500013125000
Figure 2.
Location of gaging stations used in estimating peak flows of the Big Lost River, Idaho.

T
able 1.
Station and Bulletin 17B fl
ood-frequency information for streamfl
ow-gaging stations used in estimating the 100-year peak fl
ow in the
Big Lost River
, Idaho
[Bulletin 17B, Interagenc
y
Advisory Committee on
W
ater Data (1982); No., number;
WY
, w
ater year; mi
2
, square miles; ft
3
/s, cubic feet per second;
%,
percent; ID, Idaho; —, no data]
Gaging-station information
Flood frequency (Bulletin 17B)
Gaging-
station
No.
Gaging-station name
Period of
record
(WY)
Drainage
area
(mi
2
)
100-year
peak-
fl
ow
estimate
(ft
3
/s)
No. of
peak
fl
ows
Upper
95%
confi
-
dence
limit
(ft
3
/s)
Lower
95%
confi
-
dence
limit
(ft3/s)
13120500 Big Lost River at Howell Ranch near Chilly, ID1904 – 15, 1920 – 2001 450 4,790 93 5,510 4,270
13123500/ 13124000
Big Lost River (east and west channels) above Mackay Reser-voir near Mackay, ID 1919 – 60 710 — — — —
13124500/ 13125000 Warm Springs Creek (east and west channels) near Mackay, ID 1919 – 60 156 — — — —
213125500 Surface inflow to Mackay Reservoir near Mackay, ID 1919 – 60 766 3,590 40 4,740 2,930
13127000 Big Lost River below Mackay Reservoir near Mackay, ID
1904 – 06, 1912 – 15, 1919 – 2001 813 3 3,670 89 4,330 3,210
13132500 Big Lost River near Arco, ID1946 – 61, 1966 – 2001 1,410 35,030 52 9,730 3,040
13132513 INEEL diversion at head near Arco, ID 1984 – 2001 4 — — — — —
13132520 Big Lost River below INEEL diversion near Arco, ID 1984 – 2001 5 — — — — —
1 Receives significant flow contributions from the Big Lost River during peak-flow events.
2 Combined flow data from Warm Springs Creek (13123500 and 13124000) and Big Lost River (13124500 and 13125000) above Mackay Reservoir.3 Estimates were determined using regulated flow data; not representative of actual 100-year peak flow.4 Not applicable.5 Unable to define drainage area because of minimal elevation changes and highly porous underlying rock formations.
cent, is approximately 9.4 percent lower than the Bulle-tin 17B estimate.
Site information and flood-frequency estimates for the other gaging stations used in the analysis also are presented in table 1. The two gaging stations on the Big Lost River (east channel, 13123500, and west channel, also called Parsons Creek, 13124000) above Mackay Reservoir have a combined upstream drain-age area of approximately 710 mi2. The two Warm Springs Creek gaging stations (east channel, also called Pole Stockyard Creek, 13124500, and west channel, 13125000) have a combined upstream drainage area of approximately 56 mi2. The data from these four gaging stations make up the data for the hypothetical station 13125500, which represents the combined surface in-flows to Mackay Reservoir. It is important to note that during peak-flow events, flow from the Big Lost River is able to enter the two Warm Springs Creek channels
upstream from Mackay Reservoir. The other two gag-ing stations, below Mackay Reservoir near Mackay (13127000) and near Arco (13132500), have upstream drainage areas of 813 mi2 and 1,410 mi2, respectively. Because of large infiltration losses and lack of tributary inflows downstream from Arco, drainage areas for the INEEL diversion at head near Arco (13132513) and the Big Lost River below INEEL diversion near Arco (13132520) were not computed.
For purposes of this report, annual peak flow refers to the annual instantaneous peak flow. The annual instantaneous peak flow is the largest computed discharge (discharge is computed from stage data typi-cally recorded at 15-minute intervals) at a gaging sta-tion in any given year. In addition, daily mean flow refers to the average of all computed discharges for a specific day.
Explanation of Data 7
Adjusted Peak-Flow Data
The subsequent analyses are based on annual peak-flow attenuation values between gaging stations. Accurate attenuation values can be calculated only for corresponding peak flows—peak flows from the same event at adjacent gaging stations. An attenuation analy-sis is limited to years in which data are available at both gaging stations. Annual peak flows at some down-stream stations were not recorded for every water year. For various reasons such as localized rainfall events, localized snowmelt runoff, or channel infiltration losses, annual peak flows at some downstream stations for some water years were not the result of the same event as the annual peak flows at the upstream stations. In cases where the annual peak flows were not corre-sponding peak flows, an adjusted annual peak flow was
determined for the downstream station. The method for determining the adjusted peak flow was as follows: (1) Determine the average ratio between all available annual peak flows and each corresponding daily mean flow (the daily mean for the day that the annual peak occurred) for the specific station, (2) identify the daily mean flow at the downstream station that corresponds to the annual peak flow being retained at the upstream station, and (3) multiply the daily mean flow at the downstream station by the average ratio determined in step 1. Typical peak-flow lag times, estimated by using a combination of existing data, estimated stream veloc-ities, and reach lengths, were used as a guide in deter-mining corresponding peak flows. Lag times for each of the subreaches used in the analyses are presented in the appropriate sections of this report.
8 Estimating the Magnitude of the 100-Year Peak Flow, Big Lost River, INEEL, Idaho
Bulletin 17B curve95 percent confidence limitAnnual peak flow
10012510 0.20.520305070809095989999.5
500
1,000
700
300
5,000
10,000
7,000
3,000
AN
NU
AL
PE
AK
FL
OW
IN
BIG
LO
ST R
IVE
R A
TH
OW
EL
L R
AN
CH
, IN
CU
BIC
FE
ET
PE
R S
EC
ON
D
ANNUAL EXCEEDANCE PROBABILITY, IN PERCENT
Figure 3. Bulletin #17B flood frequency curve (based on 93 peak flows of record) and 95-percent confidence limits for BigLost River at Howell Ranch (13120500), Idaho. (Bulletin 17B, Inter-agency Advisory Committee on Water Data, 1982)
Figure 3. Bulletin 17B flood-frequency curve (based on 93 peak flows of record) and 95-percent confidence limits for Big Lost River at Howell Ranch (13120500), Idaho. (Bulletin 17B, Interagency Advisory Committee on Water Data, 1982)
Estimation of Error (Confidence Limits)
In this report, 95-percent confidence limits are used as an indicator of the presumed accuracy of the 100-year peak-flow estimate at each location. The 95-percent confidence limits represent plus and minus two standard deviations (standard errors) of the residuals (predicted minus expected) and define the upper and lower values between which the actual value would be expected to fall 95 percent of the time. The confidence limits for the 100-year peak-flow estimate at the How-ell Ranch gaging station were derived from the three-parameter log-Pearson Type III analysis used to deter-mine the estimate (Interagency Advisory Committee on Water Data, 1982). All other confidence limits were determined by combining the errors at Howell Ranch with those resulting from the attenuation regression analyses for each subreach. The method consisted of pooling the error associated with the estimate at How-ell Ranch with the errors associated with the estimates derived from the regression analyses in each subse-quent reach using the following equation:
, (1)
where S is two standard errors of the specific estimate; sHR is two standard errors associated with the peak-flow estimate at Howell Ranch; and s1, s2,…sn are two stan-dard errors associated with the attenuation estimates from the regression analysis in each incremental sub-reach (Boas, 1966, p. 733).
The validity of equation 1 is based on two assump-tions: (1) The errors are normally distributed about the mean, and (2) each data set is completely independent of the others. The first assumption is not completely true because the distribution of the errors associated with the Bulletin 17B (Interagency Advisory Commit-tee on Water Data, 1982) estimate at Howell Ranch is not quite normal. However, this slight skew in the error distribution likely does not have a significant effect on the final calculations of the errors. The fact that loss rates within each reach, which affect the attenuation of peak flows, are likely independent from each other makes valid the assumption that the data sets are inde-pendent of each other. The error values calculated using equation 1 were applied to the peak-flow esti-mates derived from the attenuation analysis for each specific location to determine the upper and lower 95-percent confidence limits. The calculations used in
determining the 95-percent confidence limits at the downstream end of each subreach and the calculations for the 100-year peak-flow estimates are presented in appendix 1 at the back of this report.
ESTIMATION OF THE 100-YEAR PEAK FLOWEstimation of the 100-Year Peak Flow.
Recorded and estimated peak flows, long-term gaging-station data (table 1), and estimates of tributary inflows and peak-flow attenuation values were used as the bases to estimate the 100-year peak flow for the Big Lost River at the western boundary of the INEEL. Peak flow and peak-flow attenuation values were plotted and engineering judgment was used to determine what type of regression model best fit each data set. Estimates of attenuation values during the 100-year peak flow were based on extrapolations of existing data and the assump-tion that trends would remain consistent. Assumptions also were made with regard to reservoir levels and antecedent basin conditions. Where applicable, peak-flow estimates for intermediate channel locations were compared with estimates obtained from Bulletin 17B (Interagency Advisory Committee on Water Data, 1982) and regional regression flood-frequency analyses.
Howell Ranch to Mackay Reservoir
The gaging station at Howell Ranch (fig. 2) was chosen as the starting point for this analysis. It was selected as the starting point for several reasons: (1) It accounts for more than half of the total runoff in the basin (Crosthwaite and others, 1970); (2) it has a long and consistent period of record; and (3) the flood-fre-quency curve fits the annual peak-flow data very well (fig. 3). In addition, streamflow upstream from the Howell Ranch gaging station is not affected by irriga-tion diversions or water storage structures. The stream reach between the Howell Ranch gaging station (13120500) and the gaging station sites above Mackay Reservoir (13123500,13124000, 13124500, and 13125000) is approximately 20 mi long and adds 316 mi2 of contributing drainage area. As discussed previ-ously, the data from all four gaging stations located above Mackay Reservoir are included in the data for the hypothetical gaging station, surface inflows to Mackay Reservoir (13125500). Because during peak-flow events, flow from the Big Lost River is able to enter each of these four channels upstream from Mackay Reservoir, the hypothetical station data are
S sHR2 s1
2 s22 … sn
2+ + + +=
Estimation of the 100-Year Peak Flow 9
used in the attenuation analysis. The typical lag time for peak flows within this reach is approximately 24 to 48 hours. Significant channel losses typically occur within this reach, especially in the area known as Chilly Sinks (fig. 2), located 6 to 8 mi downstream from the Howell Ranch gaging station (Stearns and others, 1938).
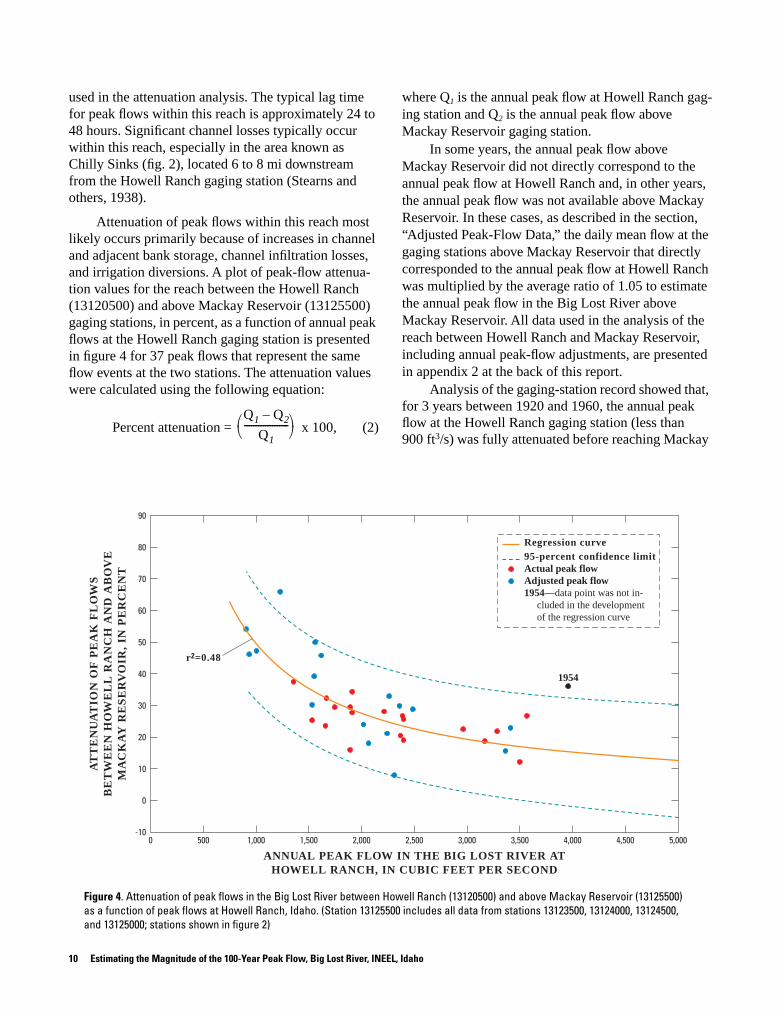
Attenuation of peak flows within this reach most likely occurs primarily because of increases in channel and adjacent bank storage, channel infiltration losses, and irrigation diversions. A plot of peak-flow attenua-tion values for the reach between the Howell Ranch (13120500) and above Mackay Reservoir (13125500) gaging stations, in percent, as a function of annual peak flows at the Howell Ranch gaging station is presented in figure 4 for 37 peak flows that represent the same flow events at the two stations. The attenuation values were calculated using the following equation:
Percent attenuation = x 100, (2)
where Q1 is the annual peak flow at Howell Ranch gag-ing station and Q2 is the annual peak flow above Mackay Reservoir gaging station.
In some years, the annual peak flow above Mackay Reservoir did not directly correspond to the annual peak flow at Howell Ranch and, in other years, the annual peak flow was not available above Mackay Reservoir. In these cases, as described in the section, “Adjusted Peak-Flow Data,” the daily mean flow at the gaging stations above Mackay Reservoir that directly corresponded to the annual peak flow at Howell Ranch was multiplied by the average ratio of 1.05 to estimate the annual peak flow in the Big Lost River above Mackay Reservoir. All data used in the analysis of the reach between Howell Ranch and Mackay Reservoir, including annual peak-flow adjustments, are presented in appendix 2 at the back of this report.
Analysis of the gaging-station record showed that, for 3 years between 1920 and 1960, the annual peak flow at the Howell Ranch gaging station (less than 900 ft3/s) was fully attenuated before reaching Mackay
Q1 Q2–
Q1
-------------------
10 Estimating the Magnitude of the 100-Year Peak Flow, Big Lost River, INEEL, Idaho
Figure 4. Attenuation of peak-flows in the Big Lost River between Howell Ranch (13120500) and above Mackay Reservoir(13123500/13124000), Idaho. (Sites shown in figure 2)
90
80
70
60
50
40
30
20
10
0
-100 500 1,000 1,500 2,000 2,500 3,000 3,500 4,000 4,500 5,000
AT
TE
NU
AT
ION
OF
PE
AK
FL
OW
SB
ET
WE
EN
HO
WE
LL
RA
NC
H A
ND
AB
OV
EM
AC
KA
Y R
ES
ER
VO
IR,
IN P
ER
CE
NT
ANNUAL PEAK FLOW IN THE BIG LOST RIVER ATHOWELL RANCH, IN CUBIC FEET PER SECOND
1954
r2=0.48
Regression curve95-percent confidence limitActual peak flowAdjusted peak flow1954—data point was not in- cluded in the development of the regression curve
Figure 4. Attenuation of peak flows in the Big Lost River between Howell Ranch (13120500) and above Mackay Reservoir (13125500) as a function of peak flows at Howell Ranch, Idaho. (Station 13125500 includes all data from stations 13123500, 13124000, 13124500, and 13125000; stations shown in figure 2)

Reservoir. These peak flows were not included in figure 4 because an accurate attenuation value could not be calculated. The complete attenuation of annual peaks of less than 900 ft3/s also was noted by Crosthwaite and others (1970, p. 46), who reported that after extended dry periods, more than 1,000 ft3/s may be lost for a period of time until local storage demands have been met. However, this would probably affect only smaller peak-flow events. Larger peak-flow events, such as the 100-year peak-flow event, likely would have sufficient water volumes to satisfy storage demands before the actual peak arrived.
The large attenuation value corresponding to the peak flow in 1954 is shown in figure 4 but was not used in the development of the regression equation. This peak flow was the result of a cloudburst on Wildhorse Creek on June 26 (U.S. Army Corps of Engineers, 1967, p. 6). Near-base-flow conditions in the weeks leading up to the annual peak flow likely increased the available bank storage, and the relatively short-dura-tion peak flow likely resulted in significant channel
storage losses during the peak flow. These two factors would increase total losses and, in turn, increase the peak-flow attenuation within the reach.
Although there is significant scatter in this plot (fig. 4, r 2 = 0.48), it is apparent that the attenuation val-ues in this reach tend to decrease nonlinearly as flows increase. It is also apparent that the rate of decrease changes within the 1,000 ft3/s to 2,000 ft3/s range. This seems reasonable since initial losses probably satisfy channel and bank storage requirements in addition to infiltrating into the ground-water system. Once these channel and bank storage requirements are satisfied, subsequent losses are a result only of infiltration to the ground-water system. Extrapolation of the existing trend of attenuation values results in an attenuation estimate of 13 percent for the 100-year peak flow at the Howell Ranch gaging station.
A plot of annual peak flows in the Big Lost River above Mackay Reservoir as a function of correspond-ing peak flows at Howell Ranch is presented in figure 5 for the same 37 peak flows shown in figure 4. For com-
Estimation of the 100-Year Peak Flow 11
Figure 5. Annual peak-flows in the Big Lost River above Mackay Reservoir (13123500/13124000) as a function of annual peakflows in the Big Lost River at Howell Ranch (13120500), Idaho. (Sites shown in figure 2)
5,000
4,500
4,000
3,500
3,000
2,500
2,000
1,500
1,000
500
00 500 1,000 1,500 2,000 2,500 3,000 3,500 4,000 4,500 5,000A
NN
UA
L P
EA
K F
LO
WS
IN
TH
E B
IG L
OS
T R
IVE
R A
BO
VE
MA
CK
AY
RE
SE
RV
OIR
, IN
CU
BIC
FE
ET
PE
R S
EC
ON
D
ANNUAL PEAK FLOWS IN THE BIG LOST RIVER ATHOWELL RANCH, IN CUBIC FEET PER SECOND
20%
0% attenuation
50%
30%
40%1954
r2=0.93
Regression curveActual peak flowAdjusted peak flow1954—data point was not in- cluded in the development of the regression curve
Figure 5. Annual peak flows in the Big Lost River above Mackay Reservoir (13125500) as a function of annual peak flows in the Big Lost River at Howell Ranch (13120500), Idaho. (Station 13125500 includes all data from stations 13123500, 13124000, 13124500, and 13125000; stations shown in figure 2)

parison purposes, plots of attenuation values of 0, 20, 30, 40, and 50 percent also are shown. The data used in figure 5 represent only corresponding peak flows that resulted from the same flow event and peak flows that reached the gaging stations above Mackay Reservoir without being fully attenuated. For the same reasons as previously discussed, the 1954 data point was left out of the development of the regression line. The regression line correlates closely with the data points (r 2 = 0.93), which indicates a strong correlation be-tween annual peak flows in the Big Lost River at How-ell Ranch and above Mackay Reservoir. Ostenaa and others (1999, fig. 2 – 7, p. 20) presented similar data, which also suggested a strong correlation between peak flows at the Howell Ranch gaging station and those at the gaging stations above Mackay Reservoir.
As discussed previously, the Bulletin 17B (Inter-agency Advisory Committee on Water Data, 1982) flood-frequency estimates for the Howell Ranch gaging station are considered to be very reliable because the range between the upper and lower 95-percent confi-dence limits is relatively narrow. The 100-year peak-flow estimate at Howell Ranch was routed downstream to Mackay Reservoir using an approximate peak-flow attenuation of 13 percent obtained from extrapolation of the regression curve shown in figure 4. Calculations used in determining the estimated peak flow based on the attenuation method are shown in appendix 4 at the back of this report. The estimate and corresponding 95-
percent confidence limits then were compared with other estimates for the above Mackay Reservoir site (13125500) obtained from Bulletin 17B and regional regression flood-frequency analyses (table 2). An explanation of the determination of the 95-percent con-fidence limits is presented in a previous section, “Esti-mation of Error (Confidence Limits),” of this report. The attenuation method estimate of 4,170 ft3/s is about 16.2 percent larger than the Bulletin 17B estimate of 3,590 ft3/s. Because the actual regional regression esti-mate of 4,310 ft3/s does not account for channel losses, this value was reduced by approximately 620 ft3/s (13 percent of the 100-year estimate from Bulletin 17B of 4,790 ft3/s). The adjusted regional regression esti-mate of 3,690 ft3/s is about 11.5 percent lower than the attenuation estimate and about 2.8 percent higher than the estimate determined using Bulletin 17B guidelines.
Mackay Reservoir
Mackay Reservoir extends over about 3 mi of the approximately 5-mi reach of river between the gaging stations above Mackay Reservoir (13123500/13124000/13124500/13125000) and the gaging station below Mackay Reservoir (13127000) (fig. 2). The data from all four gaging stations located above Mackay Reser-voir are included in the data for the hypothetical gaging station, surface inflows to Mackay Reservoir (13125500). The reservoir covers approximately 1,200 acres and, in 1980, had approximately 38,500 acre-ft of storage capacity (Williams and Krupin, 1984, p. 72). Water District 34 operates the reservoir for irrigation of about 33,000 acres of farmland in the Big Lost River Valley.
In all years, the main purpose of the reservoir, pro-viding irrigation water, is given the greatest consider-ation (U.S. Department of Agriculture, 1989). Water allocations for the irrigation season are determined on the basis of reservoir levels on May 1. Reservoir stor-age records show that, in most normal to above-normal water years (the long-term annual mean flow at Howell Ranch of approximately 320 ft3/s is a good indication of a normal water year), the reservoir is full or nearly full before the annual peak occurs. There are likely two reasons for these high reservoir levels: (1) It is a pri-mary goal of Water District 34 to retain or secure high reservoir storage levels before irrigation begins on or around May 1 (U.S. Department of Agriculture, 1989; Bob Shaffer, Watermaster, Water District 34, oral com-mun., 2002); and (2) snowmelt runoff events are typi-
Table 2. Estimated 100-year peak flows in the Big Lost River at Howell Ranch and above Mackay Reservoir, Idaho
[Bulletin 17B, Interagency Advisory Committee on Water Data (1982); peak flow reported in cubic feet per second (ft3/s); —, no data]
Type of flow estimate
Big Lost River at Howell Ranch
(13120500)Big Lost River above Mackay
Reservoir (13125500)1
Bulletin 17B
Attenuation method
Bulletin 17B
Regional equation2
100-year peak flow 4,790 4,170 3,590 3,690
Upper 95-percent confidence limit 5,510 5,290 4,740 —
Lower 95-percent confidence limit 4,270 3,170 2,930 —
1 Combined flow data from Warm Springs Creek (13123500 and 13124000) and Big Lost River (13124500 and 13125000) above Mackay Reservoir.
2 Estimated using regional regression flood-frequency analyses (Berenbrock, 2002); actual value of 4,310 ft3/s was adjusted for expected channel losses of approxi-mately 620 ft3/s (13 percent of 100-year peak flow from Bulletin 17B, Interagency Advisory Committee on Water Data, 1982).
12 Estimating the Magnitude of the 100-Year Peak Flow, Big Lost River, INEEL, Idaho

cally of long duration with large volumes of water available for storage before the actual peak arrives.
Water allocations can be adjusted after May 1 if reservoir storage levels are high. Thus, if the reservoir is not completely full, it is advantageous for the irriga-tion district to continue filling the reservoir through May and into June (Bob Shaffer, Watermaster, Water District 34, oral commun., 2002). Because of the irri-gation district’s focus on keeping reservoir levels high and the absence of any specific guidelines with regard to flood control, it was assumed for purposes of this study that no additional storage would be available dur-ing the 100-year peak-flow event and that outflows from the reservoir would equal inflows. This has been the case several times in the past, most notably in 1967, when significant flooding occurred in the Arco area (U.S. Army Corps of Engineers, 1991, p. 1 – 4).
The estimated 100-year peak inflow to Mackay Reservoir from the Big Lost River (including Warm Springs Creek) was determined to be approximately 4,170 ft3/s (table 2). No other significant tributary inflows to Mackay Reservoir exist. This was verified by analyzing available streamflow and reservoir content data. During periods of time when reservoir levels were constant (inflows equaled outflows), the combined inflows (13125500) basically accounted for the entire outflow from the reservoir (13127000). Thus, for the purpose of this report, the 100-year peak flow into and, because of previous assumptions, out of Mackay Res-ervoir was estimated to be approximately 4,170 ft3/s.
Mackay Reservoir to Arco
The stream reach between the gaging station below Mackay Reservoir (13127000) and the gaging station near Arco (13132500) covers approximately 37 mi and receives tributary inflows from an additional 597 mi2 of contributing drainage area. The typical lag time for peak flows within this reach is approximately 48 to 96 hours. Significant channel losses typically occur within this reach, especially in the Darlington Sinks area and in the river reach between Moore and Arco (Crosthwaite and others, 1970, p. 52) (fig. 2). Especially large loss rates seem to increase the peak-flow lag time in certain years.
Attenuation of peak flows within this reach most likely occurs primarily as a result of increases in chan-nel storage, channel infiltration losses, and irrigation diversions. A plot of peak-flow attenuation values, in
percent, as a function of peak flows at the below Mackay Reservoir gaging station is presented in figure 6 for 28 peak flows that represent the same flow event for the two gaging stations. The attenuation values were calculated using the following equation:
Percent attenuation = x 100, (3)
where Q1 is the annual peak flow at the below Mackay Reservoir gaging station and Q2 is the annual peak flow at the near Arco gaging station.
The annual peak flow at the gaging station near Arco was not available for some water years. In these cases, the daily mean flow for the gaging station near Arco that corresponded to the annual peak flow below Mackay Reservoir was multiplied by a factor of 1.07 to estimate the annual peak flow at the gaging station near Arco. The method for determining this adjustment fac-tor was discussed in the section, “Adjusted Peak-Flow Data.” All data used in the analysis of the reach be-tween Mackay Reservoir and Arco, including annual peak-flow adjustments, are presented in appendix 3 at the back of this report. Analysis of gaging-station records showed that, in some years, the peak flow below Mackay Reservoir was fully attenuated before reaching the gaging station near Arco, most likely because of channel infiltration losses. The data from these years were left out of the plot because an accurate attenuation value could not be calculated.
A plot of annual peak flows near Arco as a func-tion of corresponding peak flows below Mackay Reser-voir is presented in figure 7 for the same 28 peak flows shown in figure 6. For comparison purposes, plots of attenuation values of 0, 20, 30, 40, and 50 percent also are shown in figure 7. This plot differs from that pre-sented in Ostenaa and others (1999, fig. 2 – 9, p. 22) in that figure 7 shows only corresponding peak flows resulting from the same flow event and peak flows that reached the gaging station near Arco without being fully attenuated.
The attenuation values for this reach (fig. 6) are significantly more variable (r 2 = 0.33) than those for the reach above Mackay Reservoir (fig. 4). This is likely the result of a more complex system of irrigation withdrawals, the possibility of variable tributary in-flows, and possibly more variable channel infiltration rates downstream from Mackay Reservoir. However, even with these large variabilities, extrapolation of the
Q1 Q2–
Q1
-------------------
Estimation of the 100-Year Peak Flow 13

14
Estimating the Magnitude of the 100-Y
ear Peak Flow
, Big Lost River
, INEEL, Idaho
Figure 6. Attenuation of peak-flows in the Big Lost River between below Mackay Reservoir (13127000) and near Arco(13132500), Idaho. (Sites shown in figure 2)
140
120
100
80
60
40
20
0
-20
-40
-600 500 1,000 1,500 2,5002,000 3,000 3,500 4,000 4,500
AT
TE
NU
AT
ION
OF
PE
AK
FL
OW
S I
N T
HE
BIG
LO
ST
RIV
ER
BE
TW
EE
N B
EL
OW
MA
CK
AY
RE
SE
RV
OIR
AN
D N
EA
R A
RC
O,
IN P
ER
CE
NT
ANNUAL PEAK FLOW IN THE BIG LOST RIVER BELOWMACKAY RESERVOIR, IN CUBIC FEET PER SECOND
r2=0.33
Regression curve95 percent confidence limitActual peak flowAdjusted peak flow
data in fi
gure 6 shows that as peak flows below Mackay Reservoir approach the 100-year estimate of 4,170 ft
3
/s,
the attenuation values within the reach linearly approach zero. This trend also is apparent in figure 7 (r
2
= 0.59), which sho
ws that peak flows near Arco are approximately equal to those below Mackay Reservoir after the peak flows below Mackay Reservoir exceed about 3,000 ft
3
/s.
Carrig
an (1972, p. 12) stated that, on the basis of flow data through 1967, as flows below Mackay Reser-voir approach 2,230 ft
3
/s, it is probable that the higher
runoff volume satisfies the storage and infiltration loss demands that were prevalent earlier in the runoff pro-cess, resulting in negligible differences in flows be-tween the two gaging stations. Although it is probably unlikely that infiltration losses within this reach are reduced to zero during high runoff events, it is likely that the losses are offset by tributary inflows from the lower basin. It is also probable that because snowmelt in the lower basin generally occurs earlier in the runoff process, peak flows from the intermediate tributaries help to satisfy local storage demands but do not signifi-
cantly affect the peak runoff from the upper basin, other than to offset losses. Subsequent records show that Carrigan’s threshold value may be somewhat low; however, as flows below Mackay Reservoir approach 4,170 ft
3
/s, peak-fl
ow attenuation in this reach is likely negligible. Thus, the 100-year peak flow for the Big Lost River near Arco was estimated to be 4,170 ft
3
/s,
equal to the estimated peak flow below Mackay Reservoir.
The 100-year peak-flow estimates and 95-percent confidence limits for this reach and Bulletin 17B and regional regression flood-frequency estimates are pre-sented in table 3. Calculations used in determining the estimated peak flow based on the attenuation method are shown in appendix 4 at the back of this report. An explanation of the determination of the 95-percent con-fidence limits is presented in the section, “Estimation of Error (Confidence Limits).” The Bulletin 17B esti-mate was determined from gaging-station peak-flow records that are affected by regulation of outflows from Mackay Reservoir and possible irrigation diversions and, therefore, probably is not representative of the
Figure 6.
Attenuation of peak fl
ows in the Big Lost River between below Mackay Reservoir (13127000) and near Arco (13132500) as
a function of peak fl
ows below Mackay Reservoir
, Idaho (Stations shown in fi
gure 2)
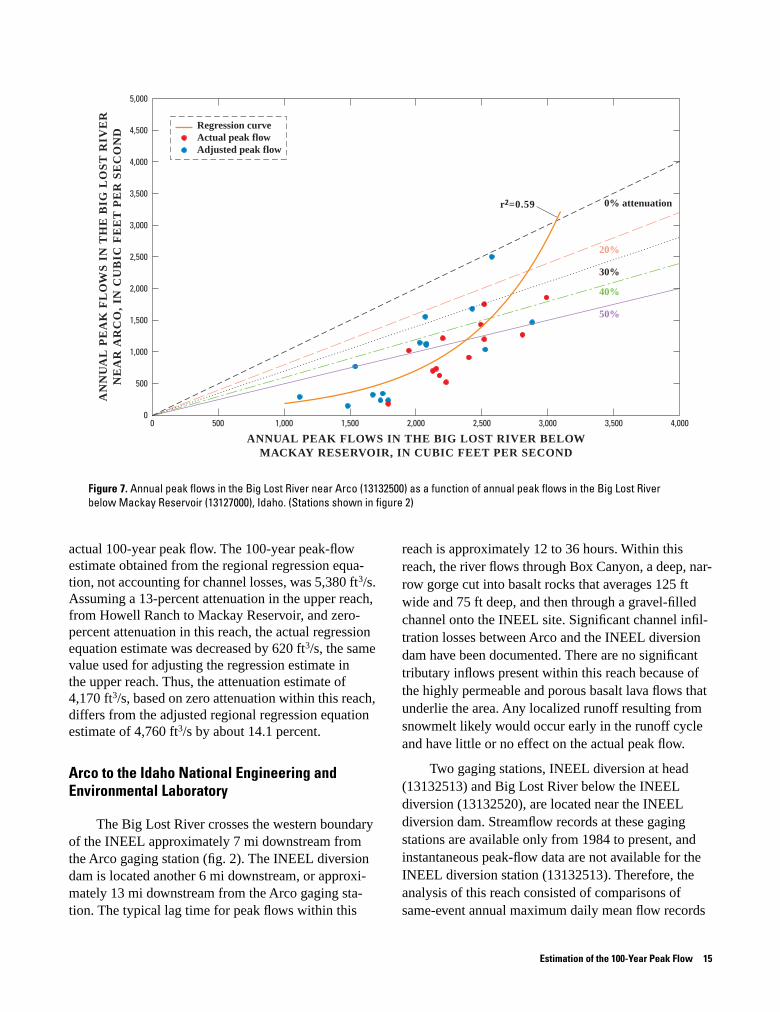
Figure 7. Annual peak-flows in the Big Lost River near Arco (13132500) as a function of annual peak flows in the Big LostRiver below Mackay Reservoir (13127000), Idaho. (Sites shown in figure 2)
5,000
4,500
4,000
3,500
3,000
2,500
2,000
1,500
1,000
500
00 500 1,000 1,500 2,000 2,500 3,000 3,500 4,000
AN
NU
AL
PE
AK
FL
OW
S I
N T
HE
BIG
LO
ST
RIV
ER
NE
AR
AR
CO
, IN
CU
BIC
FE
ET
PE
R S
EC
ON
D
ANNUAL PEAK FLOWS IN THE BIG LOST RIVER BELOWMACKAY RESERVOIR, IN CUBIC FEET PER SECOND
r2=0.59
Regression curveActual peak flowAdjusted peak flow
20%
0% attenuation
50%
30%
40%
Figure 7. Annual peak flows in the Big Lost River near Arco (13132500) as a function of annual peak flows in the Big Lost River below Mackay Reservoir (13127000), Idaho. (Stations shown in figure 2)
actual 100-year peak flow. The 100-year peak-flow estimate obtained from the regional regression equa-tion, not accounting for channel losses, was 5,380 ft3/s. Assuming a 13-percent attenuation in the upper reach, from Howell Ranch to Mackay Reservoir, and zero-percent attenuation in this reach, the actual regression equation estimate was decreased by 620 ft3/s, the same value used for adjusting the regression estimate in the upper reach. Thus, the attenuation estimate of 4,170 ft3/s, based on zero attenuation within this reach, differs from the adjusted regional regression equation estimate of 4,760 ft3/s by about 14.1 percent.
Arco to the Idaho National Engineering and Environmental Laboratory
The Big Lost River crosses the western boundary of the INEEL approximately 7 mi downstream from the Arco gaging station (fig. 2). The INEEL diversion dam is located another 6 mi downstream, or approxi-mately 13 mi downstream from the Arco gaging sta-tion. The typical lag time for peak flows within this
reach is approximately 12 to 36 hours. Within this reach, the river flows through Box Canyon, a deep, nar-row gorge cut into basalt rocks that averages 125 ft wide and 75 ft deep, and then through a gravel-filled channel onto the INEEL site. Significant channel infil-tration losses between Arco and the INEEL diversion dam have been documented. There are no significant tributary inflows present within this reach because of the highly permeable and porous basalt lava flows that underlie the area. Any localized runoff resulting from snowmelt likely would occur early in the runoff cycle and have little or no effect on the actual peak flow.
Two gaging stations, INEEL diversion at head (13132513) and Big Lost River below the INEEL diversion (13132520), are located near the INEEL diversion dam. Streamflow records at these gaging stations are available only from 1984 to present, and instantaneous peak-flow data are not available for the INEEL diversion station (13132513). Therefore, the analysis of this reach consisted of comparisons of same-event annual maximum daily mean flow records
Estimation of the 100-Year Peak Flow 15
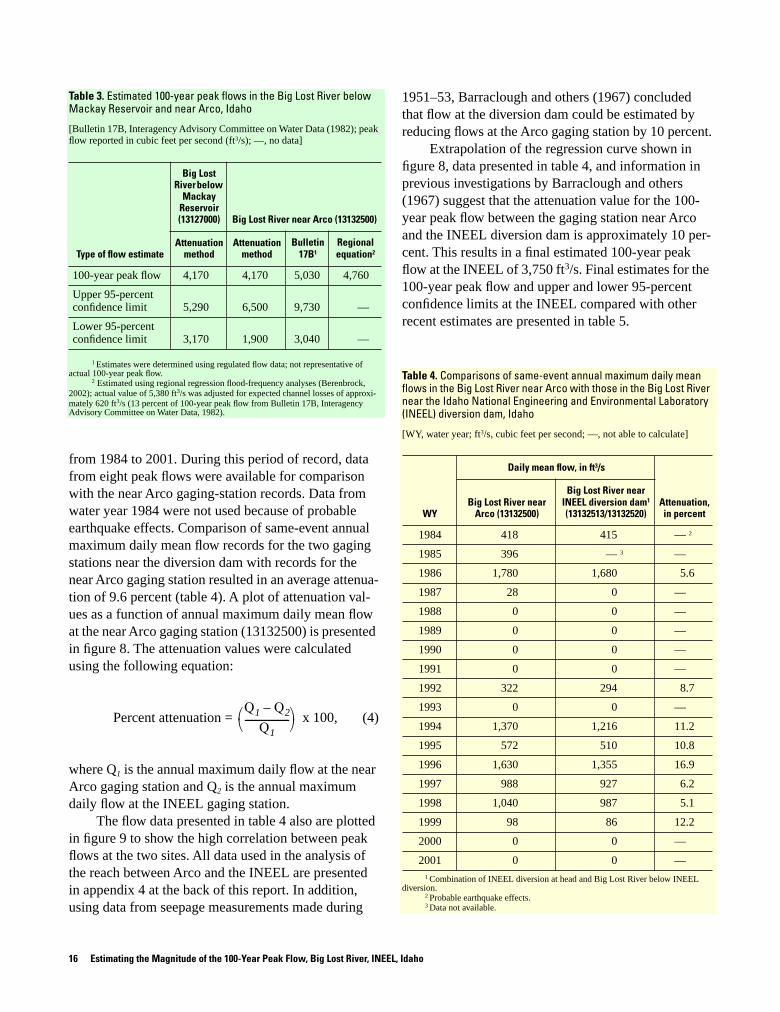
from 1984 to 2001. During this period of record, data from eight peak flows were available for comparison with the near Arco gaging-station records. Data from water year 1984 were not used because of probable earthquake effects. Comparison of same-event annual maximum daily mean flow records for the two gaging stations near the diversion dam with records for the near Arco gaging station resulted in an average attenua-tion of 9.6 percent (table 4). A plot of attenuation val-ues as a function of annual maximum daily mean flow at the near Arco gaging station (13132500) is presented in figure 8. The attenuation values were calculated using the following equation:
Percent attenuation = x 100, (4)
where Q1 is the annual maximum daily flow at the near Arco gaging station and Q2 is the annual maximum daily flow at the INEEL gaging station.
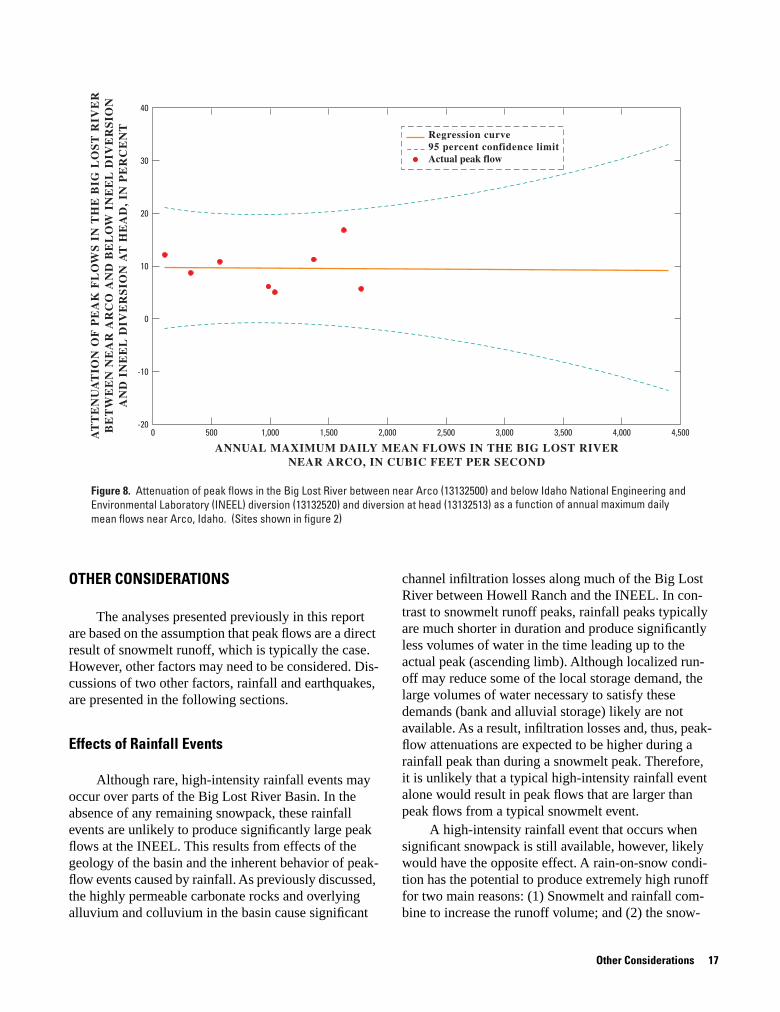
The flow data presented in table 4 also are plotted in figure 9 to show the high correlation between peak flows at the two sites. All data used in the analysis of the reach between Arco and the INEEL are presented in appendix 4 at the back of this report. In addition, using data from seepage measurements made during
1951–53, Barraclough and others (1967) concluded that flow at the diversion dam could be estimated by reducing flows at the Arco gaging station by 10 percent.
Extrapolation of the regression curve shown in figure 8, data presented in table 4, and information in previous investigations by Barraclough and others (1967) suggest that the attenuation value for the 100-year peak flow between the gaging station near Arco and the INEEL diversion dam is approximately 10 per-cent. This results in a final estimated 100-year peak flow at the INEEL of 3,750 ft3/s. Final estimates for the 100-year peak flow and upper and lower 95-percent confidence limits at the INEEL compared with other recent estimates are presented in table 5.
Q1 Q2–
Q1-------------------
Table 4. Comparisons of same-event annual maximum daily mean flows in the Big Lost River near Arco with those in the Big Lost River near the Idaho National Engineering and Environmental Laboratory (INEEL) diversion dam, Idaho
[WY, water year; ft3/s, cubic feet per second; —, not able to calculate]
WY
Daily mean flow, in ft3/s
Attenuation, in percent
Big Lost River near Arco (13132500)
Big Lost River near INEEL diversion dam1 (13132513/13132520)
1984 418 415 —.2
1985 396 —.3 —
1986 1,780 1,680 5.6
1987 28 0 —
1988 0 0 —
1989 0 0 —
1990 0 0 —
1991 0 0 —
1992 322 294 8.7
1993 0 0 —
1994 1,370 1,216 11.2
1995 572 510 10.8
1996 1,630 1,355 16.9
1997 988 927 6.2
1998 1,040 987 5.1
1999 98 86 12.2
2000 0 0 —
2001 0 0 —1 Combination of INEEL diversion at head and Big Lost River below INEEL
diversion.2 Probable earthquake effects.3 Data not available.
1 Estimates were determined using regulated flow data; not representative of actual 100-year peak flow.
2 Estimated using regional regression flood-frequency analyses (Berenbrock, 2002); actual value of 5,380 ft3/s was adjusted for expected channel losses of approxi-mately 620 ft3/s (13 percent of 100-year peak flow from Bulletin 17B, Interagency Advisory Committee on Water Data, 1982).
Table 3. Estimated 100-year peak flows in the Big Lost River below Mackay Reservoir and near Arco, Idaho
[Bulletin 17B, Interagency Advisory Committee on Water Data (1982); peak flow reported in cubic feet per second (ft3/s); —, no data]
Type of flow estimate
Big Lost River below
Mackay Reservoir (13127000) Big Lost River near Arco (13132500)
Attenuation method
Attenuation method
Bulletin 17B1
Regional equation2
100-year peak flow 4,170 4,170 5,030 4,760
Upper 95-percent confidence limit 5,290 6,500 9,730 —
Lower 95-percent confidence limit 3,170 1,900 3,040 —
16 Estimating the Magnitude of the 100-Year Peak Flow, Big Lost River, INEEL, Idaho
Other Considerations
1
Figure 8. Attenuation of peak flows in the Big Lost River between near Arco (13132500) and below Idaho National Engineering andEnvironmental Laboratory (INEEL) diversion (13132520) and diversion at head (13132513) as a function of annual maximum dailymean flows near Arco, Idaho. (Sites shown in figure 2)
0 500 1,000 1,500 2,5002,000 3,000 3,500 4,000 4,500
40
30
20
10
0
-10
-20
AT
TE
NU
AT
ION
OF
PE
AK
FL
OW
SIN
TH
EB
IGL
OS
TR
IVE
RB
ET
WE
EN
NE
AR
AR
CO
AN
DB
EL
OW
INE
EL
DIV
ER
SIO
NA
ND
INE
EL
DIV
ER
SIO
NA
TH
EA
D,
INP
ER
CE
NT
ANNUAL MAXIMUM DAILY MEAN FLOWS IN THE BIG LOST RIVERNEAR ARCO, IN CUBIC FEET PER SECOND
Regression curve95 percent confidence limitActual peak flow
OTHER CONSIDERA
TIONS
Other Considerations
.
The analyses presented pre
viously in this report are based on the assumption that peak flows are a direct result of snowmelt runoff, which is typically the case. However, other factors may need to be considered. Dis-cussions of two other factors, rainfall and earthquakes, are presented in the following sections.
Effects of Rainfall Events
Although rare, high-intensity rainf
all events may occur over parts of the Big Lost River Basin. In the absence of any remaining snowpack, these rainfall events are unlikely to produce significantly large peak flows at the INEEL. This results from effects of the geology of the basin and the inherent behavior of peak-flow events caused by rainfall. As previously discussed, the highly permeable carbonate rocks and overlying alluvium and colluvium in the basin cause significant
channel infiltration losses along much of the Big Lost River between Howell Ranch and the INEEL. In con-trast to snowmelt runoff peaks, rainfall peaks typically are much shorter in duration and produce significantly less volumes of water in the time leading up to the actual peak (ascending limb). Although localized run-off may reduce some of the local storage demand, the large volumes of water necessary to satisfy these demands (bank and alluvial storage) likely are not available. As a result, infiltration losses and, thus, peak-flow attenuations are expected to be higher during a rainfall peak than during a snowmelt peak. Therefore, it is unlikely that a typical high-intensity rainfall event alone would result in peak flows that are larger than peak flows from a typical snowmelt event.
A high-intensity rainfall event that occurs when significant snowpack is still available, however, likely would have the opposite effect. A rain-on-snow condi-tion has the potential to produce extremely high runoff for two main reasons: (1) Snowmelt and rainfall com-bine to increase the runoff volume; and (2) the snow-
Other Considerations
17
Figure 9. Combined maximum daily mean flows in the Big Lost River below Idaho National Engineering and Environmental Labora-tory diversion (13132520) and INEEL diversion at head (13132513) as a function of annual maximum daily mean flows in the Big LostRiver near Arco (13132500), Idaho. (Sites shown in figure 2)
3,000
2,500
2,000
1,500
1,000
500
00 500 1,000 1,500 2,000 2,500 3,000
CO
MB
INE
D A
NN
UA
L M
AX
IMU
M D
AIL
Y M
EA
N F
LO
WS
IN T
HE
BIG
LO
ST
RIV
ER
BE
LO
W I
NE
EL
DIV
ER
SIO
N A
ND
INE
EL
DIV
ER
SIO
N A
T H
EA
D,
IN C
UB
IC F
EE
T P
ER
SE
CO
ND
ANNUAL MAXIMUM DAILY MEAN FLOWS IN THE BIG LOST RIVERNEAR ARCO, IN CUBIC FEET PER SECOND
1965
r2=0.99
Regression curveMaximum daily mean flow1965—data point was not in- cluded in the developement of the regression curve
20%
0% attenuation
Figure 9. Combined maximum daily mean flows in the Big Lost River below Idaho National Engineering and Environmental Laboratory (INEEL) diversion (13132520) and INEEL diversion at head (13132513) as a function of annual maximum daily mean flows in the Big Lost River near Arco (13132500), Idaho. (Stations shown in figure 2)
pack has the potential to maintain soil moisture at high levels or keep the soil frozen, resulting in minimal infil-tration. The physiographic features of the basin (size, elevation, and elevation differential), however, make it unlikely for basinwide, high-intensity rainfall and min-imal infiltration conditions to occur simultaneously with maximal snowmelt. As discussed previously, snowmelt in the lower part of the basin typically occurs earlier in the runoff process, while runoff peaks from the upper part of the basin typically do not occur until mid- to late June. Thus, widespread, high-intensity rainfall most likely would not coincide with maximal runoff conditions across the entire basin. In addition, because of the two distinct runoff processes present in the basin, if snowmelt were occurring at higher eleva-tions, the snowpack likely would already have melted in the valley bottom. Lack of snowpack on the valley floor reduces the probability that high moisture levels
Table 5. Comparisons of final estimates of the 100-year peak flow and 95-percent confidence limits for the Big Lost River at the Idaho National Engineering and Environmental Laboratory (INEEL), Idaho
[Peak flow reported in cubic feet per second (ft3/s); —, no data]
Type of flow estimate
Big Lost River near
Arco (13132500)
Big Lost Rivernear INEEL diversion dam1
(13132513/13132520)
Attenuation method
Attenuation method
Kjelstrom and
Berenbrock2
Ostenaa and
others3
100-year peak flow 4,170 3,750 7,260 2,910
Upper 95-percent confidence limit 6,500 6,250 — 3,270
Lower 95-percent confidence limit 1,900 1,300 — 2,386
1 Combination of INEEL diversion at head and Big Lost River below INEEL diversion.
2 Kjelstrom and Berenbrock (1996).3 Ostenaa and others (1999).
18 Estimating the Magnitude of the 100-Year Peak Flow, Big Lost River, INEEL, Idaho

or frozen soil would minimize infiltration. Thus, although it is possible that rainfall in the upper basin could coincide with an above-average snowpack, infil-tration losses most likely would still be present in the valley bottom and result in attenuations similar to those seen during snowmelt-only events.
Possible Earthquake Effects
It is important to note that an earthquake in or near the Big Lost River Basin could significantly affect the way flood peaks are routed through the basin. The Borah Peak earthquake (Lost River Range, fig. 1), the largest recorded earthquake in Idaho, occurred on October 28, 1983, and registered 7.3 on the Richter scale. Immediate effects of this earthquake included a significant change in the ground-water and surface-water conditions in the basin. The most obvious effects were the occurrence of geyser-like extrusions of
ground water in the Chilly Buttes area and increased spring flow in the Thousand Springs Creek area (fig. 1) (Barney D. Lewis, U.S. Geological Survey, written commun., 1983). A significant increase in the base flow of the Big Lost River at the Howell Ranch gaging sta-tion, likely due to increased spring flow, was also evi-dent, as shown in figure 10. Base flow increased from approximately 200 ft3/s to nearly 400 ft3/s in the days immediately following the earthquake. In addition, the monthly average daily flows were the highest on record for the non-runoff months of November 1983 through March 1984. The November 1983 average flow was more than double that of any other November on record. Streamflow in subsequent months slowly decreased as the effects of the earthquake subsided.
The increased streamflow both upstream and downstream from the Howell Ranch gaging station resulted in inflows to Mackay Reservoir that, at times, were nearly five times normal. The average daily inflow to Mackay Reservoir from 1919 to 1960 for the
Other Considerations 19
Figure 10. Daily mean flows in the Big Lost River at Howell Ranch (13120500) during the 30-day period immediately preceeding andfollowing the Borah Peak, Idaho, earthquake on October 28, 1983.
550
500
450
400
350
300
250
200
150
100
50
015 1918 23 27 31 4 8 12
DA
ILY
ME
AN
FL
OW
S I
N T
HE
BIG
LO
ST
RIV
ER
AT
HO
WE
LL
RA
NC
H,
IN C
UB
IC F
EE
T P
ER
SE
CO
ND
1983OCTOBER NOVEMBER
16 17 222120 262524 302928 321 765 11109 151413
Bor
ah P
eak
eart
hqua
keO
ctob
er 2
8, 1
983
Figure 10. Daily mean flows in the Big Lost River at Howell Ranch (13120500) during the 30-day period immediately preceding and following the Borah Peak, Idaho, earthquake on October 28, 1983.

month of November was 169 ft3/s; the average daily inflow in November 1983 was 617 ft3/s (Barney D. Lewis, U.S. Geological Survey, written commun., 1983). The average daily flow in November at the Howell Ranch gaging station for the entire period of record is 107 ft3/s; that for November 1983 was 373 ft3/s. On the basis of average daily flows for November, the stream reach between Howell Ranch and Mackay Reservoir would be expected to gain approximately 60 ft3/s. In November 1983, however, the same stream reach gained more than 240 ft3/s.
Similar effects were also present in the reach between Mackay Reservoir and Arco. The average out-flow from Mackay Reservoir in November 1983 was 660 ft3/s, compared with an average flow of 759 ft3/s at the Arco gaging station. The November average daily flow below Mackay Reservoir for the entire period of record is approximately 106 ft3/s, and the long-term
November average at Arco is approximately 85 ft3/s. On the basis of these average daily flows for Novem-ber, the stream reach between Mackay Reservoir and Arco would be expected to lose approximately 21 ft3/s. In November 1983, however, the same stream reach gained approximately 99 ft3/s. Streamflow gains within this reach continued to some degree through April 1984 (fig. 11). Sufficient tributary base flows exist within this reach to account for the increase in streamflow; however, as shown previously, losses are prevalent within this reach until flows approach the 4,000 ft3/s range. Thus, the earthquake likely affected local condi-tions to the extent that net losses were reduced at least to an amount that allowed for gains in streamflow within the reach.
In contrast to flow conditions in the upstream reaches, the local flow conditions downstream from Arco did not seem to be affected by the earthquake.
20 Estimating the Magnitude of the 100-Year Peak Flow, Big Lost River, INEEL, Idaho
Figure 11. Daily mean flows in the Big Lost River below Mackey Reservoir (13127000) and Big Lost River near Arco (13132500)before and after the Borah Peak, Idaho, earthquake on October 28, 1983.
1,800
1,600
1,400
1,200
1,000
800
600
400
200
0September November AprilFebruaryOctober December January March May
DA
ILY
ME
AN
FL
OW
S I
N T
HE
BIG
LO
ST
RIV
ER
,IN
CU
BIC
FE
ET
PE
R S
EC
ON
D
MONTH
Bor
ah P
eak
eart
hqua
keO
ctob
er 2
8, 1
983
Big Lost Riverbelow Mackey Reservoir
Big Lost Rivernear Arco
Figure 11. Daily mean flows in the Big Lost River below Mackay Reservoir (13127000) and near Arco (13132500) preceding and following the Borah Peak, Idaho, earthquake on October 28, 1983.

Average daily flows in November at the INEEL diver-sion dam were approximately 660 ft3/s (Barney D. Lewis, U.S. Geological Survey, written commun., 1983), compared with the 759 ft3/s average at the Arco gaging station. These values result in an average atten-uation of about 13 percent, which is comparable to the estimated 10-percent value previously determined.
On the basis of the data available, it is apparent that local flow conditions could be affected for an extended period of time following an earthquake, which would increase the probability that a large peak flow could occur while these conditions exist. A 100-year peak flow at the Howell Ranch gaging station, coinciding with gaining or even zero-loss conditions in the lower basin, likely would result in a peak flow at the INEEL site equal to the Howell Ranch peak flow plus other peak flows or high base flows from interme-diate tributaries. For example, given zero-loss condi-tions, a combination of a 100-year peak flow from the Big Lost River at Howell Ranch (table 1), a high base flow from Antelope Creek (estimated to be 210 ft3/s by Hortness and Berenbrock, 2001), and an estimated combined base flow of 250 ft3/s from other small tribu-taries (Hortness and Berenbrock, 2001) could increase the peak flow by as much as 1,100 ft3/s at the gaging station near Arco.
SUMMARYSummary.
Recent studies by the Bureau of Reclamation and the U.S. Geological Survey resulted in a large differ-ence in estimates of the 100-year peak flow for the Big Lost River near the western boundary of the Idaho National Engineering and Environmental Laboratory (INEEL). These estimates ranged from 2,910 ft3/s to 7,260 ft3/s. This study was undertaken to help resolve the large discrepancy in these earlier estimates of the 100-year peak flow.
Regression models that compared annual peak flows between successive upstream and downstream gaging stations for the same flow event and peak-flow attenuation values as a function of upstream peak flows were used to estimate the magnitude of the 100-year peak flow for the Big Lost River near the western boundary of the INEEL. The analysis integrated the cumulative effects of in-channel storage, infiltration losses, and tributary inflows on the magnitude of peak flows for return periods that were presumed to be less than 100 years. Peak flows with an estimated recur-
rence interval of 100 years were predicted by extrapo-lating attenuation trends.
The confidence limits for the 100-year peak-flow estimate at the Howell Ranch gaging station were derived from the three-parameter log-Pearson Type III analysis used to determine the estimate. Upper and lower 95-percent confidence limits for the final esti-mate of the 100-year peak flow were determined by combining the error associated with the estimate at Howell Ranch with the errors associated with the esti-mates derived from the regression analyses. All other confidence limits were determined by combining the errors at Howell Ranch with those resulting from the attenuation regression analyses for each specific sub-reach.
The regression models indicated that, in the upper reach of the Big Lost River, between Howell Ranch and Mackay Reservoir, downstream peak flows above Mackay Reservoir are lower than upstream peak flows at Howell Ranch. In this reach of the river, the peak-flow attenuation, expressed as the ratio of peak-flow differences between the upstream and downstream gaging stations divided by the peak flow of the upstream station, decreases nonlinearly as the magni-tude of the peak flow increases. The attenuation value approaches 13 percent for flows approaching the 100-year peak flow at Howell Ranch. The regression mod-els (r2 = 0.48 and 0.93) for this reach of the river indi-cated that the rate of increase in losses attributable to in-channel storage, bank storage, and infiltration either decreases as the flow increases or is partially offset by tributary inflows during periods of very high flow.
Historical evidence indicates that Mackay Reser-voir has had little or no effect on the magnitude of annual peak flows. This reservoir is operated as a stor-age reservoir to provide water for irrigation in the Big Lost River Valley. Measurement records indicate that peak flows generally occur after the reservoir has filled. Because of this and because Mackay Reservoir is not operated as a flood-control structure, it was assumed to have no effect on peak flows.
Regression models for the lower reach of the Big Lost River, between Mackay Reservoir and Arco (r2 = 0.33 and 0.59), indicated that downstream peak flows are also lower than upstream peak flows. How-ever, in contrast to the upper reach, peak-flow attenua-tion values decrease linearly as the magnitude of the peak flow increases. The peak-flow attenuation in this reach of the river approaches zero for flows approach-ing the 100-year peak-flow estimate immediately
Summary 21

upstream and downstream from Mackay Reservoir. This behavior indicates that contributions to peak flow from tributary drainages along this reach of the river likely exceed the effects of in-channel storage and infil-tration losses during periods of very high flow.
The resulting analysis produced an estimate of the 100-year peak flow near Arco of 4,170 ft3/s with upper and lower 95-percent confidence limits of 6,500 ft3/s and 1,900 ft3/s, respectively. This estimate of the 100-year peak flow is about 17.1 percent less than the esti-mate derived from application of Bulletin 17B guide-lines (5,030 ft3/s) to the 51 years of regulated gaging-station record near Arco. However, the range between the upper and lower confidence limits (9,730 ft3/s to 3,040 ft3/s, respectively) determined using the Arco gaging record and Bulletin 17B guidelines is consider-ably larger than that resulting from adjustments applied to the uncertainty limits for the 100-year peak flow originating at Howell Ranch using the attenuation regression models. These large differences in uncer-tainty limits probably reflect the effects of irrigation diversions in the river reach between Mackay Reser-voir and Arco and, to some extent, Mackay Reservoir flow regulation during below-normal water years.
The expected attenuation value of 10 percent between Arco and the INEEL diversion dam obtained from analysis of maximum daily mean flows agrees with the value presented by Barraclough and others. Applying this estimate to the reach of the river between Arco and the INEEL diversion dam resulted in an esti-mate of the 100-year peak flow for the Big Lost River immediately upstream from the INEEL diversion dam of 3,750 ft3/s; upper and lower 95-percent confidence limits were 6,250 ft3/s and 1,300 ft3/s, respectively.
Localized rainfall, even of high intensity, is not likely to produce large peak flows at the INEEL because of high loss rates along much of the stream channel. The relatively short flow durations resulting from rainstorms historically have not provided suffi-cient volumes of water to satisfy local storage demands. Only when these storage demands have been met will the loss rates decrease enough for significant peak flows to reach the INEEL site.
The effects of the October 1983 Borah Peak earth-quake on measured flows in the Big Lost River were examined as part of this study. The data indicated that the magnitude 7.3 earthquake produced measurable increases in base flow in many reaches of the river. Most notably, the reach immediately upstream from Arco changed from a losing to a gaining reach for a
period of time following the earthquake. Although it was beyond the scope of this study to assign a probabil-ity to the joint occurrence of a large earthquake and a 100-year peak flow, the impact of such an event on esti-mates of the 100-year peak flow were defined on the basis of how the event affected normal flow conditions in the basin. The resulting analysis indicated that such a joint occurrence could be expected to increase the magnitude of the 100-year peak flow by as much as 1,100 ft3/s at the gaging station near Arco.
REFERENCES CITEDReferences Cited.
Barraclough, J.T., Teasdale, W.E., and Jensen, R.G., 1967, Hydrology of the National Reactor Testing Station, Idaho, 1965: U.S. Geological Survey Open-File Report, 107 p.
Bennett, C.M., 1986, Capacity of the diversion channel below the flood-control dam on the Big Lost River at the Idaho National Engineering Laboratory, Idaho: U.S. Geological Survey Water-Resources Investigations Report 86 – 4204, 25 p.
Berenbrock, Charles, 2002, Estimating the magnitude of peak flows at selected recurrence intervals for streams in Idaho: U.S. Geological Survey Water-Resources Investigations Report 02 – 4170, 59 p.
Boas, M.L., 1966, Mathematical methods in the physi-cal sciences: New York, John Wiley and Sons, 793 p.
Carrigan, P.H., 1972, Probability of exceeding capacity of flood-control system at the National Reactor Testing Station, Idaho: U.S. Geological Survey Open-File Report, 102 p.
Crosthwaite, E.G., Thomas, C.A., and Dyer, K.L., 1970, Water resources in the Big Lost River Basin, south-central Idaho: U.S. Geological Survey Open-File Report, 109 p., 4 pls.
Druffel, Leroy, Stiltner, G.J., and Keefer, T.N., 1979, Probable hydrologic effects of a hypothetical fail-ure of Mackay Dam on the Big Lost River Valley from Mackay, Idaho, to the Idaho National Engi-neering Laboratory: U.S. Geological Survey Water-Resources Investigations Report 79 – 99, 47 p.
Hortness, J.E., and Berenbrock, Charles, 2001, Esti-mating monthly and annual streamflow statistics at ungaged sites in Idaho: U.S. Geological Survey
22 Estimating the Magnitude of the 100-Year Peak Flow, Big Lost River, INEEL, Idaho

Water-Resources Investigations Report 01 – 4093, 36 p.
Interagency Advisory Committee on Water Data, 1982, Guidelines for determining flood flow frequency, Bulletin #17B of the Hydrology Subcommittee: Reston, Va., U.S. Geological Survey, Office of Water Data Coordination, 183 p.
Kjelstrom, L.C., and Berenbrock, Charles, 1996, Esti-mated 100-year peak flows and flow volumes in the Big Lost River and Birch Creek at the Idaho National Engineering Laboratory, Idaho: U.S. Geological Survey Water-Resources Investiga-tions Report 96 – 4163, 23 p.
Koslow, K.N., and Van Haaften, D.H., 1986, Flood routing analysis for a failure of Mackay Dam: Idaho Falls, Idaho, EG&G Idaho, Inc., EFF – EP – 7184, 33 p.
Lamke, R.D., 1969, Stage-discharge relations on Big Lost River within National Reactor Testing Sta-tion, Idaho: U.S. Geological Survey Open-File Report, 29 p.
Nobel, C., 1980, A two-dimensional analysis of flood-ing of the Big Lost River below Box Canyon Outlet: Idaho Falls, Idaho, EG&G Idaho, Inc., EFF – EI – 80 – 2, 26 p.
Ostenaa, D.A., Levish, D.R., Klinger, R.E., and O’Connell, D.R.H., 1999, Phase 2 paleohydro-logic and geomorphic studies for the assessment of flood risk for the Idaho National Engineering and Environmental Laboratory, Idaho: Bureau of Reclamation Report 99 – 7, 112 p., 4 apps.
Rathburn, S.L., 1989, Pleistocene glacial outburst flooding along the Big Lost River, east-central
Idaho: Tucson, Ariz., University of Arizona, M.S. thesis, 41 p.
____1991, Quaternary channel changes and paleo-flooding along the Big Lost River, Idaho National Engineering Laboratory: Laramie, Wyo., TriHy-dro Corporation, prepared for EG&G Idaho, Inc., EFF – WM – 9909, 33 p.
Stearns, H.T., Crandall, Lynn, and Steward, W.G., 1938, Geology and ground-water resources of the Snake River Plain in southeastern Idaho: U.S. Geological Survey Water-Supply Paper 774, 268 p.
U.S. Army Corps of Engineers, 1967, Postflood report, flood of June-July 1967, Big Lost River, Idaho: Walla Walla, Wash., U.S. Army Corps of Engi-neers, 15 p.
____1991, Feasibility report, Big Lost River Basin, Idaho: Walla Walla, Wash., U.S. Army Corps of Engineers, variously paged.
U.S. Department of Agriculture, 1989, Soil Conserva-tion Service (draft), Mackay Reservoir Operations and Management Guide, Custer County, Idaho, June 1989: Boise, Idaho, U.S. Department of Agriculture, 85 p.
Williams, R.P., and Krupin, P.J., 1984, Erosion, chan-nel change, and sediment transport in the Big Lost River, Idaho: U.S. Geological Survey Water-Resources Investigations Report 84 – 4147, 87 p.
Wright, A.E., 1903, Report on irrigation in the valley of Lost River, Idaho: U.S. Department of Agriculture Circular No. 58, 43 p.
References Cited 23

Appendices
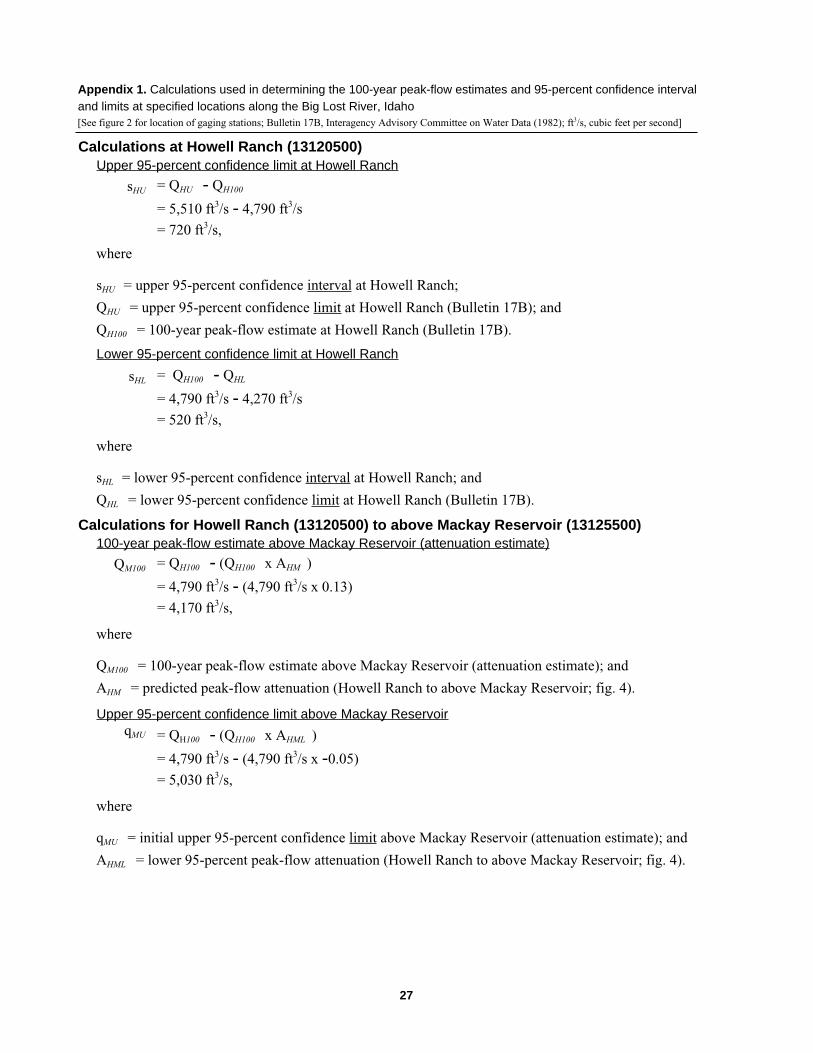
Appendix 1. Calculations used in determining the 100-year peak-flow estimates and 95-percent confidence interval and limits at specified locations along the Big Lost River, Idaho [See figure 2 for location of gaging stations; Bulletin 17B, Interagency Advisory Committee on Water Data (1982); ft3/s, cubic feet per second]
Calculations at Howell Ranch (13120500) Upper 95-percent confidence limit at Howell Ranch
sHU = QHU - QH100
= 5,510 ft3/s - 4,790 ft3/s
= 720 ft3/s,
where
sHU = upper 95-percent confidence interval at Howell Ranch;
QHU = upper 95-percent confidence limit at Howell Ranch (Bulletin 17B); and
QH100 = 100-year peak-flow estimate at Howell Ranch (Bulletin 17B).
Lower 95-percent confidence limit at Howell Ranch
=sHL QH100 - QHL
= 4,790 ft3/s - 4,270 ft3/s
= 520 ft3/s,
where
sHL = lower 95-percent confidence interval at Howell Ranch; and
QHL = lower 95-percent confidence limit at Howell Ranch (Bulletin 17B).
Calculations for Howell Ranch (13120500) to above Mackay Reservoir (13125500) 100-year peak-flow estimate above Mackay Reservoir (attenuation estimate)
QM100 = QH100 - (QH100 x AHM )
= 4,790 ft3/s - (4,790 ft3/s x 0.13)
= 4,170 ft3/s,
where
QM100 = 100-year peak-flow estimate above Mackay Reservoir (attenuation estimate); and
AHM = predicted peak-flow attenuation (Howell Ranch to above Mackay Reservoir; fig. 4).
Upper 95-percent confidence limit above Mackay Reservoir qMU = QH100 - (QH100 x AHML )
= 4,790 ft3/s - (4,790 ft3/s x -0.05)
= 5,030 ft3/s,
where
qMU = initial upper 95-percent confidence limit above Mackay Reservoir (attenuation estimate); and
AHML = lower 95-percent peak-flow attenuation (Howell Ranch to above Mackay Reservoir; fig. 4).
27
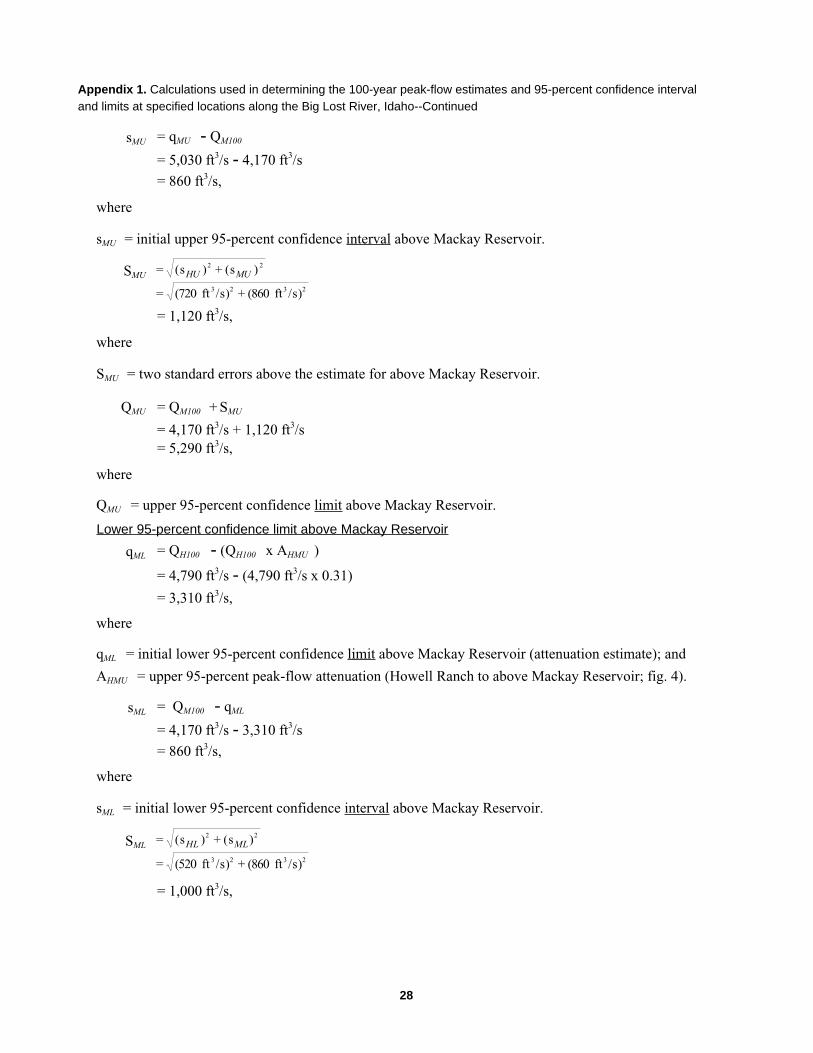
Appendix 1. Calculations used in determining the 100-year peak-flow estimates and 95-percent confidence interval and limits at specified locations along the Big Lost River, Idaho--Continued
sMU = qMU - QM100
= 5,030 ft3/s - 4,170 ft3/s
= 860 ft3/s,
where
sMU = initial upper 95-percent confidence interval above Mackay Reservoir.
SMU =
=
22 ) (s+ ) (s MU HU
23 2 3 /s) ft (860 + /s) ft (720
= 1,120 ft3/s,
where
SMU = two standard errors above the estimate for above Mackay Reservoir.
QMU = QM100 + SMU
= 4,170 ft3/s + 1,120 ft3/s = 5,290 ft3/s,
where
QMU = upper 95-percent confidence limit above Mackay Reservoir.
Lower 95-percent confidence limit above Mackay Reservoir
qML = QH100 - (QH100 x AHMU )
= 4,790 ft3/s - (4,790 ft3/s x 0.31)
= 3,310 ft3/s,
where
qML = initial lower 95-percent confidence limit above Mackay Reservoir (attenuation estimate); and
AHMU = upper 95-percent peak-flow attenuation (Howell Ranch to above Mackay Reservoir; fig. 4).
=sML QM100 - qML
= 4,170 ft3/s - 3,310 ft3/s
= 860 ft3/s,
where
sML = initial lower 95-percent confidence interval above Mackay Reservoir.
SML =
=
22 ) (s+ ) (s ML HL
23 2 3 /s) ft (860 + /s) ft (520
= 1,000 ft3/s,
28

Appendix 1. Calculations used in determining the 100-year peak-flow estimates and 95-percent confidence interval and limits at specified locations along the Big Lost River, Idaho--Continued
where
SML = two standard errors below the estimate for above Mackay Reservoir.
QML = QM100 - SML
= 4,170 ft3/s - 1,000 ft3/s
= 3,170 ft3/s,
where
QML = lower 95-percent confidence limit above Mackay Reservoir.
Calculations from below Mackay Reservoir (13127000) to near Arco (13132500) 100-year peak-flow estimate above Mackay Reservoir (attenuation estimate)
QA100 = QM100 - (QM100 x AMA )
= 4,170 ft3/s - (4,170 ft3/s x 0.0)
= 4,170 ft3/s,
where
QA100 = 100-year peak-flow estimate near Arco (attenuation estimate); and
AMA = predicted peak-flow attenuation (below Mackay Reservoir to near Arco; fig. 6).
Upper 95-percent confidence limit near Arco
qAU = QM100 - (QM100 x AMAL )
= 4,170 ft3/s - (4,170 ft3/s x -0.49)
= 6,210 ft3/s,
where
qAU = initial upper 95-percent confidence limit near Arco (attenuation estimate); and
AMAL = lower 95-percent peak-flow attenuation (below Mackay Reservoir to near Arco; fig. 6).
sAU = qAU - QA100
= 6,210 ft3/s - 4,170 ft3/s
= 2,040 ft3/s,
where
sAU = initial upper 95-percent confidence interval near Arco.
SAU = 22 2 ) (s + ) (s+ ) (s AU MU HU
=
= 2,330 ft3/s,
23 2 3 2 3 /s) ft (2,040 + /s) ft (860 + /s) ft (720
29

Appendix 1. Calculations used in determining the 100-year peak-flow estimates and 95-percent confidence interval and limits at specified locations along the Big Lost River, Idaho--Continued
where
SAU = two standard errors above the estimate for near Arco.
QAU = QA100 + SAU
= 4,170 ft3/s + 2,330 ft3/s = 6,500 ft3/s,
where
QAU = upper 95-percent confidence limit near Arco.
Lower 95-percent confidence limit near Arco qAL = QM100 - (QM100 x AMAU )
= 4,170 ft3/s - (4,170 ft3/s x 0.49)
= 2,130 ft3/s,
where
qAL = initial lower 95-percent confidence limit near Arco (attenuation estimate); and
AMAU = upper 95-percent peak-flow attenuation (below Mackay Reservoir to near Arco; fig. 6).
sAL = QA100 - qAL
= 4,170 ft3/s - 2,130 ft3/s
= 2,040 ft3/s,
where
sAL = initial lower 95-percent confidence interval near Arco.
SAL = 22 2 ) (s + ) (s+ ) (s AL ML HL
=
= 2,270 ft3/s,
where
SAL = two standard errors below the estimate for near Arco.
23 2 3 2 3 /s) ft (2,040 + /s) ft (860 + /s) ft (520
QAL = QA100 - SAL
= 4,170 ft3/s - 2,270 ft3/s
= 1,900 ft3/s,
where
QAL = lower 95-percent confidence limit near Arco.
30

Appendix 1. Calculations used in determining the 100-year peak-flow estimates and 95-percent confidence interval and limits at specified locations along the Big Lost River, Idaho--Continued
Calculations from near Arco (13132500) to near INEEL diversion dam 100-year peak-flow estimate near INEEL diversion dam (attenuation estimate)
QI100 = QA100 - (QA100 x AAI )
= 4,170 ft3/s - (4,170 ft3/s x 0.10)
= 3,750 ft3/s,
where
QI100 = 100-year peak-flow estimate near INEEL diversion dam (attenuation estimate); and
AAI = predicted peak-flow attenuation (near Arco to near INEEL diversion dam; fig. 8).
Upper 95-percent confidence limit near INEEL diversion dam qIU = QA100 - (QA100 x AAIL )
= 4,170 ft3/s - (4,170 ft3/s x -0.12)
= 4,670 ft3/s,
where
qIU = initial upper 95-percent confidence limit near INEEL diversion dam (attenuation estimate); and
AAIL = lower 95-percent peak-flow attenuation (near Arco to near INEEL diversion dam; fig. 8).
sIU = qIU - QI100
= 4,670 ft3/s - 3,750 ft3/s
= 920 ft3/s,
where
sIU = initial upper 95-percent confidence interval near INEEL diversion dam.
SIU = 22 2 2 ) (s+ ) (s+ ) (s+ ) (s IU AU MU HU
= (720 /s) (860 /s) (2,040 /s) (920 /s)
= 2,500 ft3/s,
where
SIU = two standard errors above the estimate near INEEL diversion dam.
QIU = QI100 + SIU
= 3,750 ft3/s + 2,500 ft3/s = 6,250 ft3/s,
where
QIU = upper 95-percent confidence limit near INEEL diversion dam.
23232323 ft+ft+ft+ft
31

Appendix 1. Calculations used in determining the 100-year peak-flow estimates and 95-percent confidence interval and limits at specified locations along the Big Lost River, Idaho--Continued
Lower 95-percent confidence limit near INEEL diversion dam qIL = QA100 - (QA100 x AAIU )
= 4,170 ft3/s - (4,170 ft3/s x 0.32)
= 2,830 ft3/s,
where
qIL = initial lower 95-percent confidence limit near INEEL diversion dam (attenuation estimate); and
AAIU = upper 95-percent peak-flow attenuation (near Arco to near INEEL diversion dam; fig. 8).
=sIL QI100 - qIL
= 3,750 ft3/s - 2,830 ft3/s
= 920 ft3/s,
where
sIL = initial lower 95-percent confidence interval near INEEL diversion dam.
SIL = 22 2 2 ) (s+ ) (s+ ) (s+ ) (s IL AL ML HL
= (520 /s) (860 /s) (2,040 /s) (920 /s) 2
= 2,450 ft3/s,
where
SIL = two standard errors below the estimate near INEEL diversion dam.
QIL = QI100 - SIL
= 3,750 ft3/s - 2,450 ft3/s
= 1,300 ft3/s,
where
QIL = lower 95-percent confidence limit near INEEL diversion dam.
3232323 ft+ft+ft+ft
32
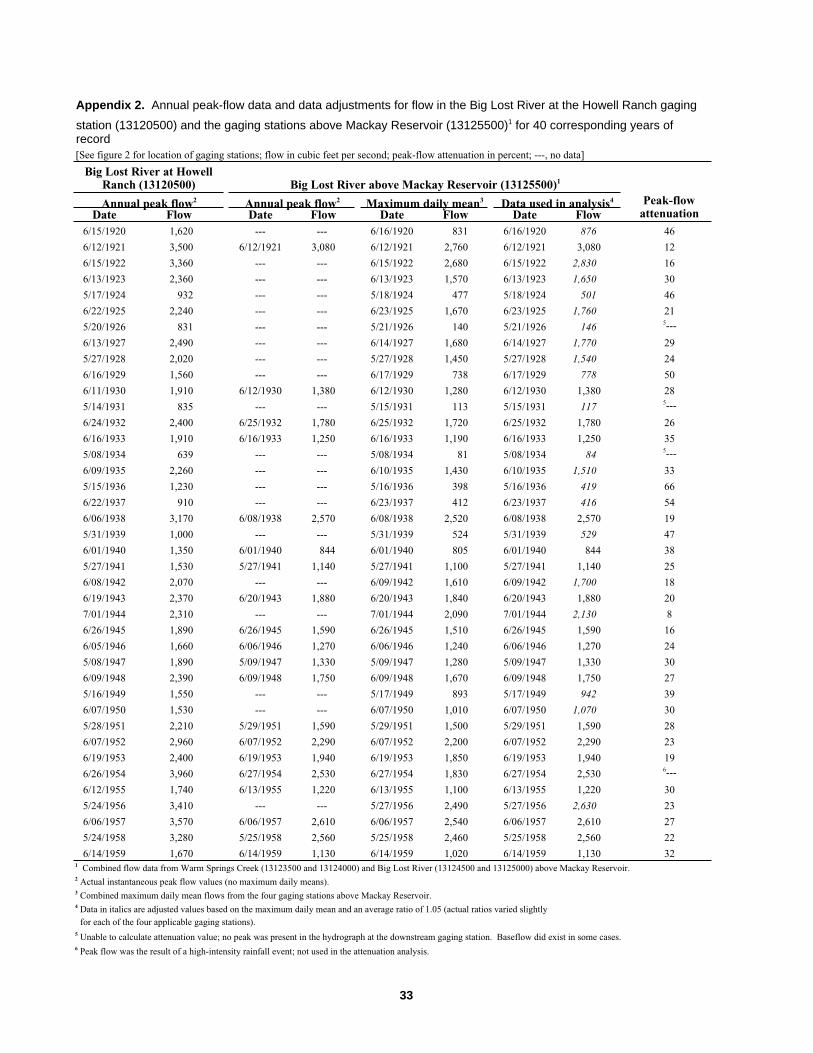
---
---
---
---
---
---
---
---
---
---
---
---
---
---
---
---
---
---
---
---
---
---
---
---
---
---
---
---
---
---
---
---
---
---
---
---
---
---
---
---
Appendix 2. Annual peak-flow data and data adjustments for flow in the Big Lost River at the Howell Ranch gaging
station (13120500) and the gaging stations above Mackay Reservoir (13125500)1 for 40 corresponding years of record [See figure 2 for location of gaging stations; flow in cubic feet per second; peak-flow attenuation in percent; ---, no data]
Big Lost River at Howell Ranch (13120500) Big Lost River above Mackay Reservoir (13125500)1
Annual peak flow2 Annual peak flow2 Maximum daily mean3 Data used in analysis4 Peak-flow Date Flow Date Flow Date Flow Date Flow attenuation
6/15/1920 1,620 6/16/1920 831 6/16/1920 876 46
6/12/1921 3,500 6/12/1921 3,080 6/12/1921 2,760 6/12/1921 3,080 12
6/15/1922 3,360 6/15/1922 2,680 6/15/1922 2,830 16
6/13/1923 2,360 6/13/1923 1,570 6/13/1923 1,650 30
5/17/1924 932 5/18/1924 477 5/18/1924 501 46
6/22/1925 2,240 6/23/1925 1,670 6/23/1925 1,760 21
5/20/1926 831 5/21/1926 140 5/21/1926 146 5---
6/13/1927 2,490 6/14/1927 1,680 6/14/1927 1,770 29
5/27/1928 2,020 5/27/1928 1,450 5/27/1928 1,540 24
6/16/1929 1,560 6/17/1929 738 6/17/1929 778 50
6/11/1930 1,910 6/12/1930 1,380 6/12/1930 1,280 6/12/1930 1,380 28
5/14/1931 835 5/15/1931 113 5/15/1931 117 5---
6/24/1932 2,400 6/25/1932 1,780 6/25/1932 1,720 6/25/1932 1,780 26
6/16/1933 1,910 6/16/1933 1,250 6/16/1933 1,190 6/16/1933 1,250 35
5/08/1934 639 5/08/1934 81 5/08/1934 84 5---
6/09/1935 2,260 6/10/1935 1,430 6/10/1935 1,510 33
5/15/1936 1,230 5/16/1936 398 5/16/1936 419 66
6/22/1937 910 6/23/1937 412 6/23/1937 416 54
6/06/1938 3,170 6/08/1938 2,570 6/08/1938 2,520 6/08/1938 2,570 19
5/31/1939 1,000 5/31/1939 524 5/31/1939 529 47
6/01/1940 1,350 6/01/1940 844 6/01/1940 805 6/01/1940 844 38
5/27/1941 1,530 5/27/1941 1,140 5/27/1941 1,100 5/27/1941 1,140 25
6/08/1942 2,070 6/09/1942 1,610 6/09/1942 1,700 18
6/19/1943 2,370 6/20/1943 1,880 6/20/1943 1,840 6/20/1943 1,880 20
7/01/1944 2,310 7/01/1944 2,090 7/01/1944 2,130 8
6/26/1945 1,890 6/26/1945 1,590 6/26/1945 1,510 6/26/1945 1,590 16
6/05/1946 1,660 6/06/1946 1,270 6/06/1946 1,240 6/06/1946 1,270 24
5/08/1947 1,890 5/09/1947 1,330 5/09/1947 1,280 5/09/1947 1,330 30
6/09/1948 2,390 6/09/1948 1,750 6/09/1948 1,670 6/09/1948 1,750 27
5/16/1949 1,550 5/17/1949 893 5/17/1949 942 39
6/07/1950 1,530 6/07/1950 1,010 6/07/1950 1,070 30
5/28/1951 2,210 5/29/1951 1,590 5/29/1951 1,500 5/29/1951 1,590 28
6/07/1952 2,960 6/07/1952 2,290 6/07/1952 2,200 6/07/1952 2,290 23
6/19/1953 2,400 6/19/1953 1,940 6/19/1953 1,850 6/19/1953 1,940 19
6/26/1954 3,960 6/27/1954 2,530 6/27/1954 1,830 6/27/1954 2,530 6---
6/12/1955 1,740 6/13/1955 1,220 6/13/1955 1,100 6/13/1955 1,220 30
5/24/1956 3,410 5/27/1956 2,490 5/27/1956 2,630 23
6/06/1957 3,570 6/06/1957 2,610 6/06/1957 2,540 6/06/1957 2,610 27
5/24/1958 3,280 5/25/1958 2,560 5/25/1958 2,460 5/25/1958 2,560 22
6/14/1959 1,670 6/14/1959 1,130 6/14/1959 1,020 6/14/1959 1,130 32 1 Combined flow data from Warm Springs Creek (13123500 and 13124000) and Big Lost River (13124500 and 13125000) above Mackay Reservoir. 2 Actual instantaneous peak flow values (no maximum daily means). 3 Combined maximum daily mean flows from the four gaging stations above Mackay Reservoir. 4 Data in italics are adjusted values based on the maximum daily mean and an average ratio of 1.05 (actual ratios varied slightly
for each of the four applicable gaging stations). 5 Unable to calculate attenuation value; no peak was present in the hydrograph at the downstream gaging station. Baseflow did exist in some cases. 6 Peak flow was the result of a high-intensity rainfall event; not used in the attenuation analysis.
33

Appendix 3. Annual peak-flow data and data adjustments for flow in the Big Lost River at the gaging stations below Mackay Reservoir (13127000) and near Arco (13132500) for 51 corresponding years of record [See figure 2 for location of gaging stations; flow in cubic feet per second; peak-flow attenuation in percent; ---, no data]
Big Lost River below Mackay Reservoir
(13127000) Big Lost River near Arco (13132500)
Annual peak flow1 Annual peak flow1 Maximum daily mean2 Data used in analysis3 Peak-flow Date Flow Date Flow Date Flow Date Flow attenuation
5/10/1947 1,120 --- --- 5/14/1947 275 5/14/1947 294 74
6/10/1948 1,790 6/15/1948 171 6/15/1948 137 6/15/1948 171 90
6/15/1949 1,030 --- --- 6/17/1949 27 --- --- 4---
7/07/1950 911 --- --- 7/11/1950 49 --- --- 4---
5/30/1951 1,790 --- --- 6/03/1951 214 6/03/1951 229 87
6/08/1952 2,130 6/11/1952 698 6/11/1952 681 6/11/1952 698 67
6/21/1953 1,730 --- --- 6/22/1953 209 6/22/1953 224 87
6/27/1954 1,860 --- --- 7/01/1954 26 --- --- 4---
6/14/1955 1,130 --- --- 6/19/1955 8 --- --- 4---
6/03/1956 2,530 --- --- 6/07/1956 962 6/07/1956 1,030 59
6/08/1957 2,400 6/11/1957 909 6/11/1957 892 6/11/1957 909 62
5/26/1958 2,520 6/01/1958 1,190 6/01/1958 1,170 6/01/1958 1,190 53
5/14/1959 1,110 --- --- 5/16/1959 14 --- --- 4---
6/07/1960 1,070 --- --- 6/10/1960 0 --- --- 4---
7/15/1961 686 --- --- 7/18/1961 0 --- --- 4---
6/27/1965 2,570 6/29/1965 2,500 --- --- 6/29/1965 2,500 3
6/01/1966 786 --- --- 6/11/1966 27 --- --- 4---
6/23/1967 2,430 --- --- 6/26/1967 1,570 6/26/1967 1,680 31
6/20/1968 1,620 --- --- 6/23/1968 82 --- --- 4---
5/28/1969 1,540 --- --- 5/29/1969 720 5/29/1969 770 50
6/28/1970 2,150 6/30/1970 738 6/30/1970 705 6/30/1970 738 66
6/24/1971 2,200 6/30/1971 1,220 6/30/1971 1,190 6/30/1971 1,220 45
6/18/1972 1,480 --- --- 6/19/1972 139 6/19/1972 149 90
5/25/1973 1,090 --- --- 5/28/1973 16 --- --- 4---
6/21/1974 2,810 6/23/1974 1,260 6/23/1974 1,240 6/23/1974 1,260 55
7/14/1975 2,080 --- --- 7/16/1975 1,130 7/16/1975 1,130 46
5/27/1976 1,430 --- --- 5/31/1976 80 --- --- 4---
6/10/1977 772 --- --- 6/11/1977 15 --- --- 4---
6/12/1978 1,360 --- --- 6/16/1978 44 --- --- 4---
5/28/1979 1,580 --- --- 5/30/1979 42 --- --- 4---
7/04/1980 1,670 --- --- 7/05/1980 300 7/05/1980 321 81
6/09/1981 2,230 6/12/1981 523 6/12/1981 488 6/12/1981 523 77
6/30/1982 2,490 7/02/1982 1,430 7/02/1982 1,420 7/02/1982 1,430 43
6/14/1983 2,070 --- --- 6/15/1983 1,460 6/15/1983 1,560 25
6/30/1984 2,030 --- --- 7/02/1984 1,070 7/02/1984 1,140 44
6/12/1985 936 --- --- 6/17/1985 9 --- --- 4---
6/06/1986 2,990 6/09/1986 1,860 6/09/1986 1,750 6/09/1986 1,860 38
5/26/1987 818 --- --- 5/29/1987 25 --- --- 4---
6/21/1988 725 --- --- 6/24/1988 0 --- --- 4---
6/23/1989 623 --- --- 6/26/1989 0 --- --- 4---
6/27/1990 747 --- --- 6/30/1990 0 --- --- 4---
6/26/1991 685 --- --- 6/29/1991 0 --- --- 4---
5/14/1992 586 --- --- 5/17/1992 0 --- --- 4---
6/23/1993 1,750 --- --- 6/24/1993 318 6/24/1993 340 81
6/11/1994 580 --- --- 6/14/1994 0 --- --- 4---
7/12/1995 2,880 --- --- 7/15/1995 1,370 7/15/1995 1,470 49
34
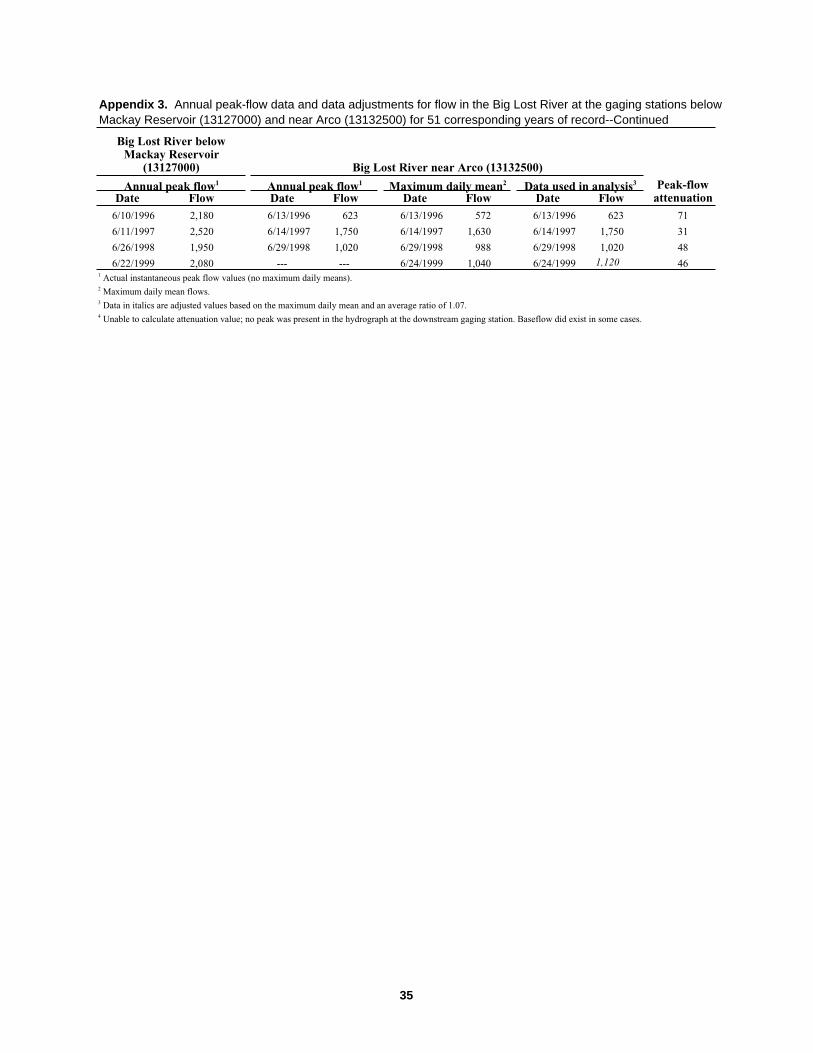
--- ---
Appendix 3. Annual peak-flow data and data adjustments for flow in the Big Lost River at the gaging stations below Mackay Reservoir (13127000) and near Arco (13132500) for 51 corresponding years of record--Continued
Big Lost River below Mackay Reservoir
(13127000) Big Lost River near Arco (13132500)
Annual peak flow1 Annual peak flow1 Maximum daily mean2 Data used in analysis3 Peak-flow Date Flow Date Flow Date Flow Date Flow attenuation
6/10/1996 2,180 6/13/1996 623 6/13/1996 572 6/13/1996 623 71
6/11/1997 2,520 6/14/1997 1,750 6/14/1997 1,630 6/14/1997 1,750 31
6/26/1998 1,950 6/29/1998 1,020 6/29/1998 988 6/29/1998 1,020 48
6/22/1999 2,080 6/24/1999 1,040 6/24/1999 1,120 46 1 Actual instantaneous peak flow values (no maximum daily means). 2 Maximum daily mean flows. 3 Data in italics are adjusted values based on the maximum daily mean and an average ratio of 1.07. 4 Unable to calculate attenuation value; no peak was present in the hydrograph at the downstream gaging station. Baseflow did exist in some cases.
35

Appendix 4. Annual maximum daily mean flow in the Big Lost River at the gaging stations near Arco (13132500), at Idaho National Engineering and Environmental Laboratory (INEEL) diversion at head (13132513), and below INEEL diversion (13132520) for 8 corresponding years of record [See figure 2 for location of gaging stations; flow in cubic feet per second; peak-flow attenuation in percent; ---, no data]
Big Lost River INEEL Diversion Big Lost River below near Arco at head INEEL Diversion (13132500) (13132513) (13132520)
Maximum daily mean Maximum daily mean Maximum daily mean Data used in analysis Peak-flow Date Flow Date Flow Date Flow Date Flow attenuation
6/09/1986 1,780 6/09/1986 1,290 6/09/1986 390 6/09/1986 1,680 6 6/12/1993 322 6/12/1993 0 6/12/1993 294 6/12/1993 294 9 7/15/1995 1,370 7/16/1995 780 7/16/1995 436 7/16/1995 1,216 11 6/13/1996 572 6/13/1996 150 6/13/1996 360 6/13/1996 510 11 6/14/1997 1,630 6/14/1997 890 6/14/1997 465 6/14/1997 1,355 17 6/29/1998 988 6/29/1998 494 6/29/1998 433 6/29/1998 927 6 6/24/1999 1,040 6/24/1999 609 6/24/1999 378 6/24/1999 987 5
11/03/1999 98 11/03/1999 0 11/03/1999 86 11/03/1999 86 12
36
Hortness and Rousseau —
Estimating the M
agnitude of the 100-Year Peak Flow, B
ig Lost River, INEEL, Idaho —
U.S. G
eological Survey Water-Resources Investigations Report 02–4299
Printed on recycled paper