estimating the economic benefits of maintaining peak instream flows … · 2018-05-02 ·...
TRANSCRIPT
Estimating the Economic Benefits of Maintaining Peak Instream Flows in the
Poudre River through Fort Collins, Colorado
Dr. John Loomis, EconomistDepartment of Agricultural and Resource Economics
Colorado State University, Fort Collins, CO 80523
Final ReportApril 2008

1
Estimating the Economic Benefits of Maintaining Peak Instream Flows in the Poudre River through Fort Collins, Colorado
Dr. John Loomis, Economist
Department of Agricultural and Resource Economics Colorado State University, Fort Collins, CO 80523
Final Report, March 24, 2008

2
Estimating the Economic Benefits of Maintaining Peak Instream Flows in the Poudre River through Fort Collins, Colorado
Dr. John Loomis, Economist Department of Agricultural and Resource Economics Colorado State University, Fort Collins, CO 80523
Acknowledgements: I would like to thank John Stokes, Jennifer Shanahan, Rachel Steeves and Rick Bachand of the Fort Collins Natural Resources Staff, and Keith Elmund of Fort Collins Utilities for guidance and suggestions on the survey design. Paulo Brito ably carried out the data entry. Three anonymous peer reviewers provided important suggestions that have improved the accuracy and completeness of this report. The conclusions are those of the author and do not reflect City of Fort Collins staff, nor an official position of Colorado State University.
March 24, 2008
3
Estimating the Economic Benefits of Maintaining Peak Instream Flows in the Poudre River through Fort Collins, Colorado
Dr. John Loomis, Economist
Executive Summary
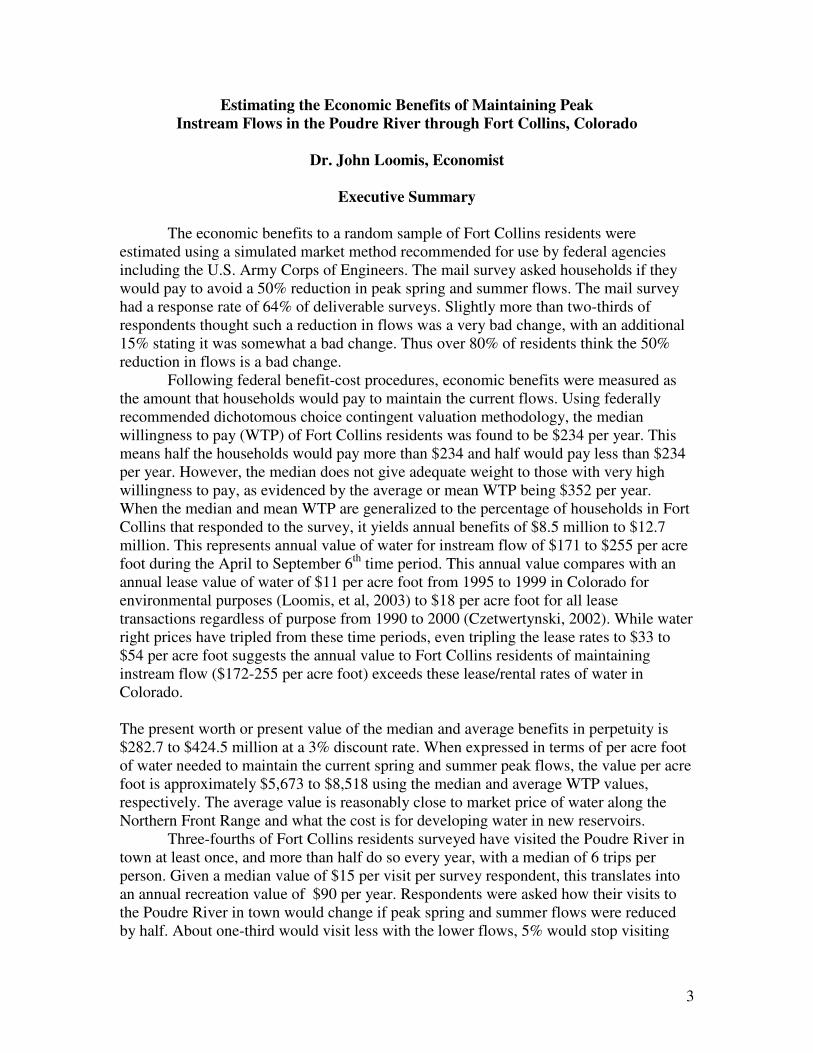
The economic benefits to a random sample of Fort Collins residents were
estimated using a simulated market method recommended for use by federal agencies including the U.S. Army Corps of Engineers. The mail survey asked households if they would pay to avoid a 50% reduction in peak spring and summer flows. The mail survey had a response rate of 64% of deliverable surveys. Slightly more than two-thirds of respondents thought such a reduction in flows was a very bad change, with an additional 15% stating it was somewhat a bad change. Thus over 80% of residents think the 50% reduction in flows is a bad change.
Following federal benefit-cost procedures, economic benefits were measured as the amount that households would pay to maintain the current flows. Using federally recommended dichotomous choice contingent valuation methodology, the median willingness to pay (WTP) of Fort Collins residents was found to be $234 per year. This means half the households would pay more than $234 and half would pay less than $234 per year. However, the median does not give adequate weight to those with very high willingness to pay, as evidenced by the average or mean WTP being $352 per year. When the median and mean WTP are generalized to the percentage of households in Fort Collins that responded to the survey, it yields annual benefits of $8.5 million to $12.7 million. This represents annual value of water for instream flow of $171 to $255 per acre foot during the April to September 6th time period. This annual value compares with an annual lease value of water of $11 per acre foot from 1995 to 1999 in Colorado for environmental purposes (Loomis, et al, 2003) to $18 per acre foot for all lease transactions regardless of purpose from 1990 to 2000 (Czetwertynski, 2002). While water right prices have tripled from these time periods, even tripling the lease rates to $33 to $54 per acre foot suggests the annual value to Fort Collins residents of maintaining instream flow ($172-255 per acre foot) exceeds these lease/rental rates of water in Colorado. The present worth or present value of the median and average benefits in perpetuity is $282.7 to $424.5 million at a 3% discount rate. When expressed in terms of per acre foot of water needed to maintain the current spring and summer peak flows, the value per acre foot is approximately $5,673 to $8,518 using the median and average WTP values, respectively. The average value is reasonably close to market price of water along the Northern Front Range and what the cost is for developing water in new reservoirs.
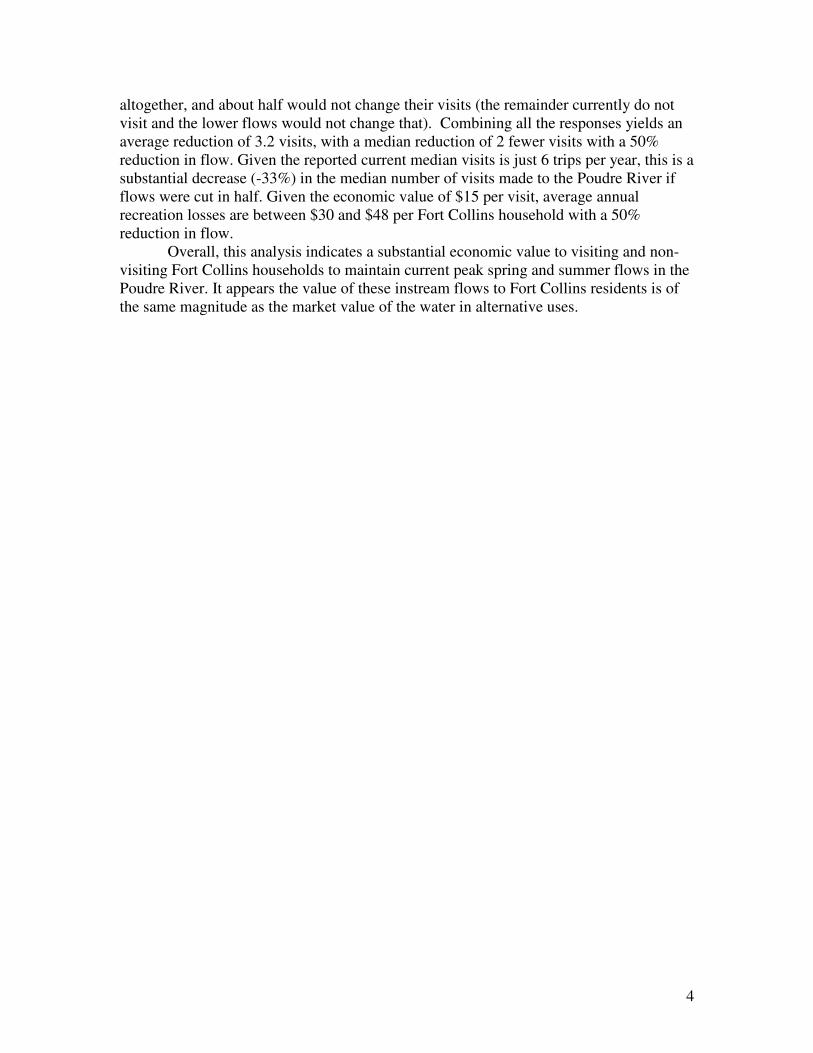
Three-fourths of Fort Collins residents surveyed have visited the Poudre River in town at least once, and more than half do so every year, with a median of 6 trips per person. Given a median value of $15 per visit per survey respondent, this translates into an annual recreation value of $90 per year. Respondents were asked how their visits to the Poudre River in town would change if peak spring and summer flows were reduced by half. About one-third would visit less with the lower flows, 5% would stop visiting
4
altogether, and about half would not change their visits (the remainder currently do not visit and the lower flows would not change that). Combining all the responses yields an average reduction of 3.2 visits, with a median reduction of 2 fewer visits with a 50% reduction in flow. Given the reported current median visits is just 6 trips per year, this is a substantial decrease (-33%) in the median number of visits made to the Poudre River if flows were cut in half. Given the economic value of $15 per visit, average annual recreation losses are between $30 and $48 per Fort Collins household with a 50% reduction in flow.
Overall, this analysis indicates a substantial economic value to visiting and non-visiting Fort Collins households to maintain current peak spring and summer flows in the Poudre River. It appears the value of these instream flows to Fort Collins residents is of the same magnitude as the market value of the water in alternative uses.

5
TABLE OF CONTENTS
Page #
INTRODUCTION 6 STUDY DESIGN 7 Description of the Poudre River Scenario Being Valued 7 Non Market Valuation and the Contingent Valuation Method 13 DATA COLLECTION 16 Survey Development, Focus Groups and Pretesting 16 Sample Design and Data Collection Procedures 17 RESULTS 19 Survey Sample Returns and Demographics 19 Relative Importance of Different Characteristics of the Poudre River 20 Recreation Visitation 21 Results of the Reduced Flow Scenario on Recreation Visitation 23 Household Economic Benefits of Maintaining Peak Flows in the Poudre River 25 Economic Analysis of Recreation Benefits of the Poudre River 32 Application of Values to Water Management 33 CONCLUSION 37 REFERENCES 39 APPENDIX Copy of Survey Instrument

6
INTRODUCTION
Adequate water flows in rivers provide society with many economic benefits.
Obviously visitors receive on-site recreation benefits (Loomis, 1987). Recreation values
from visiting the Poudre River are not traded in markets but nonetheless have economic
values to visitors. Federal benefit-cost procedures used by the U.S. Army Corps of
Engineers (U.S. Water Resources Council, 1983), recognizes these values. The water
flows also support streamside vegetation such as cottonwoods, which have aesthetic
values to residents. Further, the river itself and the streamside vegetation provide habitat
for numerous native fish and wildlife species. Many people derive enjoyment and
satisfaction from viewing wildlife such as birds that depend on this streamside habitat.
Further, some residents receive enjoyment from just knowing that adequate flows support
native fish and wildlife species even if they do not visit the river (Krutilla, 1967, Sanders,
et al., 1990, Loomis, 1987). These off-site benefits are sometimes known as existence
(Sanders, et al., 1990) or passive use values. These passive use values are recognized by
federal agencies when performing natural resource damage assessment. They are also
non-market benefits and public good values.
The objective of this study is to apply a federally approved method (used by
agencies such as the US Army Corps of Engineers), the contingent valuation method, to
estimate these non-market benefits that Fort Collins residents receive from maintaining
current peak (spring and summer) flows in the Poudre River through the city of Fort
Collins. This non-market valuation information will be useful for comparing to existing
market values of water and market values associated with proposals to divert water from
the Poudre River upstream of Fort Collins.

7
STUDY DESIGN
Description of the Poudre River Scenario Being Valued
Our study area is the Poudre River through the City of Fort Collins. This area is
illustrated in Figure 1. This map was also included in the survey to focus respondent
attention just on this stretch of river. The features of the Poudre River that were described
in the survey were as follows:
• The Poudre River flows for 10 miles through Fort Collins.
• Playing a central role in the region’s water supply by carrying water for cities and agricultural lands in northern Colorado.
• The Poudre River Trail which runs parallel to the river, providing recreational opportunities such as walking, bicycling, jogging, dog-walking, bird watching, and in-line skating.
• About 1,400 acres of publicly accessible land, including 18 City Natural Areas and 5 Parks along
the river. • Public access to the Poudre River providing water based recreation such as fishing, tubing,
canoeing and kayaking.
• Habitat to many different species, including more than 30 fish species, about 225 bird species, 30 mammal species, 250 native plant species, and 65 species of butterflies. Several of the native fish species are classified as “threatened” with extinction by the State of Colorado, and three bird species are listed as “threatened or species of concern” by the State of Colorado.
• Opportunities for environmental education at the CSU Environmental Learning Center and all along the river.

8
Figure 1. Map of Study Area Provided Respondents

9
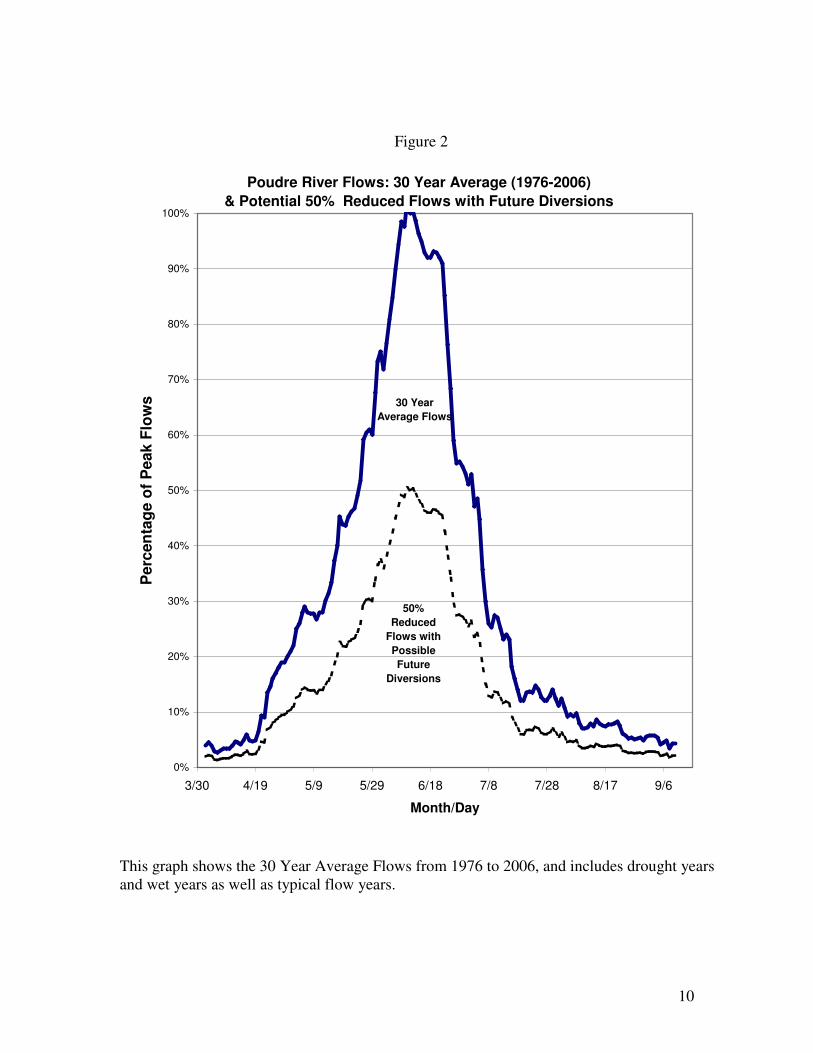
The next section of the survey described the current pattern of river flows and how that
would change with possible diversion. Figure 2 shows the hydrograph insert that was
developed with City of Fort Collins and USGS gauging station data over a 30 year
average from 1976-2006 to reflect a wide range of dry, normal and wet year flows. Based
on input from City staff, reduced flows were represented as a 50% reduction that
represents the potentially significant reductions of flows that are possible in the future.
Future flow reductions, however, will likely vary considerably over time and are
dependent on available flows in the river, water rights that are in priority and operational
requirements. The graph was subject to several focus groups and pretests to improve the
clarity to the respondent.
10
Figure 2
Poudre River Flows: 30 Year Average (1976-2006)
& Potential 50% Reduced Flows with Future Diversions
0%
10%
20%
30%
40%
50%
60%
70%
80%
90%
100%
3/30 4/19 5/9 5/29 6/18 7/8 7/28 8/17 9/6
Month/Day
Perc
en
tag
e o
f P
eak F
low
s 30 Year
Average Flows
50%
Reduced
Flows with
Possible
Future
Diversions
This graph shows the 30 Year Average Flows from 1976 to 2006, and includes drought years and wet years as well as typical flow years.

11
The focus of the study was to find the residents’ willingness to pay to maintain the current
peak river flows. The survey asked whether a household would pay an annual share of the
estimated cost to maintain the current peak flows. The exact wording of the question was:
If the costs of keeping the current peak flows were spread among all Fort Collins households and businesses, your share of the cost is estimated to be $XX per year. Would you pay this amount each year to be used solely to keep Poudre River flows at the current 30 Year Average Flows shown in Figure 1 rather than have 50% Reduced Flows?
___ Yes ___ No ___ Unsure
The $XX was filled in with one of ten different dollar amounts. These dollar amounts
ranged from a low of $2 to a high of $950. Most of the dollar amounts were centered
around what people in the focus groups and pretests indicated they would pay when they
were asked an open ended question about the maximum amount they would pay. Thus,
most of the dollar amounts were $10, 20, $30, $50 and $90 per household each year.
The next section of the survey asked households about their recreation visitation to the
Poudre River, Natural Areas along the Poudre River and the Poudre River bike paths.
Those indicating they did not visit, were instructed to skip to the demographic section.
Questions about recreation use included annual number of trips and recreation activities.
Individuals were also asked a dichotomous choice contingent valuation willingness to
pay question about their recreation use. The text of that question is:
As you know, costs of gasoline, rental rates for equipment, and other recreation expenses typically increase over time. If your cost of a visit to the Poudre River in town had been $RR higher, would you have still made your most recent visit? ___ Yes ___ No ___ Not Sure The $RR dollar was replaced with one of ten different dollar amounts ranging from $2 to $90.
The majority of the dollar amounts were in the range of $5 to $15. These amounts were
selected based on responses in the focus groups and pretests.
12
Respondents were also asked if the changes in flows as shown in Figure 2 would change
the number of visits they would make to the Poudre River. Responses included “I would
visit more often, less often and no change.”
The final section of the survey included demographic questions about zip code, gender,
age, education and income on the inside of the back cover. The back cover was blank to
allow respondents to write any thoughts or comments on the Poudre River or the survey.
The survey made an eight page booklet.
13
Non Market Valuation and the Contingent Valuation Method
The structure of the willingness to pay (WTP) questions and statistical analysis of
responses utilizes the Contingent Valuation Method or CVM. The method derives its
name from the fact that responses are contingent upon a simulated market situation
presented in the survey. CVM is a commonly used method in which a direct interview or
survey is administered to elicit the households’ willingness to pay for non-market
benefits that are not traded in markets (Loomis and Walsh, 1997). It is used to estimate
values of public or quasi-public goods, as well as counterfactual scenarios that do not
presently exist, but might with different future management actions or policies.
The CVM survey approach has been widely used to value natural resources where
other valuation methods are difficult to apply (Brookshire et. al 1982). CVM is a
recommended approach by the U.S. Water Resources Council under two different
Federal administrations (U.S. WRC, 1979, 1983) and is used today by the U.S. Bureau of
Reclamation, U.S. Army Corps of Engineers, and U.S. Environmental Protection Agency
in their benefit-cost analyses. Although not without controversy, (Portney, 1994), CVM
has been used to simulate other local voter referendum and has been shown to be
reasonably accurate (Vossler and Kerkvliet, 2003) and yield values comparable to actual
behavior valuation methods (Brookshire, et al., 1982; Carson et al., 1996). Nonetheless,
hypothetical bias has been a found in several CVM studies (Neil, et al, 1994; Cummings,
et al., 1995; Brown, et al., 1996). Our case study has more similarities to the situations
studied by Vossler and Kervliet (2003), Brookshire et al., and Carson, et al. Similar to
these three studies, the public good being valued, the Poudre River, is well known to the
local residents we are surveying. The familiarity is due to the average time lived in Fort

14
Collins, is roughly 20 years, and the fact that about three-fourths of Fort Collins residents
have visited the Poudre River or used adjacent Natural Areas or bike paths along the river
at least once during that time. Thus several of the conditions that Cumming, Brookshire
and Schulze’s (1986) suggest are necessary for obtaining a valid estimate of WTP are met
in our study.
WTP Question Format and Data Analysis Techniques
To realistically simulate a market for maintaining existing instream flows, a
dichotomous choice WTP question format is used. In this question format, an individual
answers either “yes” if they would pay ($X) to maintain the current peak flows in the
Poudre River or “no” if they would not. The specific amount of the cost ($X) varies
across the sample. In essence we trace out a demand curve like relationship between the
amount residents are asked to pay and the percentage or probability they would pay.
As is commonly done in dichotomous choice CVM studies, we use a logistic
regression model also known as a logit model to analyze the discrete yes/no responses.
Our general specification of the logit willingness to pay model is:
(1) XnXIncomeBidP
PLnL n
i
ii βββββ ..3)(
13210 ++++=
−=
Where Pi is the probability of a Yes response, ß’s are slope coefficients and X’s are
independent variables. To estimate equation (1) using maximum likelihood requires that
equation be rewritten as a log likelihood function (see Kmenta (1986: 551) or Haab and
McConnell (2002: 29) for the details).

15
From the coefficients in equation (1) the mean and median WTP can be calculated using
formulas from Hanemann (1984). If we are interested in determining the dollar amount
that a majority of residents would pay we would calculate the median using equation:
(2) Median 13322 /)..( βββββ −++= nXnXXoWTP
In this equation, ∃0 is the intercept, ∃2… ∃n represent the non-bid independent variables,
and ∃1 is the bid coefficient. To compute median WTP, the mean of the all the non-bid
independent variables are multiplied by their respective coefficients and added to the
constant term. This product is divided by the absolute value of the coefficient on the bid
amount.
Defining the Empirical Logit WTP Model
There are several variables that could explain whether Fort Collins households
would pay to maintain the current peak flows. Of course we expect the magnitude of the
dollar amount of the cost or the bid amount to matter, with the higher the cost proposed
to households, the fewer people would agree to pay. Demographic characteristics of the
respondents may be indicative of differences in tastes and preferences, and therefore
utility and ultimately, their willingness to pay for maintaining flows. For example,
Gender has been shown in past studies to influence environmental attitudes (McStay and
Dunlap, 1983; Mohai, 1999), especially about local issues (Blocker and Eckberg, 1989)
and thus may influence willingness to pay for flows in a local river. The number of years
of education (edyears) that the respondent has may also influence their response, as
people with higher education levels are often more concerned with the environment.
Attitudes regarding the importance of maintaining the river as wildlife habitat
(habimp) or for waterbased recreation (waterecimp) may influence whether or not the

16
resident would pay. If an individual thought the reduction in Poudre River flows was a
good change (coded positive), the less likely they would pay (prchange). An
individual’s use value toward the Poudre River would be influenced by whether or not
they have visited the river, parks or natural areas along the river this year (Visit). Thus
the following logit model reflects these candidate variables:
(3) Vote = β0 - β1(bidamt) + β2(educ) - β3(prchange) + β4(edyears) + β5(habimp) +
β6(gender) + β7(waterecimp) + β8(visit)
DATA COLLECTION
Survey Development, Focus Groups and Pre-testing
The final survey was the result of initial interaction between the author and City
of Fort Collins Natural Resources staff, with input from the City Utilities staff. Once the
basic survey design and information was agreed upon, two focus groups of 14-15 city
residents each, were held in Fort Collins to evaluate the clarity of information presented,
graphs, maps, and questions being asked. Numerous suggestions were received that led to
revising the cover, layout of some questions, rewording of several questions, and
rewording of information presented in the survey. In addition, we asked respondents
open-ended willingness to pay questions for the program in order to determine the range
of dollar amounts to ask in the closed-ended dichotomous choice WTP questions. The
survey was revised after each focus group. Then a pre-test of the entire survey booklet
was conducted on another group of 14 Fort Collins residents. Final revisions and final
review by City Natural Resources staff, resulted in the survey that was printed and mailed
to residents.

17
Sample Design and Data Collection Procedures
A random sample of 550 Fort Collins residents was purchased from Survey
Sampling Inc., a company specializing in providing survey samples. The distribution of
the sample by the main non-CSU zip codes (i.e., 80523 was purposefully omitted) in Fort
Collins follows the population distribution in each of the zip codes.
Following the Dillman (2000) Total Design Method, the survey was a booklet
with an interesting color cover (see Appendix for black and white version), that showed
four different views of the river through Fort Collins, one of which had river visitors, one
with a bridge crossing and one with a powerpole. The eight page booklet had a blank
back cover where respondents could write comments. Inserted into the survey booklet
was a color map of the study area and Figure 2, showing current peak and reduced flows.
These were inserts so that respondents could refer to them as they answered questions in
various sections of the survey. (A copy of the survey is included in the Appendix).
Following Dillman (2000), there was a personalized cover letter with original
signature in blue ink, a $1 bill enclosed as a token of appreciation, and a stamped return
envelope. The outgoing envelope also had original stamps affixed. The survey was
mailed out at the end of the first week of October.
To ensure that the response rate would be as high as possible, reminder postcards
were sent to each household one-week after they received a copy of the survey. This
postcard reminded the household to return the finished survey if they have not already
done so, and thank those that did. A phone and email were provided so that those who
had misplaced their questionnaire could be mailed another copy.

18
If a survey was not returned by the end of October, then the household received a
more emphatic personalized cover letter stressing the importance of the study, along with
another copy of the questionnaire and another stamped return envelope. The new cover
letter repeated what was mentioned in the previous mailing, but it will also remind them
that their completed survey was not returned.

19
RESULTS
Survey Sample Returns and Demographics
Of the 550 surveys mailed out, there were 22 undeliverable, and 7 respondents who were
deceased. This yields a net eligible sample of 521. We received 332 surveys back. Given
the undeliverable surveys and deceased addressees, this represents a response rate of 64%
of deliverable/eligible surveys. This survey response rate is reasonably good and higher
than most election turnouts.
Table 1 presents the distribution of returned surveys by zip code versus the
population by zip code. As can be seen there is a very close correspondence. Thus the
decision to return the survey was not significantly influenced by where one lives in the
city. This suggests that all Fort Collins residents have an equivalent interest in the Poudre
River.
Table 1 Comparison of Returned Surveys and City Population by Zip Code
_______________________________
Zip Code Returned Population 80521 13% 14% 80524 20% 21% 80525 37% 36% 80526 28% 29% No Zip Given 2% 100% 100%
_______________________________
The sample of returned surveys has a slightly (+11%) higher household income
($78,721) than the population ($70,391). The sample is somewhat older at 55 years of
age versus 45 years in the population. This pattern is common in mail surveys where
older households are more likely to return questionnaires than younger households.
20
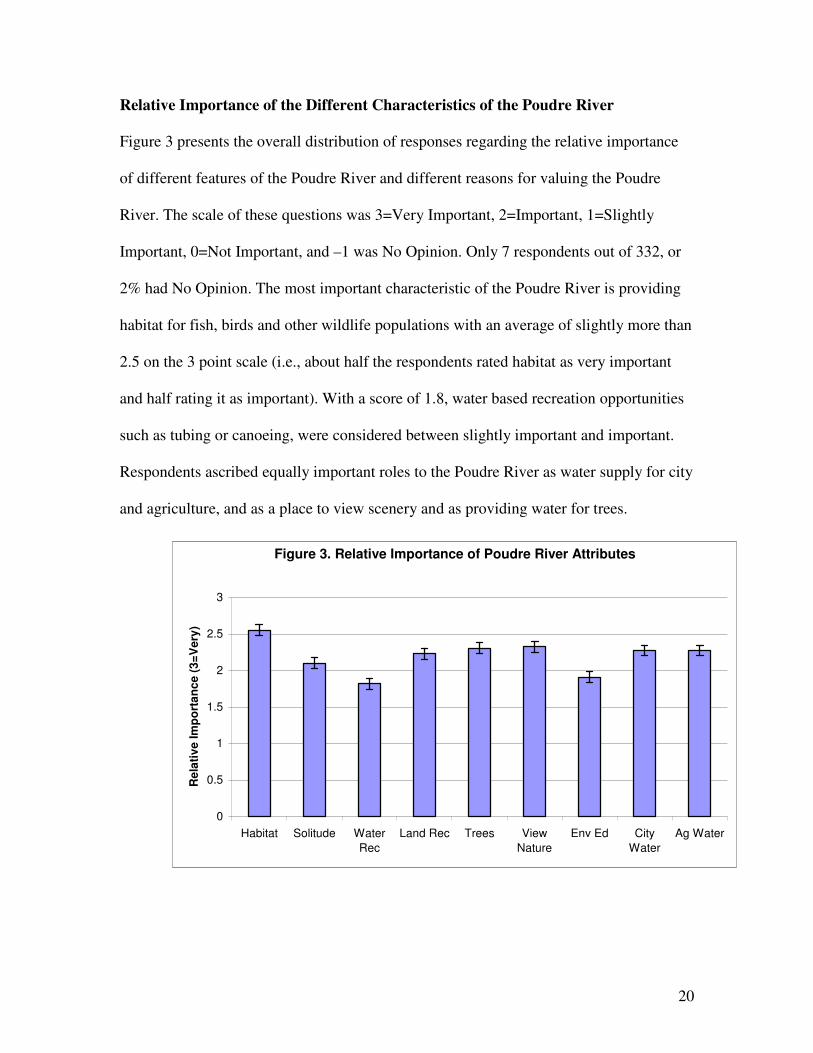
Relative Importance of the Different Characteristics of the Poudre River
Figure 3 presents the overall distribution of responses regarding the relative importance
of different features of the Poudre River and different reasons for valuing the Poudre
River. The scale of these questions was 3=Very Important, 2=Important, 1=Slightly
Important, 0=Not Important, and –1 was No Opinion. Only 7 respondents out of 332, or
2% had No Opinion. The most important characteristic of the Poudre River is providing
habitat for fish, birds and other wildlife populations with an average of slightly more than
2.5 on the 3 point scale (i.e., about half the respondents rated habitat as very important
and half rating it as important). With a score of 1.8, water based recreation opportunities
such as tubing or canoeing, were considered between slightly important and important.
Respondents ascribed equally important roles to the Poudre River as water supply for city
and agriculture, and as a place to view scenery and as providing water for trees.
Figure 3. Relative Importance of Poudre River Attributes
0
0.5
1
1.5
2
2.5
3
Habitat Solitude Water
Rec
Land Rec Trees View
Nature
Env Ed City
Water
Ag Water
Re
lati
ve
Im
po
rta
nc
e (
3=
Ve
ry)
21
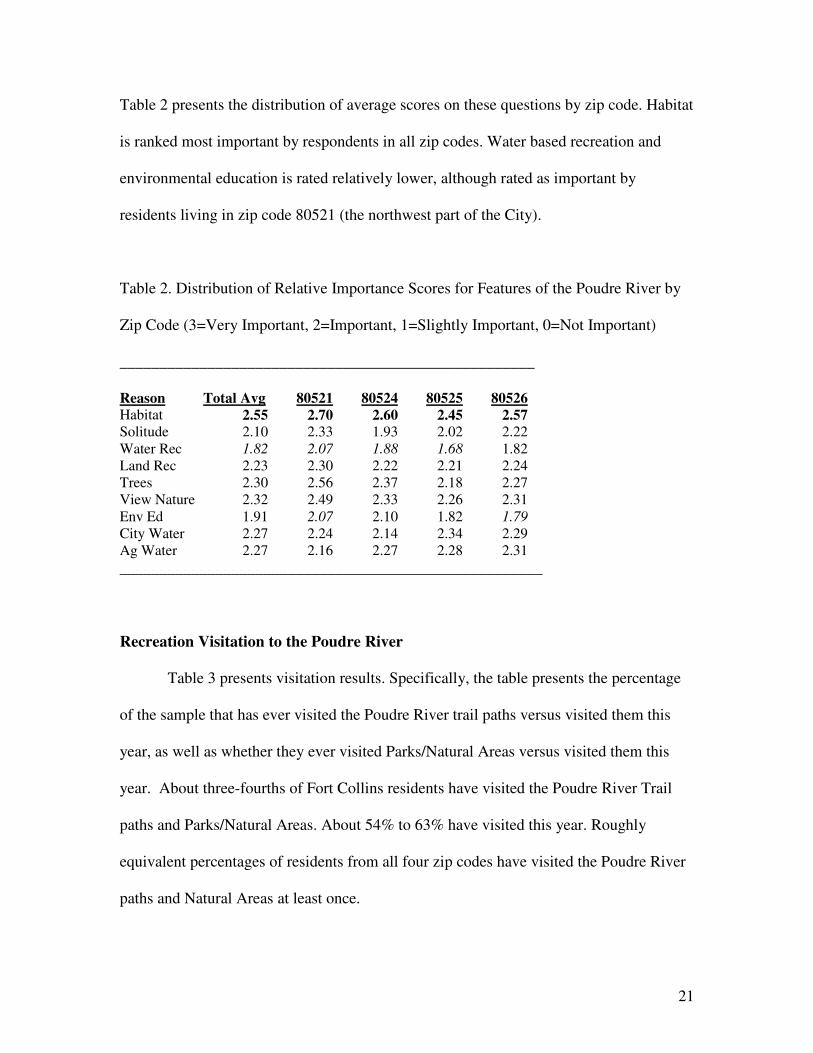
Table 2 presents the distribution of average scores on these questions by zip code. Habitat
is ranked most important by respondents in all zip codes. Water based recreation and
environmental education is rated relatively lower, although rated as important by
residents living in zip code 80521 (the northwest part of the City).
Table 2. Distribution of Relative Importance Scores for Features of the Poudre River by
Zip Code (3=Very Important, 2=Important, 1=Slightly Important, 0=Not Important)
____________________________________________________
Reason Total Avg 80521 80524 80525 80526Habitat 2.55 2.70 2.60 2.45 2.57Solitude 2.10 2.33 1.93 2.02 2.22Water Rec 1.82 2.07 1.88 1.68 1.82Land Rec 2.23 2.30 2.22 2.21 2.24Trees 2.30 2.56 2.37 2.18 2.27View Nature 2.32 2.49 2.33 2.26 2.31Env Ed 1.91 2.07 2.10 1.82 1.79City Water 2.27 2.24 2.14 2.34 2.29Ag Water 2.27 2.16 2.27 2.28 2.31
_____________________________________________________
Recreation Visitation to the Poudre River
Table 3 presents visitation results. Specifically, the table presents the percentage
of the sample that has ever visited the Poudre River trail paths versus visited them this
year, as well as whether they ever visited Parks/Natural Areas versus visited them this
year. About three-fourths of Fort Collins residents have visited the Poudre River Trail
paths and Parks/Natural Areas. About 54% to 63% have visited this year. Roughly
equivalent percentages of residents from all four zip codes have visited the Poudre River
paths and Natural Areas at least once.

22
Table 3. Percent of Respondents Having Ever Visited and Visited the Poudre River in Town this Year _____________________________________________________________________ Total 80521 80524 80525 80526Ever Visit Paths 74% 77% 78% 77% 68%Visit Paths This Year 54% 58% 55% 56% 51%
Ever Visit Parks/Nat Areas 76% 81% 75% 78% 74%Visit Parks/Nat Areas This Year 59% 63% 54% 63% 57%
Never Visited 10% 9% 7% 11% 13%Not Visited This Year 19% 21% 24% 18% 17%
_____________________________________________________________________
The median number of visits is 6 per year to the Poudre River in town. However,
the average number of visits per year is 20 visits as about a dozen people in our sample
indicated they make one hundred or more visits per year. The average length of stay
along the Poudre River is 90 minutes, with the median of one hour.
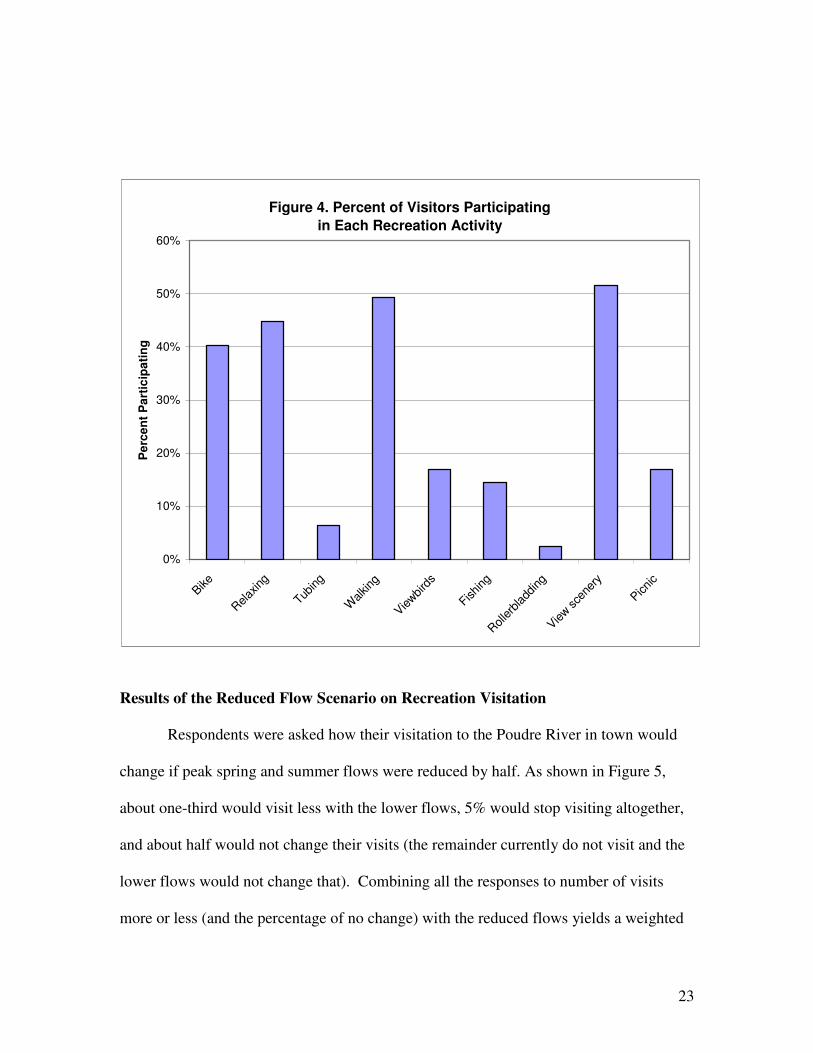
Figure 4 presents the percentage of visitors participating in each type of recreation
activity on the Poudre River through town. Viewing scenery and walking are most
common activities with about half the visitors participating in them.
23
Results of the Reduced Flow Scenario on Recreation Visitation
Respondents were asked how their visitation to the Poudre River in town would
change if peak spring and summer flows were reduced by half. As shown in Figure 5,
about one-third would visit less with the lower flows, 5% would stop visiting altogether,
and about half would not change their visits (the remainder currently do not visit and the
lower flows would not change that). Combining all the responses to number of visits
more or less (and the percentage of no change) with the reduced flows yields a weighted
Figure 4. Percent of Visitors Participating
in Each Recreation Activity
0%
10%
20%
30%
40%
50%
60%
Bike
Relax
ing
Tubing
Walking
Viewbi
rds
Fishing
Rollerb
ladd
ing
View s
cene
ry
Picnic
Pe
rce
nt
Pa
rtic
ipa
tin
g

24
average reduction of 3.2 visits across the entire sample, with a median reduction of 2
fewer visits. Given the reported current median visits are 6 trips per year, this is a
substantial (-33%) decrease in the median number of visits made to the Poudre River if
flows were cut in half. Given the economic value of $15 per visit, average annual
recreation losses are between $30 and $48 per Fort Collins household with a 50%
reduction in flow.
Figure 5. How Visitors Would React to 50% Reduced Flows
1%
31%
48%
5%
0%
10%
20%
30%
40%
50%
60%
Visit more Visit less No chg visits Stop visits
Pe
rce
nt
of
Vis
ito
rs
Households were asked whether they viewed reducing the peak spring and summer flows
in half as a Very Good Change, Somewhat Good Change, Neither Good nor Bad,
Somewhat Bad Change, Very Bad Change, No Opinion, or Not Enough Information.

25
As is evident in Table 4, slightly more than two-thirds of respondents thought such a
reduction in flows was a very bad change, with an additional 15% stating it was
somewhat a bad change. Thus more than 80% of the survey respondents think a 50%
reduction in flows is a bad change.
Table 4. Number and Percentage That Think Reducing Flows in the Poudre River in Half
Frequency Percent ____
Very Bad Change 218 68%
Somewhat Bad 48 15%
Neither 11 3%
Somewhat Good 2 1%
Very Good Change 3 1%
Not enough Info 33 10%
No Opinion 4 1%
__________
319 100%
Household Economic Benefits of Maintaining Peak Flows in the Poudre River
Households were asked if they would pay an annual cost to avoid the 50% reduction in
peak spring and summer flows so as to keep the Poudre River at its current level during
that time period. To quantify the maximum willingness to pay, a household was
randomly asked to pay one of ten different dollar amounts. These dollar amounts ranged
from a low of $2 to a high of $950.
Fifty-five percent of respondents stated they would pay the annual cost to maintain flows
in the Poudre River through town. Of the remaining 45%, 23% said they would not pay,
and 22% were unsure. Of those respondents that answered either Yes or No to the
26
willingness to pay question, most were fairly certain of their responses, with an average
score of 7.24 on a ten point scale (were 1 is Not Certain, 5 being Somewhat Certain and
10 being Very Certain).
Of the 71 indicating they would not pay anything to maintain the Poudre River, six
indicated it was due to not receiving any benefits from maintaining flows in the Poudre
River. Twenty-six percent indicated they could not afford to pay at this time. In some
respects, this “could not afford” response indicates that households took the dollar
amount they were asked to pay seriously, and recognized their limited household budgets
when answering the willingness to pay question. Only 39 individuals or 12% of
respondents gave what would be considered a “protest” response, rejecting the premise
that they had to pay to maintain Poudre River flows. These included 12 who checked that
only households living close to the river or those that visit should pay, or gave a response
of “Other”. Since these individual’s votes would still count in a real election and to be
conservative, we have included the protest responses in our analysis of willingness to
pay.
To be consistent with the literature on polling and contingent valuation, we have recoded
the unsure responses to No responses as well. The literature suggests those that are
uncertain of their responses typically vote No when an actual election is held. That is, the
polling literature suggests these uncertain voters stick to the status quo when they are
unsure about the change. This recoding also improves the validity of the willingness to
pay results, as comparisons with between actual cash willingness to pay and stated
27
willingness to pay in CVM surveys show those uncertain of their response, tend to vote
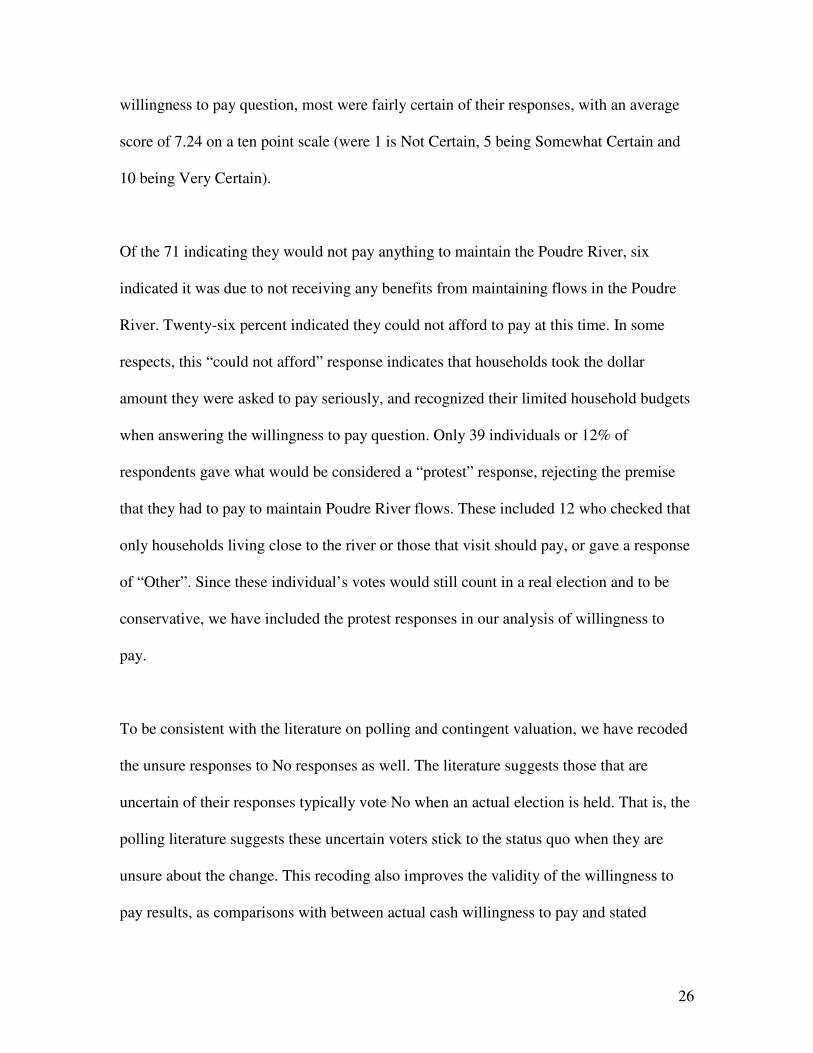
No when faced with the actual cash costs (Champ, et al., 1996). Figure 6 provides a plot
of the raw data percentage of Yes and No (where the unsure responses are coded as No),
at each dollar amount the sample of respondents were asked to pay.
Figure 6. Empirical Distribution of Raw WTP Data
$10
$110
$210
$310
$410
$510
$610
$710
$810
$910
0% 20% 40% 60% 80% 100%
Percent that Would Pay Each $ Amount
$ A
mo
un
t H
ou
se
ho
lds
As
k T
o P
ay
As can be seen there is generally a continuous (monotonic) reduction in the percentage of
households that would pay as the dollar amount asked to pay increases. The only
exception is at the highest dollar amount, where there is an increase in the percentage that
would pay. Thus, the overall pattern of the data at nine of the ten data points indicates
internal validity of the responses, in the sense that the higher the dollar amount asked to
pay, the fewer percentage of the sample that would pay this amount.

28
Table 5 presents the statistical logistic regression results of the main valuation question
on whether Fort Collins households would pay an annual cost to maintain the current
flows in the Poudre River through town and avoid a 50% reduction in peak spring and
summer flows shown in Figure 2. The logistic regression results have higher internal
validity, as indicated by the negative sign on the Bid Amount($) variable. The negative
and statistically significant (at the 1% level) coefficient indicates that those asked to pay a
higher cost were less likely to vote yes (coded as 1, and no is coded as zero). This
conforms with both common sense and downward sloping demand curves. It also
suggests respondents took the dollar amount they were asked to pay seriously. If they did
not, then there would not be a statistically significant and negative relationship between
the magnitude of the dollar cost and the percentage that would pay each dollar amount.
The other variables are statistically significant at the 10% level or better and also have an
intuitive relationship between the voting Yes. In particular, residents that have visited a
river, park or natural area along the river the year of the survey are more likely to pay.
The more important waterbased recreation was (Water Rec Imp), the more likely they
are to pay for maintaining flows in the Poudre River. Thus, recreation use values have a
significant influence on willingness to pay. Gender also plays a role with males more
willing to pay than females. Individuals with additional years of education are also more
willing to pay. Those that view a reduction in Poudre River flows as a good change are
less likely to pay (coded as positive for good change), and those that indicate it is a bad
change are more likely to pay (coded as negative for a bad change). Below we examine
how much each of these variables contributes to annual willingness to pay.

29
Table 5. Logistic Regression Results for Total Economic Value of Maintaining Poudre River Flows _____________________________________________________________________ Dependent Variable: Yes or No to Pay Annual Cost Method: ML - Binary Logit Observations: 300
Variable Coefficient z-Statistic Probability Mean
Constant -4.827273 -4.4879 0.0000 1.00 Bid Amount($) -0.003256 -5.1793 0.0000 180.10
Poudre River Change -0.860144 -4.5251 0.0000 -1.5167 Visit Park/Nat Area Year 0.675515 2.2553 0.0241 0.6234
Gender 0.693383 2.3723 0.0177 0.6233 Years of Education 0.194652 3.0723 0.0021 15.23
Water Rec Imp 0.253041 1.7513 0.0799 1.85
Mean dependent variable 0.5466 McFadden R-squared 0.248934 Log likelihood -155.19 LR statistic (6 df) 102.8771 Restr. log likelihood -206.63 Probability(LR stat) 0.000000
Obs Dependent =0 (No) 136 Total observations 300 Obs Dependent =1 (Yes) 164
Hanemann (1989) presents the formula used to calculate median WTP:
)/)..(( 13322 βββββ −++= nXnXXoWTP
where ß1 is the coefficient on the BidAmount($) and the other ß’s are the constant and the
coefficients on the other variables times their means (X). The median willingness to pay
for Fort Collins residents is $234.40 per year to avoid a 50% reduction in peak spring and
summer flows in the Poudre River. This is interpreted as half the residents in Fort
Collins would pay less than this and half would pay more than this amount.
The fitted logistic relationship between the amount Fort Collins residents were asked to
pay and the percentage of them that would pay each amount is illustrated in Figure 7.

30
Figure 7. Percentage that Would Pay to
Maintain Poudre Flows
$0
$200
$400
$600
$800
$1,000
$1,200
$1,400
$1,600
$1,800
0% 10% 20% 30% 40% 50% 60% 70% 80%
As can be seen in the figure, this curve has an intuitive negative slope, with the higher the
annual dollar amount a household is asked to pay, the lower the percentage of Fort
Collins households are estimated to pay that amount. The median of $234 per year
corresponds to the amount that 50% of households would pay. However, the median
WTP does not give adequate weight to high values that some residents reported. As
shown in Figure 7, 20% of Fort Collins respondents would pay nearly three times the
median value or slightly more than $600 per household annually. The average WTP
reflects this high intensity and is more appropriate for benefit-cost analysis comparisons,
than the median (which is more useful for judging the dollar amount that would pass in a
voter referendum). The average or mean annual WTP is $352 per household (calculated
using the formula in Hanemann, 1989), substantially above the median WTP.
The Krinsky-Robb technique is used to construct a confidence interval around
median and mean WTP (Park, Loomis, and Creel, 1991). The 90% confidence interval
around the median is $107 to $380 per household, per year. The 90% confidence interval
around the average or mean WTP is $259 to $505 per household per year.

31
To provide a more intuitive understanding of the relationship between the independent
variables and annual household willingness to pay, the logit coefficients in Table 5 are
“reparameterized” by dividing slope coefficient on the independent variable by the
absolute value of the coefficient on the bid amount. Doing this converts the logistic
regression coefficients into slope coefficients that can be interpreted as how a one unit
change in the independent variable affects annual household willingness to pay.
Annual Household Willingness to Pay ($)=
-1482 –$264.17*(Poudre River Change)+$207.17*(Visit Park/Nat Area This Year)
+$212.96*(Gender) +$59.78*(Years of Education) +$77.72*(Water Rec Importance)
In the above equation each additional year of household education raises annual
willingness to pay by $59.78. A household that visited Poudre River parks or natural
areas this year has an annual willingness to pay $207.17 higher than households that did
not visit this year. Males (Gender =1) willingness to pay is $212.96 higher than females
(Gender=0). A one unit increase in the importance of the Poudre River for water based
recreation (e.g., from important (2) to very important (3)) raises annual household
willingness to pay by $77.72. If a household feels the 50% reduction in flows in the
Poudre River is a somewhat bad change (-1) then annual household willingness to pay
increases by $264.17 (-1*-264.17).

32
Economic Analysis of Recreation Benefits of the Poudre River
The same type of dichotomous choice contingent valuation question was asked of visitors
to the Poudre River in the survey. Table 6 presents the results of the logistic regression
analysis.
Table 6. Logistic Regression Results for Recreation Economic Value of a Visit to the Poudre River in Town.
Dependent Variable: Yes-Pay Higher Trip Cost Method: ML - Binary Logit Observations: 198
Variable Coefficient Std. Error z-Statistic Probability
Constant -0.561497 0.4154 -1.3514 0.1765 Recreation Bid Amount -0.040018 0.0081 -4.9071 0.0000
Visit Park/Natural Area Year 0.924787 0.3614 2.5582 0.0105 Water Rec Importance 0.301341 0.1574 1.9141 0.0556
Mean dependent variable 0.40404 McFadden R-squared 0.171953 Log likelihood -110.605 LR statistic (3 df) 45.93680 Restr. log likelihood -133.574 Probability(LR stat) 5.85E-10
Obs Dependent =0 (No) 118 Total observations 198 Obs Dependent =1 (Yes) 80
The recreation logistic regression results also have higher internal validity, as indicated
by the negative sign on the Recreation Bid Amount variable. The negative and
statistically significant (at the 1% level) coefficient indicates that visitors asked to pay a
higher cost were less likely to state yes (coded as 1, and no is coded as zero). This also
suggests that respondents took the cost increase seriously. The other variables are
statistically significant at the 5% level or better and also have an intuitive relationship
with a Yes response. In particular, residents that have visited the river, park or natural
area along the river this year are more likely to pay the higher visitation cost. The more
33
important waterbased recreation was (Water Rec Imp), the more likely they are to pay
the higher recreation visit cost.
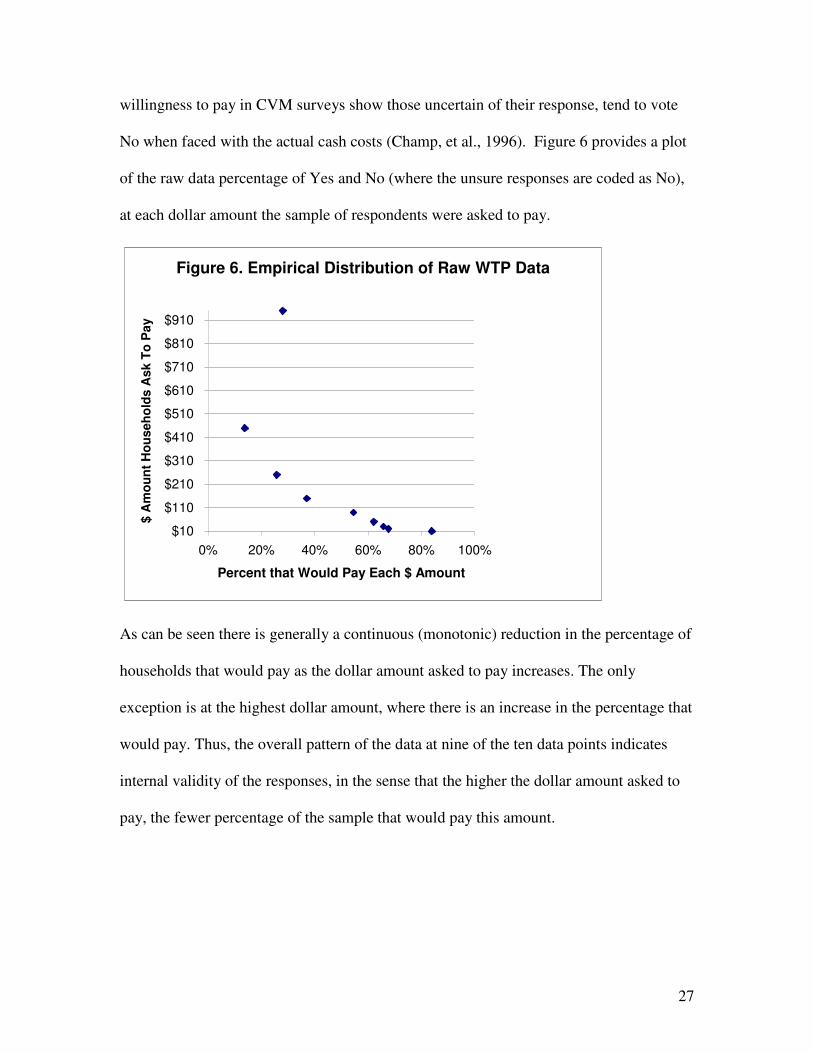
Setting the non-bid amount variables at their means, we calculated the median
willingness to pay for a visit to the Poudre River at $15, with a 90% confidence interval
of $7 to $22. Thus, half the visitors to the Poudre River would pay $15 or more, while the
other half would pay $15 or less. Figure 8 presents the graph of the fitted logistic
willingness to pay curve. As can be seen, 15% to 20% of visitors receive substantial
benefits ($50-60) from their visits to the Poudre River.
Figure 8. Percentage that Would Pay Higher Costs
to Visit the Poudre River
$0
$20
$40
$60
$80
$100
$120
$140
0% 10% 20% 30% 40% 50% 60% 70%
Percent That Would Pay
Vis
it C
os
t In
cre
as
e
Application of Values to Water Management
Recreation Value to Visitors
The annual recreation loss per Fort Collins resident from a 50% reduction in peak spring
and summer flows can be calculated by multiplying the median reduction in trips of the
times the value per trip. The median reduction in trips of the 31% of the sample that

34
stated they would reduce trips plus 5% of the sample that indicated they would stop
visiting is -5 trips. Combining this trip reduction with the 48% that would not change
their visits, and the others who do not visit, yields an overall sample weighted average
trip reduction is 3.2 trips, with a median reduction of two trips. Thus, $15 per trip times
the median -2 trip reduction yields a reduction of $30 per year and $15 per trip times the
average reduction of 3.2 trips yields an annual loss of $48 a year in lost recreation
benefits due to lower spring and summer flows for those that would take fewer trips.
Total Economic Value to Fort Collins Households
The annual median loss in total economic value associated with a 50% reduction in flow
to visiting and non-visiting Fort Collins households would be the median WTP of
$234.40. According to the U.S. Census there were 129,467 persons living in Fort Collins
in 2006. The U.S. Census also estimates an average of 2.29 persons per household. Thus
there are an estimated 56,536 households in Fort Collins. However, while we do have a
relatively high response rate of 64%, this means that 36% of Fort Collins households sent
surveys did not either take the time nor had sufficient interest to return the survey after
two mailings. If we take a conservative approach of assuming those non-responding
households have no willingness to pay to maintain flows in the Poudre River, we then
generalize our sample only to 64% of Fort Collins households that did return the survey.
This yields about 36,183 households. With a median WTP per household of $234, this
yields median annual total benefits of maintaining the current flows in the Poudre River
of $8.5 million. Using the average value per households that reflects the fact that 20% of
the respondents have a value triple the median (see Figure 7), the mean or average WTP

35
is $352 per year per household. This yields an annual value of $12.73 million. In other
words, Fort Collins households would pay between $8.5 million to $12.73 million each
year rather than have spring and summer peak flows reduced by 50%.
Using the Lincoln Street Gauge data for the most recent 30 years at the time of this study
(1976-2006), the 50% reduction in flows from April to September 6th illustrated to
respondents in survey graph, amounts to roughly 49,831 acre feet of water. Using the
total Fort Collins annual value divided by the 49,381 acre feet represents annual value of
water for instream flow of $171 to $255 per acre foot.
This annual value compares with an annual lease value of water of $11 per acre foot from
1995 to 1999 in Colorado for environmental purposes (Loomis, et al, 2003) to $18 per
acre foot for all lease transactions regardless of purpose from 1990 to 2000
(Czetwertynski, 2002). While water right prices have tripled from these time periods,
even tripling the lease rates to $33 to $54 per acre foot suggests the annual value to Fort
Collins residents of maintaining instream flow ($171-255 per acre foot) exceeds these
lease/rental rates of water in Colorado during non drought years.
Taking the present value or present worth of the annual benefits in perpetuity using the
Federal government discount rate of 3% used by agencies such as the Army Corps of
Engineers, yields $282.7 million to $424.5 million. Thus the $282.7 million to $424.5
million to avoid a 50% reduction during the spring and summer peak flows in the Poudre
River implies a water right value per acre foot of the flows ranging from $5,673 to $8,518
per acre foot.

36
According to discussion with Joe O’Brien at WaterColorado.com, water rights can be
purchased for about $10,000 an acre foot (which is also about the cost of water being
developed with the Glade Reservoir project). Using the average WTP, Fort Collins
households value maintaining the peak flows during the spring and summer period almost
equal to the market value of the water for development. Given the high cost of
permanently maintaining instream flow in a city with rising population, there may be
merit in the concept of leasing water rather than purchasing water rights. However, water
leasing can be difficult and there would be significant legal, administrative, and water
rights issues to resolve. As the Fort Collins population increases from its 130,000 to
150,000 over the next couple of decades, this would raise median and mean total benefits
by 15%. This relatively high value of water to Fort Collins residents through town arises
in part from the public good nature of instream flows. In particular, instream flow is a
non-consumptive use of water that all can enjoy, whereas water withdrawals are rival and
consumptive (one household’s use reduces the amount of water available to other
households).

37
CONCLUSION
Eighty-three percent of those surveyed indicated that a 50% reduction in peak spring and
summer flows in the Poudre River through town would be a “bad change”, with nearly
two-thirds saying it would be a “very bad change”. Thus it is not surprising that median
annual willingness to pay to avoid the reduction in flows was substantial, at $234 per
household and the average value of $352 per household. When these amounts are
generalized to the percentage of households in Fort Collins that responded to the survey,
it yields annual benefits of $8.5 million to $12.73 million. The present worth or present
value of these benefits in perpetuity is $282.7 million to $424.5 million. When expressed
in terms of per acre foot of water needed to maintain the current spring and summer peak
flows, the value per acre foot ranges from $5,673 to $8,518. The average value is
reasonably close to the market price of water along the Northern Front Range and what
the cost is for developing water in Glade Reservoir.
Three-fourths of Fort Collins residents have visited the Poudre River in town, and more
than half do so every year, with a median of 6 trips per person. The number of trips
would fall dramatically among the 36% of visitors who said they would take fewer trips
to the Poudre River if flows were cut in half. The economic value of a visit to the Poudre
River in town is $15 per visit. The current annual value of these recreation trips is $90.
The annual loss in recreation value from a 50% reduction in flow is $30 to $48 per
household based on a median reduction of 2 trips and a mean reduction of 3.2 trips.

38
Overall, this analysis indicates a substantial economic value to visiting and non-visiting
Fort Collins households to maintain current peak spring and summer flows in the Poudre
River. It appears the average value of these instream flows to Fort Collins residents in the
same range as the market value of the water in alternative uses.
39
References
Blocker, J. and D. Eckberg. 1989. Environmental Issues as Women’s Issues: General Concerns and Local Hazards. Social Science Quarterly 70(3): 586-593.
Brookshire, David, William Schulze, Mark Thayer and Ralph d’Arge. 1982. Valuing Public Goods: A Comparison of Survey and Hedonic Approaches. American Economic Review 72(1): 165-177.
Brown, Thomas, Patty Champ, Richard Bishop and Dan McCollum. 1996. Which Response Format Reveals the Truth About Donations to a Public Good. Land Economics 72(2): 152-166.
Cameron, Trudy. 1988. A New Paradigm for Valuing Non-Market Goods Using Referendum Data. Journal of Environmental Economics and Management 15: 355-80.
Carson, Richard, Nick Flores, Kerry Martin and Jennifer Wright. 1996. Contingent Valuation and Revealed Preference Methodologies: Comparing the Estimates for Quasi-Public Goods. Land Economics 72(1): 80-99.
Champ, Patricia, Richard Bishop, Thomas Brown, Daniel McCollum. 1997. Using Donation Mechanisms to Value Nonuse Benefits from Public Goods. Journal of Environmental Economics and Management 33(2): 151-162.
Cummings, Ronald, David Brookshire and William Schulze. 1986. Valuing Environmental Goods: An Assessment of the Contingent Valuation Method. Totowa, NJ: Rowman and Allanheld.
Cummings, Ronald, Glenn Harrison and E.E. Rutstrom. 1995. Homegrown Values and Hypothetical Surveys: Is the Dichotomous Choice Approach Incentive Compatible? American Economic Review 85(2): 260-266.
Czetwertynski, M. 2002. The Sale and Leasing of Water Rights in the Western United States: An Overview of the Period 1990-2001. Water Policy Working Paper #2002-002. Georgia State University, Atlanta.
Dillman, D. 2000. Mail and Internet Surveys: The Tailored Design Method. Second Edition. John Wiley & Sons, Inc.
Haab, Timothy and Kenneth McConnell. 2002. Valuing Environmental and Natural
Resources: The Econometrics of Non-Market Valuation. Northampton, MA: Edward Elgar.
Halstead, John M., A.E. Luloff, and Thomas H. Stevens. October 1992. “Protest Bidders in Contingent Valuation.” Northwestern Journal of Agriculture and Resource Economics. 21(2): 160-169.
Hanemann, Michael. 1984. “Welfare Evaluations in Contingent Valuation Experiments with Discrete Responses.” American Agricultural Economics Association. 66(3): 332-341.
Hanemann, Michael. November, 1989. “Welfare Evaluations in Contingent Valuation Experiments with Discrete Response Data: Reply.” American Agricultural Economics Association. 71(4): 1057-1061.
Kmenta, J. 1986. Elements of Econometrics. Macmillian Publishing Company, New York, NY.

40
Krutilla, John. 1967. Conservation Reconsidered. American Economic Review 57: 777-786. Loomis, John B. and Richard G. Walsh. 1997. Recreation Economic Decisions:
Comparing Benefits and Costs. 2nd ed. State College, PA: Venture Publishing, Inc.: 159-176.
Loomis, J. 1987. The Economic Value of Instream Flow: Methodology and Benefit Estimates for Optimum Flows. Journal of Environmental Management, Vol 24.
Loomis, J., K. Quattlebaum, T. Brown and S. Alexander. 2003. Expanding Institutional
Arrangements for Acquiring Water for Environmental Purposes: Transactions Evidence from the Western United States. Water Resources Development 19(1): 21-28.
McStay, J. and R. Dunlap. 1983. Male-female Differences in Concern for Environmental
Quality. International Journal of Women’s Studies 6(4): 291-301. Mohai, Paul. 1991. Men, Women, and the Environment: An Examination of the Gender
Gap in Environmental Concern and Activism. Society and Natural Resources 5: 1-19.
Neil, Helen, Ronald Cummings, Philip Ganderton, Glenn Harrison, and Thomas
McGukin. 1994. Hypothetical Surveys and Real Economic Commitments. Land Economics 70(2): 145-54.
Park, Timothy, John B. Loomis, and Michael Creel. February 1991. “Confidence Intervals for Evaluating Benefits Estimates from Dichotomous Choice Contingent Valuation Studies.” Land Economics. 67(1): 64-73. Portney, Paul R. Autumn. 1994. “The Contingent Valuation Debate: Why Economists
Should Care.” The Journal of Economic Perspectives. 8(4): 3-17.
Sanders, L., R. Walsh and J. Loomis. 1990. Toward Empirical Estimation of the Total Value of Protecting Rivers. Water Resources Research, Vol 26 U.S. Water Resources Council. 1979. Procedures for Evaluation of National Economic
Development (NED): Benefits and Costs of Water Resources Planning (Level C) Final Rule. Federal Register 44(242): 72892-977.
U.S. Water Resources Council. 1983. Economic and Environmental Principles and Guidelines for Water and Related Land Resources Implementation Studies. U.S. Government Printing Office, Washington D.C. March 10.
Vossler, Christian and Joe Kerkvliet. 2003. “A Criterion Validity Test of the Contingent
Valuation Method: Comparing Hypothetical and Actual Voting Behavior for a Public Referendum.” Journal of Environmental Economics and Management. 45(3): 631-649.

41
APPENDIX: COPY OF SURVEY INSTRUMENT