estimating the burden of foodborne diseases in the caribbean
TRANSCRIPT

Estimating the Burdenof Foodborne Diseases
in the Caribbean
Dr Lisa Indar Program manager: Foodborne Diseases
CAREC/PAHO/WHO

• The burden of foodborne diseases can be defined as the incidence, prevalence of morbidity, disability and mortality associated with acute and chronic manifestations of FBD (WHO 2006)
• A burden of Illness study estimates the true burden of a syndrome (e.g. gastroenteritis) or pathogen e.g. Salmonella) in a community– What is the true burden of diarrhea illness in the
community?
– What is the true burden of a specific pathogen e.g Salmonella in the community?
What is a ‘Burden of Illness’ study?

Why the need to estimate
the global
burden of foodborne diseases?

Why do we need BOI studies
• FBD :important global cause of illness and death
• WHO: prevention and control of FBD: a priority (2002).
• Large variation in capacities to detect, investigate and mitigate FBD –absence of reliable data on burden of FBD
• True burden and real health impact of FBD is not known/well understood, hence not prioritised
• Precise information on BOI is needed to allocate resources for appropriate and most effective FBD control efforts, and developing relevant public health policies
• The WHO through the Global Burden Disease initiative, developed a rigorous approach for BOI estimation
• The underlying concept of this study rests on defining the reporting pyramid for each country


Objectives of the Initiative to Estimate the Global Burden of Foodborne Diseases
To strengthen the capacity of countries in conducting burden of foodborne disease assessments and to increase the number of countries who have undertaken a burden of foodborne disease study.
Objective 1 To provide estimates on the global burden of foodborne diseases according to age, sex and regions for a defined list of causative agents of microbial, parasitic, and chemical origin.
To increase awareness and commitment among Member States for the implementation of food safety standards.
To encourage countries to use burden of foodborne disease estimates (e.g. for cost-effective analyses of prevention, intervention and control measures).
Objective 2
Objective 3
Objective 4

Disease Burden
What we do know…
(reported cases)
What we need to know!
Surveillance of Foodborne DiseaseSurveillance of Foodborne Disease

Canada
United States of America
United Kingdom
Ireland
Netherlands
JordanVietnam
Malaysia
Australia
Japan
Cuba, Honduras, El Salvador, Guatemala
Slovenia
Norway
Known Studies of Burden of Foodborne Illness

Benefits of conducting a ‘BOI’ study
• Obtain estimates of the burden of enteric pathogens and acute gastroenteritis of foodborne origin in the community
• Obtain estimates of the burden caused by specific enteric pathogens commonly transmitted by food in the community
• Gain a better understanding of how your surveillance system and laboratories are working
• Promote cooperation and collaboration among various government sectors
• Advocate for gaining money and affect policy change
• Build capacity and promote intersectoral collaboration
• Determine more appropriate intervention measures for FBD, guide policy

Caribbean Burden of Illness
Study 2007-present

Why Caribbean needs a BOI study
• The epidemiology of food and waterborne illnesses at the community level are poorly understood in the Caribbean.
• Little information on disease burden is available: limiting appropriate prevention measures & allocation of resources
• Large number of marginalized populations with poor access to health are often at high risk to food, waterborne and zoonotic infections – causing considerable morbidity, and largely undetected by routine surveillance systems
• Communicable disease surveillance in the region has primarily been based on syndromic surveillance and there is limited aetiology (based laboratory- confirmed cases) since stools are not routinely collected for lab testing.

• Syndromes are often under-reported. Especially true for GE as many people will self-treat without seeking health care, (doctors do not routinely request stool samples for AGI )
• Limited understanding of which pathogens (etiologies) are responsible for the illnesses manifest in the 3 key syndromes (acute GE, undifferentiated fever, fever and respiratory)
• Even with the enhanced CD system, persons unable/unwilling to go to a health care provider will not be captured leading to a paucity of information about these individuals and the illnesses
• Ltd development of targeted disease reduction interventions.
• Conduct of BOI studies is therefore needed in the Caribbean
Why Caribbean needs a BOI study

Symptom # cases 2005
# cases 2006
# cases 2007
# cases 2008
cases 2009
Gastroenteritis (GE) <5 (17-20 CMCS)
25, 819 58,772
41, 536
57,834
49,564
Gastroenteritis (GE) >5 (17-20 CMCS)
34,658
57, 836
52,316
68,571
71159
GE/FBD outbreaks 21 21 22 FBD Etiologic agent (Laboratory-confirmed)
Campylobacter (3-6CMCS)
37
43
37
64
Escherichia coli (pathogenic)
0 3
6
8 1
Norovirus (3-4CMCS)
3 7
19
12 11
Listeria 0 13 0 0 0 Salmonella (13-15CMCS)
838
533
528 428
678
Shigella (7-11CMCS)
183 156 103
74
173
Typi and Paratyphi 0 356 110 6 6 Vibrio 1 0 0 0 1 Rotavirus 154 72 117 54 (Clinical diagnoses) Ciguatera poisoning (4-6CMCS)
453 387
263
349
91
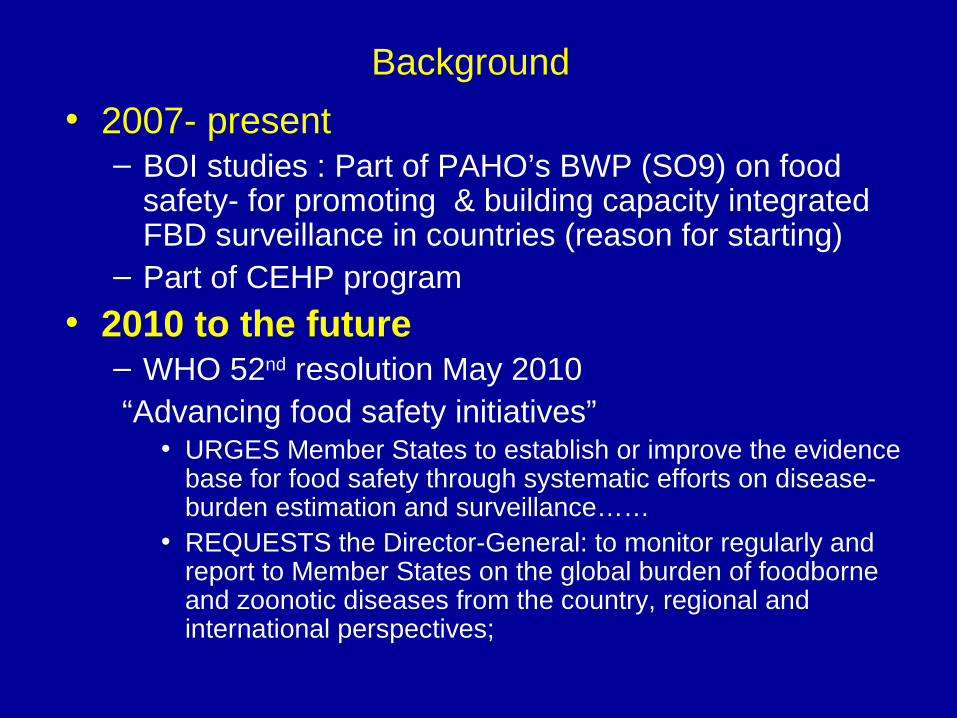
Background
• 2007- present – BOI studies : Part of PAHO’s BWP (SO9) on food
safety- for promoting & building capacity integrated FBD surveillance in countries (reason for starting)
– Part of CEHP program
• 2010 to the future– WHO 52nd resolution May 2010 “Advancing food safety initiatives”
• URGES Member States to establish or improve the evidence base for food safety through systematic efforts on disease-burden estimation and surveillance……
• REQUESTS the Director-General: to monitor regularly and report to Member States on the global burden of foodborne and zoonotic diseases from the country, regional and international perspectives;

Background• Countries (8):
– St Lucia, Grenada,Jamaica, Trinidad, Guyana Dominica
– Bermuda, Barbados
– Based on size, capacity, tourism dependence
– Request and agreements from MoHs
– representative of the CARICOM countries
• Coordination: CAREC with PAHO, PHAC
• Each country: responsible for conduct of study– Steered by CMO, national epidemiologist & lab director

Objectives of Study• Det community prevalence of gastroenteritis, fever and
acute respiratory illness and undifferentiated fever
• Quantify the under-reporting of disease syndromes.
• Develop source attribution estimates for GE illnesses.
• Understand the etiology of key pathogens commonly transmitted by food in the Caribbean. Salmonella, Shigella, Campylobacter, Staphylococcus, pathogenic E coli 0157:H7, Norovirus
• Provide baseline information on exposure to key zoonoses
• Improve laboratory capacity to enable timely and sensitive diagnose of infectious diseases.
• Build capacity to analyze surveillance and research data.
• Strengthen national and regional surveillance systems.
• Promote the generation of public policies and interventions for foodborne infections

Disease Burden
What we do know…
(reported cases)
What we need to know!
Research Protocol

Population survey
Population survey
Laboratory survey
Laboratory survey
Laboratory survey
Surveillance system
Sources of Information
How often do ill persons seek medical care?
How often are specimens submitted?
How often do laboratories test for a pathogen?
How sensitive are the laboratory tests?
How often are laboratory-confirmed cases reported?
How many cases are reported to surveillance?
1
2
3

Methodology
To estimate the burden of FBD: 2 Components
• A population-based component– Population survey based on self reported cases
– 2 surveys during high and low GI periods
• A laboratory-based component– Enhanced lab testing for 1 year
– Review of lab results before and after
• Information and Policy-based component

•Population survey based on self-reported cases of AGI
•Administered as a retrospective population based survey • Use a standardized questionnaire, administered by trained interviewers from randomly selected enumeration districts in each parish
Survey•Information on acute GE, undifferentiated fever, fever and respiratory symptoms experienced over the past 30 day•symptoms, socio-demographics, frequency of health care seeking behaviours, frequency of appropriate laboratory specimen submissions, use of antibiotics and other medications, and perceived cause of illness
1: Population Component

• Ist survey: February 21-March 7, 2009 (2 weeks) to capture the high AGI season (typically during the winter months (December-February) •second phase during 14-27 June 2009 (2 weeks)) to capture the low season. (2 weeks)) to capture the low season usually during May – July-.
Population Survey (based on GI trends)

2: Population surveyOutcomes
• estimate of the no of persons in population experiencing these syndromes and proportion of those who sought medical care.
• determine proportion of those seeking care for diarrhea provided a stool for diagnosis, under-reporting factors
• Info to estimate the social and economic cost of AGI
proportion of gastrointestinal illness (AGI) attributed to food and thespecific pathogens, (Salmonella, Shigella, Campylobacter, pathogenic Staphylococcus aureus, Escherichia coli 0157:H7, Vibrio and Norovirus) will then be estimated (in conjunction with other data, including outbreak and laboratory based surveillance data).

Goal: better understand and improve routine laboratory surveillance at country level & to determine the prevalence of specific aetiologies commonly transmitted by food
The laboratory based component includes• Lab capacity strengthening initiative
– Methods and media
• Baseline survey of the national laboratory • One year enhanced testing• Survey following one year testing
2: Laboratory Component

Outcomes of Lab Study
• estimate the number of specimens received in the laboratories servicing the study sites
• proportion of cases lost to surveillance because of negative findings
• proportion of confirmed cases reported to the surveillance systems in the participating countries.
• Laboratory and population survey- used to estimate the true impact of specific pathogens wrt to diarrheic disease in the populations

Population survey
Population survey
Laboratory survey
Laboratory survey
Laboratory survey
Surveillance system
Sources of Information
How often do ill persons seek medical care?
How often are specimens submitted?
How often do laboratories test for a pathogen?
How sensitive are the laboratory tests?
How often are laboratory-confirmed cases reported?
How many cases are reported to surveillance?
1
2
3
Example: What is the true burden of Salmonella in the community?

To estimate the burden of illness'
Step 1: Collect and analyze data
• (I) Review of current surveillance system:
• (II) Conduct a laboratory-based component– One year enhanced lab testing & survey
• (iii) Conduct a population-based survey – Two surveys based on AGI trends
Step 2: Calculate Multipliers
Step 3: Calculate Burden of Illness

Step 2: Calculate multipliers
• What is a multiplier?
– A multiplier is the inverse of a proportion calculated to account for the underreporting between two steps in a surveillance pyramid
10% = 100/10 = Multiplier of 10
20% = 100/20 = Multiplier of 5
15% = 100/15 = Multiplier of 6.7

12% = 100/12= 8.3
18% = 100/18 = 5.6
100% = 100/100 = 1.0
70% = 100/70 = 1.4
100% = 100/100 = 1.0
18,012
Step 2: Calculate Multipliers
How often do ill persons seek medical care?
How often are specimens submitted?
How often do laboratories test for a pathogen?
How sensitive are laboratory tests?
How often are laboratory-confirmed cases reported?
How many cases are reported to surveillance?

Persons Ill = 1,172,077
Persons seeking medical care = 141,214
Persons submitting specimens = 25,217
Specimens Examined = 25,217
Laboratory-confirmed cases = 18,012
Cases Reported = 18,012
Step 3: Calculate Burden of Illness
X 1.0
X 1.4
X 1.0
X 5.6
X 8.3Medical Care
Specimens Obtained
Lab Tests
Sensitivity
Reported

Burden of Illness Calculator Salmonella
A how many cases of disease are reported? 2
Per cent (%) MultiplierB How often does the parish report to NND 100 1.000B How often are laboratory confirmed cases reported to local health authority? 100 1.000C How sensitive are the laboratory tests for pathogen? 75 1.333D How often do laboratories test for pathogen? 88 1.136E How often are specimens submitted? 100 1.000E How often are requests for stool samples made ? 35 2.857F How often do persons with a diarrheal illness seek care? 17.2 5.814
Final Multiplier 25.169
Overall 50.34

Step 3: Calculate Burden of Illness
Persons Ill = 1,172,077
There are approximately 1.2 million cases of Salmonella in the
community

In country BOI Activities • Provide technical assistance for overall
coordination • Finalization of protocols, questionnaire, timelines,
budget, logistics, id of BOI coordinator• Conduct lab training• Develop Sampling frame with statistical unit • Sensitization advocacy and Launch Meetings • Survey Administration training workshops• Advocacy for stool collection • Monthly/Bimonthy Conference Calls/ Meetings

Pop Survey Administration[1] Time period
Country Survey (to capture high AGI season)
Survey (to capture low AGI season)
Laboratory testing (year)
Current Status and outstanding activities
2008-2009
St Lucia April 2008 Peak: week 12-15 Survey:(Apr 28-Ma 3)
Dec 2008 Low: Weeks 44-50 Survey: (Dec 8-13)
April 2008- April 2009
? Completed, data to be analyzed ? Paper presented at CHRC 2009 ? Request for assistance to prepare
country report
2008-2009
Grenada? Feb/May 2009 Peak: week 14-15 Survey: Apr 12-18,
Oct 2008 Low: week 30-31 Survey : Oct 12-18
Oct 2008- Dec 2009
? Completed ? Paper presented at CHRC 2009 ? Country report received in May 2010,
being reviewed by CAREC ? Abstract presented at ICEID 2010 ? Request by country for data to be
disseminated in country ? Paper being written for journal
2008-2010
Trinidad and Tobago
Nov 2008 Peak: week 46-47 Survey Nov 9-15
June 2009 Low: week 25-26 May 31-June
Nov 2008- Dec 2009
? Completed ? Country report just received for
review by CAREC ? Abstract to be presented at IUFOST
2010 ? Paper being written for CHRC 2010 ? Awaiting CAREC comments for data
dissemination
Status of in country BOI studies

2009-2010
Jamaica February 21-March 7, 2009
June 14-27, 09 March 2009 -2010
? Completed ? Preliminary report sent to PAHO in
May 2010 ? Request for assistance to prepare
final country report and write paper 2009-2010
Dominica Feb-March 2009 Peak: week 8-9 (Feb 22-Mar 09)
Aug 2010 March 09- May 09
? Ongoing ? Ist phase of pop study completed ? Next phase : Aug 2010 ? Report due Dec 2010
2009-2010
Guyana June-July 2009 Survey Mid August 2009
Nov-December Survey: Mid Nov2009
August 2009- August 2010
? Lab study Ongoing ? Population surveys completed , data
being entered ? Need assistance in data analysis ? Report due Nov 2010
2010-2011
Barbados Feb -April 2011 Peak: week 12-13 (Mar 29-Apr 4)
July –Aug 2010 Low: wk 30-31 (Jul 26- Aug 08)
Aug 2010- Aug 2011
? To be launched on August 9-13th 2010
? Final protocol and IRB approval in July 2010
? LOA being finalized and preparations being made
? Ist population study to be conducted on Aug 14-20 2010
2010-2011
Bermuda Oct 2010 Peak: week Survey (Oct 2010)
Feb 2010 low: week 4-5 (Jan 25-31)
Oct 2010- Oct 2011
• Initial meeting in June 2010 • Protocol being prepared • Proposed date for ist survey and
launch : October 2 010

Table 1 : Key Summary data from BOI population and laboratory surveys
AGE population and laboratory surveys data Range * (from 6 countries)
Survey Respondent /cooperation rate 65.8%- 99.95%
Monthly Prevalence of AGE 4.03%- 10.7%
Incidence/ episodes of diarrheal per person year. 0.52 -1.4 episodes /year
Duration of Diarrhea
Mean duration of diarrhea
1-20 days
2.1-3.8 days
Loss of productive days due to illness
Mean Loss of productive days
1-20 days
1.5-4 days

AGE population and laboratory surveys data Range * (from 6 countries)
Ill persons sought seek medical care 15.4%-36%
Hospitalizations 0-14%
Stool specimens requested from ill person 12.5 %- 23%
Stools specimens Submitted for testing 1%-43%
Laboratory tested for AGI stool specimen 25%-95%
Proportion of Laboratory positive AGE specimen 8.5%-47%
Laboratory confirmed AGE reported to surveillance unit 11.8%-76.4%
Treatment of AGE with ORS 4.3%- 65%
Treatment of AGE with antibiotics 2.0- 41%
Hand washing before and after toilet use 21%-58%
Using soap to wash hands. 28-68 %

Critical success factors
1. Advocacy /sensitization msgs for stool collection
2. To doctors, health care workers for enhanced stool collection from cases with diarrhea
• To public: to bring /request/give stool samples 1. Timeliness of Stool collection & transport to lab2. Enhanced Laboratory testing
– Media and supplies– Proper info on forms (onset, symptoms, age)– Standardized methods
3 Survey administration– Follow protocol – Avoid bias (convenient sample)– Visit homes when entire household is present

Capacity building
• Created/strengthened the capacity in the design of country protocols,
• Strengthened laboratory diagnosis and identification of FBD pathogens;
• BOI data analysis workshop Improved specimen collection and transport,
• Data analysis and assessment of the evidence
• Intersectoral collaboration, • Strengthening the health surveillance system
in the countries.

Impact• Promotion of Interdisciplinary team work,
communication and data sharing between lab, epi, env health and vet
• Gaps in surveillance system identified– Improvement in FBD surveillance (timeliness of
reporting, coordination, response)• Increase in lab capacity and better lab data
– More etiologies, more labs, more accurate data– Computerized data collection and analyses
• Data on burden of AGI and economic costs– Evidence of the importance of FBD
• Data on risk factors for infection– Improve food safety measures
• Definition of new research lines– Attribution to the source of origin– Burden of disease (Dalys calculation)

Future actions
• Complete on-going studies• Data dissemination
– Country reports
– Peer reviewed papers: regional and country data.• Workshop at Guelph (PHAC-U of Guelph)• Journal articles (Infection journal)
• Knowledge translation– Workshop for social network mapping
• PVS tool
– Follow-up the workshop as part of PAHO BWP in 2011 and in the BWP12-13 for the Caribbean led by CAREC.
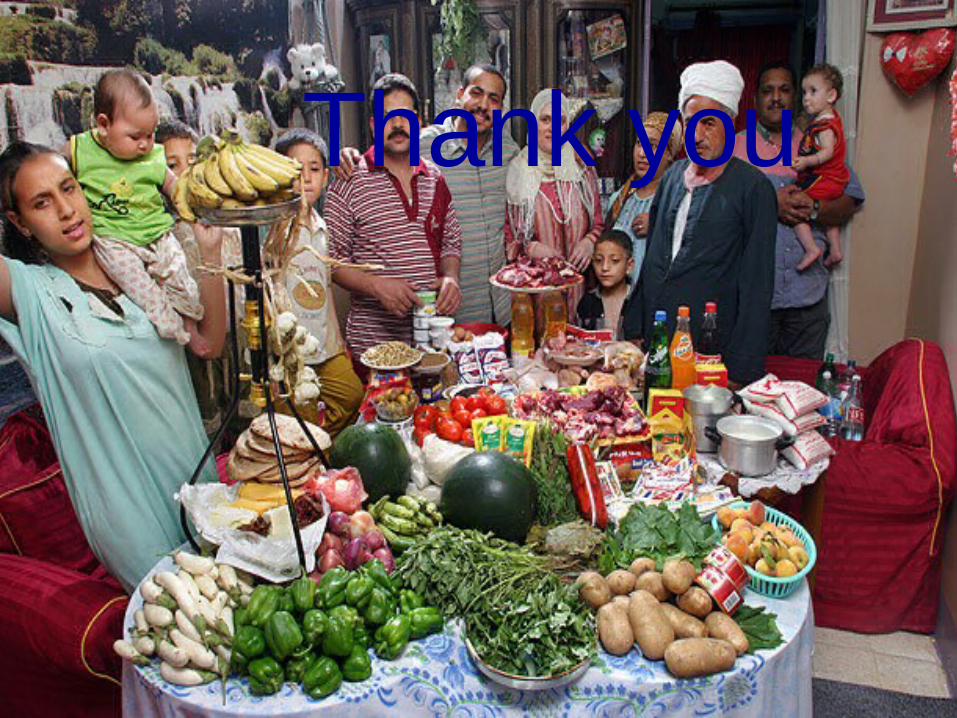
Thank you