estimating the burden of illness and economic consequences
TRANSCRIPT

1
Estimating the burden of illness and economic consequences associated with malnutrition in
Myanmar
David Coomes
A thesis
submitted in partial fulfillment of the
requirements for the degree of
Master of Public Health
University of Washington
2019
Committee:
Carol Levin
Christine McGrath
Program Authorized to Offer Degree:
Department of Global Health

2
©Copyright 2019
David Coomes

3
University of Washington
Abstract
Estimating the burden of illness and economic consequences associated with malnutrition in
Myanmar
David Coomes
Chair of the Supervisory Committee:
Carol Levin
Department of Global Health
While there has been progress over the last few decades, maternal and child undernutrition still
contributes to a substantial amount of death and illness in the world. In Myanmar, it is the number one
risk factor for premature death and disability. In addition to human suffering, the consequences of
malnutrition contribute to lower overall economic productivity which impacts families and the country
as a whole. This study uses 2016 DHS household survey data from Myanmar to estimate the prevalence
of malnutrition related indicators in the country, including stunting, wasting, low birthweight, anemia,
and suboptimal breastfeeding practices, along with the population attributable fraction of morbidity and
mortality associated with those malnutrition indicators. Additionally, the incidence of deaths and
illnesses attributable to malnutrition is used to estimate the economic costs associated with
malnutrition. We estimate a total of 11,905 (95% CI: 6,187-17,703) under five deaths per year in
Myanmar due to malnutrition, which represents approximately 25% of all under five deaths in the
country. The total costs associated with malnutrition is $506.8 million USD (95% CI; 396.7-618.2)
annually, which represents approximately 0.80% of Myanmar’s GDP. The main contributors of costs
include $212.6 million that is associated with stunting and $145.7 million that is associated with under
five mortality. The government of Myanmar should consider the economic consequences of
malnutrition when weighing investments in health against other budget considerations.

4
Introduction
Despite significant progress over the last two decades, malnutrition continues to affect one out of three
individuals around the world, including 151 million children who are stunted and 51 million who are
wasted.1 While the global rate of childhood stunting has decreased from 32.6% to 22.2%, there remains
significant disparities among, and within, countries. Progress on addressing anemia and underweight
among women of childbearing age has been much slower: the rates of underweight among women have
not changed significantly since 2000 and rates of anemia have risen slightly. In addition, there are
millions of undernourished individuals who face serious health risks as multiple forms of malnutrition
interact to increase adverse health outcomes. Particularly affected are the 16 million children in the
world who suffer from both stunting and wasting, along with the 8.2 million children who suffer from
both stunting and overweight.2
While the burden of illness associated with malnutrition has lowered, and the overall burden of disease
worldwide has shifted over the last 30 years, from communicable diseases in childhood to
noncommunicable diseases (NCDs) in adulthood, underweight still remains the leading risk factor for
Disability-adjusted Life Years (DALYs) among children under five years old.3 Overall, child and maternal
undernutrition accounts for approximately 7% of the worldwide disease burden. This statistic also
conceals country and within-country differences in health risks.
Malnutrition is driven by a range of risk factors that interact in a complex way, including agricultural,
environmental, economic, and social factors.4 Food security, an important driver of malnutrition,
depends on the availability, access, and biological utilization of food. These factors, in turn, are
dependent on environmental conditions that may impact agriculture and market conditions that impact
the supply and price of food. Other drivers include access to clean water, improved sanitation facilities,
and access to healthcare. All of these factors are highly interrelated and dependent on each other.
Myanmar suffers from particularly high rates of malnutrition; it is one of the 20 countries that comprise
80% of the world’s malnourished children.5 Among malnutrition indicators, rates of stunting and anemia
are particularly high in Myanmar. Similar to the global trend, the country has made significant
improvements in combating malnutrition. The contribution of malnutrition as a risk factor for death and
disability has lowered by almost 50% over the last ten years, possibly due to increased investment in
micronutrient supplementation and a focus on child nutrition.5 Despite this, it still remains the number
one risk factor in the country.6
The consequences of malnutrition on poor health outcomes in Myanmar are significant. Stunting can
lead to poor physical and cognitive health and even to increased chronic diseases later in life.7 Early
childhood stunting is associated with increased risk of obesity later in life, which may impact the country
as it experiences the nutrition transition that many other quickly developing countries have experienced
before.8 This transition is marked by a change in disease patterns towards nutrition-related NCDs that
particularly impacts those of low-socioeconomic status.9 In this context, undernutrition is associated
with chronic health conditions such as inflammatory bowel disease (IBD), chronic kidney, lung, and liver
disease, and cancer.10 This could contribute to already dire trends as Myanmar is among one of the 23
countries that accounts for approximately 80% of the total morality burden attributable to chronic
diseases in developing countries.11 Most importantly, malnutrition is associated with almost half of all

5
child mortality in the world.12 This is significant in Myanmar as approximately 5% of all children die
before reaching their fifth birthday.13
In addition to the significant poor health outcomes associated with malnutrition, multiple studies have
reported economic losses due to malnutrition and its related health outcomes, or its inverse – the cost
savings associated with nutrition interventions. The 2015 Global Nutrition Report mentions that scaling
up nutrition interventions results in a compound rate of return of 10% and a benefit-cost ratio of 16:1.14
One multi-country review found benefit-cost ratios of investing in stunting reduction in 17 high-burden
countries to range from 3.6 to 48, with a median of 17.7 In this study, Myanmar was found to have a
benefit-cost ratio of 17.2-17.7, very close to the median. Longitudinal evidence has also shown
economic losses, or benefits attributed to interventions, due to malnutrition. A cohort of individuals in
Guatemala who participated in a nutritional supplementation trial found that those who were stunted at
36 months had a 66% lower per capita consumption compared to those that were not stunted.15
Cost of illness (COI) studies represent an important component to understanding the economic burden
of risk factors, such as malnutrition, related to morbidity and mortality. Rather than a full economic
evaluation, which measures both the cost of illness and the benefits of interventions, a COI study only
estimates the costs associated with the economic burden of the relevant diseases.16 These studies can
be used to provide information that will inform cost-effectiveness and cost-benefit studies, as well as
estimate the amount of money that could be saved if a disease or risk factor were eliminated from a
country.17 Previous COI studies that look at malnutrition have reported a large range of estimates.
Examples include a study that estimates the cost of stunting in Malawi to be 10% of the annual GDP,18
and another that estimates the annual burden of malnutrition among pregnant women and children
under 5 in Cambodia to be $260 million, or 1.7% of the GDP.19
The current study will attempt to estimate the cost of malnutrition in Myanmar, using a societal
perspective to capture all costs, including direct medical costs as well as costs related to current and
future lost productivity. The contribution of this study is twofold: 1) to benefit future full-economic
evaluations that estimate the costs and benefits of nutrition-specific and nutrition-sensitive
interventions in Myanmar, and 2) to inform policy discussions on the importance of policies to improve
nutrition in Myanmar and other low- and medium-income countries. In order to estimate these costs,
this study will also estimate the prevalence of malnutrition and related risk factors in Myanmar as well
as the population attributable risk (PAR) of mortality and morbidity associated with these factors. The
rest of this paper includes a review of the risks associated with malnutrition, followed by a methods,
results, discussion, and conclusion sections.
Review of literature of the risks associated with selected malnutrition
indicators
The following section outlines epidemiological evidence associating malnutrition related factors with
poor health outcomes. In this study we include the evidence on mortality and morbidity associated with:
maternal body mass index, micronutrient deficiencies, anemia, low birthweight, anthropometric
deficiencies (stunting and wasting), and breastfeeding practices. Figure 1 at the end of the section
illustrates the association between the risk factors and health outcomes.

6
Maternal Body Mass Index
Multiple studies have shown increased odds of giving birth to a low birthweight (LBW) infant associated
with low maternal BMI. Low maternal BMI is usually defined as less than 18.5 kg/m2, while low
birthweight is usually defined as infants who are born weighing less than 2500 grams. One cross-
sectional study in Sudan reported that maternal BMI was significantly associated with LBW.20 Another
cross-sectional study from India reported that women with a pre-pregnancy BMI <18.5 kg/m2 had
increased odds of giving birth to a LBW infant as compared to women with a pre-pregnancy BMI of 18.5-
22.9.21 Finally, representing stronger evidence, a prospective cohort study from Viet Nam reported
increased odds of delivering an infant of LBW for women with low BMI as compared to women that
were not low BMI.22
Low birth weight is associated with multiple short-term negative health outcomes including infant
mortality and morbidity, as well as long-term health outcomes such as stunting and chronic diseases in
adulthood. Additionally, LBW has been associated with poor cognitive outcomes – low birth weight
babies are more likely to complete fewer years of school and suffer from lower productivity as adults.21
Micronutrient deficiencies
Micronutrients, including zinc, vitamin A, and iron, are important for fetal and young child growth and
development, as well as maternal health. Poor health outcomes from micronutrient deficiencies include
low birth weight, increased maternal mortality, and increased child morbidity and mortality from
infectious diseases. The health outcomes depend on specific micronutrient deficiencies – each one is
important for different developmental or functional purposes and therefore interact with health in
specific ways. There is limited evidence that multiple micronutrient (MMN) supplementation among
pregnant women improves birth outcomes, through supporting health and development for both
maternal and fetal systems.23 Poor nutritional status of the mother can result in restricted fetal growth,
which is a major contributor to low birth weight in LMICs.24 MMN supplementation in a trial in Nepal
reduced three-month mortality among preterm infants, but did not impact mortality for term infants.25
A meta-analysis showed that MMN was also associated with reduced risk of low birth weight.26 Because
the impact on morbidity and mortality differs depending on the micronutrient, the present study will
focus on iron, vitamin A, and zinc and the evidence of associated health outcomes from deficiencies in
these micronutrients.
Additionally, the overall nutritional and environmental health status of populations modifies the impact
of supplementation programs – evidence points to the fact that health outcomes are only improved for
micronutrient deficient populations. For example, studies in Bangladesh and Indonesia showed cognitive
improvements for children born to mothers with low BMI or anemia, however, no improvement was
seen among children born to healthy weight mothers.23 Further complicating the interpretation of study
results is the fact that supplements have complex interactions with the environment. Nutritional
supplements may have reduced efficacy due to infectious diseases or other factors related to
malnutrition.
Zinc
Zinc deficiency in children has been linked to an increased risk of diarrhea and pneumonia as well as
stunting.27 Zinc deficiency results in impaired immune system functioning, and the impact of zinc

7
supplementation on infectious disease is believed to be both therapeutic and preventive.28 Evidence
supporting this comes from trials of zinc supplementation that have reduced diarrhea morbidity and
mortality among children under five.24 The impact of zinc deficiency begins during gestation and
continues through early life – maternal zinc supplementation has been associated with reduced child
morbidity for low birth weight infants.29
Vitamin A
Vitamin A deficiency has been linked to increased child and maternal mortality due to diarrheal disease
and measles. While the global prevalence of vitamin A deficiency has gone down over the last several
decades, it still accounted for 1.7% of all deaths in children under five in LMICs, including an estimated
94,000 deaths from diarrhea and 11,200 deaths from measles in 2013.30 Vitamin A deficiency is also
linked to blindness among pregnant women and children – nearly 52,000 children go blind in India every
year due to vitamin A deficiency.31 The impact of supplementation depends on the dose and frequency
of administration – interventions with smaller more frequent doses were associated with a 42%
reduction in child mortality while interventions with larger and less frequent doses were associated with
a 19% reduction in child mortality.32 Vitamin A supplementation was also shown to decrease maternal
morbidity in a randomized trial in Nepal, likely due to decreased obstetric problems and infections.33
Anemia
There is substantial evidence that anemia impacts maternal, child, and adult health. Negative health
outcomes of anemia include maternal and child mortality, low birth weight, preterm birth, and reduced
child cognition. Factors that contribute to anemia include inadequate micronutrient intake (including
iron, folate, and vitamin B12), infections such as malaria or hookworm, and genetic conditions such as
thalassemia.34 Many sources cite the figure that 50% of anemia is due to iron deficiency, however,
studies that have examined this link directly have shown that this figure ranges considerably (from 1%-
75%) based on context.35 While there are no studies that report the contribution of micronutrient
deficiencies to anemia in Myanmar, children with anemia in the country were found to have significantly
lower levels of blood iron as compared to children without anemia.36
Anemia among pregnant women has been associated with maternal and neonatal mortality, low birth
weight, and preterm birth. Two studies, both using meta-analyses, estimate a lower relative risk of
maternal mortality with increasing amounts of blood hemoglobin among pregnant women.27,37 This
relationship was found to differ among women in regions endemic with Plasmodium falciparum malaria
as compared to non-endemic regions, with the risk of morality being higher in endemic regions.37
Anemia among pregnant women has also been associated with neonatal (up to 1 month after birth) and
perinatal (seven days after birth) mortality. One study reports a lower perinatal mortality rate
associated with an increase in blood hemoglobin,37 while another reports a higher odds ratio of neonatal
mortality associated with maternal anemia (as defined by Hb concentrations below 110 g/L).35
There is evidence that maternal anemia is associated with both low birthweight (LBW) and preterm
birth. Low birth weight is generally defined as an infant born full term that weighs between 2000-2499
grams, and very low birth weight are those that weigh less than 2000 grams. The odds of giving birth to
a child of low birth weight was found to be greater among anemic women in one meta-analysis,35 and an
observational study in Nepal found increasing odds of giving birth to a low birthweight infant, consistent
with a dose-related manner, associated with lower maternal hemoglobin concentrations.37 Additionally,
8
experimental evidence has shown that iron supplementation among pregnant women resulted in a 20%
reduction in incidence of LBW.38 In a study in rural Nepal, women with anemia and iron deficiency had
an almost doubled risk of preterm birth compared to those without anemia.39
There is not much evidence that supports the impact of anemia in children on child mortality. Most of
the evidence that finds associations between these come from Plasmodium falciparum malaria endemic
regions, where malaria is a major cause of both childhood anemia and mortality.37 One recent analysis
reported a link between anemia and child mortality for children up to 12 years old,40 however, this
analysis only included P. falciparum endemic regions and compared severe anemia (<5.0 g/dL Hb) to all
others. Because the evidence is not clear, the present study will not include child anemia as a risk factor
for death.
Anemia impacts adult labor productivity through several biological pathways, including oxygen transport
from the lungs to the muscles, and iron supplementation interventions have been shown to improve
productivity.41 One seminal study reported the productivity losses as 5% for light manual labor and as
high as 17% for heavy manual labor.42 There is some evidence that links childhood anemia to reduced
cognitive development. One review reports an association of 1.73 lower IQ points per 10 g/L decrease in
hemoglobin,27 and another reports an increased risk of mental retardation associated with lower blood
hemoglobin levels.37 As far as economic outcomes, childhood anemia has been associated with a 2.5%
reduction in adult earnings.42 While there are no recent studies measuring the role of iron deficiency in
anemia in Myanmar, a study published in 1972 reports rates of iron-deficiency anemia (IDA) of 13-24%
among pregnant women, 5-15% among all women, 3-27% among children, and 1-5% among men.43
Low Birthweight
Globally, approximately 20 million infants are born with low birthweight (LBW) every year.44 The two
main causes of this are intrauterine growth restriction (IUGR) and preterm birth. Those that are born
small but at term (>37 weeks) are considered small for gestational age (SGA). SGA infants may represent
babies that experienced IUGR due to factors such as under nutrition, pregnancy complications,
infections, or other diseases.45 In low-income countries, which experience high rates of SGA births due
to IUGR, low birthweight is often used as a good proxy of IUGR.45 The causes of LBW also have different
impacts on the morbidity and mortality outcomes associated with LBW. While most babies born with
low birthweight in LMICs are born term, and therefore experience growth restriction in utero, the
relative risk of mortality associated with preterm delivery are higher as compared to SGA infants. Infants
that are born both preterm and SGA are at the highest risk of mortality – they have a 15-fold higher risk
of dying during the neonatal period as compared to infants that are born at term and appropriate
weight for their gestational age.27
The risk of dying for LBW infants is highest during the neonatal period (1-28 days), but increased risk of
mortality persists throughout the first year of life.44 Additionally, IUGR is associated with long-term
health impacts and may contribute to stunting in adolescents and adults.46 Other long-term
consequences of IUGR include increased risks of diabetes, obesity, and hypertension as well as delayed
cognitive development. Because LBW and IUGR are associated with other long-term nutritional
outcomes, such as stunting, the present study will focus on the impacts of LBW on neonatal mortality.
Estimates on the duration of pregnancies, and therefore the prevalence of preterm births, is not
available in Myanmar, therefore, this study will assume that all LBW babies are due to IUGR. This will

9
likely underestimate the mortality due to LBW as preterm babies have a higher risk of death as
compared to term SGA babies.
Anthropometric measures – stunting, wasting, and underweight
Malnutrition in children is often measured by low height for age z-score (HAZ or stunting), low weight
for height z-score (WHZ or wasting), and low weight for age z-score (WAZ or underweight). The standard
cut-off for nutritional deficiencies for all of these measurements is below -2 z-scores as compared to the
WHO Child Growth Standards median for the same age and sex.47 Children who fall below -3 z-scores of
the reference population are considered severely malnourished. While the categorization of
malnourishment is based on hard z-score cut-offs, there is evidence that mild malnourishment –
children who are not technically categorized as stunted, wasted, or underweight but who experience
some malnutrition – also impacts child health and growth. Suboptimum growth as measured by these
indicators is associated with increased risk of death due to infectious disease during childhood.27
Although undernutrition is not often cited as the immediate cause of death, stunting, wasting, and
underweight have been attributed to 14.5%, 14.6%, and 19.6% respectively of all child deaths under five
in the world.48 It is important to note that anthropometric deficits (stunting or wasting) do not
themselves cause increased mortality or morbidity, however, they are good proxy measurements for
chronic and acute malnutrition.49
Stunting is associated with chronic malnutrition, including micronutrient deficiencies, and the highest
risk period for stunting takes place in the first 1000 days after conception.27 Wasting is associated with
acute malnutrition, and can be impacted by infectious diseases such as acute respiratory infections,
measles, and diarrhea. Underweight is associated with both chronic and acute malnutrition – children
who are stunted or wasted may be underweight.50 Evidence from India shows that 20-55% of children
are born with some growth faltering present, making maternal nutrition an important part of child
nutritional outcomes.50 Because of the inability of underweight to distinguish between those that are
stunted and those that are wasted, this study will focus on the risk of mortality and morbidity associated
with stunting and wasting separately, rather than underweight. At the highest risk of mortality are those
that suffer from both stunting and wasting. Children who are stunted, wasted, and underweight have an
almost 12-fold risk of mortality as compared to children without any growth deficits.50
The mechanism through which suboptimal growth increases the risk of mortality is suppression of the
immune system resulting in increased susceptibility to infections.51 This results in a positive feedback
cycle wherein children who are malnourished are more susceptible to, and suffer greater impacts from,
infectious disease, which in turn reduces their nutritional status. Inadequate dietary intake of zinc and
vitamin A are also associated with suboptimal growth, increasing the risk of mortality.50 There is
evidence that stunting and wasting are each associated with incidence of infectious disease, although
the strongest evidence shows that they may increase the duration and severity of diarrhea and ARI.52
Additionally, evidence shows that children who are both stunted and wasted are at higher risk of
diarrheal disease and ARI.53 Finally, malnutrition has been associated with decreased response to
vaccines.54
In addition to increased risk of mortality and morbidity due to infectious disease, there are long-term
health impacts for children who suffer from growth failure. Children with stunted growth are at
increased risk of obesity later in life and of developing major comorbidities, such as type 2 diabetes and
cardiovascular disease.55 There is also a higher risk of hypertension among undernourished pre-school

10
children and adolescents.56 This has been termed the ‘triple burden’ of malnutrition, infectious disease,
and non-communicable diseases that impact children living in poverty and food insecurity in LMICs.
Finally, there are intergenerational cycles that contribute to malnourished populations – women who
are stunted are more likely to give birth to stunted children.57
Cognitive impacts of stunting
Malnutrition in general, and stunting especially, is associated with reduced long-term cognitive
development in children. The negative outcomes for stunted children include poor cognition along with
lower educational attainment and, into adulthood, lower adult wages and productivity.58 Stunting has
been shown to delay schooling by 1-3 years, and those that are stunted but in school have been shown
to have a 25% reduced cognitive benefit of attending school.54 Some estimates put the personal
economic losses of stunted individuals at 20% less income as adults.58 Others have used more moderate
estimates of around 6% in lost income due to stunting.19
The causal mechanism of malnourishment on poor cognitive development are hypothesized to come
from brain development. Apical dendrites in the brain cortex continue to develop until about two years
of age, requiring adequate nutrition to do so. This makes the first 1000 days after conception
particularly important for nutrition’s impact on cognitive development.
Breastfeeding Practices
The WHO recommends exclusive breastfeeding for the first six months of life, and breastfeeding along
with complementary foods until age two.58 Optimal breastfeeding practices are associated with a lower
risk of all-cause mortality, mortality due to diarrheal disease, and incidence of diarrheal disease for
children under two.59 Approximately half of all diarrhea incidences and 823,000 deaths among children
under five worldwide could be prevented by breastfeeding.60 The mechanism of protection against
infectious disease for breastfeeding includes increased nutrition as well as protection through glycans
and secretory immunoglobulins present in breastmilk.61 Additionally, infants who are exclusively
breastfed are not ingesting water with possible contaminants that may cause infection.
There is some evidence that suboptimal breastfeeding increases the risk of incidence and mortality due
to pneumonia, however, this evidence is less conclusive compared to the impact of breastfeeding on
diarrheal disease.27,62 Long-term impacts of breastfeeding on children may include reduction of obesity,
diabetes, sudden infant death syndrome, and malocclusion.63 In addition to protection for children
under two, breastfeeding likely confers benefits for mothers including lower risk of breast and ovarian
cancers.
Breastfeeding has also been associated with higher cognitive performance. The annual economic burden
of not breastfeeding is estimated to be about $302 billion, or 0.49% of the world’s gross national
income.63 In Southeast Asia, a study estimated that the impact of suboptimal breastfeeding among
seven countries, including Myanmar, was 12,400 preventable child and maternal deaths and a loss of
$1.6 billion every year.64 This same study estimated that Myanmar had $3.38 million in health care
expenditures per year due to inadequate breastfeeding. We will not include cognitive losses due to
breastfeeding in this study as it is likely associated with other cognitive losses that we include, such as
losses due to stunting.

11
Figure 1. Diagram of nutrition-specific indicators and their association with health outcomes. All outcomes are specific to children under five
years of age unless otherwise specified. The yellow outcomes are the intermediate health outcomes used as proxy measurements for
malnutrition in this study.
Anemia (child)
Diarrhea mortality
Stunting
Low birthweight
Suboptimal breastfeeding
Wasting
Vitamin A deficiency
Low BMI (maternal
)
Iron deficiency
Zinc deficiency
ARI mortality
Diarrhea morbidity
ARI morbidity
Measles mortality
Poor cognitive development
Inadequate nutritional
intake
Anemia (maternal)
Neonatal/ perinatal mortality
Vitamin A deficiency (maternal)
Maternal mortality
Cause
Intermediate
outcome (measured)
Health outcome
Legend

12
Methods
The prevalence of malnutrition in Myanmar was used to estimate the mortality rate and permanent
disability attributable to malnutrition during the study year, as well as the economic losses associated
with these deaths and disability. We also estimate the incidence and economic burden of diarrheal
disease and acute respiratory infections (ARI). To estimate the economic losses associated with these
indicators we 1) estimated the prevalence of associated nutrition indicators, 2) estimated the population
attributable fraction (PAF) of morbidity and mortality attributable to these indicators using the
prevalence of disease and relative risks (RR) found in the literature, 3) applied the PAF estimates to
obtain the annual number of deaths and disability associated with malnutrition by risk group, and 4)
estimated the annual economic losses by applying the number of incident cases with disease and deaths
to cost formulas.
Although the mortality estimates are based on the prevalence of malnutrition indicators, the final
costing analysis used the incidence of mortality over one year to estimate the costs associated with
malnutrition. This was done by constructing the PAF of mortality associated with malnutrition related
indicators and applying this to the incidence of cause-specific mortality for the year as reported by the
World Health Organization (WHO). This estimate is the incidence of cause-specific mortality associated
with malnutrition. The annual incidence of diarrheal disease and ARI was also calculated.
Prevalence and incidence of nutrition-specific indicators
The prevalence of nutrition-specific indicators was used to construct the PAF associated with
malnutrition. The prevalence of nutrition-specific indicators for stunting, wasting, BMI during pregnancy,
maternal anemia, and low birthweight in Myanmar were estimated using the 2015-16 Demographic and
Health Survey (DHS), a nationally and regionally representative survey. For prevalence rates that could
not be estimated using DHS survey data (i.e. micronutrient deficiencies such as zinc and vitamin A) a
literature search was conducted to find prevalence estimates from comparable settings. Using
prevalence estimates, the total number of cases for each nutrition indicator was estimated by applying
the prevalence estimates to the proportion of the population for each target group (pregnant women,
children under five years, and adults aged 15 to 49 years) reported by the United Nations Population
Division (ref).
The incidence of infectious disease (diarrhea and ARI) was used to estimate the direct medical costs
associated with malnutrition. Diarrhea and ARI yearly incidence was estimated using the 2015-16 DHS
survey. Incidence of diarrhea, cough, and short rapid breathing in the last two weeks for children under
5 years was reported by a sub-sample of households within the survey. ARI incidence was estimated as
all children that were reported to have both cough and short rapid breathing in the last two weeks.65 To
estimate the total number of cases of diarrhea and ARI, the sampling fraction was determined by
dividing the total number of children under 5 years in Myanmar in 2015 by the sample of children whose
mother answered the individual questionnaire. The sampling fraction was then multiplied by the
individual weight and applied to the incidence of diarrhea and ARI in the last two weeks to determine
the total number of cases of diarrhea and ARI in the two weeks before the survey. This number was
multiplied by 26 to estimate the total number of cases of diarrhea and ARI over the study year. All
prevalence and incidence estimates were constructed using Stata version 14. The svy commands in Stata
were used to account for sampling design, including survey weights and household level clustering.

13
Population attributable fraction associated with nutrition-specific indicators
The population attributable fraction (PAF) was used to estimate the total number of deaths and illnesses
attributable to malnutrition in the study year, and to estimate the economic losses associated with
these deaths and illnesses. The PAF of morbidity and mortality due to undernutrition was calculated
using the comparative risk assessment framework.3 For this framework, the burden of disease
associated with each nutrition-specific indicator is calculated in reference to a theoretical counterfactual
that is specific to each indicator. For example, estimates of neonatal mortality associated with low birth
weight were calculated as the risk of mortality for babies born below 2500g compared to the risk of
mortality for babies born ≥2500g. Table S1 lists the theoretical counterfactual specific to each indicator.
These risk factors are informed by epidemiological evidence as outlined in the literature review, and the
possible distribution of these risk factors at the population level. Table 1 and Table 2 present the
relative risks (RR) of these risk factors on mortality and morbidity respectively.
Table 1. Relative risk of mortality associated with nutrition indicators found in literature.
Nutrition Indicator Relative Risk
Mortality associated with maternal nutrition status
Neonatal mortality associated with Maternal anemia35
1.49 (1.19-1.87)
Maternal mortality associated with Vitamin A deficiency33
1.78 (1.19-2.70)
Child mortality associated with low birth weight (<2500g)59
Neonatal mortality 3.06 (2.21-4.23)
Post neonatal mortality 1.98 (1.39-2.81)
Child mortality associated with severe, moderate, and mild wasting and underweight27
Anthropometric indicator z-score
< -3SD -3SD to -2SD -2SD to -1SD
ARI1 mortality by HAZ 6.39 (4.19-9.75) 2.18 (1.39-3.43) 1.55 (1.02-2.37)
ARI mortality by WHZ 9.68 (6.07-15.43) 4.66 (3.07-7.09) 1.92 (1.31-2.84)
Diarrhea mortality by HAZ 6.33 (4.64-8.64) 2.38 (1.71-3.31) 1.67 (1.20-2.30)
Diarrhea mortality by WHZ 12.33 (9.18-16.57) 3.41 (2.52-4.63) 1.60 (1.23-2.11)
All-cause mortality among children with stunting and wasting50
18.64 (10.90-31.87) Reference is children that are not stunted or wasted
Child mortality by breastfeeding behavior62
Diarrhea mortality
0-5 months 6-23 months
Partial
None None
4.62 (1.81-11.76) 10.52 (2.79-39.6) 2.18 (1.14-4.16)
Child mortality associated with vitamin A deficiency30
Diarrhea mortality 1.69 (1.17-2.45)
1 ARI refers to acute respiratory illness
14
Measles mortality 1.26 (0.84-1.87)
Child mortality associated with zinc deficiency
Diarrhea mortality28 1.14 (1.06-1.23)
Note: Partial breastfeeding means that an infant’s main source of nourishment comes from breastmilk, but they may also intake some liquids (water and juices), ORS, vitamins, minerals, and medicines. Exclusive breastfeeding refers to no other food or drink, including water.
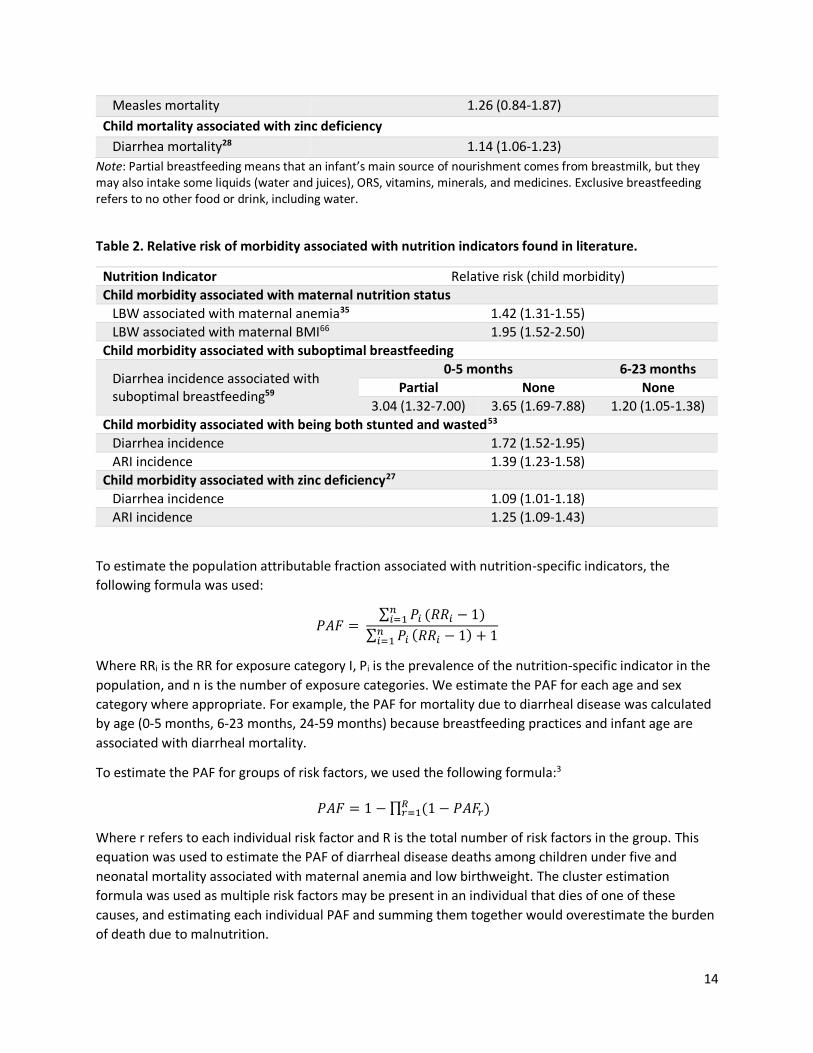
Table 2. Relative risk of morbidity associated with nutrition indicators found in literature.
Nutrition Indicator Relative risk (child morbidity)
Child morbidity associated with maternal nutrition status
LBW associated with maternal anemia35 1.42 (1.31-1.55)
LBW associated with maternal BMI66 1.95 (1.52-2.50)
Child morbidity associated with suboptimal breastfeeding
Diarrhea incidence associated with suboptimal breastfeeding59
0-5 months 6-23 months
Partial None None
3.04 (1.32-7.00) 3.65 (1.69-7.88) 1.20 (1.05-1.38)
Child morbidity associated with being both stunted and wasted53
Diarrhea incidence 1.72 (1.52-1.95)
ARI incidence 1.39 (1.23-1.58)
Child morbidity associated with zinc deficiency27
Diarrhea incidence 1.09 (1.01-1.18)
ARI incidence 1.25 (1.09-1.43)
To estimate the population attributable fraction associated with nutrition-specific indicators, the
following formula was used:
𝑃𝐴𝐹 = ∑ 𝑃𝑖
𝑛𝑖=1 (𝑅𝑅𝑖 − 1)
∑ 𝑃𝑖𝑛𝑖=1 (𝑅𝑅𝑖 − 1) + 1
Where RRi is the RR for exposure category I, Pi is the prevalence of the nutrition-specific indicator in the
population, and n is the number of exposure categories. We estimate the PAF for each age and sex
category where appropriate. For example, the PAF for mortality due to diarrheal disease was calculated
by age (0-5 months, 6-23 months, 24-59 months) because breastfeeding practices and infant age are
associated with diarrheal mortality.
To estimate the PAF for groups of risk factors, we used the following formula:3
𝑃𝐴𝐹 = 1 − ∏ (1 − 𝑃𝐴𝐹𝑟)𝑅𝑟=1
Where r refers to each individual risk factor and R is the total number of risk factors in the group. This
equation was used to estimate the PAF of diarrheal disease deaths among children under five and
neonatal mortality associated with maternal anemia and low birthweight. The cluster estimation
formula was used as multiple risk factors may be present in an individual that dies of one of these
causes, and estimating each individual PAF and summing them together would overestimate the burden
of death due to malnutrition.

15
The PAF gives us the proportion of deaths or incidence of disease attributable to each malnutrition
indicator in the risk group. By multiplying the PAF estimate by the total amount of disease specific
deaths and incidence of disease in the population, we estimate the number of deaths and incidents of
disease that is attributable to each nutrition-specific indicator.
Number of deaths attributed to indicator = PAF X Number of deaths per year in risk group
The formula for morbidity is similar, but it uses the number of illnesses rather than the number of
deaths in each risk group. The number of diarrheal disease and ARI were estimated using the DHS data.
The WHO Global Health Observatory data repository was used for the annual number of cause-specific
deaths in Myanmar in 2016.67
Some risks are associated with specific age groups within the 1-59-month age group. For example, risk of
diarrheal mortality associated with breastfeeding practices are different for children aged 1-5 months as
compared to those 6-23 months and 24-59 months. Because the diarrheal mortality rate was only
available for children 1-59 months and not for age sub-categories, we estimated the diarrheal mortality
rate for each age sub-category (1-5 months, 6-23 months, and 24-59 months) using the total number of
deaths in children 1-59 months due to diarrheal disease multiplied by the proportion of all-cause deaths
in each age sub-category as reported in the 2016 DHS. This may bias our estimates as the all-cause
mortality rate for children in each group may not correspond to the diarrhea mortality rate.
One uncertainty associated with estimating the PAF lies in applying the relative risk found in the
literature to our study population. For example, the risk of neonatal mortality associated with maternal
anemia found in the literature includes women of any anemia level (mild, moderate, and severe). If the
distribution of severity of anemia within that study population is different than that of the current study,
this may impact the PAF estimate. We will conduct a sensitivity analysis of the number of child deaths
attributable to maternal anemia by only including the prevalence of moderate and severe anemia
among pregnant women as compared to all forms of anemia.
Economic losses attributed to each nutrition-specific indicator
This economic burden of disease analysis will estimate the societal costs of malnutrition in Myanmar,
including the direct medical and nonmedical costs and indirect productivity costs. This study will
estimate both annual costs that are realized during the study year and future costs due to death and
permanent disability. The annual costs include direct medical costs and direct nonmedical costs
associated with illness, such as transportation and caretaking costs, and productivity losses due to adult
anemia. The future costs associated with death and permanent disability for children under five include
the lost lifetime earnings for children that die due to malnutrition and the reduction of lifetime earnings
due to cognitive losses associated with stunting. All future costs will be presented as net present values
(NPV), which means they will be discounted at 3% annually. Table 3 summarizes these costs, their
causes linked to malnutrition, and the time frame over which the costs will be estimated.

16
Table 3. Summary of costs included in study.
Cost category Malnutrition cause Costs Time period of costs
1. Annual direct medical cost
Child morbidity – diarrhea and ARI
In-patient and out-patient treatment costs
Study year
2. Annual direct non-medical cost
Child morbidity – diarrhea and ARI
Caretaking, transportation
Study year
3. Annual indirect productivity losses
Adult morbidity – iron deficiency anemia
Lost productivity due to iron deficiency anemia
Study year
4. Lost workforce Child mortality Lost productivity due to loss of future workers due to malnutrition
NPV of estimated lifetime earnings
5. Lost workforce due to lower future productivity
Child morbidity – stunting Lost productivity associated with stunting
NPV of estimated lifetime losses of earnings
The direct and indirect costs associated with malnutrition over a one-year period estimated in this study
use incidence-based estimates.17 The incidence of death, permanent disability, and illness attributable
to malnutrition were estimated using the PAF described above. We describe the direct and indirect cost
methods in greater detail below.
Direct costs include in-patient and out-patient costs to treat diarrhea and ARI that are the result of
malnutrition, and non-medical patient costs such as transportation and the cost of child care in the
event of an illness. This study will estimate direct costs by measuring the proportion of a disease that is
due to exposure to malnutrition and multiplying the total number of illnesses by the average treatment
cost.17 We will use cost estimates from the literature for the average treatment cost. The treatment rate
and number of child illnesses will be estimated using the 2016 DHS.
1. The average cost of treatment for diarrhea and ARI used in this analysis are $4.80 and $3.30
respectively.64 This study will use the following formula to measure the direct medical cost of illness
applied to diarrhea and ARI separately:
Annual direct cost of malnutrition = number of child illnesses attributable to malnutrition (as
determined by PAF) X treatment rate X average direct medical cost of treating illness
2. We estimate the annual direct non-medical costs associated with child illness due to transportation
and child care expenses. We assume that annual indirect costs associated with diarrheal disease and
ARI is 25% of the direct costs of treating these diseases, as found in several other studies in
Southeast Asia.64,68 We use the following formula to estimate the direct non-medical cost of illness
applied to diarrhea and ARI.
Annual indirect cost of malnutrition = number of child illnesses attributed to malnutrition X
treatment rate X average direct non-medical cost of malnutrition.
17
In incidence-based costing, mortality and permanent disability costs are calculated for all those who die
or become disabled during the study year.69 These are calculated as indirect costs, and include the value
of lost productivity due to malnutrition, both during the study year and in the future. This study will use
the human capital method to estimate indirect costs by measuring the lost production in terms of lost
earnings (future or current). This study will include three indirect costs: 1) the economic losses due to
depressed current productivity, 2) the net present value of future lost workforce due to child mortality,
and 3) the net present value of future lost productivity due to depressed future productivity.
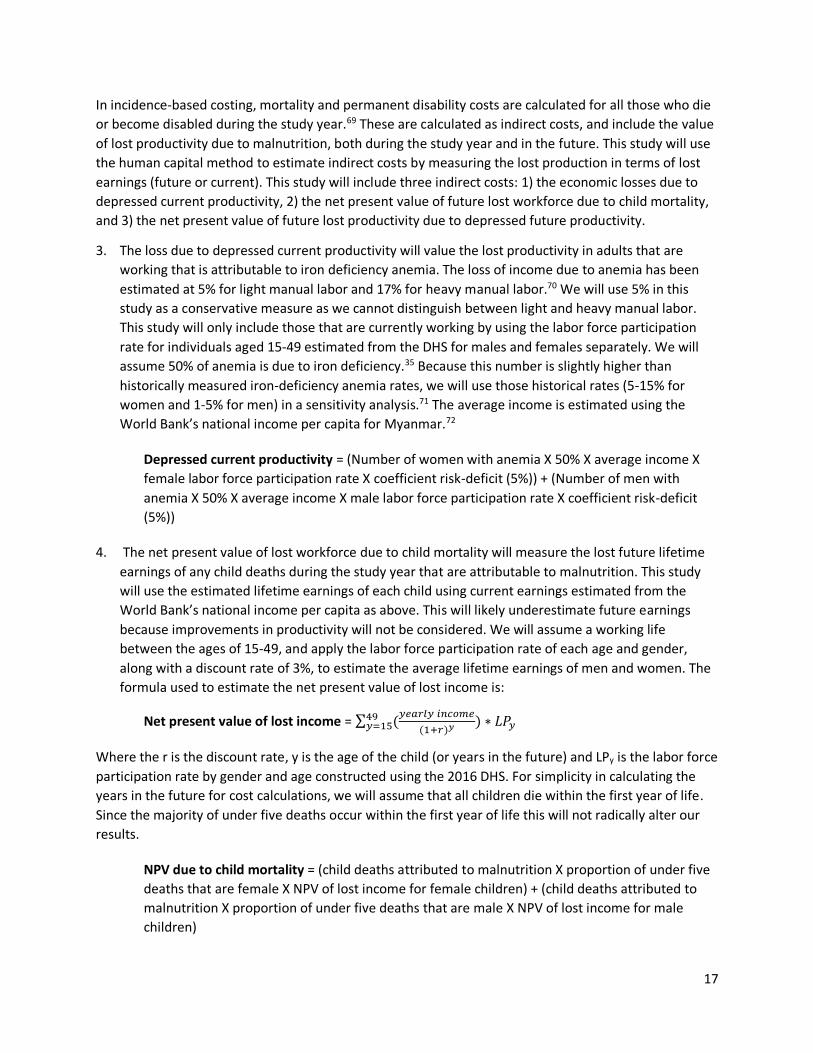
3. The loss due to depressed current productivity will value the lost productivity in adults that are
working that is attributable to iron deficiency anemia. The loss of income due to anemia has been
estimated at 5% for light manual labor and 17% for heavy manual labor.70 We will use 5% in this
study as a conservative measure as we cannot distinguish between light and heavy manual labor.
This study will only include those that are currently working by using the labor force participation
rate for individuals aged 15-49 estimated from the DHS for males and females separately. We will
assume 50% of anemia is due to iron deficiency.35 Because this number is slightly higher than
historically measured iron-deficiency anemia rates, we will use those historical rates (5-15% for
women and 1-5% for men) in a sensitivity analysis.71 The average income is estimated using the
World Bank’s national income per capita for Myanmar.72
Depressed current productivity = (Number of women with anemia X 50% X average income X
female labor force participation rate X coefficient risk-deficit (5%)) + (Number of men with
anemia X 50% X average income X male labor force participation rate X coefficient risk-deficit
(5%))
4. The net present value of lost workforce due to child mortality will measure the lost future lifetime
earnings of any child deaths during the study year that are attributable to malnutrition. This study
will use the estimated lifetime earnings of each child using current earnings estimated from the
World Bank’s national income per capita as above. This will likely underestimate future earnings
because improvements in productivity will not be considered. We will assume a working life
between the ages of 15-49, and apply the labor force participation rate of each age and gender,
along with a discount rate of 3%, to estimate the average lifetime earnings of men and women. The
formula used to estimate the net present value of lost income is:
Net present value of lost income = ∑ (𝑦𝑒𝑎𝑟𝑙𝑦 𝑖𝑛𝑐𝑜𝑚𝑒
(1+𝑟)𝑦49𝑦=15 ) ∗ 𝐿𝑃𝑦
Where the r is the discount rate, y is the age of the child (or years in the future) and LPy is the labor force
participation rate by gender and age constructed using the 2016 DHS. For simplicity in calculating the
years in the future for cost calculations, we will assume that all children die within the first year of life.
Since the majority of under five deaths occur within the first year of life this will not radically alter our
results.
NPV due to child mortality = (child deaths attributed to malnutrition X proportion of under five
deaths that are female X NPV of lost income for female children) + (child deaths attributed to
malnutrition X proportion of under five deaths that are male X NPV of lost income for male
children)

18
5. The net present value of loss due to depressed future productivity will value the reduction of
earnings due to the cognitive impact of malnutrition. This estimate considers losses in cognitive
function and subsequent earnings due to chronic malnutrition. This study will use an estimated
direct loss of earnings associated with stunting of 6.04% as a conservative estimate.73 Since
malnutrition has the biggest impact on child development within the first 1,000 days, we will
estimate the stunting prevalence using the number of children two years of age from the 2016 DHS
survey to represent the number of children who become stunted during the study year. We will use
a similar formula for calculating the NPV of lost earnings due to depressed future productivity as the
one we use for lost income for child mortality, but instead of using the entire value, we will multiply
it by the loss of earnings associated with stunting each year. Similar to the NPV of lost workforce
due to child mortality, this estimate will discount future earnings at 3%.
NPV of loss due to depressed future productivity = (Number of female children aged two that
are stunted X NPV of lost income for female children X coefficient risk-deficit (6.04%)) +
(Number of male children aged two that are stunted X NPV of lost income for male children X
coefficient risk-deficit (6.04%))
To estimate the total cost associated with malnutrition over the study period, we will add all of these
cost categories together. A sensitivity analysis will be conducted using a 7% discount rate. Intangible
costs, such as pain and suffering, grief, and mental anguish will not be included.
Results
Prevalence and incidence of malnutrition
The prevalence of nutrition-specific indicators estimated using the 2016 DHS are illustrated in Table 4,
including indicators for pregnant women, children under five, and non-pregnant women. To estimate
the total number of cases in the country, the nationally representative prevalence estimates were
multiplied by the total number of individuals in each age and gender group, reported from the United
Nations (UN) Population Division. The number of pregnant women was estimated using the crude birth
rate in Myanmar over the time period 2010-2015, also reported from the UN Population Division.

19
Table 4. Prevalence of nutrition-specific indicators and related outcomes in Myanmar from 2016 DHS.
Risk Group Nutrition indicator Prevalence Number of cases
Outcome
Pregnant women
(972,325)2
Low BMI (<18.5) 15.0% 145,849 Child morbidity
Anemia (<12.0 g/dl) 56.9% 553,253
Infant and maternal mortality
Severe anemia (<7.0 g/dl) 0.4% 3,889
Moderate anemia (7.0-9.9 g/dl)
27.7% 269,334
Mild anemia (10.0-11.9 g/dl)
28.9% 281,002
Children u5 (4.6 million)3
Low birth weight (<2500 g) 8.1% 78,758
Child mortality Low birth weight (2000- 2499 g)
5.6% 54,450
Very low birth weight (<2000 g)
2.7% 26,253
Wasted (WHZ<-2) 7.3% 332,369 Child mortality
Stunted (HAZ<-2) 29.0% 1,320,370 Child mortality and
development
Stunted and wasted 1.6% 72,848 Child mortality and
morbidity
Anemia (<12.0 g/dl) 44.8% 2,039,744
Growth, development, and productivity
Severe anemia (<7.0 g/dl) 0.5% 22,765
Moderate anemia (7.0-9.9 g/dl)
8.6% 391,558
Mild anemia (10.0-10.9 g/dl)
35.6% 1,620,868
Suboptimal breastfeeding* 23.8% 433,446
Child mortality and morbidity
Under 6 months not breastfed
1.8% 8,195
Under 6 months partial breastfed
47.8% 217,633
6-23 months not breastfed 15.4% 210,349
Adult women (14.3 million)
Anemia: women 46.5% 6,647,640 Productivity
* Suboptimal breastfeeding only refers to infants under two years old. It includes infants aged 0-5 months who are partially breastfed or not breastfed (mother no longer breastfeeds child) and those that are 6-23 months that are
2 Calculated using the crude birth rate of 18.7 per 1,000 population over the time period of 2010-2015. Retrieved from the United Nations Population Division: https://population.un.org/wpp/Download/Standard/Fertility/ 3 Population totals are 2015 reported estimates from the United Nations Population Division: https://population.un.org/wpp/Download/Standard/Population/
20
not breastfed at all. Partial breastfeeding refers to infants that are under 6 months of age and are breastfed but also given supplemental food.
Malnutrition indicators related to pregnant women captured in this survey include low BMI and anemia.
Low BMI has been associated with an almost two-fold risk of giving birth to low birthweight babies,
which in turn is associated with increased infant mortality.19 Pregnant women also suffer from anemia at
higher rates than non-pregnant women in Myanmar (57% as compared to 47%), perhaps due to the
increased nutritional needs of the growing fetus.
The largest number of cases of malnutrition in children under five is seen in rates of anemia and
stunting, which affect approximately 2 million and 1.3 million children respectively. Most children who
suffer from anemia only suffer from mild anemia (about 79% of anemia cases). While mild anemia is not
recognized as a direct cause of death, it may still increase the risk of mortality.74 Children in Myanmar
suffer from relatively high rates of stunting as defined as below -2 standard deviations from the
reference population – almost 30% overall. While the prevalence of stunting and wasting (in the same
child) is relatively rare – below 2% – this still represents over 70,000 children under five who are at
serious risk of dying from malnutrition.
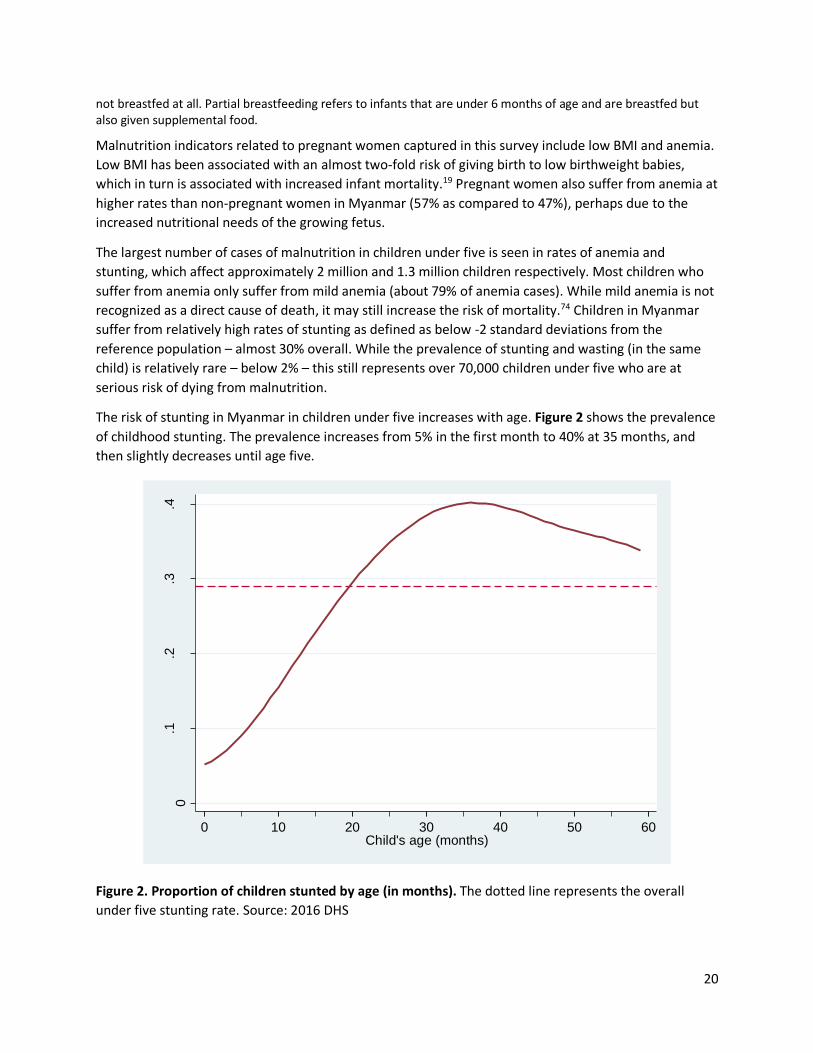
The risk of stunting in Myanmar in children under five increases with age. Figure 2 shows the prevalence
of childhood stunting. The prevalence increases from 5% in the first month to 40% at 35 months, and
then slightly decreases until age five.
Figure 2. Proportion of children stunted by age (in months). The dotted line represents the overall
under five stunting rate. Source: 2016 DHS
0.1
.2.3
.4
Pro
po
rtio
n s
tun
ted
0 10 20 30 40 50 60Child's age (months)
21
Appendix Table S2 shows the prevalence of stunting, wasting, and stunting and wasting combined,
calculated by z-score and including those that are not technically stunted or wasted but may still be
malnourished (those that have an HAZ or WHZ between -1 and -2). Including all children below -1
standard deviation in HAZ or WHZ, approximately 63% of children are malnourished as evidenced by low
HAZ and 33% are malnourished as evidenced by low WHZ. Almost 10% of children in Myanmar are at
least slightly stunted and slightly wasted. Those children at highest risk of mortality include those who
are severely stunted or wasted, as measured below -3 standard deviations in HAZ or WHZ. These include
about 8.2% who are severely stunted and 1.5% who are severely wasted.
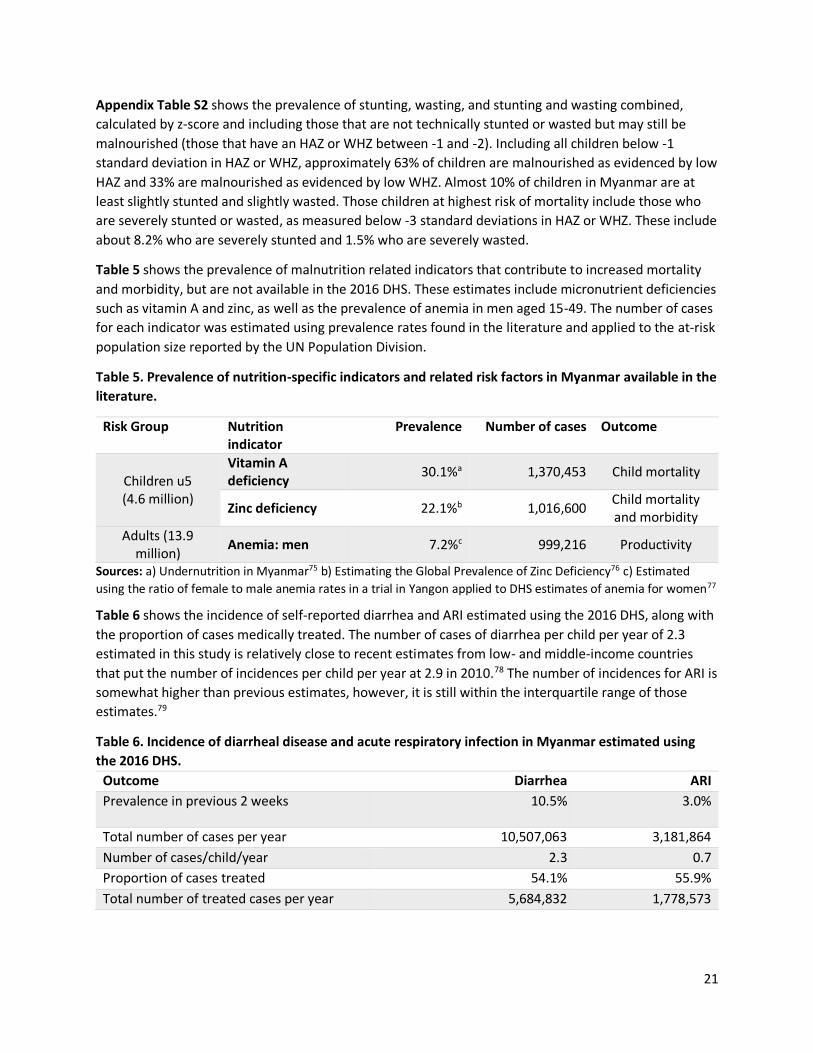
Table 5 shows the prevalence of malnutrition related indicators that contribute to increased mortality
and morbidity, but are not available in the 2016 DHS. These estimates include micronutrient deficiencies
such as vitamin A and zinc, as well as the prevalence of anemia in men aged 15-49. The number of cases
for each indicator was estimated using prevalence rates found in the literature and applied to the at-risk
population size reported by the UN Population Division.
Table 5. Prevalence of nutrition-specific indicators and related risk factors in Myanmar available in the
literature.
Risk Group Nutrition indicator
Prevalence Number of cases Outcome
Children u5 (4.6 million)
Vitamin A deficiency
30.1%a 1,370,453 Child mortality
Zinc deficiency 22.1%b 1,016,600 Child mortality and morbidity
Adults (13.9 million)
Anemia: men 7.2%c 999,216 Productivity
Sources: a) Undernutrition in Myanmar75 b) Estimating the Global Prevalence of Zinc Deficiency76 c) Estimated
using the ratio of female to male anemia rates in a trial in Yangon applied to DHS estimates of anemia for women77
Table 6 shows the incidence of self-reported diarrhea and ARI estimated using the 2016 DHS, along with
the proportion of cases medically treated. The number of cases of diarrhea per child per year of 2.3
estimated in this study is relatively close to recent estimates from low- and middle-income countries
that put the number of incidences per child per year at 2.9 in 2010.78 The number of incidences for ARI is
somewhat higher than previous estimates, however, it is still within the interquartile range of those
estimates.79
Table 6. Incidence of diarrheal disease and acute respiratory infection in Myanmar estimated using
the 2016 DHS.
Outcome Diarrhea ARI
Prevalence in previous 2 weeks 10.5% 3.0%
Total number of cases per year 10,507,063 3,181,864
Number of cases/child/year 2.3 0.7
Proportion of cases treated 54.1% 55.9%
Total number of treated cases per year 5,684,832 1,778,573

22
Population attributable fraction associated with nutrition-specific indicators
Table 7 shows the population attributable fraction (PAF) and number of deaths associated with our
selected malnutrition indicators in Myanmar. A total of 11,905 under five deaths per year can be
attributed to the malnutrition measured in this study, or about 25% of all under five deaths in Myanmar.
Almost half (47.8%) of under five deaths in Myanmar occur during the neonatal period (within the first
month of life). Most deaths found in this study to be attributable to malnutrition, due to maternal
anemia and low birthweight, also occur during this period. These two maternal nutrition factors
contribute to over 24.8% of all neonatal deaths – a total of 5,701 deaths per year.
The cause of death that contributes to the most deaths between the age of 1-59 months in Myanmar is
ARI. This study estimates that 38.7% of deaths from ARI are attributable to malnutrition – 2,690 deaths
per year. Over half (63.7%) of all deaths due to diarrhea in Myanmar between the ages of 1-59 months
can be attributed to malnutrition. The proportion of deaths from diarrhea attributable to malnutrition is
highest among the youngest age group and decreases as the age increases. Among maternal deaths,
19.0% can be attributed to vitamin A deficiency, the only indicator associated with maternal mortality
captured in this study.

23
Table 7. Population attributable fraction and number of deaths attributable to malnutrition in Myanmar.
Outcome Population Risk factor Incident
casesa PAFb
Number attributed to malnutrition
Estimate 95% CI
Maternal mortality Pregnant women Vitamin A deficiency 1,700 0.190 323 (92-575)
Neonatal mortality Neonatal infants Maternal anemia, BMI
23,000 0.248 5,701 (3,127-8,387)
Post neonatal mortality
Post neonatal infants LBW 14,470 0.074 1,064 (443-1,850)
Child mortality due to ARI
Children 1-59 months
Stunting
6,952
0.226 1,574 (729-2,510)
Wasting 0.161 1,118 (583-1,782)
Infant mortality due to diarrhea
Children 1-5 months
Suboptimal breastfeeding, Stunting, Wasting, Vitamin A deficiency, Zinc deficiency
2,131 0.729 1,554 (836-1,940)
Infant mortality due to diarrhea
Children 6-23 months
Suboptimal breastfeeding, Stunting, Wasting, Vitamin A deficiency, Zinc deficiency
1,045 0.553 578 (293-798)
Child mortality due to diarrhea
Children 24-59 months
Stunting, Wasting, Vitamin A deficiency, Zinc deficiency
669 0.472 316 (177-434)
Child mortality due to measles
Children 1-59 months
Vitamin A deficiency 15 0.073 1 (-1-3)
Total deaths attributable to malnutrition 12,228 (6,279-18,278)
a. Source: WHO Global Health Observatory data repository and 2016 DHS. The age and cause specific mortality rates are reported for neonatal
infants, post neonatal infants, and children 1-59 months old. To estimate the infant mortality due to diarrhea by age group (1-5 months, 6-23

24
months, and 24-59 months), we multiplied the total number of deaths due to diarrheal disease in children 1-59 months by the all-cause
mortality rates per each age group as reported in the 2016 DHS.
b. Source: Calculated by authors as described in methods.
Table 8. Population attributable fraction and number of illnesses attributable to malnutrition in Myanmar.
Outcome Population Risk Incident casesa PAFa
Number attributed to malnutrition
Estimate 95% CI
LBW Neonatal infants Maternal anemia, maternal BMI
78,758 0.316 17,171 (7,684-26,078)
ARI incidence Children 1-59 months Stunted and wasted 3,157,681 0.006 19,582 (11,578-29,034)
Diarrhea incidence
Children 1-5 months
Suboptimal breastfeeding, stunted and wasted, zinc deficiency
619,918 0.372 230,827 (62,144-391,105)
Children 6-23 months
Suboptimal breastfeeding, stunted and wasted, zinc deficiency
4,924,624 0.080 392,538 (163,932-638,633)
Children 24-59 months Stunted and wasted, zinc deficiency
4,928,583 0.051 253,153 (127,377-388,128)
Total diarrhea incidence under 5 years 10,473,125 0.084 876,518 (353,453-1,417,866)
a. Source: Calculated by author as described in methods.
Table 8 shows the total estimated PAF attributable to malnutrition and number of incidences per year for low birthweight, ARI, and diarrheal
disease. For overall number of incidences, malnutrition has the largest impact on diarrheal disease, with approximately 877,000 incidences of
diarrhea (8.4% of all cases) being attributable to malnutrition each year. The overall number and proportion of ARI cases that can be attributed
to malnutrition is relatively low – about 20,000 cases or 0.6% of all cases. Finally, approximately 30% of all low birthweight cases can be
attributed to maternal anemia and maternal BMI.

25
Economic losses attributed to malnutrition
Table S3 in the appendix shows the cost components for the direct costs associated with childhood
diarrhea and ARI. The treatment rate was just over half for each disease (54.1% for diarrhea and 55.9%
for ARI). The average cost per treatment was not available in the DHS – we instead use estimates from
previous studies, which estimate the cost of treatment in Myanmar of $4.80 for diarrhea and $3.30 for
ARI. The treatment costs were estimated using average costs for inpatient and outpatient treatment,
and are much lower than other countries in Southeast Asia, which range between $5.30 for ARI
treatment in Cambodia to $22.50 per diarrhea treatment in Indonesia.64
Table 10 shows the cost components for indirect costs associated with adult productivity, child
mortality, and permanent child disability due to stunting. The differences in male and female NPV for
lifetime earnings and earnings lost due to stunting is due to the lower female labor force participation
rate calculated from the 2016 DHS. We calculated a labor force participation rate of 66.5% for women
between the ages of 15-49 and a participation rate of 90.6% for men of the same age. For estimating the
lost income for all cost categories, we use an annual income of $1,093, estimated using the reported
annual per capita GDP from the World Bank. For assumptions used in estimating indirect costs see Table
S4 in the Appendix.
Table 10. Indirect cost variables associated with adult productivity, child mortality, and permanent
child disability.
Cost Variable Cost outcome Estimate Source
Current lost productivity per employed person per year due to iron deficiency anemia
ID anemia $55 WB Open Data
Lifetime earnings (NPV)
Future lost workforce: female $10,082 2016 DHS, WB Open Data Future lost workforce: male $13,771
Earnings lost due to stunting (NPV)
Future lost earnings: female $645 2016 DHS, WB Open Data Future lost earnings: male $881
A total of $507 million USD, or 0.80% of GDP, is lost due to malnutrition in Myanmar every year. Table
11 shows the yearly loss by type of economic loss. Approximately $148 million USD (28% of all costs)
occur during the study year in the form of direct treatment costs, indirect patient costs, and lost
productivity due to iron-deficiency anemia. The remaining 72% of costs ($358 million USD) are lost
future lifetime earnings due to child mortality and stunting. Future lost productivity associated with
stunting is the largest overall contributor to the cost of malnutrition, due to its relatively large cost per
incidence, estimated at almost $645-$881 USD lower income over the life of an individual, and the large
number of incidents per year.

26
Table 11. Economic losses attributed to malnutrition.
Economic costs Cause Number of incidents attributable to malnutrition
Yearly loss
Annual direct medical costs
Diarrhea incidence 876,518 $2,276,142
ARI incidence 19,582 $36,123
Annual direct non-medical costs
Diarrhea incidence 876,518 $569,035
ARI incidence 19,582 $9,031
Current lost productivity ID Anemia: women 3,324,750 $120,828,896
ID Anemia: men 500,400 $24,776,255
Future lost workforce Under five mortality 11,905 $145,678,646
Future lost productivity Stunting 278,744 $212,639,256
Total costs $506,813,384
The patient cost (including direct medical and indirect costs) of treating diarrhea and ARI associated with
malnutrition is approximately $2.89 million USD per year. The majority of this (98%) is associated with
treating diarrheal diseases. The majority (81%) of the current annual costs (excluding NPV of lost future
earnings) associated with malnutrition are due to lost productivity from women suffering from iron-
deficiency anemia. This is driven by the large number of women who suffer from anemia and the
relatively high cost associated with this – almost $55 USD per year.
For long-term costs of lost productivity due to child mortality or permanent disability, both contribute a
substantial amount to the overall costs. Under five mortality accounts for about 45% of the future lost
productivity (and approximately 29% of overall costs) while stunting accounts for the other 55% of
future lost productivity and almost 42% of the overall costs.
Table 12 shows the results of the sensitivity analysis for iron deficiency anemia among men and women
using the estimate of iron deficiency anemia from a previous study published in 1972.71 The range of
iron deficiency anemia from that study for women (5-15%) was lower than the current study estimates
(23.8%), however, the range for men in the current study (3.6%) is within the range from the earlier
study (1-5%).

27
Table 12. Sensitivity analysis of the burden and economic consequences of iron deficiency anemia
using historic rates of iron deficiency anemia. The current (main) analysis assumes that 50% of anemia
is associated with iron deficiency.
Type of analysis
Rate of IDA
Number of incidents
Yearly cost Percent of
overall cost
ID Anemia: women
Main analysis 23.3% 3,324,750 $120,828,896 23.8%
Sensitivity analysis (low)
5.0% 715,000 $25,984,709 6.3%
Sensitivity analysis (high)
15.0% 2,145,000 $77,954,126 16.8%
ID Anemia: men
Main analysis 3.6% 500,400 $24,776,255 4.9%
Sensitivity analysis (low)
1.0% 139,000 $6,882,293 1.4%
Sensitivity analysis (high)
5.0% 695,000 $34,411,466 6.7%
Discussion
Children in Myanmar have a relatively high risk of dying before five years of age. This analysis showed
that almost 25% of these deaths were attributed to malnutrition due to maternal BMI or anemia, or
childhood malnutrition defined by wasting, stunting, or micronutrient deficiencies. The largest overall
correlate of child mortality is maternal anemia followed by maternal BMI. This supports evidence
suggesting that maternal nutritional status is one of the most important factors in child health and
survival. Among child health indicators in Myanmar, stunting associated with ARI accounted for the
largest proportion of all-cause child mortality. Wasting associated with ARI, post-neonatal mortality
associated with low birthweight, suboptimal breastfeeding among infants aged <5 months, and
diarrheal mortality associated with stunting all substantially contributed to under five mortality.
Our estimates report a GDP loss of 0.80% (95% CI, 0.63-0.98%) due to malnutrition. This is relatively low
compared to cost of malnutrition studies from other countries. A similar study in Cambodia reported
malnutrition-associated economic losses at approximately $266 million USD, or about 1.7% of the
Cambodian GDP.19 That study attributed a high proportion of the costs ($57 million USD) to iodine
deficiency, which may account for some of the differences as we did not capture that in the current
study. The authors of the Cambodia study also included a higher reduction in lifetime earnings due to
stunting – 5% for light manual labor (similar to the current study) and 17% for heavy manual labor,
assuming 15% of labor is heavy.
An important contribution to the cost of illness literature is a benefit-cost analysis of stunting by
Hoddinott et al.7 That study estimates a median benefit-cost ratio of stunting investments in 17 low-
income countries of 18:1, and a benefit-cost ratio for Myanmar of 17.2:1 - 17.7:1. While they do not
estimate an overall cost of stunting in Myanmar, the authors estimate a per capita increase in income of
11.3% associated with each case of stunting that is averted. This is substantially higher than our own
assumption of 6%. Using a loss of income of 11.3% in the current study would have resulted in an NPV of

28
stunting losses totaling $375.4 million USD as compared to our result of $212.6 million USD, and an
overall cost of malnutrition of $669.6 million USD (1.06% of GDP).
A study on the cost of hunger in Malawi carried out by the World Food Program (WFP) and other
organizations estimates an overall cost of hunger in that country that is much higher than our study –
almost $600 million USD, or 10.3% of the GDP.80 The Malawi study estimates approximately 23% of all
child deaths from 2008-2012 were attributable to malnutrition, a number similar to the current study
(24.7%). However, that report included both current costs (related to malnutrition that occurs during
the study year) as well as retrospective costs – malnutrition that occurred before the study year, such as
the cost of lost productivity on adults due to childhood malnutrition. Therefore, that study includes the
cost of malnutrition related indicators, such as underweight, for all segments of the population aged 0-
64 years, whereas the current study only includes estimates using the incidence of stunting and wasting
for children under five. Additionally, the Malawi study attributes a larger proportion of diarrhea and ARI
incidences to malnutrition. They attribute 38% of diarrheal incidents and 3% of ARI incidents to
malnutrition as compared to 8.4% and 0.6% for diarrhea and ARI respectively in the current study. These
differences are likely due to alternative interpretations of the epidemiological data.
The proportion of under five deaths attributable to malnutrition in this study (24.7%) is substantially
lower than the often-cited figure of 45% of under five deaths that are nutrition related.81 There may be
several reasons for this. First, the figure of 45% comes from several early papers on the subject that
were published in the 1990s. The world has made significant progress on improving malnutrition since
that time, although there is still much more work to do. Second, one of those papers uses weight-for-
age as a risk factor for all-cause mortality,82 whereas in the current study we use height-for-age and
weight-for-height as a risk factor for cause-specific mortality. The reason we chose these measures was
that it is difficult to disentangle the effects of other health aspects, such as enteric disease, on mortality,
that are associated with anthropometric measurements and related to poverty. The chosen measures in
the current study represent the best evidence to date on the impacts of malnutrition on mortality.
Finally, the current study did not include all aspects of malnutrition, such as other micronutrient
deficiencies or children that may die directly from malnutrition, due to data limitations.
The direct medical costs associated with malnutrition in this study are relatively low – only about $2.9
million USD per year. This is slightly lower than an estimate from Walters et al. that put the direct cost of
not breastfeeding in Myanmar at $3.38 million USD.64 However, that study attributed about 70% of the
deaths from inadequate breastfeeding to ARI, while the present study did not include a link between ARI
and suboptimal breastfeeding. Multiple reviews report an association between suboptimal
breastfeeding and increased mortality and morbidity from ARI, but the reported 95% confidence
intervals for the relative risks include one.59,83 While the current study recognizes that there may be a
causal link between suboptimal breastfeeding and an increased risk of ARI, we chose to omit this from
our analysis due to the lack of robust epidemiological evidence. An additional factor that contributes to
the low direct medical costs are the relatively low costs of treatment for diarrhea and ARI as compared
to their neighbors in Southeast Asia. Whereas Myanmar averaged $4.80 per diarrhea treatment and
$3.30 per ARI treatment, most other countries had treatment costs in the range of $13 – $19 USD.Error!
Bookmark not defined.
There were an abnormally low number of measles deaths reported in children under five in Myanmar in
the study year (2016). Because of this, measles mortality associated with vitamin A deficiency

29
contributed very little to our final analysis; only one death of the fifteen measles deaths in children
under five in Myanmar in 2016 were attributed to vitamin A deficiency. In 2015 there were 372 measles
deaths under five and in 2017 there were 489. In a normal year (using the 10-year average of measles
deaths under five in Myanmar of 780),4 we would have attributed 57 measles deaths to vitamin A
deficiency. An additional note regarding measles mortality due to vitamin A deficiency is that this was
the only relative risk included in the present study which included one in the 95% confidence interval
(RR=1.26; 95% CI: 0.84-1.87). However, vitamin A deficiency is recognized as a cause of measles by the
WHO, and supplementation is recommended for all children in populations at risk of vitamin A
deficiency.84 Because the measles mortality rate was so low during the study year, this did not
substantially impact our results.
One potential confounder with respect to the impact of vitamin A deficiency, and other micronutrient
deficiencies, on increasing infectious disease risk is the fact that supplementation trials often include
individuals that are not deficient as well as those that are deficient in the micronutrient. The
supplementation may have no effect on individuals that are not deficient, masking the impact of
micronutrient deficiencies on the outcome of interest within micronutrient deficient populations.
Multiple studies support this and report that supplementation reduces negative health impacts
significantly for malnourished populations, but the evidence for the general population is less clear.85,86
Studies, including trials, that do not consider the nutritional status of the population may not be able to
disentangle the impacts of micronutrient supplementation on healthy vs. malnourished populations.
Importantly, this study found malnutrition plays a key role in under five deaths in Myanmar. This
includes about 25% of all neonatal deaths, and approximately 48% of all under five deaths due to
diarrheal disease and ARI. Additionally, about 875,000 cases of diarrhea (8.4% of all cases) per year
could be averted if malnutrition was eliminated in Myanmar. Considering adult nutritional status,
anemia impacts a large number of women in Myanmar – over 6.5 million women between 15-49 years
of age – and iron deficiency may be a large contributor to this. The potential productivity losses due to
this are large – more than $120 million per year. Beyond reduced wages and lower productivity in the
labor force, this may have a huge impact on women’s productivity in other aspects of their lives, such as
child rearing and education.
This study did not include the economic impact of malnutrition on chronic diseases. Malnutrition has
been associated with many chronic diseases such as inflammatory bowel disease (IBD), chronic kidney
disease, lung and liver disease, and cancers.87 While chronic diseases, if they had been included, may
have contributed relatively little to this analysis due to discounting, they may play a larger role in
Myanmar as the country experiences the nutrition transition, characterized by a shift from energy-poor
and plant-based diets to processed food that is high in fat and sugar, and an increase in chronic
diseases.88 This transition results in high rates of both under- and over-nutrition in the same population,
and, sometimes, in the same person. Studies have shown that children who are malnourished and
stunted are more likely to become overweight as adolescents and adults.88 Myanmar is currently one of
the 23 countries that account for around 80% of the total mortality due to chronic diseases in
4 Calculated using the reported under five deaths due to measles from the WHO Global Health Observatory data repository retrieved from: http://apps.who.int/gho/data/view.main.ghe1002015-CH3?lang=en

30
developing countries.89 As it undergoes increasing income and the nutrition transition, malnutrition may
play a larger role in chronic diseases and their impact on the economy.
Since the majority of costs attributable to malnutrition in this study are future costs associated with
death and permanent disability of children under five, the discount rate plays a large role in estimating
the total costs. Using a discount rate of 7% as a sensitivity analysis, we find the yearly overall cost of
malnutrition drops about 50% to $278.5 million USD (Appendix Table S6). The rate of 3% used by this
study is recommended by the World Bank,90 however, more recent studies have proposed an even
lower discount rate.91
The rate of anemia caused by malnutrition, specifically iron deficiency, in Myanmar is uncertain. We
assume 50% of anemia is caused by iron deficiency, consistent with other recent studies. Some meta
analyses have used a rate as high as 60% for P. falciparum non-endemic regions,59 however, the
measured contribution of iron deficiency to anemia has been shown to vary dramatically from country
to country.35 There are no recent estimates of the contribution of iron deficiency to anemia in Myanmar,
but a study from 1972 reports rates somewhat lower for women, but consistent for men, than those
used in the current study.43 Using the rates of iron deficiency anemia (IDA) reported in that study, Table
12 and Table S7 in the appendix shows the results of a sensitivity analysis. The current study uses a
prevalence of IDA among women of 23.3% and 3.6% among men. The lower bound (from the previous
study) of a 5% prevalence of IDA among women and a 1% prevalence of IDA among men results in an
estimate of 854,000 cases of IDA among adults in Myanmar, costing $32.9 million in lost productivity.
Using an upper bound of 15% IDA among women and 5% among men, we estimate 2,840,000 cases if
IDA, costing $112.4 million annually. These are both somewhat lower than the estimates from this study
of 3,825,150 cases of IDA among adults resulting in $145.6 million in lost productivity per year.
Additionally, due to the uncertainty in the role of the severity of anemia on the impact of neonatal
mortality, we performed a sensitivity analysis using only the prevalence of moderate or severe anemia
among pregnant women on the impact of neonatal mortality. Using the 2016 DHS data, we estimate a
prevalence of 31.1% of moderate or severe (27.7% moderate and 0.4% severe) anemia, as compared to
56.9% of pregnant women with any anemia. This analysis resulted in attributing 20.4% of neonatal
deaths to maternal anemia and low maternal BMI when using only moderate and severe anemia as
compared to 24.8% when including all anemia. The difference in neonatal deaths attributed to
malnutrition was 4,685 deaths in the sensitivity analysis compared to 5,701 in our main analysis.
Limitations
There are several limitations to the estimation of the burden of disease in this study. First, there are
some limitations to the evidence on the impact of malnutrition on several key health outcomes. For
example, the impact of stunting and wasting on ARI incidence is so far inconclusive. While previous
studies have shown a slightly increased risk of ARI associated with both stunting and wasting, the
relative risk 95% confidence interval included one.52 Although there may be a causal relationship
between increased risk of ARI incidence and malnutrition, we chose to omit it from this analysis due to a
lack of epidemiological evidence. Second, there are some limitations in the data for malnutrition related
indicators in Myanmar. For example, there are no recent studies that estimate the prevalence of zinc
deficiency in the population, and therefore the present study used the worldwide zinc deficiency
estimate. This highlights the need for increased surveillance of malnutrition related indicators.

31
Third, this study does not directly measure most malnutrition indicators, rather it uses proxy
measurements, such as stunting, to represent the prevalence of malnutrition in Myanmar. While
anthropometric deficits, such as stunting and wasting, do not directly cause increased mortality and
disability,92 they are good indicators of chronic and acute malnutrition. Additionally, there are some
other data limitations, particularly related to micronutrient deficiencies including zinc, vitamin A, and
iron. More research should be undertaken to establish baselines of micronutrient deficiencies in
Myanmar, and in determining the role of iron deficiency in anemia in the country. We attempted to
mitigate the limitations associated with a lack of data on the role of iron deficiency in anemia by carrying
out a sensitivity analysis using previous studies.
Fourth, much of the evidence related to risks associated with malnutrition comes from observational
studies, which includes a risk of residual confounding. Some risks can be better estimated using
controlled interventions, such as that of micronutrient deficiencies, however, others, such as the impact
of stunting or wasting on mortality, cannot be ethically or feasibly carried out using controlled
experiments. We used relative risk estimates that were adjusted for confounding whenever possible,
but residual confounding cannot be definitively ruled out in any case.
Fifth, the evidence of the risk of poor health outcomes due to malnutrition was sometimes not
disaggregated to the extent of the prevalence data. For example, we estimate neonatal mortality
associated with maternal anemia using any pregnant woman with anemia, without differentiating
between the risk of neonatal mortality from severe anemia as compared to that of mild anemia. While
the relative risk used in our study included pregnant women with any anemia, including mild, the
distribution of severity of anemia within the study population in which the relative risk was estimated
may differ from the population in this study. This could potentially impact our estimates of the number
of deaths due to anemia and the costs associated with those deaths.
As far as limitations in the costing analysis, the current study uses the human capital approach, which
values a person’s productivity in terms of market earnings. This approach tends to undervalue the lives
of children, which is a major component of this study, due to future discounting and the long time
period between death or disability and potential earnings.93 This approach also tends to undervalue
conditions that are more common among low income individuals.94 We have tried to mitigate the
unequal value of labor within Myanmar by using the national per capita GDP, however, this does not
take into account the international disparities in income and the resulting disparities in the value of a
human life.
Because of this limitation, the current study undervalues women’s contribution to overall earnings and
GDP. We use the labor force participation rate as an input in both current and future lost productivity,
the yearly costs per person associated with female mortality and morbidity is lower than that of the
yearly cost per person associated with male mortality and morbidity. This more accurately estimates the
lost earnings of individuals participating in the labor market, however, it ignores the contributions of
unpaid labor that is disproportionately carried out by women. This is especially important for costing in
LMICs, where the formal labor market comprises a relatively smaller proportion of the overall
production. Estimates of the contribution of unpaid labor to overall production range from 20%-60% of
GDP.95
There are also several limitations inherent in cost of illness studies, and it is important to consider these
limitations when interpreting the results. First, due to the differences in data and methods across

32
studies, COI studies are not comparable. Additionally, there are many assumptions that must be made in
order to value the cost of a death or permanent disability. For this study, we use the current per capita
GDP income, however, we have no way of knowing what future productivity and income will look like in
Myanmar. For these reasons, the estimates presented in this paper should not be directly compared to
estimates of the cost of illness in other countries. A second critique of COI studies is that the costs
associated with diseases are often double counted.94 We have attempted to alleviate this concern by
only costing the deaths and disability that we associated with malnutrition, rather than including
secondary diagnoses claims.
A third criticism of COI studies relates to the fact that the estimates do not include the cost of
interventions to mitigate the impact of disease, so only a completely effective and free intervention
would avert the losses estimated in the study.94 However, COI studies – specifically incidence-based
studies – are a necessary component to cost-effectiveness studies in setting an upper limit to the
resources that could be saved if the risk were fully removed. Despite all of these limitations, COI studies
that are explicit in their methodology and the assumptions used are a valuable tool for decision makers
in allocating scarce resources for public good. The alternative, in this case, is to ignore the economic
impact associated with malnutrition.
Finally, attaching a monetary value to measures of malnutrition depends on multiple assumptions and
could be carried out in many different ways. Because of this, we chose conservative estimates to include
in the model and chose not to include productivity gains, even though it would be fair to assume that
children in Myanmar will be more productive than their parent’s generation. We also did not include any
benefits of improved nutrition outside of expected income, although nutrition would also improve
production in unpaid labor, education, and other activities. Because of these reasons, we view these
estimates as conservative.
Conclusion
The results of this study may help guide policy discussions for investing in nutrition-specific and
nutrition-related programs in Myanmar. Other studies have shown the potential benefits of addressing
malnutrition; for example, one study reports that investing in stunting reduction in Myanmar would
have a benefit-cost ratio of around 17, meaning there would be returns of $17 for every $1 spent on
stunting reduction.96 That study did not include the costs associated with child mortality from
malnutrition. The present study may also be useful for decision makers considering introducing and/or
scaling up nutrition interventions. While we do not include any analysis of costs or benefits from scaling
up nutrition interventions, we hope that this work may contribute to estimating the returns to
investment in future studies.
We estimate the annual economic losses due to 12 key malnutrition indicators in Myanmar to be
approximately $507 million USD. More importantly, over 12,000 deaths, including 323 maternal deaths
and approximately 11,900 under five deaths can be attributed to malnutrition each year in the country.
Although there are no easy fixes to this problem, increased investment in nutrition may yield net
positive economic returns, in addition to improved quality of life. The government of Myanmar should
take this into account when developing future nutrition-specific and nutrition-sensitive programs.

33
Appendix
Table S1. Counterfactual for relative risks
Nutrition indicator Outcome Risk category Counterfactual
Maternal anemia Neonatal mortality Blood hemoglobin <110 g/L
Blood hemoglobin > 110 g/L
Maternal vitamin A deficiency
Maternal mortality Not receiving vitamin A supplements
Receiving vitamin A supplements
Low birthweight Child mortality <2500 g at birth >2500 g at birth
Stunted Child mortality <-1 SD compared to WHO standard
>-1 SD compared to WHO standard
Wasted Child mortality <-1 SD compared to WHO standard
>-1 SD compared to WHO standard
Stunted & wasted Child morbidity and mortality
<-2 SD compared to WHO standard
>-2 SD compared to WHO standard
Suboptimal breastfeeding
Not breastfed (0-5 months)
Child morbidity and mortality
Not breastfed at age <6 months
Exclusively breastfed until age 6 months
Partially breastfed (0-5 months)
Child morbidity and mortality
Received supplemental food at age <6 months
Exclusively breastfed until age 6 months
Not breastfed (6-23 months)
Child morbidity and mortality
Not breastfed at age 6-23 months
Breastfed at age 6-23 months
Child vitamin A deficiency
Child mortality Serum retinol <0.70 µmol/L
Serum retinol >0.70 µmol/L
Child zinc deficiency Child morbidity and mortality
Not receiving zinc supplements
Receiving zinc supplements
Table S2. Prevalence of stunting, wasting, and combined stunting and wasting by z-score.
Nutrition indicator Prevalence Cases
Stunted (low HAZ)
<-3SD 8.22% 374,257
-3 SD to -2 SD 21.08% 959,772
-2 SD to -1 SD 33.83% 1,540,280
Total 63.13% 2,874,309
Wasted (low WHZ)
<-3SD 1.46% 66,474
-3 SD to -2 SD 5.94% 270,448
-2 SD to -1 SD 25.10% 1,142,803
Total 32.50% 1,479,725
Stunted and wasted
<-3SD 0.03% 1,589

34
-3 SD to -2 SD 1.04% 47,351
-2 SD to -1 SD 8.60% 391,558
Total 9.67% 440,498
Table S3. Direct cost variables associated with child illness.
Cost Variable Illness Estimate Source
Treatment rate Diarrhea 54.1%
2016 DHS ARI 55.9%
Average direct medical cost of treating illness
Diarrhea $4.80 Walters et al., 201664
ARI $3.30
Average direct non-medical cost of treating illness
Diarrhea $1.20 Walters et al., 2016
ARI $0.83
Table S4. Assumptions for indirect costs
Cost Variable Cost outcome Estimate Source
Labor force participation rate (age 15-49)
ID Anemia: women 66.5% 2016 DHS
ID Anemia: men 90.6%
Annual income (GDP per capita) Current lost productivity, future lost workforce, future lost productivity
$1,093 WB Open Data
Under five mortality proportion by gender
Male 58.39% 2016 DHS
Female 41.61%

35
Table S5. Cost estimates including 95% confidence intervals for number of incidents per year.
Cost category Cause
Number of incidents attributable to malnutrition Yearly cost
Estimate 95% CI Low 95% CI high Estimate 95% CI Low 95% CI high
Annual direct medical costs
Diarrhea incidence 876,518 353,453 1,417,866 $2,276,142 $917,848 $3,681,915
ARI incidence 19,582 11,578 29,034 $36,123 $21,357 $53,559
Annual indirect costs
Diarrhea incidence 876,518 353,453 1,417,866 $569,035 $229,462 $920,479
ARI incidence 19,582 11,578 29,034 $9,031 $5,339 $13,390
Current lost productivity
ID Anemia: female 3,324,750 3,224,650 3,432,000 $120,828,896 $117,191,036 $124,726,602
ID Anemia: male 500,400 486,500 514,300 $24,776,255 $24,088,026 $25,464,484
Future lost workforce
Under five mortality: female
4,954 2,574 7,366 $49,947,029 $25,957,351 $74,272,344
Under five mortality: male
6,951 3,613 10,337 $95,731,617 $49,751,492 $142,355,046
Future lost productivity
Stunting male 138,785 116,506 161,065 $122,323,536 $102,687,076 $141,960,877
Stunting female 139,959 117,512 162,402 $90,315,720 $75,830,642 $104,798,216
Total costs $506,813,384 $396,679,631 $618,246,912
Percent of GDP 0.80% 0.63% 0.98%

36
Table S6. Economic losses attributed to malnutrition sensitivity analysis using a 7% discount rate for
future costs.
Cost category Cause Number of incidents attributable to malnutrition
Yearly loss
Annual direct medical costs
Diarrhea incidence 876,518 $2,276,142
ARI incidence 19,582 $36,123
Annual direct non-medical costs
Diarrhea incidence 876,518 $569,035
ARI incidence 19,582 $9,031
Current lost productivity ID Anemia: women 3,324,750 $120,828,896
ID Anemia: men 500,400 $24,776,255
Future lost workforce Under five mortality 13,791 $57,493,885
Future lost productivity Stunting 278,744 $72,467,070
Total costs $278,456,437
Table S7. Sensitivity analysis of costs associated with iron deficiency anemia (IDA) using historic levels
of IDA.
Rate of IDA
(lower) Number of
incidents Yearly cost
(lower est.) Rate of IDA
(upper) Number of
incidents Yearly cost
(upper est.)
Women 5% 715,000 $25,984,709 15% 2,145,000 $77,954,126
Men 1% 139,000 $6,882,293 5% 695,000 $34,411,466
Total 854,000 $32,867,002 2,840,000 $112,365,592

37
References
1 Achadi, E., Ahuja, A., Bendech, M. A., Bhutta, Z. A., De-Regil, L. M., Fanzo, J., ... & Kimani, E. (2016). Global Nutrition Report: From Promise to Impact: Ending Malnutrition by 2030. International Food Policy Research Institute.
2 Fanzo, J., Hawkes, C., Udomkesmalee, E., Afshin, A., Allemandi, L., Assery, O., ... & Corvalan, C. (2018). 2018 Global Nutrition Report: Shining a light to spur action on nutrition.
3 Lim, S. S., Vos, T., Flaxman, A. D., Danaei, G., Shibuya, K., Adair-Rohani, H., ... & Aryee, M. (2012). A comparative risk assessment of burden of disease and injury attributable to 67 risk factors and risk factor clusters in 21 regions, 1990–2010: a systematic analysis for the Global Burden of Disease Study 2010. The lancet, 380(9859), 2224-2260.
4 Martínez, R., & Fernández, A. (2007). Model for analysing the social and economic impact of child undernutrition in Latin America. ECLAC.
5 Win, A. Z. (2016). Micronutrient deficiencies in early childhood can lower a country's GDP: The Myanmar example. Nutrition, 32(1), 138-140.
6 Myanmar. (September 15, 2017). Retrieved June 2, 2019, from http://www.healthdata.org/myanmar
7 Hoddinott, J., Alderman, H., Behrman, J. R., Haddad, L., & Horton, S. (2013). The economic rationale for investing in stunting reduction. Maternal & child nutrition, 9, 69-82.
8 Uauy, R., Kain, J., Mericq, V., Rojas, J., & Corvalán, C. (2008). Nutrition, child growth, and chronic disease prevention. Annals of medicine, 40(1), 11-20.
9 Amuna, P., & Zotor, F. B. (2008). Epidemiological and nutrition transition in developing countries: impact on human health and development: The epidemiological and nutrition transition in developing countries: evolving trends and their impact in public health and human development. Proceedings of the Nutrition Society, 67(1), 82-90.
10 Benković, V., Kolčić, I., Uhernik, A. I., Bender, D. V., Oreb, I., Stevanović, R., & Krznarić, Ž. (2014). The economic burden of disease-related undernutrition in selected chronic diseases. Clinical nutrition, 33(4), 689-693.
11 Abegunde, D. O., Mathers, C. D., Adam, T., Ortegon, M., & Strong, K. (2007). The burden and costs of chronic diseases in low-income and middle-income countries. The Lancet, 370(9603), 1929-1938.
12 GLOPAN. (2016). Food systems and diets: Facing the challenges of the 21st century. London, UK.
13 World Bank. (n.d.). Mortality rate, under-5 (per 1,000 live births). Retrieved August 7, 2018, from https://data.worldbank.org/indicator/SH.DYN.MORT?locations=MM
14 Haddad, L. J., Hawkes, C., Achadi, E., Ahuja, A., Ag Bendech, M., Bhatia, K., ... & Fanzo, J. (2015). Global Nutrition Report 2015: Actions and accountability to advance nutrition and sustainable development. Intl Food Policy Res Inst.
15 Maluccio, J. A., Hoddinott, J., Behrman, J. R., Martorell, R., Quisumbing, A. R., & Stein, A. D. (2009). The impact of improving nutrition during early childhood on education among Guatemalan adults. The Economic Journal, 119(537), 734-763.
16 Drummond, M. F., Sculpher, M. J., Claxton, K., Stoddart, G. L., & Torrance, G. W. (2015). Methods for the economic evaluation of health care programmes. Oxford university press.
38
17 Segel, J. E. (2006). Cost-of-illness studies—a primer. RTI-UNC Center of Excellence in Health Promotion Economics, 1-39.
18 WFP (World Food Programme). (2015). The Cost of Hunger in Malawi. Rome.
19 Moench-Pfanner, R., Silo, S., Laillou, A., Wieringa, F., Hong, R., Hong, R., ... & Bagriansky, J. (2016). The economic burden of malnutrition in pregnant women and children under 5 years of age in Cambodia. Nutrients, 8(5), 292.
20 Adam, I., Babiker, S., Mohmmed, A. A., Salih, M. M., Prins, M. H., & Zaki, Z. M. (2007). Low body mass index, anaemia and poor perinatal outcome in a rural hospital in eastern Sudan. Journal of Tropical Pediatrics, 54(3), 202-204.
21 Dharmalingam, A., Navaneetham, K., & Krishnakumar, C. S. (2010). Nutritional status of mothers and low birth weight in India. Maternal and child health journal, 14(2), 290-298.
22 Ota, E., Haruna, M., Suzuki, M., Anh, D. D., Tho, L. H., Tam, N. T. T., ... & Ariyoshi, K. (2011). Maternal body mass index and gestational weight gain and their association with perinatal outcomes in Viet Nam. Bulletin of the World Health Organization, 89, 127-136.
23 Gernand, A. D., Schulze, K. J., Stewart, C. P., West Jr, K. P., & Christian, P. (2016). Micronutrient deficiencies in pregnancy worldwide: health effects and prevention. Nature Reviews Endocrinology, 12(5), 274.
24 Zeng, L., Cheng, Y., Dang, S., Yan, H., Dibley, M. J., Chang, S., & Kong, L. (2008). Impact of micronutrient supplementation during pregnancy on birth weight, duration of gestation, and perinatal mortality in rural western China: double blind cluster randomised controlled trial. Bmj, 337, a2001.
25 Christian, P., West, K. P., Khatry, S. K., Leclerq, S. C., Pradhan, E. K., Katz, J., ... & Sommer, A. (2003). Effects of maternal micronutrient supplementation on fetal loss and infant mortality: a cluster-randomized trial in Nepal. The American journal of clinical nutrition, 78(6), 1194-1202.
26 Haider, B. A., & Bhutta, Z. A. (2017). Multiple‐micronutrient supplementation for women during pregnancy. Cochrane Database of Systematic Reviews, (4).
27 Black, R. E., Victora, C. G., Walker, S. P., Bhutta, Z. A., Christian, P., De Onis, M., ... & Uauy, R. (2013). Maternal and child undernutrition and overweight in low-income and middle-income countries. The lancet, 382(9890), 427-451.
28 Yakoob, M. Y., Theodoratou, E., Jabeen, A., Imdad, A., Eisele, T. P., Ferguson, J., ... & Bhutta, Z. A. (2011). Preventive zinc supplementation in developing countries: impact on mortality and morbidity due to diarrhea, pneumonia and malaria. BMC Public health, 11(3), S23.
29 Osendarp, S. J., Van Raaij, J. M., Darmstadt, G. L., Baqui, A. H., Hautvast, J. G., & Fuchs, G. J. (2001). Zinc supplementation during pregnancy and effects on growth and morbidity in low birthweight infants: a randomsied placebo controlled trial. The Lancet, 357(9262), 1080-1085.
30 Stevens, G. A., Bennett, J. E., Hennocq, Q., Lu, Y., De-Regil, L. M., Rogers, L., ... & Oehrle, S. P. (2015). Trends and mortality effects of vitamin A deficiency in children in 138 low-income and middle-income countries between 1991 and 2013: a pooled analysis of population-based surveys. The Lancet Global Health, 3(9), e528-e536.
31 Semba, R. D., de Pee, S., Sun, K., Campbell, A. A., Bloem, M. W., & Raju, V. K. (2010). Low intake of vitamin A–rich foods among children, aged 12–35 months, in India: association with malnutrition, anemia, and missed child survival interventions. Nutrition, 26(10), 958-962.
39
32 Villamor, E., & Fawzi, W. W. (2000). Vitamin A supplementation: implications for morbidity and mortality in children. The Journal of infectious diseases, 182(Supplement_1), S122-S133.
33 West Jr, K. P., Katz, J., Khatry, S. K., LeClerq, S. C., Pradhan, E. K., Shrestha, S. R., ... & Sommer, A. (1999). Double blind, cluster randomised trial of low dose supplementation with vitamin A or βcarotene on mortality related to pregnancy in Nepal. Bmj, 318(7183), 570-575.
34 Kalaivani, K. (2009). Prevalence & consequences of anaemia in pregnancy. Indian J Med Res, 130(5), 627-33.
35 Young, M. F., Oaks, B. M., Tandon, S., Martorell, R., Dewey, K. G., & Wendt, A. S. (2019). Maternal hemoglobin concentrations across pregnancy and maternal and child health: a systematic review and meta‐analysis. Annals of the New York Academy of Sciences.
36 Zhao, A., Gao, H., Li, B., Yu, K., Win, N. N., Zhang, Y., & Wang, P. (2015). Potential contribution of iron deficiency and multiple factors to anemia among 6-to 72-month-old children in the Kokang area of Myanmar. The American journal of tropical medicine and hygiene, 93(4), 836-840.
37 Ezzati, M., Lopez, A. D., Rodgers, A. A., & Murray, C. J. (2004). Comparative quantification of health risks: global and regional burden of disease attributable to selected major risk factors.
38 Imdad, A., & Bhutta, Z. A. (2012). Routine iron/folate supplementation during pregnancy: effect on maternal anaemia and birth outcomes. Paediatric and perinatal epidemiology, 26, 168-177.
39 Allen, L. H. (2000). Anemia and iron deficiency: effects on pregnancy outcome. The American journal of clinical nutrition, 71(5), 1280S-1284S.
40 Scott, S., Chen-Edinboro, L., Caulfield, L., & Murray-Kolb, L. (2014). The impact of anemia on child mortality: an updated review. Nutrients, 6(12), 5915-5932.
41 Horton, s., & Ross, J. (2003). The economics of iron deficiency. Food policy, 28(1), 51-75.
42 Alderman, H., & Horton, S. (2007). The economics of addressing nutritional anemia. Nutritional anemia, 19, 35.
43 Hla-Pe, U. (1972). Iron deficiency in Burmese population groups. The American journal of clinical nutrition, 25(2), 210-217.
44 Katz, J., Lee, A. C., Kozuki, N., Lawn, J. E., Cousens, S., Blencowe, H., ... & Adair, L. (2013). Mortality risk in preterm and small-for-gestational-age infants in low-income and middle-income countries: a pooled country analysis. The Lancet, 382(9890), 417-425.
45 Lee, A. C., Katz, J., Blencowe, H., Cousens, S., Kozuki, N., Vogel, J. P., ... & Christian, P. (2013). National and regional estimates of term and preterm babies born small for gestational age in 138 low-income and middle-income countries in 2010. The Lancet Global Health, 1(1), e26-e36.
46 Longo, S., Bollani, L., Decembrino, L., Di Comite, A., Angelini, M., & Stronati, M. (2013). Short-term and long-term sequelae in intrauterine growth retardation (IUGR). The Journal of Maternal-Fetal & Neonatal Medicine, 26(3), 222-225.
47 World Health Organization, & Unicef. (2009). WHO child growth standards and the identification of severe acute malnutrition in infants and children: joint statement by the World Health Organization and the United Nations Children's Fund.
48 Pasricha, S. R., & Biggs, B. A. (2010). Undernutrition among children in South and South‐East Asia. Journal of paediatrics and child health, 46(9), 497-503.

40
49 Leroy, J. L., & Frongillo, E. A. (2019). Perspective: What does stunting really mean? A critical review of the evidence. Advances in Nutrition, 10(2), 196-204.
50 McDonald, C. M., Olofin, I., Flaxman, S., Fawzi, W. W., Spiegelman, D., Caulfield, L. E., ... & Nutrition Impact Model Study. (2013). The effect of multiple anthropometric deficits on child mortality: meta-analysis of individual data in 10 prospective studies from developing countries. The American journal of clinical nutrition, 97(4), 896-901.
51 Olofin, I., McDonald, C. M., Ezzati, M., Flaxman, S., Black, R. E., Fawzi, W. W., ... & Nutrition Impact Model Study (anthropometry cohort pooling. (2013). Associations of suboptimal growth with all-cause and cause-specific mortality in children under five years: a pooled analysis of ten prospective studies. PloS one, 8(5), e64636.
52 Kossmann, J., Nestel, P., Herrera, M. G., Amin, A., & Fawzi, W. W. (2000). Undernutrition in relation to childhood infections: a prospective study in the Sudan. European journal of clinical nutrition, 54(6), 463.
53 Nandy, S., Irving, M., Gordon, D., Subramanian, S. V., & Smith, G. D. (2005). Poverty, child undernutrition and morbidity: new evidence from India. Bulletin of the World Health Organization, 83, 210-216.
54 Psaki, S., Bhutta, Z. A., Ahmed, T., Ahmed, S., Bessong, P., Islam, M., ... & Shrestha, P. (2012). Household food access and child malnutrition: results from the eight-country MAL-ED study. Population health metrics, 10(1), 24.
55 Guerrant, R. L., DeBoer, M. D., Moore, S. R., Scharf, R. J., & Lima, A. A. (2013). The impoverished gut—a triple burden of diarrhoea, stunting and chronic disease. Nature reviews Gastroenterology & hepatology, 10(4), 220.
56 Sawaya, A. L., Sesso, R., Florêncio, T. M. D. M. T., Fernandes, M. T., & Martins, P. A. (2005). Association between chronic undernutrition and hypertension. Maternal & child nutrition, 1(3), 155-163.
57 De Onis, M., & Branca, F. (2016). Childhood stunting: a global perspective. Maternal & child nutrition, 12, 12-26.
58 WHO. (2019). Health Topics: Breastfeeding. Retrieved from https://www.who.int/topics/breastfeeding/en/ April 30, 2019.
59 Black, R. E., Allen, L. H., Bhutta, Z. A., Caulfield, L. E., De Onis, M., Ezzati, M., ... & Maternal and Child Undernutrition Study Group. (2008). Maternal and child undernutrition: global and regional exposures and health consequences. The lancet, 371(9608), 243-260.
60 Victora, C. G., Bahl, R., Barros, A. J., França, G. V., Horton, S., Krasevec, J., ... & Group, T. L. B. S. (2016). Breastfeeding in the 21st century: epidemiology, mechanisms, and lifelong effect. The Lancet, 387(10017), 475-490.
61 Hajeebhoy, N., Nguyen, P. H., Mannava, P., Nguyen, T. T., & Mai, L. T. (2014). Suboptimal breastfeeding practices are associated with infant illness in Vietnam. International breastfeeding journal, 9(1), 12.
62 Lamberti, L. M., Zakarija-Grković, I., Walker, C. L. F., Theodoratou, E., Nair, H., Campbell, H., & Black, R. E. (2013). Breastfeeding for reducing the risk of pneumonia morbidity and mortality in children under two: a systematic literature review and meta-analysis. BMC public health, 13(3), S18.
63 Rollins, N. C., Bhandari, N., Hajeebhoy, N., Horton, S., Lutter, C. K., Martines, J. C., ... & Group, T. L. B. S. (2016). Why invest, and what it will take to improve breastfeeding practices?. The Lancet, 387(10017), 491-504.

41
64 Walters, D., Horton, S., Siregar, A. Y. M., Pitriyan, P., Hajeebhoy, N., Mathisen, R., ... & Rudert, C. (2016). The cost of not breastfeeding in Southeast Asia. Health policy and planning, 31(8), 1107-1116.
65 Akinyemi, J. O., & Morakinyo, O. M. (2018). Household environment and symptoms of childhood acute respiratory tract infections in Nigeria, 2003–2013: a decade of progress and stagnation. BMC infectious diseases, 18(1), 296.
66 Ota, E., Haruna, M., Suzuki, M., Anh, D. D., Tho, L. H., Tam, N. T. T., ... & Ariyoshi, K. (2011). Maternal body mass index and gestational weight gain and their association with perinatal outcomes in Viet Nam. Bulletin of the World Health Organization, 89, 127-136.
67 World Health Organization (WHO). Global Health Observatory data repository. Retrieved May 15, 2019 from http://apps.who.int/gho/data/view.main.ghe1002015-CH3?lang=en
68 Bagriansky, J. (2014). The Economic Consequences of Malnutrition in Timor-Leste. Dili, Timor-Leste: UNICEF
69 Benković, V., Kolčić, I., Uhernik, A. I., Bender, D. V., Oreb, I., Stevanović, R., & Krznarić, Ž. (2014). The economic burden of disease-related undernutrition in selected chronic diseases. Clinical nutrition, 33(4), 689-693.
70 Alderman, H., & Horton, S. (2007). The economics of addressing nutritional anemia. Nutritional anemia, 19, 35.
71 Hla-Pe, U. (1972). Iron deficiency in Burmese population groups. The American journal of clinical nutrition, 25(2), 210-217.
72 World Bank Data. Adjusted net national income per capita (current US$). Retrieved May 27, 2019 from: https://data.worldbank.org/indicator/NY.ADJ.NNTY.PC.CD?locations=MM
73 Moench-Pfanner, R., Silo, S., Laillou, A., Wieringa, F., Hong, R., Hong, R., ... & Bagriansky, J. (2016). The economic burden of malnutrition in pregnant women and children under 5 years of age in Cambodia. Nutrients, 8(5), 292.
74 Scott, S., Chen-Edinboro, L., Caulfield, L., & Murray-Kolb, L. (2014). The impact of anemia on child mortality: an updated review. Nutrients, 6(12), 5915-5932.
75 Cashin, J. (2016). Undernutrition in Myanmar; Part 1: A Critical Review of Literature. LIFT. Leveraging Essential Nutrition Actions to Reduce Malnutrition (LEARN) Programme.
76 Wessells, K. R., & Brown, K. H. (2012). Estimating the global prevalence of zinc deficiency: results based on zinc availability in national food supplies and the prevalence of stunting. PloS one, 7(11), e50568.
77 Oo, N. N., Bancone, G., Maw, L. Z., Chowwiwat, N., Bansil, P., Domingo, G. J., ... & Nosten, F. (2016). Validation of G6PD point-of-care tests among healthy volunteers in Yangon, Myanmar. PloS one, 11(4), e0152304.
78 Walker, C. L. F., Perin, J., Aryee, M. J., Boschi-Pinto, C., & Black, R. E. (2012). Diarrhea incidence in low-and middle-income countries in 1990 and 2010: a systematic review. BMC public health, 12(1), 220.
79 Rudan, I., Tomaskovic, L., Boschi-Pinto, C., & Campbell, H. (2004). Global estimate of the incidence of clinical pneumonia among children under five years of age. Bulletin of the World Health Organization, 82, 895-903.

42
80 World Food Program (WFP). (2015). The cost of hunger in Malawi. Retrieved from https://reliefweb.int/report/malawi/cost-hunger-malawi-social-and-economic-impacts-child-undernutrition-malawi
81 World Health Organization. (2018). Children: reducing mortality. Retrieved June 1, 2019 from: https://www.who.int/news-room/fact-sheets/detail/children-reducing-mortality
82 Schroeder, D. G., & Brown, K. H. (1994). Nutritional status as a predictor of child survival: summarizing the association and quantifying its global impact. Bulletin of the World Health Organization, 72(4), 569.
83 Lamberti, L. M., Zakarija-Grković, I., Walker, C. L. F., Theodoratou, E., Nair, H., Campbell, H., & Black, R. E. (2013). Breastfeeding for reducing the risk of pneumonia morbidity and mortality in children under two: a systematic literature review and meta-analysis. BMC public health, 13(3), S18.
84 World Health Organization. (10 August 2015). Vitamin A supplementation. Retrieved 30 May 2019 from https://www.who.int/immunization/programmes_systems/interventions/vitamin_A/en/
85 Gernand, A. D., Schulze, K. J., Stewart, C. P., West Jr, K. P., & Christian, P. (2016). Micronutrient deficiencies in pregnancy worldwide: health effects and prevention. Nature Reviews Endocrinology, 12(5), 274.
86 Villamor, E., & Fawzi, W. W. (2000). Vitamin A supplementation: implications for morbidity and mortality in children. The Journal of infectious diseases, 182(Supplement_1), S122-S133.
87 Benković, V., Kolčić, I., Uhernik, A. I., Bender, D. V., Oreb, I., Stevanović, R., & Krznarić, Ž. (2014). The economic burden of disease-related undernutrition in selected chronic diseases. Clinical nutrition, 33(4), 689-693.
88 Uauy, R., Kain, J., Mericq, V., Rojas, J., & Corvalán, C. (2008). Nutrition, child growth, and chronic disease prevention. Annals of medicine, 40(1), 11-20.
89 Abegunde, D. O., Mathers, C. D., Adam, T., Ortegon, M., & Strong, K. (2007). The burden and costs of chronic diseases in low-income and middle-income countries. The Lancet, 370(9603), 1929-1938.
90 World Bank. (1994). Development Report 1993: Investing in Health; Oxford University Press: New York, NY, USA.
91 Attema, A. E., Brouwer, W. B., & Claxton, K. (2018). Discounting in economic evaluations. PharmacoEconomics, 36(7), 745-758.
92 Leroy, J. L., & Frongillo, E. A. (2019). Perspective: What does stunting really mean? A critical review of the evidence. Advances in Nutrition, 10(2), 196-204.
93 Rice, D. (1994). Cost-of-illness studies: fact or fiction?. The Lancet, 344(8936), 1519-1520.
94 Finkelstein, E., & Corso, P. (2003). Cost-of-illness analyses for policy making: a cautionary tale of use and misuse. Expert Review of Pharmacoeconomics & Outcomes Research, 3:4, 367-369, DOI: 10.1586/14737167.3.4.367
95 Antonopoulos, R. (2008). The unpaid care work-paid work connection. Levy Economics Institute, Working Papers Series.
96 Hoddinott, J., Alderman, H., Behrman, J. R., Haddad, L., & Horton, S. (2013). The economic rationale for investing in stunting reduction. Maternal & child nutrition, 9, 69-82.