estimating column diameters in jet grouting processes · estimating column diameters in jet...
TRANSCRIPT
1
Estimating column diameters in jet grouting processes
Kimpritis, T.1, Standing, J.R.2 and Thurner, R.3
1 Keller Hellas S.A., formerly Imperial College London 2 Department of Civil and Environmental Engineering, Imperial College London 3 Keller Grundbau GmbH, Technical and Commercial Director Middle East and Turkey
Abstract
Jet grouting is widely used in geotechnical engineering for a variety of applications and is a well-
proven technique. As with many techniques developed from a practical perspective, there is still
scope for improvements both in construction practice and design. This paper focuses on one of
the most crucial elements of quality control required with jet grouting operations, the diameter of
the constructed column. First, the jet grouting method is explained and the main issues of the
concept highlighted. A description follows of the techniques available for estimating column
diameter, discussing their application and evaluation on site. There is a particular emphasis on
two methods: inclined core drilling and a newly-developed thermic approach (Meinhard et al.,
2007) both of which were implemented on two construction projects. Data from these case
studies are reported and analysed extensively, in conjunction with influencing factors such as
the ground conditions, to assess their effects on the achieved diameter. An empirical approach
for evaluating the diameter of jet-grouted columns is developed based on various factors
influencing their size such as monitor lifting speed and soil strength.
Introduction
Jet grouting is a process involving high pressure erosion, grout injection and mixing of in-situ
ground, resulting in both replacement and relaxation of the soil and the formation of a cemented
soil mass which in most instances has the form of a column. The jet-grouted column is
constructed by in-situ injection using specialised equipment that comprises: drilling rig, drill rods,
grout mixer and pump and injection monitor with one or more horizontal radial nozzles delivering
high velocity fluids to erode, mix and stabilise the in-situ soils using engineered grout slurry
(ASCE, 2016). During the grouting process, the rotating drilling rods, with the grout injection unit
(the monitor) at the base, are raised at a certain lifting speed, hence creating a column (of
roughly circular shape) of mixed grout and soil. By constructing a number of overlapping
columns, the overall strength and the stiffness of the soil mass are improved. Common
2
applications of the improved soil mass can be to provide a strutting slab, a cut-off wall or for
general ground improvement (e.g. to enable tunnelling works).
In practice, the accurate determination of the diameter of the resulting jet-grouted column is a
crucial factor when assessing the integrity and effectiveness of a jet-grouted soil mass. It is
hindered by the fact that the constructed columns are often far below the ground surface and,
even with stringent construction control measures, the diameter might not be uniform with depth
due to varying ground conditions. This paper briefly describes the jet grouting technique and the
methods available for estimating column diameter. It then focusses on two of the methods:
inclined core drilling, which is very reliable and accurate, and the relatively new thermic method.
The effectiveness of the latter is investigated using data from two sites where both methods
were implemented. The diameter measurements made on site are correlated with various
factors such as the monitor lifting speed and the ground conditions to investigate potential
relationships between them. Combining the factors by means of regression analyses, allows
simple empirical expressions to be developed for estimating jet-grouted column diameters. The
aim of the paper is twofold: (i) to contribute an alternative means of estimating jet-grouted
column diameters; and (ii) to encourage the recording and compilation of site information to
reinforce such an approach.
Method description
In principle, there are three primary types of jet grouting system, which are classified by the
number of fluids injected into the subsoil.
Single: grout is pumped through the rods and exits the nozzles of the monitor at high velocity
(i.e. a minimum of 100 m/sec). The energy of the grout stream simultaneously erodes the soil
and replaces it with mixture of grout and soil.
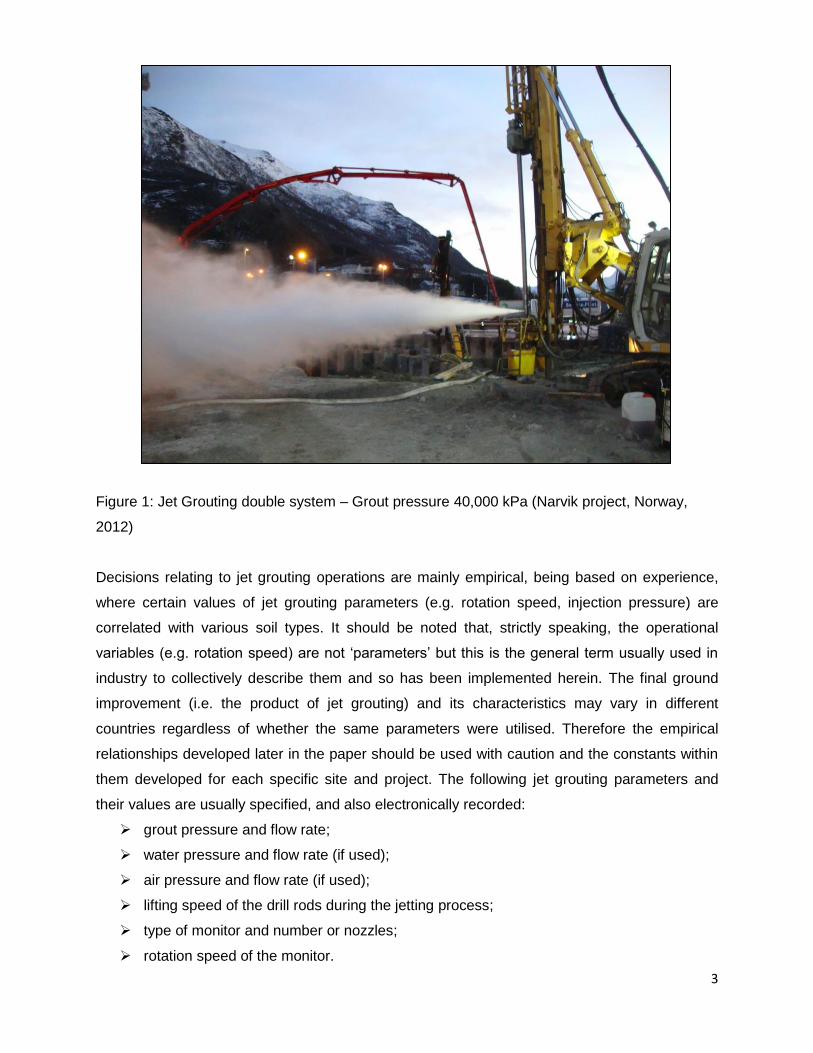
Double: compressed air (200 to 1000 kPa) is supplied and surrounds the grout stream in
order to enhance the erosive effect (Figure 1).
Triple: the soil structure is broken down with a high pressure water jet shrouded by an air jet
for increased efficiency. The surrounding soils are thus hydraulically eroded and then mixed
with a jet of cement slurry in situ to create soilcrete columns. The cement slurry is injected at
low pressure from the same monitor through lower level nozzles. In this grouting process,
due to differences in density, most of the grout remains within the jet-grouted column while
the water rises above it. The excess water-soil-cement mixture flows to the surface through
the annular space between the drill rods and the borehole wall.
3
Figure 1: Jet Grouting double system – Grout pressure 40,000 kPa (Narvik project, Norway,
2012)
Decisions relating to jet grouting operations are mainly empirical, being based on experience,
where certain values of jet grouting parameters (e.g. rotation speed, injection pressure) are
correlated with various soil types. It should be noted that, strictly speaking, the operational
variables (e.g. rotation speed) are not ‘parameters’ but this is the general term usually used in
industry to collectively describe them and so has been implemented herein. The final ground
improvement (i.e. the product of jet grouting) and its characteristics may vary in different
countries regardless of whether the same parameters were utilised. Therefore the empirical
relationships developed later in the paper should be used with caution and the constants within
them developed for each specific site and project. The following jet grouting parameters and
their values are usually specified, and also electronically recorded:
grout pressure and flow rate;
water pressure and flow rate (if used);
air pressure and flow rate (if used);
lifting speed of the drill rods during the jetting process;
type of monitor and number or nozzles;
rotation speed of the monitor.
4
Methods for estimating the diameter of jet-grouted columns
A primary concern in the quality control of jet grouting operations is the estimation of the final
diameter of the column and whether it varies over its length. The type of soil, the project itself
(e.g. underpinning, retaining works, soil improvement) along with its specific conditions (e.g.
execution inside existing buildings, grouting depth) all influence the method that can be used to
estimate or measure the column diameter.
The main methods available for measuring the jet-grouted column diameter are listed below.
1. Excavation (Figure 2).
2. Core drilling: vertical or inclined (Figures 3 and 4).
3. Thermic method: where by measuring on site the temperature during the curing process
of the binding agent (cement) along the centre of the jet-grouted column, the achieved
diameter and the cement quantity in the column can be calculated (Meinhard et al.,
2007, following the work of Brandstätter et al., 2002).
4. Jet grouting column callipers: these are mechanical devices which are lowered into the
fresh jet-grouted column, immediately after its construction, and their arms opened to
measure the diameter (Getec, 2004).
5. Painted bars: these are installed vertically in the ground around the column centre at
distances roughly equal to the expected column diameter. After the jetting process, they
are retrieved from the ground and the column diameter is estimated based on the
amount of paint remaining after erosion from the jetting process.
6. Hydrophones: these are installed in the ground (at similar locations to those for the
painted bars method) and the column diameter is estimated from the sound intensity
recorded and the form of the sound diagram produced (‘flat’, ‘plate’, ‘wave’ or ‘peak’)
(Leible, 2011).
7. Empirical calculation models: based on the density of the mixed grout and soil spoil
coming to the surface during the jetting process (Lesnik, 2003).
8. Geophysical methods: e.g. the Electric Cylinder® Method (CYLJET) (Frappin and
Vernhes, 2011).
9. Wave analysis method: in this method the evaluation of the diameter of the jet-grouted
column is based on an elastic wave analysis approach (Schorr et al., 2007)
10. Turbulent kinematic flow theory: in this approach, the eroding ability of the high pressure
injection grout is evaluated using a semi-empirical equation, the constants of which are
determined from results of previous experiments and trials. A relationship between the
5
achieved diameter, the jet grouting parameters and the soil properties is thus defined.
(Wang, et al., 2012)
11. Analytical approach: the diameter calculation is based on theoretical models (Modoni et
al., 2006).
The methods available can be categorized into three main groups.
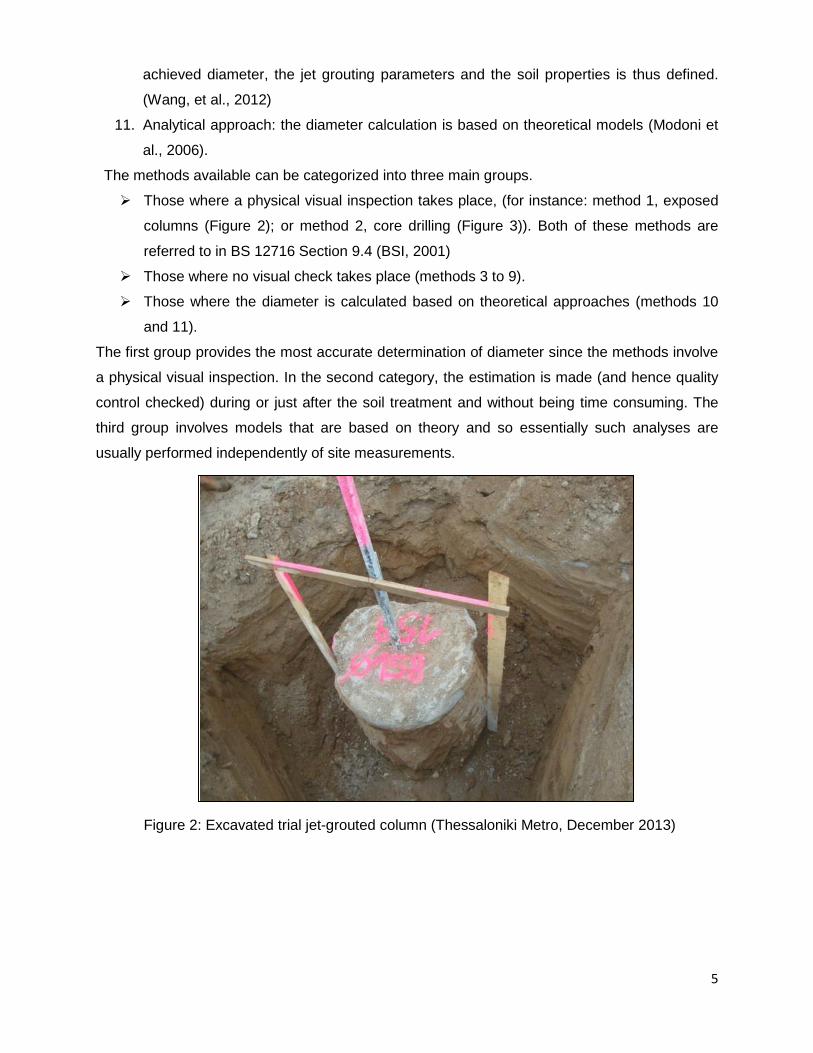
Those where a physical visual inspection takes place, (for instance: method 1, exposed
columns (Figure 2); or method 2, core drilling (Figure 3)). Both of these methods are
referred to in BS 12716 Section 9.4 (BSI, 2001)
Those where no visual check takes place (methods 3 to 9).
Those where the diameter is calculated based on theoretical approaches (methods 10
and 11).
The first group provides the most accurate determination of diameter since the methods involve
a physical visual inspection. In the second category, the estimation is made (and hence quality
control checked) during or just after the soil treatment and without being time consuming. The
third group involves models that are based on theory and so essentially such analyses are
usually performed independently of site measurements.
Figure 2: Excavated trial jet-grouted column (Thessaloniki Metro, December 2013)
6
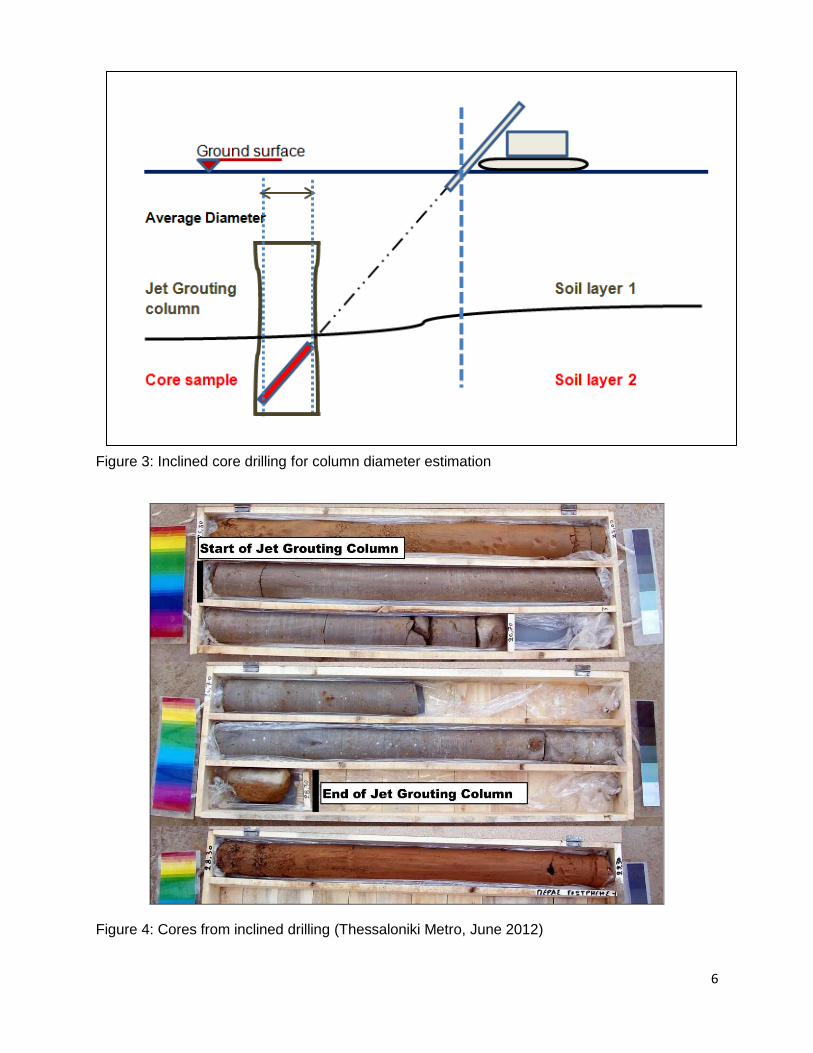
Figure 3: Inclined core drilling for column diameter estimation
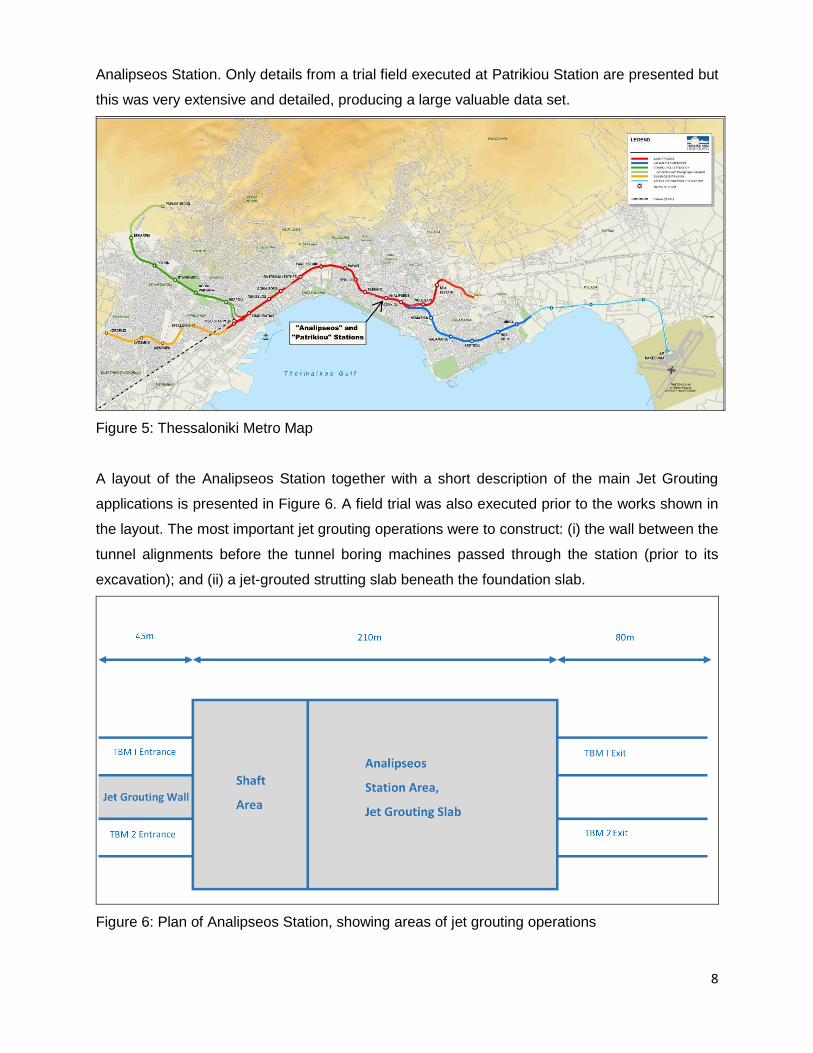
Figure 4: Cores from inclined drilling (Thessaloniki Metro, June 2012)

7
In this paper, two of the available methods are described in more detail: inclined coring (method
2) and the thermic method (method 3). These are then investigated further using field
measurements and records from two sites where both techniques were implemented.
Inclined coring. In order to calculate the diameter using the inclined coring method the
following information is required: the surface coordinates of the point of drilling of the column
and the coring; the inclination of the column itself (if not vertical); the angle at which the core
was drilled; any deviation in the drilling and the length of the core sample. Trigonometric
formulations can then be applied to the basic geometry to determine the diameter. This method,
together with that involving excavation, is considered to be the most reliable and accurate of all
available methods.
Thermic method. Meinhard et al. (2007) explain that the thermic method involves exploiting
the exothermic characteristics established during the hydration process of early-age jet grouted
soil. In order to apply the method the following are needed: (i) in-situ temperature
measurements made at the centre of the column directly after column construction; (ii) the
properties of the employed binder (usually cement); and (iii) the thermal properties of the
surrounding soil (the volumetric heat capacity C (kJ/(m3K)) and the thermal conductivity k
(W/(mK)) which are usually obtained from database software. The temperature measurements
primarily relate to the binding agent (in most cases cement) as they are taken at the centre of
the Jet Grouting column directly after its construction for a minimum duration of 30 hours. The
recorded temperature history is input into commercial software, named ‘Tempjet’, which
produces an in-situ temperature versus time ‘in-situ’ curve. This in-situ curve is compared with
model curves, generated from finite element analyses implementing a multiphase hydration
constitutive model, which are produced for the various types of binding agents (e.g. cement)
used in the construction of columns. The unique theoretical curve that best matches the in-situ
curve is established (using ‘Tempjet’) and the diameter estimated along with the cement
quantity within the jet-grouted column. More specific details of the method are given by
Meinhard et al. (2007).
Information on the two project case histories
Both of the above techniques were widely implemented as part of the various jet grouting
operations used during the construction of Analipseos and Patrikiou Stations which form part of
the Thessaloniki Metro in Greece. The locations of the stations, within the overall Metro system,
are shown in Figure 5. Major jet grouting operations took place for the construction of the
8
Analipseos Station. Only details from a trial field executed at Patrikiou Station are presented but
this was very extensive and detailed, producing a large valuable data set.
Figure 5: Thessaloniki Metro Map
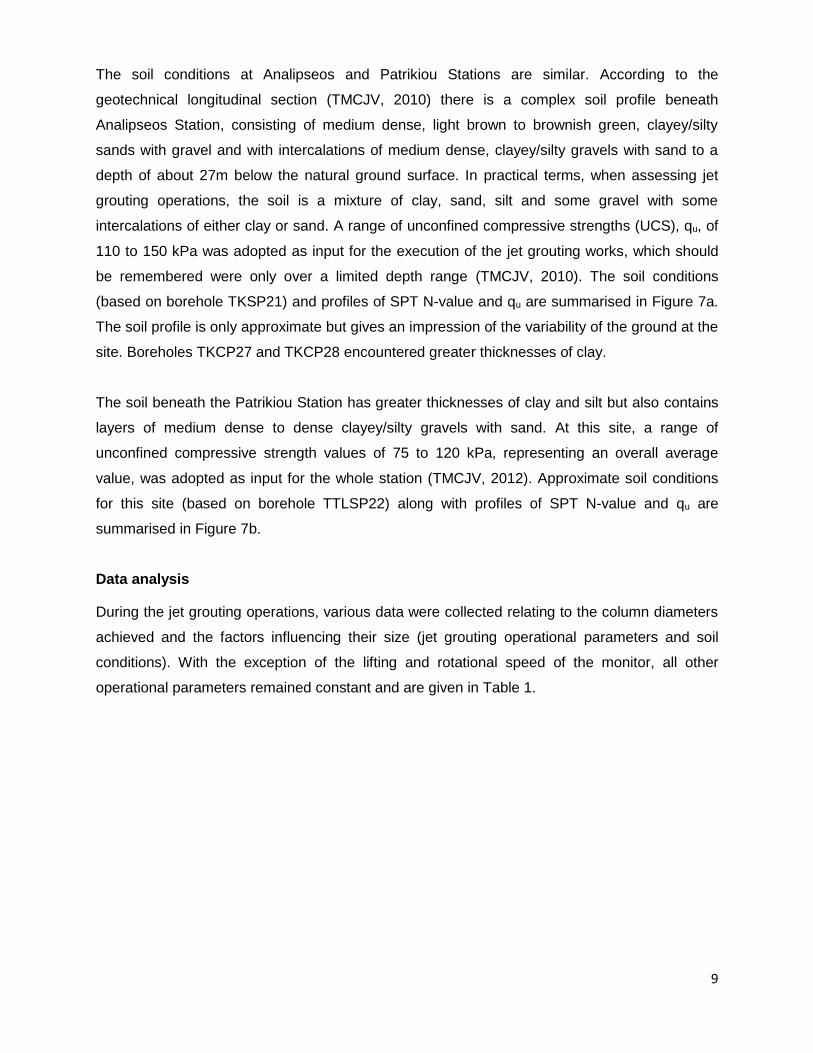
A layout of the Analipseos Station together with a short description of the main Jet Grouting
applications is presented in Figure 6. A field trial was also executed prior to the works shown in
the layout. The most important jet grouting operations were to construct: (i) the wall between the
tunnel alignments before the tunnel boring machines passed through the station (prior to its
excavation); and (ii) a jet-grouted strutting slab beneath the foundation slab.
Figure 6: Plan of Analipseos Station, showing areas of jet grouting operations
9
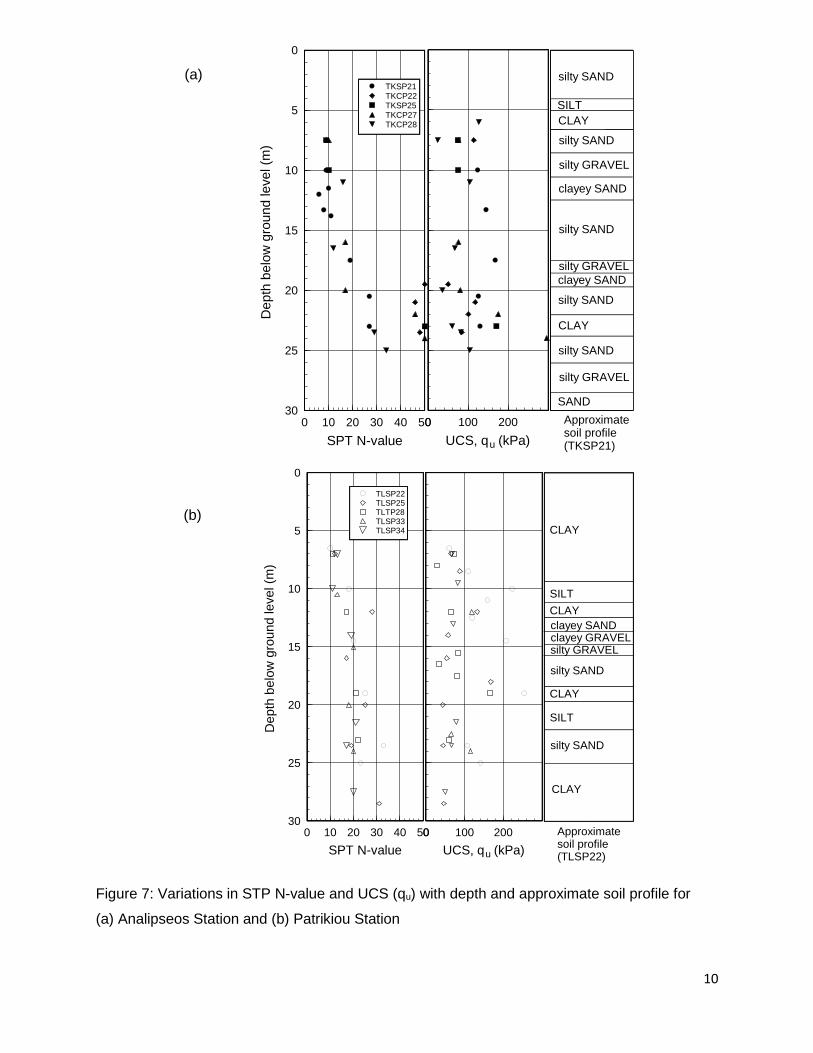
The soil conditions at Analipseos and Patrikiou Stations are similar. According to the
geotechnical longitudinal section (TMCJV, 2010) there is a complex soil profile beneath
Analipseos Station, consisting of medium dense, light brown to brownish green, clayey/silty
sands with gravel and with intercalations of medium dense, clayey/silty gravels with sand to a
depth of about 27m below the natural ground surface. In practical terms, when assessing jet
grouting operations, the soil is a mixture of clay, sand, silt and some gravel with some
intercalations of either clay or sand. A range of unconfined compressive strengths (UCS), qu, of
110 to 150 kPa was adopted as input for the execution of the jet grouting works, which should
be remembered were only over a limited depth range (TMCJV, 2010). The soil conditions
(based on borehole TKSP21) and profiles of SPT N-value and qu are summarised in Figure 7a.
The soil profile is only approximate but gives an impression of the variability of the ground at the
site. Boreholes TKCP27 and TKCP28 encountered greater thicknesses of clay.
The soil beneath the Patrikiou Station has greater thicknesses of clay and silt but also contains
layers of medium dense to dense clayey/silty gravels with sand. At this site, a range of
unconfined compressive strength values of 75 to 120 kPa, representing an overall average
value, was adopted as input for the whole station (TMCJV, 2012). Approximate soil conditions
for this site (based on borehole TTLSP22) along with profiles of SPT N-value and qu are
summarised in Figure 7b.
Data analysis
During the jet grouting operations, various data were collected relating to the column diameters
achieved and the factors influencing their size (jet grouting operational parameters and soil
conditions). With the exception of the lifting and rotational speed of the monitor, all other
operational parameters remained constant and are given in Table 1.
10
(a)
(b)
Figure 7: Variations in STP N-value and UCS (qu) with depth and approximate soil profile for
(a) Analipseos Station and (b) Patrikiou Station
0 10 20 30 40 50
SPT N-value
0
5
10
15
20
25
30
Depth
belo
w g
round level (m
)
TKSP21TKCP22TKSP25TKCP27TKCP28
0 100 200
UCS, qu (kPa)
silty SAND
SILT
CLAY
silty SAND
silty GRAVEL
clayey SAND
silty SAND
silty GRAVEL
clayey SAND
CLAY
silty SAND
silty SAND
SAND
silty GRAVEL
Approximatesoil profile(TKSP21)
0 10 20 30 40 50
SPT N-value
0
5
10
15
20
25
30
Depth
belo
w g
round level (m
)
TLSP22TLSP25TLTP28TLSP33TLSP34
0 100 200
UCS, qu (kPa)
CLAY
clayey GRAVELclayey SAND
silty GRAVEL
CLAY
silty SAND
silty SAND
SILT
CLAY
Approximatesoil profile(TLSP22)
CLAY
SILT
11
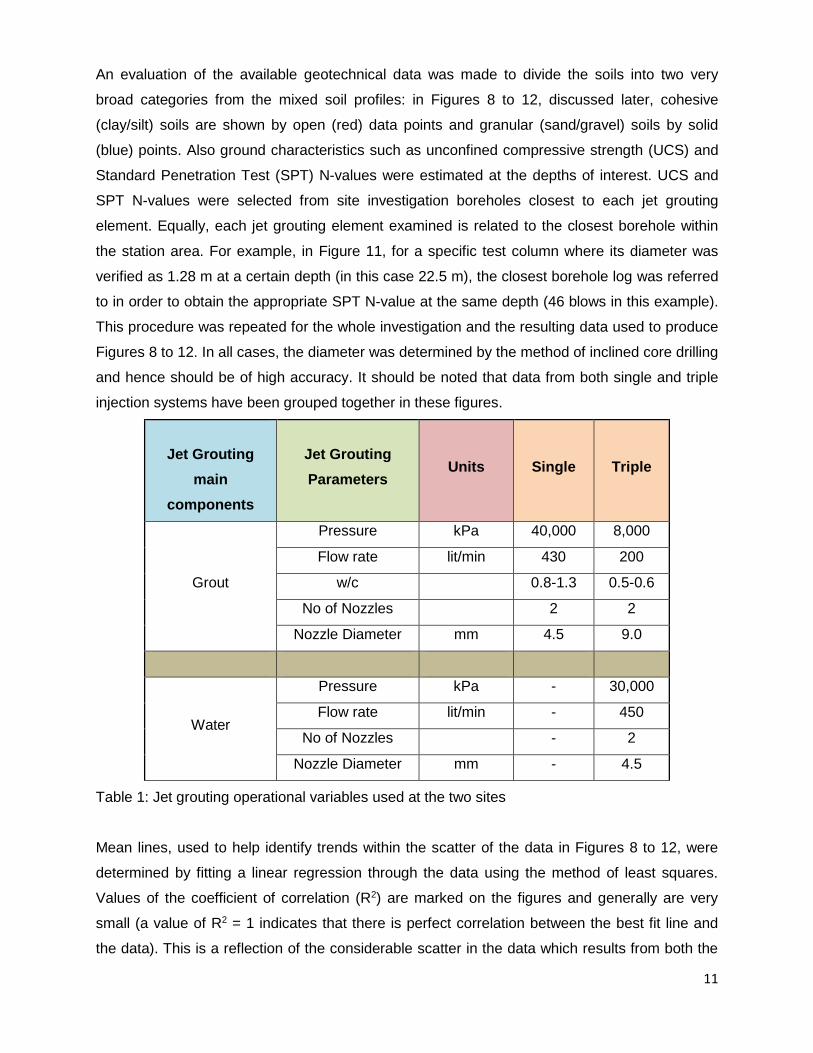
An evaluation of the available geotechnical data was made to divide the soils into two very
broad categories from the mixed soil profiles: in Figures 8 to 12, discussed later, cohesive
(clay/silt) soils are shown by open (red) data points and granular (sand/gravel) soils by solid
(blue) points. Also ground characteristics such as unconfined compressive strength (UCS) and
Standard Penetration Test (SPT) N-values were estimated at the depths of interest. UCS and
SPT N-values were selected from site investigation boreholes closest to each jet grouting
element. Equally, each jet grouting element examined is related to the closest borehole within
the station area. For example, in Figure 11, for a specific test column where its diameter was
verified as 1.28 m at a certain depth (in this case 22.5 m), the closest borehole log was referred
to in order to obtain the appropriate SPT N-value at the same depth (46 blows in this example).
This procedure was repeated for the whole investigation and the resulting data used to produce
Figures 8 to 12. In all cases, the diameter was determined by the method of inclined core drilling
and hence should be of high accuracy. It should be noted that data from both single and triple
injection systems have been grouped together in these figures.
Jet Grouting
main
components
Jet Grouting
Parameters Units Single Triple
Grout
Pressure kPa 40,000 8,000
Flow rate lit/min 430 200
w/c 0.8-1.3 0.5-0.6
No of Nozzles 2 2
Nozzle Diameter mm 4.5 9.0
Water
Pressure kPa - 30,000
Flow rate lit/min - 450
No of Nozzles - 2
Nozzle Diameter mm - 4.5
Table 1: Jet grouting operational variables used at the two sites
Mean lines, used to help identify trends within the scatter of the data in Figures 8 to 12, were
determined by fitting a linear regression through the data using the method of least squares.
Values of the coefficient of correlation (R2) are marked on the figures and generally are very
small (a value of R2 = 1 indicates that there is perfect correlation between the best fit line and
the data). This is a reflection of the considerable scatter in the data which results from both the
12
number of variables involved and also the complex ground conditions. In view of the scatter it
was decided that a simple linear fit was most appropriate, more complex functions not being
justifiable or of practical benefit. Improved correlations could be achieved if selected outlying
data points were omitted but it was decided to retain all points for completeness. A number of
conclusions can be drawn from evaluating the data presented in Figures 8 to 12.
First, it can be seen that in most cases where the ground was mainly sand/gravel the diameter
achieved was relatively larger than in cases where the soil was mainly silt/clay. This is most
clearly seen by the mean lines drawn through the two sets of data in each figure: the solid (blue)
line (relating to sand/gravel) is always above the broken (red) line (relating to silt/clay).
In mainly sand/gravel soils: the mean value of the diameter was 1.5 m with minimum and
maximum values of 1.2 m and 2.0 m.
In mainly clay/silt soils: the mean value of the diameter was 1.4 m with minimum and
maximum values of 1.1 m and 1.8 m.
This seems a logical result as a granular soil should be easier to erode than a cohesive one for
a given injection pressure, thus resulting in a larger diameter column.
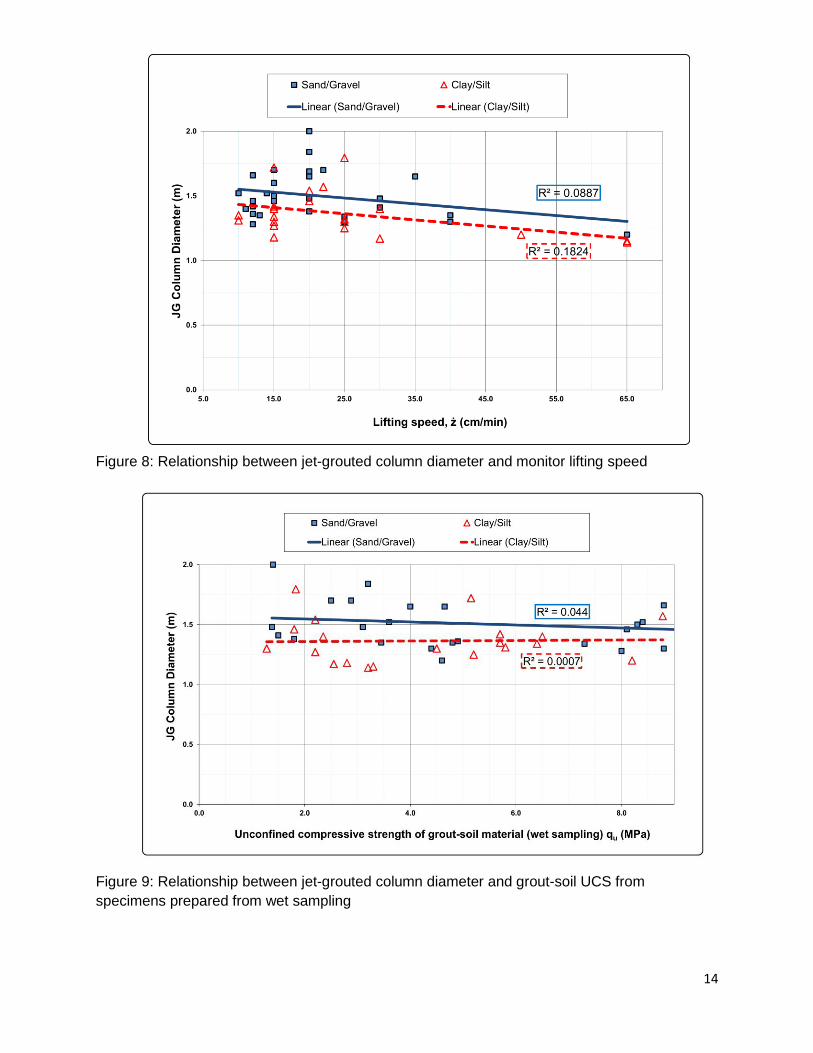
Figure 8 illustrates clearly the difference between the diameters for the two soil categories for
varying lifting speeds, ż, (solid symbols are above open symbols in most cases). It is also
evident, as expected, that an increase in the lifting speed of the monitor leads to a reduction in
column diameter achieved, although the effect is not strong, as indicated by the shallow
inclination of the trend lines. For both soil types there appears to be an optimum lifting speed in
the range of 15 to 25 cm/min where the largest diameters were achieved (most clear with the
granular soil).
Just after the production of each jet-grouted column, wet samples of the fresh grout-soil material
were retrieved from within the column using a special sampler which could reach the depth of
interest and take a sample at that specific level (known as a wet sampling process). Specimens
were prepared from these wet samples for UCS testing after 7 and 28 days. The resulting UCS
28-day values are plotted against column diameter in Figure 9 to assess whether this measure
can be used to help assess column diameter achieved. It can be seen that the diameter is not
strongly influenced by the mean UCS values, although there are minor trends of diameter
reducing with increasing grout-soil strength. As with the lifting speed data there appears to be
an optimum UCS strength in the range of 2 to 4 MPa for the granular soils.
13
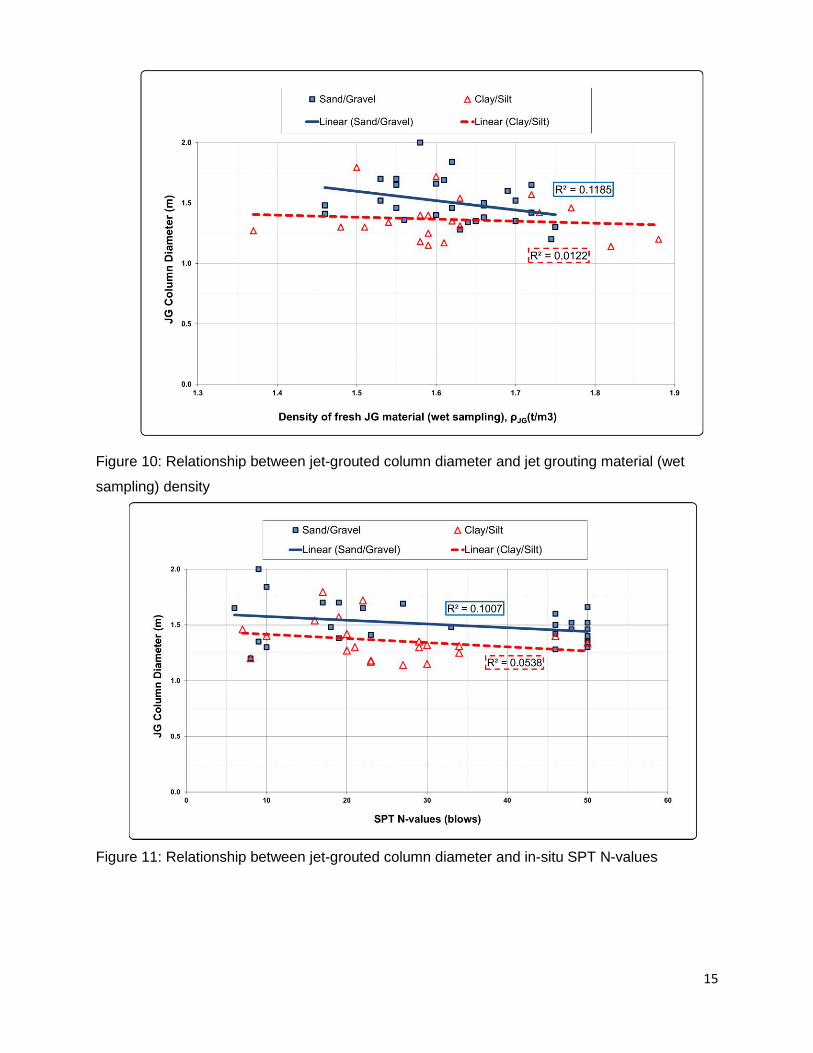
As the density values of the fresh grout-soil, ρJG, were readily determined at the same time that
the UCS samples were prepared, these can also be correlated with jet-grouted column
diameter. The mean value of ρJG for both soil categories was the same: 1.62 t/m3. The range of
values recorded is greater for the clay/silt soil type with minimum and maximum values of 1.37
t/m3 and 1.88 t/m3, while for the sand/gravel soil type they are 1.46 t/m3 and 1.75 t/m3. The
results are presented in Figure 10. There is a general trend (within the scatter) of the diameter
reducing with increasing density for the sand/gravel soil category. This logically follows from the
same trend observed with UCS values (diameter reducing as UCS increases) as broadly UCS
would be expected to increase with increasing density. The effect is barely discernible for the
clay/silt soil category. The trends for ρJG are also discussed later when the empirical model is
presented and explained.
The influence of the ground SPT N-values on jet-grouted column diameter is shown in Figure
11. The diameter becomes smaller as the SPT values increase regardless of soil type. This
again seems logical as the stronger the soil is the more difficult it should be for a given injection
pressure to erode it and hence the smaller the resulting jet-grouted column diameter. There are
a number of points in Figure 11 at the SPT N-value of 50, at which the test is often stopped. It
would have been interesting to continue these tests further to see whether the observed trend
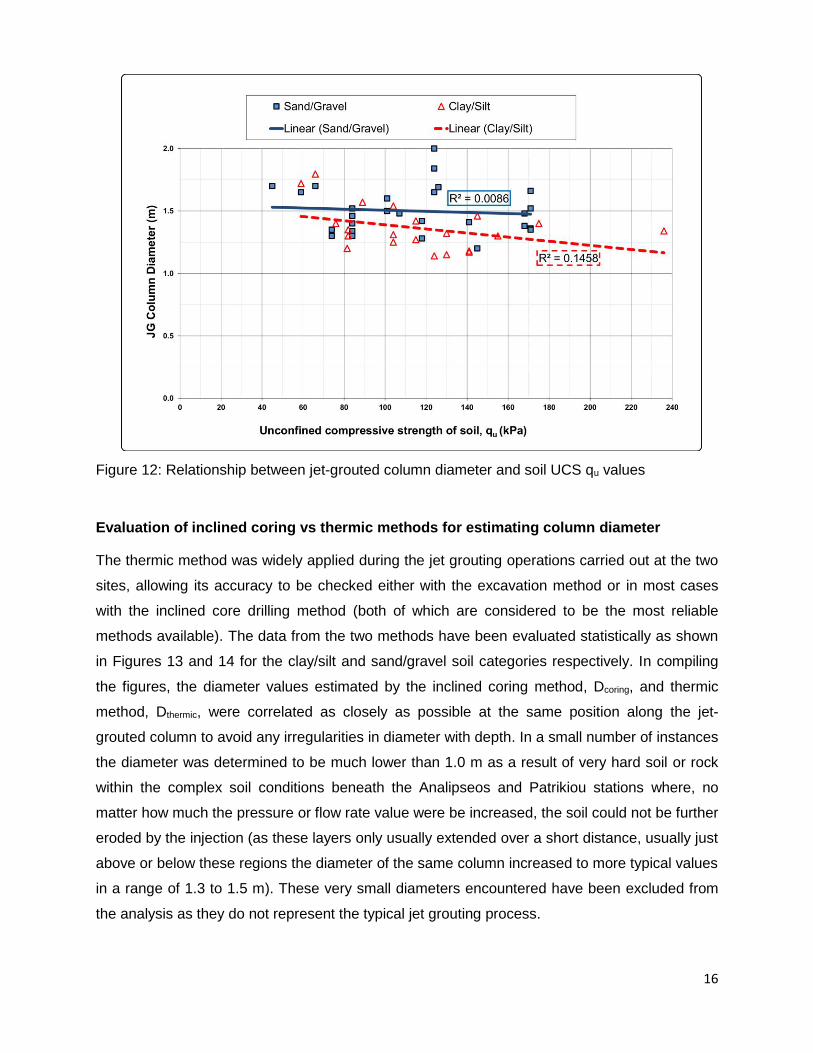
was confirmed more clearly. The UCS of the natural soil prior to jet grouting operations would
be expected to have a similar trend of reducing column diameter with increasing qu. The results
are plotted in Figure 12. There is a clear trend to this effect for the clay/silt soils for which this
type of test is more appropriate. In the case of the sand/gravel category there does not appear
to be any trend. This is not surprising as predominantly granular soils would be much more
prone to random failure in an unconfined condition (even if they do contain small fractions of
clay/silt). It can be concluded that UCS tests are not helpful for making interpretations with the
granular soil category. The SPT N-value is much more suitable.
The data plotted in Figures 8 to 12 provide a basic idea of how the jet-grouted column diameter
is influenced by various factors that can be readily determined either in advance of or during the
jet grouting operations. Further analyses with more quantitative tools are discussed later to help
provide clearer trends and a more accurate understanding of what primarily influences the
diameter and how it can be calculated.
14
Figure 8: Relationship between jet-grouted column diameter and monitor lifting speed
Figure 9: Relationship between jet-grouted column diameter and grout-soil UCS from
specimens prepared from wet sampling
15
Figure 10: Relationship between jet-grouted column diameter and jet grouting material (wet
sampling) density
Figure 11: Relationship between jet-grouted column diameter and in-situ SPT N-values
16
Figure 12: Relationship between jet-grouted column diameter and soil UCS qu values
Evaluation of inclined coring vs thermic methods for estimating column diameter
The thermic method was widely applied during the jet grouting operations carried out at the two
sites, allowing its accuracy to be checked either with the excavation method or in most cases
with the inclined core drilling method (both of which are considered to be the most reliable
methods available). The data from the two methods have been evaluated statistically as shown
in Figures 13 and 14 for the clay/silt and sand/gravel soil categories respectively. In compiling
the figures, the diameter values estimated by the inclined coring method, Dcoring, and thermic
method, Dthermic, were correlated as closely as possible at the same position along the jet-
grouted column to avoid any irregularities in diameter with depth. In a small number of instances
the diameter was determined to be much lower than 1.0 m as a result of very hard soil or rock
within the complex soil conditions beneath the Analipseos and Patrikiou stations where, no
matter how much the pressure or flow rate value were be increased, the soil could not be further
eroded by the injection (as these layers only usually extended over a short distance, usually just
above or below these regions the diameter of the same column increased to more typical values
in a range of 1.3 to 1.5 m). These very small diameters encountered have been excluded from
the analysis as they do not represent the typical jet grouting process.
17
By separating the results for the two soil categories, it becomes clear that estimating the
diameter using the thermic method is influenced by the ground conditions over the depth at
which the various tests were performed. Taking the inclined core drilling method to be the most
accurate for estimating jet-grouted column diameter, the analyses indicate that the thermic
method provides diameter values that in general are: larger than reality in clay/silt category soils
(Dthermic = 1.14Dcoring) and smaller than reality in sand/gravel category soils (Dthermic = 0.89Dcoring).
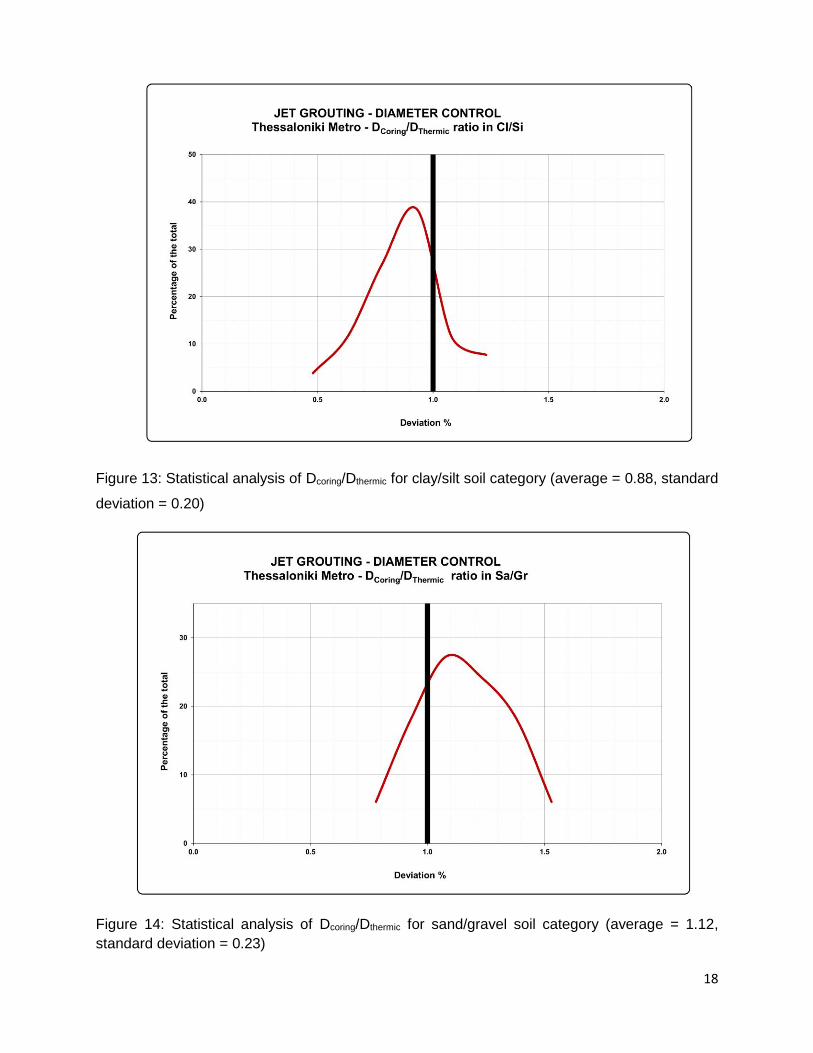
From the analysis of the results from the two sites on the Thessaloniki Metro, the following has
been established for clay/silt category soils (Figure 13):
80% of the ratio Dcoring/Dthermic is less than 1.00,
20% of the ratio Dcoring/Dthermic is between 1.00 and 1.30.
Therefore from Figure 13 and the average value, it can be seen that the thermic method gives
results which are 12% more optimistic than the actual diameter of the column and so is likely to
over-predict the actual diameter.
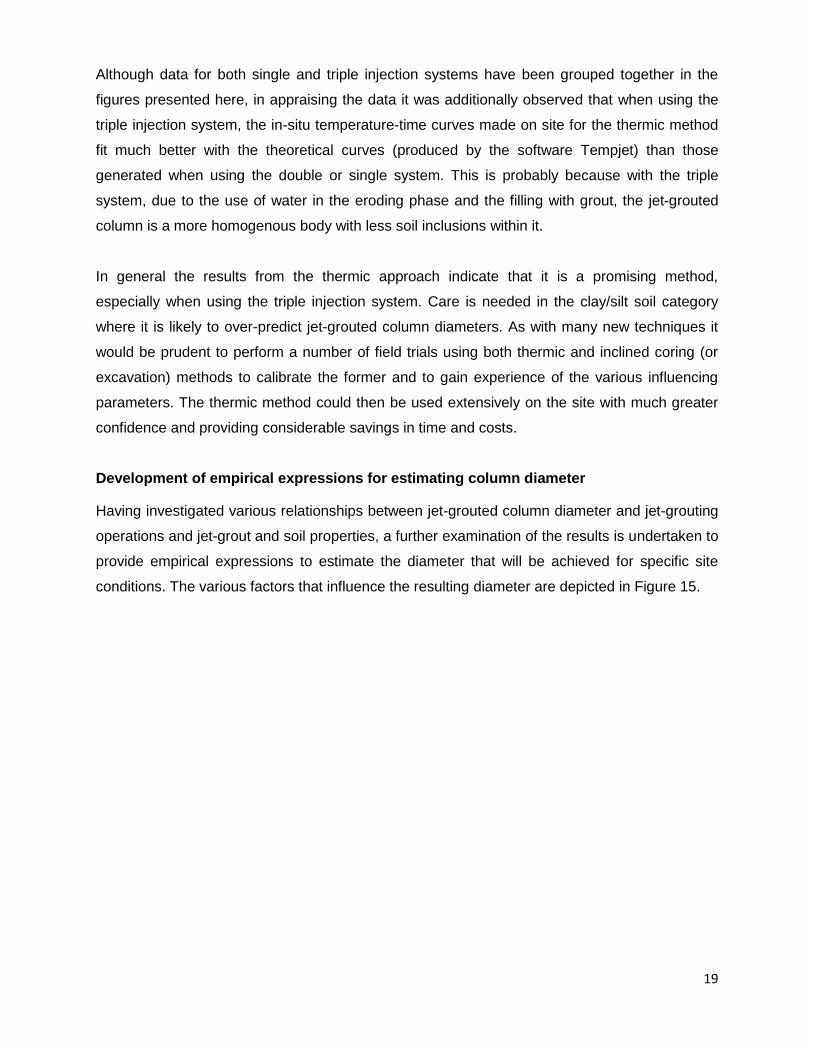
For the sand/gravel category soils (Figure 14):
76% of the ratio Dcoring/Dthermic is more than 1.00,
24% of the ratio Dcoring/Dthermic is between 0.80 and 1.00.
In this case the thermic method under-predicts (by about 12%) the actual diameter of the
column and thus overall the results are on the safe side.
18
Figure 13: Statistical analysis of Dcoring/Dthermic for clay/silt soil category (average = 0.88, standard
deviation = 0.20)
Figure 14: Statistical analysis of Dcoring/Dthermic for sand/gravel soil category (average = 1.12,
standard deviation = 0.23)
19
Although data for both single and triple injection systems have been grouped together in the
figures presented here, in appraising the data it was additionally observed that when using the
triple injection system, the in-situ temperature-time curves made on site for the thermic method
fit much better with the theoretical curves (produced by the software Tempjet) than those
generated when using the double or single system. This is probably because with the triple
system, due to the use of water in the eroding phase and the filling with grout, the jet-grouted
column is a more homogenous body with less soil inclusions within it.
In general the results from the thermic approach indicate that it is a promising method,
especially when using the triple injection system. Care is needed in the clay/silt soil category
where it is likely to over-predict jet-grouted column diameters. As with many new techniques it
would be prudent to perform a number of field trials using both thermic and inclined coring (or
excavation) methods to calibrate the former and to gain experience of the various influencing
parameters. The thermic method could then be used extensively on the site with much greater
confidence and providing considerable savings in time and costs.
Development of empirical expressions for estimating column diameter
Having investigated various relationships between jet-grouted column diameter and jet-grouting
operations and jet-grout and soil properties, a further examination of the results is undertaken to
provide empirical expressions to estimate the diameter that will be achieved for specific site
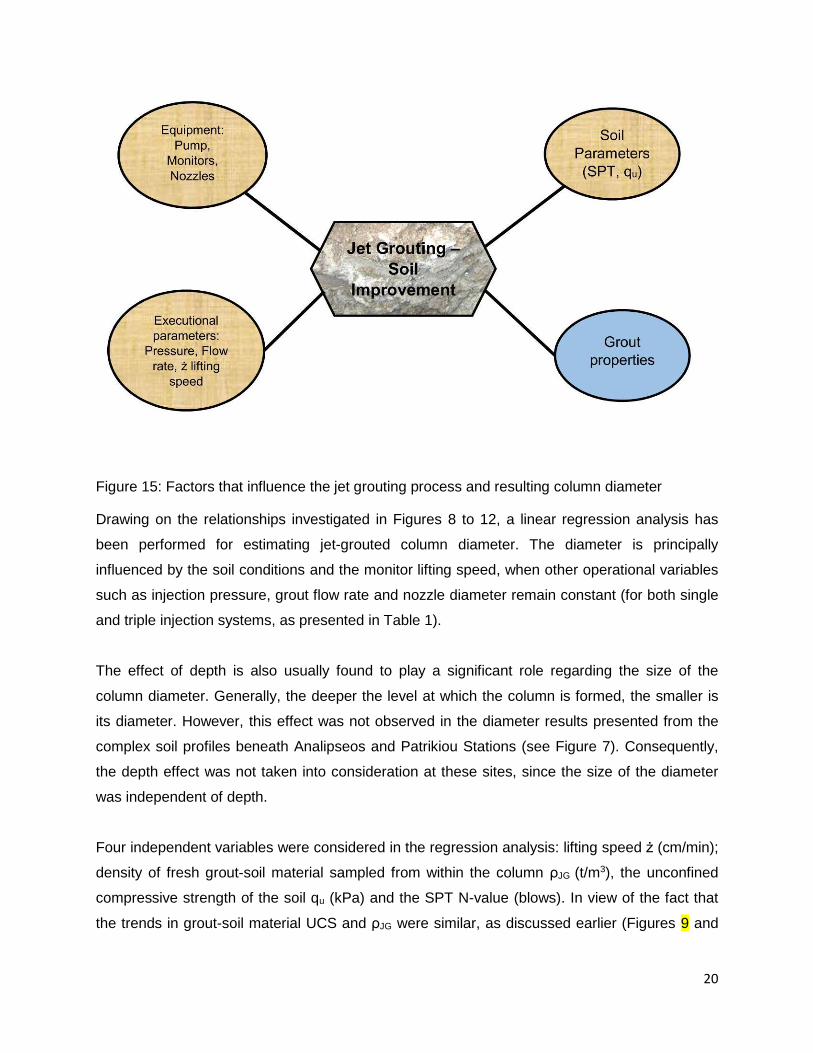
conditions. The various factors that influence the resulting diameter are depicted in Figure 15.
20
Figure 15: Factors that influence the jet grouting process and resulting column diameter
Drawing on the relationships investigated in Figures 8 to 12, a linear regression analysis has
been performed for estimating jet-grouted column diameter. The diameter is principally
influenced by the soil conditions and the monitor lifting speed, when other operational variables
such as injection pressure, grout flow rate and nozzle diameter remain constant (for both single
and triple injection systems, as presented in Table 1).
The effect of depth is also usually found to play a significant role regarding the size of the
column diameter. Generally, the deeper the level at which the column is formed, the smaller is
its diameter. However, this effect was not observed in the diameter results presented from the
complex soil profiles beneath Analipseos and Patrikiou Stations (see Figure 7). Consequently,
the depth effect was not taken into consideration at these sites, since the size of the diameter
was independent of depth.
Four independent variables were considered in the regression analysis: lifting speed ż (cm/min);
density of fresh grout-soil material sampled from within the column ρJG (t/m3), the unconfined
compressive strength of the soil qu (kPa) and the SPT N-value (blows). In view of the fact that
the trends in grout-soil material UCS and ρJG were similar, as discussed earlier (Figures 9 and
21
10), only ρJG has been included in the regression analysis. Therefore estimated column diameter
can be expressed as a function of the above four independent values.
D = α1 ż + α2 ρJG + α3 qu + α4 SPT
where α1, α2, α3, α4 are regression variables.
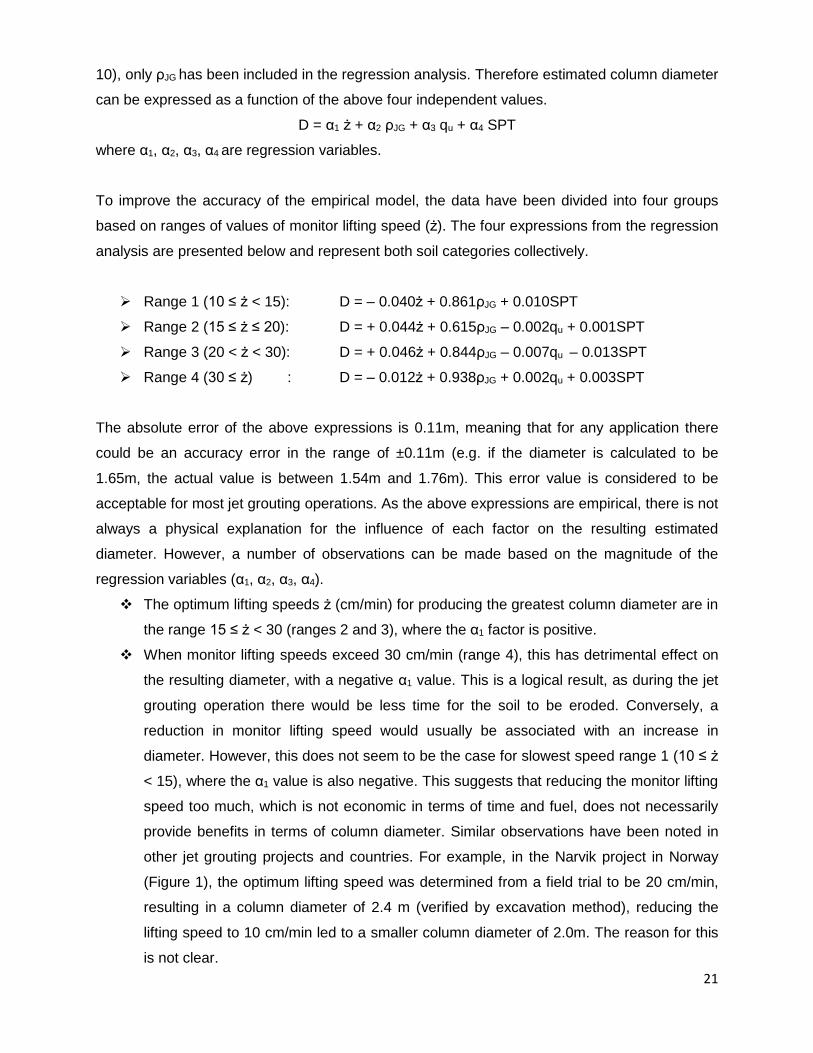
To improve the accuracy of the empirical model, the data have been divided into four groups
based on ranges of values of monitor lifting speed (ż). The four expressions from the regression
analysis are presented below and represent both soil categories collectively.
Range 1 (10 ≤ ż < 15): D = – 0.040ż + 0.861ρJG + 0.010SPT
Range 2 (15 ≤ ż ≤ 20): D = + 0.044ż + 0.615ρJG – 0.002qu + 0.001SPT
Range 3 (20 < ż < 30): D = + 0.046ż + 0.844ρJG – 0.007qu – 0.013SPT
Range 4 (30 ≤ ż) : D = – 0.012ż + 0.938ρJG + 0.002qu + 0.003SPT
The absolute error of the above expressions is 0.11m, meaning that for any application there
could be an accuracy error in the range of ±0.11m (e.g. if the diameter is calculated to be
1.65m, the actual value is between 1.54m and 1.76m). This error value is considered to be
acceptable for most jet grouting operations. As the above expressions are empirical, there is not
always a physical explanation for the influence of each factor on the resulting estimated
diameter. However, a number of observations can be made based on the magnitude of the
regression variables (α1, α2, α3, α4).
The optimum lifting speeds ż (cm/min) for producing the greatest column diameter are in
the range 15 ≤ ż < 30 (ranges 2 and 3), where the α1 factor is positive.
When monitor lifting speeds exceed 30 cm/min (range 4), this has detrimental effect on
the resulting diameter, with a negative α1 value. This is a logical result, as during the jet
grouting operation there would be less time for the soil to be eroded. Conversely, a
reduction in monitor lifting speed would usually be associated with an increase in
diameter. However, this does not seem to be the case for slowest speed range 1 (10 ≤ ż
< 15), where the α1 value is also negative. This suggests that reducing the monitor lifting
speed too much, which is not economic in terms of time and fuel, does not necessarily
provide benefits in terms of column diameter. Similar observations have been noted in
other jet grouting projects and countries. For example, in the Narvik project in Norway
(Figure 1), the optimum lifting speed was determined from a field trial to be 20 cm/min,
resulting in a column diameter of 2.4 m (verified by excavation method), reducing the
lifting speed to 10 cm/min led to a smaller column diameter of 2.0m. The reason for this
is not clear.
22
Regarding the density of the fresh jet-grout material (from wet sampling), for all ranges,
the higher its value, the greater the column diameter. This contradicts the trend
observed in Figure 10 and is a consequence of combining the other three influencing
factors together. As values of ρJG are in all cases greater than 1 t/m3 (logically, as this is
the density of water) and the associated regression variables, α2, are approaching unity,
this suggests that the ρJG factor has a strong influence on the diameter estimated from
these empirical formulations.
The α3 and α4 regression variables are generally small and so have a lesser influence on
the estimated diameter. This is especially so for α3, which is omitted for the first range
since it was less than 10-3. Low α3 regression variable values are appropriate as the
unconfined compressive strength test is often not suitable for intact soils (especially
those with large granular content).
The above expressions can be readily used to obtain rough estimates of the diameter of jet-
grouted columns constructed in soils with comparable characteristics to those of the two sites
from the Thessaloniki Metro discussed here. Similar formulations can be produced for other
sites after establishing the soil characteristics (from the ground investigation carried out in
advance of the works), using the operational variables planned for the site and the density of
fresh grout-soil material measured on site. The approach is intended as a practical way of
estimating the diameter of jet-grouted columns and is recommended for major projects where
normally field trials are carried out prior to the main works.
Conclusions
A vital component of quality control in jet grouting operations is the accurate estimation of
resulting jet-grouted column diameters. There are several methods available for determining the
column diameter: the excavation and inclined core drilling methods are the most accurate and
reliable but also require much more time and cost compared with other methods.
Many of the alternative methods are promising but, as there is only limited experience with
many of them, they need to be tested / calibrated for the specific site conditions using field trials
where either excavation or inclined drilling methods are also being used, unless there is past
experience and data for similar ground conditions. The thermic method was used extensively, in
conjunction with the inclined core drilling method, on two construction sites forming part of the
Thessaloniki Metro. Correlating the data from both has demonstrated that the thermic method
works well, predicting diameters to within ±12% of the actual diameter, over-predicting in
clay/silt soils and under-predicting in sand/gravel soils.
23
Potential relationships between the measured / estimated column diameters and factors such as
monitor lifting speed (ż), soil strength (qu and SPT N-value), and the density (ρJG) of fresh grout-
soil material (sampled from the wet column) have been investigated. A common finding is that
diameters are always marginally larger when the jet grouting is performed in predominantly
granular soils, all other factors being equal. Linear regression analyses were performed,
combining the factors, to develop empirical expressions for estimating column diameter of the
form:
D = α1 ż + α2 ρJG + α3 qu + α4 SPT
where α1, α2, α3, α4 are the regression variables. The expressions developed, for the two sites
and the jet grouting operational variables adopted on them, provide a reasonably accurate (the
accuracy error being in the range of ±0.11m) and practical way of estimating the diameter of jet-
grouted columns at minimum cost during an extended production sequence.
For new sites, information relating to the soil can be obtained in advance from the ground
investigation reports and the jet grouting operational variables are given (being selected by the
jet grouting contractor). Therefore the main input variable required from site is the density of the
fresh grout-soil material which can be readily determined using wet sampling techniques.
Suitable expressions can then be developed from field trials performed prior to commencement
of the main works where column diameters are measured using one or more methods
(calibrated against excavation or inclined coring methods).
Acknowledgements
The authors are grateful to the following for their assistance and co-operation in producing the
paper: Attiko Metro engineers; the engineers and workers of the AIS Joint Venture (AEGEK
Construction, Impregilo and SELI); and Keller Group colleagues.
References
ASCE (American Society of Civil Engineers), (2016). Jet Grouting Guide Specification, Jet
Grouting Task Force of the Geo-Institute of ASCE Grouting Committee. Rston, VA, USA..
BSI (2001) EN 12716: Execution of special geotechnical works – jet grouting. BSI, London, UK.
Brandstätter, C., Lackner, R. & Mang, A. H. (2002). Bestimmung von Materialeigenschaften
zementgebundener Werkstoffe mittels Temperaturemessungen: Anwendung im Rahmen des
Düsenstrahlverfahrens [Evaluation of properties of cementitious materials by means of
24
temperature measurements:Application to jet grout]. Bauingenieur Magazine, February 2002,
77(2), pp. 51-57.
Frappin, P. and Vernhes, J.D. (2011). CYLJET, An innovative method for jet grouting column
diameter measurement. Proceedings - 1st International Conference on Engineering Geophysics,
Al Ain, United Arab Emirates, European Association of Geoscientists & Engineers (EAGE),
Houten, the Netherlands, pp. 67-74.
Getec, M. (2004). Messchirm Anleitungen. Keller Grundbau GmbH Bochum, Germany (in
German).
Leible, C. (2011). Reichweitenmessung nach dem Hydrophonverfahren Bilfinger Berger
Spezialtiefbau GmbH, Bruchsal Technical Project Report (in German).
Lesnik, (2003). Ermittlung der Reichweite beim Düsenstrahlverfahren unter Berücksichtigungder
Herstellparameter und der Bodeneigenschaften mittels Rücklaufanalyse“,. PhD Thesis, Graz:
Gruppe Geotechnik Graz, Institute for Geotechnical Engineering and Soil Mechanics, Graz
University of Technology, Graz, Austria (in German).
Meinhard, K., Hopfgartner, M., Lackner, R. & Adam, D. (2010). Thermisches
berechnungsmodell zur reichweitenermittlung von DSV-Säulen. In Tagungsbeiträge der 6.
Ősterreichischen Geotechniktagung mit Vienn-Terzaghi Lecture. Wien Austria (in German).
Modoni, G., Croce, P. & Mongiovi, L. (2006). Theoretical modelling of jet grouting.
Geotechnique 56, Volume 5, pp. 335-347.
Schorr, C., Traegner, R. & Micciche, R. (2007). Evaluating in-situ jet grout column diameters
utilizing wave analysis. Proceedings: Geo-Denver 2007, GSP 168 Grouting for Ground
Improvement: Innovative Concepts and Applications, Febraury 18-21, 2007, pp. 165-178.
TMC JV (Thessaloniki Metro Construction JV) (2010). Geotechnical Longitudinal Section.
TTMC JV AIASA, Thessaloniki, Greece.
TMC JV (2012). Patrikiou Station/Trumpet Jet Grotuing Tsting Program – Evaluation report.
TTMC JV AIASA, Thessaloniki, Greece.
Wang, Z.-F., Shen, S.-L. & Yang, J. (2012). Estimation of the Diameter of Jet-Grouted Column
based on Turbulent Kinematic Flow Theory, Proceedings of the Fourth International Conference
on Grouting and Deep Mixing, New Orleans, Louisiana, United States, February 15-18, 2012,
pp. 246-257.

25
List of figures
Figure 1: Jet Grouting double system – Grout pressure 40,000 kPa (Narvik project, Norway, 2012)
Figure 2: Excavated trial jet-grouted column (Thessaloniki Metro, December 2013)
Figure 3: Inclined core drilling for column diameter estimation
Figure 4: Cores from inclined drilling (Thessaloniki Metro, June 2012)
Figure 5: Thessaloniki Metro Map (Red Line-Basic Line)
Figure 6: Plan of Analipseos Station, showing areas of jet grouting operations
Figure 7: Variations in STP N-value and UCS (qu) with depth and approximate soil profile for (a) Analipseos Station and (b) Patrikiou Station
Figure 8: Relationship between jet-grouted column diameter and monitor lifting speed
Figure 9: Relationship between jet-grouted column diameter and grout-soil UCS from specimens prepared from wet sampling
Figure 10: Relationship between jet-grouted column diameter and jet grouting material (wet sampling) density
Figure 11: Relationship between jet-grouted column diameter and in-situ SPT N-values
Figure 12: Relationship between jet-grouted column diameter and soil UCS qu values
Figure 13: Statistical analysis of Dcoring/Dthermic for clay/silt soil category (average = 0.88, standard deviation = 0.20)
Figure 14: Statistical analysis of Dcoring/Dthermic for sand/gravel soil category (average = 1.12, standard deviation = 0.23)
Figure 15: Factors that influence the jet grouting process and resulting column diameter