estimated displaced products and ratios of distillers co
TRANSCRIPT

future science group 911ISSN 1759-726910.4155/BFS.10.60 © 2010 Future Science Ltd
Biofuels are promoted globally in an effort to address energy security concerns and reduce the carbon inten-sity of transportation fuels. In the USA, under the Energy Independence and Security Act (EISA) of 2007, the US government has mandated a maximum production of 15 billion gal of corn ethanol by 2015. As part of this rule, EISA requires a 20% reduction in the lifecycle GHG emissions of corn ethanol (produced in new or expanded facilities) compared with conven-tional gasoline [101]. In addition to the federal mandate, several complementary low-carbon fuel standards have been approved or are under development at the state level. In April 2009, the California Low Carbon Fuel Standard program mandated a minimum 10% reduc-tion in the fuel intensity of all transportation fuels sold in California by 2020 [1]. Similarly, the European Commission has also adopted biofuel requirements [2]. All of these regulatory developments require lifecycle assessment (LCA) of biofuels.
One critical issue that affects biofuel LCAs is the way of dealing with the co-products of biofuels. An accurate account of the energy and emissions of biofuel
co-products is essential to achieve reliable LCA results for biofuels. Several methods can be used to deal with biofuel co-products [3]. In the displacement method, the products to be displaced by nonfuel products are determined first. The energy use and emissions burdens of producing the otherwise displaced products are then estimated. The estimated energy use and emissions bur-dens are credits that are subtracted from the total energy use and emission burdens of the biofuel production cycle.
In the GHGs, regulated emissions and energy use in transportation (GREET) model developed by Argonne National Laboratory, we incorporate, together with other methods, the displacement method for corn ethanol LCA for both wet milling and dry milling ethanol plants. Since dry milling corn plants account for the majority of US corn ethanol production, it is important to evaluate and regularly update the production and utilization of the co-products from dry mills. Thus, in this article, we examine the displacement method for dry milling plants, which produce distillers’ co-products. Two parameters are key to the displacement method of dry milling corn ethanol plants: the yield of distillers’ co-products in the
Biofuels (2010) 1(6), 911–922
Estimated displaced products and ratios of distillers’ co-products from corn ethanol plants and the implications of lifecycle ana lysis
Salil Arora1, May Wu†1 & Michael Wang1
Displacement of conventional animal feed components – corn, soybean meal and urea – by distillers’ co-products has been revisited. We developed the distillers’ co-products displacement ratios at different levels: the feedlot level, the US market level and the composite US and export market level, in order to provide a relevant estimate for ethanol plant operators, stakeholders and decision makers. As expected, corn is still the single largest component in the conventional beef cattle diet to be displaced by distillers’ co-products, followed by soybean meal. On average, 1 kg of wet distillers’ grains could displace 1.313 kg of corn and urea together, when it is used as a substitute in the diet of beef cattle; for distillers’ dried grain with solubles, 1.271 kg of corn and urea can be displaced per kg of distillers’ dried grain with solubles fed to beef cattle. Uncertainties about the consistency of reported data, export market and emerging new co-products are discussed. In addition, the use of distillers’ co-products as an animal feed may have an indirect impact on the lifecycle assessment of corn ethanol.
Review
1Argonne National Laboratory, Center for Transportation Research, Energy System Division, Lemont, IL 60439, USA †Author for correspondence: Tel.: +1 630 252 6658; E-mail: [email protected]
For reprint orders, please contact [email protected]

Biofuels (2010) 1(6) future science group912
Review Arora, Wu & Wang
plants and the types and amounts of conventional animal feeds that are to be displaced by distillers’ co-prod-ucts. In the GREET1.8c version, released in March 2009, we used the information that we developed in Arora et al. [102].
Since 2008, several major publica-tions have examined co-product dis-placement in the corn ethanol LCA. Liska et al. reported a corn ethanol LCA based on a newly developed bio-fuel energy systems simulator (BESS) model [4]. In addition to crop cultiva-tion and ethanol production stages, the model includes cattle feedlot operation and anaerobic digestion in the LCA system boundary. The distillers’ co-products displacement benefits, therefore, contain diet sub-stitutions and energy and emission savings associated with feedlot opera-tions. The LCA results for various
types of corn dry mills showed increased GHG emission benefits with the use of wet distillers’ grains (WDG) and closed loop anaerobic digestion. Bremer et al. analyzed current corn ethanol co-product use in livestock diets, based on US Midwest livestock industry surveys and lit-erature reviews [5]. The displacement ratio for distillers’ dried grain with solubles (DDGS), modified distillers’ grain with solubles and wet distillers’ grain with solubles were developed for beef cattle, dairy cattle and swine for Iowa, Nebraska, Texas and a midwest average. The study reported a weighted average of dietary substitution of 0.91 kg of corn, 0.225 kg of soybean meal (SBM) and 0.036 kg of urea per kg of distillers’ co-products on a dry matter basis. These results were incorporated into the BESS model.
In this study, we re-examined the distillers’ co-prod-ucts displacement ratios for beef cattle, dairy cattle and swine. In addition, we included a distillers’ co-products dietary substitution for poultry. Furthermore, we con-sidered the US consumption and export market for distillers’ co-products to estimate the displacement ratios for ethanol plants and for the US market and the export feed market. Results from this study will be incorporated into the GREET model.
Distillers’ grains & solubles from dry milling corn ethanol plants & their depositionThe dry milling process is the dominant technology for ethanol production in the USA. It accounts for 90% of the 12 billion gal/year estimated production capacity as of May 2010 [6], with corn being the exclusive
feedstock for more than 91% of this production volume. Recent estimates developed by the US Environmental Protection Agency (EPA) project that the majority (92%) of EISA-mandated starch ethanol in 2015 would be produced from corn-fed plants [101].
Distillers’ co-products are an important co-product from the dry milling of corn ethanol plants. Financially, distillers’ co-products are crucial for maintaining the profitability of the plants, since it provides 10–20% of the plant revenues [7,103]. From the lifecycle perspective, the use of distillers’ co-products as animal feed plays an important role in accurately determining lifecycle energy use and GHG emissions for corn ethanol. Historically, distillers’ co-products available from the beverage indus-try have been fed mainly to ruminants (beef and dairy cattle). However, with increased amounts of distillers’ co-products available from the corn ethanol industry, its use has been expanded to monogastric animals (swine and poultry). Table 1 presents historical and projected US ethanol and distillers’ grains production volumes.
Due to the large quantities of distillers’ grains being introduced into domestic and export feed markets, sev-eral national and state-level surveys have reported the typical inclusion level and amount of distillers’ grains fed by animal type in the USA [8,104,105]. However, none of these surveys report data regarding annual consump-tion of distillers’ grains by animal type. The Renewable Fuels Association regularly provides rough estimates of the consumption of distillers’ grains by animal type in the domestic animal industry (Table 2).
The theoretical maximum US market size for distill-ers’ grains has been estimated to be 46.8 million met-ric tons [7,106]. As indicated in Table 1, 34.9 million met-ric tons of US distillers’ co-products could be produced by 2015, if the 15-billion gal congressional mandate for etha-nol is reached. As expected, all of that amount (shown in Table 3) could potentially be consumed in US markets at the current reported inclusion levels in various animal types, with a 100% market penetration. Large and con-centrated feeding facilities make it possible to further increase the market size for distillers’ co-products [107].
As reported in the National Agricultural Statistics Service – US Department of Agriculture survey [104], dairy and beef cattle operations have the most experi-ence with feeding distillers’ grains (ranging from 9 years for dairy cattle to 5 years for beef cattle) and can feed them as dry distillers’ co-products or WDG [105]. The feeding of WDG can be challenging because of the higher transportation costs (thus limiting feedlots to be situated within 100 miles of ethanol plants) and the short shelf life (~ 7–10 days). However, the produc-tion of WDG leads to a significant reduction in drying energy costs for ethanol plants, and their use reportedly improves performance for beef cattle. In Nebraska, the
Key terms
Corn ethanol: Ethanol produced from corn through a fermentation process.
Lifecycle assessment: Evaluation of the effects that a product, process or service has on the environment for its entire lifespan.
Dry milling: A corn fractionation process where corn germ and corn bran are removed from the corn kernel and the remaining portion of corn kernel is further fermented to yield ethanol.
Distillers’ co-products: Co-products from distillation of cereal grains for ethanol production. Distillers’ co-products can be a substitute for conventional animal feed (e.g., corn, soybean meal and urea).
Distillers’ co-products displacement ratio: Ratio of the amount of distillers’ co-products to the amount of conventional animal feed that is displaced by the distillers’ co-product for livestock.
Estimated displaced products and ratios of distillers’ co-products Review
future science group www.future-science.com 913
synergies achieved from reduced energy costs for etha-nol plants and better performance for beef cattle have resulted in a higher feedlot size for operations that use ethanol co-products. Such feedlots are located short distances from ethanol plants. A 2007 industry survey found approximately one third of the dry mills surveyed sold co-products as WDG [108].
A comparison of the nutrient composition and low heating values of various corn ethanol co-products and conventional feeding ingredients is presented in Table 4. As can be seen in the table, there is a significant variation in nutrient composition among the different corn ethanol co-products and conventional animal feeds. Commercial livestock operations rely on professional animal nutri-tionists to formulate nutritionally balanced feed rations. Therefore, the amount of conventional feed ingredients replaced when feeding co-products can vary significantly by animal type and co-product type. However, obtaining commercial feed composition data can be difficult, as they are considered proprietary information. The feeding of these co-products has been researched extensively in academia. Thus, for the current study, we relied mainly on peer-reviewed and conference publications, as well as co-product surveys. In the sections below, we briefly review the data sources and methodology to calculate the displacement ratios of various corn ethanol co-products.
Methodology & assumptionsThe displacement ratios of distillers’ co-products were determined by following several steps. First, the US total distillers’ co-products production and consump-tion were characterized, and the market share split for WDG and dry distillers’ grains (DDG) and the consumption by animal type were determined on the basis of available statistics. These market share data for the dry distillers’ co-products and WDG were split
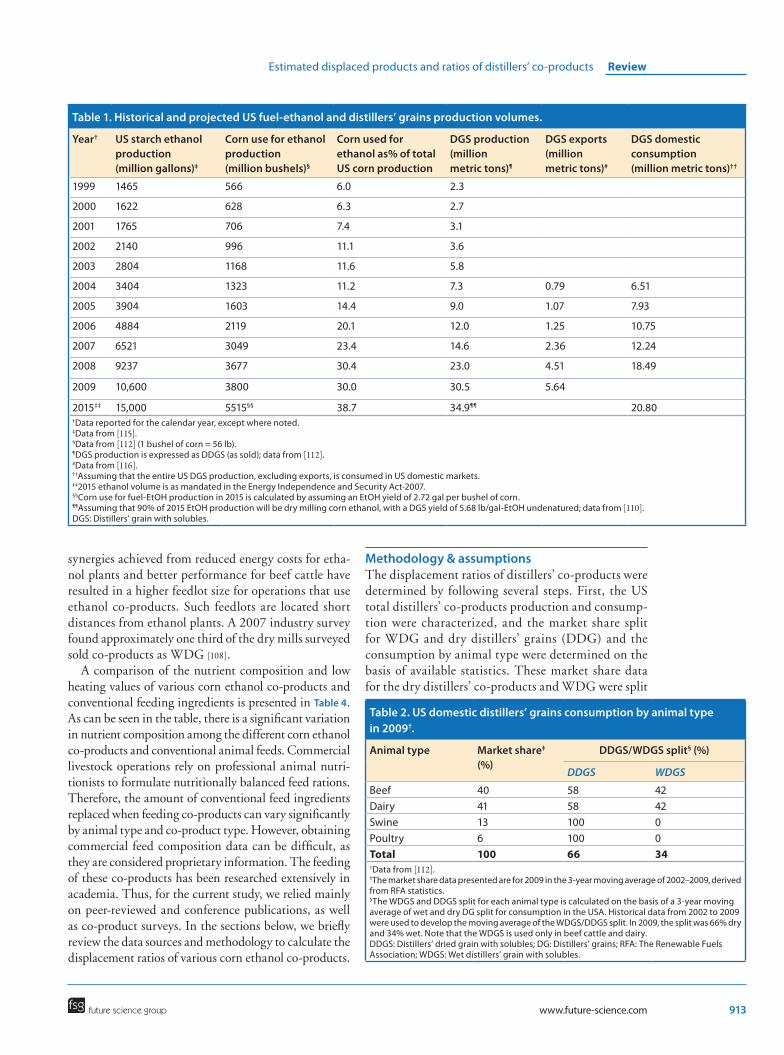
Table 1. Historical and projected US fuel-ethanol and distillers’ grains production volumes.
Year† US starch ethanol production (million gallons)‡
Corn use for ethanol production (million bushels)§
Corn used for ethanol as% of total US corn production
DGS production (million metric tons)¶
DGS exports (million metric tons)#
DGS domestic consumption (million metric tons)††
1999 1465 566 6.0 2.3
2000 1622 628 6.3 2.7
2001 1765 706 7.4 3.1
2002 2140 996 11.1 3.6
2003 2804 1168 11.6 5.8
2004 3404 1323 11.2 7.3 0.79 6.51
2005 3904 1603 14.4 9.0 1.07 7.93
2006 4884 2119 20.1 12.0 1.25 10.75
2007 6521 3049 23.4 14.6 2.36 12.24
2008 9237 3677 30.4 23.0 4.51 18.49
2009 10,600 3800 30.0 30.5 5.64
2015‡‡ 15,000 5515§§ 38.7 34.9¶¶ 20.80†Data reported for the calendar year, except where noted.‡Data from [115].§Data from [112] (1 bushel of corn = 56 lb).¶DGS production is expressed as DDGS (as sold); data from [112].#Data from [116].††Assuming that the entire US DGS production, excluding exports, is consumed in US domestic markets.‡‡2015 ethanol volume is as mandated in the Energy Independence and Security Act-2007. §§Corn use for fuel-EtOH production in 2015 is calculated by assuming an EtOH yield of 2.72 gal per bushel of corn. ¶¶Assuming that 90% of 2015 EtOH production will be dry milling corn ethanol, with a DGS yield of 5.68 lb/gal-EtOH undenatured; data from [110].DGS: Distillers’ grain with solubles.
Table 2. US domestic distillers’ grains consumption by animal type in 2009†.
Animal type Market share‡ (%)
DDGS/WDGS split§ (%)
DDGS WDGS
Beef 40 58 42Dairy 41 58 42Swine 13 100 0Poultry 6 100 0Total 100 66 34†Data from [112].‡The market share data presented are for 2009 in the 3-year moving average of 2002–2009, derived from RFA statistics.§The WDGS and DDGS split for each animal type is calculated on the basis of a 3-year moving average of wet and dry DG split for consumption in the USA. Historical data from 2002 to 2009 were used to develop the moving average of the WDGS/DDGS split. In 2009, the split was 66% dry and 34% wet. Note that the WDGS is used only in beef cattle and dairy.DDGS: Distillers’ dried grain with solubles; DG: Distillers’ grains; RFA: The Renewable Fuels Association; WDGS: Wet distillers’ grain with solubles.

Biofuels (2010) 1(6) future science group914
Review Arora, Wu & Wang
and the distillers’ co-products consumption by animal type from 2002 to 2009 was then calculated to derive a 3-year moving average, and the 2009 data of the moving average was used in this study. Second, the diet substitution recommended from various studies and by animal performance, with the inclusion of dry (12% moisture content) and wet (65% moisture content) distillers’ co-products, was reviewed. The lifetime
performance of the animals when fed with various portions of distill-ers’ co-products was compared with the performance without distillers’ co-products. Surveys, statistical data and expert opinions were used in selecting distillers’ co-products inclusion levels.
Next, displaced dietary compo-nents for each animal type were cal-culated at the chosen inclusion rate on the basis of research data. The amount was then normalized by the total distillers’ co-products used to derive the displacement ratios of corn, SBM and urea as a result of distillers’ co-products inclusion in the animal diet for dry and wet dis-tillers’ co-products, separately. The resultant feedlot-level displacement
ratios were then aggregated according to the dry and wet distillers’ co-products market share for each ani-mal type. Furthermore, the displacement values for all four animal types were aggregated on the basis of US distillers’ co-products consumption by animal type to derive the US consumption-based distillers’ co-products displacement ratios. Similarly, the distillers’ co-products export market was analyzed to determine a displace-ment ratio for each animal type and feed component. The domestic consumption value was aggregated with export figures by animal type to estimate the US and export consumption-based distillers’ co-products dis-placement ratio. In addition, the shortened cattle life-time as a result of the distillers’ co-products diet was examined; methane emission from enteric fermenta-tion in the reduced cattle lifetime was estimated, which accounts for the avoided GHG emissions. For the cur-rent study, the US market size for distillers’ grains was determined by using the concept of grain consuming animal units developed by the Economic Research Service [9,109]. Note that distillers’ co-products would not be likely to displace vitamins, microminerals, amino acids and other supplements. These requirements were not covered by this study.
� Distillers’ co-products feeding in beef cattleIn the diets of commercial beef cattle, corn is used as the primary grain (energy source), supplemented with a small quantity of SBM and cottonseed meal as the pro-tein source and urea as the nonprotein nitrogen source [8]. The distillers’ co-products would generally replace SBM or cottonseed meal first and then corn and urea in beef cattle diets. Since most previously published studies for beef cattle focus on the displacement of corn
Table 3. US distillers’ grains market size†.
Animal type GCAU (million units)
Feed per GCAU‡ (metric ton/unit)
DGS inclusion (%)
Potential DGS usage at different levels of market penetration
(1000 metric tons)
50% 100%
Dairy 10.18 3.95§ 20 4020 8041Beef 19.61 2.16 20 4236 8472
40 8472 16,943Swine 26.12 2.16 10 2821 5642Poultry 30.35 2.16 10 3278 6556Total market size¶
18,591 37,181
†The DGS market size is represented as DDGS (as a fed/sold basis); data from [108].‡Includes energy feeds (i.e., grains), oilseed meals (i.e., SBM), animal-protein feeds, grain-protein feeds and other by-product feeds. Excludes feeding of distillers’ grains because of data unavailability. No roughage (i.e., alfalfa hay) is included.§Corrected on the basis of the feed composition reported in [12], assuming an annual feeding period of 300 days and a feed-dry matter content of 85.5%. Represents the corn and SBM portion of the diet. Total feed per dairy-GCAU is 8.21 metric tons/year.¶40% inclusion for beef.DDGS: Dried distillers’ grain with solubles; DGS: Distillers’ grain with solubles; GCAU: Grain consuming animal units; SBM: Soybean meal.
Table 4. Properties of corn ethanol co-products and conventional animal feeds†.
Animal feed/other co-products
Dry matter (%)
Crude protein (%)
Fat (%) Low heating valves (Btu/lb)
Corn‡ 85.5 8.3 3.9 8059§
SBM¶ 87.8 50.1 1.4 7951#
DDGS†† 89.2 30.8 11.2 8703‡‡
WDGS§§ 30.0 36.0 15.0 8703¶¶
d-DDGS## 92.3 34.0 2.7 8703¶¶
HP-DDG¶ 87.5 48.6 3.4 8703¶¶
CGF††† 89.4 23.8 3.5 7954‡‡‡
Corn germ¶ 90.6 17.2 19.1 NACorn oil 16,000§§§
†Crude protein, fat content and low heating values, presented on dry matter basis.‡Data from [35].§Data from [117].¶Data from [20].#Data from [36].††Data from [118].‡‡ Data from [119].§§ Data from [11]. Note that WGS composition varies. The value shown above is an example, not necessarily typical.¶¶Assuming the same low heating values as DDGS on a dry matter basis.##Data from [31].†††Data from [37].‡‡‡ Data from [120].§§§Assuming the same low heating valves as soybean oil.DDGS: Distillers’ dried grain with solubles; d-DDGS: Deoiled DDGS; SBM: Soybean material; WDGS: Wet distillers’ grain with solubles.

Estimated displaced products and ratios of distillers’ co-products Review
future science group www.future-science.com 915
and urea and data for SBM and cottonseeds meal were limited, in this study we concentrate on corn and urea displacement. The distillers’ co-products inclusion in beef diets leads to a significant improvement in animal performance (faster weight gain) compared with the control diet [10].
In this study, the lifetime dry matter intake and nutri-tional data at the selected inclusion level for DDGS (20%) and WDG (40%) were used to calculate the amount of corn and urea being displaced per unit of DDGS used, as compared with cattle fed a conventional diet. The diet and performance data were based on a comprehensive review by Klopfenstein et al. [10]. The displacement of beef cattle diets that use DDGS and WDG at the feedlot level is presented in Table 5. These values were further aggregated by considering the mar-ket share split between DDGS and WDG for beef cattle (58.3 and 41.7%, respectively; Table 6) to estimate US consumption and export (Tables 6 & 7).
However, distillers’ co-products feeding in beef cattle is impacted by the type of grain processing method. Vasconcelos and Galyean reported steam flaked corn (SFC) as the most common processing method for corn [8]. One study on the use of dried-distillers’ co-products in SFC diets suggested that the inclusion of dried-distillers’ co-products and wet-dis-tillers’ co-products at 15% resulted in no performance change [11]. There is a lack of comprehensive stud-ies about the beef cattle diet on corn feed produced from various processing technologies and the impacts of distillers’ co-products inclusion. The literature available for this study mostly centers on dry-rolled corn/high-moisture corn diets for beef cattle.
� Distillers’ co-products feeding in dairy cattleVarious short-term studies (of a 4- or 5-week dura-tion) that evaluate distillers’ co-products inclusion in the diets of dairy cattle have reported an increased milk production with distillers’ co-products inclusion
levels of up to 30%, and an equal replacement of energy (corn grain) and protein (SBM) sources in dairy diets [12–14]. To establish the reproducibility of results obtained from such short-term feeding studies in commercial dairy production, experimental stud-ies were conducted over the entire lactation period of dairy cows for 2 years. These studies observed no difference in the lactation response while dairy cattle were fed a 15% WDG diet and a control diet [15,16]. A comprehensive review of distillers’ co-products feeding in dairy diets by Schingoethe et al. concluded that the dairy responses to wet or dried distillers’ co-products inclusion in the diets were usually considered to be equal, and potentially up to a 30% inclusion rate as dry matter could be used without a detrimental effect [17]. However, other nutritional factors could limit the inclusion level, as additional supplements may be required when a distillers’ co-products of more than 10% is used in the diets. It was therefore recommended that dairy cattle be fed 20% of distillers’ co-products as dry matter.
The literature have reported that both wet and dry distillers’ co-products can be a dietary substitute for corn and SBM for dairy cattle. In this study, a DDGS and WDG inclusion level of 20% in dairy diets was selected. Nutritional data and dry matter intake from Anderson et al. were used to determine a normalized corn and SBM displacement by DDGS and WDG at the feedlot level (Table 5) [12]. The dairy displacement ratios agreed well with data from the BESS model. These values were further aggregated to consider the US consumption by market share of wet and dry distillers’ co-products (Table 6) and the export markets (Table 7).
� Distillers’ co-products feeding in swineThe DDGS (WDG is not used in swine diets) dis-places corn and SBM in the swine diet. Studies were conducted to evaluate swine performance when fed with
Table 5. Distillers’ grain with solubles displacement ratios at the feedlot level†,‡.
Animal type
DDGS inclusion (%)
DDGS displacement ratio§
(kg/kg co-product)WDGS inclusion (%)
WDGS displacement ratio§
(kg/kg co-product)
Corn Soybean meal Urea Corn Soybean meal Urea
Beef 20 1.203 NA¶ 0.068 40 1.276 NA¶ 0.037
Dairy 20 0.445 0.545 0.000 20 0.445 0.545 0.000
Swine 20 0.577 0.419 0.000 0 NA NA NA
Poultry# 10 0.552 0.483 0.000 0 NA NA NA†This table provides the basis for corn ethanol plant operators to estimate co-product displacement ratio and carbon credit for the individual plant.‡A feedlot in this article is defined as a type of animal feeding operation that is used in factory farming for finishing livestock, including beef cattle, dairy, swine, turkeys and chickens.§Dry matter basis. The moisture content is 12% for DDGS and 65% for WDGS.¶Small quantity of SBM was also included in conventional beef diet, which was not analyzed in this estimate.#Assuming an equal market share for laying hens, broilers, and turkeys for the poultry category.DDGS: Distillers’ dried grain with solubles; WDGS: Wet distillers’ grain with solubles.

Biofuels (2010) 1(6) future science group916
Review Arora, Wu & Wang
an inclusion rate of 10% [18–20], 15% [21], 20% [22] and 30% [23,24]. These studies reported equivalent perfor-mance in animals as equal amounts of corn grain and SBM were replaced in swine diets with DDGS, as com-pared with the control group fed with conventional diets. A 2009 review of DDGS use in swine diets by Stein and Shurson [25] covered data from 25 experiments when corn DDGS was included in grower–finisher swine diets, with an improvement in animal performance in four experiments, a reduction in five experiments and no change in 16 experiments. Although this review study recommends that DDGS of up to 30% can be included in grower–finisher swine diets with no change in growth performance, it recognizes that at DDGS inclusion lev-els above 20%, the high fat content of DDGS (espe-cially linoleic acid) can negatively impact meat quality and requires a nutritional adjustment to swine diets a few weeks before the swine are slaughtered. In 2007, the National Agriculture Statistics Service (US Department of Agriculture) survey reported a 10% inclusion level of DDGS in swine diet. However, in the past few years, because of the steep increase in conventional feed (corn and SBM) prices reported by the Economic Research Service (US Department of Agriculture) [108], we have seen increased use of higher levels of DDGS (20–30%)
in grower–finisher swine diets [26, Shurson JC, Pers. Comm.]. In addition to inclusion rate, experts suggest supple-ments of crystalline threonine and trytophan may be necessary when corn and SBM are replaced by DDGS in swine diet.
For the current study, a 20% DDGS inclusion rate was selected for swine diets. Animal diet studies from Widmer et al. [20] and Shurson [26] were gathered. Displacement ratios for SBM and corn derived from these studies were averaged to determine the ratio of corn and SBM displacement per unit of DDGS fed. The results presented in Table 5 are the displacement ratios at the feedlot level. For distillers’ co-products US consumption and export, the displacement ratios are listed in Tables 6 & 7.
� Distillers’ co-products feeding in poultryHistorically, distillers’ co-products have been included at low levels (~ 5%) in poultry diets because of the high variability in the nutritional quality. However, with the availability of distillers’ co-products from new corn ethanol plants, there has been a focus on improving the quality and providing a more consistent co-product. In a 2008 review of distillers’ co-product use in poultry diets by Świątkiewicz and Koreleski, the authors examined
Table 6. Distillers’ grain with solubles displacement ratios for US consumption†.
Animal type Animal share (%)
US market share (%) Displacement ratio for US consumption (combined DDGS/WDGS) (kg/kg DGS)‡
DDGS WDGS Corn Soybean meal Urea
Beef 40 58.3 41.7 1.233 0.055Dairy 40 58.3 41.7 0.445 0.545 0.000Swine 13 100 0 0.577 0.419Poultry§ 6 100 0 0.552 0.483Total weighted average
0.788 0.304 0.022
†The feedlot-level displacement ratios shown in Table 5 were further aggregated with WDGS and DDGS splits for each animal type and US market share by animal type (as specified in Table 2) to derive the displacement ratios for US consumption.‡Dry matter basis. The moisture content is assumed to be 12% for DDGS and 65% for WDGS.§Assuming an equal market share for laying hens, broilers and turkeys for the poultry category.DDGS: Distillers’ dried grain with solubles; WDGS: Wet distillers’ grain with solubles.
Table 7. Composite distillers’ grain with solubles displacement ratios for US consumption and export markets†.
Parameter Market share (%)
Displacement ratio by component, by market(kg/kg co-product)
Corn Soybean meal Urea
US consumption 80.39 0.634 0.244 0.018Export market consumption‡,§ 19.61 0.152 0.060 0.005Aggregated displacement ratio: US and export markets
0.786 0.304 0.023
†The values presented in this table considered the export market and domestic market of distillers’ grain with solubles at 2009, with a 3 year moving average of distillers’ grain with solubles consumption statistics from 2004 to 2009. Data from [112]. Domestic market values are calculated from the aggregated values in Table 6.‡Export market use for distillers’ dried grain with solubles only. Assuming that animal shares of distillers’ dried grain with solubles use in the export market are similar to those in the domestic market. §Assuming that feed composition in the export market is similar to that in the domestic market.

Estimated displaced products and ratios of distillers’ co-products Review
future science group www.future-science.com 917
DDGS use in the diets of broiler, turkey and laying hens [27]. They recommend that DDGS could be included at a 10–15% level in the grower–finisher diets for broiler chickens and turkeys and the diets for laying hens. At this level, DDGS replaces equal amounts of SBM and corn in poultry diets, between the poultry fed with distillers’ co-products and the control. However, since replacing SBM protein with DDGS protein affects the levels of some important dietary amino acids, the review further suggests increasing the levels of lysine in poultry diets. In addition, including a supplement of crystalline threonine and tryptophan may also be necessary when corn and SBM are replaced by DDGS. WDG is not currently used in the poultry diet.
The DDGS inclusion rates of 10% for turkeys [28], 10% for broilers [29] and 10% for laying hens [30] were selected for this study. The dry matter intake and nutri-tional value in various growth stages for turkeys, broil-ers and laying hens were analyzed; the amount of corn and SBM displaced by DDGS was determined, and the results were further weighted by the feeding days to derive a final displacement ratio at the feedlot level. Table 5 shows the displacement ratio used by poultry at the feedlot level. The displacement ratios, including US consumption and export for poultry, are presented in Tables 6 & 7. We assume an equal market share for laying hens, broilers and turkeys under the poultry category.
� Enteric fermentation methane creditMethane (CH
4) emissions from enteric fermentation
in animals are a significant source of GHG emissions, thus accounting for 34% of the total agriculture-related GHG emissions in the USA [110]. The CH
4 emissions
due to enteric fermentation from beef and dairy cattle represent 72 and 23% of the total enteric fermentation CH
4 emissions, respectively. Since feeding of distill-
ers’ co-products improves animal performance for beef cattle, these animals remain in commercial feedlots for a shorter period, compared with animals on a con-ventional diet, before being delivered to the slaughter house. Fewer days in the feedlot results in less CH
4
emissions during their lifetime.For the current study, the GHG savings were calcu-
lated based on EPA emission factors (grams per head of beef cattle per year) for enteric fermentation. The grams of CH
4 emissions avoided due to the shortened beef cattle
lifetime were normalized by the amount of distillers’ co-products included in the diet to derive the amount of CH
4 avoided per gram of distillers’ co-products used.
This value was then aggregated by the wet and dry distillers’ co-products market split for beef cattle. The resultant CH
4 emission savings, in g CH
4/g distillers’
co-products, were expressed as a CO2 equivalent by using
the global warming potential (GWP) of CH4.
Results & discussion � Results
The displacement ratios of distillers’ co-products have been calculated on the basis of the methodology and data sources, as already described. The main focus of the study was to develop accurate displacement ratios of distillers’ co-products, which is currently the domi-nant co-product from the corn dry milling process. To provide a relevant estimate for stakeholders, etha-nol plant operators and decision makers, we intended to develop displacement ratios at different levels: the feedlot level, the US market level and the composite US and export market level. The ethanol plant opera-tor can estimate the plant co-product credit by using feedlot-level displacement ratios, which are specific to distillers’ co-products type and animal type. The dis-placement ratios for the US and export markets can be useful for stakeholders and decision makers for estimat-ing national averages, conducting market analyses and supporting business decisions.
The distillers’ co-products displacement ratio esti-mated at the feedlot level (Table 5), shows that the amount of conventional ingredients (i.e., corn, SBM and urea) that are replaced varies significantly by ani-mal type and by type of distillers’ co-products, either wet or dry. As expected, corn is the major dietary com-ponent displaced by distillers’ co-products in beef cat-tle – approximately three-times that for dairy cattle. At the same distillers’ co-products inclusion rate, poultry demonstrates an equivalent level of corn and SBM dis-placement, compared with swine. The WDG displaces more corn than DDGS for beef cattle, primarily because of a higher inclusion rate and greater cattle performance on WDG. Therefore, an ethanol plant neighboring with a beef cattle feedlot, which can use its entire distill-ers’ co-products production as WDG, could displace 1.313 kg of corn and urea together, per kg WDG (dry basis) used. For DDGS, 1.271 kg of corn and urea can be displaced per kg of distillers’ co-products used for beef. Individual ethanol plants produce and market their co-product differently, depending on their loca-tion, transportation requirements, available animal operations for distillers’ co-products and other factors. As such, the feedlot level displacement values presented in Table 5 provide a basis for plant operators to estimate carbon credits for individual plants. Furthermore, the table offers a comparison of different choices of distill-ers’ co-products use, both from a lifecycle perspective and to assist decision-making regarding corn ethanol GHG emission reduction potentials.
There is a notable change in dairy feed displacement ratio from a previous estimate [102]. In that estimate, data from primarily short-term studies were used, which indicate a large performance gain when dairy cattle are

Biofuels (2010) 1(6) future science group918
Review Arora, Wu & Wang
fed with DDGS. As the improved performance trans-lates to a shortened growth period before livestock reach the desirable weight, there would be additional savings associated with the displaced feed, which could lead to higher displacement for dairy (0.731 kg corn/kg DGS and 0.633 kg SBM/kg DGS) and a higher overall dis-placement ratio for beef, dairy and swine (1.271 kg/kg US consumption). As previously stated, a thorough review of extended feeding studies for dairy found that a majority of the data merged, leading to the conclusion that using DDGS and WDG in a dairy diet does not yield a clear gain in performance. Without the perfor-mance gain for dairy, the overall displacement ratio for US consumption would be 1.115 kg/kg (Table 6).
We further incorporated the wet and dry distillers’ co-products split and the US market share for each animal type into the US-centered displacement ratios. Table 6 presents composite distillers’ co-products displacement ratios for US consumption in different animal opera-tions. A total of 1 kg of distillers’ co-products displaces 1.115 kg of corn, SBM and urea when beef cattle, dairy, swine and poultry are included at the US-consumption level. As indicated in Table 1, the US ethanol industry is expected to produce 34.9 million metric tons of distillers’ co-products by 2015. Such production could potentially displace 27.5 million metric tons of corn, 10 million metric tons of SBM (~380 million bushels of soybeans), and 0.77 million metric tons of urea, if all the distillers’ co-products is used in the feedlot industry in the USA. The corn saving translates to 1061 million bushels of corn, which could supply approximately 20% of the corn required for ethanol production in 2015 (Table 1). Note that in the projection for the distillers’ co-products mar-ket in 2015, Table 1 considers the US market only, which is approximately 80% of the entire current distillers’ co-products market. Thus, the actual market potential for distillers’ co-products could be larger.
The distillers’ co-products displacement ratios for the export market were calculated by assuming the same market share and feed composition as that for US domestic market and considering only DDGS consumption, since WDG is impractical in the export market. Table 7 presents aggregated displacement ratios
for the domestic and export markets. The distillers’ co-products export market has increased rapidly in the past few years, but it is still quite volatile and not yet mature. Therefore, displacement ratios for the export market would be sensitive to market fluctuations and frequent updates would be necessary.
The enteric fermentation credit from beef cattle oper-ation was estimated. The credit accounts for avoided CH
4 emissions that result from a gain in performance
or reduced feeding days in the cattle lifetime due to the distillers’ co-products diet, from which less enteric fer-mentation occurs and thereby less CH
4 is emitted from
the feedlot. Table 8 shows avoided CH4 emissions at the
feedlot level and the US consumption level. The CH4
reduction is expressed as CO2 equivalence converted by
a GWP of 25. With current knowledge and understand-ing of CH
4 emissions from enteric fermentation during
the lifetime of beef cattle, an ethanol dry mill that sells distillers’ co-products to a beef cattle feedlot could result in a 0.059–0.084 kg CO
2-equivalent emission credit for
each kilogram of distillers’ co-products fed (dry basis) (Table 8). Similar to the data shown in Table 5, the GHG emission credit ratios shown in Table 8 provide ethanol plant operators with a tool to estimate the carbon credit for the ethanol produced from their facility. Assuming a distillers’ co-products yield of 5.68 pounds (lb)/gal of un-denatured ethanol [111], a 100 million gallons/year dry mill at its full capacity, on average, can avoid 19,100 met-ric tons of CO
2 emissions when it sells the entire distillers’
co-products production to a beef cattle feedlot. In 2009, the USA produced 30.5 million metric tons of distillers’ co-products. With an 80.4% US consumption, a 40% use in beef cattle, and an aggregated CH
4 credit ratio,
this amount of distillers’ co-products use in the US mar-ket could eliminate the 725,760 metric tons of CO
2 that
would otherwise be emitted.
� UncertaintiesOne main objective of this study was to provide updated relevant estimates for corn ethanol LCA so that the dis-tillers’ co-products energy and emission credits for corn ethanol could be determined. However, several uncer-tainties could significantly change the credit allocated
to distillers’ co-products:
� Verifiable distillers’ co-products production and consumption data;
� Changes in the quantity and composition of manure due to feeding of distillers’ co-products;
� New co-products from corn ethanol production.
Table 8. Methane emission avoidances from reduced enteric fermentation by distillers’ grain with solubles substitution†.
DDGS‡
(kgCO2 equiv/kg DGS fed)WDGS‡
(kgCO2 equiv/kg DGS fed)Aggregated DDGS and WDGS§
(kgCO2 equiv/kg DGS fed)
Feedlot 0.084 0.059 0.074†For beef cattle only. The avoided methane emissions are the result of performance gain, or reduced feeding days in the cattle lifetime due to DGS substitution, from which less enteric fermentation occurs; thereby, less methane is emitted from the feedlot. The methane reduction is expressed as CO2 equivalence converted by a global warming potential of 25.‡Estimated on the basis of a 20% inclusion for DDGS and 40% for WDGS, as indicated in Table 5 (DGS as a dry basis).§The US market share is 58.3% for DDGS and 41.7% for WDGS, as indicated in Table 6.DDGS: Distillers’ dried grain with solubles; WDGS: Wet distillers’ grain with solubles.

Estimated displaced products and ratios of distillers’ co-products Review
future science group www.future-science.com 919
Verifiable distillers’ co-products production & consumption dataIn our study, distillers’ co-products production data were obtained from industry sources [112]. Since 2007, the US Census Bureau has reported the production volumes of corn co-products produced in dry and wet milling plants. A summary of these data are presented in Table 9 [113]. These production volumes are lower than those reported directly by industry (shown in Table 1) and include the significant production of intermediate co-products, such as dry distillers’ grains, dry distillers’ solubles and corn distillers’ solubles (combining DDG and DDS produces DDGS, while a mix of WDG and corn distillers solubles produces WDG). In addition, these data also indicate a lower WDG market share than that reported by industry (Table 2). In the past, US fuel ethanol industry surveys have reported a wide variation in the yield and nutrient profiles of distillers’ co-products and other co-products [31].
On the consumption side, our study assumed that the entire US production, minus exports, is consumed in the domestic market. The past ethanol co-product surveys have reported industrial inclusion rates in US animal diets, but none of these surveys reported cumulative co-product consumption by the entire animal feeding sector (such as industrial beef feed-lots) [8,104,105]. As shown in Table 5, the distillers’ co-products displacement ratios by animal type can vary significantly, which in turn can influence the corn ethanol LCA results.
Changes in quantity & composition of manure due to feeding of distillers’ grainsIn our study, we included the credit for reduced enteric fermentation due to improved animal performance for some animals fed on distillers’ co-products. However, the effects of changes in manure composition and quantity were not considered. The CH
4 emissions
from enteric fermentation and manure management represent approximately 1.7 and 0.6% of total US GHG emissions, respectively, while nitrous oxide emissions from manure manage-ment represent approximately 0.2% of total US GHG emissions [110]. A 2007 study showed that the inclu-sion of high-fiber ingredients, such as distillers’ co-products (10% inclusion rate), in poultry diets lowers the total ammonia emissions by approximately 50%, mainly because of the decrease in manure pH [32]. These reductions, however, must be confirmed in real-world
animal feeding operations. The impacts that the feed-ing of distillers’ co-products will have on changes in the enteric fermentation and the manure management emissions of various animal feeding operations are still being evaluated.
New co-products from corn ethanol productionThere are uncertainties regarding the new co-prod-ucts from the future technology mix for starch etha-nol production. The new dry milling technologies, such as corn fractionation and corn oil extraction, have focused on process energy reductions and the production of new co-products with a better market value, including high-protein dry distillers’ grains (HP-DDG), corn gluten feed (CGF; produced by mixing de-oiled germ, bran, and syrup), corn germ, de-oiled DDGS (d-DDGS), and corn oil [114]. These new co-products have either different feeding values compared with conventional distillers’ co-products (for d-DDGS, HP-DDG, CGF and corn germ) or a different use (corn oil as a potential feedstock for biodiesel production). Data on the use and displace-ment of these new co-products were not available at the time of this study.
� Indirect effects of using distillers’ grainsThe system boundary for the current corn ethanol LCA typically includes raw material production, corn farming, transportation of raw materials and the final product, ethanol production and combustion in motor vehicles. The use of distillers’ co-products as an animal feed may impact processes outside this sys-tem b oundary. One possible indirect effect is briefly discussed below.
Steam flaked corn is the most common process-ing method used before including corn in beef cattle diets. It is used in all major feeding regions of the USA, except in the midwest, where a combination of DRC and HMC is used in feedlots [8]. However, the
Table 9. Annual corn ethanol co-products production as reported by the US Census Bureau†.
Year Distillers’ grains production (million metric tons)‡
Market share (%)
Wet distillers’ grain with solubles
Distillers’ dried grain with solubles
Distillers’ dried grains
Distillers’ dried solubles
Condensed distillers’ solubles
2007 12.8 23.0 52.4 21.4 1.2 2.1
2008 17.5 24.2 54.0 20.2 0.0 1.6
2009 18.2 21.1 56.3 20.9 0.2 1.5†Data from [113].‡The DGS production is expressed as DDGS (as sold). The US Census Bureau reports on as-sold production volumes of WDGS (70% moisture assumed); DDGS (10% moisture assumed); distillers’ dried grains (10% moisture assumed); distillers’ dried solubles (10% moisture assumed); and condensed distillers’ solubles (66% moisture assumed).

Biofuels (2010) 1(6) future science group920
Review Arora, Wu & Wang
steam-flaking of corn is an energy-intensive process with significantly higher energy inputs of electricity and natural gas [33]. Until recently, the feedlot indus-try has been able to absorb the higher energy costs of flaking corn because of the significant improvement in animal performance when SFC is included, compared with DRC/HMC-based diets [34]. However, with the inclusion of distillers’ co-products in beef cattle diets (20%), the difference in animal performance between feeding the SFC-based diet and DRC/HMC-based diet is reduced, thus, providing the feed industry with an incentive to switch from SFC-based diets to DRC/HMC-based diets. The possibility of such a switch suggests a need to allocate the reduction in energy inputs for the feed industry in the assessment of the corn ethanol life cycle as a result of the switch from SFC to DRC/HMC diets.
Conclusions & future research needsUpdated displacement ratios of distillers’ co-products have been developed at different levels: the feedlot level, the US market level, and the composite US and
export market level. The results presented in Tables 5–7 provide relevant estimates for the individual eth-anol plants, stakeholders and decision makers. The results show that distillers’ co-products displace sig-nificant quantities of corn grains and SBM, as well as small amounts of urea, in commercial animal feeding operations. The GHG emission avoidance as a result of reduced enteric fermentation of beef cattle on the distillers’ co-products diet is estimated for the ethanol plant and the US corn ethanol industry. Compared with previous estimates, we see the feedlot industry increasing its adoption of the distillers’ co-products diet in both the amount and the spread. Considering the significant variation in co-product credits with the individual type of animal and type of distillers’ co-products product, reports about co-product produc-tion volumes and nutrient profiles are a necessity and should occur regularly. Finally, with regard to con-sumption, surveys that detail consumption by animal industry type, inclusion levels, typical feed composi-tion and animal performance while livestock are fed on ethanol co-products are also essential.
Executive summary
Introduction � The way of dealing with the co-products of biofuels is a critical issue that affects biofuel life-cycle analysis, which is required by the
renewable fuel standard and other state legislations. Distillers’ grains & solubles from dry milling corn ethanol plants & their deposition
� All of the distillers’ dried grain with solubles produced can potentially be consumed in US markets at the current reported inclusion levels and with a 100% market penetration, if the Energy Independence and Security Act’s mandate has been reached by 2015.
� Distillers’ dried grain with solubles usage increases dramatically in past few years to displace conventional feed ingredient, which demands frequent revisit of the displacement ratios for corn ethanol life-cycle analysis. This study is an update of the 2008 displacement ratio estimate.
Methodology & assumptions � This ana lysis relies on published literature and recent reviews of animal feeding studies. It considered animal market share, distillers’ dried
grain with solubles and wet distillers’ grains market split, inclusion rate of distillers’ dried grain with solubles or wet distillers’ grains in the diet and animal performance.
� Distillers’ dried grain with solubles and wet distillers’ grains inclusion rate in the diet: 20% for beef cattle, 20% for dairy cattle, 20% for swine and 10% poultry when fed with distillers’ dried grain with solubles; 40% for beef and 20% for dairy when fed with wet distillers’ grains. Displaced conventional feed ingredients include corn, soybean meal and urea.
Results & discussion � Distillers’ dried grain with solubles displacement of conventional feed ingredient is estimated at three levels: livestock feedlot level, US
consumption market level and composite US and export market level. � Feeding beef cattle with the co-products has the largest benefit by displacing 1.271–1.313 kg conventional feed per kg co-product and
avoided 0.074 kg CO2 eq. greenhouse gas emissions per kg co-product. � Displacement ratio of 1.115 kg/kg co-product for the US market means approximately 20% of corn required for corn ethanol production
can be saved by the usage of distillers’ dried grain with solubles to displace conventional animal feed in 2015. � Uncertainties of the ana lysis can be caused by distillers’ co-products production and consumption data, changes in the quantity and
composition of manure due to feeding of distillers’ co-products and new co-products from corn ethanol production. Conclusions & future research needs
� Distillers’ co-products displace significant quantities of corn grains and soybean meal, as well as small amounts of urea in commercial animal feeding operations. The feedlot industry is increasing its adoption of the distillers’ co-products diet in both the amount and the spread.
� Co-product production volumes, nutrient profiles and consumption surveys are a necessity and should occur regularly.

Estimated displaced products and ratios of distillers’ co-products Review
future science group www.future-science.com 921
BibliographyPapers of special note have been highlighted as:n of interest
1 California Air Resource Board. Proposed Regulation to Implement the Low Carbon Fuel Standard. Volume 1. Staff Report: Initial Statement of Reasons. 374 (2009).
2 European Commission. Directive 2009/28/EC of the European Parliament and of the Council of 23 April 2009 on the Promotion of the Use of Energy from Renewable Sources and Amending and Subsequently Repealing Directives 2001/77/EC and 2003/30/EC. Official J. European Union 16–62 (2009).
3 Wang M, Huo H, Arora S. Methods of dealing with co-products of biofuels in lifecycle analysis and consequent results within the US context. Energy Policy DOI:10.1016/j.enpol.2010.03.052 (2010). (Epub ahead of print).
4 Liska AJ, Yang H, Bremer VR et al. Improvements in life cycle energy efficiency and greenhouse gas emissions of corn-ethanol. J. Industrial Ecology 13, 58–74 (2008).
5 Bremer VR, Liska AJ, Klopfenstein TJ et al. Emissions savings in the corn-ethanol life cycle from feeding co-products to livestock. J. Environ. Qual. 39, 472–482 (2010).
n Analyzed current corn ethanol co-product use in livestock diets in US midwest. The displacement ratio for distillers’ dried grain with solubles (DDGS), modified distillers’ grain with solubles and wet distillers’ grain with solubles were developed for beef cattle, dairy cattle and swine.
6 US Ethanol Capacity – Shares by Wet Mill vs Dry Mill. Ethanol database maintained by Renewable Fuel Association. (2010).
7 Dhuyvetter KC, Kastens TL, Boland M. The US Ethanol Industry: Where Will it be
Located in the Future? Agricultural Issues Center, University of California, CA, USA (2005).
8 Vasconcelos JT, Galyean ML. Nutritional recommendations of feedlot consulting nutritionists: the 2007 Texas Tech University survey. J. Anim. Sci. 85(10), 2772–2781 (2007).
9 Baker AJ. Estimating feed use: background and issues. Special Article in Feed Yearbook/FDS-1998/April. 34–39 (1998).
10 Klopfenstein TJ, Erickson GE, Bremer VR. Board-invited review: use of distillers’ by-products in the beef cattle feeding industry. J. Anim. Sci. 86(5), 1223–1231 (2008).
n Comprehensive review of DDGS use in beef cattle diet.
11 Depenbusch BE, Loe ER, Sindt JJ et al. Optimizing use of distillers’ grains in finishing diets containing steam-flaked corn. J. Anim. Sci. 87, 2644–2652 (2009).
12 Anderson JL, Schingoethe DJ, Kalscheur KF et al. Evaluation of dried and wet distillers’ grains included at two concentrations in the diets of lactating dairy cows. J. Dairy Sci. 89(8), 3133–3142 (2006).
13 Kleinschmit DH, Schingoethe DJ, Kalscheur KF et al. Evaluation of various sources of corn dried distillers’ grains plus solubles for lactating dairy cattle. J. Dairy Sci. 89(12), 4784–4794 (2006).
14 Janicek BN, Kononoff PJ, Gehman AM et al. The effect of feeding dried distillers’ grains plus solubles on milk production and excretion of urinary purine derivatives. J. Dairy Sci. 91(9), 3544–3553 (2008).
15 Mpapho GS, Mpapho GS, Hippen AR, Kalscheur KF, Schingoethe DJ. Lactational performance of dairy cows fed wet corn distillers’ grains for the entire lactation. J. Dairy Sci. 89, 1811 (2006).
16 Mpapho GS, Hippen AR, Kalscheur KF, Schingoethe DJ. Production responses of dairy cows fed wet distillers’ grains during the transition period and early lactation. J. Dairy Sci. 90, 100 (2007).
17 Schingoethe D J, Kalscheur KF, Hippen AR, Garcia AD. Invited review: the use of distillers’ products in dairy cattle diets. J. Dairy Sci. 92(12), 5802–5813 (2009).
n Comprehensive review of DDGS use in dairy cattle diet.
18 Whitney MH, Shurson GC, Johnston LJ, Wulf DM, Shanks BC. Growth performance and carcass characteristics of grower–finisher pigs fed high-quality corn distillers’ dried grains with solubles originating from a modern midwestern ethanol plant. J. Anim. Sci. 84, 3356–3363 (2006).
19 Stein HH. Distillers’ dried grains with solubles (DDGS) in diets fed to swine. In: HHS-SwineFocus 001. Department of Animal Sciences, College of ACES, University of Illinois at Urbana-Champaign, IL, USA (2007).
20 Widmer MR, McGinnis LM, Wulf DM, Stein HH. Effects of feeding distillers’ dried grains with solubles, high-protein distillers’ dried grains, and corn germ to growing-finishing pigs on pig performance, carcass quality, and the palatability of pork. J. Anim. Sci. 86(8), 1819–1831 (2008).
21 Hill GM, Link JE, Rincker MJ, Kirkpatrick DL, Gibson ML, Karges K. Utilization of distillers’ dried grains with solubles and phytase in sow lactation diets to meet the phosphorus requirement of the sow and reduce fecal phosphorus concentrations. J. Anim. Sci. 86, 112–118 (2008).
22 Wilson JA, Whitney MH, Shurson GC, Baidoo SK. Effects of adding distillers’ dried grains with solubles (DDGS) to gestation and
Future perspectiveDistillers’ dried grain with solubles market penetration in the USA is likely to continue and its usage in swine and poultry diet will increase as the record high price of con-ventional feed ingredients remains. Globally, animal feed demand will continue to grow because of the population growth and a change in diet in less developed countries as it has occured in the past 10 years. As a result, there is a potentially large international DGS market in the foresee-able future. Consequently, the co-product displacement ratios will continue to evolve. It will further be influenced by export market share, feed ingredient it displaces and the livestock it was fed in various countries. The dynamics would have a direct and significant impact on energy and GHG emission results of corn ethanol LCA.
AcknowledgmentsWe thank Zia Haq of that DOE office for his support of this study.
Financial & competing interests disclosureThis study was supported by the US Department of Energy, Assistant Secretary for Energy Efficiency and Renewable Energy, Office of Biomass Program, under contract DE-AC02–06CH11357. The authors have no other relevant affiliations or financial involvement with any organization or entity with a financial interest in or finan-cial conflict with the subject matter or materials discussed in the manuscript apart from those disclosed.
No writing assistance was utilized in the production of this manuscript.

Biofuels (2010) 1(6) future science group922
Review Arora, Wu & Wang
lactation diets on reproductive performance and nutrient balance in sows. J. Anim. Sci. 81(Suppl. 2), 47–48 (2003).
23 Song M, Baidoo SK, Shurson GC, Johnson LJ. Use of dried distillers’ grains with solubles in diets for lactation sows. J. Anim. Sci. 85(Suppl. 2), 97 (2007).
24 Greiner LL, Wang X, Allee G, Connor J. The feeding of dry distillers’ grain with solubles to lactating sows. J. Anim. Sci., 86(Suppl. 2), 63 (2008).
25 Stein HH, Shurson GC. Board-invited review: the use and application of distillers’ dried grains with solubles in swine diets. J. Anim. Sci. 87(4), 1292–1303 (2009).
n Comprehensive review of DDGS use in swine diet.
26 Shurson JC. Impact of distiller’s grains on indirect land use change. Presented at: The National Corn Growers Association Conference. St. Louis, MO, USA, 25–26 August (2009).
n Reviews the recent trend of DDGS use in livestock industry.
27 Świątkiewicz S, Koreleski J. The use of distillers’ dried grains with solubles (DDGS) in poultry nutrition. Worlds Poult. Sci. J. 64(02), 257–266 (2008).
28 Roberson KD. Use of dried distillers’ grains with solubles in growing-finishing diets of turkey hens. Int. J. Poult. Sci. 2(6), 389–393 (2003).
29 Wang Z, Cerrate S, Coto C, Yan F, Waldroup PW. Utilization of distillers’ dried grains with solubles (DDGS) in broiler diets using a standardized nutrient matrix. Int. J. Poult. Sci. 6(7), 470–477 (2007).
30 Roberson KD, Kalbfleisch JL, Pan W, Charbeneau RA. Effect of corn distiller̀ s dried grains with solubles at various levels on performance of laying hens and egg yolk color. Int. J. Poult. Sci. 4(2), 44–51 (2005).
31 Saunders JA, Rosentrater KA. Survey of US fuel ethanol plants. Bioresour. Technol. 100(13), 3277–3284 (2009).
32 Roberts S, Xin H, Kerr BJ, Russell JR, Bregendahl K. Effects of dietary fiber and reduced crude protein on ammonia emission from laying-hen manure. Poult. Sci. 86(8), 1625 (2007).
33 Macken C, Erickson G, Klopfenstein T. The cost of corn processing for finishing cattle. Professional Animal Scientist 22, 23–32 (2006).
34 Zinn R, Owens F, Ware R. Flaking corn: processing mechanics, quality standards, and impacts on energy availability and performance of feedlot cattle. J. Anim. Sci. 80(5), 1145 (2002).
35 White P, Johnson L. Corn: Chemistry and Technology (2nd Edition). White P, Johnson L (Eds). American Association of Cereal Chemists Inc. MN, USA (2003).
36 Huo H, Wang M, Bloyd C, Putsche V. Lifecycle assessment of energy and GHG effects of soybean-derived biodiesel and renewable fuels. Argonne National Laboratory Technical Report, ANL/ESD/08–02, March (2008).
37 National Research Council. Nutrient Composition of Feeds. In: Nutrient Requirements of Dairy Cattle. National Academies Press. 281–314 (2001).
� Websites101 US EPA, Office of Transportation and Air
Quality and Assessment and Standards Division. Renewable fuel standard program (RFS2) regulatory impact analysis (EPA-420-R-10–006). www.epa.gov/OMS/renewablefuels/420r10006.pdf
102 Arora S, Wu M, Wang M. Update of distillers’ grains displacement ratios for corn ethanol lifecycle analysis. www.transportation.anl.gov/pdfs/AF/527.pdf
103 Taheripour F, Hertel TW, Tyner We, Beckman JF, Birur DK. Biofuels and their by-products: global economic and environmental implications. Presented at: American Agricultural Economics Association Annual Meeting. FL, USA (2008).www.gtap.agecon.purdue.edu/resources/download/3974.pdf
104 NASS-USDA. Ethanol co-products used for livestock feed. http://usda.mannlib.cornell.edu/MannUsda/viewDocumentInfo.do?documentID=1756 (Accessed April 2008)
105 Waterbury JA, Mark D, Thoms S, Erickson GE, Klopfenstein TJ. An economic overview of ethanol co-product utilization in Nebraska. www.ianrpubs.unl.edu/epublic/live/ec858/build/ec858.pdf
106 Cooper G. A brief, encouraging look at ‘theoretical’ distillers’ grains markets. Distillers’ Grains Quarterly, First Quarter.www.ethanolproducer.com/dgq/issue.jsp?issue_id=66
n Provides a historical trend of DDGS market.
107 Macdonald JM, Mcbride WD. The transformation of US livestock agriculture: scale, efficiency, and risks. www.ers.usda.gov/Publications/EIB43/
108 Wu M. Analysis of the efficiency of the US ethanol industry 2007. www1.eere.energy.gov/biomass/pdfs/anl_ethanol_ana lysis_2007.pdf
109 ERS-USDA. Feed Grains Database. www.ers.usda.gov/data/feedgrains/
110 US EPA. Inventory of US greenhouse gas emissions and sinks: 1990–2007. www.epa.gov/climatechange/emissions/usinventoryreport.html
111 Mueller S. 2008 National Dry Mill Corn Ethanol Survey. Biotechnol. Lett.www.ilcorn.org/uploads/documents/uploader/327Biotech%20Letters%202008%20Corn%20Ethanol%20Survey.pdf
112 RFA. Industry resources: co-products. www.ethanolrfa.org/industry/resources/co-products/
113 US Census Bureau. M311J – Fats and oils: oilseed crushings. Current Industrial Reports.www.census.gov/manufacturing/cir/historical_data/m311j/index.html
114 Mueller S, Copenhaver K. An analysis of modern corn ethanol technologies. www.erc.uic.edu/PDF/mueller/EthanolPlantTechnologyReport2_1609.pdf
115 Energy Information Administration – US Department of Energy. Annual energy review 2008. www.eia.doe.gov/aer/pdf/aer.pdf
116 Karst K. Market perspectives, 31 July 2009. www.grains.org/market-perspectives/market-perspective-2009-english/1821
117 Pennsylvania State University. Coping with high energy prices: heat energy content of shelled corn. http://energy.cas.psu.edu/energycontent.html
118 University of Minnesota. DDGS nutrient profiles. www.ddgs.umn.edu/profiles.htm
119 Morey RV, Hatfield D, Sears R, Tiffany D. Characterization of feed streams and emissions from biomass gasification/combustion at fuel ethanol plants. Presented at: The 2006 ASABE Annual International Meeting.www.biomasschpethanol.umn.edu/papers/ASABEPaper064180.pdf
120 Agricultural Utilization Research Institute. Agricultural renewable solid fuels data. www.auri.org/research/fuels.pdf