china’s market for distillers
TRANSCRIPT
United States Department of Agriculture
www.ers.usda.gov
A Report from the Economic Research Service
Michael Jewison, [email protected]
Fred Gale, [email protected]
China’s Market for Distillers Dried Grains and the Key Influences on Its Longer Run Potential
FDS-12g-01
August 2012
Contents
Approved by USDA’s World Agricultural
Outlook Board
Introduction . . . . . . . . . . . . . . . 2
Background: The U.S. DDGS Industry and Market . . . . . . . . 3
China: An Important Market for U.S. DDGS Exports . . . . . . 4
China’s DDGS Imports Are Sensitive to Prices . . . . . . . . . . 12
Conclusions . . . . . . . . . . . . . . . 19
References . . . . . . . . . . . . . . . . 21
Abstract
The expansion of corn-based ethanol production in the United States yields a large volume of residual co-products called distillers dried grain with solubles (DDGS) . Most DDGS are utilized in the domestic U .S . market, but Chinese importers seeking raw materials for animal feed have emerged as a significant export market . High feed prices and favorable tax treatment within China stimulated a surge of imports of U .S . DDGS during 2009-11 . China’s potential demand for U .S . DDGS depends on various factors that include the price of corn, Chinese policy, and the availability and price of other substitute feed ingredients, such as the byproducts of grain processing in China (residual products from alcohol production) . Demand is robust, but slower growth in the U .S . supply of DDGS and uncertainties about Chinese policy may constrain growth in exports to China .
Keywords: China, distillers dried grains, corn, exports, feed, ethanol
Acknowledgments
The authors gratefully acknowledge the input and review comments of Lin Hoffman, Edward Allen, Maurice Landes, Donna Roberts, and Mark Jekanowski of USDA’s Economic Research Service (ERS); Jerry Norton of USDA’s World Agricultural Outlook Board; Peter Riley of USDA’s Farm Service Agency; Scott Sindelar, Joshua Lagos, Richard Omeara, Oliver Flake, and Alicia Isom of USDA’s Foreign Agricultural Service; Jerry Shurson of the University of Minnesota; Robert Wisner of Iowa State University; Jacinto Fabiosa of the Food and Agricultural Policy Research Institute; and Alvaro Cordero of the U .S . Grains Council . Editorial guidance was provided by Priscilla Smith and graphic design by Cynthia A . Ray of ERS .
2 China’s Market for Distillers Dried Grains and the Key Influences on Its Longer Run Potential / FDS-12g-01
Economic Research Service/USDA
The rapid expansion of corn use in U .S . ethanol production is well known . Less well known, but also critical to the economics of the industry, are the supply and demand for the residual co-products from ethanol produc-tion, known as distillers dried grains with solubles (DDGS) . Robust export demand from China for DDGS can simultaneously raise the value to U .S . ethanol producers and satisfy the Chinese livestock industry’s hunger for low-cost feed ingredients .
This report examines the recent trends in U .S .-China trade in DDGS and analyzes factors affecting the competitiveness of U .S . DDGS in the Chinese market . The report discusses the role of U .S . DDGS in meeting the nutri-tional needs of Chinese livestock at minimum cost, the scarcity of feed mate-rials in China, trade policy, quality issues, and resistance to imports from Chinese suppliers of competing feed ingredients .
Introduction
3 China’s Market for Distillers Dried Grains and the Key Influences on Its Longer Run Potential / FDS-12g-01
Economic Research Service/USDA
DDGS are the primary co-products in the production of ethanol using the dry-mill process (see box, “What Are DDGS?”) . Approximately 31 percent of each U .S . bushel of corn used in dry-mill ethanol production is left over as DDGS . During the 2010/11 corn marketing year (September-August) U .S . corn dry-mill ethanol producers used 116 .2 million metric tons (mmt) of corn to produce 12 .4 billion gallons of fuel ethanol, resulting in the simultaneous production of 36 .3 mmt of DDGS, which can account for, on average, 20 percent of the typical ethanol plant’s total revenue .1 An additional 0 .9 mmt of DDGS were produced by U .S . beverage distilleries in 2010/11 . Approximately 91 .1 percent of corn ethanol is produced by dry mills; the remainder is from wet mills . The co-products from wet mills include corn gluten feed and corn gluten meal, but not DDGS (Hoffman and Baker, 2010) .
DDGS have emerged to become a useful feed ingredient and an important source of supplementary income for dry-mill ethanol producers . In the United States, DDGS are used primarily for dairy and beef feeding . All livestock and poultry can use the nutrients from DDGS, but beef and dairy cattle (ruminants) can use them more readily than hogs and poultry (monogastrics) (Hoffman and Baker, 2011) . DDGS are cheaper when incorporated wet (distillers wet grains (DWG) contain 65-percent moisture), but higher transport costs and shorter shelf life can be problematic . However, DWG actually improve feed quality in the beef and dairy sector as a result of most rations having low moisture content .
1One metric ton (mt) of corn produc-es 106 gallons of ethanol and 0 .3125 mt of DDGS . Assuming cash prices of $2 .80/gallon for ethanol and $230/mt for DDGS, the resulting total revenue per mt of corn is (106 X $2 .8) + ($230 X 0 .3125) = $368 . Therefore, $72/$368 = 20 percent .
Background: The U.S. DDGS Industry and Market
What Are DDGS?
The term “distillers grains” refers to co-products generated by dry-mill ethanol plants, including distillers wet grains (DWG), distillers dried grains (DDG), distillers wet grains with solubles (DWGS), distillers dried grains with solubles (DDGS), and condensed distillers solubles (CDS) . Unless otherwise specified for the remainder of this report, the term distillers grains will mean distillers dried grains with solubles (DDGS) .
Distillers dried grains with solubles (DDGS) are the primary residual co-product after the starch portion of corn is fermented to produce ethanol . After the corn has been fermented, alcohol is removed by distillation, with the remaining residues then dried . Typically, three types of residual co-products are produced via this process: distillers dried grains, distillers dried solubles, and distillers dried grains with solubles .
Once the fermented corn is distilled, the soluble portion of the residual co-products is condensed by evaporation to make distillers solubles . The solid material remaining from the fermentation residues is distillers grains, and both co-products are dried to produce distillers dried grains (DDG) and distillers dried solubles (DDS), with the former having a higher concentration of nutrients than the latter . In the United States, ethanol plants blend and dry DDS and DDG to get DDGS . The estimate for U .S . production is therefore the total of all three products .
4 China’s Market for Distillers Dried Grains and the Key Influences on Its Longer Run Potential / FDS-12g-01
Economic Research Service/USDA
Most DDGS produced in the United States are used domestically in feed rations for cattle or other livestock . However, feed manufacturers in other countries have shown interest in U .S . DDGS as an economical feed ingredient . China, in particular, with its rising demand for livestock feed and escalating feed costs, has emerged as a significant market . Strong Chinese imports of U .S . DDGS help feed mills in China meet robust feed demand while simultaneously supporting the value of DDGS for the U .S . ethanol industry . Strong markets for DDGS are important to the continued profitability of ethanol production, which in turn supports the demand for U .S . corn .
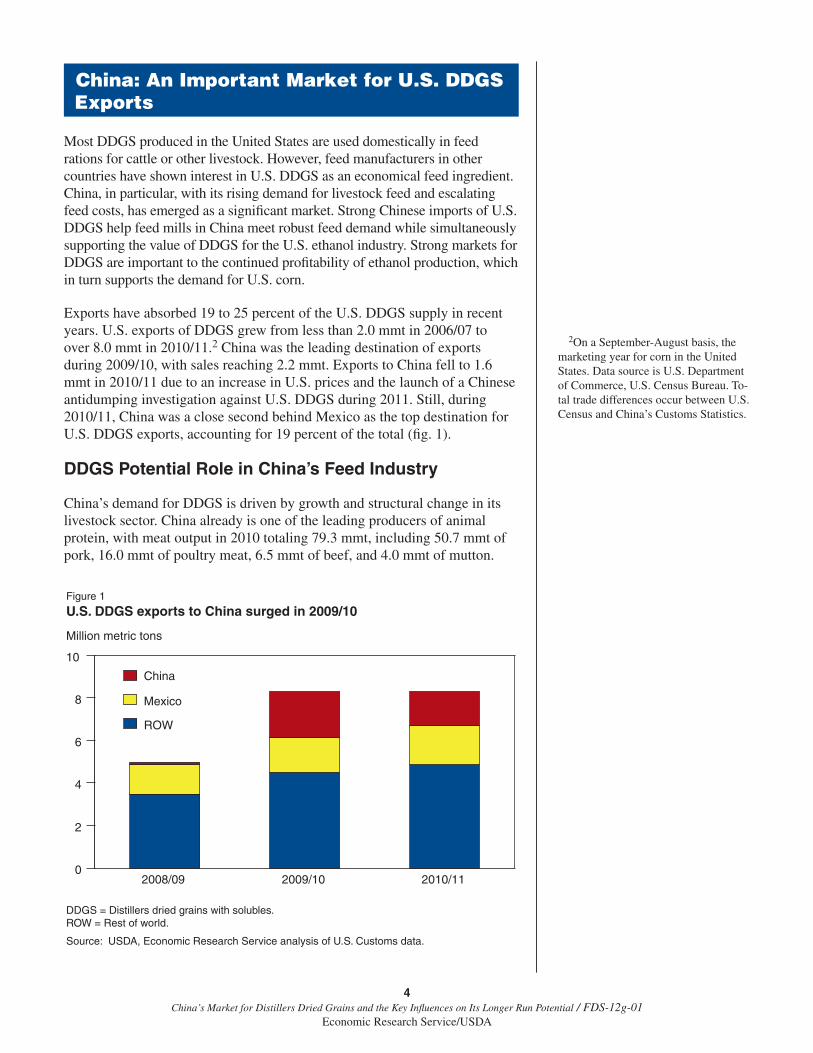
Exports have absorbed 19 to 25 percent of the U .S . DDGS supply in recent years . U .S . exports of DDGS grew from less than 2 .0 mmt in 2006/07 to over 8 .0 mmt in 2010/11 .2 China was the leading destination of exports during 2009/10, with sales reaching 2 .2 mmt . Exports to China fell to 1 .6 mmt in 2010/11 due to an increase in U .S . prices and the launch of a Chinese antidumping investigation against U .S . DDGS during 2011 . Still, during 2010/11, China was a close second behind Mexico as the top destination for U .S . DDGS exports, accounting for 19 percent of the total (fig . 1) .
DDGS Potential Role in China’s Feed Industry
China’s demand for DDGS is driven by growth and structural change in its livestock sector . China already is one of the leading producers of animal protein, with meat output in 2010 totaling 79 .3 mmt, including 50 .7 mmt of pork, 16 .0 mmt of poultry meat, 6 .5 mmt of beef, and 4 .0 mmt of mutton .
2On a September-August basis, the marketing year for corn in the United States . Data source is U .S . Department of Commerce, U .S . Census Bureau . To-tal trade differences occur between U .S . Census and China’s Customs Statistics .
China: An Important Market for U.S. DDGS Exports
Figure 1
U.S. DDGS exports to China surged in 2009/10
Million metric tons
DDGS = Distillers dried grains with solubles.ROW = Rest of world.
Source: USDA, Economic Research Service analysis of U.S. Customs data.
2008/09 2009/10 2010/110
2
4
6
8
10
ROW
Mexico
China
5 China’s Market for Distillers Dried Grains and the Key Influences on Its Longer Run Potential / FDS-12g-01
Economic Research Service/USDA
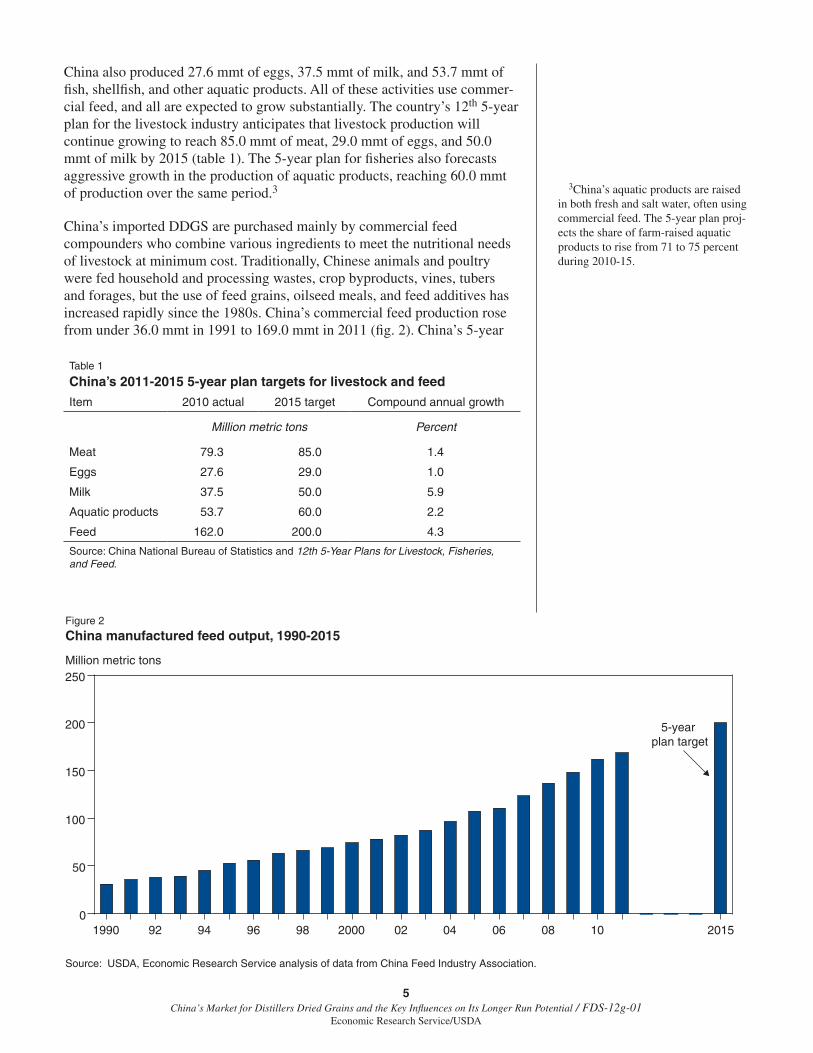
China also produced 27 .6 mmt of eggs, 37 .5 mmt of milk, and 53 .7 mmt of fish, shellfish, and other aquatic products . All of these activities use commer-cial feed, and all are expected to grow substantially . The country’s 12th 5-year plan for the livestock industry anticipates that livestock production will continue growing to reach 85 .0 mmt of meat, 29 .0 mmt of eggs, and 50 .0 mmt of milk by 2015 (table 1) . The 5-year plan for fisheries also forecasts aggressive growth in the production of aquatic products, reaching 60 .0 mmt of production over the same period .3
China’s imported DDGS are purchased mainly by commercial feed compounders who combine various ingredients to meet the nutritional needs of livestock at minimum cost . Traditionally, Chinese animals and poultry were fed household and processing wastes, crop byproducts, vines, tubers and forages, but the use of feed grains, oilseed meals, and feed additives has increased rapidly since the 1980s . China’s commercial feed production rose from under 36 .0 mmt in 1991 to 169 .0 mmt in 2011 (fig . 2) . China’s 5-year
3China’s aquatic products are raised in both fresh and salt water, often using commercial feed . The 5-year plan proj-ects the share of farm-raised aquatic products to rise from 71 to 75 percent during 2010-15 .
Table 1
China’s 2011-2015 5-year plan targets for livestock and feed
Item 2010 actual 2015 target Compound annual growth
Million metric tons Percent
Meat 79.3 85.0 1.4
Eggs 27.6 29.0 1.0
Milk 37.5 50.0 5.9
Aquatic products 53.7 60.0 2.2
Feed 162.0 200.0 4.3
Source: China National Bureau of Statistics and 12th 5-Year Plans for Livestock, Fisheries, and Feed.
Figure 2
China manufactured feed output, 1990-2015
Million metric tons
Source: USDA, Economic Research Service analysis of data from China Feed Industry Association.
1990 92 94 96 98 2000 02 04 06 08 100
50
100
150
200
250
2015
5-year plan target
6 China’s Market for Distillers Dried Grains and the Key Influences on Its Longer Run Potential / FDS-12g-01
Economic Research Service/USDA
plan anticipates that commercial feed production will grow to 200 .0 mmt in 2015 . The projected annual increase of 4 .7 percent (7 .6 mmt) is much faster than the projected growth in livestock and poultry output . This rapid growth reflects a shift from traditional feed sources to commercial feed in China’s livestock industry .
As China’s demand for feed expands, the country’s limited endowment of land and water resources constrains its capacity to expand feed grain produc-tion . Supply is also constrained by China’s tariff and nontariff measures restricting corn imports . As demand outpaces supply, domestic prices of corn, other grains and oilseed meals are rising (Gale et al ., 2012) . Feed companies and livestock producers are seeking alternative ingredients that can reduce feed production costs (Wang, 2011) .
Use of imported DDGS in the Chinese feed industry is still in an early stage . Feed compounders mix a variety of ingredients to produce feed products containing needed energy, protein, amino acids, vitamins, and trace elements at minimum cost . Corn and soybean meal are the predominant ingredients for commercial livestock feed in China, but other major ingredients include wheat and rice bran and hulls; other corn processing byproducts; fish meal; cotton-seed and rapeseed meals; meat, blood and bone meals; and meat processing waste . In 2010, the Ministry of Agriculture estimated that 134 mmt of various raw materials were used by the feed industry, with feed use of DDGS esti-mated at 2 .5 mmt (China Ministry of Agriculture Feed Office, 2011) .
The rising domestic price of corn has spurred Chinese feed compounders to seek alternative raw materials like DDGS that can add energy, protein, B vitamins, phosphorus, and trace elements to animal feed formulations at low cost . News reports and industry sources indicate that Chinese purchasers view DDGS primarily as a substitute for corn (China Feed Trade, 2011; China Aquaculture Network, 2010) .4 China has a long tradition of feeding residue 4A U .S . analysis also observed that
U .S . DDGS are commonly used as a substitute for corn (Ferris, 2011) .
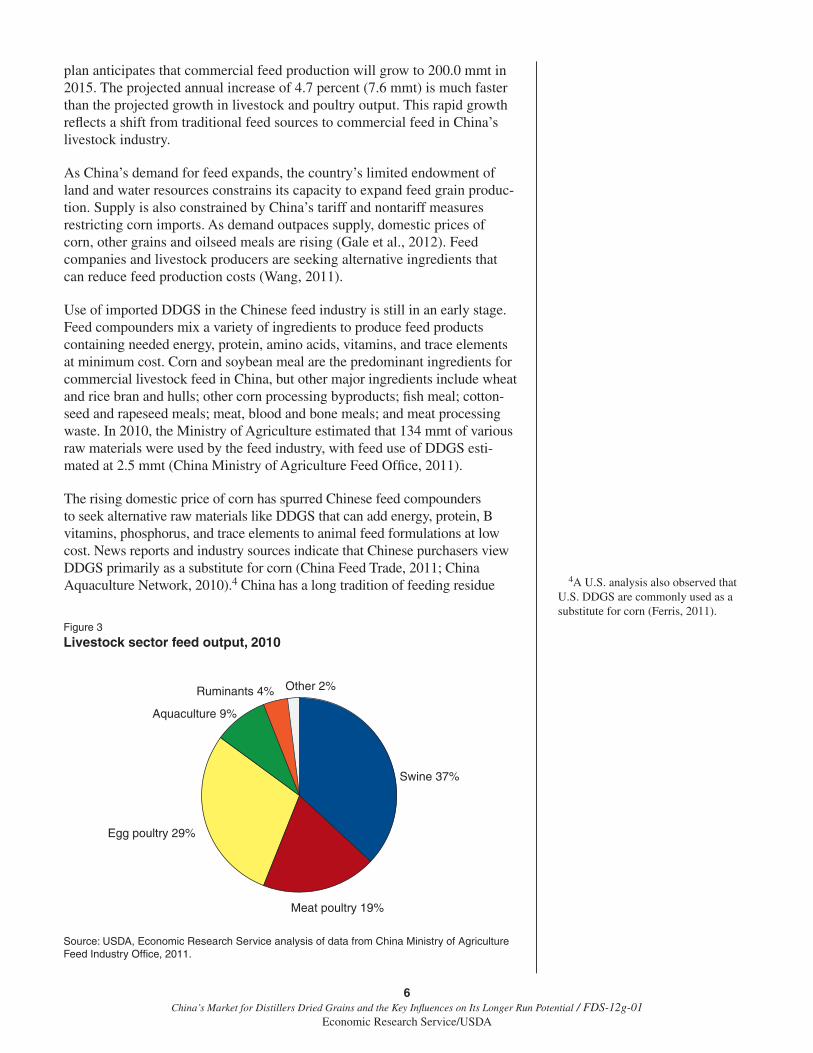
Figure 3
Livestock sector feed output, 2010
Source: USDA, Economic Research Service analysis of data from China Ministry of Agriculture Feed Industry Office, 2011.
Swine 37%
Meat poultry 19%
Egg poultry 29%
Aquaculture 9%
Ruminants 4% Other 2%
7 China’s Market for Distillers Dried Grains and the Key Influences on Its Longer Run Potential / FDS-12g-01
Economic Research Service/USDA
from alcohol distilling to swine, but the practice was traditionally confined to farms near distilleries (Coffing et al ., 1991) . The launch of Chinese grain-based ethanol production in 2004 yielded a domestic DDGS supply used mainly in northern China . Imports of U .S . DDGS increased as Chinese feed prices began rising in recent years, and numerous feed mills in coastal areas began importing DDGS (Nongcai Baodian, 2011; China Corn Net, 2011) .
DDGS can be included in the diets of a variety of livestock and poultry species to varying degrees . In the United States, DDGS are used predomi-nantly for feeding cattle . In China, DDGS use is in an experimental stage and is currently in use primarily in feed for poultry and swine (Nongcai Baodian, 2011) . Chinese feed industry statistics show that nearly half of feed manu-factured in 2010 was destined for poultry (mainly chickens and ducks) that produced either eggs or meat, while 37 percent was fed to swine (see fig . 3) .5 Aquaculture (fish, shrimp, and other shellfish) accounted for 9 percent of China’s manufactured feed . Ruminants (mainly cattle, sheep, and goats) accounted for only 4 percent of manufactured feed output; these animals consume mainly crop residues and forages in China .
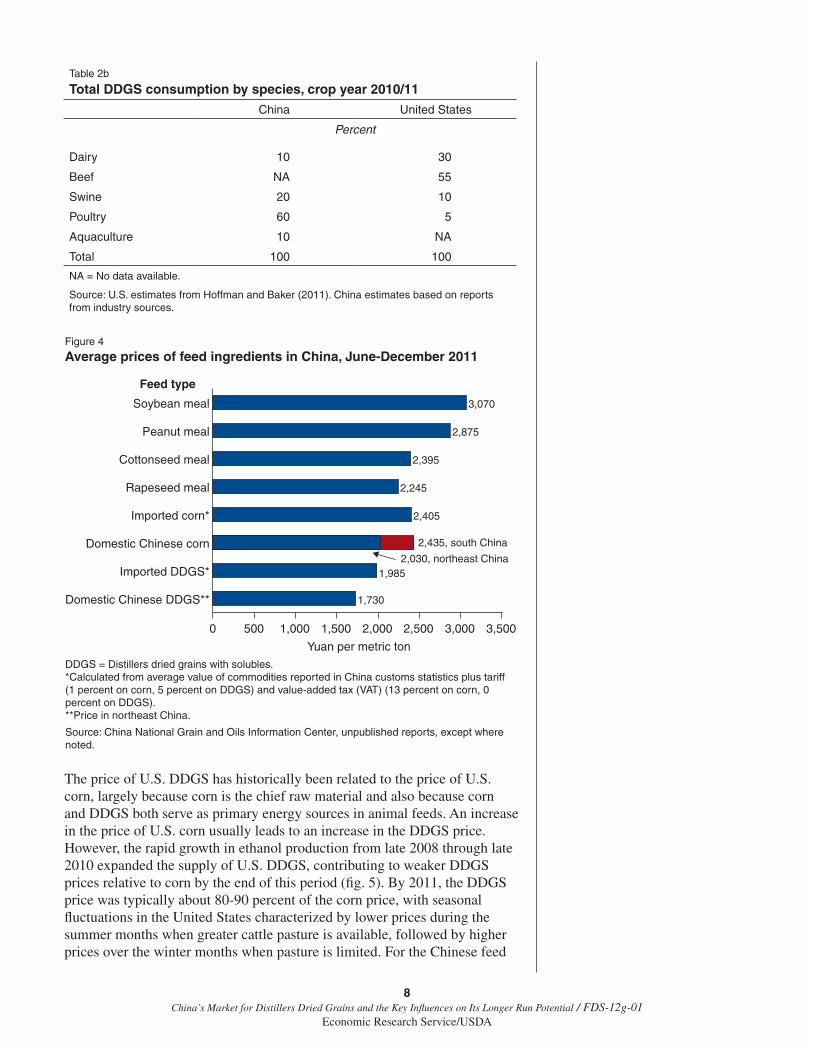
The predominance of monogastrics like poultry and hogs in China limits use of DDGS since these species cannot easily digest the large amounts of fiber in DDGS (Nongcai Baodian, 2011) . In China, DDGS generally is limited to 10-12 percent of hog feed rations and 5-10 percent of poultry rations, but the large number of hogs and poultry in China still represent a large poten-tial market for DDGS . A shift toward large-scale commercial dairy farms following China’s 2008 melamine milk-adulteration incident could create more demand for U .S . DDGS for Chinese dairy feed (tables 2a and 2b) .
Prices and Other Determinants of Competitiveness
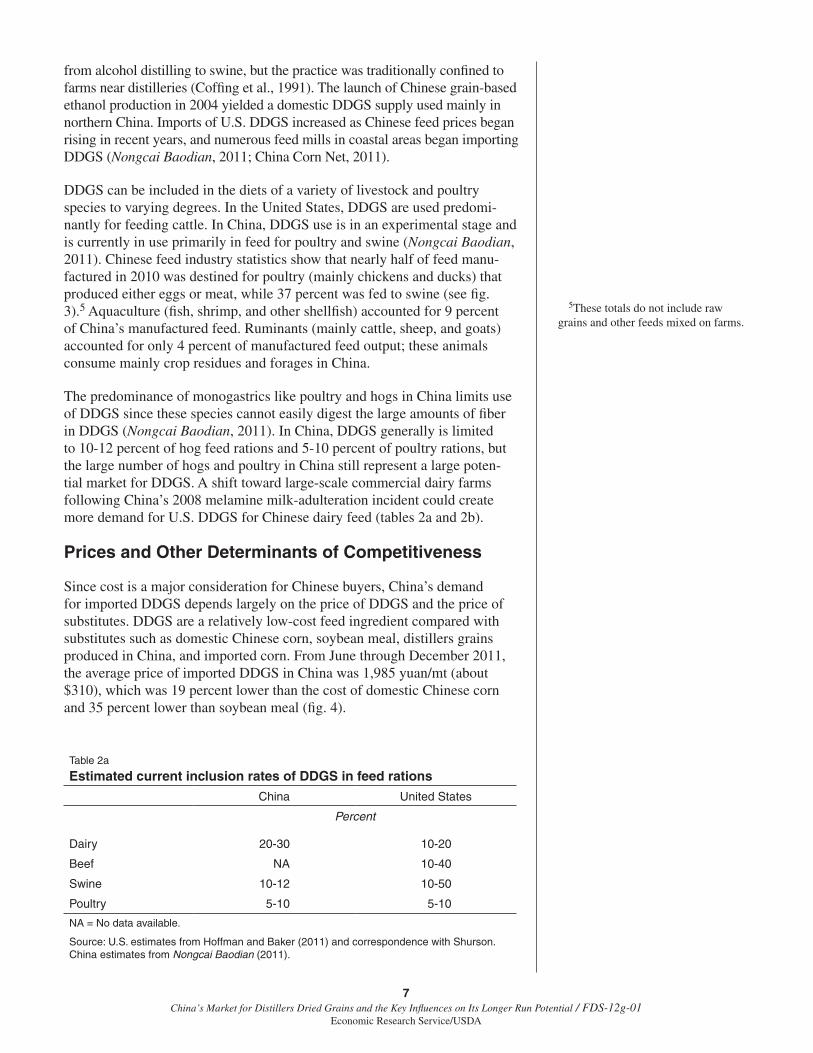
Since cost is a major consideration for Chinese buyers, China’s demand for imported DDGS depends largely on the price of DDGS and the price of substitutes . DDGS are a relatively low-cost feed ingredient compared with substitutes such as domestic Chinese corn, soybean meal, distillers grains produced in China, and imported corn . From June through December 2011, the average price of imported DDGS in China was 1,985 yuan/mt (about $310), which was 19 percent lower than the cost of domestic Chinese corn and 35 percent lower than soybean meal (fig . 4) .
5These totals do not include raw grains and other feeds mixed on farms .
Table 2a
Estimated current inclusion rates of DDGS in feed rations
China United States
Percent
Dairy 20-30 10-20
Beef NA 10-40
Swine 10-12 10-50
Poultry 5-10 5-10
NA = No data available.
Source: U.S. estimates from Hoffman and Baker (2011) and correspondence with Shurson. China estimates from Nongcai Baodian (2011).
8 China’s Market for Distillers Dried Grains and the Key Influences on Its Longer Run Potential / FDS-12g-01
Economic Research Service/USDA
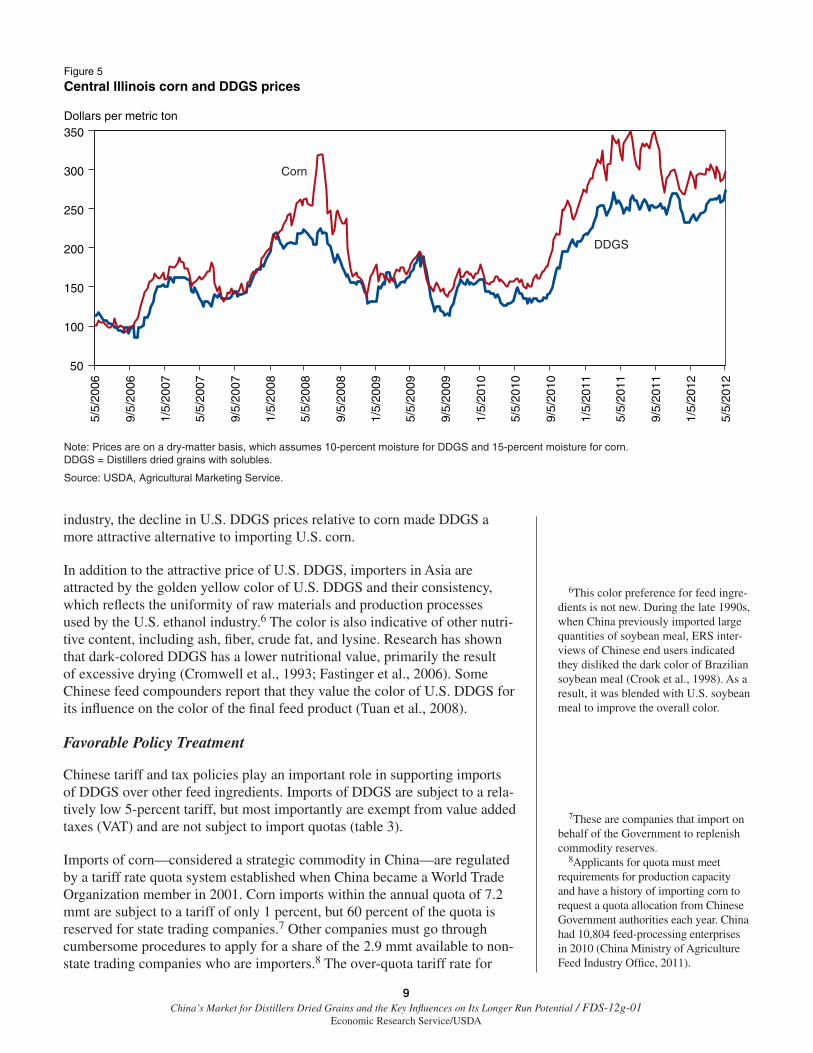
The price of U .S . DDGS has historically been related to the price of U .S . corn, largely because corn is the chief raw material and also because corn and DDGS both serve as primary energy sources in animal feeds . An increase in the price of U .S . corn usually leads to an increase in the DDGS price . However, the rapid growth in ethanol production from late 2008 through late 2010 expanded the supply of U .S . DDGS, contributing to weaker DDGS prices relative to corn by the end of this period (fig . 5) . By 2011, the DDGS price was typically about 80-90 percent of the corn price, with seasonal fluctuations in the United States characterized by lower prices during the summer months when greater cattle pasture is available, followed by higher prices over the winter months when pasture is limited . For the Chinese feed
Table 2b
Total DDGS consumption by species, crop year 2010/11
China United States
Percent
Dairy 10 30
Beef NA 55
Swine 20 10
Poultry 60 5
Aquaculture 10 NA
Total 100 100
NA = No data available.
Source: U.S. estimates from Hoffman and Baker (2011). China estimates based on reports from industry sources.
Figure 4
Average prices of feed ingredients in China, June-December 2011
DDGS = Distillers dried grains with solubles.*Calculated from average value of commodities reported in China customs statistics plus tariff �(1 percent on corn, 5 percent on DDGS) and value-added tax (VAT) (13 percent on corn, 0 percent on DDGS).**Price in northeast China.
Source: China National Grain and Oils Information Center, unpublished reports, except where noted.
Domestic Chinese DDGS**
Imported DDGS*
Domestic Chinese corn
Imported corn*
Rapeseed meal
Cottonseed meal
Peanut meal
Soybean meal
0 500 1,000 1,500 2,000 2,500 3,000 3,500
1,730
1,9852,030, northeast China
2,405
2,245
2,395
2,875
3,070
2,435, south China
Yuan per metric ton
Feed type
9 China’s Market for Distillers Dried Grains and the Key Influences on Its Longer Run Potential / FDS-12g-01
Economic Research Service/USDA
industry, the decline in U .S . DDGS prices relative to corn made DDGS a more attractive alternative to importing U .S . corn .
In addition to the attractive price of U .S . DDGS, importers in Asia are attracted by the golden yellow color of U .S . DDGS and their consistency, which reflects the uniformity of raw materials and production processes used by the U .S . ethanol industry .6 The color is also indicative of other nutri-tive content, including ash, fiber, crude fat, and lysine . Research has shown that dark-colored DDGS has a lower nutritional value, primarily the result of excessive drying (Cromwell et al ., 1993; Fastinger et al ., 2006) . Some Chinese feed compounders report that they value the color of U .S . DDGS for its influence on the color of the final feed product (Tuan et al ., 2008) .
Favorable Policy Treatment
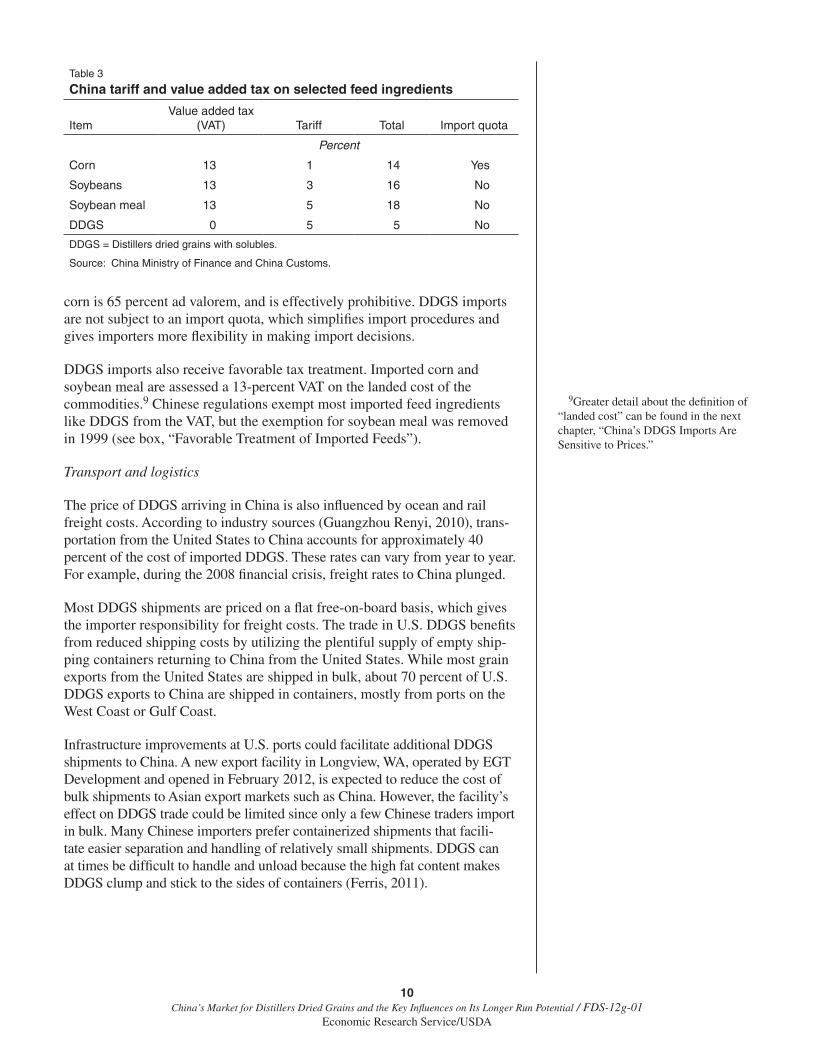
Chinese tariff and tax policies play an important role in supporting imports of DDGS over other feed ingredients . Imports of DDGS are subject to a rela-tively low 5-percent tariff, but most importantly are exempt from value added taxes (VAT) and are not subject to import quotas (table 3) .
Imports of corn—considered a strategic commodity in China—are regulated by a tariff rate quota system established when China became a World Trade Organization member in 2001 . Corn imports within the annual quota of 7 .2 mmt are subject to a tariff of only 1 percent, but 60 percent of the quota is reserved for state trading companies .7 Other companies must go through cumbersome procedures to apply for a share of the 2 .9 mmt available to non-state trading companies who are importers .8 The over-quota tariff rate for
6This color preference for feed ingre-dients is not new . During the late 1990s, when China previously imported large quantities of soybean meal, ERS inter-views of Chinese end users indicated they disliked the dark color of Brazilian soybean meal (Crook et al ., 1998) . As a result, it was blended with U .S . soybean meal to improve the overall color .
7These are companies that import on behalf of the Government to replenish commodity reserves . 8Applicants for quota must meet requirements for production capacity and have a history of importing corn to request a quota allocation from Chinese Government authorities each year . China had 10,804 feed-processing enterprises in 2010 (China Ministry of Agriculture Feed Industry Office, 2011) .
Dollars per metric ton
Figure 5
Central Illinois corn and DDGS prices
50
100
150
200
250
300
350
5/5/
2006
9/5/
2006
1/5/
2007
5/5/
2007
9/5/
2007
1/5/
2008
5/5/
2008
9/5/
2008
1/5/
2009
5/5/
2009
9/5/
2009
1/5/
2010
5/5/
2010
9/5/
2010
1/5/
2011
5/5/
2011
9/5/
2011
1/5/
2012
5/5/
2012
DDGS
Corn
Note: Prices are on a dry-matter basis, which assumes 10-percent moisture for DDGS and 15-percent moisture for corn. DDGS = Distillers dried grains with solubles.
Source: USDA, Agricultural Marketing Service.
10 China’s Market for Distillers Dried Grains and the Key Influences on Its Longer Run Potential / FDS-12g-01
Economic Research Service/USDA
corn is 65 percent ad valorem, and is effectively prohibitive . DDGS imports are not subject to an import quota, which simplifies import procedures and gives importers more flexibility in making import decisions .
DDGS imports also receive favorable tax treatment . Imported corn and soybean meal are assessed a 13-percent VAT on the landed cost of the commodities .9 Chinese regulations exempt most imported feed ingredients like DDGS from the VAT, but the exemption for soybean meal was removed in 1999 (see box, “Favorable Treatment of Imported Feeds”) .
Transport and logistics
The price of DDGS arriving in China is also influenced by ocean and rail freight costs . According to industry sources (Guangzhou Renyi, 2010), trans-portation from the United States to China accounts for approximately 40 percent of the cost of imported DDGS . These rates can vary from year to year . For example, during the 2008 financial crisis, freight rates to China plunged .
Most DDGS shipments are priced on a flat free-on-board basis, which gives the importer responsibility for freight costs . The trade in U .S . DDGS benefits from reduced shipping costs by utilizing the plentiful supply of empty ship-ping containers returning to China from the United States . While most grain exports from the United States are shipped in bulk, about 70 percent of U .S . DDGS exports to China are shipped in containers, mostly from ports on the West Coast or Gulf Coast .
Infrastructure improvements at U .S . ports could facilitate additional DDGS shipments to China . A new export facility in Longview, WA, operated by EGT Development and opened in February 2012, is expected to reduce the cost of bulk shipments to Asian export markets such as China . However, the facility’s effect on DDGS trade could be limited since only a few Chinese traders import in bulk . Many Chinese importers prefer containerized shipments that facili-tate easier separation and handling of relatively small shipments . DDGS can at times be difficult to handle and unload because the high fat content makes DDGS clump and stick to the sides of containers (Ferris, 2011) .
9Greater detail about the definition of “landed cost” can be found in the next chapter, “China’s DDGS Imports Are Sensitive to Prices .”
Table 3
China tariff and value added tax on selected feed ingredients
ItemValue added tax
(VAT) Tariff Total Import quota
Percent
Corn 13 1 14 Yes
Soybeans 13 3 16 No
Soybean meal 13 5 18 No
DDGS 0 5 5 No
DDGS = Distillers dried grains with solubles.
Source: China Ministry of Finance and China Customs.
11 China’s Market for Distillers Dried Grains and the Key Influences on Its Longer Run Potential / FDS-12g-01
Economic Research Service/USDA
Favorable Treatment of Imported Feeds
Since the 1990s, Chinese authorities have experimented with trade policies designed to augment China’s feed supply as a means of facilitating growth in the country’s livestock industry . During a period of high feed prices in the 1990s, authorities cut tariffs on feeds derived from processing of grains, oilseeds, sugar, and alcohol distilling to 5 percent, waived the 13-percent value added tax (VAT) on imports of feeds, and eliminated import quotas .
The main purpose of these measures was to increase the supply of soybean meal to promote efficient livestock production (Crook et al ., 1998) . At the time, imports of unprocessed soybeans were subject to quotas, a 3-percent tariff (for shipments within the quota), and a 13-percent VAT . Soybean oil imports were also subject to a quota, a 13-percent tariff, and a 17-percent VAT .
Spurred by the waiver of VAT and removal of quotas, plus a decline in world prices, China’s imports of soybean meal surged from negligible amounts in 1995 to 3 .6 mmt in 1996/97 and 4 .2 mmt during 1997/98 (Hsu, 2001) . The surge of imports put downward pressure on domestic Chinese soybean meal prices and reduced profit margins of domestic soybean-crushing enterprises . At the same time, large volumes of soybean oil were smuggled into China to evade quotas, tariffs, and the VAT (Crook et al ., 1998; Hsu, 2001) .
In July 1999, the VAT on imported soybean meal was restored in order to slow imports and boost margins for domestic soybean crushers . Since 2001, regulations have specifically excluded soybean meal from the VAT exemption for feeds . Other feeds, including DDGS, still have the VAT exemption and a 5-percent tariff .
After the VAT on soybean meal imports was restored, China shifted from importing soybean meal and soybean oil to importing mostly unprocessed soybeans . Robust investment in soybean processing and removal of quotas on imported soybeans further encouraged imports . The volume of imported soybeans soared to 54 mmt in 2011 . Nearly all of the soybean meal derived from imported soybeans is used for animal feed in China . Soybean meal imports dropped to 100,000 metric tons (mt) during 2000/01 and rarely exceeded 200,000 mt annually in subsequent years .
Similar to the 1990s soybean meal episode, the surge of DDGS imports to 3 mmt during 2010 prompted complaints from domestic Chinese processors (of ethanol and alcohol) that imports depressed the price of their co-products and reduced their profit margins . A group of these companies filed a petition with China’s Ministry of Commerce on November 16, 2010, to launch an antidumping investigation against imports of U .S . DDGS (discussed in Transports and Logistics section of this chapter) .

12 China’s Market for Distillers Dried Grains and the Key Influences on Its Longer Run Potential / FDS-12g-01
Economic Research Service/USDA
Industry sources in China report that cost savings are the main motivation behind increased use of imported DDGS in China . A livestock specialist with the U .S . Grains Council’s Beijing Office estimated that including DDGS could reduce feed costs for Chinese farms by 45 to 75 yuan ($7 to $11) per metric ton compared with a corn-soybean meal formulation . The manager of a Chinese feed mill asserted that cost savings were the reason for the appeal of DDGS (Nongcai Baodian, 2011) .10
A study by Fabiosa et al . (2009) used actual and secondary data to conduct a microeconomic analysis on the impact of imported DDGS on feed costs in China . Their results indicated a clear economic incentive for feed millers and livestock producers to use imported DDGS in their feed rations, with a poten-tial savings of $1 per hundredweight for mixed feed, or 6 percent of average feed costs . At the time of the study, China’s DDGS imports from the U .S . were negligible, but the authors noted the potential for growth was substantial given the economic incentives alone .
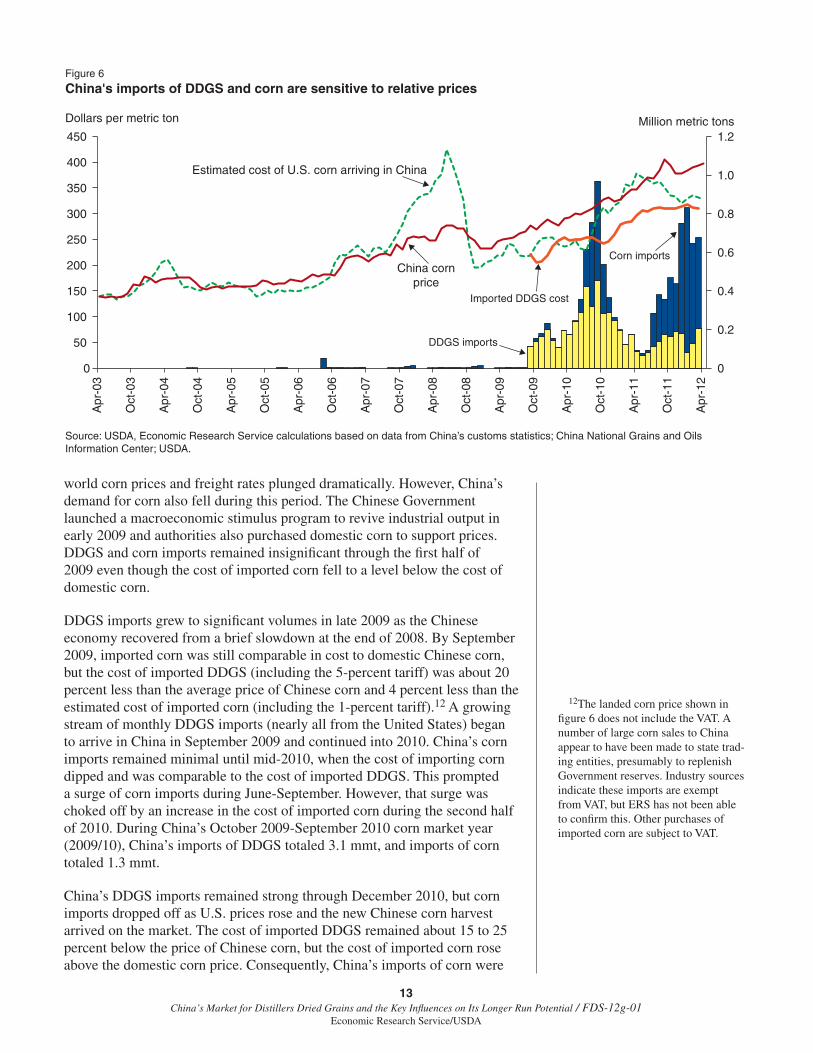
The substitutability among DDGS, corn, and other feed raw materials from both domestic Chinese and imported sources means that China’s imports of DDGS and corn are sensitive to relative prices and are variable, depending on the ration-formulation methodology used . The rising price of domestic corn in China is prompting feed compounders and livestock producers to seek out substitutes for corn like U .S . DDGS . In September 2011, China’s corn price was approximately 20 percent higher than a year earlier . This rate of increase was approximately three times faster than the growth in China’s consumer price index (CPI) . The prices of other grains and feed resources are also rising, and the resulting cost pressures on livestock producers and feed mills induce them to search for alternative feeds that can minimize their production costs .
The relationship between prices and imports of DDGS and corn is illustrated in figure 6, showing China’s monthly imports of DDGS and corn (both predominantly from the United States) from 2003 to 2012 . The chart also displays three prices:
• TheaveragepriceofdomesticChinesecorninGuangzhou,acorn-deficitregion of southern China that typically has among the highest corn prices in China .
• TheestimatedlandedcostofimportingU.S.corn,calculatedbyaddingmonthly ocean-freight rates to the average price of U .S . corn at Gulf of Mexico ports plus Chinese tariffs and taxes .
• Theaveragecostandfreight(C&F)priceofimportedDDGSarrivingin China, calculated by dividing the monthly value of DDGS imports reported in Chinese customs statistics by the volume of imports .11
China’s imports of both DDGS and corn were insignificant during 2007-2008 when U .S . corn prices and freight rates were at high levels . During this period, China’s corn prices were lower than world prices . During mid-2008,
10The Beijing Office of the U .S . Grains Council posts on its website periodic reports showing the costs and feed value of DDGS and other feed raw materials in China (see: http://www .grains .org .cn/_d269507396 .htm) .
11Note that customs statistics could notbeusedtocalculatetheC&Fpriceof imported corn since China’s corn im-ports were negligible in most months .
China’s DDGS Imports Are Sensitive to Prices
13 China’s Market for Distillers Dried Grains and the Key Influences on Its Longer Run Potential / FDS-12g-01
Economic Research Service/USDA
world corn prices and freight rates plunged dramatically . However, China’s demand for corn also fell during this period . The Chinese Government launched a macroeconomic stimulus program to revive industrial output in early 2009 and authorities also purchased domestic corn to support prices . DDGS and corn imports remained insignificant through the first half of 2009 even though the cost of imported corn fell to a level below the cost of domestic corn .
DDGS imports grew to significant volumes in late 2009 as the Chinese economy recovered from a brief slowdown at the end of 2008 . By September 2009, imported corn was still comparable in cost to domestic Chinese corn, but the cost of imported DDGS (including the 5-percent tariff) was about 20 percent less than the average price of Chinese corn and 4 percent less than the estimated cost of imported corn (including the 1-percent tariff) .12 A growing stream of monthly DDGS imports (nearly all from the United States) began to arrive in China in September 2009 and continued into 2010 . China’s corn imports remained minimal until mid-2010, when the cost of importing corn dipped and was comparable to the cost of imported DDGS . This prompted a surge of corn imports during June-September . However, that surge was choked off by an increase in the cost of imported corn during the second half of 2010 . During China’s October 2009-September 2010 corn market year (2009/10), China’s imports of DDGS totaled 3 .1 mmt, and imports of corn totaled 1 .3 mmt .
China’s DDGS imports remained strong through December 2010, but corn imports dropped off as U .S . prices rose and the new Chinese corn harvest arrived on the market . The cost of imported DDGS remained about 15 to 25 percent below the price of Chinese corn, but the cost of imported corn rose above the domestic corn price . Consequently, China’s imports of corn were
12The landed corn price shown in figure 6 does not include the VAT . A number of large corn sales to China appear to have been made to state trad-ing entities, presumably to replenish Government reserves . Industry sources indicate these imports are exempt from VAT, but ERS has not been able to confirm this . Other purchases of imported corn are subject to VAT .
Million metric tonsDollars per metric ton
Figure 6
China's imports of DDGS and corn are sensitive to relative prices
0
0.2
0.4
0.6
0.8
1.0
1.2
0
50
100
150
200
250
300
350
400
450
Apr
-03
Oct
-03
Apr
-04
Oct
-04
Apr
-05
Oct
-05
Apr
-06
Oct
-06
Apr
-07
Oct
-07
Apr
-08
Oct
-08
Apr
-09
Oct
-09
Apr
-10
Oct
-10
Apr
-11
Oct
-11
Apr
-12
Estimated cost of U.S. corn arriving in China
China cornprice
DDGS imports
Corn imports
Imported DDGS cost
Source: USDA, Economic Research Service calculations based on data from China’s customs statistics; China National Grains and Oils Information Center; USDA.
14 China’s Market for Distillers Dried Grains and the Key Influences on Its Longer Run Potential / FDS-12g-01
Economic Research Service/USDA
again minimal during late 2010 . Corn imports resumed during the second half of 2011 as U .S . prices declined and Chinese prices kept rising .
The cost of imported DDGS remained well below the cost of Chinese corn during the first half of calendar year 2011, but an antidumping investiga-tion against U .S . DDGS announced by China’s Ministry of Commerce in December 2010 raised uncertainties for Chinese purchasers (see box, “China’s Antidumping Investigation Against U .S . DDGS”) . DDGS imports resumed their growth during the second half of 2011 as the cost dipped and rumors circulated in China that the Government would discontinue the anti-dumping investigation . During the 2010/11 market year, China’s imports of DDGS fell to 2 .1 mmt and corn imports fell to 980,000 mt as the cost of imported corn rose above domestic prices while imports of rapeseed meal from Canada and India increased due to competitive prices .13 Imports of both corn and DDGS were strong during late 2011 and early 2012 as Chinese corn prices rose and U .S . prices fell .
13China’s imports of rapeseed meal totaled 1 .4 mmt during October 2010-September 2011, up from 1 mmt during the year-earlier period .
China’s Antidumping Investigation Against U.S. DDGS
In late December 2010, China’s Ministry of Commerce announced an antidumping investigation against imported U .S . DDGS to take place during 2011 . The investigation was requested by a group of domestic Chinese alcohol producers that included two of China’s five officially sanctioned fuel ethanol companies (Jilin Fuel Ethanol Co . and Anhui Fengyuan Biological) and two other alcohol producers in Jilin Province . There may have been other companies with an interest in the case, since China has dozens of companies producing alcohol products . The petitioners claimed that imported DDGS depressed prices of their DDGS and other co-products sold in the domestic market, thus reducing their supplementary income from alcohol production .
The potential imposition of high countervailing duties as a result of the investigation would harm Chinese feed manufacturers and livestock producers who use imported DDGS . In his role as a representative to the National People’s Congress, the chairman of China’s largest feed company publicly opposed the antidumping investigation, saying it was not in the interest of the feed industry and only represented the interests of a few alcohol producers (“New Hope Asks Chinese Government To Stop Antidumping Investigation Against U .S . DDGS,” April 15, 2011; available at: http://www .gdfeed .org .cn/news/qiyedongtai/2011/0415/8985 .html .) He argued that assessing high duties on imported DDGS would raise costs for feed companies that would be passed on to consumers in higher meat prices .
On June 21, 2012, the Ministry of Commerce announced the antidumping investigation would be terminated, citing a decision by the petitioners to withdraw their complaint . Some feed mill managers and analysts speculated that the investigation was launched as a strategic measure to slow the rapid growth in imported DDGS and prevent their share of the Chinese market from exceeding 50 percent (Nongcai Baodian, 2011) .
15 China’s Market for Distillers Dried Grains and the Key Influences on Its Longer Run Potential / FDS-12g-01
Economic Research Service/USDA
Nonprice Factors Affecting Chinese DDGS Demand
Users may be willing to pay a premium for U .S . DDGS due to its better quality and consistency . Industry sources say DDGS produced by Chinese ethanol plants are uneven in quality and color due to the variation in raw materials and different milling and fermentation processes used (Nongcai Baodian, 2011) . In most cases, the nutrient quality of China-produced DDGS is lower and less consistent than U .S . DDGS, reflecting differences in the ethanol production process and excessive drying, which may be the result of poor quality feedstock (USDA, Foreign Agricultural Service, 2009) .
Mycotoxins in grain are a concern in China’s livestock and feed industry, and the concern is even more acute for users of DDGS, particularly for poultry and swine, which are more sensitive than ruminants . High moisture levels can promote growth of molds and fungi that emit poisonous toxins that can weaken livestock and make the animals more vulnerable to disease and slow weight gain .14 Few Chinese farmers have access to grain-drying equipment, and grain is frequently stored in facilities where it is vulnerable to moisture and temperature changes . When grain is processed into alcohol, the concen-tration of mycotoxins in DDGS is two to three times higher than the concen-tration before the starch is removed from the grain (Shurson, 2009) . Industry sources say mycotoxins are a common problem in domestic Chinese DDGS, which requires costly treatment to eliminate (Nongcai Baodian, 2011) .
On the other hand, the attraction of DDGS for Chinese buyers could be eroded by a “back end” fractionation process being adopted by U .S . ethanol producers, which raises revenue by extracting corn oil that can be used for biodiesel fuel (Ferris, 2011) . Recent data from the U .S . Grains Council (2012) showed 90 out of 200 dry-mill ethanol plants in the United States currently have oil extraction capability, and the number is expected to increase to 105 by the summer of 2012 . The reduced-oil DDGS produced by this process appear to have relatively greater value for cattle than for poultry and swine because ruminants can better utilize the higher fiber for energy than can monogastric animals (Shurson, 2006) .15 Higher fiber content may discourage use for Chinese poultry and swine feed—currently the dominant uses .
At a China feed industry seminar held in 2011, University of Minnesota Professor Jerry Shurson explained in a presentation that the new process reduces the fat content and a participant in the meeting questioned whether the new type of DDGS would be attractive as a feed for China’s poultry and swine (Southern Rural News, 2011) . So far, the effect of the reduced fat content is not clear . The relatively small share of DDGS in final feed prod-ucts mutes changes in its characteristics, and some research indicates that the protein quality—the amino acid balance—of DDGS in general could keep even low-oil DDGS attractive to Chinese buyers .
The regional availability of DDGS in China is also important . Domestic DDGS and other co-products are mainly produced in the northeastern region, where corn supplies are abundant . China’s southern region produces large volumes of manufactured feed products but has limited supplies of raw materials . Corn and DDGS from northeastern China must be shipped long distances at high cost to reach these customers . Guangdong Province has the largest commercial feed output in China, but corn prices there are 12 to 15
14According to one study, tests of feed products in China during 2008 found that nearly all of 342 samples were contaminated with mycotoxins, and products of corn (DDG, corn gluten meal, brewers’ grains) had the highest prevalence (Lao, 2009) .
15Anticipating this problem for a wide spectrum of users who use DDGS as a substitute for corn, Ferris (2011, p . 9) surmised that “deoiled” DDGS may sell at a discounted price for some time after adoption of “back end” fractionation .
16 China’s Market for Distillers Dried Grains and the Key Influences on Its Longer Run Potential / FDS-12g-01
Economic Research Service/USDA
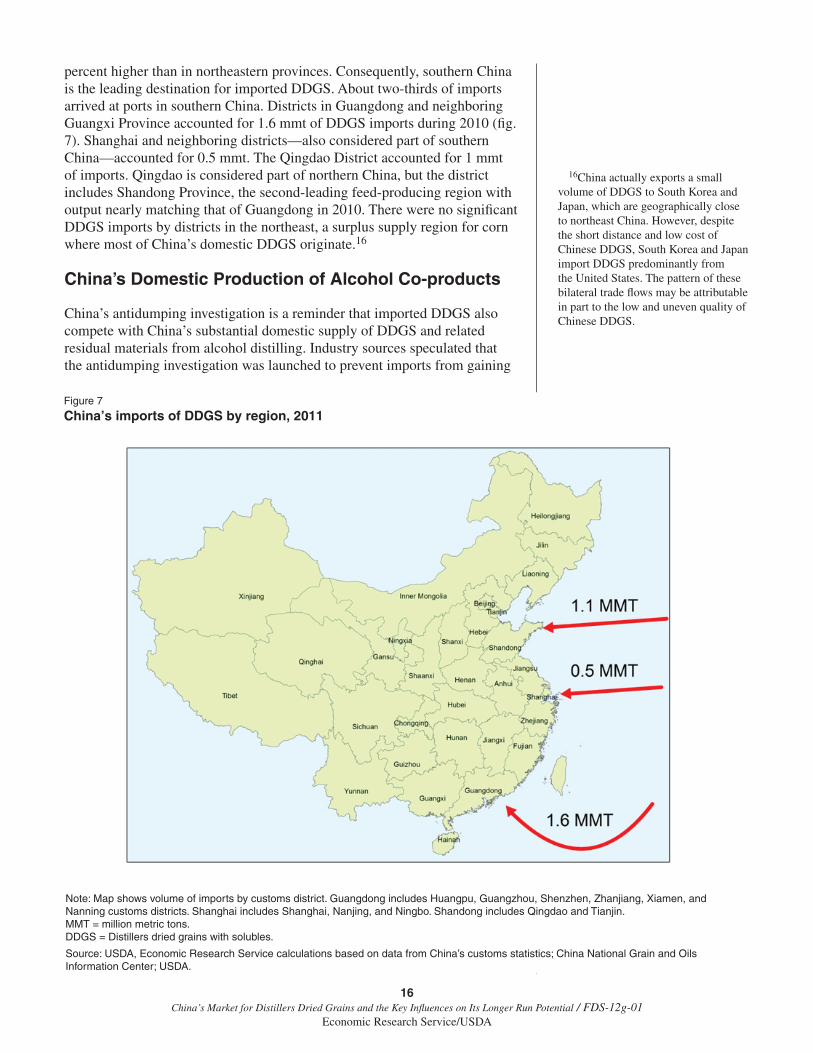
percent higher than in northeastern provinces . Consequently, southern China is the leading destination for imported DDGS . About two-thirds of imports arrived at ports in southern China . Districts in Guangdong and neighboring Guangxi Province accounted for 1 .6 mmt of DDGS imports during 2010 (fig . 7) . Shanghai and neighboring districts—also considered part of southern China—accounted for 0 .5 mmt . The Qingdao District accounted for 1 mmt of imports . Qingdao is considered part of northern China, but the district includes Shandong Province, the second-leading feed-producing region with output nearly matching that of Guangdong in 2010 . There were no significant DDGS imports by districts in the northeast, a surplus supply region for corn where most of China’s domestic DDGS originate .16
China’s Domestic Production of Alcohol Co-products
China’s antidumping investigation is a reminder that imported DDGS also compete with China’s substantial domestic supply of DDGS and related residual materials from alcohol distilling . Industry sources speculated that the antidumping investigation was launched to prevent imports from gaining
16China actually exports a small volume of DDGS to South Korea and Japan, which are geographically close to northeast China . However, despite the short distance and low cost of Chinese DDGS, South Korea and Japan import DDGS predominantly from the United States . The pattern of these bilateral trade flows may be attributable in part to the low and uneven quality of Chinese DDGS .
Figure 7
China’s imports of DDGS by region, 2011
Note: Map shows volume of imports by customs district. Guangdong includes Huangpu, Guangzhou, Shenzhen, Zhanjiang, Xiamen, and Nanning customs districts. Shanghai includes Shanghai, Nanjing, and Ningbo. Shandong includes Qingdao and Tianjin. MMT = million metric tons.DDGS = Distillers dried grains with solubles.
Source: USDA, Economic Research Service calculations based on data from China’s customs statistics; China National Grain and Oils Information Center; USDA.
17 China’s Market for Distillers Dried Grains and the Key Influences on Its Longer Run Potential / FDS-12g-01
Economic Research Service/USDA
more than 50 percent of China’s DDGS market (Nongcai Baodian, 2011; China Corn Net, 2011) .
Fuel ethanol is part of a larger alcohol industry that yields various feed co-products . During the early 2000s, production of alcohol for beverage, fuel, pharmaceutical, and industrial uses expanded rapidly (Gale et al ., 2009) . The raw material used for distilling alcohol varies from region to region and includes corn, rice, wheat, sorghum, potatoes and other nongrain feed ingredi-ents such as cassava . However, much of the increased capacity was constructed in corn-growing regions and uses corn as the primary raw material .
Corn-based co-products from domestic Chinese fuel ethanol and other types of alcohol industries are produced mainly in the northeastern region of the country, the region with the most abundant corn resources . There is no means of directly measuring the availability of residues from alcohol distilling in China, but limited statistics on alcohol production show that the industry has grown most rapidly in corn-producing regions, suggesting that the alcohol industry’s growth represents increased use of corn as the raw material (Chinese Academy of Agricultural Mechanization Sciences, 2011) .
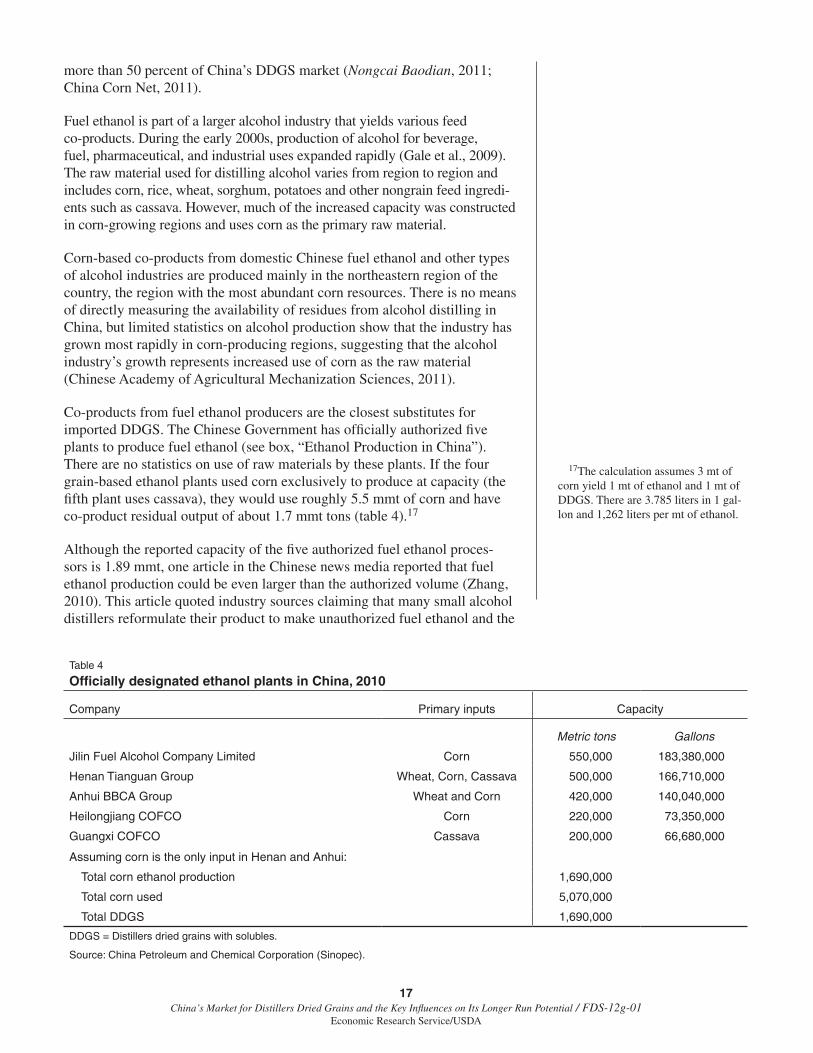
Co-products from fuel ethanol producers are the closest substitutes for imported DDGS . The Chinese Government has officially authorized five plants to produce fuel ethanol (see box, “Ethanol Production in China”) . There are no statistics on use of raw materials by these plants . If the four grain-based ethanol plants used corn exclusively to produce at capacity (the fifth plant uses cassava), they would use roughly 5 .5 mmt of corn and have co-product residual output of about 1 .7 mmt tons (table 4) .17
Although the reported capacity of the five authorized fuel ethanol proces-sors is 1 .89 mmt, one article in the Chinese news media reported that fuel ethanol production could be even larger than the authorized volume (Zhang, 2010) . This article quoted industry sources claiming that many small alcohol distillers reformulate their product to make unauthorized fuel ethanol and the
17The calculation assumes 3 mt of corn yield 1 mt of ethanol and 1 mt of DDGS . There are 3 .785 liters in 1 gal-lon and 1,262 liters per mt of ethanol .
Table 4
Officially designated ethanol plants in China, 2010
Company Primary inputs Capacity
Metric tons Gallons
Jilin Fuel Alcohol Company Limited Corn 550,000 183,380,000
Henan Tianguan Group Wheat, Corn, Cassava 500,000 166,710,000
Anhui BBCA Group Wheat and Corn 420,000 140,040,000
Heilongjiang COFCO Corn 220,000 73,350,000
Guangxi COFCO Cassava 200,000 66,680,000
Assuming corn is the only input in Henan and Anhui:
Total corn ethanol production 1,690,000
Total corn used 5,070,000
Total DDGS 1,690,000
DDGS = Distillers dried grains with solubles.
Source: China Petroleum and Chemical Corporation (Sinopec).
18 China’s Market for Distillers Dried Grains and the Key Influences on Its Longer Run Potential / FDS-12g-01
Economic Research Service/USDA
designated producers exceed their authorized volumes when gasoline prices are high . The article’s findings could not be confirmed but listings on Chinese e-commerce sites checked by ERS include a number of companies listing “fuel ethanol” as one of their products . This could also imply a larger supply of domestic DDGS than is often acknowledged . Recent Chinese Government policy has sought to slow growth of ethanol and other industrial uses of corn but production has remained robust .
Ethanol Production in China
China began its ethanol program in 2001 when the Chinese Government designated four fuel ethanol producers in Jilin, Heilongjiang, Henan, and Anhui Provinces that used corn, rice, and wheat as raw materials . At the time, the Government held large reserves of grain and farmers were receiving low prices for grain . The four ethanol producers receive cash subsidies and tax exemptions and sell their output to two state-owned fuel blenders .
In 2006, the Chinese Government announced that new growth in ethanol output would come from nongrain raw materials such as cassava, sweet sorghum, sweet potatoes, crop residues, and forest products . The nongrain raw materials can only be planted on land that is unsuitable for producing grain and processing must be nonpolluting . In 2009, a fifth plant began producing ethanol in Guangxi Province using cassava as a raw material . Several ethanol producers conducted experimental trials in producing ethanol from sweet sorghum and corn stalks . The feed value of co-products from nongrain raw materials is generally low . An Economic Research Service team that visited the Guangxi plant was told that the residual by product from producing ethanol from cassava can be used as animal feed, but it has a lower protein content (11-14 percent) and higher fiber (30-40 percent) . The company burns most of the residual by product for electricity generation (Tuan et al ., 2008) .
China’s 12th 5-year plan for 2011-15 announced a target of producing 5 .0 mmt of biofuels by 2015, with all growth coming from nongrain raw materials . In 2011, China’s State Council approved a plan to construct a plant in eastern China’s Zhejiang Province that will use cassava imported from Southeast Asia as the raw material . Other nongrain ethanol projects are planned, and research on new technologies continues .
In 2012, China’s Ministry of Finance sharply reduced the subsidy for grain-based ethanol production . The subsidy for 2012 was set at 500 yuan/mt, less than half the 1276 yuan subsidy in 2011 (the 2012 subsidy for nongrain fuel ethanol was set at 750 yuan/mt) . The reduction reflects concerns among Chinese officials that rising use of corn for industrial processing was contributing to upward pressure on corn prices . The shift in policy is likely to restrict the domestic supply of DDGS by slowing or reducing corn-based ethanol production in China .
19 China’s Market for Distillers Dried Grains and the Key Influences on Its Longer Run Potential / FDS-12g-01
Economic Research Service/USDA
China’s robust demand for feed ingredients makes the country an important market for U .S . DDGS exports, but the volume of U .S . DDGS exported to China in the future is highly uncertain . A key constraint on future growth may be prospects for slower expansion in the supply of U .S . DDGS during the coming decade, as growth in the volume of corn-based ethanol produced is expected to slow . According to the latest USDA baseline projections to 2021, total U .S . corn used for ethanol is forecast to increase from 128 mmt in 2010/11 to 139 mmt in 2021/22, compared with growth of 112 mmt between 2000/01 and 2010/11 (USDA/OCE, 2012) . This moderation of growth reflects slower expected increases in blended gasoline consumption in the United States and constraints in the market for ethanol blends above 10 percent (E10), including approved E15 and E85 blends (USDA/OCE, 2012) . Based on this projected level of ethanol output, U .S . DDGS supplies will likely expand, but at a much more subdued rate than in recent years .
It is possible that the volume of U .S . DDGS available for export will decline if U .S . domestic use of DDGS increases in the future . DDGS has become an important component of U .S . livestock rations, and domestic feed use is unlikely to fall substantially from an estimated 29 mmt in 2010/11 .18 The projected increase in U .S . meat consumption and exports over the next decade could also result in further increases in domestic demand for DDGS (USDA/OCE, 2012) . Therefore, it is possible U .S . domestic use of DDGS could expand faster than production, but this will depend, in part, on the rela-tive availability and prices for corn and soybean meal .
U .S . DDGS supply constraints aside, relative prices and transportation costs will likely have the biggest influence on the destination of U .S . DDGS exports in the future . High transportation costs of DDGS and integration of feed and livestock sectors in the North American Free Trade Association region favor nearby markets—such as Canada and Mexico—over Asian markets .19 On the other hand, high feed prices and robust domestic demand in other countries could push DDGS export sales toward other growth desti-nations in Asia besides China, such as South Korea, Vietnam, and Thailand .
Use of imported DDGS in China is a relatively new phenomenon and limited to a few relatively small feed mills in coastal provinces . The cost advan-tage depends in large part on trends in U .S . and China corn prices including tariffs and taxes . If China’s corn prices continue rising, feed mills and live-stock producers will face continued pressure to find cheaper feed ingredients like DDGS . In the United States, DDGS and corn prices tend to be closely related, so a decline in U .S . corn prices relative to Chinese corn prices would tend to make both U .S . corn and DDGS more price-competitive in China .
Chinese policy treatment of DDGS is uncertain as officials balance the priority of expanding feed supplies against domestic corn-processing industry interests . Favorable trade treatment of DDGS is an important factor that spurred the import of DDGS . However, the antidumping investigation against U .S . DDGS reflects the competing interests of livestock producers and domestic suppliers of DDGS (China Corn Net, 2011) . DDGS imports affect only a relatively small number of alcohol producers in China, but
18DDGS appears to have substituted for direct use of corn and soybean meal by livestock producers following the expansion of ethanol use of corn . See Hoffman and Baker (2011) .
19Some have claimed that as transport cost becomes a major consideration, it will favor importing feed nutrients in the form of DDGS rather than corn be-cause the density is magnified by three times in the former . Supply constraints aside, the substitution of DDGS for corn depends on many factors and fur-ther research is needed to answer this question . Handling advantages for corn could partly offset gains from nutrient concentration in DDGS .
Conclusions
20 China’s Market for Distillers Dried Grains and the Key Influences on Its Longer Run Potential / FDS-12g-01
Economic Research Service/USDA
industry sources indicate that policymakers and industry members are averse to imports gaining a dominant share of any industry (Nongcai Baodian, 2011) .20 The antidumping investigation was terminated in 2012, suggesting that concerns about feed costs prevailed over alcohol industry interests . At the same time, Chinese officials have sharply reduced subsidies for domestic fuel ethanol and implemented other policies to constrain growth in domestic alcohol production that would restrict domestic supplies of DDGS and other co-products that compete with imported DDGS .
China’s feed demand is expected to expand rapidly over the next 10 years . USDA’s baseline projections to 2021 project that feed and residual use of corn will expand from 124 mmt to 172 mmt and soybean meal consumption will rise from 43 mmt to 73 mmt . This expansion in feed use is driven by a livestock sector shifting from backyard to commercial production, which will likely utilize more corn and soybean meal and fewer inputs such as house-hold and processing waste, crop by-products, vines, tubers, and other forages .
Feed demand in China will remain robust, but future DDGS sales to China depend on the economic value of U .S . supplies compared with alternative raw materials including domestic and imported corn . DDGS from the United States are one of many sources of raw materials supporting China’s growing commercial feed production (imports of DDGS were equivalent to roughly 2 percent of feed output during 2010) . In an environment of rising costs, Chinese feed mills will continue to seek out cost-minimizing raw mate-rials . If DDGS sales to China are restricted by rising prices or other factors, Chinese demand will shift to other raw materials: corn, wheat, other grains, oilseed meals, and other milling and processing co-products . The emergence of China’s DDGS imports is a reminder that feed supplies come from diverse sources, and demand is price-sensitive .
20The soybean industry is dominated by imports, and commentators warn that rising imports of DDGS and other commodities could lead to a similar reliance on imports .
21 China’s Market for Distillers Dried Grains and the Key Influences on Its Longer Run Potential / FDS-12g-01
Economic Research Service/USDA
Berger, Larry L ., and Darrel L . Good . 2007 . “Distillers Dried Grains Plus Solubles Utilization by Livestock and Poultry,” Corn-Based Ethanol in Illinois and the U.S.: A Report from the Department of Agricultural and Consumer Economics, University of Illinois, Chapter 6, November . Retrieved from: http://www .farmdoc .illinois .edu/policy/research_reports/ethanol_report/Ethanol%20Report .pdf
Bunge North America . 2011 . EGT To Build Third Facility in Montana. August 16 . Retrieved from: http://www .bungenorthamerica .com/news/releases/2011-08-16 .shtml
China National Grains and Oils Information Center (CNGOIC) . Feedgrains Supply and Demand Situation Weekly Report. Various issues .
Chinese Academy of Agricultural Mechanization Sciences . 2011 . “2010 China Agricultural Processing Yearbook,” China Agricultural Press, July .
China Aquaculture Network . 2010 . Zhongguo jiang jinkou geng duo yumi gan jiuzao danbai siliao (China will import more DDGS), November 19 . Retrieved from: http://www .yangzhiwang .com .cn/news/show .php?itemid=3257
China Corn Net . 2011 . DDGS fan qing xiao diaocha yinfa si kao (Thoughts on what triggered the DDGS antidumping investigation), news report, January 10 . Retrieved at: www .yumi .com .cn
China Feed Trade . 2011 . Zhong mei siliao duiyu yumi de xuqiu jiang hui chixu shangsheng (China and U .S . corn feed demand will continue to increase), September 23 . Retrieved from: http://www .xumu .com .cn/html/feed/1011/2011/0926/232407 .html
China Ministry of Agriculture . 2011 . “2010 China Agricultural Yearbook,” China Agricultural Press, March .
China Ministry of Agriculture . 2011 . China’s 12th 5-year Plan for the Feed Industry, retrieved from: http://www .moa .gov .cn/zwllm/zcfg/nybgz/201110/t20111019_2367679 .htm
China Ministry of Agriculture . 2011 . China’s 12th 5-year Plan for the Fisheries Industry, retrieved from: http://www .moa .gov .cn/zwllm/ghjh/201111/t20111114_2408578 .htm
China Ministry of Agriculture . 2011 . China’s 12th 5-year Plan for the Live-stock Industry, retrieved from: http://web .zgny .com .cn/User_Doc/23530/News/2422/20119301138115663235301 .htm
China Ministry of Agriculture . 2006 . China’s 11th 5-year Plan for the Live-stock Industry, retrieved from: http://www .gov .cn/gzdt/2006-09/13/content_387510 .htm
References
22 China’s Market for Distillers Dried Grains and the Key Influences on Its Longer Run Potential / FDS-12g-01
Economic Research Service/USDA
China Ministry of Agriculture Feed Industry Office . 2011 . 2010 Quanguo Nian Siliao Gongye Shengchan (2010 National Feed Industry Produc-tion), news release, May 19 .
Coffing, Art, Hunter Colby, William Lin, and James R . Simpson . 1991 . China Trip Report (U.S. Livestock and Feed Team), USDA Science and Technology Exchange Program internal report, October .
Cromwell, Gary, Kevin Herkelman, and Tim Stahly . 1993 . “Physical, Chemical and Nutritional Characteristics of Distillers Dried Grains With Solubles for Chick and Pigs,” Journal of Animal Science 71(3):679-686, March 1 . Retrieved from: http://jas .fass .org/content/71/3/679 .full .pdf+html
Crook, F .W ., R . Hanson, H . Hsu, B . Karmen, and P . Laney . 1998 . Soybean Consumption and Trade in China: A Trip Report, USDA internal report, July .
Dooley, Frank J . 2008 . U.S. Market Potential for Dried Distillers Grains With Solubles, Working Paper #08-12, Purdue University, Department of Agri-cultural Economics, December . Retrieved from: http://ageconsearch .umn .edu/bitstream/46342/2/08-12 .pdf
Fabiosa, Jacinto F ., James Hansen, Holger Matthey, Suwen Pan, and Francis Tuan . 2009 . Assessing China’s Potential Import Demand for Distillers Dried Grains: Implications for Grain Trade, Staff Report 09-SR 104, Iowa State University, Center for Agricultural and Rural Development, December . Retrieved from: http://www .card .iastate .edu/publications/DBS/PDFFiles/09sr104 .pdf
Fastinger, N .D ., J .D . Latshaw, and D .C . Mahan . 2006 . “Amino Acid Avail-ability and True Metabolizable Energy Content of Corn Distillers Dried Grains With Solubles in Adult Cecectomized Roosters,” Poultry Science 85:1212-1216, 2006 . Retrieved from: http://ps .fass .org/cgi/reprint/85/7/1212?maxtoshow=&hits=10&RESULTFORMAT=&author1=Fastinger&andorexacttitle=and&andorexacttitleabs=and&andorexactfulltext=and&searchid=1&FIRSTINDEX=0&sortspec=relevance&fdate=1/1/2003&tdate=9/30/2008&resourcetype=HWCIT
Ferris, John . 2011 . Potential for Corn Oil Extracted from Distillers Dried Grains and Solubles as a Feedstock for Biodiesel, Staff Paper 2011-07, Michigan State University, September .
Gale, F ., Marti, D ., and Hu, D . 2012 . China’s Volatile Pork Industry, LDP-M-211-01, USDA, Economic Research Service, February . Retrieved from: http://www .ers .usda .gov/media/262067/ldpm21101_1_ .pdf
Gale, F ., and S . Henneberry . 2010 . “Markets Adapt to China’s Changing Diet,” Choices 24, 2nd Quarter 2010, pp . 32-36 .
Gale, F ., Tuan, F ., Wang, X ., and Cao, Z . 2009 . China Is Using More Corn for Industrial Products, FDS-09k-01, USDA, Economic Research Service,

23 China’s Market for Distillers Dried Grains and the Key Influences on Its Longer Run Potential / FDS-12g-01
Economic Research Service/USDA
December . Retrieved from: http://www .ers .usda .gov/media/153522/fds09k01 .pdf
Guangzhou Renyi Import and Export Trading Company Limited . 2010 . Jinkou meiguo DDGS jingyan fenxiang (Our experience importing U .S . DDGS), presentation given at U .S . DDGS promotion conference in China . Retrieved from: http://122 .70 .144 .155/ppt/
Hoffman, Linwood, and Allen Baker . 2011 . Estimating the Substitution of Distillers Grains for Corn and Soybean Meal in the U.S. Feed Complex, FDS-I-01, USDA, Economic Research Service, October . Retrieved from: http://www .ers .usda .gov/media/236568/fds11i01_2_ .pdf
Hoffman, Linwood, and Allen Baker . 2010 . Market Issues and Prospects for U.S. Distillers Grains: Supply, Use, and Price Relationships, FDS-10k-01, USDA, Economic Research Service, December . Retrieved from: http://www .ers .usda .gov/media/107533/fds10k01_1_ .pdf
Hsu, Hsin-Hui . 2001 . “Policy Changes Continue to Affect China’s Oilseeds Trade Mix,” in China: Agriculture in Transition, WRS-01-2, USDA, Economic Research Service, November, pp . 30-36 .
Jacela, J .Y ., Frobose, H .L ., DeRouchey, J .M ., Tokach, M .D ., Dritz, S .S ., Goodband, R .D ., and Nelssen, J .L . 2010 . “Amino acid digestability and energy concentration of high-protein corn dried distillers grains and high-protein sorghum dried distillers grains with solubles for swine,” Journal of Animal Science 89:3617-3623, 2010. Retrieved from: http://jas .fass .org/content/88/11/3617 .full .pdf+html
Lao, Jinhua .2009 . “Siliao Meijian Dusu Wuran Yanzhong, Shangjia de Xuetou? (Is serious mycotoxin contamination in feed a commercial stunt?),” Southern Rural News, July 17 . Retrieved from: http://nf .nfdaily .cn/nanfangdaily/nfncb/200907160241 .asp
National Corn Growers Association . 2008 . Value-added Feed Source for Beef, Dairy Beef, Dairy, Poultry, Swine, and Sheep, September 9. Retrieved from: http://www .ethanol .org/pdf/contentmgmt/NCGA_Distillers_Grain_908-1 .pdf
Nongcai Baodian . 2011 . “Wu Nian Nei DDGS Jinkou Chao Guochan, Shangwu Bu Li An Fan Qingxiao Diaocha (DDGS Imports Surpassed Domestic Production in Five Years, Ministry of Commerce Launched Antidumping Investigation),” news article, April 7 . Retrieved from: http://animal .nfncb .cn/sczlzt/32 .html
Shurson, Jerry . 2002 . The Value and Use of Distiller’s Dried Grains with Solubles (DDGS) in Swine Diets, presentation retrieved from: http://www .ddgs .umn .edu/articles-swine/2002-Shurson-%20Carolina%20nutr%20conf .pdf
Shurson, Jerry . 2006 . “The Value of High-Protein Distillers Co-products in Swine Feeds .” Distillers Grains Quarterly, First Quarter 2006, pp .
24 China’s Market for Distillers Dried Grains and the Key Influences on Its Longer Run Potential / FDS-12g-01
Economic Research Service/USDA
22-25 . Retrieved from: http://www .ddgs .umn .edu/articles-swine/2006-Shurson-%20DGQuarterly .pdf
Shurson, Jerry, and Abdorrahman S . Alghandi . 2008 . “Quality and New Technologies to Create Corn Co-Products from Ethanol Production,” chapter 10 in Using Distillers Grains in the U.S. and International Live-stock and Poultry Industries, Iowa State University, Midwest Agribusi-ness Trade Research and Information Center at the Center for Agricultural and Rural Development . Retrieved from: http://www .card .iastate .edu/books/distillers_grains/pdfs/distillers_grains_book .pdf
Shurson, Jerry, and Mindy Spiehs . 2002 . Feeding Recommendations and Example Diets Containing Minnesota-South Dakota Produced DDGS for Swine, retrieved from: http://www .ddgs .umn .edu/feeding-swine/exam-pleswinediets-revised .pdf
Sinopec News (Zhongguo Shihua Xinwen Wang) . 2011 . Ranliao Yichun Chanye Fazhan Jinru Pingjing Qi (Ethanol Industry Development Reaches Bottleneck), news article, June 29 .
Southern Rural News (Nanfang Nongcun Bao) . 2011 . Youzhi Hanliang Jian-shao Huojiang DDGS Xing Jia Bi (Reduced Fat Content Could Lower the Value of DDGS), news article, November16 . Retrieved at: http://www .nfncb .cn/nccf/xm/4967 .html
Southern Rural News (Nanfang Nongcun Bao) . 2009 . Siliao Meijian Dusu Wuran Yanzhong (Serious Mycotoxin Contamination of Feed), news article, July 17 .
Tuan, F ., L . Hoffman, W . Lin, J . Hansen, and F . Gale . 2008 . China’s Poten-tial Demand for Ethanol Co-products . USDA, Economic Research Service internal report, July .
U .S . Department of Agriculture, Agricultural Marketing Service . 2012 . Live-stock and Grain Market News Portal . Retrieved from: http://marketnews .usda .gov/portal/lg
U .S . Department of Agriculture, Economic Research Service . 2011 . Feed Grains Database, based on August 2011 World Agricultural Supply and Demand Estimates . Retrieved from: http://www .ers .usda .gov/data/feedgrains/
U .S . Department of Agriculture, Foreign Agricultural Service . 2011 . Produc-tion, Supply and Distribution Online, based on August 2011 World Agri-cultural Supply and Demand Estimates . Retrieved from: http://www .fas .usda .gov/psdonline/
U .S . Department of Agriculture, Foreign Agricultural Service . 2012 . Global Agricultural Trade System Online . Retrieved from: http://www .fas .usda .gov/gats/default .aspx
25 China’s Market for Distillers Dried Grains and the Key Influences on Its Longer Run Potential / FDS-12g-01
Economic Research Service/USDA
U .S . Department of Agriculture, Foreign Agricultural Service . 2009 . U.S. DDGS Dashes for China, Mostly to the Feed Mills of Guangdong, GAIN Report Number: CH9611, Global Agriculture Information Network, July .
U .S . Department of Agriculture, Office of the Chief Economist, World Agri-cultural Outlook Board . 2012 . USDA Agricultural Projections to 2021, OCE-2011-1, February . Retrieved from: http://www .ers .usda .gov/publica-tions/oce-usda-agricultural-projections/oce121 .aspx
U .S . Grains Council . 2012 . “Low-oil DDGS Become Increasingly Avail-able,” Ethanol Producer, Vol 18, Issue 2, January 26 .
Wang, Enhui . 2011 . “Zhongguo Siliao Shengchan Zhuangkuang ji Fazhan Qushi (China’s Feed Industry Production Situation and Development Trend),” Agricultural Outlook, No . 6, 2011, pp . 43-46 .
Zhang, Qian . 2010 . Qianwan Dun Che Yong Yichun Chanliang Cunyi (Millions of tons of ethanol production in doubt), Caijing, August 11 . Retrieved from: http://www .caijing .com .cn/2010-08-11/110495605 .html