essais in economics of telecommunications: competition
TRANSCRIPT

HAL Id: tel-01702148https://tel.archives-ouvertes.fr/tel-01702148
Submitted on 6 Feb 2018
HAL is a multi-disciplinary open accessarchive for the deposit and dissemination of sci-entific research documents, whether they are pub-lished or not. The documents may come fromteaching and research institutions in France orabroad, or from public or private research centers.
L’archive ouverte pluridisciplinaire HAL, estdestinée au dépôt et à la diffusion de documentsscientifiques de niveau recherche, publiés ou non,émanant des établissements d’enseignement et derecherche français ou étrangers, des laboratoirespublics ou privés.
Essais in economics of telecommunications : competitionbetween services and between firms
Marc Petulowa
To cite this version:Marc Petulowa. Essais in economics of telecommunications : competition between services andbetween firms. Economics and Finance. Université Montpellier, 2015. English. �NNT :2015MONTD066�. �tel-01702148�

D������ ��� ��Université de Montpellier
Préparée au sein de l’école doctorale ED 231
Et de l’unité de recherche UMR 5474/1135 - LAMETALaboratoire Montpelliérain d’Economie Théorique et Appliquée
Spécialité: Sciences économiques
Présentée par Marc Petulowa
Essays in economics of
telecommunications: competition
between services and between firms
Sous la direction d’Edmond Baranes
Soutenue le 27 février 2015 devant le jury composé de
Mr. Edmond Baranes Professeur des Université de Montpellier Directeur
Universités de thèse
Mr. Thierry Pénard Professeur des Université de Rennes 1 Rapporteur
Universités
Mr. Wilfried Sand-Zantman Professeur des Université de Toulouse 1 Rapporteur
Universités
Mr. Benoît Mulkay Professeur des Université de Montpellier Examinateur
Universités
Mr. Marc Lebourges Directeur Orange S.A. Examinateur
Réglementation
Européenne
& Etudes éco.

«��� ersité n’entend donner aucune approbation ni improbation auxopinions émises dans cette thèse ; ces opinions doivent être considérées commepropres à leur auteur ».


R������������
Je remercie M. Thierry Pénard, Professeur des Universités à l’Université de
Rennes 1 et M. Wilfried Sand-Zantman, Professeur des Universités à l’Université
de Toulouse 1, d’avoir accepté la charge de rapporteur de thèse.
Je remercie également M. Benoît Mulkay ainsi que M. Marc Lebourges
d’avoir bien voulu juger mon travail.
Un très grand merci également à M. Edmond Baranes, Professeur des Uni-
versités à l’Université de Montpellier, d’avoir diriger ma thèse et de m’avoir
accompagné tout le long de cette aventure. De par sa facilité d’accès, ses com-
mentaires et ses suggestions, il m’a grandement allégé la tâche de rédiger ce
manuscrit.
Je tiens également à remercier Orange pour avoir financé ma thèse. Par
ailleurs, je remercie les nombreuses personnes chez Orange qui ont contribué
à la réalisation de cette thèse en partageant leur savoir avec moi. Tout partic-
ulièrement Julienne Liang, qui m’a encadré lors de mon séjour dans les locaux
d’Orange à Paris et qui a parfaitement su me remettre sur le bon chemin quand
je me suis égaré je ne sais pas où.
Je remercie également Volcy Lesca, Anne-marie Allouet, Anouk Mathieu,
Saghar Saïdi, Julienne Liang, Maude Hasbi Marc Lebourges, François Jean-
jean, Thomas Cadet, Olivier Chalmeau, Georges Vivien Houngbonon et Clau-
dia Saavedra pour les nombreuses relectures, commentaires et suggestions très
valorisants ou encore les collaborations fructueuses.
Merci également à toute l’équipe Europe-Economie de la DRG d’Orange
pour son accueil chaleureux et l’ambiance de travail très agréable.
Par ailleurs, je remercie Maude Hasbi, Thomas Cadet, Olivier Chalmeau
et Georges Vivien Houngbonon avec qui j’ai eu le plaisir de partager le bureau
au 78, ainsi qu’à Alleray. J’espère trouver à nouveau des collègues de bureau
avec qui le travail sera aussi agréable que ce fut le cas avec vous!
Je remercie de tout mon cœur Nathalie, Christiane, Maman, Anouk, Julie,
Sylvie, Lena, Sacha, Dario, John et Philippe de m’avoir supporté et d’avoir été
un si grand soutien pendant cette aventure. Il y a eu des moments difficiles,
i

��
mais votre soutien et vos sourires me les ont fait oubliés très rapidement.
Je remercie beaucoup Paolo, Carole, Denis, Jérôme, Anki, Katia, Andrei,
Fafou, Adrien, Nora, Jimmy et Josette pour leur soutient et leur curiosité
quant à mes travaux. Ensemble avec ma famille, vous m’avez été d’une aide
inestimable!
Je tiens à remercier Lionel pour son amitié et les nombreuses excursions et
promenades dans, sous et à l’extérieur de Paris. Ces moments étaient indis-
pensables au succès de cette thèse. Aussi, merci à tous les sportifs chez Orange
(Pascal, Lionel, Christophe, Richard, Flore,. . . ) avec qui j’ai eu le plaisir de
partager des moments de «détente» sur le terrain de foot ou encore lors des
footing aux bords de la Seine.
Sandra, Alain et Christian! Sans vous, je n’aurai jamais pu m’imaginer de
rédiger ce document! Je vous remercie vivement pour tout ce que vous avez
fait pour moi!
Merci également à tous doctorants de l’Université de Montpellier et parti-
culièrement Marsha, Sylvain et Marc de m’adopter dans leur bureau.
Sandra, Alain et Christian! Sans vous, je n’aurai jamais pu m’imaginer de
rédiger ce document! Je vous remercie vivement pour tout ce que vous avez
fait pour moi!
Finalement, je tiens à remercier tous celles et ceux qui ont contribué d’une
manière ou d’une autre à la réalisation de cette thèse et que je n’ai pas men-
tionnés précédemment.


C�������
Remerciements i
General introduction 1
Chapter 1:
Fixed-Mobile substitution and bundling 3�
1.1 Introduction . . . . . . . . . . . . . . . . . . . . . . . . . . . . . . ��
1.2 Literature review . . . . . . . . . . . . . . . . . . . . . . . . . . . . ��
1.3 Model specifications . . . . . . . . . . . . . . . . . . . . . . . . . . ��
1.4 Results . . . . . . . . . . . . . . . . . . . . . . . . . . . . . . . . . ��
1.5 Discussion and conclusion . . . . . . . . . . . . . . . . . . . . . . . !
Bibliography . . . . . . . . . . . . . . . . . . . . . . . . . . . . . . . . . �
Appendix Chapter 1 . . . . . . . . . . . . . . . . . . . . . . . . . . . . .
Chapter 2:
Socio-demographics and telecommunications services: Some
empirics 9�
2.1 Introduction . . . . . . . . . . . . . . . . . . . . . . . . . . . . . . ��
2.2 Literature review . . . . . . . . . . . . . . . . . . . . . . . . . . . . �
2.3 Model framework . . . . . . . . . . . . . . . . . . . . . . . . . . . . "!!
2.4 The data . . . . . . . . . . . . . . . . . . . . . . . . . . . . . . . . "!#
2.5 Estimation results . . . . . . . . . . . . . . . . . . . . . . . . . . . ""
2.6 Discussion and conclusion . . . . . . . . . . . . . . . . . . . . . . . "$�
Bibliography . . . . . . . . . . . . . . . . . . . . . . . . . . . . . . . . . "��
Appendix Chapter 2 . . . . . . . . . . . . . . . . . . . . . . . . . . . . . "�%
Chapter 3:
Combining competition law and sector-specific regulation:
the case of margin squeeze 1�&
3.1 Introduction . . . . . . . . . . . . . . . . . . . . . . . . . . . . . . "��
3.2 Literature Review . . . . . . . . . . . . . . . . . . . . . . . . . . . "��
iv

3.3 Model specifications . . . . . . . . . . . . . . . . . . . . . . . . . . "#"
3.4 No regulation . . . . . . . . . . . . . . . . . . . . . . . . . . . . . . "#�
3.5 Upstream market regulation . . . . . . . . . . . . . . . . . . . . . . " $
3.6 Discussion and conclusion . . . . . . . . . . . . . . . . . . . . . . . "��
Bibliography . . . . . . . . . . . . . . . . . . . . . . . . . . . . . . . . . "�
Appendix Chapter 3 . . . . . . . . . . . . . . . . . . . . . . . . . . . . . "�!
General conclusion &2�
List of Figures &12
List of Tables &11


G����'( ����)*+���)�
Imagine today’s world without any information and communication technolo-
gies (ICT). Societies would not use Internet, smartphones or computers. Peo-
ple would not communicate via easy and quick E-mail and visioconferences
would actually take place in one and the same room. Many things people
nowadays consider as perfectly integrated in everyday life would simply not be
available.
By simply looking, in contrast, at the reality of today, the impact of ICT
on people’s life becomes strikingly clear. The ICT, as a general purpose tech-
nology, turn out to be a pillar of the economic development of our societies.
From an economic point of view, many studies have provided the empirical
evidence: 37 % of the growth of the gross domestic product generated in the US
between 2005 and 2010 are attributed to the ICT. For the German case, this
number is about 32 % and 26 % in France (Arlandis et al., 2011-. /04 �54 5�67
does the consumption and usage of ICT affect economic growth, but it also
has considerable spill-over and network effects. For instance, by learning how
to efficiently use the ICT, the labour force in general increased its productivity
by 1.3 percentage points in the US and by 0.7 percentage points in the EU
during the period 1997 - 2005 (Welsum et al., 2012-. 86:5, ;: Maliranta et al.
<2010- :=5>?@, 4=? =�A= B����:= 6;E50F HF5@0I4� �47, 6��J?@ ;K5�A 54=?F: 45
the development of ICT, induced a beneficial creative destruction and a more
efficient use of resources.
Closely behind the device manufacturing ranks the telecommunications sec-
1

L?�?F;6 ��4F5@0I4�5� $
tor as the most important component of the ICT industry, with up to 37 % of
the GDP generated by the European ICT industry in 2010 and almost 20 %
of ICT employment (approximately 1 million jobs).1
865�A:�@? the political will to unleash the potentials of ICT and the telecom-
munications sector - see for instance the EU’s Digital Agenda from 2000 and the
Commission’s proposal for a Connected Continent from 2013 -, public decision
makers largely relied on sector-specific regulation. In their view, the introduc-
tion of a competitive setting could release those potentials and thus benefit
the whole society. But, since the formerly vertically integrated monopoly has
no private incentive to encourage competition, public decision makers relied
on regulatory power to achieve their objectives.
It is a well-known fact that the duplication of a nation-wide network in-
frastructure that builds on an identical technology as the existing one is eco-
nomically not viable because of the extremely high sunk costs. The latter
may constitute insurmountable barriers to entry for new market players and
induced the idea of the ladder of investment, which has been theorised by Cave
<2006a-M I5KH?4�4�5� �� 4=? >=56? ��@0:4F7 :=506@ E? ?�I50F;A?@ �� ; :4?H>�:?
manner. It should first take place on the service layer via regulated access to
the incumbent’s physical fixed infrastructure. This should allow new entrants
to provide telecommunications services offers by using the incumbent’s net-
work. Once this is achieved, competition should climb up to the next industry
level, namely the infrastructure layer, thus creating facility-based competition.
To that end, downstream competitors should invest in their own infrastructure
using new technologies.
Whereas service-based competition is undeniably achieved in Europe, the
recent emergence national subsidy plans to help the deployment of new broad-
band technologies indicate that the mechanism behind the ladder of investment
1 Source: Eurostat�N Statistics Explained. Accessed last: 19/11/2014. Similar numbersare found for the data provided by the US Bureau of Economic Analysis (BEAOP

L?�?F;6 ��4F5@0I4�5� �
does not perfectly work.2 B;I�6�47QE;:?@ I5KH?4�4�5� �� 4=? ST?@ I5KK0��I;Q
tions market is thus not yet achieved and it seems that competitive forces are
insufficient to achieve this objective. Some papers investigate the relevance of
Cave’s concept for achieving broadband investment. Whereas some of them
state that service-based competition is necessary for reach facility-based com-
petition (Oldale and Padilla, 2004-, 54=?F: H04 �4: K?F? ?T�:4?�I? ��45 U0?:4�5�
(Bacache et al., 2013-.
A first area of application of sector-specific regulation is thus price reg-
ulation of the access to the incumbent’s fixed network. But the market of
mobile communications is subject to regulatory intervention on prices, too,
even though much later than the fixed counterpart. In particular, the mobile
termination rates, basically under the network operator’s scrutiny and thus
monopolistic, were, for some time, unregulated because competition in the
mobile market was thought a sufficiently strong force to drive them down.
Though, these rates remained at a high level until regulators intervened. But,
the waterbed effect, i.e. an effect under which end prices for communications
increase due to termination rates reductions in order to keep profits unchanged,
occurred. However, with the evolution of the calling pattern, in particular the
increase of mobile usage and thus the number of mobile-to-mobile calls, the
waterbed-effect vanished and final prices decreased. Similarly to the mobile
termination rates regulation on a national basis, regulatory instances seek to
push roaming costs, i.e. costs for calling when traveling abroad, down to 0.
As the European Digital Agenda and the Commission’s regulatory proposal
for a Connected Continent show, sector-specific regulation does no longer al-
most exclusively deal with the proper enhancement of competitive forces in
order to achieve lower end user prices. In effect, regulators and legislators are
2 See for instance the website oV WXY ZY[\]^ VY_Y[]` \a^aNW[b Vo[ W[]cd ]^_ _aeaW]`infrastructure, providing information on the financing of broadband deployment. Similarinformation is provided by the relevant French ministry’s website ]^_ fb WXY [Y`Yg]^WBelgian ministryP

L?�?F;6 ��4F5@0I4�5� �
appealed to attack several fronts, such as effectively promote a single digital
market and the emergence of pan-EU mobile service operators or protecting
the Open Internet.
Regarding the single digital markets, many challenges lie ahead, among
which the most complicated are going to be the creation of a harmonised envi-
ronment in spectrum allocation matters, a unified pricing schemes and pan-EU
consolidation. At present, the 28 member states often have very complex auc-
tion designs for assigning the spectrum, an essential facility for mobile commu-
nications. This complexity incurs considerable transaction costs and end up in
very high expenditures for mobile operators. With a single, harmonised envi-
ronment, mobile operators could more easily implement their business outside
their national market. Although, to date, Europe’s mobile communications
market appears highly fragmented if the number of service providers may be
used as an indicator. In Europe, the Herfindahl-Hirschmann index for the mo-
bile industry ranges from ± 2500 (Poland) to ± 4400 (Malta), whereas that
index for the whole US yields ± 2300 (GSMA, 2013b-. h=? �� ?:4K?�4 I;H;IQ
ity necessary for eventual market consolidation, and thus for increased success
probability of a pan-european undertaking, may not be present. Finally, a
unified pricing scheme for each operator throughout the EU seems a highly
complicated task. Indeed, aligning prices in Romania (average cost of 2.2 e
cents for a domestic call) and in France (12.7 e cents) may reveal challenging.3
h=? I5F? 5j 4=? HF5E6?K F?6;4� ? 45 4=? HF54?I4�5� 5j 4=? kH?� l�4?F�?4 �:
the concept of net neutrality, introduced by Wu <2003-. h=? �@?; E?=��@ 4=�:
concept is the non-discrimination of any data packet that travels through the
Internet. More specifically, a network operator should not be allowed to dis-
criminate contents sent over its network, even if they require many resources.
Since these resources are represented by bandwidth available through the ca-
3 See Commission’s press release o^ ]gY[]eY d]`` m[adY a^ WXY np V[o\ qth August 2013.

L?�?F;6 ��4F5@0I4�5� #
bles paid and deployed by the network operator, the latter sees itself entitled
to monetise the usage of its pipes.4 r5F?5 ?F, 4=? �FF? 5I;E6? ? 5604�5� 5j
end user pricing towards flat-rates, which additionally know considerable price
decreases, has led network operator to turn towards applications and content
providers for new revenue streams.5 s?4>5FJ 5H?F;45F: ;�@ ;HH6�I;4�5�: ;�@
contents providers evidently disagree, as neither side wants to be the only
one to contribute to the network expansion and each side invokes arguments
relative to investment and innovation incentives.6
B��;667, it should be noted that the debate also raises problems from a judi-
cial point of view. For instance, in its 2013 proposal the European Commission,
defined specialised services that may benefit from a prioritised treatment by
network operators. The underlying definition invokes enhanced quality of ser-
vice for these specialised services, without defining any threshold, leaving thus
many space for interpretation and many ahead lying discussions.
In the US, the problem does not lie in the definition of some service allowed
to benefit from a favoured treatment, but in the question as to who has the
relevant regulatory power. Indeed, the Federal Communication Commission
(FCC) released in 2010 an order aiming to prohibit any unequal treatment
4 Expression used by Ed Whitacre, former CEO of AT&T in a Bloomberg a^WY[gaYt o^the competitive and regulatory environment in the American Broadband industry.
5 The two-sided market literature showed that the platform (which here are the Internetservice providers) prefers to set low prices for the side that is most valued, while the other sidesomehow cross-subsidises (Armstrongu 2006v Rochet and Tiroleu 2006OP wW aN oVWY^ \Y^Wao^Y_that end users are the most valued side, as they provide advertising revenues to contentproviders. In this light, the fact that network operators turn towards content providers inorder to monetise the latters’ access to consumers appears consistent.
6 Several academic paper are also dedicated to this debate with the idea to describe theincentive to innovate and invest of network operators as well as content and applicationsproviders. For instance, Wu x2003O do^Na_Y[N WX]W a^^og]Wao^ ]W WXY ]mm`ad]Wao^N ]^_ do^WY^WNlayer is more important than innovation at the network layer and concludes that a netneutrality regime is welfare superior. On the contrary, Yoo x2010Ou do^Na_Y[N WX]W ] ^o^yneutral regime is superior, since the allocation of scarce bandwidth to the most efficientis simply the natural evolution of a network trying to respond to an ever-growing diversityof customer demands (Yoou 2010OP zWXY[ ]{WXo[N ]`No do^d`{_Y o^ tY`V][Y N{mY[ao[aWb oV ]discriminatory regime, because of a larger variety of quality of service and contents, reducingthus the risk of exclusion of applications that only need a low quality of service Hermalinand Katz x2007O o[ fYd]{NY a^gYNW\Y^WN ]W WXY ^YWto[| `]bY[ aN Y^X]^dY_u [Y_{da^e WX{N WXYnetwork congestion Bourreau et al. x2014OP

L?�?F;6 ��4F5@0I4�5� %
by Internet service providers.7 h=�: 5F@?F, =5>? ?F, =;: E??� ;��066?@ E7 4=?
US court of appeals, arguing that the FCC chose not to classify broadband as
an telecommunications services, but as an information service.8 B5665>��A 4=?
US Telecommunications Act of 1996, though, the FCC’s power is restricted
to telecommunications services. Informations services are thus not under the
scrutiny of the American federal regulator. There is now on ongoing reflexion
on whether to reclassify broadband services, so that they fall under the FCC’s
mandate, and more generally on the FCC’s mission in the Internet age.
As mentioned above, many discussion lie yet ahead, as solution to impor-
tant issue are still unclear. Although, the telecommunications sector has been
conferred an important role and it is therefore of crucial significant to analyse
and understand the underlying economic specificities of that industry. The
aim of this thesis is thus to contribute in that it focussed on two major top-
ics that can be classified within the area relative to the competition in the
telecommunications sector.
Competition between communication services
The first two chapters of this thesis focus on the competition between fixed
and mobile communications services. This competition arose as an increasing
number of fixed communications services have also become available on mobile
networks.
The emergence of Fixed-Mobile substitution
On the demand side, service competition began in voice services. As mobile
telecommunications services are experiences goods and due to both price and
non-price factors (e.g. poorer quality of service, geographical network cover-
age or simply the handiness of the mobile phones available at that time), mo-
7 The FCC’s “Open Internet Order” can be found hereP8 See here Vo[ ] }Y{WY[�N ][Wad`Y o^ WXY N{f~YdWP

L?�?F;6 ��4F5@0I4�5�
bile subscription rates were low.9 8: �?4>5FJ I5 ?F;A? ;�@ U0;6�47 �KHF5 ?@,
Fixed-Mobile substitution (FMS) took place and began with the substitution
of the subscription of a second fixed telephony line by the subscription of a
mobile plan. Then, FMS in voice service matters continued to expand. But
this expansion has also been fostered by technological advances. Marketing
and pricing strategy like on-net calling (where a user incurred no costs when
the call was placed within the same network) or as is nowadays often the case,
unlimited calling regardless of the terminating network are also explaining fac-
tors. Most recently, mobile operators introduced unlimited calling from mobile
to fixed networks. Consequently, national calls, whether terminated on a fixed
or a mobile network, are increasingly originated on a mobile network. Follow-
ing the European Commission, mobile voice traffic overtook fixed voice traffic
during 2008 - 2009.
The number of services available simultaneously on both infrastructures
continued to expand as technology evolved. Within 40 years, 4 technological
evolutions have been developed and successfully marketed. But the most im-
pressing evolution took place in the last 15 years with the emergence of three
technologies: GSM, UMTS and finally LTE.10
���������i��� ������i�� i� ���i�� ������i���i��� �������
Such technological evolution did not only impact voice services, but also al-
lowed to introduce new and innovative services, with mobile broadband up-
front. Mobile broadband has benefitted from the technological evolution as
connection and transmission speeds have constantly improved. The latest tech-
9 At the beginning of the 1990’s, the weight of a mobile phone ranged from 250 gr. upto 500 gr.
10 GSM: Global System for Mobile Communications, arrived at the beginning of the 1990,is the basis for the more efficient GPRS (General Packet Radio Service), introduced around2001 and EDGE (Enhanced Data rates for GSM Evolution), introduced around 2004.UMTS: Universal Mobile Telecommunications System, with the extension HSPA (High SpeedPacket Access), introduced by 2010.LTE: Long Term Evolution

L?�?F;6 ��4F5@0I4�5� �
nology, LTE will allow mobile users to surf the web at theoretical download
speeds approaching 100 Mbps when in motion.11 �0I= @;4; F;4?: ;F? :0�I�?�4
to allow for instance, IP-TV on mobile devices or mobile visioconferencing.
The most widespread mobile broadband technology to date is HSPA (com-
monly known as 3G+), which covers practically 100 % of Europe’s population
(Commission <2013-, H. �-. 864=50A=, �0F5H?: H?�?4F;4�5� F;4? �:, 5� ; ?FQ
age, relatively low compared to other parts in the worlds: considering all the
possible connecting devices (smartphones, tablets and laptops), 54 % of Euro-
peans have subscribed to a mobile broadband plan by the end of 2012 (idem, p.
74), whereas, for instance, South Korea’s penetration rate is approaching 110
% (GSMA <2013a-, H. �!-.12 s54? =5>? ?F 4=? @� ?FA��A H�I40F? �� �0F5H?M
the Nordic countries announce a mobile broadband penetration rate of close or
above 100 % (Danemark: 98 %, Sweden 106 %, Finland: 107 %) and 18 of 27
EU member states have penetration rates below the EU average (Commission
<2013-, H. �-.
Increasing mobile subscription and evolving pricing schemes
With increasing mobile subscription take-up rates, network operators enjoyed
economies of scale and scope, ending up in a decrease of average cost of services
and hence mobile plans. But economies of scale and scope were not the sole
factor for decreasing mobile communications prices. Increasing competition
also plays a major role. For instance, in January 2012, Free Mobile entered
the French mobile communications market as the fourth mobile network opera-
tor.13 BF?? r5E�6? >;: 6;0�I=?@ >�4= ;� ;AAF?::� ? HF�I��A H56�I7 ;�@ 4F�AA?F?@
11 However, such download speeds rate are contingent to many factors, e.g. the consumers’handset, the operators’ frequency used for LTE deployment, the type of antenna installedby operators, the number of consumers connected to a given cell, etc.
12 GSMA (GSM Association) is an association representing the interests of over 1000mobile telecommunications operators using the GSM standards and aiming to elaborateand promote cross-network standards such as e.g. the usage of SIM-cards.
13 If mobile virtual network operators are added, the French metropolitan market countsnot less than 47 operators (all markets confounded, residential and professional). Even

L?�?F;6 ��4F5@0I4�5� �
the low-cost era in the French mobile industry. In order to illustrate, the av-
erage monthly bill for mobile services can be mentioned: the average bill was
approximatively 23 e before Free’s market entry and, following ARCEP, about
18 e by the end of September 2013 (Arcep, 2014b-. 8�54=?F F?;:5� ?TH6;����A
the decrease of mobile communications plans is regulatory intervention that
induced a considerable decrease in mobile termination rate.14
h=? ;j5F?K?�4�5�?@ 4?I=�565A�I;6 ? 5604�5�: =; ? ;6:5 I5K? 45A?4=?F >�4=
evolving pricing schemes. For instance, with the packeting technique intro-
duced with GPRS, the tariff scheme passed from a connection basis towards
a consumption basis. Said otherwise, before GPRS, the consumer had to pay
for the time he was connected as his connection required the occupation of a
full ”line” during his connection time, which was due to the circuit-switching
technique. With GPRS, the network evolved towards packet-switching which
allows the sharing of the line between several connected users. The fee to
pay by the user in a packet-switching infrastructure is therefore based on the
information effectively sent or received, and thus based on the effective con-
sumption.
It should however be noted that evolution in communications networks
does not constitute the only factor responsible for the evolution of the commu-
nications’ ecosystem. In order to fully benefit from the advantages provided
by improved networks, consumers need compatible handsets. The industry of
mobile devices such as smartphones and tablets has reacted towards new possi-
bilities provided by mobile communications networks and developed handsets
that are no longer simple telephones. This new generation of handsets offers
though most of the MVNOs are specialised in a given market segment (e.g. seniors, foreign-ers, etc.), they altogether represented 11,6 % of the French market by june 2014 (Arcepu2014aOP
14 Mobile termination rates can be defined as the fee an operator A has to pay operatorB, when a call, originated in A’s network, is terminated in B’s network. Relying on figuresprovided by the Body of European Regulators for Electronic Communications (BEREC),GSMA indicates an annual decrease of up to 18 % of mobile termination rates during theperiod 2006 - 2012 (GSMA x2013aOu mP �qOP

L?�?F;6 ��4F5@0I4�5� "!
usage possibilities similar to desktop computers thanks to increasing user-
friendliness (e.g. illustrative icons) or technical efficiency (e.g. more efficient
processors, displays with higher resolution). Users experience thus a higher
quality of service when for instance watching a film on their tablet or smart-
phone. Furthermore, content providers such as social networks, video or music
streaming developed applications that allow users to consume these contents
on any mobile device, which increases consumers’ utility of subscribing to a
mobile offer.
Increasing mobile data consumption
Alongside increasing mobile subscription penetration, mobile device penetra-
tion rates are strongly increasing and are assumed to contribute greatly to the
increase of mobile data traffic. Cisco provides a report and forecast of mobile
data traffic and indicates that, in 2012, it increased by 70 % and that 885
petabytes per month have travelled over mobile networks, which corresponds
to 18 times the size of the entire global Internet in 2000 (Cisco <2014-, H. "-.15
r5F?5 ?F, ��:I5 ?:4�K;4?: K5E�6? @;4; 4F;�I 45 AF5> ;4 ; F;4? 5j %% � H?F 7?;F
during the period 2012 - 2017 (idem, p. 3). This traffic growth will be fostered
by i) further deployment of LTE network (”In 2012, a [. . . ] 4G-connection
generated 19 times more data traffic on average than a non-4G connection,
(idem, p. 2)) and ii) the increasing importance of smartphone penetration
(about 68 % of global mobile traffic will be generated by smartphones (idem,
p. 7)).
Although mobile broadband will continue to gain in importance, it will
only represent a fraction of global Internet traffic. As Cisco <2013b- F?H5F4:,
mobile data traffic does merely represent 2 % of global IP traffic in 2012 and
about 9 % in 2017. Most of the Internet traffic will thus be put through
15 1 petabyte (Pb) = 1000 terabyte (Tb) = 1000 Gigabytes (Gb). For comparison, a 2hour film in HD needs about 4 Gb.

L?�?F;6 ��4F5@0I4�5� ""
the fixed Internet access, resp. fixed broadband, which has the undeniable
advantages of i) offering higher connection speeds than mobile broadband and
ii) unlimited data volume.16 h=�: 6;44?F ;@ ;�4;A?, =5>? ?F, �: @0? 45 4=?
scarcity of the radio spectrum available to mobile operators for providing their
mobile services, which reduces their capacity to offer high volume caps of
mobile data.
Technological evolution if fixed communications matters
As did mobile networks; fixed networks have been upgraded as well. The tradi-
tional copper network, which, in its early beginning allowed for analogue voice
services and narrowband Internet access, has also been subject to constant
evolution. The copper pair benefitted from the digitalisation and the infor-
mation sent over a fixed network is thus converted into data relying on the
Internet Protocol (IP). This allowed steadily increasing bandwidth efficiency
and an enhanced range of services: Voice over IP (VoIP), IP-TV with catch-
up TV or VoD and high-speed Internet.17 ��4= 4=? 0HAF;@? 45>;F@: 5H4�I;6
fibre network, fixed networks will be able to offer connection speeds up to 1
Gbps for downlink and 10 Mbps for uplink.
With the latest technologies deployed in mobile and fixed networks, both
infrastructures converge. This convergence towards all IP implies a changing
relation between fixed and mobile services. As mentioned above, voice services
are subject to increasing substitution between fixed and mobile: in early 2011,
around 27 % of the Europeans stated to use mobile voice services exclusively
against 21 % by the turn of 2005 / 2006 (Eurobarometer, 2006, 2011-. 8: j5F
the US, a NHIS survey reveals that almost 45 % of American households were
16 In its report from 2012, only one of the surveyed operators had a data volume cap onfixed data volume (OECD x2012Ou mmP ��OP
17 Video on Demand is a service allowing consumers to watch any TV Show at any timethey want, provided that the show is comprised in operator’s VoD catalogue. Catch-up TVis defined as the possibility to replay a TV show even shortly after its first airing, althoughonly for a short period of time.

L?�?F;6 ��4F5@0I4�5� "$
wireless-only in the first semester of 2013, against approximatively 6 % by the
turn 2005 / 2006 (Blumberg & Luke, 2007, 2014-.
As for broadband, the relation between fixed and mobile is less clearcut as
it can go in either direction.
Fixed-Mobile substitution in broadband matters
Assessing this relation on the demand side is delicate given the heterogeneity of
consumers’ needs. Some consumers are able to satisfy their consumption needs
by using only a mobile offer. For instance, according to an international com-
parison made by the british regulator OFCOM in 2012, more than a quarter of
Italian households only have mobile broadband at home (OFCOM <2013-, H.
213).18 ��K�6;Fly, one in five Australian households indicate to be mobile-only
broadband users. On the other hand, some consumers are heavy-players in
Internet usage and are subscribing to both fixed and mobile in order to enjoy
more data capacity.
The only evidence for actual FMS in broadband matters, that is approved
by a national authority, is provided by the Austrian market. During its revision
of relevant markets in 2009, the Austrian national regulatory authority TKK
considered mobile broadband to be ”[. . . ] a sufficiently close substitute for
DSL and cable connections [so as] to include all of them in the same retail
market.” (Berec, 2011-.19 L� ?� 4=�: S�@��A, h�� @?I�@?@ 45 >�4=@F;> ?TQ
ante regulatory constraints on residential wholesale broadband access.
18 Office of Communications.19 Telekom-Control-Kommission. TKK based their finding on i) a forward-looking con-
sumer switching behavior and ii) their past switching behavior. The forward-looking ap-proach relies on the hypothetical monopolist-test which assesses whether a 5 to 10 % priceincrease would be profitable for the concerned undertaking. Under such a price evolution ofall available DSL and cable offers, 25 % of respondents said they would switch away fromDSL, resp. cable, among which almost half would switch for mobile broadband. Analysingthe past switching behavior revealed that the flow from DSL and cable towards mobile hasbeen stronger the flow in the opposite direction. Moreover, TKK reports that 31 % of house-holds without Internet access would subscribe a mobile broadband offer, whereas only 17 %would subscribe to DSL and 13 % to cable.

L?�?F;6 ��4F5@0I4�5� "�
Fixed-Mobile substitution on the supply side
On the supply side, mobile and fixed networks are most likely to be comple-
ments, because mobile networks only allow for limited capacity and putting
the global data traffic only through mobile networks would likely to be unsus-
tainable. As consumers’ demand in data traffic is increasing steadily, telecom-
munications operators need fixed networks to discharge their mobile networks
and to ensure a given level of quality of service. They can do so by diverting
data traffic that has been initiated on a mobile network to a fixed network.20
� �@?�467, I5�:0K?F: I506@ �54 E?�?S4 jF5K 4=? 4?I=�565A�I;6 ? 5604�5�:
described above if telecommunications operators had not invested in infrastruc-
tures. Deploying such network infrastructures bears tremendous investments
costs.21
��A= investment costs and fierce competition in both service markets pushed
operators to adopt strategies that allow i) to attract new consumers, respec-
tively to reduce existing consumers’ willingness to churn and ii) to foster adop-
tion of new infrastructures. This latter point is especially important when tak-
ing into consideration the wireless-only consumers and the investment costs in
fixed network infrastructures. Moreover, its importance increases even more
given the fact that, so far, no innovative services (the so-called killer services)
20 Diverting mobile data traffic is possible through promoting Wi-Fi Offload, by whichthe consumers connect a handset device, via Wi-Fi, on a fixed broadband network. In somecountries, operators offer their fixed broadband subscribers the possibility to ”open” theirfixed broadband access, creating thus a Wi-Fi-community, which allows mobile users fromthe same operator to connect their handsets to that ”opened” access via Wi-Fi. Anothermeans of traffic diversion is FemToCell, which can be defined as an extension of fixedbroadband network. Via a ”miniature base-station” connected to the fixed access, operatorscan increase or improve the mobile network signal. The demanded data is, however, handedover to the fixed network.
21 In France, total investment costs for the deployment of a nation-wide optical fibrenetwork are estimated around 20 to 30 billion e. The costs of upgrading the mobile networkto LTE is delicate to estimate as this depends on each operator’s existing equipment in thebase stations. However, consultants from PolyConseil estimate the upgrade to cost around 2billion e for the incumbents Orange, SFR and Bouygues and about 1 billion for the entrantFree Mobile. Besides the costs for this infrastructure upgrade, the necessary licenses had tobe acquire, for which the four operators paid 3,5 billion e. Find PolyConseil’s report hereP

L?�?F;6 ��4F5@0I4�5� "�
have been developed that create a consumer’s need and thus an incentive for
him to subscribe.22
����ice bundling as marketing innovation
One adopted strategy is service bundling. In the telecommunications sector,
service bundling exists under various forms. In the mobile segment, almost
any offer can be considered as a bundle of a given amount of minutes for
calling, text messages and a some limited data volume cap. Similarly, in the
fixed market, almost every operator offers a complete range of service bundles
that combines two out of three or all three possible services (fixed voice, fixed
broadband and TV). Dual-play offers, i.e. a basket of two out of three services,
are most popular in Europe with around 25 % of Europeans followed by triple-
play offers (16 %, Eurobarometer <2013-, H. $%-.
The latest evolution in bundling practises is the combination of mobile
and fixed services in one offer. On a European level, such offers have yet not
been massively subscribed (approx. 4 %), but many divergences exist between
European Member States. In some countries, quadruple-play offers do not
seem to attract much of consumers’ interest, as, following a report Analysys
Mason report of 2013, it is estimated to see around 10 % of fixed services
subscriptions to be bundled with mobile services in Germany, Poland or the
UK.23 �5>? ?F, �� 54=?F I50�4F�?:, U0;@F0H6?QH6;7 5�?F: A?4 K0I= ;44?�4�5�
from consumers. In Spain, for instance, the commercialisation of Telefònica’s
quadruple play offer Fusiòn incited 21 % of Spanish households to bundle
mobile and fixed broadband by 2012 (and its adoption rate is estimated to
double in 2017).24 BF?�I= =50:?=56@: ;6:5 :??K 45 E? j5�@ 5j U0;@F0H6?QH6;7
offers, as the subscription rate is estimated at 42 % in 2012 with potential to
22 Examples for such killer services in mobile communications are voice services for 2Gand mobile broadband for 3G.
23 See here Vo[ ] f[aYV N{\\][b oV �^]`bNbN �]No^�N [Ymo[WP24 idem.

L?�?F;6 ��4F5@0I4�5� "#
increase up to 75 % in 2017.25
B5F I5�:0K?F:, 4=? ��4?F?:4 5j H0FI=;:��A ; E0�@6? 5j :?F �I?: �: K064�H6?.
Besides increased simplicity, transparency and a reduced number of bills, they
also pay less, since bundles are offered with the discount on the individual
(stand-alone) prices. For undertakings, however, the effects of discounting are
not always clear-cut. The (short-run) success of Telefònica’s Fusiòn and also
in the French market Orange’s quadruple play offer Open and Free Mobile’
offer is although palpable. In particular, Telefònica managed to recoup all
its 2011 / 2012 losses in terms of customer base within a few months after
launching Fusiòn.26 8: j5F 4=? BF?�I= K;FJ?4, >�4=�� ;HHF5T�K;4� ?67 � 7?;F:
after launching its quadruple-play offer, Orange claims to have around one
third of its fixed broadband customer base switched to the quadruple offer
and it is estimated that around half of Free’s customer base subscribed to the
bundle.27
864hough, the practise of discounting may have an important drawback.
More specifically, mobile broadband has been the value-added service for op-
erators when mobile plans with 3G access have been marketed. Now, this
value-added service is part of a competitive race for market shares and in-
creased consumer loyalty. As consumers are rational in the sense that they
choose the least expensive offer that best suits their needs, discounting may
lead to reduced market value of broadband services. But, all operators in a
(given) market introduce bundled offers, which raises the question whether
such pricing strategies are profitable or not.
25 idem.26 In 2011 / 2012, the Spanish incumbent abandoned the system of terminal subsidies,
upon which over 1 million consumers left Telefònica for one of the competitors. See forinstance hereP
27 Source: LaTribuneP

L?�?F;6 ��4F5@0I4�5� "%
Chapter 1: Service bundling and Fixed-Mobile substitution
The first chapter of this thesis addresses this issue and analyses the potential
impacts of service bundling in the telecommunications industry given FMS. In
particular, via a micro-economic modelling, it analyses the impact of introduc-
ing a bundle discount on consumer demand for the Fixed-Mobile bundle, fixed
and mobile as stand-alone services and the demand for wireless-only. More-
over, the effects on operators’ profits are analysed as well as social welfare.
This analysis considers two multi-market firms and shows that, under sym-
metry, service bundling is a situation akin to a prisoner’s dilemma: in equilib-
rium, neither firm wants to, but both have to offer a bundle as a consequence
of individual incentive to do so.28 B�FK: 65:? HF5S4: ? ?� 4=50A= 4=? :=;F? 5j
consumers subscribing to both services increases (i.e. the number of wireless-
only consumers decreases upon introducing a discount). But, with the discount
acting as a competitive tool, operators attract more consumers towards their
bundle. Since the bundled price is lower than the sum of stand-alone services,
profits are reduced. Consumers on the other hand are better off, precisely
because of the discount. Hence, consumer surplus increases and the increase
of consumer surplus more than compensates the operators’ profits losses, such
that, at the end, social welfare increases.
Although, if one firm is able to provide a higher-valued fixed service (i.e.
if firms are not symmetric), the analysis shows this firm always increases its
profits when offering a discount, whereas bundling is a Maximin strategy for
the competitor: it minimises its losses when it bundles as well. Notwithstand-
ing, the firm with the higher-valued fixed service has no incentive to induce
all the wireless-only consumers to subscribe to fixed service as well. Indeed,
the presence of wireless-only consumers implies that the fixed services market
28 Symmetry between firms is assumed to occur when consumers have the same valuationfor fixed services regardless the firm that offers the product.

L?�?F;6 ��4F5@0I4�5� "
is not fully covered. With a fully covered fixed market, bundling would not
be a profitable strategy. Hence in equilibrium, operators will not offer a dis-
count when both markets are fully covered. Moreover, if both services were
perfectly substitutable, bundling would again not be profitable. This shows
that bundling is profitable for at least one firm, provided that fixed and mobile
service are neither too strong complements, nor perfect substitutes. Similarly
to the symmetric case, consumer surplus and social welfare increases.
Chapter 2: Socio-demographics and telecommunications
Fixed-Mobile Substitution is also at the core of the second chapter of this the-
sis. Chapter 2 attempts to empirically assess the impacts of socio-demographic
variables on the demand for telecommunications services in France.
Data from a consumer’s experience survey is fitted using a multinomial
logit model. This work seeks to identify what characteristics influence the
probability of a consumer to be wireless-only, to purchase a bundled offer or
several stand-alone service offers. Primary results confirm the findings of the
existing literature: the less revenue a consumer has, the more likely he/she is
to be wireless-only which suggest the existence of a stronger budget constraint
for these consumers. Another result suggest an incumbency advantage, espe-
cially in rural areas, in the sense that Orange’s consumers are less likely to be
wireless-only as customers from other market players.
The interaction of sector-specific regulation and compe-
tition law: the case of margin squeeze
Chapters 1 and 2 focus on competition between services, which can also be
considered as inter-platform competition or infrastructure-based competition.
But, at the beginning of the liberalisation process in the late 1990’s, compe-
tition took place on the fixed infrastructure, as mobile networks had, to that

L?�?F;6 ��4F5@0I4�5� "�
date, not yet been sufficiently deployed to exert a competitive pressure on
fixed networks. Thus, intra-platform competition was the first notable form of
competition in the telecommunications sector. Sector-specific regulation has
its part in this event.
Besides regulatory constraints, firms must also comply with common com-
petition law. However, the interaction between regulation and competition law
can have important impacts on the industry outcome. The next chapter aims
at analysing this interaction and its impacts by looking specifically on margin
squeeze regulation.
The telecommunications sector is greatly shaped by sector-specific regula-
tion. The aim of sector-specific regulation is to create and promote a com-
petitive environment using different tools such as access obligations and price
regulation. Even though, these tools could concern both sectors, mobile and
fixed, this chapter will focus on regulatory intervention in the fixed sector.
Sector regulation has been set up when the liberalisation process of the
telecommunications industry has been initiated.29 �F�5F 4=�: HF5I?::, ST?@
networks were in the hands of a legal or private monopoly, as it was more
economically rational to have the network deployed by one single firm, rather
than several competing firms. With the introduction of competition in fixed
telecommunications, the main concern of authorities was how to best create
a competitive environment in the downstream market, given the fact that
the network infrastructure had been inherited by the former legal monopoly,
which became thus monopolist over an essential facility. This configuration,
29 Several authorities are implicated in the process of liberalisation. First, the EuropeanCommission, in light of its goal to create a single internal market at European level, setstargets to achieve and provides a regulatory framework and remedies for eventual marketfailures. See for instance the Commission’s notice on the application of the competition rulesto access agreements in the telecommunications sector (Commission x1998Ou XY^dYVo[WX ac-cess notice). Second, at a national level, national competition authorities (henceforth NCAs)survey the application of European and national competition law and the proper functioningof the competitive process. Finally, also at a national level, national regulatory authorities(henceforth NRA) are specifically invested to set up a national regulatory framework ac-cording to the prescriptions provided by the Commission.

L?�?F;6 ��4F5@0I4�5� "�
a vertically integrated upstream monopolist that competes in the downstream
market with rivals that must rely on the integrated firm’s network, raised (and
still raises) concerns of abuse of dominance by the integrated firm and may
call for regulatory intervention.30
���� regulatory tools
A first move towards effective downstream competition has been made by the
access obligation laid upon the vertically integrated firm. More specifically, the
incumbent firm has been obliged to unbundle its local loop, i.e. to grant access
to the part of the network that connects the consumer to the main distribution
frame.31 � ¡¢£ £ ¤ ¥¦§¥¦¨£©¦ª (henceforth LLU ) can be understood as leasing
the lines that connect customers to the rest of the network at a price called
the access charge.
However, LLU did not suffice to avoid potential abuses of dominance via
excessively high access charges. As such behavior may possibly impede the
proper functioning of the competitive process, it is prohibited by competition
law, whether European or national.32 B0F4=?FK5F?, s¬8: @F;> 5� ex ante
access price regulation.33 l� 5F@?F j5F 4=�: 6;44?F 4556 45 E? ?�I�?�4, 4=? ?F4�Q
30 Due to economic unfeasibility of duplicating the existing infrastructure and huge, sunkinvestment costs of deploying an alternative network, infrastructure-based competition in thefixed market has been weak. Therefore, potential competitors must rely on the incumbent’snetwork (note, however, that many governments foster the deployment of New GenerationAccess Networks (henceforth NGAN ) which could lead to infrastructure-based competition).Similarly, at that time, mobile network were no competitive alternative to fixed networks.As for today, in only in Austria mobile network are considered as a sufficiently competitivealternative. There, infrastructure-based competition is ongoing, which also lead TKK toalleviate regulatory restriction on some fixed networks segments. See supra note 19P
31 The main distribution frame is an equipment which collects all the wires that connectclients to the telecommunications operator and that establishes the interconnection betweentwo communicating parties.
32 See in particular The Treaty of the Function of the European Union, Art 102 (2008).A equivalent law exist in the United States with the Sherman Act, §2 (1890).
33 Several price regulation rules exist. The most common are the rate of return pricingrule (henceforth, RoR) and the price cap regulation (henceforth, PC ). Whereas the formeraims at setting a price level such that investors earn a fixed rate of return on the capital theyinvested, the latter set a price maximum level that may not be exceeded. The RoR-rule hasbeen continuously abandoned in favour to the PC, because RoR may incite the regulatedfirm to be cost-inefficient (low incentive to reduce cost and a high incentive to over-invest, as
L?�?F;6 ��4F5@0I4�5� $!
cally integrated firm is subject to a further obligation: accounting separation
(Commission, 2005-. �@?F 4=�: 5E6�A;4�5�, 4=? ��I0KE?�4 SFK �: F?U0�F?@ 45
share any information about its costs underlying the exploitation of its net-
work (deployment and maintenance costs, depreciation of assets, etc.) with
its NRA. This requirement should allow NRAs to determine, in a transpar-
ent manner, relevant cost elements that should be covered by the incumbent’s
access price and also to provide accurate information
“ensur [ing] that there has been no undue discrimination between
the provision of services internally and those provided externally
[. . . ]” (Commission <2005-, 8F4. #, H. $%%M% -.34
k� 4=? 45H 5j 0H:4F?;K HF�I? F?A06;4�5�, 4=? F?6;4�5� E?4>??� 0H:4F?;K ;�@
downstream prices is also a concern. As mentioned above, the provision of the
upstream service ought not to involve any discriminatory treatment between
the incumbent’s downstream arm and its downstream rival. The authorities
are therefore vigilant in what regards the spread between the incumbent’s
upstream price and its downstream price. In particular, they consider the
possibility for anticompetitive behavior stemming from the incumbent if the
above-mentioned spread is too narrow for an unintegrated downstream firm
this raises the needed revenue for recouping the investment which ultimately raises prices)the PC-rule has its shortcoming such as informational asymmetry between the regulatoryauthority and the regulated firm or the incentive to reduce cost via quality reduction, ithas been widely adopted. A third, less applied regulation rule is the earning sharing rule(ESR). It defines a range of RoR where, whenever the effective RoR lies in this range, thefirm can keep all its earning and, whenever the effective RoR is outside, earnings are sharedwith consumers, by e.g. a price decrease, resp. increase (when the RoR is above the upperboundary, resp. below the lower boundary).
34 Accounting separation is a widespread practise in Europe. Outside the old continent,incumbents’ upstream and downstream entities often operate under stronger forms of separa-tion. For instance, in the UK in 2005, the British incumbent British Telecom’s (BT) plan fora stronger vertical separation has been approved by OFCOM, the British NRA (and NCA).From that date on, some wholesale activities are managed by a distinct unit from BT, wheremanagers have localised incentives, i.e. seek to maximise their unit’s profits rather than thewhole group’s profits (Caveu 2006bOP zWXY[ Y]\m`YN Vo[ NW[o^eY[ Vo[\N oV xgY[Wad]`O NYmyarations are Australia’s incumbent Telstra (with an approach similar to OFCOM’s) or theUSA with strict structural separation of telecommunications operations. In 2006, however,the US were reconsidering the approach towards structural separation (OECDu 2006OP

L?�?F;6 ��4F5@0I4�5� $"
to be economically viable. Such a too narrow spread between upstream and
downstream prices typically defines a margin squeeze.
The debate on margin squeeze
An OECD roundtable on margin squeeze gave a generally accepted definition
of margin squeeze:
“A margin squeeze can arise only when (a) an upstream firm pro-
duces an input for which there are no good economic substitutes, (b)
the upstream firm sells that input to one or more downstream firms
and (c) the upstream firm also directly competes in that downstream
market against those firms.” (OECD <2009c-, H. -
There is a vivid debate on whether a margin squeeze constitutes a stand-
alone infringement of competition law or whether it should be treated as an
existing theory of harm (i.e. predatory pricing or refusal to deal). This debate
opposes two strikingly different positions taken by the US and the EU.
The US approach: the Trinko judgment.
A first key feature of the US approach towards margin squeeze is that US
Courts see sector-specific regulation and competition law as substitutes. More-
over, regulation, whenever it exists, primes over competition law. The land-
mark judgement in Trinko made this point quite clear.35 l� $!!�, s?> ®5FJ:
incumbent Verizon was accused of providing its downstream rivals with an
upstream input of lesser quality on the regulated wholesale market, thereby
hindering its competitors to compete efficiently in the downstream market. In
this case, the accused undertaking had the regulatory obligation to provide
access to its unintegrated downstream competitors. The plaintiff invoked a
35 Verizon Communications, Inc. v. Law Offices of Curtis V. Trinko, 540 U.S. 398 (2004),(henceforth Trinko).

L?�?F;6 ��4F5@0I4�5� $$
violation of both the regulatory framework set up by the Federal Communi-
cations Commission (FCC) and the antitrust law as stated in section 2 of the
Sherman Act.
The Supreme Court of the US has investigated in this case whether regu-
latory duty to deal induces an antitrust duty to deal.36 h=? �50F4 =?6@ 4=;4 ;
regulatory duty to deal, in the form of access obligation laid on the vertically
integrated upstream monopolist, does neither induce nor is it equivalent to an
antitrust duty to deal. Furthermore, in its opinion, the Court showed itself
reluctant to apply competition law in presence of sector-specific regulation:
the existence of “[sector-specific regulation is] designed to deter and remedy
anticompetitive harm” (Trinko, p. 12). It considers special regulatory agencies
and enacted regulatory rules to be more appropriate and capable of ruling
the competitive environment as general antitrust laws and points out several
possible drawbacks linked to concurrent application. For instance, the Court
was concerned that imposing an antitrust duty to deal could refrain the up-
stream monopolist, as well as the downstream competitor, from competition-
enhancing investments. Also, imposing two or more parties to negotiate may
end up in a collusive agreement, inducing thus reduced competition at the
expense of consumer welfare.
36 Following a statement of the US during the OECD roundtable on margin squeeze, adoctrinal difference between a regulatory and an antitrust duty to deal, provided by theTrinko judgement, is that under the former, the competitor is already established in themarket. An institutional difference is that regulators are better suited to impose duties todeal, given their proximity to the sector in question and a better ability of balancing short-term effects on competition against long-term dynamic effects such as investments (OECDx2009cOu mP �¯°OP ±a^]``bu WXY p² _Y`Ye]WY Wo WXY zn³´ [o{^_W]f`Y NW]WY_ WX]Wu YgY^ aV ]^antitrust duty to deal exists, a margin squeeze claim will have to be filed as a predatorypricing claim (OECD x2009cOu mP �µ¶P

L?�?F;6 ��4F5@0I4�5� $�
The linkLine judgement
The US’s reluctant attitude towards margin squeeze as a stand-alone infringe-
ment is illustrated by the linkLine case.37 l� $!!�, �;6�j5F��;: ��I0KE?�4
AT&T has been accused of squeezing its rivals’ margins and of denying them
access to the AT&T’s essential facility (its DSL network), even though there is
a regulatory obligation of access. The Supreme Court considered that, based
on the Trinko ruling, AT&T had no antitrust duty to deal and thus has not
been obliged to offer terms and conditions that preserve its rivals’ margins.38
r5F?5 ?F, 4=? �50F4 I5�:�@?F?@ 4=;4 4=? K;FA�� :U0??·? I6;�K :=506@ E?
declined into a predatory pricing claim. The Supreme Court invoked an ar-
gument of “institutional concerns” for not recognising a margin squeeze as a
stand-alone abuse of antitrust law whenever sector-specific regulation is set up
(linkLine judgement, p. 4). It sees itself ill-suited to constantly supervise both
the upstream and downstream prices, as well as the spread between them,
since this task would amount to act like a regulatory agency, which is outside
a Court’s missions.
The EU approach
The EU approach is in striking opposition. First, even though the Commis-
sion’s recommendation on accounting separation confers an equivalent task to
sector-specific regulation than the U.S. does - namely to “[. . . ] identify poten-
tial anticompetitive behavior [. . . ]” (Commission <2005-, 8F4. <%-, $%%¸%�- Q
the access notice clearly defines both tools as complementary:
“The Commission considers that competition rules and sector
specific regulation form a coherent set of measures to ensure a lib-
37 Pacific Bell v. linkLine Communications, Inc., 555 U.S. 438 (2009), (henceforth lin-kLine).
38 linkLine, p. 3.
L?�?F;6 ��4F5@0I4�5� $�
eralised and competitive market environment for telecommunica-
tions markets in the Community.” (Commission <1998-, 8F4 <"��-,
265/23).
This complementarity has further been backed up by European case law
relative to margin squeezes. The most important and clarifying judicial deci-
sions in margin squeeze matters have been taken in the telecommunications
sector.
The Deutsche Telekom judgement
For instance, the Deutsche Telekom (henceforth DT ) case, the Commission
found that the dominant operator DT, via its pricing scheme, did not leave a
sufficient margin to its competitors which found themselves in the impossibility
to cover product-specific costs (i.e. downstream cost for providing the final
retail service/product).39
h=? �50F4 5j B�F:4 l�:4;�I? <=?�I?j5F4= CFI ), backed up later on by the
European General Court (henceforth GC ), consent with the Commission that
a margin squeeze constitutes an independent infringement of competition law,
emphasising that DT’s
“conduct is connected with the unfairness of the spread between
its [wholesale] prices for [local loop] access [services] and its re-
tail prices [for end-user access services], which takes the form of a
margin squeeze.”40
. h=�: �KH6�?: 4=;4 4=? �5KK�::�5� �: �54 F?U0�F?@ 45 HF5 ? 4=;4 �?�4=?F
the upstream price nor the downstream price are eventually unlawful, but
the unfairness of the spread between these two price elements constitutes by
39 Commission’s Decision in DT of 21/05/2003 (2003/707/EC), Case T-271/03 DeutscheTelekom AG v. Commission, 10 April 2008, and Appeal C-280/08 P, 14 October 2010.
40 Appeal C-280/08 P, 14 October 2010, recital 142.

L?�?F;6 ��4F5@0I4�5� $#
itself the infringement of Art. 102 of the TFEU. This ruling has further been
reaffirmed by the Telefónica-case and TeliaSonera-case.
The Commission based its analysis on the equally efficient competitor-test.
The aim of this test is to verify whether the incumbent’s downstream price
allows to cover its own specific costs of the relevant product if the access price
charged to its competitors was imputed to its own downstream operations arm.
The Courts confirmed the lawfulness of the EEO-approach because it provides
legal certainty as all cost parameters are known to the incumbent.41
8�54her important element derived from the DT judgement is that sector-
specific regulation does not provide immunity from competition law. The Com-
mission and the GC acknowledge that the regulatory environment is based on
the price cap principle, which leaves the defendant with sufficient scope of
action for reduction of the margin squeeze by adjusting its retail price.42 8:
mentioned above, the PC-rule established a maximum level of the regulated
price that may not be exceeded. As DT’s price was not set at the maximum
level, it had means to increase its price and thus to avoid a margin squeeze.
By its inactivity to that regard, DT has exposed itself to liability for an-
ticompetitive behavior. This point in the DT judgment also highlights the
Commission’s view of complementarity between regulatory interventions and
competition law.
The Telefónica judgement
In Telefónica, the Commission adopted an additional, more sophisticated cal-
culation methodology.43 h=? �H;��:= ?F4�I;667 ��4?AF;4?@ ��I0KE?�4 =;: E??�
accused of leaving an insufficient margin to its upstream customers with whom
it competed in the downstream market. In order to allege a margin squeeze, the
41 DT, judgement under appeal, ¶201 and ¶202.42 idem, ¶11.43 Case C-295/12 P Telefónica & Telefónica de España v. Commission, 2007, T-336/07
and T-398/07 Telefónica & Telefónica de España v. Commission, 29 March 2012.

L?�?F;6 ��4F5@0I4�5� $%
Commission used, besides the year-on-year margin squeeze calculus, the dis-
count cash flow method (DCF) so as to verify the long run profitability of the
accused firm. Despite possible drawbacks of using the DCF method (e.g. false
positive due to important future cash flows that outweigh initial losses; ¶333 of
the Commission’s decision in Telefónica), the ECJ rejected Telefónica’s appeal
against the use of DCF. The ECJ considered the Commission to be right in
applying the DCF as both methods yielded the presence of a margin squeeze.
In its appeal, Telefónica claimed that upstream investment induced high
upstream input prices, while in the mean time, the downstream market has
been subject to intense competition between convergent offers, implying price
discounting, and therefore low retail prices. In contrast to Judge Scalia in
Trinko, the GC did not recognise an impediment of investment incentives when
applying competition law to a regulated environment. On the contrary, in the
light of the desired infrastructure-based competition in the EU, the GC agreed
with the Commission in that the regulatory duty to deal imposed on Telefónica
“[. . . ]result[ed] from a balancing by the public authorities of the incentives of
Telefónica and its competitors to invest and innovate”.
Further clarifying ruling has been brought by the TeliaSonera-case.44 l�
this case, the Swedish incumbent has been accused by the Swedish NCA of
abusing its dominant position. Before delivering its judgement, the Swedish
Court addressed a set of questions to the ECJ relative to the correct interpre-
tation of Art. 102 of the TFEU.
The TeliaSonera judgement
The Court’s ruling in TeliaSonera made a clear cut between a refusal to deal
and a margin squeeze. In Bronner, the Court ruled that the existence of an
essential facility creates a duty to deal for its owner and any refuse of granting
44 Case C-52/09 Konkurrensverket v. TeliaSonera Sverige AB, 17 February 2011.

L?�?F;6 ��4F5@0I4�5� $
access to it is an attempt to reduce rivals’ ability to efficiently compete.45 l�
TeliaSonera, the GC highlighted that the characteristic of essentiality, or in-
dispensability, of the upstream input for the provision of downstream services
is not predominant for a margin squeeze to exist. It held that, given the signif-
icant market power of the vertically integrated firm in the upstream market,
the upstream input does not need to be indispensable for anticompetitive ef-
fects to emerge via a margin squeeze. In particular, if the upstream input is
essential for downstream competition, than anticompetitive effects are proba-
ble, whereas if the input is not indispensable, potential anticompetitive effects
may exist and need to be proven.46 l4 j5665>: jF5K 4=? h?6�;�5�?F; F06��A 4=;4
the scope of applicability of margin squeeze as an antitrust liability doctrine
is greatly enlarged.
US vs. EU: opposing view on liability for margin squeeze.
The above exposition of US and EU case law shows that, today, there exist two
strikingly opposed views as to whether in a regulated environment a margin
squeeze is to consider as a liability doctrine or not. For the US, it is clearly not.
For the EU, it is and recent rules even loosen the conditions under which it can
be applied. Each position may have its merits, but a profound understanding of
the impacts of applying competition rules and regulatory restrictions jointly
is of great importance as either tool impacts the strategic behavior of the
concerned firms.
45 Oscar Bronner GmbH & Co. KG v Mediaprint Zeitungs- und Zeitschriftenverlag GmbH& Co. KG, case C-7/97,1998.
46 Supra 44u m][P q¯ y ¹�P
L?�?F;6 ��4F5@0I4�5� $�
Chapter 3: Interaction between sector regulation and competition
law
In the last chapter of this thesis, the joint application of competition law and
upstream market regulation will be analysed from a theoretical point of view.
In a duopolistic model with differentiated products, a vertically integrated
firm sells an upstream input to an unintegrated downstream rival. Demand
asymmetry is introduced by allowing for differences in downstream efficiency
between the integrated and the unintegrated firm and/or differences in prod-
uct quality. Moreover, the modelling allows to compare the US view to the
European view, as it compares different scenarii. The first scenario is that of
competitive environment without either a prohibition of squeeze nor upstream
regulation. In a second scenario, a ban on margin squeeze is introduced via
the EEO margin squeeze test, i.e. the spread between the integrated firm’s
price and access charge must allow for recovering downstream product-specific
costs. Scenarii three and four rerun this exercise but with a regulated upstream
market.
The analysis shows that absent upstream market regulation, the incum-
bent’s downstream price does not satisfy the EEO test whenever the unin-
tegrated firm is relatively more efficient (this is, is either more cost efficient,
offers a higher quality or any combination of both). However, in this case,
the downstream competitor does not incur negative profits and is thus not ex-
cluded from the market. This insight shows that the efficiency of the EEO-test
is strongly dependent on the market conditions both firms face downstream.
Comparing the first scenario to the second reveals that a ban on margin
squeeze as stand-alone policy may have a welfare-enhancing effect. Indeed,
as the integrated firm’s price is ruled by the EEO-test, its only remaining
profit-optimising variable is the upstream price. The incumbent maximises its
overall profits by reducing the upstream price which in turn acts positively on

L?�?F;6 ��4F5@0I4�5� $�
the price set by the rival in the downstream market. The latter’s price shrinks
and its demand increases. On the other hand, the incumbent’s downstream
price increases, penalising thus its consumers. Analysing social welfare, how-
ever, shows that the increased competitor’s profits outweigh the incumbent’s
depressed profits. Moreover, as more consumers benefit of the rival’s reduced
price, consumer surplus increases. As a final result, a ban on margin squeeze
as stand-alone policy has a welfare beneficial effect.
In contrast to this, the analysis in the presence of upstream market regula-
tion shows opposite results. First, when competition law is applied via a ban
on margin squeeze, the above-mentioned decreasing rivals’ cost-effect vanishes
and both downstream prices increase. Consumers do no longer benefit from
the competitor’s higher efficiency. Due to higher prices, industry profits in-
crease, whereas consumers are strictly worse off. The impact on social welfare
is ambiguous.
Finally, as a ban increases the burden laid on the regulated incumbent firm,
the latter may manifest less initiatives in the downstream market. Indeed, at
some level of inefficiency (relative to its competitor), the incumbent may prefer
to withdraw from the downstream market and let the more efficient rival serve
the retail market alone.47
h=? ;�;67:�: �� 4=�: I=;H4?F :0AA?:4: 4=;4, E7 �4: >;7 5j @?;6��A >�4= K;FQ
gin squeezes, the Commission’s goal to promote competition and ultimately
protect consumers from abusive conduct by undertakings is likely to be jeop-
ardised. US Courts seem to have the right intuition regarding liability under
a margin squeeze doctrine.
47 As such a behavior has not yet been observed in the real world, the incumbent’swithdrawal has to be put in perspective. It is, however, conceivable that the incumbent firmmay leave some market segments, while remaining active in others.

º�»(�)¼�'½¾¿
ARCEP (2014a). Observatoire des marchés des communications électroniques
(services mobiles). 2ème trimestre 2014. Available here.
ARCEP (2014b). Observatoire des marchés des communications électroniques
en France Q2 2014 - Observatoire des investissements et de l’emploi. 2ème
trimestre 2014 - Résultats définitifs. Available here.
Arlandis A., Ciriani S., Koleda G. (2011). L’économie numérique et la crois-
sance, poids, impact et enjeux d’un secteur stratégique, Document de travail
Nř 24. Available here. 8II?::?@ 6;:4M "�¸""¸$!"�.
Armstrong M., (2006). Competition in two-sided markets, RAND Journal of
Economics, 37(3), 668-691.
Berec (2011). Berec Report on impact of Fixed-Mobile Substitution in Market
Definition, 8 December 2011, available here.
Blumberg S. J., Luke J. V. (2007). Wireless substitution: Early release of
estimates based on data from the National Health Interview Survey, July -
December 2006. National Center for Health Statistics, May 2007., available
here
/60Kberg S. J., Luke J. V. (2014). Wireless substitution: Early release of
estimates from the National Health Interview Survey, January - June 2014.
National Center for Health Statistics, December 2014, available here.
30

L?�?F;6 ��4F5@0I4�5� �"
Bacache M., Bourreau M., Germain G., (2013). Dynamic Entry and Invest-
ment in New Infrastructures: Empirical Evidence from the Fixed Broadband
Industry. Review of Industrial Organization, 44(2), 179-209.
Bourreau M., Kourandi F., Valletti T., (2014). Net Neutrality with Competing
Internet Platforms, CEIS Research Paper 307, Tor Vergata University, CEIS,
revised 14 Feb 2014.
Cave M. (2006), Encouraging infrastructure competition via the ladder of in-
vestment. Telecommunications Policy, 30(3-4), 223-237.
Cave M. (2006), Six Degrees of Separation: Operational Separation as a Rem-
edy in European Telecommunications Regulation, MPRA Paper No. 3572,
posted 14/06/2007, available here.
Cisco (2014), Visual Networking Index: Global Mobile Data Traffic Forecast
Update 2013 - 2018, February 4, 2014, available here.
Cisco (2013b), Visual Networking Index: Forecast and Methodology 2012 -
2017, May 29, 2013, available here.
European Commission (1998), Notice on the Application of the Competition
Rules to Access Agreements in the Telecommunications Sector, (98/C), OJ
C 265, 22/08/1998:2-28.
European Commission (2005), Recommendation on accounting separation and
cost accounting systems under the regulatory framework for electronic com-
munications, (2005/698/EC), OJ L 266, 11/10/2005:64-69.
European Commission (2013), Commission Staff Working Document Digital
Agenda Scoreboard SWD (2013) 217 final.
Dogan P., Bourreau M., Manant M, (2009). A Critical Review of the “Ladder of
L?�?F;6 ��4F5@0I4�5� �$
Investment" Approach. Scholarly Articles 4777447, Harvard Kennedy School
of Government. Available here.
Eurobarometer (2006), E-Communicatins Household Survey Report, Field-
work: December 2005 - January 2006, July 2006.
Eurobarometer (2011), E-Communicatins Household Survey Report, Field-
work: December 2011, June 2012,
Eurobarometer (2013), E-Communicatins Household Survey Report, Field-
work: February-March 2011, July 2011, available here.
GSM Association (2013a), Mobile Economy Europe 2013, available here.
GSM Association (2013b), Mobile Wireless Performance in the EU & the US,
May 2013, available here.
Hermalin B. E., Katz M. L., (2007). The economics of product-line restric-
tions with an application to the network neutrality debate, Information
Economics and Policy, 19(2), 215-248.
Jullien, B., Rey, P., Saavedra, C. (2013), The Economics of Margin Squeeze,
IDEI Report, available here.
Maliranta M., Rouvinen P., Ylä-Anttila P., (2010), Finland’s Path to the
Global Productivity Frontier through Creative Destruction, International
Productivity Monitor, Centre for the Study of Living Standards, 20, Fall,
68-84. Available here.
OECD (2006), Report on experiences with structural separation, 07/06/2006,
available here.
OECD (2009a), Information Economy Product Definitions Based On The Cen-
tral Product Classification (Version 2), available here.

L?�?F;6 ��4F5@0I4�5� ��
OECD (2009b), Mobile Broadband: Pricing and Services, available here.
OECD (2009c), Policy Roundtables Margin Squeeze, 2009,
DAF/COMP(2009)36, available here.
OECD (2011), Broadband Bundling: Trends and Policy Implications, OECD
Digital Economy Papers, No. 175, OECD Publishing, available here.
OECD (2012), Fixed and Mobile Networks: Substitution, Complementarity
and Convergence, OECD Digital Economy Papers, No. 206, OECD Pub-
lishing, available here.
OFCOM (2013), International Communications Market Report, Research Doc-
ument, 12 December 2013, available here.
Oldale, A., Padilla, J. (2004). From state monopoly to the “investment ladder":
Competition policy and the NRF. in The Pros and Cons of Antitrust in
Deregulated Markets, Swedish Competition Authority.
Rochet J.-C., Tirole J., (2006). Two-sided markets: a progress report, RAND
Journal of Economics, 37(3), 645-667.
RTR (2009), Abgrenzung des Marktes für breitbandigen Zugang auf Vorleis-
tungsebene.
Welsum D., Overmeer W., Van Ark B., (2012). Unlocking the ICT growth
potential in Europe: Enabling people and businesses. A study prepared
for the European Commission DG Communications Networks, Content &
Technology. Available here. 8II?::?@ 6;:4M "�¸""¸$!"�.
Wu T., (2003). Network Neutrality, Broadband Discrimination, Journal on
Telecommunications and High-Technology Law, 2, 141-176.
Yoo C., (2010). Network Neutrality or Internet Innovation? Regulation, 33(1),
22-29. Available on SSRN.

ÀÁÂÃÄÅR Æ
Fixed-Mobile substitution and bundling1
ÇÈÇ Introduction
Fixed-Mobile substitution (FMS) refers to the fact that mobile telecommuni-
cations services replace their fixed counterparts. It is driven by technological
progress and, in particular, by the convergence of mobile network performance
towards fixed network performance. For instance, call services are of equal
quality regardless which network is used. Also, the third and fourth genera-
tion of mobile technology allow for similar mobile broadband quality of service
as with the widespread DSL or cable access.
Each service has its advantage, though. While mobile services have the
undeniable convenience of mobility, fixed services offer abundance (unlimited
allowance of data usage and call minutes). The mobility feature procured by
mobile services implies further that the relation between fixed and mobile is one
of one-way substitution, meaning that mobile may replace fixed services, but
the opposite is unlikely to occur. Another point of divergence it that mobile
services are rather personal (mostly used by the subscriber himself), whereas
fixed services are used by all the members of a household and therefore more
collective. On these grounds, fixed and mobile are considered as imperfect
1 This chapter relies on a collaboration with Julienne Liang from the department ofregulatory affairs of Orange. Thanks again, Julienne!
34

".". INTRODUCTION 35
substitutes.
Despite this, an increasing number of consumers throughout the world
reports to use exclusively their mobile to satisfy their needs for electronic
communications. As such, at the end of 2013, 38 % of the US households
indicated in a NHIS survey to be mobile-only for placing calls (Blumberg and
Luke, 2013-. B5665>��A 4=? Eurobarometer <2014-, 4=? � I50�4?@ ;F50�@ �"
% of wireless-only households.
As for broadband matters, a similar trend seems to occur. In an interna-
tional comparison by OFCOM <2013-, K5F? 4=;� $# � 5j l4;6�;� =50:?=56@:,
respectively around 20 % of Australian households, claimed mobile to be their
only means for broadband access. In Austria, broadband FMS is even more
advanced. The national regulatory authority for electronic communications
considered in 2009 mobile broadband to be a “sufficiently close substitute” to
fixed broadband over DSL or cable access. This finding induced the Austrian
regulator to consider that ex-ante wholesale regulation on broadband access is
no longer necessary (Berec, 2011É RTR, 2009-.
In some countries, however, a contradicting trend is observed. Namely,
service providers operating in both fixed and mobile markets have introduced
bundled offers that comprise fixed services (IPTV, IP telephony, broadband
internet access) and mobile services (voice and data services). Moreover, such
quadruple play offers become increasingly popular. Within approximately
three years after their market introduction, the subscription rate to such offers
is estimated around 42 % in France and 20 % in Spain by the end of 2012.
These rates are also forecasted to nearly double in the next 3 or 4 years.2
/04 the increase of mobile-only subscription raises the question whether
fixed-mobile bundling is the adequate response by providers present on both
2 See for instance an article fb La Tribune (2013) for information on the Frenchquadruple-play subscription. For a general overview and forecast of the European quadrupleplay offers, see the report fb Analysis Mason (2013).

".". INTRODUCTION 36
markets. Does bundling allow such multi-market operators to counter the
possible threat of reduced revenues stemming from fixed offers? Is bundling a
means to reduce intermodal competition exerted by mobile on fixed services?
As academic literature has not yet focussed on a joint analysis of FMS
and bundling, this work attempts to fill this gap. A theoretical framework
is developed that reconsiders the profitability of bundling strategies given the
presence of FMS. It draws upon two multi-market operators that compete à
la Hotelling. It adopts the ”straight-to-mobile” view, which is one possibility
of how mobile-only consumers emerge. An alternative would be the ”cut-the-
cord” view, where consumers decide to terminate or do not reconnect their
fixed service subscription. The straight-to-mobile view reflects the idea that
consumers choose at first a mobile offer and, thereafter, have the possibility
to choose a fixed offer. This view seems interesting, because merely everyone
born after 1980 has first subscribed to a mobile offer before having possibly
subscribed to a fixed offer.3 h=? Ê:4F;�A=4Q45QK5E�6?Ê �?> �: ;6:5 ;HHF5HF�;4?
if one considers young people leaving their parents’ house. Already mobile
subscriber, they may choose not to subscribe at all (or at least not immediately)
to a fixed offer. Moreover, since the presence of FMS implies the presence of
mobile-only consumers, the model also considers partial coverage of the fixed
market.
The decision to subscribe to an additional fixed service offer is modelled
to depend on the additional utility that consumers expect from having both
(substitutable) services simultaneously. The introduction of expected utility
is new to the bundling literature, but has its motivations. Firstly, this uncer-
tainty might be interpreted as a learning-by-doing effect: mobile-only users
may learn their needs for, e.g. data volume only after having exclusively used
3 Using the example of the UK, market trends show that 99 % of consumers between15 and 44 years have a mobile subscription (OFCOMu 2013OP ±a^_a^e ] Na\a`][ Ëe{[Y Vo[fixed subscriptions is difficult, especially on the subscriber level because a fixed servicesubscription is used by all members of a household and not only by the subscriber.

".". INTRODUCTION 37
mobile services for a while. In that case, they may subscribe to a fixed offer
so as to complement their mobile data allowance. Secondly, some mobile-only
consumers may anticipate subscribing to a fixed offer because some new fea-
tures in the fixed offer are announced by operators (e.g. forthcoming change
of TV-channels comprised in the bundle, more user-friendly equipment, higher
connection speeds, etc).
Finally, the model introduces an equivalent approach to Thanassoulis’
firm-specific and product-specific preferences (Thanassoulis, 2007-. B�� <SFKQ
specific preferences) appear in the fixed market if consumers have the same
reservation price for fixed services. Alternatively, PSP (product-specific pref-
erences) appear if reservation prices differ from one operator to another. Since
in the setting used in this chapter FSP leads to perfect symmetry between
firms, the present work denotes that case the symmetric case.
The analysis reveals that if consumers have product-specific preferences
and if fixed and mobile services are neither too strong substitutes nor too
strong complements, at least one operator earns higher profits by bundling
its services. Hence, the prisoners’ dilemma situation, often revealed in the
bundling literature, disappears. The higher profits stem from the increased
demand for the discounted bundled offer. Consumer surplus, as well as social
welfare, increases when bundling strategies are employed. Moreover, the dis-
count turns the imperfect substitutes into stronger complements and reduces
the number of mobile-only consumers. Bundling may therefore induce full
coverage of the fixed market. However, with the fixed market fully covered,
selling both services as a package would not be profitable and therefore not
introduced, implying then a foregone consumer surplus and welfare increase.
The remainder of this chapter is the following. Section 1.2 EF�?Ì7 HF?:?�4:
the literature on FMS and on bundling. Section 1.3 HF?:?�4: 4=? K5@?6 :H?I�Q
fications. The results are presented in section 1.4, >=�I= �: @� �@?@ �� 4>5 :0EQ

".$. LITERATURE REVIEW 38
sections. Subsection 1.4.1 j5I0::?: 5� 4=? H?Fj?I467 :7KK?4F�I :?44��A >=?F?
consumers have identical valuations for either operator’s fixed, respectively mo-
bile services. The case of product-specific preferences is analysed in subsection
1.4.2. B��;667, :?I4�5� 1.5 @�:cusses the results and concludes.
1.2 Literature review
The relevant literature for this chapter is twofold: the one on FMS and the
one on service bundling. Since these two topics have always been treated
separately, the strands are presented distinctly.
Fixed-Mobile substitution Academic literature on FMS is mostly empiri-
cal and attempts to assess the sign of cross-price elasticities between fixed and
mobile services. Evidently, elder papers addressed the issue of FMS on the
level of voice services, as broadband FMS is quite a recent issue.
Although fixed and mobile services were originally conceived as comple-
ments (mainly for businessmen), the increasing and rapid diffusion of mobile
services turned the relation of complementarity into one of substitution. Gru-
ber and Verboven <2001- ?:4�K;4?@ 4=;4 4=? @��0:�5� 5j K5E�6? :?F �I?: �:
negatively impacted by the stock of fixed telecommunications lines per capita
in EU15 countries in the period 1984 - 1997. Yoon and Song <2003- ;6:5
found substitution between calls for the years 1997 - 1998 in Korea. Similarly,
Rodini, Ward and Woroch <2003- j50�@ K5@?F;4? :0E:4�404�5� E?4>??� 4=?
second fixed line usage and mobile usage for the period 1999 - 2001 in the US.
A more recent series of papers provided evidence of sufficiently strong FMS
on either calls access or usage level, which allows to address the problem of
defining the relevant markets. An accurate definition of relevant market consti-
tutes a cornerstone for efficient ex-ante market regulation. Among these papers
are Briglauer et al. <2011a- ;�@ Barth and Heimeshoff <2011-. �=?F?;: 4=?

".$. LITERATURE REVIEW 39
first considered the Austrian market, the later used data of the EU27 countries.
For the period 2004 - 2009, Barth and Heimeshoff <2011- HF5 ?@ 4=? ?T�:4?�I?
of a one-way substitution that is sufficiently strong so that the asymmetric
regulation laid upon fixed services must be challenged.4 864ernatively, the
Austrian study by Briglauer et al. <2011a-, E;:?@ 5� ; #Q7?;FQ@;4;:?4 <$!!$ Q
2007), suggested that national fixed and mobile calls might belong to the same
market, as the authors found significant positive cross-price elasticities.5 k�
the contrary, at access level, FMS did not appear.6
86:5, some studies analysed broadband FMS. For instance, Cardona et
al. <2009- �� ?:4�A;4?@ @?K;�@ j5F EF5;@E;�@ l�4?F�?4 ;II?:: �� 80:4F�;. 86Q
though, due to too low a penetration rate of mobile broadband during the
analysed time period, the authors could not conclude on FMS in the Austrian
broadband segment. Srinuan, Srinuan and Bohlin <2012- ;�;67:?@ �>?@?�:
broadband segment. They concluded on significant substitutability between
fixed and mobile broadband access.
The most recent data has been used by Grzybowski and Verboven <2013-,
who used Eurobarometer household survey data from 2005 to 2011. As the
authors show, central and eastern Europe’s member states consider fixed and
mobile voice services as stronger substitutes than their western neighbours.7
r5F?5 ?F, 4=?7 ?:4�K;4?@ ;� ? ?� :4F5�A?F 5�I? :?F �I? Br� >=?� 4=? =50:?Q
hold has a mobile broadband connection. However, if the type of Internet
broadband (fixed or mobile) is taken into account, the results show that fixed
and mobile access become stronger substitutes if the household disposes over
a mobile broadband connection. On the contrary, both accesses become com-
4 Asymmetric regulation has been set up in order to foster mobile service take-up andachieve intermodal competition.
5 The study of Briglauer et al. x2011aO o^`b Vod{NNY_ o^ d]``N fb m[ag]WY mY[No^NP ³]``Y_placed by firms have not been considered.
6 The authors mentioned the possibility of cheaper international calls over fixed networkas a reasonable explanation for the complementarity of access.
7 A strong level of FMS in central and eastern Europe has been also found on firm levelby Vagliasindi, Güney and Taubman x2006OP

".$. LITERATURE REVIEW 40
plements if the household disposes over fixed broadband.
Profitability of bundling Two pricing strategies relative to the practice of
bundling have been considered in the large literature on product bundling: i)
pure bundling strategy, involving the bundling firm to sell its products only as
packages and ii) mixed bundling strategy, involving, on the contrary, to sell
products both as a package and stand-alone items.
Mixed bundling has revealed itself to be a very powerful tool for implement-
ing improved market segmentation (respectively price discrimination) because
of the sorting effect (Stigler, 1963-, 5F 0:��A 4=? 4?FK: 5j Adams and Yellen
<1976-, 4=? self-selection effect. It induces consumers to reveal their prefer-
ences for the different offers, enabling the monopolist to extract higher rents
on consumers, whereas the latter are worse off.
In a monopolistic context, where the monopolist considers any form of
bundling, Adams and Yellen <1976- :=5>?@ 4=;4 H0F? E0�@6��A �: @5K��;4?@
by mixed bundling, since the latter form can procure profits at least as high.8
Long <1984- I5�:�@?F?@ @?K;�@: ;@@F?::?@ 45 ; K064�QHF5@0I4 K5�5H56�:4
to be interrelated. More specifically, in its extension of Schmalensee <1984-,
Long explains that the profitability of mixed bundling as discriminatory pricing
tool works best when products are either substitutes or independent. The
reason is that bundling reduces the heterogeneity of consumers valuations (via
the sorting / self-selection effect).9
��4h complements, a multi-product monopolist may not find it profitable
to bundle. However, as Nalebuff <2004- :=5>?@, �j 4=? E0�@6? I5KH5�?�4: ;F?
complements, bundling may serve for raising barriers to entry or relax com-
petition. More specifically, a multi-product monopolist, that faces potential
8 This finding has been confirmed by Schmalensee x1984O o[ McAfee, McMillan andWhinston x1989Ou ]\o^e oWXY[NP
9 Long’s analysis has been generalised by Armstrong x2013O tXo N{\\][aNY_ WXY [YN{`WNby the simple statement that ”[. . . bundling is profitable if] demand for a single item is lesselastic than the demand for the bundle[. . . ]” (p. 455).
".$. LITERATURE REVIEW 41
entry in the market for one of its components, may use bundling so as to reduce
the competitor’s ability to reach out for the monopolist’s consumers. Based
on a similar reasoning, bundling may also facilitate collusive behavior in the
(post-entry) competitive market (Spector, 2007-.
Carbajo, De Meza and Seidman <1990- A; ? ;�54=?F :4F;4?A�I K54� ;4�5�
for product bundling. In their paper, a multi-product monopolist bundles
its two complements, one of which is in competition with a rival’s product.
Analysing whether prices or output as strategic variable yields higher effi-
ciency, the authors showed that pure bundling in a Bertrand setting reduces
competitiveness.10 l�4F5@0I��A E0�@6��A HF5 �@?: 4=? K5�5H56�:4 >�4= ;� ;@Q
ditional product differentiation device, which in turn leads to higher end prices
in the competitive market. If, on the other hand competition is à la Cournot,
bundling again disables the single-product rival to poach consumers. There-
fore, the rival’s output decreases and prices increase.
In a more competitive setting, Matutes and Régibeau <1992- j5I0::?@ 5� ;
duopoly where consumer valuations for complementary goods are decisive for
market coverage. Here, consumers are supposed to buy a system of two com-
plementary components, whether as mix-and-match (one component from each
duopolist) or as pure system (both components from the same firm). First, it is
shown that pure bundling is always dominated by mixed bundling. Next, with
low market coverage, a prisoner’s dilemma arises when firms allow for compati-
bility. Bundling decreases the price of the pure system and induces the demand
for bundle to increase.11 �5>? ?F, ;: 4=? 6;44?F ?�?I4 @5K��;4?: 4=? j5FK?F,
revenues from the stand-alone sales and thus, bundling is not profitable. More-
over, as market coverage increases, price cuts (via a bundle discount) on pure
systems trigger a more aggressive reaction from the rival, leading to fiercer
10 In their paper, mixed bundling is not considered. However, even though the paper ofChen x1997O X]N ]^oWXY[ ]a\ x^]\Y`bu m[oga_a^e ]^ YÍ{a`af[a{\ WXYo[b oV m[o_{dW f{^_`a^eOuit provides equivalent results for mixed bundling as Carbajo, De Meza and Seidman x1990OP
11 Similar results are found by Economides x1993O ]^_ Reisinger x2006O Vo[ N{fNWaW{WYNP

".$. LITERATURE REVIEW 42
competition and therefore unprofitable bundling. If consumers valuations are
too high, market coverage is too high and competitive response too aggressive.
Firms then prefer not to bundle.
Thanassoulis <2007- :0AA?:4: 4=;4 4=? HF5S4;E�6�47 5j ��4F5@0I��A E0�@6?@
offers at a reduced price depends on whether consumers have firm-specific
(FSP) or product-specific (PSP) preferences. The difference is that under FSP,
the disutility (of not consuming the ideal product) does not increase with the
quantity bought from one firm. Under FSP, buyers of multiple components are
cross-subsidised by single-component buyers. This leads to increased profits
and reduced consumer surplus. Alternatively, under PSP, price competition
for the multi-component buyers is too fierce, leading to reduced profits and
increased consumer surplus. However, social welfare decreases under PSP be-
cause of allocative inefficiencies: some consumers that would prefer to cross-
purchase do now buy the bundle even though this is not the closest to their
ideal.
Thanassoulis has showed the interest for the bundling literature of distin-
guishing FSP from PSP. This analysis here applies a similar approach to the
fixed market, i.e. the market for the imperfect substitute. Specifically, whereas
Thanassoulis focusses on the level of Hotelling’s transportation costs for dis-
tinguishing both preferences, the model presented in this chapter places the
consumer reservation prices for fixed and mobile services in the center for the
distinction between FSP and PSP. This approach allows for a simpler repre-
sentation of FMS. PSP then appear when consumer have distinct valuations
for both fixed services offered by either firm. This can also be interpreted as
inter-platform competition in the fixed market (e.g. FTTH vs. ADSL, etc).
Alternatively, considering equal valuations for fixed services would represent
FSP and interprets competition in the fixed market as one of intra-platform
".$. LITERATURE REVIEW 43
competition (e.g. ADSL from operator A vs. ADSL from operator B, etc).12
864hough, as will be seen below, with this definition of FSP, firms are perfectly
symmetric. Consumers will be equally satisfied with either one of them. This
case will henceforth be called the symmetric case.
The distinction between the symmetric case and the case with product-
specific preferences adopted in this present model allows to contribute to the
bundling literature in the following way: if consumer have product-specific
preferences, the mixed bundling equilibrium is no longer a prisoners’ dilemma.
Indeed, at least one firm earns higher profits (even though at industry level
profits do not vary). Also, in contrast to Thanassoulis’ results, social welfare
(as well as consumer surplus) increases.
Another difference is that the consumers’ decision between single and multi-
ple services consumption depends on the expected additional utility consumers
anticipate to enjoy if both services are consumed. In Thanassoulis’ study, the
distribution of consumers of a single service (“small” buyers in the cited pa-
per) and consumer of both services (“large” buyers) is given and a small buyer
does not become a large buyer. This does not allow to analyse the possible mi-
gration streams between single service consumers and multi-service consumers
that may be induced by bundling. Here, the bundle discount impacts expected
additional utility and thus the distribution of consumers.
12 A possible justification for this alternative approach may be found in shops like ThePhone House or Internity. Such shops have commercial agreements with different operatorsand are thus able to provide consumers a more global information about the offers available.An advantage for consumers is that travel costs are clearly reduced as only one shop isvisited even though a wide range of offers is readily available. Hence, if the consumer isonly interested in an ADSL offer (e.g. because FTTH is not yet deployed in his residentialarea), the choice would depend on its preferences for an operator (i.e. FSP). For instance,the experienced quality of consumer care in mobile service matters may then be key forsubscribing (or not) to a given fixed services operator. Alternatively, if the consumer hasthe choice between a FTTH or an ADSL offer, his choice will then (mainly) depend on itsproduct-specific preferences.

".�. MODEL SPECIFICATIONS 44
1.3 Model specifications
The supply side is composed by two multi-market operators, denoted by k =
A, B, which are both able to provide one fixed and one mobile services offer,
indexed by j = f, m, at linear price pkj .13 �;Ih operator is assumed have
his own fixed and his own mobile infrastructures. Under this assumption,
the issue of incumbency with the associated network access problem does not
arise and allows to focus on the effects of bundling. A typical example of
such a competitive setting related to telecoms is competition between a cable
operator and an operator using copper network, with both having either their
own mobile network or an roaming agreement with another mobile network
owner.
Furthermore, operators are assumed to offer their services separately as well
as a bundle of both (that is, to practise mixed bundling) and to compete in
prices in a Hotelling setting. Each service represents a different market within
which services are maximally differentiated. Each market is represented by a
Hotelling line of unitary length where operators are located at either end (A
is in 0 and B in 1). Finally, marginal costs are denoted cf and cm for fixed and
mobile services respectively. Without loss of generality, marginal costs are set
equal to 0.
Concerning the consumers’ choice, the model uses the straight-to-mobile
view. It is therefore assumed that consumers subscribe to a mobile plan in first
place. Next, it is assumed that consumers anticipate the additional utility de-
rived from having fixed services along with mobile services. If they subscribe to
an additional fixed service, they must anticipate a supplementary and strictly
positive net utility. In any other event, the concerned consumer considers fixed
and mobile as being too strong substitutes and remains single-service user, i.e.
13 In many countries, operators offer flat-rate tariffs rather than multi-part tariff schemes.This supports the usage of linear prices.

".�. MODEL SPECIFICATIONS 45
mobile-only user. Finally, consumers’ preferences are assumed uniformly dis-
tributed along the Hotelling lines.
Fig. 1.1 A� es a graphical representation of the model specifications. As
Î y B
0 1Mobile plan subscribers from A
choose fixed services either from A
to form a bundle, from B as
cross-purchase or do not subscribe
to any fixed offer.
✁✁✁☛
❆❆❆❯
❄
Mobile plan subscribers from B
choose fixed services either from B
to form a bundle, from A as
cross-purchase or do not subscribe
to any fixed offer.
✁✁✁☛
❆❆❆❯
❄A xA
BU xA,BCP
B
0 1
A xB,ACP xB
BUB
0 1
Mobile
market
❆❆
✁✁
Fixed
market
❆❆
✁✁
DABU D
A,BCPDA
MO DB,ACP DB
BUDBMO
ÏÐÑÒ ÓÒÓ Representation of model specifications. DkBU denotes the demand for
the bundle addressed to operator k and DkMO stands the demand for mobile-only
addressed to operator k. Finally, Dk,−kCP denotes the demand for −k’s fixed services
stemming from consumers of k’s mobile service.
can be seen on the figure, the fixed market is represented by two segments
in order to allow the distinction between bundled sales and cross-purchased
sales (i.e. each service bought from a different operator).14 k� 4=? 65>?F
left segment fixed services offers are proposed to consumers of mobile services
from A. This segment can be interpreted as A’s bundle market, since only A’s
bundle is available on this segment. Similarly, the lower right segment would
then be B’s bundle market.
Moreover, there are two marginal consumers on each segment in the fixed
market: xkBU and xk,−k
CP . BU stands for bundle and CP for cross-purchase.
The first superscript indicates the mobile service provider and the second the
fixed service provider. xkBU represents the consumer who is indifferent between
a bundle from operator k and remaining mobile-only. xk,−kCP represents the con-
14 Indeed, would there only be one segment, consumers located, e.g., between 0 and xABU
could then have subscribed to mobile services from either A or B and no distinction betweenthem would be possible and thus, no distinction between bundlers or cross-purchasers.

".�. MODEL SPECIFICATIONS 46
sumer who is indifferent between being mobile-only and cross-purchasing mo-
bile services from k and fixed services from −k. The presence of two marginal
consumers on each segment illustrates the fact that the fixed market is not
fully covered, allowing for mobile-only users to emerge.
Maximal differentiation and the presence of mobile-only consumers between
A and B inherently leads to local monopolies. This might appear as a strong
assumption, particularly in the fixed telecommunications market where compe-
tition is rather fierce. Nevertheless, this representation is a first step towards
the distinction between the symmetric case and product-specific preferences
(respectively intra and inter-platform competition): the symmetric case could
represent market segmentation in terms of consumer age.15�F5@0I4Q:H?I�SI
preferences might be valid for inter-modal competition in the fixed market,
e.g. where the copper network competes with a fibre or cable network.16
h0F���A 45 4=? I5�:0K?F: 04�6�47 j0�I4�5�, 4=? ;::0KH4�5� 5j ?TH?I4?@
utility implies that the total utility function is the sum of a given utility and
an expected utility. Total utility writes U = Um + EUmf , where Um is the
given utility from mobile services and EUmf the expected additional utility
from having both mobile and fixed services.
Denote the consumer’s valuation for data service quality (or volume) by
vkj and his valuation for telecommunications services on the go by gk
j , for
k = A, B and service j = f, m. Some simplifying assumptions on valuations
are made. First, the valuation of mobile data volume, vm, is assumed to be
15 Relative to the symmetric case and market segmentation in terms of consumer age: elderpeople more often mention incumbent operators rather than newcomers, which testifies of acertain degree of perceived differentiation.
16 Some empirical works estimated access demand for different technologies (FTTH,ADSL, narrowband and possibly mobile) in different countries, such as e.g. Cardona etal. x2009O Vo[ �{NW[a] o[ Ida and Kuroda x2006O Vo[ Ô]m]^P ÕXYa[ [YN{`WN NXotu ]\o^e oWXY[things, that substitution between fixed access technologies is not absolute. For instance, Car-dona et al. indicate that Austria’s narrowband users might not consider broadband “[. . . ]as an equally good substitute”. Similarly, Ida and Koruda’s study reveals that Japan’s ADSLusers can be regrouped according to their price sensitivities: medium-speed ADSL user(“normally price sensitive”) and low and high-speed ADSL user (“extremely price sensitives”). Hence, the assumption of local monopolies might be surprising but is not unfounded.

".�. MODEL SPECIFICATIONS 47
the same for each operator. This is a reasonable assumption, as it seems im-
plausible for an operator to compete, at least in the long run, using an older
technology than its competitor.17 B0F4=?FK5F?, �4 �: ;::0K?@ 4=;4 K5E�6? �?4Q
works are of the same quality and have the same geographic coverage, which
leads gm to be the same for each operator.
Given these specifications, the utility of mobile services from operator k,
Ukm, then writes vm+gm−pk
m−γ|yk − y|, where y is the position of the marginal
consumer, yk is operator k’s position and γ represents the disutility a consumer
incurs when not consuming its ideal mobile services (i.e. transportation costs).
When it comes to the decision of subscribing to a fixed service, two points
are to emphasise. First, gkf is by definition close or equal to 0, because fixed
service cannot provide much mobility. Therefore, the expected additional util-
ity does only stem from excess valuation for data volume of fixed over mobile.
Define by θk = vkf − vm the measure of the excess valuation operator k’s fixed
service can offer a consumer. This measure θk can be seen as the expression
of the magnitude of FMS observed in the telecommunications industry. Due
to technological superiority of fixed networks (e.g. regarding connection speed
of data transmission capacity), it follows that θk > 0, ∀k = A, B. Increasing
substitutability is represented by θk approaching 0. Alternatively, a high θk
indicates a large spread between vkf and vm which in turn implies stronger
complementarity between both services.
A second point to notice is that, when the consumer actually buys fixed
services, he has the choice between buying them from the same operator he
bought his mobile plan from (thus, forming a bundle) and cross-purchasing. In
the case of bundling, a discount δk will be granted by his operator. Otherwise,
17 For instance, if one operator deploys a new technology (e.g. 4G LTE), it seemsimplausible for a competitor to maintain its 3G network, but will most likely invest in the4G technology, too. Furthermore, newcomers, for which entry barriers may be very high,might benefit from a roaming agreement with an incumbent operator and, hence, competeon the same level with identical quality.

".�. MODEL SPECIFICATIONS 48
the consumer has to pay the full price for each service.
Given these specifications, a consumer of mobile services from operator
k anticipates his expected additional utility of having both services by con-
sidering all the purchase possibilities (this is, either as a bundle or as cross-
purchase). Thus, the expected additional utility yields
EUkmf =
∫ xkBU
xkUk
BU +∫ x−k
xk,−k
CP
Uk,−kCP (1.1)
=∫ xk
BU
xk
[θk − (pk
f − δk) − t|xk − z|]
dz +∫ x−k
xk,−k
CP
[θ−k − p−k
f − t|x−k − z|]
dz
In the above, the first integral stands for bundled purchase and the second
for cross-purchase. Similarly to the utility function for mobile services, xk
denotes operator k’s location on the Hotelling line, xkBU , respectively xk,−k
CP
is the position of the marginal consumer and t the transportation cost. It is
assumed that the disutility of not consuming their preferred service is the same
for fixed as for mobile services, this is, t = γ. Expression (1.1Ö is equivalent
to consumer surplus. As a matter of fact, it is the surplus subscribers of
a mobile plan from a given operator expect from having mobile and fixed
services (bundled or not). Regarding FMS, it can be seen that the smaller θk
(or equivalently θ−k), the smaller the expected utility.
Finally, as mentioned above, symmetry appears when vkf = v−k
f = vf . This
implies a symmetric setting where θk = θ−k = θ and thus an equal magnitude
of FMS among operators. All the consumers see fixed and mobile services as
equally strong substitutes and have an equally high expected additional util-
ity.18 �5�:?U0?�467, 4=? ?U0�6�EF�0K >�66 E? :7KK?4F�I. k� 4=? 54=?F =;�@, ;�
asymmetric setting and, thus, asymmetric equilibrium appear with product-
specific preferences where vkf Ó= v−k
f . In this setting, consumers see one opera-
tor’s fixed services as a better alternative (say operator k), which grants that
18 Recall that mobile-only consumer appear when they do not incur a positive net utility.

".�. RESULTS 49
operator a competitive advantage. Furthermore, this latter operator has also
a lower FMS (θk > θ−k), providing consumers a higher expected utility.
The subsequent analysis relies on the following game:
1) Operators decide whether to introduce a bundled offer or not
2) Operators set simultaneously prices for mobile and fixed services (pkm, pk
f )
3) Consumers choose a mobile plan
4) Consumers learn their preferences and i) decide whether to subscribe to
a fixed service or not offer and ii) in the case of subscription, they decide
to which operator.
The game is solved by backward induction and the results are presented in the
next section.
1.4 Results
Before turning to the analysis of equilibria, market shares and the different
consumption (i.e. mobile-only, bundle or cross-purchase) types are derived.
Stages 3 and 4 are solved using product-specific preferences, rather than the
symmetric case. This allows for insights in mobile demand matters, which
would be hidden otherwise. In subsection 1.4.1, F?:H?I4� ?67 1.4.2, :4;A?: "
and 2 are then solved for the symmetric case, respectively for product-specific
preferences.
Stage 4: Consumers’ decision regarding fixed services
The position of the marginal consumers in the fixed market are needed in
order to calculate the expected additional utilities EUmf . According to the
model setup above, the marginal consumer xkBU (that is, who is indifferent
between a bundle and mobile-only consumption) is determined by equalising
the corresponding utility to 0, where 0 is the anticipated utility incurred by
a consumer whose excess valuation for fixed services is insufficient given the

".�. RESULTS 50
price pkf and therefore remains mobile-only. A similar reasoning applies to
xk,−kCP . Thus, from Uk
BU ≡ θk − (pkf − δk) − t|xk − xk
BU | = 0 and Uk,−kCP ≡
θ−k − p−kf − t|x−k − xk,−k
CP | = 0, the locations of the marginal consumers are
given by19
×xABU =
θA−(pAf
−δA)t
, xA,BCP = 1 − θB−pB
f
t
xB,ACP =
θA−pAf
t, xB
BU = 1 − θB−(pBf
−δB)t
(1.2)
The first line of (1.2Ö represents the marginal consumers in the fixed market
that already have a mobile plan from A (the lower left segment on Fig. 1.1-
and the second line corresponds to the marginal consumers that have a mobile
plan from B (the lower right segment). Using expression (1.1Ö, the expected
additional utility is integrated over the corresponding x. Hence, subscribing
to a fixed offer when having a mobile offer from operator A yields
EUAmf =
∫ xABU
0
[θA −
(pA
f − δA)
− tz]
dz +∫ 1
xA,B
CP
[θB − pB
f − t(1 − z)]
dz
=1
2t
{(pA
f − vAf − δA
)2+
(pB
f − vBf − δB
)2+ 2δB
(pB
f − vBf
)− δB2
+ 2vAm
[(pA
f − θA − δA)
+(pB
f − vBf
)]}(1.3)
Similarly, with a mobile plan from operator B
EUBmf =
∫ xB,A
CP
0
[θA − pA
f − tz]
dz +∫ 1
xBBU
[θB −
(pB
f − δB)
− t(1 − z)]
dz
=1
2t
{(pB
f − vBf − δB
)2+
(pA
f − vAf − δA
)2+ 2δA
(pA
f − vAf
)− δA2
+ 2vBm
[(pB
f − θB − δB)
+(pA
f − vAf
)]}(1.4)
Stage 3: Consumers’ decision regarding mobile services
19 Recall that operator A is located in 0 (thus, xA = 0) and B in 1 (xB = 1).

".�. RESULTS 51
After the expected additional utilities being derived, the third stage of the
game is solved by defining the marginal consumer y in the mobile market.
With operator A located in 0, y implicitly defines the demand for A’s mobile
services and is solution of
UAm(y, ·) + EUA
mf = UBm(y, ·) + EUB
mf (1.5)
gAm + vA
m − pAm − γy + EUA
mf = gBm + vB
m − pBm − γ(1 − y) + EUB
mf
leading to
y =gA
m − gBm + vA
m − vBm + pB
m − pAm + γ + EUA
mf − EUBmf
2γ(1.6)
Given the assumptions of equal valuations vm and gm, as well as equal trans-
portation costs t = γ and plugging (1.3Ö and (1.4Ö into (1.6Ö, y yields:20
×y =1
2+
pBm − pA
m
2t+
δA2 − δB2
4t2−
δA(pA
f − θA)
− δB(pB
f − θB)
2t2(1.7)
The above expression provides first interesting insights. First of all, it shows
how the bundle discount acts as a competitive tool. The third term shows that
the operator able to offer the highest discount attracts a higher demand for its
mobile services. Hence, the discount acts as a competitive tool as it increases
the number of potential bundle sales. Secondly, the demand for mobile services
depends on the magnitude of FMS, θ. For instance, the demand for A’s mobile
services, y, depends positively on θA: ∂y∂θA = δA
2t2 . Thus, the higher θA, the less
substitutable (or equivalently. more complementary) operator A’s fixed and
mobile services are and therefore, the higher operator A’s demand for mobile
services. The intuition behind this is that, due to complementarity, more
consumers are willing to subscribe to A’s mobile service in light of a potential
20 Operator B’s demand for mobile services is equal to 1 − y.

".�. RESULTS 52
subscription of a bundle and of benefitting from a reduced price via the bundle
discount δA. On the other hand, y depends negatively on θB: the more B′s
services are complementary, the lower is the demand for A’s mobile services.
It is seen that under symmetry, the mobile market is split evenly among
operator: y = 1/2.
Given that all the marginal consumers in each market are now defined, the
different consumption types can be characterised which are given in table 1.1
E?65>. h=�: 4;E6? ;6:5 A� ?: �54;4�5�: j5F 4=? @��?F?�4 @?K;�@:.
ØÙÚÛÜ ÝÞßàÛá
Mobile market
[0 y] [y 1]
[0 xABU ] Bundlers from A : DA
BU /
[xABU xA,BCP ] mobile-only-consumers from A: DA
MO /
[xA,BCP 1]
Cross-purchasers:D
A,BCP
/Mobile from A and fixed from B:
[0 xB,ACP ] /
Cross-purchasers:D
B,ACPMobile from B and fixed from A:
[xB,ACP xBBU ] / mobile-only-consumers from B: DB
MO
[xBBU 1] / Bundlers from B : DBBU
âãäåæ ÓÒÓ The different consumption types according to the marginal consumers.BU denotes bundlers, CP denotes cross-purchasers, MO denotes mobile-only con-sumers. For demands of cross-purchasers, the first superscript indicates the mobileoperator, the second superscript the fixed operator.

çèé. RESULTS 53
Operators face the following maximisation problems:
maxpA
f,pA
m
ΠA = pAm DA
MO + pAm DA,B
CP + pAf DB,A
CP + (pAm + pA
f − δA) DABU (1.8a)
= pAm
(xA,B
CP − xABU
)y + pA
m
(1 − xA,B
CP
)y + pA
f xB,ACP
(1 − y
)
+(pA
m + pAf − δA
)xA
BU y
maxpB
f,pB
m
ΠB = pBm DB
MO + pBm DB,A
CP + pBf DA,B
CP + (pBm + pB
f − δB) DBBU (1.8b)
= pBm
(xB
BU − xB,ACP
) (1 − y
)+ pB
m xB,ACP
(1 − y
)+ pB
f
(1 − xA,B
CP
)y
+(pB
m + pBf − δB
) (1 − xB
BU
) (1 − y
)
The first term represents revenues from mobile-only sales. The second and
third terms correspond to revenues stemming from separate sales of either
services when consumers cross-purchase. Finally, the last term represents rev-
enues from bundled sales.
1.4.1 Symmetry among operators
When consumers have the same reservation price for fixed services regardless
the provider, the environment is said to be symmetric. This subsection analy-
ses this case. It is assumed that consumers have the same valuation for fixed
services: vAf = vB
f = vf . Since mobile services are also equally valued by all
the consumers (vAm = vB
m = vm), it follows that θA = θB = θ.
The analysis begins with the regime without bundling, then provides the
equilibria with bundling, and terminates with a comparison of both regimes.
Stage 2: Price setting stage
No bundling Suppose first that operators do not bundle. The model is
easily adapted by setting the bundle discounts δA and δB equal to 0. Then, the

çèé. RESULTS 54
profit maximisation problems in (1.8aê and (1.8bê yield the following equilibria,
∀k = A, B:21
ëk∗f =
θ
2(1.9a)
pk∗m = t (1.9b)
Πk∗ =t
2+
θ2
4t(1.9c)
In contrast to the fixed market, the market for mobile services is fully covered
and operators compete head-on. Thus, the price for mobile services is equal
to the standard Hotelling price. In the partially covered fixed market, prices
are independent of any transportation cost, and are negatively impacted by
increasing substitutability: the stronger the FMS (this is, θ closer to 0), the
smaller pkf , ∀k = A, B. Moreover, profits are also negatively impacted by
stronger substitutability.
In the no bundling regime, operators face the following equilibrium de-
mands, ∀k = A, B:
Dk∗MO =
1
2− θ
2t(1.10a)
Dk∗BU = Dk∗
CP =θ
4t(1.10b)
Obviously, the demand for mobile-only, DkMO, increases with stronger FMS.
With fixed and mobile becoming stronger substitutes, an increasing consumer
mass does not see the point in paying for a similar service when their needs are
satisfied with the service they already possess. On the other hand, all demands
for fixed services, whether as a bundle or as cross-purchase, decrease with θ.22
ìíîe that if fixed and mobile services were perfect substitutes (i.e. vf = vm
21 The detailed profit maximisation can be found in appendix A.1.1ï22 The term “bundle” is somehow abusive in the sense that this paragraph considers the
no-bundling regime. Here, bundling is merely “one-stop shopping”, where both services aresubscribed from the same operator, although no discount is granted.

çèé. RESULTS 55
and thus θ = 0), there would be no demand for fixed services and operators
have symmetric market shares in the mobile market only: DkMO = 1/2, ∀k =
A, B.
Before turning the mixed bundling regime, recall from the model setup
that the operators are maximally differentiated, i.e. located at either end of
the Hotelling lines. Formally, local monopolies arise, in A’s bundle market
(the lower left segment of Fig. 1.1ðñ òóôõ îóô ö÷øùúõ÷û üíõýþöôø xABU is to the
left of xA,BCP : xA
BU < xA,BCP Similarly in B’s bundle market: xB,A
CP < xBBU . Then,
assuming that both operators have a strictly positive market share in the fixed
market (whether in its own bundle market or the rival’s) the condition for local
monopolies in the fixed market yields:
0 < xABU < xA,B
CP < 1
0 < xB,ACP < xB
BU < 1(1.11)
Solving these inequalities together yields the following:23
ÿC�����C� 1.1. Without any discount granted on bundled sales, local monop-
olies arise if fixed and mobile services are neither too strong substitutes, nor
too strong complements: 0 < θ < t.
The first inequality, 0 < θ, is natural, given the technological superiority
of fixed services. It indicates that substitutability should not be too strong.
The second inequality yields the opposite: fixed and mobile services should
not be too complementary. If θ was too large, fixed and mobile services would
be too complementary and no consumer would remain mobile-only. The fixed
market would then be fully covered and the marginal consumers, who are
indifferent between bundling and cross-purchasing would be one and the same.
Consequently, the operators would compete head-on in the fixed market, too.
23 See appendix A.1.3 f�� ������ ��� � �ï

çèé. RESULTS 56
Mixed Bundling In a mixed bundling regime, operators can offer their
services as a bundle or separately. Before turning to equilibria, another as-
sumption is briefly discussed.
Due to perfect symmetry, it is reasonable to assume that each operator’s
total profits have the same reaction towards an increase of the rival’s discount.
As appendix A.1.2 �íømally shows, the marginal impact on A’s profits caused
by a marginal increase of B’s discount is exactly the same than a marginal
increase of A’s discount has on the B’s profits. Hence, it is assumed that both
operators grant the same level of discount for bundled sales in a symmetric
environment:
Assumption 1.1. In the case of perfect symmetry, the multi-market operators
will set identical bundle discounts: δA = δB = δ.
Under this assumption, equilibrium stand-alone prices and total profits in
a bundling regime (labelled by a ”hat”) yield:
pkf =
θ
2+
δ
4(1.12a)
pkm = t +
δ2
2t(1.12b)
Πk =t
2+
θ2
4t− δ2
16t(1.12c)
The impact of introducing a bundle discount on prices are easily seen by com-
paring equilibria in (1.12aê to (1.9aê, respectively (1.12bê to (1.9bê: all individual
prices increase by a fraction of δ. This is a standard result in the bundling
literature. When products or services under consideration are substitutable
and when firms introduce a bundled offer alongside their existing stand-alone
offers, prices for stand-alone offers increase in order to recoup at least partially
the cost of bundling.
Comparing profits in both regimes reveals that bundling is ultimately not

çèé. RESULTS 57
profitable. In effect, comparing (1.9cê and (1.12cê shows up negative:
Πk − Πk =t
2+
θ2
4t− δ2
16t−
(t
2+
θ2
4t
)
= − δ2
16t(1.13)
Such a profit decline is explained as follows. Due to the discount granted on
bundled sales, an increasing mass of consumers subscribes to the bundled offer
at a price equal to pkm + pk
f − δ. This is verified by looking at the equilibrium
demands, ∀k = A, B:
DkMO =
1
2− θ
2t− δ
4t(1.14a)
DkBU =
θ
4t+
3δ
8t(1.14b)
DkCP =
θ
4t− δ
8t(1.14c)
The increase of DkBU and the decreases of Dk
MO and DkCP can be observed by
the following difference. Define by ∆Dkl = Dk
l − Dkl the variation of demand
l = {MO, BU, CP} addressed to operator k when passing from a no-bundling
regime (Dkl ) to a bundling regime (Dk
l ). It then is easily verified that:
∆DkBU + ∆Dk
MO + ∆D−k,kCP =
3δ
8t+ (− δ
4t) + (− δ
8t) = 0 (1.15)
Hence, bundling has the effect of diverting demand from the more expensive
separate sales (which allow to cover the costs of bundling) towards the cheaper
bundled sales. This diversion then leads to a decrease in profits.
Note, at this stage that, due to the presence of a discount on bundled
sales, the condition 1.1ñ ôõýþøúõù ûíü÷û öíõí,íûúôý úõ îóô ��ô� ö÷ø�ôîñ ÷�÷,îý
as follows:
Remark 1.1. Under assumption 1.1 t�� condition for local monopolies to arise

çèé. RESULTS 58
becomes: 0 < θ < t − δ2.
The corresponding interpretation remains unaffected: FMS should not be
too strong, nor too weak. In other words, fixed and mobile services should
not be too substitutable, nor too complementary. Although, in presence of δ,
the condition is logically strengthened. As mentioned above, the demand for
bundled sales increases, whereas other demands (for mobile-only and cross-
purchases) decrease, implying that the discount turns the substitutes into
stronger complements.24
St��� 1: The operators’ decision to bundle or not
A natural question that arises from the comparison of pricing equilibria
is that of the individual incentive to introduce a bundle discount, given that
operators are aware of the negative outcome when competing via bundling. As
a matter of fact, depending on the magnitude of θ (i.e. on the magnitude of
FMS), a multi-market operator has an individual incentive to bundle its two
services. When operator k unilaterally decides to introduce a bundle discount,
its profits, Πkunilateral
, are equal to
Πkunilateral
=t
2+
θ2
4t+
θδkν(2λ + θδk
)− δk2
[3t4 +
(9t2 − δk2
)2]
4tµ2(1.16)
expression where ν = (8t2 −δk2
), λ = (6t2 −δk2
) and µ = (12t2 −δk2
). The first
two terms in the above, t/2 and θ2/4t, correspond to profits in a no-bundling
regime given by (1.9cê. The third term therefore equals the difference in profits
operator k earns with unilateral bundling compared to the no-bundling regime.
The difference between both regimes is equal to Πkunilateral
−Πk∗. Then, checking
for a value of θ for which ∆Πk is positive and that complies with condition 1.1
2� This means that the marginal consumers in the fixed market draw closer to each other,reducing the mobile-only segment and increasing the operators’ bundle market share. Sincethe demand for mobile-only decrease at a higher rate than the demand for cross-purchases,firms come closer to each other, which leads to the strengthened condition.

çèé. RESULTS 59
yields:
Πkunilateral
− Πk∗ =θδkν
(2λ + θδk
)− δk2
[3t4 +
(9t2 − δk2
)2]
4tµ2> 0
⇔ t − δ
2> θ >
√2
√t2µ2
δ2ν− λ
δ≡ θ (1.17)
θ is strictly larger than 0 for any t > 0 and δ > 0. Thus, too strong a
substitutability between fixed and mobile services (that is, θ ∈ (0, θ]) does
not allow for unilateral bundling to be profitable. On the other hand, for any
θ ∈ (θ, t− δ2), unilateral bundling is profitable. Hence, if FMS is of intermediate
magnitude operator k has an individual incentive to offer a fixed-mobile bundle.
The best response towards unilateral bundling by a rival is to counter-
bundle, because losses are minimised. Indeed, the difference in profits of the
(initially) non-bundling operator, Πk − Πkunilateral
, yields:25
#Πk − Πkunilateral
=t
2+
θ∆ν(2λ + θ∆
)− δk6
4tµ−
2t[36t4 − δ−kθ
(12t2 − δ−kθ
)]
(12t2 − δ−k2
)2
+2t2
[6t2
(4δ−k2 − 7δk2
)−
(δ−k2
+ δk2)2
+ 10δk2]
4tµ(1.18)
with ν, µ and λ as defined above and ∆ = (δk − δ−k).
Because the above is a continuous function of θ for any θ ∈ (θ, t − δ2) and
strictly positive at the boundaries of this interval, it appears that counter-
bundling is always the best response. Hence, if one operator unilaterally de-
cides to bundle, its rival will always counter-bundle.
Finally, as both operators are symmetric and have the same strategic be-
havior, it is immediate to see that the equilibrium outcome involves strictly
positive bundle discounts. Multi-market operators will incur profits as given
in (1.12cê.
The following can therefore be stated:
25 It is important to remark that now k is the initially non-bundling firm.

çèé. RESULTS 60
Proposition 1.1. If multi-market operators are perfectly symmetric, unilateral
bundling is always profitable if FMS is neither too strong, nor too weak, i.e.
θ ∈ (θ, t− δ2). The non-bundling rival’s best response is counter-bundling, such
that the equilibrium outcome involves both firms to offer a strictly positive
bundle discount.
Since both operators incur losses when competing via bundling, it appears
that they are in prisoners’ dilemma as they could incur higher profits than
they do in equilibrium. Unsurprisingly, industry profits (IP ), decrease:
∆IP =A,B∑
k
Πk −A,B∑
k
Πk
=
(t +
θ2
2t− δ2
8t
)−
(t +
θ2
2t
)
= −δ2
8t(1.19)
On the other hand, consumers benefit from this competition. As has been dis-
cussed above, bundling induces a larger consumer mass to consume a bundled
offer which comes at a lower price. This is clearly reflected by equilibrium
consumer surplus (CS):
∆CS = CS − CS
=
(gm + vm +
θ(δ + θ)
2t+
δ2
8t− 5t
4
)−
(gm + vm +
θ2
2t− 5t
4
)
=θδ
2t+
δ2
8t(1.20)
Summing up (1.19ê and (1.20ê gives the difference in social welfare (W ), which
clearly increases: ∆W = θδ2t
. But the stronger FMS (θ close to 0), the smaller
the welfare-beneficial effect induced by the bundle discount. The reason for
this is that the less consumers feel the need to subscribe to a second service,
the less convincing is the bundling discount.

çèé. RESULTS 61
1.4.2 Product-specific preferences
Consider in this subsection the possibility that consumers’ preferences differ for
the different fixed services, such that vkf Ó= v−k
f .26 Tóúý ö÷� íüüþøñ �íø úõýî÷õüôñ
if one operator offers fixed services over FTTH while the rival operator uses
a cable network. Another example consists in both operators using the same
infrastructure, but offering differentiated TV channel baskets, VOD catalogues,
or different volume of space for cloud computing.
Without loss of generality, assume that vkf > v−k
f and thus θk > θ−k. For
convenience, operator k will be called the higher valued operator, as it enjoys
the higher consumers’ valuation for fixed services. On the contrary, operator
−k is called the lower valued operator.
The interest in analysing this case is to show that the prisoner’s dilemma
does not emerge and the higher valued operator will always earn higher profits
with bundling. The lower valued operator’s profits, however, decrease, but
bundling allows to minimise the losses. Albeit, even if the higher valued op-
erator’s profits increase, it has no incentive to induce full market coverage in
the fixed market, since, in this case, profits would decrease.
Similarly to the symmetric case, the present analysis first derives the equi-
librium without bundling and then, in a second time, the equilibrium outcome
with mixed bundling.
Stage 2: Price setting stage
26 In most of the subsequent analysis, the operators will simply be denoted by k. Onlywhen appropriate, so as to enhance comprehension of the advanced ideas, the operators willbe distinguished by A and B.

çèé. RESULTS 62
No Bundling When neither operator offers its services as a bundle, the
equilibrium outcome yields
pkf =
θk
2(1.21a)
pkm = t (1.21b)
Πk =t
2+
θk2
4t(1.21c)
and demands become
DkMO =
1
2− θk + θ−k
4t(1.21d)
DkBU =
θk
4t(1.21e)
Dk,−kCP =
θ−k
4t(1.21f)
Since θk > θ−k, the higher valued operator sets a higher price for its fixed
service. Despite the higher price, it has a larger market share in its bundle
market, as well as in its rival’s bundle market. Hence, it also earns higher
profits.
Mixed Bundling Consider now the mixed bundling regime. Before turning
to the core of the analysis, it should be noted that, due to asymmetry induced
by product-specific preferences, the discounts can no longer be assumed to be
identical. Firms will adopt distinct strategic behaviour and an identical level
of discount for both firms does no longer seem plausible.
Similarly to the previous subsection, local monopolies arise if 0 < xABU <
xA,BCP < 1 and 0 < xB,A
CP < xBBU < 1. Several solutions ensure this set of inequal-
ities to hold and each solution can be interpreted as a different competitive
setting. In the following, these different settings will be briefly presented.
First, one can distinguish the scenario where the consumers’ valuation vAf

çèé. RESULTS 63
is considerably higher than vBf , leading to a stronger FMS for operator B, from
the alternative case where the difference between valuations is relatively small
and θA therefore close θB. Both scenarios appear plausible, if one considers
competition between narrowband and broadband, represented by the first sce-
nario, or competition between two broadband networks like fibre vs. cable.
Although, the second scenario seems to be more relevant for most of today’s
telecommunications markets, especially given the fact that narrowband access
demand is rather low and generally declining compared to broadband access
demand.
Second, within each scenario, each operator can be more or less aggressive
in its pricing strategy when it comes to the level of its bundle discount. This
means that either the higher or the lower valued operator can offer a larger
discount than its rival. Possible interpretations are:
i) when the higher valued operator offers a larger discount, it does so in
order to exert a supplementary competitive pressure on its rival. Indeed,
the latter already competes against stronger complements, whereas its
own services are relatively strong substitutes (that is, θB < θA). Thus,
if A adds a pricing constraint on B by offering stronger price reductions,
competition increases.
ii) when the higher valued operator offers a smaller discount, it makes use of
the information that, if consumers choose to subscribe to a fixed service,
some of them will prefer having it from A since they value it more. This
may confer a considerable advantage: the higher valued operator knows
that these consumers are subscribing to its fixed service even with a
smaller discount than its rival.
The subsequent analysis considers the case where consumer valuations do
not differ much and where the higher valued operator offers the higher discount.

çèé. RESULTS 64
Condition 1.2. If consumers have product-specific preferences and consumers’
valuations θA and θB are close, then, local monopolies arise whenever:
2θB < θA + θB <4t − 3
(δA − δB
)
2≡ θ
The condition states that FMS, and more specifically θA + θB cannot be
too strong, nor to weak. Would FMS be to strong, consumers would not be
interested in fixed services and thus remain mobile-only. Alternatively, with
too weak a FMS, no consumer would remain mobile-only and the corresponding
segment (that is, xk,−kCP − xk
BU) on the Hotelling lines would then not exist,
leading to head-on competition between operators in the fixed market.
Note finally that the above condition satisfies both assumptions of δA > δB.
As a matter of fact, it must be that δA > 3δB in order for θ to be positive.27
Tóô öú�ô� �þõ�ûúõù ô�þúûú�øúþöñ ô�,øôýýô� ÷ý �øýî íø�ôø T÷�ûíø ÷,,øí�ú�
mations around δA and δB, is given by
pAm = t +
δAθA − δBθB
6t+ O (1.22a)
pBm = t − δAθA − δBθB
6t+ O (1.22b)
pAf =
θA
2+
δA
4+ O (1.22c)
pBf =
θB
2+
δB
4+ O (1.22d)
ΠA =t
2+
θA2
4t+
δAθA − δBθB
6t+ O (1.22e)
ΠB =t
2+
θB2
4t− δAθA − δBθB
6t+ O (1.22f)
where O represents the omitted terms.28 Uõ�ôø condition 1.2ñ îóô úö,÷üîý í�
bundling on prices and profits can be summarised by the lemma below:
27 Moreover, the transportation costs t must be sufficiently large (that is, t > (3δA−δB)/4)for θ to be positive.
28 O = O[δk
]2+ O
[δ−k
]2+ O
[δ−k
]2δk.

çèé. RESULTS 65
Lemma 1.1. If consumers have product-specific preferences are predominant,
consumers’ valuations for fixed services close and δA > δB, the adoption of a
bundling strategy implies that
i) both prices for fixed services, pkf , increase, ∀k = A, B,
ii) the price for the higher valued operator’s mobile service, pAm, increases,
iii) the price for the lower valued operator’s mobile service, pBm, decreases,
iv) the higher valued operator earns higher profits,
v) the lower valued operator earns lower profits.
Proof. The proof is contained in appendix A.1.5è
It appears that some of the results from the symmetric case do also hold
in the setting with product-specific preferences. The prices for fixed services
increase. The intuition is the same as in the symmetric case: stand-alone
prices increase in order to recoup the costs of bundling.
In contrast, prices for mobile services vary differently from one operator
to another. Whereas the higher valued operator’s price increases, the lower
valued operator’s price decreases, which is the latter’s reaction towards the
business-stealing effect in the mobile market. To see this effect, it can be
verified that the increase of A’s bundle market equals the increase of its share
in the mobile market. Define ∆y = yNo bundling − yMixed bundling the displacement
of the marginal consumer in the mobile market induced by the introduction of
a bundle discount:
∆y = yNo bundling − yMixed bundling
=1
2+
δAθA − δBθB
12t2− 1
2
=δAθA − δBθB
12t2(1.23)
Note that the above is positive, since θA > θB and δA > δB. There is thus a
displacement to right of the marginal consumer in the mobile market, which

çèé. RESULTS 66
implies an increase of A’s share in that market.
Define moreover, in a similar vain as in section 1.4.1ñ ∆DAl = DA
l − DAl as
the variation of demand l = {MO, BU, CP}. The sum of the three different
∆DAl for A’s bundle market yield:
∑
l
∆DAl =∆DA
BU + ∆DAMO + ∆DA,B
CP
=
[θA
4t+
δA
8t
(3 +
θA2
3t2
)− δAδBθB
24t3
]−
[θA
4t
]
+
[1
2− θA + θB
4− 3δA − δB
8t+
δAθA − δBθB
12t2
(1 − (θA + θB)
2t
)]
−[
1
2− θA + θB
4
]
+
[θB
4t+
θB(δAθA − δBθB)
24t3− δB
8t
]−
[θB
4t
]
=δAθA − δBθB
12t2(1.24)
=∆y
Hence, operator A’s bundle market increases at the expense of its competi-
tor’s bundle market. This business-stealing effect is amplified by A’s higher
discount, which turns both services into stronger complements and thus en-
courages even more consumers to subscribe to the higher valued operator’s
mobile and fixed services. The lower valued operator B reacts towards this
increased competition by lowering the stand-alone price of its mobile services.
Although, by doing this, it loses one source of revenue that could allow to
recoup its costs of bundling. B therefore earns reduced profits.
Stage 1: Operators’ decision to bundle or not
From the discussion above follows that, since the higher valued operator
earned higher profits if both operators bundle, it will also earn higher profits if
it is the only operator to bundle. In this case, it would not face a bundling rival
and thus less fierce competition. The equilibrium in stage 1 therefore relies on

çèé. RESULTS 67
the decision of the lower valued operator whether or not it counter-bundles or
not.
Similarly to the symmetric case, counter-bundling is more profitable than
letting the rival (here, the higher valued operator) bundle unilaterally. Indeed,
let the variation in B’s profits when passing from a situation with unilateral
bundling by A to a situation where both operators bundle be denoted by
∆ΠB = ΠB − ΠBA unilateral
.29 Iî ü÷õ �ô ýóíòõ îó÷î þõ�ôø üíõ�úîúíõ 1.2ñ îóô ûíòôø
valued operator mitigates the reduction of its profits via counter-bundling:
ΠB − ΠBA unilateral
=
(t
2+
θB2
4t+
θBδB − θAδA
6t
)
−(
t
2+
θB2
4t− θAδA
6t+ Ψ
)
=θBδB
6t
>0 (1.25)
The last line follows since θB, as well as δB are strictly positive. Hence, both
operators bundle in equilibrium. Therefore:
Proposition 1.2. If consumers have product-specific preferences, consumers’
valuations for fixed services close and δA > δB, bundling two substitutable
products does not involve a prisoner’s dilemma. Bundling increases profits of
the operator with the lower FMS (this is, the operator with the higher fixed
service valuation), whereas it acts as a Maximin strategy for the operator
with the stronger substitutability.
The results above are in opposition with those of Thanassoulis (2007ðè Iõ
his paper, when consumers have product-specific preferences, bundling involves
a prisoners’ dilemma and operators incur revenue losses. Also, as will be shown
below, in Thanassoulis’ setting, social welfare decreases, because of allocative
29 ΠBA unilateral stands for B’s profit when A bundles unilaterally and ΠB are B’s profits
when both operators bundle (i.e. equation (1.22fê).

çèé. RESULTS 68
inefficiencies: some consumers switch for a bundle even though their needs
would be better off with cross-purchases. Here, social welfare will be pulled by
the increased consumer surplus as consumers benefit from the bundle discount,
as well as from lower stand-alone mobile prices from the lower valued operator.
This reversal of the results can be explained by the possibility for the
operators to expand their sales in the fixed market, as this market is not fully
covered. In the cited paper, all markets are fully covered, preventing thus any
possible expansion. In addition, in Thanassoulis’ work, consumers of a single
product (the “small buyers”), do not change their consumption behavior and
remain small buyers. Only “large buyers” (i.e. consumers of both products)
may switch from cross-purchases to a bundle of both products. In contrast to
this, in the present work, single-service consumers, i.e. mobile-only consumers,
can switch to multi-service consumers. Hence, because of this migration from
single to multi-service consumption, the operators can expand their market
and increase their market shares (at least the higher valued operator).
Considering equilibrium profits of both operators shows that the higher
valued operator gains what its competitor looses. This implies that bundling
is neutral at an aggregated level. Indeed, summing up individual profits so as
to get profits industry level yields a 0 variation.
∆IP =A,B∑
k
Πk −A,B∑
k
Πk
=
[t +
θA2
+ θB2
4t
]−
[t +
θA2
+ θB2
4t
]
= 0 (1.26)
On the other hand, consumer surplus increases, because consumers do not
only benefit from the bundle discount, but consumers of B’s mobile services

çèé. RESULTS 69
are better off due to lower stand-alone prices. Hence:
∆CS =CS − CS
=
(gm + vm − 5t
4+
θA2
+ θB2
2t+
θAδA + θBδB
2t
)
−(
gm + vm − 5t
4+
θA2
+ θB2
2t
)
=θAδA + θBδB
2t(1.27)
Finally, summing up (1.26ê and (1.27ê yields the difference in social welfare.
It is easily seen that with product-specific preferences, social welfare strictly
increases:
∆W = ∆CS + ∆IP
=θAδA + θBδB
2t
Full market coverage in the fixed market As point iv) í� ûôöö÷ 1.1
úõ�úü÷îes, bundling shows up to be an efficient strategy for the higher valued
operator to increase its profits. However, since the bundle discount turns ser-
vices into stronger complements, it may cause the fixed market to end up fully
covered. This raises the question of whether or not the higher valued operator
has an incentive to avoid a fully covered market, which means the disappear-
ance of stand-alone sales of fixed services and, thus, a source of revenue for
recouping the costs of bundling.
In order to answer this, consider a fully covered fixed market. The assump-
tion vAf > vB
f still prevails but it is assumed that vAf is not excessively higher
than vBf , so that operator A can not monopolise the fixed market.30 Fíøö÷ûû�ñ
30 Appendix A.1.7 p������ �� ��� �!p�����"� " �$� f ��% ������� &!�� �'��scenario.

çè1. DISCUSSION AND CONCLUSION 70
the no-monopoly condition yields 0 < ω < 6t−3(δA+δB)2
, ω = vAf − vB
f .
In this case, the difference in profits when unilaterally offering a strictly
positive bundle discount (compared to a situation without bundling) never
yields a positive outcome:
∆Πk = Πkunilateral
− Πk∗
= t +ω
3
(1 +
ω
6t+
δk
12t
)− δk
4−
[t +
ω
3
(1 +
ω
6t
)]
= ωδk
36t− δk
4
< 0∀ω ∈(
0;6t − 3(δ‖)
2
)
Therefore, the higher valued operator has no incentive to induce full market
coverage in the fixed market.
1.5 Discussion and conclusion
The aim of this study is to reassess the profitability of bundling substitutable
services. The motivation for this work comes from the telecommunications
industry where two contradicting trends are observed: due to increasing sub-
stitutability between fixed and mobile services, an increasing number of con-
sumers do no longer feel the need for subscribing to any fixed services, while
thepopularity of fixed-mobile service bundles is increasing.
A theoretical framework is developed for analysing jointly fixed-mobile sub-
stitutability and fixed-mobile bundling. It is showed that the individual in-
centive for multi-market operators to offer a bundle discount is contingent on
the degree of substitutability between fixed and mobile services. Moreover,
if the operators are perfectly symmetric, they find themselves in a prisoners’
dilemma. This situation, however, disappears with product-specific prefer-
ences. In particular, the operator that enjoys the higher valuation can in-

çè1. DISCUSSION AND CONCLUSION 71
crease its profits by bundling its services, whereas its rival will incur losses in
the bundling equilibrium.
The increase in profits of the higher valued operator has to be put in
perspective, though. Despite the revenue growth procured by bundling, the
operator earns lower margins. Indeed, the discount on bundled sales induces
more consumers to buy the “cheaper” product, reducing therefore the sources
of revenue for recouping the costs of bundling. In the short term, increased
revenue growth might seem appealing, but may jeopardise long term interest
like e.g. network investments. Moreover, because the discount turns services
into stronger complements, the fixed market is subject to an increasing market
coverage. Since, operators have no incentive to bundle services when both
markets are fully covered, they must be on guard not too offer too high a
discount.
If the degree of substitutability incites operators to bundle, then bundling
is consumer surplus increasing and ultimately welfare beneficial. Hence, should
services be too complementary, or equivalently, too substitutable, multi-market
operators would avoid bundling and consumers would not benefit from com-
petitive bundling.
The analysis has shown that bundling leads to a prisoners’ dilemma and
furthermore to a decrease of industry profits when consumers have the same
reservation price for either fixed service. Such a decrease could therefore be
an incentive for collusive behaviour. For instance, firms could coordinate on
not to bundle which would imply a foregone increase in social welfare. Further
research could address this subject and check whether or not a collusive out-
come is stable and under which conditions. With product-specific preferences,
collusion is evidently unlikely, since at least one operator gains in profits and
is, therefore, not willing to agree on not to bundle, nor on sharing its profits.
However, in the asymmetric case, further research could focus on exclusionary

çè1. DISCUSSION AND CONCLUSION 72
conduct by the higher valued operator.
Further research could also integrate regulatory issue by, for instance, con-
sidering an vertically integrated incumbent (multi-market) operator that owns
a widely spread copper network, as well as its own mobile network and com-
petes with a mobile incumbent that seeks to offer fixed services. This possible
extension raises the question of how access regulation is impacted by fixed-
mobile bundling, FMS and possibly by the combination of both. Moreover, it
would also be interesting to analyse whether the mobile incumbent is better off
by merging with a competing fixed operator (e.g. cable) or by seeking access
to the incumbent’s copper network.
After having considered one aspect of Fixed-Mobile substitution from a
theoretical point of view, FMS will be considered from an empirical aspect
in the next chapter. In particular, the next chapter attempts to determine
socio-demographic factors that influence the consumption choices of French
consumers in communications services matters.

B)*+)-./0345
Adams W., Yellen J. L., (1976). Commodity bundling and the burden the
monopoly, Quarterly Journal Of Economics, 90(3): 475-498.
Armstrong M., (2013). A general theory of commodity bundling. Journal of
Economic Theory, 148(2): 448-472. Available hereè
Barth A., Heimeshoff U., (2011). Does the growth of mobile markets cause
the demise of fixed networks? Evidence from the European Union, DICE
discussion paper, No. 42, ISBN 978-3-86304-041-3. Available hereè
Berec, (2011). Berec Report on impact of Fixed-Mobile Substitution in Market
Definition, 8/12/2011. Available hereè
Blumberg S. J., Luke J. V., (2013). Wireless substitution: Early release of
estimates from the National Health Interview Survey, January - June 2013.
National Center for Health Statistics, December 2013. Available hereè
Briglauer W., Schwarz A., Zulehner C., (2011a). Is fixed-mobile substitu-
tion strong enough to de-regulate fixed voice telephony? Evidence from
the Austrian markets. Journal of Regulatory Economics, 39(1), 50-67. DOI:
10.1007/s11149-010-9132-1.
Carbajo J., De Meza D., Seidman D. J., (1990). A strategic motivation for
commodity bundling, Journal Of Industrial Economics, 38(3), 283-298.
73

6I67I89:;<=> ?é
Cardona M., Schwarz A., Yurtoglu B. B., Zulehner C., (2009). Demand es-
timation and market definition for broadband internet services, Journal of
Regulatory Economics, 35(1), 70-95. DOI: 10.1007/s11149-008-9076-x.
Chen Y., (1997). Equilibrium Product Bundling, Journal of Business, 70(1),
85-103. Available hereè
Economides N., (1993). Mixed bundling in duopoly, mimeo.
Eurobarometer, (2014). E-Communications Household Survey Report, Field-
work: January 2014, March 2014. Available hereè
Gruber H., Verboven F., (2001). The diffusion of mobile telecommunications
services in the European Union. European Economic Review, 45(3), 577-588.
http://dx.doi.org/10.1016/S0014-2921(00)00068-4è
Grzybowski L., Verboven F., (2013). Substitution and complementarity be-
tween fixed-line and mobile access. NET Institute Working Paper No. 13-09.
Available hereè
GSM Association, (2013). Mobile Economy Europe 2013. Available hereè
Ida T., Kuroda T., (2006). Discrete choice analysis of demand for broadband in
Japan. Journal of Regulatory Economics, 29(1), 5-22. DOI:10.1007/s11149-
005-5124-y.
Long J. B. Jr., (1984). Comments on "Gaussian demand and commodity
bundling", Journal of Business, 57(1), Part 2: Pricing Strategy, 235-246.
Matutes C., Régibeau P., (1992). Compatibility and bundling of complemen-
tary goods in a duopoly. Journal Of Industrial Economics, 40(1), 37-54.
McAfee R., McMillan J., Whinston M. D., (1989). Multiproduct monopoly,
commodity bundling and correlation of values, Quarterly Journal Of Eco-
nomics, 104(2), 371-383.

6I67I89:;<=> ?1
Nalebuff B., (2004). Bundling as an Entry Barrier, Quarterly Journal Of Eco-
nomics, 119(1), 159-187. DOI: 10.1162/003355304772839551.
OFCOM, (2013). International Communications Market Report, Research
Document, 12/12/2013. Available hereè
Reisinger M., (2006). The effects of product bundling in duopoly. mimeo, Mu-
nich.
Rodini M., Ward M. R., Woroch G. A., (2003). Going Mobile: Substitutability
between fixed and mobile access, Telecommunications Policy, 27(5-6), 457-
476. http://dx.doi.org/10.1016/S0308-5961(03)00010-7è
RTR, (2009), Abgrenzung des Marktes für breitbandigen Zugang auf Vorleis-
tungsebene.
Scherer F. M., (1976). Predatory Pricing and the Sherman Act: A comment,
Harvard Law Review, 89(5), 869-890.
Schmalensee R., (1984). Gaussian Demand and Commodity Bundling, The
Journal of Business, 57(1), Part 2: Pricing Strategy, 211-230.
Singh N., Vives X., (1984). Price and Quantity Competition in a Differentiated
Duopoly, The Rand Journal of Economics, 15(4), 546-554.
Spector D. (2007). Bundling, tying and collusion. International Journal of
Industrial Organization, 25(3), 575-581. http://dx.doi.org/10.1016/j.
ijindorg.2006.06.003è
Srinuan P., Srinuan C., Bohlin E., (2012). Fixed and mobile broadband
substitution in Sweden,Telecommunications Policy, 36(3), 237-251. http:
//dx.doi.org/10.1016/j.telpol.2011.12.011è
Stigler G. J., (1963). United States v. Loew’s Inc.: A note on Block-Booking,
The Supreme Court Review, 152-157.

6I67I89:;<=> ?@
Thanassoulis J., (2007). Competitive Mixed Bundling and Consumer Sur-
plus, Journal Of Economics & Management Strategy, 16(2), 437-467. DOI:
10.1111/j.1530-9134.2007.00145.x.
Vagliasindi M., Güney I., Taubman C., (2006). Fixed and mobile competition
in transition economies, Telecommunications Policy, 30(7), 349-367. http:
//dx.doi.org/10.1016/j.telpol.2006.02.002è
Yoon C., Song Y., (2003). Telecom development in Korea: Substitution and
integration of fixed-mobile services and regulatory implications. Communi-
cations & Strategies, 52, 4th quarter 2003, 257-270.

A33DEG)H J403KD/ 1
LM1MN Profit maximisation in the symmetric case
This appendix provides detailed calculations for the operator’s profit maximi-
sation when both operators enjoy equal valuations from consumers and thus
bear the same level of FMS. The profit maximisation problem for any k = A, B
is given by the following expression:
maxpk
m,pkf
Πk = pkm Dk
MO + pkm Dk,−k
CP + pkf D−k,k
CP + (pkm + pk
f − δk) DkBU (A.1OPê
The corresponding first order conditions are as follows:
∂Πk
∂pkm
= DkMO + pk
m
∂DkMO
∂pkm
+ Dk,−kCP + pk
m
∂Dk,−kCP
∂pkm
+ pkf
∂D−k,kCP
∂pkm
+ DkBU + (pk
m + pkf − δk)
∂DkBU
pkm
!= 0 (A.1OQRê
and
∂Πk
∂pkf
= pkm
∂DkMO
∂pkf
+ pkm
∂Dk,−kCP
∂pkf
+ D−k,kCP + pk
f
∂D−k,kCP
∂pkf
+ DkBU + (pk
m + pkf − δk)
∂DkBU
pkf
!= 0 (A.1OQVê
77

;,,endix Chapter 1 ?W
The marginal consumers and different demands:
xABU =
θ −(
pAf − δA
)
t(A.1OXRê
xA,BCP = 1 −
θ − pBf
t(A.1OXVê
xB,ACP =
θ − pAf
t(A.1OXYê
xBBU = 1 −
θ −(
pBf − δB
)
t(A.1OXZê
y =1
2+
pBm − pA
m
2t+
δA2 − δB2
4t2−
δA(pAf − θ) − δB(pB
f − θ)
2t2(A.1OX[ê
DkMO = DA
MO =(
xA,BCP − xA
BU
)× y (A.1OX\ê
= DBMO =
(xB
BU − xB,ACP
)× (1 − y)
=
(2θ − pk
f − p−kf + δk − t
)(−φ)
4t3
DkBU = DA
BU = xABU × y (A.1OX]ê
= DBBU =
(1 − xB
BU
)× (1 − y)
=
(θ − pk
f + δk)
φ
4t3
Dk,−kCP = DA,B
CP
(1 − xA,B
CP
)× y (A.1OX^ê
= DA,BCP = xA,B
CP × (1 − y)
=
(θ − p−k
f
)φ
4t3
where φ =[2t
(p−k
m − pkm + t
)− 2
(pk
fδk − p−kf δ−k
)+
(δk − δ−k
) (2θ + δk + δ−k
)].

;,,endix Chapter 1 ?_
Their partial derivatives with respect to pkm and pk
f are given by
∂DkMO
∂pkm
=2θ −
(pk
f + p−kf
)− t + δk
2t2(A.1O`Rê
∂DkMO
∂pkf
=t(pk
m − p−km − t − δk
)+ δ
(2pk
f + p−kf − 3θ
)− δ−k
(p−k
f − θ)
2t3− 3δk2 − δ−k2
4t3
(A.1O`Vê
∂DkBU
∂pkm
=pk
f − θ − δk
2t2(A.1O`Yê
∂DkBU
∂pkf
=2t
(pk
m − p−km − t
)+ δk
[4
(pk
m − θ)
− 3δk]
− 2(
p−kf − θ
)δ−k + δ−k2
4t3(A.1O`Zê
∂Dk,−kCP
∂pkm
=p−k
f − θ
2t2(A.1O`[ê
∂Dk,−kCP
∂pkf
=
(p−k
f − θ)
δk
2t2(A.1O`\ê
Plugging the relevant derivatives into equation (A.1.2aê and/or (A.1.2bê and
solving then simultaneously for mobile prices pkm and fixed service prices pk
f ,
∀k = A, B provides the following equilibrium:
pk∗
m = t +5t2δk +
(t − δk
) (t + δk
)δ−k2
+(2t2 − δ2
)∆θ
tµ(A.1OaRê
pk∗
f =1
2
[θ +
δk(6t2 − δ2 + θ∆
)
µ
](A.1OaVê
Πk∗
=t
2+
θ2
4t+
1
2µ2
{t[8δk4 − 2δ−k4
+(δk2 − δ−k2)2
]− 6t3
(7δk2 − 4δ−k2)
= +θ∆ν (2λ + θ∆) − δk6
2t
}(A.1OaYê
where µ =(12t2 − δk2 − δ−k2
), λ =
(6t2 − δk2
), ν =
(8t2 − δk2
)and ∆ =
(δk − δ−k
).
Plugging equilibrium prices into demand functions (A.1.3fê - (A.1.3hê pro-

;,,endix Chapter 1 Wb
vides equilibrium demands:
DkMO =
∆θ
µ+
1
2tµ
{θ
{12t2
[δk∆ +
(δk + δ−k
)2]
−(δk + δ−k
)[δk
(δk2
+ δ−k2)+ ∆3 − 144t4
]}
+(6t2 − δk2){[
4t + δk][
6t(t − δk) + δk2]+ δ−k
[6t2 − δ−k
(2t − 2δk − ∆
)]}
+ θ2∆
[(δk + δ−k
)2+ 2∆2 − 24t2
]}(A.1OcRê
DkBU =
3tθ
µ+
1
2tµ2
{θ
[δk
(2δ−k(6t2 − δ−k) − δk∆(2δ−k + ∆)
)]
− ∆θ2(µ − δk∆
)− δkλ
[µ +
(6t2 − δ−k2)]
}(A.1OcVê
Dk,−kCP =
θ(6t2 + ∆θ)
2tµ+
1
2tµ2
{[2δkλ + 2δkδ−k∆ + ∆2
(5δkδ−k + ∆2
)]θ
− δ−k[θ2∆2 − λ
(6t2 − δ−k
)]}(A.1OcYê
with ν, µ, ∆ and λ as defined above.
Finally the equilibrium with and without a bundle discount stated in the
text are readily found as follows:
In the no bundling regime: Setting δk and δ−k equal to 0 leads to equa-
tions (1.9aê-(1.10bê. Indeed, the results follow by noticing that
µ = 112t2 , λ = 6t2
ν = 8t2 , ∆ = 0(A.1Odê
In the mixed bundling regime: Equations (1.12aê-(1.14cê appear with the
assumption 1.1 í� ú�ôõîúü÷û �úýüíþõîýo δk = δ−k = δ. In effect, the results are
obtained since
µ = 112t2−2δ2 , λ = 6t2 − δ2
ν = 8t2 − δ2 , ∆ = 0(A.1Oeê
The unilateral incentive to bundle and counter-bundle: In stage 1 of
the game, the operators decide whether to introduce a bundle discount or not.

;,,endix Chapter 1 Wç
As explained in the text, the two multi-market operators earn lower profits if
both grant a discounts, which leads to the question of the unilateral incentive.
In what follows, the relevant equations, that is (1.16ê, (1.17ê and (1.18ê, are
provided.
Equation (1.16ê yields profits for operator k if it is the only one to bundle.
It can be readily derived from equation (A.1.5cê above by setting δ−k equal to
0. In this case,
µ = 1
12t2−2δk2 , λ = 6t2 − δk2
ν = 8t2 − δk2
, ∆ = δk
(A.1Ogê
Then, equation (A.1.5cê falls back to
Πkunilateral =
t
2+
θ2
4t+
θδkν(2λ + θδk
)− δk2[
3t4 +(9t2 − δk2)2]
4tµ2(A.1OPhê
as stated in the text.
The unilaterally bundling firm’s profit variation, Πkunilateral
− Πk∗, follows by
substracting (1.9cê from (1.16ê.
Equivalently, the profits earned by the firm that initially did not bundle,
are found by setting δk equal to 0, which yields:31
Û = 1
12t2−2δ−k2 , λ = 6t2 − δ−k2
ν = 8t2 − δ−k2
, ∆ = δ−k
(A.1OPPê
and
Πkunilateral =
t
2+
θ2
4t− tδ−k
[4θ
(12t2 − δ−kθ
)− δ
(24t2 − δ−k2)]
2µ2(A.1OPQê
31 Note here that −k is the bundling firm.

;,,endix Chapter 1 Wi
Profit variation induced by counter-bundling is equal to:
Πk − Πkunilateral =
t
2+
θ∆ν(2λ + θ∆
)− δk6
4tµ− 2t
[36t4 − δ−kθ
(12t2 − δ−kθ
)]
(12t2 − δ−k2
)2
+2t2
[6t2
(4δ−k2 − 7δk2)
−(δ−k2
+ δk2)2+ 10δk2]
4tµ(A.1OPXê
This is equation (1.18ê as stated in the text.
A.1Mj Assumption 1.1k lmnqrsuvw xyqmwn mszu{yqrz sq r|n
symmetric environment.
As already discussed in the text on page 56ñ îóô ý�ööôîø� �ôîòôôõ �øöý (îó÷î
is, equal consumer reservation prices for either service) induces a symmetric
strategic behavior, or symmetric reactions towards any action taken by the
competitor. The fact that the reactions are identical can be seen by deriving
the equilibrium profits (A.1.5cê, ∀k = A, B, from above with respect to the
competitor’s bundle discount:
∂Πk(δ−k, ·)∂δ−k
=∂
∂δ−k
[t
2+
θ2
4t+
1
2µ2
{t[8δk4 − 2δ−k4
+(δk2 − δ−k2)2
]− 6t3
(7δk2 − 4δ−k2)
= +θ∆ν (2λ + θ∆) − δk6
2t
}]
=2νλ2δ−k − θν
[λ
(12t2 − 2δk2
+ ∆(δk − 3δ−k))
+ θ∆(12t2 − 2δk2
+ ∆2)]
2tµ3
=∂Π−k
∂δk(A.1OP`ê
with ν, µ, ∆ and λ as defined above.
This shows that a marginal change in δ−k yields the same impact on oper-
ator k’s profits as operator −k would be impacted by a marginal change in δk.
It therefore seems reasonable to assume that operators settle around a given
discount level δ.

;,,endix Chapter 1 W}
A.1M~ Condition 1.1k �{uvw �{q{�{wsnz sq r|n ��nm �v��
ket
In order to derive the stated condition, the marginal consumer at equilibrium
are provided. Similarly to appendix A.1.1ñ îóô ùôõôøúü ô�,øôýýúíõý ÷øô ,øí�ú�ô�
first and are then adapted to the relevant bundling regimes.
Plugging equilibrium prices (A.1.5aê and (A.1.5bê into expressions (1.2ê, the
marginal consumers yield:
xABU =
θ + 2δA
2t−
δA[(
6t2 − δA2)
+(δA − δB
)θ
]
2t(12t2 − δA2 − δB2
) (A.1OPaRê
xA,BCP = 1 − θ
2t+
δB[(
6t2 − δB2)
+(δB − δA
)θ
]
2t(12t2 − δA2 − δB2
) (A.1OPaVê
xB,ACP =
θ
2t+
δA[(
6t2 − δA2)
+(δA − δB
)θ
]
2t(12t2 − δA2 − δB2
) (A.1OPaYê
xBBU = 1 − θ + 2δB
2t−
δB[(
6t2 − δB2)
+(δB − δA
)θ
]
2t(12t2 − δA2 − δB2
) (A.1OPaZê
Local monopolies with each operator serving a strictly positive share of the
market are provided whenever the following inequalities hold simultaneously:
0 < xABU < xA,B
CP < 1
0 < xB,ACP < xB
BU < 1(A.1OPcê
In the no bundling regime: If neither operator offers a bundle discount,
the set of inequalities above falls back to
0 < θ2t
< 1 − θ2t
< 1
0 < θ2t
< 1 − θ2t
< 1(A.1OPdê
and the unique solution is 0 < θ < t as stated in the text.

;,,endix Chapter 1 Wé
In the mixed bundling regime: When the two symmetric operators offer
identical bundle discounts, the set of inequalities above falls back to
0 < θ+3δ4t
< 1 − 2θ−δ4t
< 1
0 < 2θ−δ4t
< 1 − 2θ+3δ4t
< 1(A.1OPeê
and the unique solution is 0 < θ < t + δ2
as stated in the text.
A.1M� Profit maximization in the case of product-specific
preferences
Subsection 1.4.2 ÷õ÷û�ses the profitability of bundling when consumers have
product-specific preferences for fixed services, meaning that their reservation
prices for fixed services differ: vkf Ó= v−k
f . Without loss of generality, assume
vAf > vB
f , which implies that θA > θBf .
The operators’ objective functions, resp. FOCs, are equivalent to equation
(A.1.1ê, resp. (A.1.2aê and (A.1.2bê above. The marginal consumers can be
found in the text (see equations (1.2ê and (1.7ê). Then, the different demand
yield the following:
DkMO =
[t +
(pk
f − θk − δk)
+(p−k
f − θ−k − δ−k)]
φ
4t3(A.1OPgRê
DkBU =
(θk − pk
f + δk)φ
4t3(A.1OPgVê
Dk,−kCP =
(θ−k − p−k
f
)φ
4t3(A.1OPgYê
where φ = 2t2 + δk2 − δ−k2
+ 2[t(p−k
m − pkm
)+ δ−k
(p−k
f − θ−k)
− δk(pk
f − θk)]
.

;,,endix Chapter 1 W1
The corresponding derivatives are equal to:
∂DkMO
∂pkm
=
(θk − pk
f + δk)
+(θ−k − p−k
f
)− t
2t2(A.1OQhRê
∂DkMO
∂pkf
=1
2t+
t(p−k
m − pkm
)+ δ−k
(p−k
f − θ−k)
− δk[2(pk
f − θk)
+(p−k
f − θ−k)]
2t3
− δk
2t2+
3δk2 − δ−k2
4t3(A.1OQhVê
∂Dk,kBU
∂pkm
=pk
f − θk − δk
2t2(A.1OQhYê
∂Dk,kBU
∂pkf
= − 1
2−
t(p−k
m − pkm
)+ δ−k
(p−k
f − θ−k)
− 2δk(pk
f − θk)
2t3
− 3δk2 − δ−k2
4t3(A.1OQhZê
∂Dk,−kCP
∂pkm
=p−k
f − θ−k
2t2(A.1OQh[ê
∂Dk,−kCP
∂pkf
=δk
(p−k
f − θ−k)
2t3(A.1OQh\ê
Plugging next the corresponding derivatives into the FOCs and solving
simultaneously for pkf and pk
m yields the following equilibrium prices and profits:
pkm =
12t4 + δk2(4t2 − δ−k2)
+ δkθk(2t2 − δk2)
− δ−kθ−k(2t2 − δk2)
tµ(A.1OQPRê
pkf =
δk(λ − δ−kθ−k
)+ θk
(12t2 − δ−k2)
2µ(A.1OQPVê
Πk =θk2
4t+
ν[λ2 +
(δkθk − δ−kθ−k
)(2λ + δkθk − δ−kθ−k
)]
4tµ(A.1OQPYê
with ν, µ and λ as defined in A.1.1.32
Tóô ô�þúûú�øúþö ô�,øôýýúíõý ,øí�ú�ô� úõ îóô îô�î ÷øô �íþõ� úõ îóô �íûûíòúõù
way:
In the no bundling regime: Setting δk and δ−k equal to 0 leads to (1.9aê
- (1.9cê, because µ, λ and ν are the same as in the no bundling regime in the
symmetric case (see (A.1.7ê above).
32 µ =(
12t2 − δk2 − δ−k2
), λ =
(6t2 − δk2
), ν =
(8t2 − δk2
).

;,,endix Chapter 1 W@
Mixed bundling: The expressions in the text are linear first order Taylor
approximations of equilibrium prices and profits (given in (A.1.21aê - (A.1.21cê)
near (δk, δ−k) = (0, 0).
The first order Taylor approximation of a function f(x, y) about the point
(a, b) is given by the following formula:
T (x, y) = f(a, b) +∂f
∂x|(a,b)(x − a) +
∂f
∂y|(a,b)(y − b) + O (A.1OQQê
In the above, ∂f∂x
|(a,b) denote the partial derivative of f(x, y) with respect to x
and evaluated at the point of interest (a, b). Similarly for ∂f∂y
|(a,b). Finally, O
denotes the omitted higher order terms.
Applying this formula to equations (A.1.21aê - (A.1.21cê near (δk, δ−k) =
(0, 0) yields the expressions stated in the text:
pkm(δk, δ−k) = pk
m(0, 0) +∂pk
m
∂δk|(0,0)(δ
k − 0) +∂pk
m
∂δ−k|(0,0)(δ
−k − 0)
= t +θk
6tδk − θ−k
6tδ−k
= t +δkθk − δ−kθ−k
6t(A.1OQXRê
pkf (δk, δ−k) = pk
f (0, 0) +∂pk
f
∂δk|(0,0)(δ
k − 0) +∂pk
f
∂δ−k|(0,0)(δ
−k − 0)
=θk
2+
1
4δk + 0δ−k
=θk
2+
δk
4(A.1OQXVê
Πk(δk, δ−k) = Πk(0, 0) +∂Πk
∂δk|(0,0)(δ
k − 0) +∂Πk
∂δ−k|(0,0)(δ
−k − 0)
=t
2+
θk2
4t+
θk
6tδk − θ−k
6tδ−k
=t
2+
θk2
4t+
δkθk − δ−kθ−k
6t(A.1OQXYê
A.1M� Proof of lemma 1.1M
Recall that θk > θ−k and that δk > δ−k. Moreover, define by ∆x the difference
between x in the mixed bundling regime and x in the no bundling regime,
where x is to substitute by either a price (pm, pf ) or profits (Π).

;,,endix Chapter 1 W?
Both prices for fixed services increase: The variation of either pkf or p−k
f
is strictly positive:
∆pkf =
θk
2+
δk
4− θk
2
> 0 (A.1OQ`ê
The price for the higher valued operator’s mobile service, pAm, in-
creases: Here, ∆pAm yields
∆pAm = t +
δAθA − δBθB
6t− t
> 0 (A.1OQaê
The price for the lower valued operator’s mobile service, pBm, de-
creases: In contrast to the higher valued operator, ∆pBm is always negative
because θk > θ−k and δk > δ−k:
∆pBm = t − δAθA − δBθB
6t− t
< 0 (A.1OQcê
The higher valued operator earns higher profits: Again, since θk > θ−k
and δk > δ−k:
∆ΠA =t
2+
θA2
4t+
δAθA − δBθB
6t−
( t
2+
θA2
4t
)
> 0 (A.1OQdê
The lower valued operator earns lower profits: Similarly,
∆ΠB =t
2+
θB2
4t− δAθA − δBθB
6t−
( t
2+
θB2
4t
)
< 0 (A.1OQeê

;,,endix Chapter 1 WW
A.1M� Condition 1.1k �{uvw �{q{�{wsnz sq r|n ��nm �v��
ket with product-specific preferences
In this section, the non-monopolisation condition is derived for the mixed
bundling regime only.
Using the approximated equilibrium prices (that is (1.22aê - (1.22dê), the
marginal consumer at equilibrium yield:
xABU = θA
2t+ 3δA
4t, xA,B
CP = 1 − θB
2t+ δB
4t
xB,ACP = θA
2t− δA
4t, xB
BU = 1 − θB
2t+ 3δB
4t
(A.1OQgê
The system of inequalities to solve is then:
0 < θA
2t+ 3δA
4t< 1 − θB
2t+ δB
4t
0 < θA
2t− δA
4t< 1 − θB
2t+ 3δB
4t
(A.1OXhê
which is solved when the condition stated in the text holds, namely,
2θB < θA + θB <4t − 3
(δA − δB
)
2(A.1OXPê
A.1M� Equilibria in a fully covered markets - Fixed and
mobile complementarity
This appendix provides equilibria when fixed and mobile services are comple-
ments. When both services are complementary, the fixed, as well as the mobile
market, is fully covered. Hence, on either segment of the fixed market, only one
marginal consumer exist who is indifferent between buying mobile and fixed
services as bundle or to cross-purchase. Denote by xA the marginal consumer
in A’s bundle market (this is, the lower left segment on Fig. 1.1ð ÷õ� �� xB
the indifferent consumer in B’s bundle market. Then, equalising the following
utility functions
UkBU = Uk,−k
CP
vkf − vm − (pk
f − δk) − t|xk − x| = v−kf − vm − p−k
f − t|x−k − x|

;,,endix Chapter 1 W_
the marginal consumers are located in:
xA =1
2+
vAf − vB
f − (pAf − δA − pB
f )
2t(A.1OXQê
xB =1
2−
vBf − vA
f − (pBf − δB − pA
f )
2t(A.1OXXê
The marginal consumer on the mobile market is derived by plugging xA and
xB into expected utility expression from (1.1ê:
y =1
2+
(gAm − pA
m) − (gBm − pB
m)
2t+
(δA − δB)
4t+
δA2 − δB2
8t2
+(δA + δB)
[(vA
f − pAf ) − (vB
f − pBf )
]
4t2
The objective function of the operators is equal to:
Πk = (pkf + pk
m − δk)DkBU + pk
mDCP k,−k + pkf D−k,k
CP
= (pkf + pk
m − δk)yxk + pkmy(1 − xk) + pk
f (1 − y)x−k (A.1OX`ê
In the no bundling regime: Writing vkf − v−k
f = ω, then a no bundling
regime yields the following equilibrium prices and profits:
pk∗m = t (A.1OXaRê
pk∗f = t +
ω
3(A.1OXaVê
Πk∗ = t +ω
3
(1 +
ω
6t
)(A.1OXaYê
Unilateral bundling: Suppose next unilateral bundling by operator k. Gen-
eral formulas of equilibria are:
pkm =t +
δk2
4t+ ωδk
(4t2 − δk2)
tρk(A.1OXcRê
pkf =t + ω
(12t2 + δk2)
ρk(A.1OXcVê
Πk =t − δk
4+
ω
4tρk
{2ω
16t2(9t2 + δk2
)
4tρk+
[t(12t + δk) − δk
4t
(1 +
2δkω
ρk
)]}(A.1OXcYê
Π−k =t − δk
2+
δk2
8t
+ω
2tρk
[2t
(12t2 − 2tδk − δk2)
+8t2ω(18t2 − δk2
)
ρk+ δ3
(1 +
δkω
ρk
)](A.1OXcZê

;,,endix Chapter 1 _b
where ρk =(36t2 − δk2
).
First degree Taylor approximations near δk = 0 of unilateral bundling
equilibria are equal to:
pkm = t + ω
δk
9t(A.1OXdRê
p−km = t + ω
δk
18t− δk
2(A.1OXdVê
pkf = t +
ω
3(A.1OXdYê
p−kf = t +
ω
3− δk
2(A.1OXdZê
Πk = t +ω
3
(1 +
ω
6t+
δk
12t
)− δk
4(A.1OXd[ê
Π−k = t − ω
3
(1 − ω
6t− δk
6t
)− δk
2(A.1OXd\ê
Mixed bundling: If both operators bundle, equilibrium prices and prices
are:
pkm =t − αkω
2tρ+
(δk + δ−k
)2
4t− δ−k
2(A.1OXeRê
pkf =t − ω
(12t2 + δ−k2 − δk2
ρ
)− δ−k
2(A.1OXeVê
Πk =t − δk + 2δ−k
4+
δ−k(δk + δ−k
)
8t+
ω(4t + δk − 2δ−k + 2ω
)
4t
− ω
tρ
(ω
βk
ρ+ tκk
)(A.1OXeYê
where αk = (2δk − δ−k)[4t2 − (δk + δ−k)2
], ρ = 36t2 −
(δk + δ−k
)2, βk =
576t4 + δk(δk + δ−k)3 − 4t2(δk + δ−k)(11δk + 8δ−k) and κk = 24t2 + 8t(δk −
2δ−k)
− δk(δk + δ−k).
The corresponding first order Taylor approximations around (δk, δ−k) =
(0, 0) are:
pkm =t + ω
(2δk − δ−k)
18t− δ−k
2(A.1OXgRê
pkf =t +
ω
3− δ−k
2(A.1OXgVê
Πk =t − (δk + 2δ−k)
4+
ω
3
[1 +
(δk − 2δ−k)
12t
]+
ω2
18t(A.1OXgYê
Next, the condition for both operators to be active (i.e. neither operator
can monopolise the fixed market) is found by substituting equilibrium prices

;,,endix Chapter 1 _ç
(A.1.38aê and (A.1.38bê into xA and xB from (A.1.32ê and (A.1.33ê and solving
0 < xA < 1 and 0 < xB < 1 for ω. Taylor approximations near (δk, δ−k) =
(0, 0) of marginal consumers are
xA =1
2+
ω
6t+
δA + δB
4t
xB =1
2+
ω
6t− δA + δB
4t
The solution to 0 < xA < 1 and 0 < xB < 1 then yields
−6t − 3(δA + δB)
2< ω <
6t − 3(δA + δB)
2(A.1O`hê
or, since ω = vkf − v−k
f > 0
0 < ω <6t − 3(δA + δB)
2(A.1O`Pê
To see that there is no individual incentive to introduce a bundle discount,
define ∆Πk as the difference in operator k’s profits when it passes from a no
bundling to a unilateral regime:
∆Πk = Πkunilateral − Πk∗
= t +ω
3
(1 +
ω
6t+
δk
12t
)− δk
4−
[t +
ω
3
(1 +
ω
6t
)]
= ωδk
36t− δk
4(A.1O`Qê
If condition (A.1.41ê holds, then ∆Πk is never positive. As a matter of fact,
evaluating ∆Πk at either boundary yields33
��k
= − δk
4 < 0 if ω = 0
= − δk(4t+δk)24t
< 0 if ω = 3t − 32 δk
(A.1O`Xê
This shows that at neither boundary of the non-monopolisation condition the
higher valued operator would not unilaterally offer a bundle discount. A sim-
33 Note that with one discount, say δ−k, equal to 0, the condition (A.1.41ê becomes
0 < ω < 3t − 3δk
2

;,,endix Chapter 1 _i
ilarly reasoning allows to state the same for the lower valued operator.


J�A���� �
Socio-demographics and telecommunications ser-
vices: Some empirics
2.1 Introduction
The aim of the previous chapter was to provide a theoretical framework that
allows for analysing telecommunications service bundling in presence of Fixed-
Mobile substitution.
In this chapter, the context of FMS is upheld but provides an empirical
analysis of the consumption behavior of French users of telecommunications
services. The goal of this analysis is to draw consistent portraits of three
different consumption types. In particular, this study raises the question as
to know which personal characteristics are most influential for a consumers’
choice. Furthermore, a particular interest is put on the question whether these
profiles vary from one operator to another.
Behind this work is the notice of the impressive dynamics that rules the
telecommunications market in France. In the last five or six years, the French
market has seen many evolutions caused by different reasons. For instance,
the first commercialisation in 2009 of Bouygues Télécom’s quadruple play offer
“Ideo” can be seen as a pricing innovation. With a price advantage up to 16
e compared to a stand-alone mobile and triple play offer, a clear incentive for
94

ièç. INTRODUCTION 95
consumers to change has been introduced. Another reason for the evolution
relies on the triggering of the low-cost era provoked by the market entry of Free
Mobile in early 2012. Indeed, its market entry triggered an highly aggressive
and until then unseen pricing policy: mobile plans are now priced up to 20
% below the prices charged before (ARCEPñ 2014ðè �íøôí�ôøñ ÷�þõ�÷õüô í�
voice calls, texting and very competitive data allowances became the market
standard. In order to escape competition, the incumbent operators Orange,
SFR and Bouygues Télécom not only introduced similarly competitive offers,
but also accelerated their deployment of new network technologies (e.g. optical
fibre or LTE).1 �ôý,úîe the accelerated investment, the path towards low-cost
offers did not break and its course reached out to other segments such as the
quadruple play segment.
Of course, there are also other technological reasons that explain the dy-
namics of the market and probably also the evolution of the consumers’ be-
havior. Steadily increasing performance of mobile devices and networks and
subsequently the increasing number of applications or possibilities of usage
also influence the market dynamics.
Market dynamics are thus the result of an evolving demand side as well
as supply side. As has been described previously, an increasing number of
persons stop consuming fixed telecommunications services, since their mobile
services appear sufficient for their needs. On the other hand, as the theoretical
analysis in chapter 1 ýóíwed, service bundling is likely to induce consumers
to switch for a convergent offer. The consumption behavior has thus changed
in the last years. For any service provider, it is of crucial importance to keep
trace off these changes and not only within its own customer base, but within
the whole market.
This constitutes the starting point of the present study: to identify what
1 See for instance here f�� ������� ���������% �f "���� �"��ï

ièç. INTRODUCTION 96
the driving forces of consumers’ choice are. In order to achieve this objective,
a micro-econometric model is introduced. Survey data of French interviewees
is fitted in a conditional logit model where the individuals are confronted
with three alternative consumption choices: i) using only a mobile offer, ii)
complementing their mobile offer by one or several stand-alone fixed services
or iii) subscribe to a bundle of at least two services. As explanatory variables,
the model uses mostly individuals’ characteristics, such as their age or income,
but also integrates a price proxy.
This study does not introduce any variables relative to the consumer’s
habits of how she uses her different services, as the relevant information is not
provided by the survey. Hence, with individual characteristics as only source of
information, this study provides an additional explanation for the occurrence
of FMS in the French market.
In particular, the results reveal the option of mobile-only as a tool for
budget controlling. This means that, without information on consumption
habits, mobile-only users are consumers who are subject to a strong budget
constraint. As a matter of fact, persons in a situation of unemployment, low
income or who use prepaid cards have a higher probability of mobile-only usage
than using several services. This finding can be generalised as it holds for the
three operators (Orange, SFR and Bouygues Télécom).
Another result relates to the idea that service providers are largely differen-
tiated, specifically Orange and Bouygues Télécom. This is especially true for
people living in rural areas: in contrast a Bouygues client, an Orange customer
who lives in a rural area (rather than in a large city) has a significantly higher
probability of choosing a bundle from Orange rather than being mobile-only.
The reverse is true for a Bouygues customer: the probability of choosing a
bundle from Bouygues is significantly lower. This finding suggests different
preferences between Orange and Bouygues Télécom customers.

ièi. LITERATURE REVIEW 97
The remainder of this chapter is as follows. Section 2.2 ,øí�ú�ôý ÷ �øúô�
revue of the existing literature and section 2.3 ùú�es the theoretical framework
used in this chapter. The data is presented in section 2.4 ÷õ� îóô øôýþûîý úõ
section 2.5è Fúõ÷ûû�ñ ýôüîúíõý 2.6 ùú�ôý üíõüûþ�úõù øôö÷ø�ýè
2.2 Literature review
The relevant existing literature to be reviewed here focusses on the character-
istics of demand for telecommunications services. Early academic literature
on this issue (in the 1970’s) was most often concerned with the estimation of
demand elasticities with respect to prices in times of high inflation and up-
ward pressure of call rates (Taylorñ 2002ðè �úîó îóô úõüøô÷ýúõù ,í,þû÷øúî� í�
mobile services and thus the upcoming substitution between fixed and mobile
services, the literature also considered to integrate non-price factors, like socio-
demographic ones, to profile the consumers conditional on which service they
use.
As for telephony services, Rodini, Ward and Woroch (2003ð þýô� ÷ ûíùúî
model in order to estimate cross-price elasticities between fixed and mobile
voice services. Their study relies on micro-level data from 2000-2001 in the US.
Besides statistical significant impacts of usage, as well as access and prices, the
authors also find that socio-demographic variables such as income, education or
household size have a positive impact on the probability of mobile subscription,
to the detriment of second fixed line subscription. In contrast, the older the
surveyed person, the less high the probability of subscribing to a mobile voice
service.
Following a similar idea, Ward and Woroch (2004ð ÷õ÷û�ýô� ýþ�ýîúîþîúíõ
patterns in the US during 1999 to 2001 and conclude that non-price factors
like mobile network coverage and quality also plays a major role in mobile
subscription take-off.
ièi. LITERATURE REVIEW 98
Using data from 2004 to 2006, Schejter et al. (2010ð ,ôø�íøöô� ÷ üûþý�
ter analysis on wireline and wireless market segments separately in order to
identify the characteristics of consumers belonging to either segment. Their
results show that wireless users are predominantly young people with low in-
come. Moreover, house owners are more likely to be fixed line users. The
authors also conclude that
wireless only consumers are [. . .] newcomers to the markets, who
can be seen as the emergence of a new consumer and not as an
expression of switching by an existing one.2
�úîh the emergence of broadband Internet access, several studies focus on
estimating the demand for the different Internet access technologies and derive
consumers’ willingness to pay for different component of the available offers.
For instance, Savage and Waldman (2005ð ,øí�ú�ô ô�ú�ôõüô îó÷î ýþ�ýüøú�úõù
to a high speed broadband connection is more likely for high income household
and persons with higher education. They show moreover that people’s online
experience is an influencing factor, too.
In Rosston, Savage and Waldman (2010ðñ îóô ÷þîóíøý �ôýúùõ ÷ �úýüøôîô
choice experience to show that consumers willingness to pay of Internet ser-
vice improvements like increase Internet connection speed. In particular, their
results reveal that US citizens are willing to pay 3 $ more in order to enjoy
very fast Internet rather then fast Internet. This is an interesting result as it
raises the question of whether deploying a nationwide optical fibre network is
economically justifiable.3
6øí÷��÷õ� ÷üüôýý �ôö÷õ� ôýîúö÷îúíõ úõ �þøí,ô ÷ûýí ú�ôõîú�ô�ñ ÷öíõù
2 Although, it should be noted that in the analysed period, the mobile market has notyet been at maturity. Many new consumers arrived to the market and went “straight-to-mobile”, given the benefits of mobile services (mobility, decrease of costs, increasing diffusionof usage possibilities,...).
3 In an unpublished manuscript, Rappoport, Kridel, Taylor and Alleman used data on theUS for the year 2000 and showed that fixed broadband diffusion is boosted by the householdsize, education and income. See here f�� �$� �����"� pp��ï

ièi. LITERATURE REVIEW 99
others, income, education and household size as variables that influence con-
sumers’ decision process. For instance, Srinuan, Srinuan and Bohlin (2012ð
illustrate these findings for Sweden using data from 2009 and Cardona et al.
(2009ð ÷õ÷û�ýô îóô ;þýîøú÷õ ö÷ø�ôî òúîó ibb@ �÷î÷è Tóô �íøöôø ýóíò îó÷î
swedish people living in area with a high density of populations (e.g. Stock-
holm or Gothenburg) have a higher probability of using mobile broadband
rather than fixed (fibre or DSL), whereas this probability is less high in ru-
ral areas. A similar result is found for the Austrian market: people living in
Vienna are more likely to subscribe to a mobile broadband offer. On the con-
trary, educational considerations seem to play a less important role in Sweden
than in Austria.
Also relevant are the reports issued by governmental instances like national
regulatory authorities, consulting agencies national research centres. For in-
stance, a report issued by DotEcon (2001ð ýîþ�úôý ��ô��öí�úûô ýþ�ýîúîþîúíõ
in 2001 and drew consumer profiles for UK mobile-only consumers, fixed-only
users, and fixed-and-mobile users. A similar study is produced in France by
CREDOC (2013ð íø ÷î �þøí,ô÷õ ûô�ôû �� îóô �þøí�÷øíöôîôø øô,íøîýè4 6íîó
studies basically provide the same insights: single-service usage is influenced
by low income (for mobile-only usage) or higher age (for fixed-only usage).
However, these studies mostly provide inventories and descriptive statistics on
the phenomenon discussed here, rather econometric analysis.
The contribution of this chapter is that it uses an original dataset of over
22000 observations from French consumer. The analysed period spans from
September 2008 to June 2012. The results are similar to those described
in the existing literature, namely that mobile-only usage is mostly due to
financial considerations.In contrast, the interviewees age does not appear as a
influencing factor of single-service usage, as it people of all categories of age
4 Centre de Recherche pour l’Étude et l’Observation des Conditions de Vie

iè}. MODEL FRAMEWORK 100
bear a higher probability of using fixed and mobile services rather than only
mobile. Moreover, unlike in Macher, Mayo, Ukhaneva and Woroch (2012ðñ
French part time employees are less likely to use several services than their US
counterparts.
2.3 Model framework and estimation methodology
The model used in this study is one of discrete choice. In such a model, a
decision maker faces a set of alternatives among which she chooses one and only
one. Essentially, these models estimate a probability for a given alternative to
be chosen. Since a probability is always comprised between 0 and 1, an linear
regression model is inappropriate.
Discrete choice models rely either on a logistic distribution of choice proba-
bilities (in which case the model is called Logit model) or a normal distribution
(Probit model). Since the first is computationally simpler, it is the most widely
used in the literature.
In essence, there exist two kinds of discrete choice models. In the first
one, the choice set, i.e. the set of alternatives presented to the individual
is composed of only two alternative. These models are called “binary (or
dichotomic) discrete choice models”. If, on the other hand, the choice set
comprises more than two alternatives, the model is called “polytomic discrete
choice model”.
Among these models, it is convenient to distinguish between multinomial
logit model, where the exogenous variables vary with the individuals (e.g. age,
occupational status, etc.), and conditional logit model, where the exogenous
variables vary with the alternatives in the choice set. Prices are the archetype
of a variable in a conditional discrete choice model, but the data allowance in
mobile subscriptions (which may differ from one offer to another) can also be

iè}. MODEL FRAMEWORK 101
cited.5
Tóôøô ô�úýîý ÷ûýí îóô ,íýýú�úûúî� í� ýíöô öú� í� îóô öþûîúõíöú÷û ÷õ� üíõ�
ditional model. In this case, the set of exogenous variables contains both
alternative-specific and individual-specific variables. However, these models
should not be confounded with the mixed logit, which allows to take into ac-
count the heterogeneity between individuals.6 Tóô ýîþ�� ,øôýôõîô� úõ îóúý
chapter uses both alternative-specific and individual-specific variables. In or-
der to be able to estimate such a model, the individual-specific variable have
to be coded as alternative-specific variables, i.e. induce variability for variable
like age. This is achieved in the following way. Each observation is duplicated
as many times as there are alternatives. Then, variability of individual-specific
variables (e.g. age) is achieved by setting the age equal to the actual age in
the row representing the chosen alternative and 0 in the other rows.
In a discrete choice model, the decision maker chooses one alternative from
a given choice set. Her chosen alternative is the one that maximises her utility.
Her utility is determined by her preferences and depends on i) her character-
istics (i.e. individual-specific variables) and/or ii) attributes of the different
offered choices.
If an individual n, n = 1, . . . , N , faces a choice set with j = 1, . . . , J
alternatives, her direct utility function writes Unj. In most cases however, it is
impossible to observe every relevant characteristic of either the individual or
the alternative. Therefore, the observed characteristics, which are used for the
5 Among the multinomial and conditional logit models, other classifications exist: orderedlogit (e.g. an evaluation on a Lickert scale), non-ordered or also nested logit (where thechoice in the first step determines the alternatives available in a second step; e.g. choosinga quadruple play offer in the second step, provided that mobile and fixed services have beenchosen from the same provider in the first step.). The present study uses a non-orderedlogit.
6 The key difference between mixed logit and other logit models is that the formerdecomposes the error term into two parts: the first part is related to all or a part of theobserved variables and allows, by estimating a mean and a standard deviation for thesevariables, to attribute a statistical distribution. The second part corresponds to the standardrandom error term.

iè}. MODEL FRAMEWORK 102
estimation of the choice probability, form a representative utility, denoted by
Vnj. Thus, with εnj denoting the unobserved factors, the direct utility writes:
Unj = Vnj + εnj (2.1)
The utility maximisation therefore implies that the probability of choosing
alternative j over any other available alternative yields:
Pnj = Prob(Unj > Uni)
= Prob(Vnj − Vni > εni − εnj) , j Ó= i , ∀j ∈ {1, . . . , J} (2.2)
From (2.2ê, it appears that the individual chooses alternative j if the excess
utility provided by that alternative compared to another alternative is higher
than the difference between unobserved characteristics. To be more explicit,
recall that ε represents the unobserved characteristics that influence the de-
cision maker’s choice. Then, even though it is not explicable by the retained
variables, εni − εnj represents what alternative i has to offer to individual n in
excess to alternative j. It then follows that individual n chooses alternative j
whenever the known (and observed) advantages of j over i exceed the unknown
(and unobserved) advantages of i over j.
2.3.1 Conditional logit specification
Since the unobserved factors εnj represent essentially an random error term,
a statistical distribution is attributed to them in order to be able to infer the
choice probability Pnj. In the case of a logistic model, the εnj are assumed
independent and identically distributed (iid) and to follow a Gumble extreme
value distribution. The Gumble distribution has the following density function,

iè}. MODEL FRAMEWORK 103
f(·), and cumulative distribution, F (·):
f(εni) = exp(−εni) exp[−exp(−εni)] (2.3a)
F (εni) = exp[−exp(−εni)] (2.3b)
Then, using f(εni) and F (εni), expression (2.2ê can be rewritten as follows:
Pnj = Prob(Vnj − Vni > εni − εnj)
= Prob(Vnj − Vni + εnj > εni)
=∫ +∞
−∞
∏
j Ó=i
F (εnj) f(εnj) d εnj
=e(Vnj)
∑i e(Vni)
(2.4)
The last is line follows after some algebraic manipulation which is provided
detailed in appendix A.2.1è =íòô�ôøñ úî üûíýôû� �íûûíòý Train (2009ðè
Finally, let x denote the vector containing the observed variables and β
the coefficients to be estimated. The representative utility Vnj can then be
expressed as Vnj = β′ xnj and the choice probability (2.4ê becomes:
Pnj =eβ′ xnj
∑i eβ′ xni
(2.5)
Estimation methodology In order to estimate the coefficients in the ex-
pression above, it is common practise to use the method of the maximum likeli-
hood. This proceeding searches the coefficients β that maximise the likelihood
of the probability of observing that the decision maker n actually chooses al-
ternative j among all the available alternatives. Assuming that the decision
makers are independent, this likelihood yields:
L(β) =N∏
n=1
J∏
j
(Pnj)ynj (2.6)

iè}. MODEL FRAMEWORK 104
In the above, ynj is equal to 1 if the decision maker n chose alternative j and
0 otherwise.7 <ûþùùúõù now (2.5ê into (2.6ê and taking the logarithm yields the
log-likelihood function to be maximized:
LL(β) =∑
n
∑
j
ynj ln( eβ′ xnj
∑i eβ′ xni
)(2.7)
The estimated coefficients β are such that the expression above is maximised.
Identification issue At this point, it is important to have another look at
expression (2.2ê, which stated that alternative j is chosen over alternative i if
the observed utility (estimated by means of observed characteristics) allow for
higher utility than the unobserved:
Pnj = Prob(Vnj − Vni > εni − εnj) , j Ó= i , ∀j ∈ {1, . . . , J}
It is important to note that this probability only depends on the differ-
ence in representative utilities provided by two alternatives, rather than the
actual level of utility provided by the chosen alternative. The problem is than
that an infinity of estimated coefficients result in a given difference, with the
consequence that the model is not identifiable.
In order to circumvent this identification issue, the coefficients relative to
one alternative are normalised to zero, implying that the concerned alternative
serves as reference. As a result, the estimated choice probability correspond
to the difference in probabilities relative to the normalised alternative.
Another identification problem arises with individual-specific characteris-
tics. Indeed, such variables do not vary with the alternatives in the choice set
and do therefore not contribute the difference in utilities provided by two al-
ternatives.For the sake of illustration, suppose an individual that faces a choice
7 Hence, the probability of the non-chosen alternative does not appear.

ièé. THE DATA 105
set with 3 alternatives, h, i and j, where j serves as reference. Furthermore,
assume the only available information relative to this individual is variable x.
Then, the difference in representative utility provided by alternatives i and j
writes:
Vni − Vnj = β′xni − β′xnj
= 0
since xni = xnj. Thus, β cannot be identified by the model.
A possible remedy consist in using a dummy coding for each modality of
variable x. Suppose x provides the information whether or not individual n is
employed or not. Then, the recoding implies that the dummy “employed” takes
the value of 1 if individual n is employed and 0 otherwise. Since the dummy
“unemployed” is created similarly (1 if n is unemployed, etc.), both dummies
are collinear. In order to identify the coefficient β, one dummy variable must be
excluded from the model. Similarly to the reference alternative, the excluded
dummy variable will serve as reference and the resulting coefficients then yields
the impact of the dummy relative to the reference.
2.4 The data
The data stems from the GFK Institute for surveys and spreads from Septem-
ber 2008 to June 2012.8 �þøing this period, 22072 French mobile phone users
have been reached on their cellphone and have been asked to indicate which
means for electronic communications they use on a private basis.9 Tóúý ,øôýôõî
study uses these indications in order to determine the respondent’s consump-
tion type. In particular, the respondent is considered as
8 The 4th quarter of 2010 and 2011 are unavailable.9 Since all respondents have been called on their cellphone, every one has at least a
mobile. Consequently, the survey does not include fixed-only users.

ièé. THE DATA 106
- mobile-only if she uses only a mobile phone to satisfy her consumption
needs,
- non-bundler if she uses at least one communications service other than
her mobile phone, regardless which operator is providing the additional
service(s), but does not have a bundled offer,
- bundler if she declares having a bundle from her mobile operator.
Regarding bundlers, it should be noted that the survey does not explicitly
ask for the form of the bundle (e.g. whether the respondent has a Triple /
Quadruple Play offer or not), but merely whether or not the respondent pays a
single invoice for at least two of the services provided by her mobile operator.
Hence, less usual bundles appear and are even predominant. For instance,
among the 3505 consumers who declared to have a bundle, only 496 declare
to have a Quadruple Play offer and only 939 a Triple Play offer. Thus, nearly
60 % of declared bundlers have an unconventional bundle like e.g. traditional
fixed telephony and TV.
Moreover, the survey only considers bundles that are provided by the mo-
bile operator. This leads to a considerable difference in numbers between the
present study and e.g. Special Eurobarometer reports. Indeed, this study is
unable to detect users of multiple services that may have a bundle from an op-
erator other than their mobile operator. The only information available about
these respondents is that they use multiple services, but it is unknown whether
in a bundle or not. They are therefore classified as simple non-bundlers. In
contrast, the latest Special Eurobarometer report provides figures of bundlers
that are four times higher since they consider all the bundlers regardless their
provider (Eurobarometer (2014ðñ ,è @?ðè
The pie chart 2.1 ýóíws the distribution of the 22072 respondents following
their consumption types, where, for an illustrative purpose only, bundlers are
disaggregated into i) Triple Play, ii) Quadruple Play and iii) other forms of

ièé. THE DATA 107
bundle. On this figure, it appears that the large majority (slightly above 81 %)
of the respondents use multiple services. Among these, only 15,88 % indicated
to have a bundled offer with some 4 people out of 100 have a Triple Play offer,
whereas the proportion of Quadruple Play users is slightly above 2 %.
Mobile-only
18.85 %
Non-bundlers
65.27 %
Triple Play
4.25 %
Quadruple
Play
2.25 %
Other bundle
9.38 %
Bundlers
15.88 %
ÏÐÑÒ �ÒÓ Distribution of the consumption types (Obs: 22072).
Whereas the percentages of Triple Play users and users of other forms of
bundles differ from the Eurobarometer reports, the proportions of quadruple
play users are very close, as the table 2.1 ýóíws.
Table 2.1 Comparing the proportions of Quadruple Play users: CET vs. Euro-barometer
Year This study Eurobarometer†
Nov / Dec 2009 0,7 % 1 %Feb. / Mar. 2011 2,9 % 2 %Dec. 2011 2,2 %‡ 2 %†
Eurobarometer �2014� ¡¢ £¤¢‡
January 2012, since Q4 2011 is missing.
For the sake of tractability of the model, all forms of bundle (i.e. Triple
Play, Quadruple Play or any other combination) will be aggregated into bundlers,
as the number of alternative within the choice set would otherwise be too high.

ièé. THE DATA 108
2.4.1 The variables
The analysis relies on two categories of exogenous variables. A first category
is alternative-specific and changes with every alternative available, or stated
otherwise with every consumption type. In particular, the variable price is
alternative-specific. A second category is individual-specific and, in contrast
to alternative-specific variables, changes from individual to individual. The
set of individual specific variables includes mobile operator, contract, age, oc-
cupational status, income, kids, density and gender. The table 2.2 ýþöö÷rises
and briefly describes all the variables used in the model.
Table 2.2 Description of the variables
Variable Category Description Min Max
TypeMobile-only
Choice alternative 1 3Multi-serviceBundler
Price /Monthly amount of money in e
0 8000the respondent declared to payfor all of his services
Mobile operatorOrange
Mobile service provider 1 3SFRBouygues Télécom (BT)
ContractPrepaid
Type of mobile contract 0 1Post-pay
Category of age
≤ 22 years
Respondent’s category of age 0 4[23; 30][31; 40][41; 50]≥ 51Full time employee
Respondent’s occupation 0 5
Part time employeeOccupational Retiredstatus Student
UnemployedHousekeeper
IncomeLow income (≤ 1500 e) Whether or not the respondent’s
0 1High income income is above 1500 e
Household No kids Whether or not kids live in the0 1
composition With kids household
Area of livingRural (≤ 107 inhab/km2)
Density of population of the0 2Small city ([108; 1495])
respondent’s area of livingLarge city (> 1496)
GenderMale
Respondent’s gender 0 1Female

ièé. THE DATA 109
The variables Income and Area of living are ad-hoc variables as this infor-
mation is not provided by the survey. However, the respondent’s postal codes
are available and thus its place of residence. The postal codes are therefore
used as link to i) a database containing the fiscal revenue in the respondent’s
location and ii) a base providing information about the density of population
of her living area. The data for both of these variables are provided by the
French statistical office INSEE.10
Iì¥��¦ý �÷î÷ íõ úõüíöô ,øí�ú�ôý ÷õõþ÷û �ýü÷û úõüíöôý ÷î îíòõ ûô�ôûè Uýúõù
the postal code of the respondent, her income can be approximated. In this
study, the median income at town level is used, which provides more egalitarian
measure of income at town level as the average. As the data for 2012 has not
yet been available from INSEE at the time of writing this chapter, it has been
extrapolated by using a compound average growth rate based on the data from
2008 to 2011. Finally, the data has been divided by 12 in order to have an
proxy for the respondent’s monthly income.
The data on density of population of the respondent’s area of living is a part
of the French population census which is undertook every 6 years. The most
recent data available is from 2009. The interest of integrating this variable
is that the utility of using multiple communication services might be lower in
denser areas, such as large cities. Indeed, in the latter areas, activities such
as theatre, cinemas or museums are more widely available as in rural areas.
Thus, people living in dense area may be less often at home and therefore less
inclined to use fixed services on a private basis.
As mentioned above, the variable price is alternative-specific, i.e. varies
with the consumption type. However, the respondent chooses only one alter-
native and only one actual price is known per respondent. In order to create
the choice sets the respondents will be confronted with, the price for the al-
10 Both datasets are available freely. The data on income can be found here "� �$�data on density of population hereï

ièé. THE DATA 110
ternatives that have not been chosen has to be approximated. In particular,
the price for a non-chosen alternative is set equal to the average price paid by
respondents that have chosen that given alternative. For instance, suppose an
individual n has chosen to be mobile-only. Thus, the price for the alternative
non-bundler (resp. bundler) is equal to the average amount paid by all the
non-bundlers (resp. bundlers) in the sample.Replacing these missing values
by an average value, rather than by 0 appears more realistic and economically
justifiable, as no consumer would choose an alternative at a strictly positive
price over one that is free of charge.
2.4.2 The descriptive statistics
Table 2.3 ,øí�ú�ôý ýíöô �ôýüøú,îú�ô ýî÷îúýîúüý í� îóô üíö,ûôîô ý÷ö,ûô ÷õ� ÷ûýí
of the three consumption types.11
Føíö îóúý î÷�ûô �íûûíòý îó÷î öíýî øôý,íõ�ôõîý ÷øô 8ø÷õùô üþýîíöôøý (≈
53 %) and the remaining respondents are evenly distributed among SFR and
Bouygues Télécom. This fact is reflected in the subsamples. For instance, 53 %
of all the mobile-only consumers and 50 % of all the non-bundlers are Orange
customers (the remaining respondents are again split quite evenly among SFR
and Bouygues Télécom). Although, the gap widens for bundlers. Indeed, here
2/3 of the respondents declared having a bundle provided by Orange, while
slightly above 21 % of the bundlers are SFR customer and slightly more than
12 % of them deal with Bouygues Télécom. Hence, Orange appears to be more
attractive to customers that use multiple service in some form of bundle. A
detailed profiling of operator is provided in the next section.
Furthermore, it arises from table 2.3 îó÷î ç? § í� îóô øôý,íõ�ôõîý ó÷�ô
less than 23 years, and the other categories account each for a minimum of
11 Only one category of dichotomic variables (Contract, Income, Household compositionand Gender) is provided in this table. The averages of the non-shown categories are simplycalculated as 1 minus the average of the shown category. E.g., the average of the category“Post-pay” in the complete sample is 1 − 0.4942 = 0.5058.

ièé .T
HE
DA
TA
111
Table 2.3 Descriptive statistics of the complete sample and the three consumption types
Variable Category Complete Sample Mobile-only Non-Bundler Bundler
TypeMobile-only 0.1885 (0.3911) · · · · · ·Non-bundlers 0.6527 (0.4761) · · · · · ·Bundlers 0.1588 (0.3655) · · · · · ·
Price 43.4223 (57.3322) 36.7887 (39.4385) 40.7845 (56.9449) 62.1375 (71.3787)
OperatorOrange 0.5330 (0.4989) 0.5365 (0.4987) 0.5008 (0.5000) 0.6613 (0.4733)SFR 0.2335 (0.4230) 0.2325 (0.4224) 0.2386 (0.4263) 0.2134 (0.4098)Bouygues Télécom 0.2335 (0.4231) 0.2310 (0.4215) 0.2606 (0.4390) 0.1252 (0.3310)
Contract Prepaid 0.4942 (0.5000) 0.6767 (0.4678) 0.4782 (0.4995) 0.3438 (0.4750)
Age
≤ 22 years 0.1687 (0.3745) 0.1675 (0.3735) 0.1718 (0.3643) 0.1575 (0.3643)23 - 30 years 0.1974 (0.3980) 0.2332 (0.4229) 0.1892 (0.3910) 0.1883 (0.3910)31 - 40 years 0.2138 (0.4100) 0.2228 (0.4162) 0.2124 (0.4065) 0.2088 (0.4065)41 - 50 years 0.1964 (0.3973) 0.1873 (0.3902) 0.1929 (0.4152) 0.2214 (0.4152)≥ 51 years 0.2238 (0.4168) 0.1892 (0.3917) 0.2337 (0.4170) 0.2240 (0.4170)Full Time Employee 0.4457 (0.4971) 0.3668 (0.4820) 0.4564 (0.4981) 0.4950 (0.5000)Part Time Employee 0.1101 (0.3131) 0.1264 (0.3324) 0.1073 (0.3095) 0.1024 (0.3032)
Occupational Retired 0.1171 (0.3216) 0.0839 (0.2773) 0.1280 (0.3341) 0.1118 (0.3152)status Student 0.1322 (0.3387) 0.1034 (0.3045) 0.1414 (0.3484) 0.1284 (0.3346)
Unemployed 0.1303 (0.3367) 0.2308 (0.4214) 0.1085 (0.3110) 0.1010 (0.3014)Housekeeper 0.0646 (0.2458) 0.0887 (0.2843) 0.0584 (0.2345) 0.0613 (0.2400)
Income Low income 0.4875 (0.4999) 0.5363 (0.4987) 0.4831 (0.4997) 0.4476 (0.4973)Household No kids 0.4244 (0.4943) 0.5303 (0.4991) 0.3931 (0.4884) 0.4277 (0.4948)
AreaRural 0.3299 (0.4702) 0.3339 (0.4717) 0.3193 (0.4662) 0.3686 (0.4825)Dense 0.3300 (0.4702) 0.3103 (0.4627) 0.3310 (0.4706) 0.3492 (0.4768)
of living Very dense 0.3402 (0.4738) 0.3558 (0.4788) 0.3498 (0.4769) 0.2822 (0.4501)Gender Female 0.5069 (0.5000) 0.4421 (0.4967) 0.5218 (0.4995) 0.5227 (0.4996)
Obs. 22072 4160 14407 3505Average (Standard deviation)

ièé. THE DATA 112
19.6 % of the respondents (i.e. between 23 and 30 years) and a maximum
of 22 % (above or equal 51 year). When looking at every consumption type
individually, it appears that most mobile-only users are aged between 23 and
30 years. When it comes to multiple services consumption (whether bundled
or not), the modal category is “≥ 51 years”. However, the proportion of non-
bundlers or bundlers belonging to categories “31 - 40 years” or “41 - 50 years”
are similarly high. This is especially true for bundlers, where the difference
in proportions is less then one percent. However, two different consumption
behaviors seem to emerge: mobile-only users are mostly young people (i.e. up
to 30 years), whereas respondents above 30 most often use a mobile and at
least one fixed communication service.
As for the occupational status, it appears that, in average, 44 % of the
respondents are full time employees. The second most represent group are the
students with ≈ 13 %. Respondents that were unemployed at the time they
were surveyed represent also around 13 % of the sample. This proximity be-
tween unemployed respondents and student disappears among the mobile-only
users. Indeed, there less than half as many students among the mobile-only
users as there are unemployed mobile-only users. As for the other consump-
tion types, students occupy the second rank behind the full time employees
although followed by retired persons, rather than unemployed. Yet, the phe-
nomenon of mobile-only usage might be considered as budget control measure
for respondents with weaker financial resources.
This seems furthermore confirmed by three other facts. Consider first the
variable Income. Whereas the income for 48 % of the respondent is approxi-
mated to be below 1500 e the proportion of mobile-only with a low income
is above 53 %. Second, almost 70 % of the mobile-only users declared to have
an prepaid card, which allows for a better budgeting as post-pay contracts.
Finally, the average amount paid by a mobile-only user is the lowest among

ièé. THE DATA 113
the three consumption types.12
;ý �íø îóô óíþýôóíû� üíö,íýúîúíõñ îóô î÷�ûô ýóíòý îó÷î ≈ 57 % of the
respondents have children at home, while the majority of mobile-only do not
(≈ 54 %). The reverse is true for the other consumption types: 60 % of
non-bundlers and 57 % of bundlers have kids at home.
The distribution of the respondents over the territory of France is quite
balanced, with around 1/3 in each area. Although, bundlers are most often
located in rural areas, which somehow confirms the interest of this variable.
Finally, whereas in the complete sample the genders are distributed equally,
the table shows mobile-only users are predominantly male respondents, whereas
respondents using several services (whether bundled or not) are mostly women.
2.4.3 Analysing the profiles of mobile operators
This subsection divides the complete sample into three subsamples based on
the variable operator. This allows to draw operator-specific profiles and hence
to detect whether there are inherent differences of consumption behaviors
among the three mobile communications operators present in the survey. The
chart 2.2 òúûû óôû, îí ôýî÷�ûúýó îóôýô í,ôø÷îíø�ý,ôüú�ü ,øí�ûôýè
From the chart 2.2 úî ü÷õ �ô ýôôõ îó÷î îóô ,øí,íøîúíõ í� öí�úûô�íõû� þýôøý
is essentially equivalent among all the three operators (≈ 19 %). On the other
hand, the proportions of respondents using several services vary considerably
among the three operators. For instance, Bouygues Télécom has over 70 % of
non-bundlers, a proportion that drops to slightly above 60 % for Orange. SFR
is in-between both with approximately 65 %.
As for bundlers, Orange has almost 20 % of bundlers in its interviewed
customer base, SFR has ≈ 15 % and Bouygues Télécom around 9 %. These
differences are extremely significant from a statistical point of view, as tables
12 A similar reasoning might apply to housekeeper.

ièé. THE DATA 114
0%
10%
20%
30%
40%
50%
60%
70%
Mobile-only Non-
bundlers
Bundlers Postpay High income With kids Rural Small cities Large cities Female
Type Contract Income Household Area of living Gender
General Orange SFR Bouygues
¨ã© Part I
0%
10%
20%
30%
40%
50%
≤ 22 yrs 23 - 30 yrs 31 - 40 yrs 41- 50 yrs ≥ 51 yrs Full Time Part Time Retired Student Umemp. Housek.
Age Occupational status
General Orange SFR Bouygues
ª«¬ Part II
Fig. 2.2 Comparing mobile service operators
A.2.1 ÷õ� A.2.2 úõ îóô ÷,,ôõ�ú� ýóíòè
Some other differences appear on the chart. Consider for instance the area
of living. Residents of rural areas seem to prefer to deal with Orange, while this
picture changes for dense and very dense areas. The proportions are equivalent
in dense areas. In very dense areas, however, SFR serves significantly more
customers than Bouygues Télécom as well as Orange. In this area, Bouygues
Télécom has also more customers than Orange.13
® The null hypothesis of the unilateral T-test, that the proportion between Bouygues and

ièé. THE DATA 115
Following these facts, one might be tempted to say that Orange is more
attractive for households in less dense areas, which could also be linked to the
fact that Orange is the incumbent telephony operator owning a nationwide
fixed telecommunications infrastructure. On the hand, denser areas are more
profitable, since sunk costs can be spread over a larger potential demand.
Thus, newcomers, as opposed to the incumbent, may be more aggressive in
these areas in order to build up a sufficiently large source of revenue before
expanding in other, less urbanised territories.
In terms of age, it appears that SFR has significantly less young respondents
than its competitors. No significant difference exists between the latter. As for
the next category (aged between 23 and 30 years), most of the respondents are
SFR customers.14 ;õíîher category of age in which Orange has significantly
less customers is the category “31 - 40 years”. Respondents aged between 41
and 50 years are mainly Orange customers. However, only a small statistically
significant difference could be detected between Bouygues and Orange. Finally,
the proportions of customers aged above 51 years is similar among all the
operators.
As for the household composition, it appears that Orange serves the largest
number of households with children. Again, this difference is highly significant.
Finally, some pecuniary elements can be mentioned. Firstly, in terms of
monthly amount paid for all of the telecommunications services, Bouygues
Télécom seems to offer the most competitive prices (average price for all con-
sumption types: 36.30 e), while Orange customers incur the highest monthly
invoices (47.35 e). Moreover, the proportion of respondents having a low in-
come is lower among Orange or Bouygues Télécom customers than among SFR
customers, whose average price is 41.58 e.
Orange, resp. SFR and Orange, are equal in the very dense area, is rejected at the 1 %$level.
14 The T-tests confirm that SFR has more customers in this category than Orange orBouygues Télécom.

ièé. THE DATA 116
To summarise, one might consider Orange as to be oriented towards house-
holds with several members, such as households with children. Moreover,
Orange appears to be more attractive to households living in less dense areas,
as well as people above 41 years.
Bouygues Télécom, the latest entrant among the operators present in the
survey, appears as the most aggressive operator, reaching for a younger cus-
tomer base, mostly without children and living in denser areas. SFR could be
positioned in-between Orange and Bouygues Télécom.
This profiling is consistent with the history of the French telecommunica-
tions sector. Orange is the French incumbent telecommunications operator
which faced first competition from SFR. The latter set up its strategy in order
to compete with Orange. After Bouygues Télécom arrived, imposing a compet-
itive threat on both, SFR and Orange. Especially for SFR, this was situation
new, as, instead of being the maverick, it had to face competition from one.
As for Bouygues Télécom, its strategy was clearly to offer an alternative to
French telecommunications users and to offer the most competitive prices.
These profiles allow to detect some first differences in the consumption
behaviors among the three operators. Among the users of several services, Or-
ange’s customers are more inclined to subscribe to a bundled offer than those
dealing with SFR or Bouygues Télécom. In contrast, Bouygues Télécom’s
users of multiple services are more inclined to consume stand-alone services.15
8,ôø÷îíø�ý,ôüú�ü øôùøôýýúíõý ö÷� îóôøô�íøô ÷ûûíò îí üíõ�øö îóô øôýþûîý í��
tained in the general regression, or alternatively, confirm the behavioural dif-
ferences.
15 Recall that the bundlers do only comprise respondents that have a bundle from theirmobile operator. This may considerably inflate the number of non-bundlers.
iè1. ESTIMATION RESULTS 117
2.5 Estimation results
Before proceeding to the presentation of the results, recall that, due to the
identification problem inherent to the multinomial logit model and more specif-
ically individual-specific variables, a reference alternative has to be defined. In
this study, the alternative “mobile-only” (MO) will serve as reference. The
choice of using MO as reference is motivated by the existence of Fixed-mobile
substitution. Trading off the possibility of using multiple services (NB or B)
against one of using only one service (MO) will provide useful information
about the characteristics of mobile-only consumers. Moreover, the trade-off
“B vs. MO” complies with the fact that consumers are looking for simplicity
when subscribing to multiple services.
With one reference alternative among three possibilities, two trade-offs
appear: “NB vs. MO” and “B vs MO”. Therefore, each model, general and
operator-specific, comprises these two trade-offs. This feature implies that
each category has two coefficients, one for each trade-off. The presentation of
the results therefore proceeds as follows. All the variables are discussed in each
trade-off. Although, if appropriate, only a general comment is given when, for
instance, no significant difference among trade-offs appear.
2.5.1 Results of the general model
Table 2.4 ,øí�ú�ôý îóô ôýîúö÷îô� üíô¯üúôõîý �íø îóô ùôõôø÷û öí�ôûè Tóô øôýþûîý
seem fairly good with an likelihood-ratio index (LRI ) of 0.64. Moreover, the
predictability of the general model is quite satisfying. Around 85 % of the
observations are correctly predicted by the model.
Price Unsurprisingly, the price coefficient is negative and extremely signifi-
cant, implying that the more the price increases the less high is the probability

iè1. ESTIMATION RESULTS 118
Table 2.4 Estimation results of the general model
Variable CategoryGeneral
NB vs Mo B vs Mo
PricePrice -0.6891∗∗∗(0.0118)Price2 0.0071∗∗∗(0.0001)
OperatorOrange 0.2718∗∗∗ (0.0632) 0.0624 (0.0725)SFR · ·BT 0.3797∗∗∗ (0.0735) -0.4759∗∗∗ (0.0927)
ContractPostpay · ·Prepaid -0.5690∗∗∗ (0.0547) -0.8901∗∗∗ (0.0657)
Age
≤22 years 0.4810∗∗∗ (0.1054) -0.1822 (0.1282)23 - 30 years 0.5773∗∗∗ (0.0718) -0.2366∗∗ (0.0882)31 - 40 years · ·41 - 50 years 0.5554∗∗∗ (0.0810) 0.2406∗ (0.0936)≥ 50 years 0.7306∗∗∗ (0.0986) 0.2564∗ (0.1147)Full Time · ·Part Time -0.2874∗∗ (0.0897) -0.4129∗∗∗ (0.1088)
Occupational Retired 0.5026∗∗∗ (0.1313) 0.2525 (0.1499)Status Student 0.4476∗∗∗ (0.1193) 0.3698∗∗ (0.1414)
Unemployed -0.4185∗∗∗ (0.0830) -0.7072∗∗∗ (0.1047)Housekeeper -0.8259∗∗∗ (0.1136) -0.6693∗∗∗ (0.1381)
Area of livingRural 0.1161 (0.0664) 0.0689 (0.0777)Small city 0.1366∗ (0.0692) -0.0266 (0.0818)Large city · ·
Household No kids · ·composition With kids 1.0111∗∗∗ (0.0557) 0.2238∗∗∗ (0.0658)
IncomeLow income · ·High income 0.3636∗∗∗ (0.0556) 0.1875∗∗ (0.0655)
GenderMale · ·Female 0.4640∗∗∗ (0.0582) 0.3024∗∗∗ (0.0684)
Obs. 22072LRI 0.6436AIC 17359% corr. pred. 84.90
(Std errors) ∗∗∗p < .001, ∗∗p < .01, ∗p < .05
of choosing any alternative.16 =íòô�ôøñ ùú�ôõ îóô �ôø� óúùó ,ôõôîø÷îúíõ ø÷îôý í�
telecommunications services in France, it seems unreasonable that probability
eventually drops to 0 and people simply stop consuming telecommunications
services. For this reason, the square of the price variable is introduced into the
model.
The estimation results confirm this intuition: the coefficient of the square
of price is positive and extremely significant, leading to the conclusion that
16 The coefficients are said to be extremely significant if their p-value is below 0.001, highlysignificant for p < 0.01 and significant when p < 0.05.

iè1. ESTIMATION RESULTS 119
a non-linear price effect exists. The decrease of choice probabilities is thus
mitigated by the positive non-linear price effect.
Operator In the trade-off “NB vs. MO”, it appears that variable opera-
tor is extremely significant. Taking SFR as reference, the results show that,
compared to SFR’s customers, an Orange customer has a higher probability
of being non-bundler rather than mobile-only. A similar result is found for
consumers dealing with Bouygues Télécom.
However, this finding merely expresses the fact that most consumers prefer
having multiple services. It would indeed be misleading to understand this
result as depicting the fact that Orange, resp. Bouygues Télécom, consumers
prefer per se dealing with several operators. A non-bundler may very well
have several or all of his services from his mobile operator, but, in contrast to
a bundler, does not have a single invoice regrouping at least two services.
The interpretation of this result as preference for several telecommunica-
tions services complies with the fact that the majority of the sample actually
uses multiple services, since merely about 19 % of the interviewees are mobile-
only.
At first sight, a positive coefficient for Orange in the “NB vs. MO” trade-off
might appear counter-intuitive. Indeed, panel 2.2a úõ îóô �ôýüøú,îú�ô ýî÷îúýîúüý
section shows that Orange’s proportion of non-bundlers is much lower SFR’s.
The unilateral T-test in appendix A.2.2 üíõ�øöý îóô ýî÷îúýîúü÷û ýúùõú�ü÷õüô í�
this difference in proportions. This result may then be due to the high abso-
lute number (rather than proportion) of non-bundlers among both operators’
interviewed customer base: SFR counts 3438 non-bundlers, whereas Orange
has 7215. The counter-intuitive result may therefore stem from this size effect.
As for the trade-off “B vs. MO”, the coefficient for Orange is positive but
statistically insignificant. Thus, an Orange customer does not have a signifi-

iè1. ESTIMATION RESULTS 120
cantly higher probability of being bundler rather than mobile-only consumer.
This is consistent with the fact that Orange’s proportions of bundlers and
mobile-only are very close: 19 % are mobile-only and 19.7 % are bundlers.17
6íþ�gues’ customers do not face the same circumstances. Indeed, the
youngest operator in the sample has more than twice as much mobile-only
consumers than bundlers. This is reflected by the fact that the estimated
coefficient for Bouygues in the “B vs. MO” trade-off (-0.4759) is negative
and statistically extremely significant. Hence, the probability of being bundler
rather than mobile-only is significantly weaker for a Bouygues customer than
for a SFR customer.
Contract The variable contract represents the form of mobile subscription
the interviewee has. With postpay as reference, the estimation shows that sub-
scribers of a prepaid card are less likely use several services. The corresponding
coefficient is negative and significant at the .001 level. Moreover, this results
holds for both trade-offs. Thus, it can be inferred that prepaid card users are
most often mobile-only consumers, rather than bundlers or non-bundlers.
Age The reference category for the variable age is “31 - 40 years”. As the
results show for the “NB vs. MO” trade-off, all coefficients are positive and
extremely significant. Hence, the consumption behaviours appear to be equiv-
alent for all the categories of age.
Interesting, however, is the fact that in the trade-off “B vs. MO”, younger
interviewees are less likely to be bundler whereas people aged above 40 years
seem to prefer bundled offers. Potential explanations for this could be as
follows. Putting aside the fact that the coefficient for “≤ 22 years” is not
statistically significant at the conventional levels (p-value = 0.15), it can be
17 A T-test for equality of mean does not allow to reject the null hypothesis of equalityof a type I risk of 5 %.

iè1. ESTIMATION RESULTS 121
assumed that these people still live at their parents’ house and that they are
not perfectly informed about the modalities relative to the invoice of their
parents’ offer. The lack of this information causes these people to be classified
as non-bundlers, leading to the result that they prefer NB over MO.
Regarding people in the category “23 - 30 years”, it is possible that they
are leaving or have recently left their parents’ house. Thus, their decision
to subscribe to a fixed service is more recent than their parents’ decision.
Moreover, they probably faced a different set of offers, too. Given the rapid
change observed in the French telecommunications market in the last years,
these people may have faced a much more competitive set of offers, inducing
them to choose a different provider as their mobile services provider. As a result
and just as people aged 22 years and below, they seemingly prefer choosing
NB rather than MO.
In contrast to younger interviewees, people aged 41 and above appear to
have a higher probability of being bundler rather than mobile-only than the
reference category. These people may face different housing or professional
conditions as a younger interviewee and possibly benefit from a more stable
financial situation. Their budget constraint might be less restrictive which
allows them to profit from several services provided by any operator.18 Tóô
explanation as to why these people prefer a bundle over mobile-only subscrip-
tion may stem from a quest for simplicity in subscription matters, they may
have a longer experience with their mobile operator or may be better informed
about their operator’s fixed services bundles.
Occupational Status Respondents that are full time employed are used as
reference when it comes to analyse the impact of the occupational status on
the choice probabilities. First, the results show that the occupational status
18 The less restrictive budget constraint can also be invoked as explanation for the positiveimpact on the choice probability incurred by people aged above 40 years in the trade-off “NBvs. MO”.

iè1. ESTIMATION RESULTS 122
is extremely significant in both trade-offs and exhibits the same sign of co-
efficients for all available categories. The only exception regarding statistical
significance is the category “Retired” with a p-value of 0.09.
Moreover, it appears that, compared to full time employees, people in a
situation of part time employment, unemployment or in a position of house-
keeper are more likely to be mobile-only rather than non-bundler, as the cor-
responding negative coefficients imply. This finding is not surprising if these
occupational status can be associated to a more fragile financial situation.
In such a case, the budget constraint may be too restrictive for allowing the
consumption of several telecommunications services and leads to satisfy the
telecommunications needs by a sole mobile subscription.
On the other hand, students often enjoy a financial support from their
parents, which allows them to scarify a more important part of the budget to
telecommunications services. Alternatively, given that fixed services may be
used by several members of a household, flat-sharing allows students to share
the costs of fixed services among all the community members.
Finally, persons who were retired during the survey period most probably
used fixed services before they used any mobile services. Hence, their usage of
mobile and fixed services might very well be considered as a form of legacy.
Area of living The ad-hoc variable “area of living” does not impact the
choice probabilities of either trade-off. The only exception appears in the trade-
off “NB vs. MO”, where, compared large cities, people living in small cities
have a higher probability of choosing NB over MO. However, the concerned
coefficient (Small city; 0.1366) is barely significant with a p-value of 0.048.
The weak significance, leads to the conclusion that the consumption behavior
is little influenced by people’s area of living. Thus, the intuition that a wider
availability of extra-domestic activities in large cities is not confirmed by the

iè1. ESTIMATION RESULTS 123
results.
Household composition The estimation also took account of the house-
hold composition by asking whether or not children live under the same roof
as the respondent. The reference value of this variable is “No kids”. As the
results show, the choice probability of being either NB or B (rather than MO)
is significantly higher when there children living at home.
Income The ad-hoc variable “Income” appears very significant. Compared
to areas characterised by a low income, a positive impact is observed for areas
with higher purchasing power, meaning that their probability of choosing NB
or B is higher.
The results so far can be synthesised as follows. In absence of any infor-
mation regarding the individuals’ habits of using telecommunications services
(i.e. are they heavy data consumers or not? what options do they offers com-
prise? etc.), the alternative MO appears as a means for budget controlling. As
has been discussed above, a person who manifests signs of a weaker financial
situations, such as a low income, prepaid card usage or part time employment,
resp. unemployment, has a higher probability of being MO rather than B or
NB.
In the next section, this synthesis is challenged by conditioning the model
on the variable “Operator”, in order to check if the characterisation of mobile-
only usage varies among the three operators.
2.5.2 Operator-specific estimations
In this subsection, the discussion turns to the operator-specific estimations.
The relevant results can be found in the table 2.5 �ôûíò ÷õ� ÷ûûíò îí üóôü�
whether the consumption behaviours vary across mobile operators. Since all

iè1. ESTIMATION RESULTS 124
the operators offer very similar services, any differences in consumption be-
havior may be related to horizontal differentiation among service providers.
Indeed, if the choice set does not change, an individual that chooses a given
operator rather than another must have some preference for the chosen op-
erator. Thus, in the consumer’s eyes, mobile operators are not identical, but
differentiated.
Globally, the results from the general model hold in the specific regressions:
the estimated coefficients have the same sign in the operator-specific model as
they do in the general model. Hence, the conclusions from the general model
are quite robust and are not influenced by the fact of being customer of either
mobile operator.
However, despite the identical signs, some variables show some interesting
differences among the providers, namely the variables price, age, occupational
status and area of living. In the following, these variables and their impacts
on choice probabilities are briefly discussed.
Price As can be seen from table 2.5ñ îóô ôýîúö÷îô� ,øúüô üíô¯üúôõî �÷ø�
quite considerably. Whereas these coefficient for Orange and SFR are relatively
close, it appears that the coefficient for Bouygues is the most important. The
marginal impacts of prices on the consumption of telecommunications services
are provided in the table 2.6è19
° The marginal impact of a continuous variable xnj on the choice probability Pnj is givenby
∂Pnj
∂xnj
=∂
∂xnj
(exp(Vnj)∑i exp(Vni)
)
= βj Pnj (1 − Pnj)
where βj is the estimated coefficient of xnj . If utility function is non-linear in xnj (e.g. thesquare of xnj enters the utility function), the above adapts to
∂Pnj
∂xj
= (βj + 2δjxnj) Pnj (1 − Pnj)
where δj is the estimated coefficient of the non-linear effect of xnj . The details of the relevantcalculus can be found in appendix A.2.3ï

iè1 .E
ST
IMA
TIO
NR
ESU
LT
S125
Table 2.5 Estimation results of the operator-specific models
Variable CategoryOrange SFR Bouygues
NB vs Mo B vs Mo NB vs Mo B vs Mo NB vs Mo B vs Mo
PricePrice -0.6897∗∗∗(0.0157) -0.6623∗∗∗(0.0235) -0.7146∗∗∗(0.0270)Price2 0.0071∗∗∗(0.0002) 0.0067∗∗∗(0.0002) 0.0074∗∗∗(0.0003)
ContractPostpay · · · · · ·Prepaid -0.4188∗∗∗(0.0745) -0.7681∗∗∗(0.0859) -0.5709∗∗∗(0.1108) -0.5838∗∗∗(0.1306) -0.7215∗∗∗(0.1127) -2.0419∗∗∗(0.1841)
Age
≤ 22 years 0.3944∗ (0.1393) -0.1305 (0.1631) 0.8393∗∗∗(0.2258) -0.4436 (0.2818) 0.7938∗∗∗(0.2212) -0.3896 (0.3041)23 - 30 years 0.5131∗∗∗(0.0987) -0.4078∗∗∗(0.1203) 0.8094∗∗∗(0.1385) -0.2297 (0.1693) 0.8358∗∗∗(0.1425) -0.0251 (0.1859)31 - 40 years · · · · · ·41 - 50 years 0.5844∗∗∗(0.1107) 0.3034∗ (0.1234) 0.5840∗∗∗(0.1572) -0.0237 (0.1848) 0.7875∗∗∗(0.1701) 0.1707 (0.2204)≥ 51 years 0.7571∗∗∗(0.1357) 0.2811 (0.1529) 0.9346∗∗∗(0.1999) 0.4021 (0.2240) 0.8255∗∗∗(0.1962) -0.4375 (0.2917)Full Time · · · · · ·Part Time -0.3662∗ (0.1228) -0.7670∗∗∗(0.1494) -0.0583 (0.1950) 0.1987 (0.2175) -0.1715 (0.1824) -0.2946 (0.2515)
Occupational Retired 0.6222∗∗∗(0.1802) 0.3654 (0.1982) 0.5736∗ (0.2721) 0.0709 (0.3057) 0.1977 (0.2764) 0.0802 (0.4098)Status Student 0.5322∗ (0.1626) 0.2433 (0.1873) 0.3617 (0.2491) 0.4432 (0.2982) 0.4663 (0.2497) 0.5696 (0.3187)
Unemployed -0.5012∗∗∗(0.1145) -0.8795∗∗∗(0.1392) -0.2229 (0.1724) -0.4954∗∗∗(0.2129) -0.2529 (0.1722) -0.4187 (0.2449)Housekeeper -1.0537∗∗∗(0.1550) -0.8020∗∗∗(0.1771) -0.6981∗∗ (0.2283) -0.7510∗∗ (0.2890) -0.4785 (0.2546) -0.3469 (0.3715)
Area ofRural 0.2227∗ (0.0885) 0.3071∗ (0.1005) 0.1927 (0.1373) -0.0809 (0.1608) 0.2325 (0.1371) -0.5837∗∗ (0.1894)Small cities 0.2882∗∗∗(0.0968) 0.2103 (0.1112) 0.1262 (0.1338) -0.1881 (0.1577) 0.1075 (0.1418) -0.3771 (0.1860)
living Large cities · · · · · ·Household No Kids · · · · · ·composition With kids 0.9473∗∗∗(0.0760) 0.2461∗ (0.0870) 1.2045∗∗∗(0.1116) 0.1136 (0.1329) 1.1997∗∗∗(0.1140) 0.0842 (0.1521)
IncomeLow income · · · · · ·High income 0.4136∗∗∗(0.0766) 0.1053 (0.0875) 0.3644∗∗ (0.1120) 0.2668∗ (0.1311) 0.3550∗∗ (0.1166) 0.2899 (0.1530)
GenderMale · · · · · ·Female 0.5435∗∗∗(0.0807) 0.2912∗∗ (0.0920) 0.5456∗∗∗(0.1193) 0.5167∗∗∗(0.1387) 0.3158∗∗ (0.1188) 0.0401 (0.1583)
Obs. 11765 5153 5154LRI 0.6353 0.6238 0.6945AIC 9492 4323 3524% corr. pred. 83.87 84.40 87.37
(Std errors) ∗∗∗p < .001, ∗∗p < .01, ∗p < .05

iè1. ESTIMATION RESULTS 126
Table 2.6 Average marginal impacts of prices
General Orange SFR Bouygues Télécom-0.6355 (0.0660) -0.6344 (0.0670) -0.6086 (0.0631) -0.6656 (0.0648)
(Std. deviation)
This table shows that the marginal impact is largest for Bouygues Télécom
and it can therefore be concluded that the latter’s customers are more price-
sensitive that customers of Orange or SFR.20
Tóôøô úý ÷ ,íýýú�ûô ô�,û÷õ÷îúíõ �íø îóúýñ îóíþùóè ;î îóô îúöô îóô ýþø�ô� ò÷ý
conducted, Bouygues Télécom was the latest entrant and an aggressive prices
was a cornerstone of its strategy upon entry. By offering highly competitive
prices, Bouygues Télécom achieved to poach customers from Orange and SFR.
Consumers that actually have switched may be more sensitive towards price
increases and thus may penalise a price increase in a more severe manner than
the clientele of Orange or SFR.
Age When looking at the categories of age, an interesting difference of the
relative impacts on the choice probabilities appears.21 Tóô í,ôø÷îíø�ý,ôüú�ü
estimations reveal that the impact for Orange customers aged below 31 years is
much lower than for SFR or Bouygues Télécom customers, whereas the spread
between the relative impacts shrinks for persons aged above 40 years. In effect,
the average spread of impacts for the category “23 - 30 years” in the trade-off
“NB vs. MO” is 1/3[(0.8094−0.5131)+(0.8094−0.8358)+(0.8358−0.5131)] ≈
0.2 and for the category ‘41 - 50 years” in the same trade-off is equal to
1/3[(0.5840 − 0.5844) + (0.7875 − 0.7939) + (0.7875 − 0.5844)] ≈ 0.1.22
2± T-test on equality of mean relative to these marginal effects can be found in appendixA.2.3ï
21 Since the estimated coefficients in the trade-off “B vs. MO” are not statistically signif-icant at the conventional levels, the following comments only focus on the trade-off “NB vs.MO”.
22 Similarly, the average spread for the categories “≤ 22 years” and “≥ 51 years” are1/3[(0.8393 − 0.3944) + (0.8393 − 0.7939) + (0.7939 − 0.3944)] ≈ 0.3 and 1/3[(0.9346 −0.7571) + (0.9346 − 0.8255) + (0.8255 − 0.7571)] ≈ 0.1 respectively.

iè1. ESTIMATION RESULTS 127
This difference might reflects the idea that consumption behaviours of
younger and “older” persons are not identical. Given that the average spread is
more important for younger people, this finding can be interpreted as a higher
sensibility towards the brand image of the mobile operator. As a matter of
fact, SFR and Bouygues Télécom are considered to be closer to younger con-
sumers than the historic operator, not least through lower prices. Departing
from this, it is possible that the younger individuals have a higher likelihood
to deal with several operators or alternatively to choose a single additional ser-
vice from their mobile operator without choosing a single invoice. As for the
latter possibility, assume that younger people most probably fixed broadband
as additional stand-alone service. Then, given that dual play offers including
mobile services and fixed broadband are very rare, the likelihood that these
people are classified as non-bundler can be significant, which may lead to the
mentioned result.23
Tóúý øôýþûî ö÷�ñ óíòô�ôøñ ýîôö �øíö ÷ ýúö,ûô úõîôø÷üîúíõ í� îòí üúøüþö�
stances in the database. In particular, panel 2.2b ÷õ� î÷�ûô A.2.2 ýóíò îó÷î
the proportions of individuals aged between 23 and 30 years are (significantly)
higher for SFR and Bouygues Télécom, whereas the proportions of people
aged 40 and above are equivalent for the three operators. Moreover, SFR
and Bouygues Télécom have a significantly higher proportion of non-bundlers
in their customer base than Orange. The result regarding the difference in
magnitudes of the impacts may therefore reflect this simple interaction.
Occupational status Regarding the occupational status, the estimations
show that this variable does not influence the choice probabilities for Bouygues
customers. It can therefore be concluded that, ceteris paribus, the consump-
tion behavior of Bouygues’ customer is not influenced for all the categories of
23 Bundles including mobile services appeared in France only in 2011, i.e. at the end ofthe survey period.

iè1. ESTIMATION RESULTS 128
occupational status.
On the other hand, the results relative to Orange customers bear much
resemblance to those from the general model and thus the same interpretation
can be applied: persons in a presumably weaker financial situation (i.e. part
time employee, unemployed and housekeepers) have a lower probability of being
non-bundler, respectively bundler, than mobile-only.
As for SFR, the results are somehow in between those of Orange and
Bouygues Télécom. Even though all the signs are identical to those from
the general model, only two coefficients out of 6 are significant in both trade-
offs. The conclusion regarding the occupational status may hold, but surely is
weakened.
Area of living Finally, the variable area of living reveals an notable dif-
ference between Orange and Bouygues Télécom.24 �óôøô÷ý îóúý �÷øú÷�ûô úý
significant in both trade-offs for the Orange-specific results, it appears only
significant in the trade-off “B vs. MO” for Bouygues.25 �íøôí�ôøñ �íîó øô�
gressions bear opposing signs for the relevant coefficients: compared to living
in large cities, the choice probability of being bundler rather than mobile-only
is higher (lower) for Orange (Bouygues) customers living in rural areas or small
cities.
One explanation relies on the fact that a large part of Bouygues Télécom’s
customer base lives in small or large cities rather than rural areas, as panel
2.2a ýóíws. Another possible explanation might rely on the fact that local
loop unbundling may come with a decreased quality of connection, leading for
instance to low quality IP-TV. This may considerably reduce the attractiveness
of Bouygues Télécom’s fixed services offers.
24 The choice probabilities in the SFR-specific model are unaffected by the individual’sarea of living.
25 In fact, in the Orange-specific regression, the coefficient for Small cities in the trade-off“B vs. MO” has a p-value of 0.058.

iè@. DISCUSSION AND CONCLUSION 129
2.6 Discussion and conclusion
The aim of this chapter was to shed light on the characteristics of French
users of communication services that influence their consumption behavior. In
particular, a conditional logit model has been developed in which individuals
choose between three alternative consumption possibilities, namely mobile-
only consumption, a mobile offer complemented by one or several fixed stand-
alone services, or a bundle of services provided by their mobile operator.
The interest of this work is twofold. Firstly, it provided insights on the dif-
ferent consumption types and could be useful for market segmentation. Service
providers can rely on such information in order to keep up with the evolution
of their customers’ needs and choices. Secondly, some of the results showed in
this chapter points to the concept of differentiation among services providers
present in this study.
With information on the individuals only, this study has shown that the
option of mobile-only consumption is a means for budget control. Indeed,
individual characteristics that presumably depict a weaker financial situation
appear as driving force for choosing this single service alternative. Among
these, unemployment, low income or prepaid card usage can be mentioned.
As the result showed, persons who entail such characteristics have a lower
probability of using several services. This finding can be seen as a general
result, as it also holds if the analysis separates the customers from either
operator.
In the context of Fixed-Mobile substitution, this result is complementary
to the explanations of the emergence of mobile-only consumption as a con-
sequence of technological progress. The increasing performance of mobile
communications infrastructures and usage possibilities induced an increasing
number of persons who have turned their back to fixed services, since mo-

iè@. DISCUSSION AND CONCLUSION 130
bile services alone allow them to satisfy their needs. The database used in
this study however does not provide information about how the consumers
use their services and does therefore not allow to conclude on any influence of
technology on their choices. In contrast, by using socio-demographic factors
only, this study provides an alternative explanation for this occurrence.
The second major result relates to the different consumer preferences among
Orange and Bouygues customers and it relies on two facts. First of all,
Bouygues customers are generally less willing to subscribe to a bundle pro-
vided by their mobile operator than SFR customers. No significant difference
can be provided between Orange and SFR. Second, the difference in consumer
preference increases when controlling for the individual’s area of living. The
model took account of the area of living as possible influence of consumers’
choices. While this factor is mostly insignificant in the general regression, it
gained in importance when focussing on each operator separately. Notably, Or-
ange customers living in rural areas seem to prefer bundled offers (compared
to mobile-only usage), whereas such offers seem less attractive to Bouygues
customers.
This finding reminds the concept of differentiation among operators, espe-
cially between Orange and Bouygues Télécom, since SFR can be positioned
in-between the formerly mentioned.26 ¥úõce any operator is able to provide
equivalent offers, the question then is why a consumer prefers a given opera-
tor over another? The answer suggested here is that onsumers do not behold
service providers as identical, but differentiated, most probably in terms of
quality of service or customer care. Moreover, given the restricted definition
of bundlers in this study, the result suggests that Orange has an competitive
26 As a matter of fact, the choice of SFR customers seems unaffected by their area ofliving. Even though the results for SFR go in the same direction as those for Bouygues,the study does not provide any statistically significant evidence of any impact on the choiceprobabilities.

iè@. DISCUSSION AND CONCLUSION 131
advantage in rural areas or small cities compared to its competitors.27
Tóô ,øôýôõî ýîþ�� ýþ²ôøý �øíö ÷ �ôò �ø÷ò�÷ü�ýñ îóíþùóè Tóô öíýî úö,íø�
tant one consists in the fact that the French market is imperfectly depicted
here. As a matter of fact, the question wording of the survey does not allow to
distinguish the people that actually use stand-alone services from people that
use bundled services from an operator other than their mobile operator. As
has been mentioned in section 2.4ñ îóúý úõ³÷îôý îóô õþö�ôø í� õíõ��þõ�ûôø ÷õ�
may furthermore bias the estimation results. Therefore, the results relative to
non-bundlers and bundlers must be interpreted carefully.
Another drawback may stem from the prices in this study which appear
very high, in particular the price for the bundled offers. This may lead to
overestimated price coefficients and marginal effects. However, comparing for
instance the relative results among operators provides consistent information
about the effects on choice probabilities, even though the absolute values have
to be considered with care.
Despite these drawbacks, this study gives rise to some possible further
research. The most promising alley is probably to introduce information on the
usage habits of the individuals alongside with their individual characteristics.
This would allow for a more complete analysis of the consumption behaviors.
On a separate note (but yet not less promising), the French telecommuni-
cations sector knew an important change upon the entry of the forth mobile
service provider Free Mobile in early 2012. The latter’s entry implied increased
competition among the market players in an unprecedented way. For instance,
before its entry, solely high-range offers included unlimited voice calls and data
allowance and came at an average price of 80 e. After Free’s appearance in the
27 Since in this study the definition of bundlers is restricted to customers that have aservice bundle from their mobile operator, the consumption of a bundle of services implicitlyincorporates a notion of satisfaction (for instance with the operator’s service quality or policyof customer care) or simplicity to deal with one firm only, rather than benefitting of a pricereduction. This becomes even more relevant since, in average, a bundle is the most expensivealternative available in this study.

iè@. DISCUSSION AND CONCLUSION 132
mobile segment, such offers became much more popular as the price was di-
vided by 4! The incumbent operators had to respond with similarly impressive
price decreases, leading ultimately to a further evolution of the consumers’ be-
havior. Free did thus have an important impact on the market and consumers
which would be interesting to analyse.
The first and second chapter of this thesis have been dedicated of some
aspects on competition between communications services. The next and last
chapter will focus on another type of competition, namely, competition be-
tween firms, by analysing the interaction between two tools that shape the
telecommunications sector: sector-specific regulation and competition law.

B)*+)-./0345
Afsa-Essafi C., (2003). Les modèles logit polytomiques non-ordonnés: théorie
et applications. Document de travail INSEE Nř 0301. Available hereè
ARCEP, (2014). Evolution des prix des services mobiles en France, Résultats
pour l’année 2013. Published 28 Mai 2014. Available hereè
Cardona M., Schwarz A., Yurtoglu B. B., Zulehner C., (2009). Demand es-
timation and market definition for broadband internet services, Journal of
Regulatory Economics, 35(1), 70-95. DOI: 10.1007/s11149-008-9076-x.
CREDOC, (2013). La diffusion des technologies de l’information et de la com-
munication dans la société française. Available hereè
DotEcon, (2001). Fixed-Mobile Substitution. A report prepared for BT. Avail-
able hereè
Eurobarometer, (2014). E-Communications Household Survey Report, Field-
work: January 2014, March 2014. Available hereè
Macher J. T., Mayo J. W., Ukhaneva O., Woroch G., (2012). Demand in
a Portfolio-Choice Environment: The Evolution of Telecommunications.
Georgetown McDonough School of Business Research Paper No. 2012-19.
Available hereè
Rodini M., Ward M. R., Woroch G. A., (2003). Going Mobile: Substitutability
133

6I67I89:;<=> ç}é
between fixed and mobile access, Telecommunications Policy, 27(5-6), 457-
476. http://dx.doi.org/10.1016/S0308-5961(03)00010-7è
Rosston, G., Savage S., Waldman D., (2010). Household Demand for Broad-
band Internet Service, Discussion Papers 09-008, Stanford Institute for Eco-
nomic Policy Research, revised Feb. 2010. Available hereè
Savage S., Waldman D., (2005). Broadband Internet access, awareness, and
use: Analysis of United States household data. Telecommunications Policy,
29(8), 615-633. http://dx.doi.org/10.1016/j.telpol.2005.06.001è
Schejter A. M., Serenko A, Turel O, Mehdi Z., (2010). Policy implications of
market segmentation as a determinant of fixed-mobile service substitution:
What it means for carriers and policy makers. Telematics and Informatics,
22(1), 90-102. http://dx.doi.org/10.1016/j.tele.2009.05.002è
Srinuan P., Srinuan C., Bohlin E., (2012). Fixed and mobile broadband
substitution in Sweden,Telecommunications Policy, 36(3), 237-251. http:
//dx.doi.org/10.1016/j.telpol.2011.12.011è
Taylor D. L., (2002). Customer Demand Analysis. in Handbook of Telelcom-
munications Economics, Volume 1, ed. by M. E. Cave et al., 2002, 97-142.
Train K., (2009). Discrete Choice Methods with Simulation, Second Edition,
Cambridge University Press.
Vogelsang I., (2010). The relationship between mobile and fixed-line com-
munications: A survey, Information Economics and Policy, 22(1), 4-17.
http://dx.doi.org/10.1016/j.infoecopol.2009.12.002è
Ward M. R., Woroch G. A., (2004). Usage Substitution between mobile tele-
phone and fixed line in the U.S. Available at hereè

6I67I89:;<=> ç}1
Ward M. R., Zheng S., (2012). Mobile and fixed substitution for telephone
service in China. Telecommunications Policy, 36(4), 301-310. http://dx.
doi.org/10.1016/j.telpol.2011.12.002è

A33DEG)H J403KD/ 2
LM2MN Derivation of Logit choice probability
The model framework exposed the initial steps how a decision maker chooses
one alternative from a given and transposed this idea into a mathematically
tractable manner. It provided the logit choice probability given by expression
(2.4ê without describing its derivation. The purpose of this appendix is to
explain that derivation. However, the following calculus closely follows those
provided by Train (2009ð úõ úîý üó÷,îôø }è
Recall that a decision maker n chooses alternative j over any other alter-
native if her utility is maximised with j:
Pnj = Prob(Unj > Uni) , ∀i Ó= j , j = 1, . . . , J
= Prob(Vnj + εnj > Vni + εni)
= Prob(εni < εnj + Vnj − Vni) (A.2OPê
Then, the cumulative choice probability for an individual n for all alternatives
j Ó= i is the integral of the above, weighted by the density of εnj. Since ε are
iid extreme value with density function f(ε) and cumulative distribution F (ε)
given by (2.3aê and (2.3bê respectively, the cumulative choice probability yields
Pnj =
∫ ∏
j Ó=i
F (εnj)f(εnj)dεnj
=
∫ +∞
−∞
∏
j Ó=i
(exp[−e−(εnj+Vnj−Vni)]
)exp[−εnj ] exp[−e−εnj ] dεnj (A.2OQê
136

;,,endix Chapter 2 ç}?
Regrouping the terms exp[−e−εnj ], the last line above becomes:
Pnj =
∫ +∞
−∞
∏
i
(exp[−e−(εnj+Vnj−Vni)]
)exp[−εnj ] dεnj
=
∫ +∞
−∞
exp
[−
∑
i
e−(εnj+Vnj−Vni)
]exp[−εnj ] dεnj
=
∫ +∞
−∞
exp
[−e−εnj
∑
i
e−(Vnj−Vni)
]exp[−εnj ] dεnj (A.2OXê
Following Train (2009ðñ òøúîô exp[−εnj] = t so that − exp[−εnj] dεnj = dt.
Notice that the limit of t is +∞ if εnj tends to −∞. Conversely, its limit is
equal to 0 if εnj tends to +∞. Using this changed variable yields
Pnj =
∫ 0
+∞
exp
[−t
∑
i
e−(Vnj−Vni)
](−dt)
=
∫ +∞
0
exp
[−t
∑
i
e−(Vnj−Vni)
]dt
=1
− ∑i e−(Vnj−Vni)
[exp[−t
∑
i
e−(Vnj−Vni)
]+∞
0
= 0 − 1
−∑
i e−(Vnj−Vni)
=1
e−Vnj∑
i eVni
=eVnj
∑i eVni
(A.2O`ê

;,,endix Chapter 2 ç}W
A.2Mj Student’s T-test for equality of mean
Table A.2´µ Student’s T-test for equality of mean
Bouygues SFR SFRvs. Orange vs. Orange vs. Bouygues
Price -13.4006∗∗∗ -6.9411∗∗∗ 7.2030∗∗∗
Mobile-only -0.4985 -0.3145 0.1563Non-bundlers 15.0424∗∗∗ 6.7798∗∗∗ -6.7774∗∗∗
Bundlers -20.9255∗∗∗ -8.4660∗∗∗ 9.5794∗∗∗
≤ 22 years -0.7027 -6.1052∗∗∗ -4.4854∗∗∗
23 - 30 years 1.0974 3.2889∗∗∗ 1.883231 - 40 years 3.0276∗∗ 3.5265∗∗∗ 0.429341 - 50 years -2.2275∗ -0.5844 1.3818≥ 51 years -1.2900 -0.8672 0.3600Full Time Employee 0.2592 3.3540∗∗∗ 2.6212∗∗
Part Time Employee 1.8131 -0.9730 -2.3764∗
Retired -1.7369 -2.0318∗ -0.2466Student 0.3162 -4.2207∗∗∗ -3.7912∗∗∗
Unemployed 0.1383 0.8664 0.6152Homemaker -1.2947 1.4450 2.3235∗
Prepaid -0.6158 -0.3952 0.1870Low Income -0.2540 1.7095 1.6648No Kids 5.5449∗∗∗ 4.3329∗∗∗ -1.0215Rural -12.6168∗∗∗ -12.961∗∗∗ -0.2798Dense -0.3149 -1.0731 -0.6440Very Dense 12.4405∗∗∗ 13.4579∗∗∗ 0.8742Female -0.0024 -1.8494 -1.5661
∗∗∗p < .001, ∗∗p < .01, ∗p < .05
Note: The table reports Student’s T-test values for a bilateral test of the null hy-pothesis: Equality of proportions. Alternative hypothesis: Difference in proportions.Example: In the first column (Bouygues vs. Orange), the test indicates that theproportions of bundlers is significantly (at a 1 %$ level) different between BouyguesTélécom and Orange
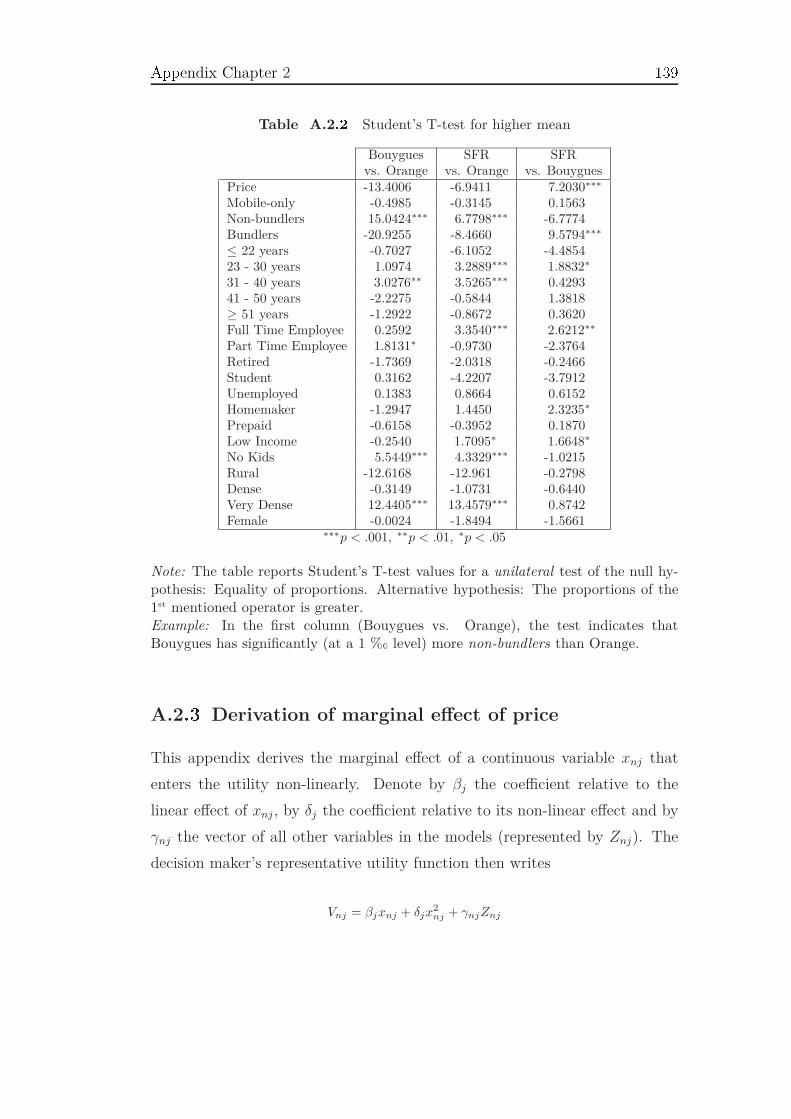
;,,endix Chapter 2 ç}_
Table A.2´¶ Student’s T-test for higher mean
Bouygues SFR SFRvs. Orange vs. Orange vs. Bouygues
Price -13.4006 -6.9411 7.2030∗∗∗
Mobile-only -0.4985 -0.3145 0.1563Non-bundlers 15.0424∗∗∗ 6.7798∗∗∗ -6.7774Bundlers -20.9255 -8.4660 9.5794∗∗∗
≤ 22 years -0.7027 -6.1052 -4.485423 - 30 years 1.0974 3.2889∗∗∗ 1.8832∗
31 - 40 years 3.0276∗∗ 3.5265∗∗∗ 0.429341 - 50 years -2.2275 -0.5844 1.3818≥ 51 years -1.2922 -0.8672 0.3620Full Time Employee 0.2592 3.3540∗∗∗ 2.6212∗∗
Part Time Employee 1.8131∗ -0.9730 -2.3764Retired -1.7369 -2.0318 -0.2466Student 0.3162 -4.2207 -3.7912Unemployed 0.1383 0.8664 0.6152Homemaker -1.2947 1.4450 2.3235∗
Prepaid -0.6158 -0.3952 0.1870Low Income -0.2540 1.7095∗ 1.6648∗
No Kids 5.5449∗∗∗ 4.3329∗∗∗ -1.0215Rural -12.6168 -12.961 -0.2798Dense -0.3149 -1.0731 -0.6440Very Dense 12.4405∗∗∗ 13.4579∗∗∗ 0.8742Female -0.0024 -1.8494 -1.5661
∗∗∗p < .001, ∗∗p < .01, ∗p < .05
Note: The table reports Student’s T-test values for a unilateral test of the null hy-pothesis: Equality of proportions. Alternative hypothesis: The proportions of the1st mentioned operator is greater.Example: In the first column (Bouygues vs. Orange), the test indicates thatBouygues has significantly (at a 1 %$ level) more non-bundlers than Orange.
A.2M~ Derivation of marginal effect of price
This appendix derives the marginal effect of a continuous variable xnj that
enters the utility non-linearly. Denote by βj the coefficient relative to the
linear effect of xnj, by δj the coefficient relative to its non-linear effect and by
γnj the vector of all other variables in the models (represented by Znj). The
decision maker’s representative utility function then writes
Vnj = βjxnj + δjx2nj + γnjZnj

;,,endix Chapter 2 çéb
The marginal effect of xnj on the choice probability Pnj yields:
∂Pnj
∂xnj
=∂
( exp(Vnj)∑i
exp(Vni)
)
∂xnj
=
(∂Vnj
∂xnj
)exp(Vnj)
∑i exp(Vni)
∑i exp(Vni)2
−exp(Vnj)
(∂Vnj
∂xnj
)exp(Vnj)
∑i exp(Vni)2
=
(∂Vnj
∂xnj
)×
(exp(Vnj)∑i exp(Vni)
− exp(Vnj)2
∑i exp(Vni)2
)
=
(∂Vnj
∂xnj
)× Pnj(1 − Pnj) (A.2Oaê
Thus, given Vnj above, ∂Vnj
∂xnjis equal to βj + 2δjxnj and the marginal effect
writes:
∂Pnj
∂xnj
= (βj + 2δjxnj) Pnj(1 − Pnj) (A.2Ocê
A.2M� Testing the equality of marginal effect of price
Table A.2´· Student’s T-test for equality of mean of marginal effect of price
TestBouygues SFR SFR
vs. Orange vs. Orange vs. BouyguesBilateral 28.1038∗∗ -24.0888∗∗∗ 45.2792∗∗∗
Unilateral 28.1038∗∗∗ -24.0888 45.2792∗∗∗
∗∗∗p < .001, ∗∗p < .01, ∗p < .05
Note: The table reports Student’s T-test values for a bilateral and unilateral test ofthe null hypothesis: Equality of average marginal effect.Alternative hypothesis for the bilateral (unilateral) test: The average marginal ef-fects are not equal (of the 1st mentioned operator is greater).Example: In the first column (Bouygues vs. Orange), the test indicates thatmarginal effect of price for Bouygues is significantly higher than Orange.


J�A���� ¸
Combining competition law and sector-specific
regulation: the case of margin squeeze1
¹º»¼�½¾ ¿À»�Á� Á�þ �� ��¾ �»tt�¼ tÃÄ�¾ »Å �¼tÃtÄÆÁt Ç�È�ÆÁ�when the prices went up the judges said it was monopoly,
when the prices went down they said it was predatory pricing,and when they stayed the same they said it was tacit collusion.”
William Landes,“The Fire of Truth: A Remembrance of Law and Econ at Chicago”,
JLE (1981) p. 193.
1 This chapter relies on a collaboration with Claudia Saavedra, former member of thedepartment of regulatory affairs of Orange.
142
}èç. INTRODUCTION 143
3.1 Introduction
The last chapter of this thesis focusses on the relation between ex ante sector-
specific regulation and ex post competition law enforcement in the case of
vertically related markets. Although not pretending to provide a general an-
swer to that question, it aims to shed light on a particular pricing issue that
may arise in vertically related market with an upstream monopoly.
The motivation for this study stems form the fact that this relation is of
a different kind in the EU than in the US. More specifically, a comparison of
jurisprudence on both sides of the Atlantic shows that ex ante market regula-
tion and ex post competition law enforcement are clearly seen as substitutes
in the US while forming a complementary set of rules in the EU.
This divergence is illustrated by the case law relative to margin squeeze
claims. A margin squeeze is said to occur if, in an industry where a verti-
cally integrated firm sells a bottleneck input to downstream competitors, the
spread between the integrated firm’s retail price and its wholesale price is in-
sufficient or too narrow such that the activity of equally efficient downstream
competitors is unprofitable (Commission (1998ðñ ¶117, Commission (2009ðñ
¶80). Several high profile case in the EU and the US relative to this issue
induced the aforementioned divergence.
The competition laws relevant for this analysis are Section 2 of the US Sher-
man Act and Art. 102 of the Treaty of the Functioning of the EU (TFEU ).2
2 The amended section 2 of the Sherman Act writes (amendment Pub. L. 108-237, 2004,Source: Legal É"f�� ��" É"��� ��ÊË
“Every person who shall monopolize, or attempt to monopolize, or combineor conspire with any other person or persons, to monopolize any part of thetrade or commerce among the several States, or with foreign nations, shall bedeemed guilty of a felony, and, on conviction thereof, shall be punished by finenot exceeding $10,000,000 if a corporation, or, if any other person, $350,000,or by imprisonment not exceeding three years, or by both said punishments, inthe discretion of the court.”
Art. 102 of the TFEU yields (Source: EUR-LexÊË
“Any abuse by one or more undertakings of a dominant position within the

}èç. INTRODUCTION 144
Both laws have the same aim and target the same infringement, namely, imped-
ing competition by abusing a dominant position and thus hamper the proper
flow of trade within the internal market.
Both jurisdictions however have different views when competition law meets
sector-specific regulation. In particular, US courts are reluctant to intervene
in a regulated industry as has been made clear by the Trinko and linkLine
case.3Ì 4 ;ý ó÷ý �ôôõ öôõîúíõô� úõ îóô úõîøí�þüîíø� ýôüîúíõ í� îóúý îóôýúýñ îóôýô
cases sharply reduced the scope for a margin squeeze claim. Especially when
sector-specific regulation is set up. The Trinko case ruled that the existence
of regulatory framework does not create an antitrust duty to deal. As firms
are free to choose their business partners and subsequently the terms and
conditions under which they deal with others, they do not have the obligation
to offer terms and conditions that please the business partners. Moreover,
courts see themselves ill-suited to intervene as market supervisor. This mission
is attributed to specific regulatory agencies that have the necessary know-how
for regulation and which, when setting up a regulatory framework, consider
possible anticompetitive issues.5
Iõ îóô �ôø� üíõîø÷ýîñ �þøí,ô÷õ Ííþøîý îíí� ÷ �ú²ôøôõî üíþøýô í� ÷üîúíõ
regarding the interplay of sector-specific regulation and competition law. The
internal market or in a substantial part of it shall be prohibited as incompatiblewith the internal market in so far as it may affect trade between Member States.Such abuse may, in particular, consist in:
(a) directly or indirectly imposing unfair purchase or selling prices or otherunfair trading conditions;
(b) limiting production, markets or technical development to the prejudice ofconsumers;
(c) applying dissimilar conditions to equivalent transactions with other trad-ing parties, thereby placing them at a competitive disadvantage;
(d) making the conclusion of contracts subject to acceptance by the other par-ties of supplementary obligations which, by their nature or according tocommercial usage, have no connection with the subject of such contracts.
”
3 Verizon Communications, Inc. v. Law Offices of Curtis V. Trinko, 540 U.S. 398 (2004).4 Pacific Bell v. linkLine Communications, Inc., 555 U.S. 438 (2009).5 linkLine, supra note 4

}èç. INTRODUCTION 145
DT case made the first and most important step towards the recognition of a
liability doctrine applicable to margin squeeze cases.
A first key element is that the DT case specifically recognises a margin
squeeze as stand-alone infringement of competition law, differentiating it from
i) predatory pricing in the downstream market and ii) refusal to deal in the
upstream market (via an excessively high upstream price). This judgment
made clear that the most important element in a margin squeeze claim is the
“[. . . ]unfairness of the spread between the downstream and upstream price.”
Moreover, neither price must individually be anticompetitive.6 Tóôøô�íøôñ
there appears a strikingly different approach compared to the US, where Judge
Roberts in linkLine stated that “[if] there is no [antitrust] duty to deal at the
wholesale level and no predatory pricing in the retail level, then a firm is cer-
tainly not required to price both of these services in a manner that preserves
its rivals’ profit margins.”7
; ýôüíõ� �ô� ôûôöôõî úý îóô øôüíùõúîúíõ í� ÷õîúîøþýî ûú÷�úûúî� �ôý,úîô îóô
existence of sector-specific regulation:8
ÎÏè . . ]there can very well be a margin squeeze between regulated
wholesale and retail prices.
. In comparison, Judge Scalia in the Trinko case conceived the existence of a
regulatory framework as “an effective steward of the antitrust function”.9
; õíî÷�ûô �ôüúýúíõ �� îóô UЦý ì:; 8FÍ8� íüüþø �� öú� ibç} îóíþùóè
Here, OFCOM decided not to condemn British Telecom (BT) for alleged mar-
gin squeeze. On the basis of a concise analysis of the national market con-
figuration, OFCOM found that BT’s pricing might incur a margin squeeze,
but without bearing any abusive character (OFCOMñ 2013ðè Iõ�ôô�ñ �þøúõù
6 Commission’s Decision in DT of 21/05/2003 (2003/707/EC), Case T-271/03 DeutscheTelekom AG v. Commission, 10 April 2008, and Appeal C-280/08 P, 14 October 2010.
7 linkLine, supra 4ï8 DT, Appeal C-280/08 P, ¶11.9 Trinko, supra 3ï

}èç. INTRODUCTION 146
the analysed period, BT’s competitors have not incurred negative margins,
nor have consumers been harmed via reduced competition. OFCOM therefore
made a clear distinction between a technical margin squeeze (i.e. a retail price
that does not cover total costs) and a margin squeeze with anti-competitive
effects.
Finally, the scope for a margins squeeze as a liability doctrine has been
greatly enlarged by the GC’s decision in TeliaSonera.10 ìíî íõû� �ú� îóô
Court made a clear cut between a margin squeeze and refusal to deal, but also
ruled that market dominance is sufficient for a margin squeeze to an admissible
claim. Thus, even if the downstream competitor could be supplied by another,
possibly not integrated, upstream firm, a margin squeeze may be alleged if the
accused vertically integrated upstream provider has significant market power.
Given this brief comparative review of the case law between the US and
the EU, the question arises whether the US approach or the EU approach
is better suited for handling margin squeeze cases. More specifically, in the
light of consumer welfare, should ex ante (upstream) market regulation and
ex-post competition law enforcement (by banning a margin squeeze) be used
as complements (i.e. EU approach) or as substitutes (i.e. US approach)?11
; üíøõôøýîíõô �íø ÷õýòôøúõù îóúý �þôýîúíõ úý îóô ,øí,ôø þõ�ôøýî÷õ�úõù í� îóô
10 Case C-52/09 Konkurrensverket v. TeliaSonera Sverige AB, 17 February 2011.11 The fact that both jurisdictions aim maximal consumer welfare can be seen from the
following statements. For the EU, Art. 5 of the Commission’s 2009 guidance of enforcementspriorities states that (CommissionÑ 2009Ê
“[I]n applying Article 82 to exclusionary conduct by dominant undertakings,the Commission will focus on those types of conduct that are most harmful toconsumers. Consumers benefit from competition through lower prices, betterquality and a wider choice of new or improved goods and services. The Com-mission, therefore, will direct its enforcement to ensuring that markets functionproperly and that consumers benefit from the efficiency and productivity whichresult from effective competition between undertakings.”
For the US, Ginsburg Ò2008Ê f�� "��"�� ��� ���� Ó �Ô� Õ��'�� "�%�� �f �$� Ö$�� "Act as
“[. . . ]contain[ing] no colorable support for application by courts of any valuepremise or policy other than the maximisation of consumer welfare.”

}èç. INTRODUCTION 147
economics of margin squeeze. Economic analysis of the impacts on consumer
surplus and social welfare when upstream market regulation and competition
law are enforced jointly may thus provide evidence on whether the relation is
best exploited as one of substitution or complementarity.
This chapter aims to contribute to this issue by proposing the following
analysis. Consider a model where a vertically integrated upstream monop-
olist faces downstream competition from a non-integrated downstream rival.
Downstream products are differentiated and the upstream market is under reg-
ulatory scrutiny. Both firms may be characterised by different efficiency levels
in the downstream market, either because products are of different qualities,
firms incur different downstream production costs or any combination of both.
The main results of the present analysis can be summarised as follows:
1. in a competitive setting without public intervention, a margin squeeze
occurs when the downstream rival is relatively more efficient,
2. without upstream market regulation, enforcing competition law by ban-
ning a margin squeeze induces a decrease of the upstream price, increase
consumer surplus and social welfare,
3. imposing both upstream market regulation and a margin squeeze ban is
likely to induce both downstream prices to increase, yielding a decrease
of consumer surplus. The effect on social welfare is ambiguous.
The remainder of this chapter is the following. Section 3.2 ,øôýôõî îóô ô��
isting literature. Section 3.3 �ôî÷úûý îóô öí�ôû ý,ôüú�ü÷îúíõý ÷õ� ýôüîúíõ 3.4
÷õ÷û�sis the impact of a margin squeeze absent upstream market regulation.
In particular, subsection 3.4.1 �ôøú�ôý îóô �ôõüóö÷ø� ô�þúûú�øúþö íþîüíöô úõ
an environment and without margin squeeze ban. Subsection 3.4.2 úõîøí�þüôý
a ban on margin squeeze and describes compares to the benchmark outcome.
Section 3.5 úõîøí�þüôý øôùþû÷îúíõ úõ îóô þ,ýîøô÷ö ö÷ø�ôî ÷õ� øôøþõ îóô ÷õ÷û�
ysis. Section 3.6 �úýüþýýôý the results and concludes.

}èi. LITERATURE REVIEW 148
3.2 Revue of existing literature
Several academic papers reveal that banning a margin squeeze is likely to in-
duce an increase of downstream prices (Bouckaert and Verbovenñ 2004× Carl-
tonñ 2008× Choné et al.ñ 2010× Sidakñ 2008ðè Tóúý ô²ôüî úý ü÷ûûô� îóô price
umbrella effect and has obvious consequences on consumer welfare. The mech-
anism behind this effect is that the vertically integrated firm’s price is subject
to an imputation rule that is commonly known as the equally efficient op-
erator-test. Implementing this rule is akin to setting the integrated firm’s
downstream price at least equal to its downstream cost plus the (regulated)
upstream price. As a result, the downstream price is higher than in a per-
fectly competitive environment. Furthermore, if there is no regulatory duty
to deal, the vertically integrated firm could choose to cease the production of
its own retail product and earn monopoly profits on the upstream market by
only selling the upstream good to the downstream firm (Carltonñ 2008ðè Ííõ�
sumers could then be harmed because some diversified products are no longer
available.
Briglauer et al. (2011ð ÷õ÷û�ýô îóô ôüíõíöúüý í� ö÷øùúõ ý�þôôØô úõ îóô
telecommunications sector when retail products are differentiated. Similarly
to the result in this chapter, they find that a margin squeeze can arise as the
competitive outcome rather than a foreclosure strategy. The difference between
their paper and the work here is that in their framework the margin squeeze
stems from inter-modal competition. Said otherwise, at a given regulatory
strength, an entrant’s margins may be squeezed when competition stems from
another infrastructure increases.12
;ý ýî÷îô� ÷�í�ôñ øôùþû÷îíø� ÷ùôõüúôý ÷õ� üíö,ôîúîúíõ ÷þîóíøúîúôý øôû� íõ
12 The authors speak of an outside option, which represents competition from a sub-stitutable product like mobile telephony services that compete with fixed line telephonyservices.

}èi. LITERATURE REVIEW 149
the imputation rule when assessing the presence of a margin squeeze. This
rule is largely discussed in the academic literature and diverse adaptions are
proposed.
Beard, Kaserman and Mayo (2003ð ,øí�ú�ô ÷ üøúîú�þô íõ îóô úö,þî÷îúíõ
test by depicting several reasons for its lack of bite. For instance, the au-
thors explain that due to an informational asymmetry about the costs of the
vertically integrated firm and the difficulty to estimate them accurately, the
regulated firm may yet be able to satisfy the imputation rule even though an
equally efficient competitor might be excluded. Moreover, the market may be
characterized by high switching costs that may induce the competitor to offer
high discounts in order to poach the incumbent’s customers. Then, using the
incumbent’s costs as benchmark weakens the effectiveness of the imputation.
Bouckaert and Verboven (2004ð ýîøôýý íþî îó÷î úõ ÷ �þûû� øôùþû÷îô� ôõ�ú�
ronment (i.e. upstream and downstream prices are set by the regulator), the
pricing scheme of the vertically integrated firm may fail to the standard test,
if it does not account of previous regulatory decisions. Therefore, the authors
plead for integrating, along with production costs, at least a proportion of the
additional costs of supplying the upstream good). Would a margin squeeze
be exist, it would merely be an “[. . . ] artifact of cost-based regulatory system”
and call this occurrence a “regulatory [margin] squeeze”. If the environment
is only partially regulated (i.e. only upstream market regulation exists), the
authors refer to a “predatory price squeeze”.13 Iõ îóô ü÷ýô í� ÷ ,øô�÷îíø� ,øúüô
squeeze , the standard predatory price test could then easily be adapted by
introducing the additional supply costs at upstream level in order to efficiently
detect an anticompetitive pricing behavior of the vertically integrated firm.
In a similar vain, Jullien et al. (2013ð �ôøú�ô ÷õ ÷�÷,îúíõ í� îóô ýî÷õ�÷ø�
13 Vertical foreclosure may only occur via an excessive upstream price, which in thepartially regulated environment is not under the scrutiny of the vertically integrated firmand thus not possible.

}èi. LITERATURE REVIEW 150
margin squeeze test that accounts for vertical integration. In their survey,
the authors review the potential of a margin squeeze for being an exclusionary
abuse and exploitative abuse. The latter case appears to be an inconsistent the-
ory of harm, because a ban on margin squeeze does merely benefit downstream
competitors, may hurt consumers and may raise upstream foreclosure concerns
if the upstream level is unregulated. If, however, upstream market regulation
exists, competition law enforcement via a ban on margin squeeze may raise
exclusionary concerns in the downstream level. Jullien et al. (2013ð îóôøô�íøô
develop an adaption of the standard predatory pricing test. As cost bench-
mark, the authors consider the opportunity costs of a vertically integrated firm
to exclude downstream competitors. This opportunity costs stem from the tra-
ditional trade-off a vertically integrated upstream monopolist: more upstream
rents by scarifying downstream rents or vice versa. The test proposed by Jul-
lien et al. (2013ð îóôøô�íøô üíõî÷úõý ÷ �ú�ôøýúíõ ø÷îúí îó÷î ÷ûûíòý îí öô÷ýþøô
how many upstream revenue is sacrified by excluding a competitor.
Another adaption of the standard imputation rule is developed by Jaunaux
and Lebourges (2013ðè Tóô ö÷úõ üíõüôøõ í� îóúý ,÷,ôø úý îí �ôøú�ô ÷ îôýî îó÷î
is in line with the
“[Commission]’s dual objective of encouraging NGA investment and
maintaining the competitive structure inherited from copper un-
bundling, while obeying the principle of fair investment risk dis-
tribution between access provider and access seekers.”14
;ý îóô ÷þîóíøý ô�,û÷úõñ îóô Ííööúýýúíõ :ôüíööôõ�÷îúíõ íõ üíõýúýîôõî õíõ�
discrimination obligations and costing methodologies to promote competition
and enhance the broadband investment environment includes a test with a
two-part cost benchmark, with a variable upstream price (e.g. varying with
the volume of access seemed) and some fixed part of the wholesale price. Jau-
� NGA = New Generation Access.

}è}. MODEL SPECIFICATIONS 151
naux and Lebourges (2013ð ýóíò úõ îóôúø ÷õ÷û�ýúý îó÷î îóô úõüûþýúíõ í� îóô
fixed part is not desirable because NGA investment may be deterred. More-
over, the authors plead for the usage of a second test that takes into account a
“competition migration effect”. This effect arises because of a transitory period
where competition migrates from the copper-based network to the NGA net-
work. Thus, the second test takes into account the interdependence between
both facilities with the aim to promote investment by all the market players.
Despite all the critics, this chapter uses the standard imputation test (that
is, the EEO-test), as it is widely accepted test in the EU-approach.
3.3 The model specifications
The analysis is carried out in an industry with two vertically related markets.
In the upstream market, only a vertically integrated firm (I ) is active and
supplies the bottleneck input for the production downstream that cannot be
bypassed. In the downstream market, the integrated firm’s downstream unit
and a unintegrated competitor (C ) compete with differentiated goods.
The production cost of one unit of upstream good, cu are assumed constant
and, without loss of generality, normalised to 0. As supplier of a bottleneck
input, the vertically integrated firm (I ) has a duty to deal and to provide the
input to its competitor. The price of the upstream good is denoted by w and
may be regulated with a price cap set either at or above marginal costs. Such
imperfect regulation may be due to additional upstream costs of supplying
the vital input to the competitor, to informational asymmetries, regulatory
capture, or to the need to preserve the long-run investment incentives of the
industry. Furthermore, upstream price regulation is assumed exogenous.
The upstream input is assumed to be used in a one-to-one proportion in
conjunction with some downstream input. The latters’ costs are denoted ci for
firm i = I, C.

}è}. MODEL SPECIFICATIONS 152
The demand is given by the following version of the Singh and Vives (1984ð
model that allows for product differentiation:
U = αIqI + αCqC − 1
2[βIq2
I + βCq2C + 2γqIqC ] (3.1)
where {αI , αC} represent consumers’ valuations for the products. For simplic-
ity, βI and βC are assumed equal to 1. γ is the downstream product differen-
tiation parameter. It measures how much the demand of one firm varies when
its rival supplies one further downstream unit. In theory, γ may evolve in
[−1, 1], where a negative γ represents complementary goods. If γ is 0, down-
stream products are independent and finally if γ is positive, the products are
substitutes, with perfect substitutability at γ = 1. This model only considers
the case of imperfect substitutes, i.e. γ ∈ (0, 1).
Given prices {pI , pC}, firms face the following demand
qI =1
1 − γ2
[αi − pi − γ(αj − pi)
], i, j = I, C; i Ó= j (3.2)
To join the works of Singh and Vives (1984ð ÷õ� Zanchettin (2006ðñ αI
and αC may be interpreted as product quality and equivalently as demand
asymmetry. If firms are perceived as providing different levels of quality, then
αI Ó= αC . Moreover, the present model allows for downstream cost differentials
(cI T cC). Then, as Zanchettin Ù2006Ú ÜÝÞ ßÞ
[. . . ]both cost and demand asymmetry reduce to one firm being more
efficient than the other in terms of cost per unit of quality supplied.
To capture this downstream efficiency, an index ∆ = αC−cC
αI−cIis introduced. If
0 < ∆ < 1, the integrated firm is relatively more efficient than the competitor,
whereas the reverse holds with ∆ > 1. Without loss of generality, αI − cI is
normalised to 1.
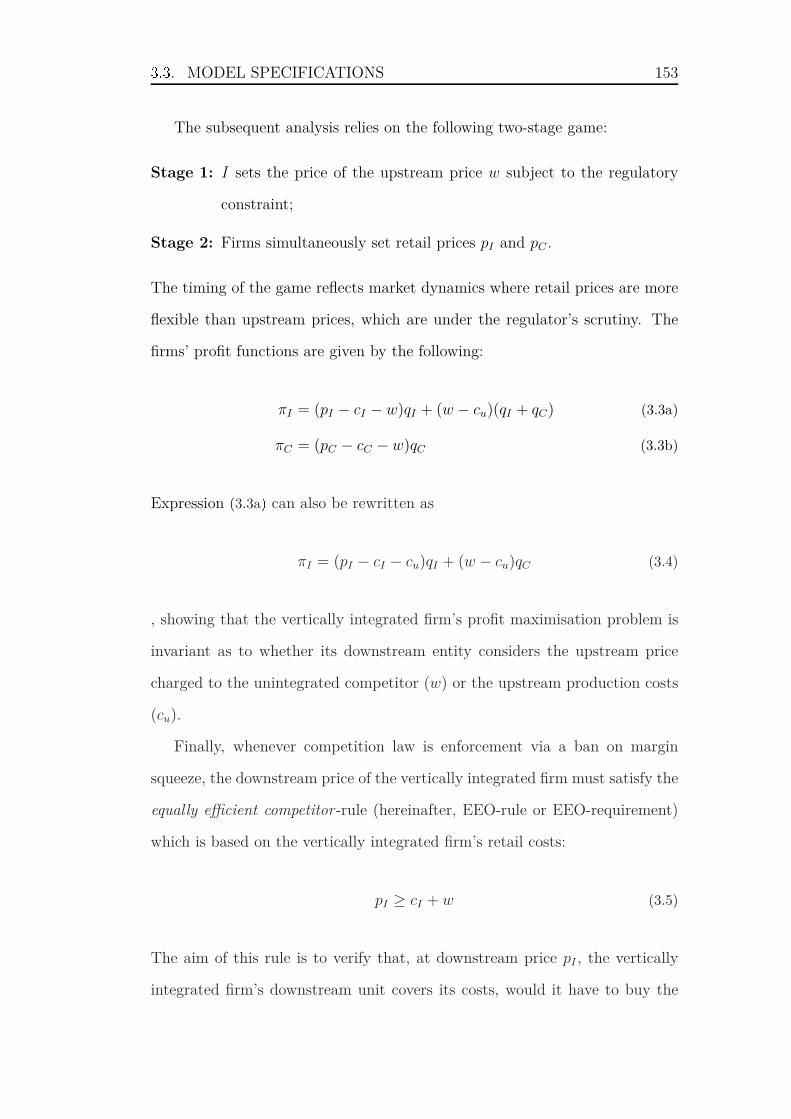
àáà. MODEL SPECIFICATIONS 153
The subsequent analysis relies on the following two-stage game:
Stage 1: I sets the price of the upstream price w subject to the regulatory
constraint;
Stage 2: Firms simultaneously set retail prices pI and pC .
The timing of the game reflects market dynamics where retail prices are more
flexible than upstream prices, which are under the regulator’s scrutiny. The
firms’ profit functions are given by the following:
πI = (pI − cI − w)qI + (w − cu)(qI + qC) (3.3a)
πC = (pC − cC − w)qC (3.3b)
Expression (3.3aâ can also be rewritten as
πI = (pI − cI − cu)qI + (w − cu)qC (3.4)
, showing that the vertically integrated firm’s profit maximisation problem is
invariant as to whether its downstream entity considers the upstream price
charged to the unintegrated competitor (w) or the upstream production costs
(cu).
Finally, whenever competition law is enforcement via a ban on margin
squeeze, the downstream price of the vertically integrated firm must satisfy the
equally efficient competitor-rule (hereinafter, EEO-rule or EEO-requirement)
which is based on the vertically integrated firm’s retail costs:
pI ≥ cI + w (3.5)
The aim of this rule is to verify that, at downstream price pI , the vertically
integrated firm’s downstream unit covers its costs, would it have to buy the

àáã. NO REGULATION 154
upstream good at the same conditions as the unintegrated competitor. De-
spite the criticism, this model relies on the EEO-rule (rather than, e.g. the
reasonably efficient competitor -rule or RJS’s VI-adjusted sacrifice test) as it
provides legal security to the vertically integrated firm. Moreover, it seems
natural to apply the EEO-rule, since it has been backed up by the GC in DT
as well as Telefònica and has thus become the standard in the Commission’s
proceeding in alleging anti-competitive margin squeeze case.
The subsequent analysis seeks to determine the impact the EEO-rule has
on the industry outcome, whether regulation is set up or not. Therefore, the
analysis is organised as follows. The next section considers an unregulated
environment and derives equilibrium without and with a margin squeeze ban
(i.e. competition law enforcement). Welfare implications are also discussed.
Then, the analysis is rerun with upstream market regulation. This latter
analysis will allow to compare the US and EU approach in margin squeeze
matters.
3.4 Equilibria in an unregulated environment
The perfect Nash equilibrium is derived by backward induction. Consider first
that the integrated firm’s price is not subject to the EEO-rule. This is called
the “free competition” setting and will be presented next.
3.4.1 “Free competition” - No competition law enforce-
ment
The first step of the backward induction involves price competition in the
downstream market at any given upstream price w. Maximising profits given
by (3.3aâ and (3.3bâ leads to the following equilibrium in the second stage of
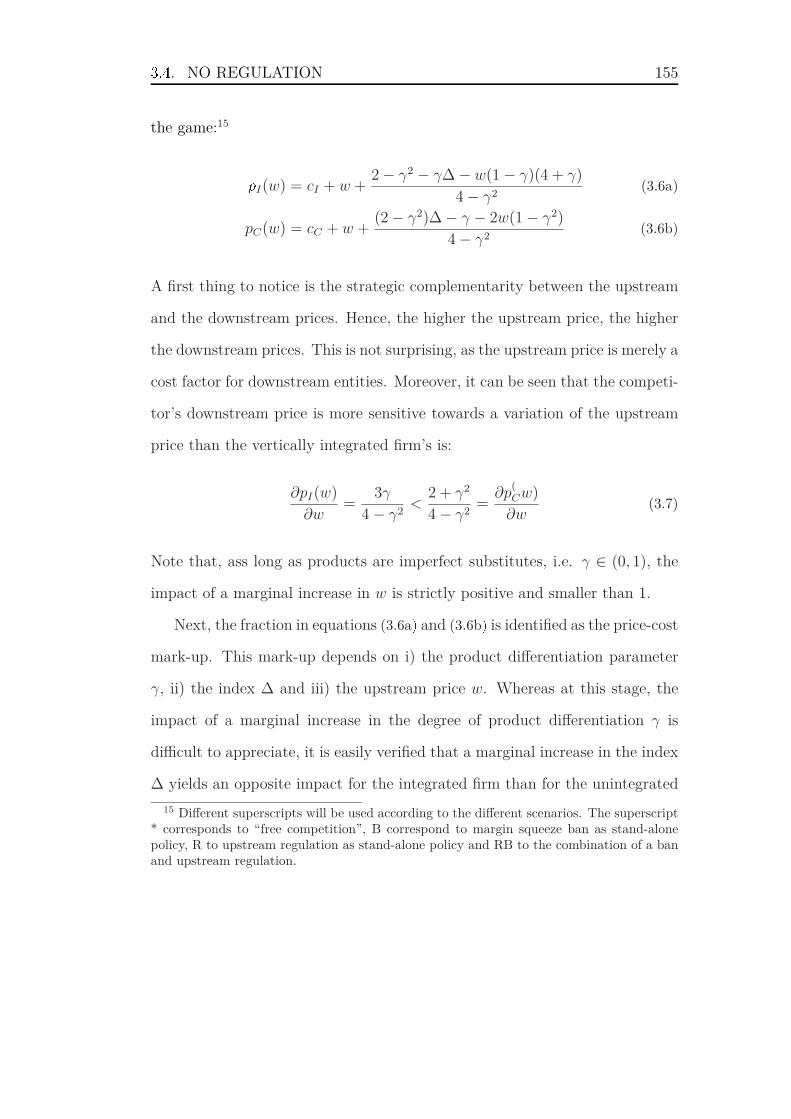
àáã. NO REGULATION 155
the game:15
äI(w) = cI + w +2 − γ2 − γ∆ − w(1 − γ)(4 + γ)
4 − γ2(3.6a)
pC(w) = cC + w +(2 − γ2)∆ − γ − 2w(1 − γ2)
4 − γ2(3.6b)
A first thing to notice is the strategic complementarity between the upstream
and the downstream prices. Hence, the higher the upstream price, the higher
the downstream prices. This is not surprising, as the upstream price is merely a
cost factor for downstream entities. Moreover, it can be seen that the competi-
tor’s downstream price is more sensitive towards a variation of the upstream
price than the vertically integrated firm’s is:
∂pI(w)
∂w=
3γ
4 − γ2<
2 + γ2
4 − γ2=
∂p(Cw)
∂w(3.7)
Note that, ass long as products are imperfect substitutes, i.e. γ ∈ (0, 1), the
impact of a marginal increase in w is strictly positive and smaller than 1.
Next, the fraction in equations (3.6aâ and (3.6bâ is identified as the price-cost
mark-up. This mark-up depends on i) the product differentiation parameter
γ, ii) the index ∆ and iii) the upstream price w. Whereas at this stage, the
impact of a marginal increase in the degree of product differentiation γ is
difficult to appreciate, it is easily verified that a marginal increase in the index
∆ yields an opposite impact for the integrated firm than for the unintegrated
15 Different superscripts will be used according to the different scenarios. The superscript* corresponds to “free competition”, B correspond to margin squeeze ban as stand-alonepolicy, R to upstream regulation as stand-alone policy and RB to the combination of a banand upstream regulation.

àáã. NO REGULATION 156
downstream competitor:
∂pI(w)
∂∆= − γ
4 − γ2< 0, ∀γ ∈ (0, 1) (3.8a)
∂pC(w)
∂∆=
2 − γ2
4 − γ2> 0, ∀γ ∈ (0, 1) (3.8b)
Hence, the more the downstream competitor’s efficiency increases (i.e. an
increasing ∆), the stronger the competitive pressure exerted on the integrated
firm whose downstream price decreases and whose ability to extract rents from
final consumers is reduced. On the contrary, the more efficient competitor is
able to extract increasing rents from consumers due to its higher efficiency.
The next step in the backward induction concerns the determination of the
optimal upstream price w. Substituting equations (3.6aâ and (3.6bâ into the
integrated firm’s profit function and maximizing over w yields:
w∗ =8∆ + γ3
2(8 + γ2)(3.9)
Remark from equation (3.9â, that the higher the index ∆, the higher the op-
timal upstream price w∗: ∂w∗
∂∆= 4
8+γ2 > 1. This implies that the integrated
firm is extracting higher rents by selling the upstream good to its downstream
competitor as the latter is becoming more efficient in the downstream market.
With the optimal upstream price w∗ now determined, the final equilibrium
outcome is provided in the following lemma:
Lemma 3.1. In the “free competition” setting without upstream market regula-
tion and no competition law enforcement, the industry outcome is characterized

àáã. NO REGULATION 157
by the following equilibria:
p∗I = cI +
8 − γ2 + 2γ∆
2(8 + γ2)(3.10a)
p∗C = cC +
2∆(6 + γ2) − γ(4 + γ2)
2(8 + γ2)(3.10b)
q∗I =
8 − γ(6∆ + γ + γ3)
2(1 − γ)(1 + γ)(8 + γ2)(3.10c)
q∗C =
(2 + γ2)(∆ − γ)
(1 − γ)(1 + γ)(8 + γ2)(3.10d)
π∗I =
4[2 + ∆(∆ − 2γ)
]− γ2(3 + γ2)
4(1 − γ)(1 + γ)(8 + γ2)(3.10e)
π∗C =
(2 + γ2)2(∆ − γ)2
(1 − γ)(1 + γ)(8 + γ2)2(3.10f)
A first thing to notice from (3.10aâ is that the integrated firm’s equilibrium
downstream price is now increasing with the index ∆. The explanation is as
follows. First, recall that the integrated firm’s price as a function of w (given
in 3.6aÚ ßå æ çèéêèæåßëì íÝëéÞßîë îí ∆ (see equation 3.8aÚ æëç æë ßëéêèæåßëì
function of w (see equation 3.7Úá ïèéîëçð Þñè îÜÞßòæó ÝÜåÞêèæò Üêßéè w∗ is
also an increasing function of ∆. Hence, the total differential of (3.10aâ yields:
dp∗I(w)
d∆=
∂p∗I(w)
∂∆+
∂p∗I(w)
∂w
dw∗
d∆
= − γ
4 − γ2+
3γw′∆
4 − γ2
=γ(3w′
∆ − 1)
4 − γ2(3.11)
where w′∆ denotes the first order partial derivative of w∗ with respect to ∆.
Then, using the fact that 3w′∆ is always strictly greater than 1 for any degree

àáã. NO REGULATION 158
of product differentiation, (3.11â is always positive:
dp∗I(w)
d∆=
γ[3
(4
8+γ2
)− 1
]
4 − γ2
=γ
8 + γ2
> 0 ,∀γ ∈ (0, 1) (3.12)
Another explanation is the strategic complementarity between prices al-
ready mentioned above. Recall that the upstream price is a cost factor in the
downstream segment of the industry. Moreover, the more efficient the com-
petitor, the more rents the integrated firm extracts via the upstream price.
Thus, by being a strategic complement to the competitor’s downstream price,
the integrated firm’s downstream price increases as the competitor’s costs in-
crease.
Consider next the application of the EEO-rule so as to determine whether
the integrated firm’s final equilbrium price involves a margin squeeze or not.
It then appears that a margin squeeze will always be alleged whenever the
competitor is more efficient:
p∗I < cI + w∗ ⇔ cI +
8 − γ2 + 2γ∆
2(8 + γ2)< cI +
8∆ + γ3
2(8 + γ)
⇔ ∆ >8 − γ2 − γ3
2(4 − γ)= 1 +
γ(2 − γ − γ2)
2(4 − γ)≡ ∆ (3.13)
Therefore,
Proposition 3.1. In the “free competition” setting, the vertically integrated
firm’s efficient pricing scheme would not satisfy the EEO-rule whenever its
competitor is more efficient (i.e. ∆ ≥ 1).
As can be seen from the derivation ∆, the failure of the margin squeeze test
is not due to any exclusionary conduct, but merely a by-product of the com-
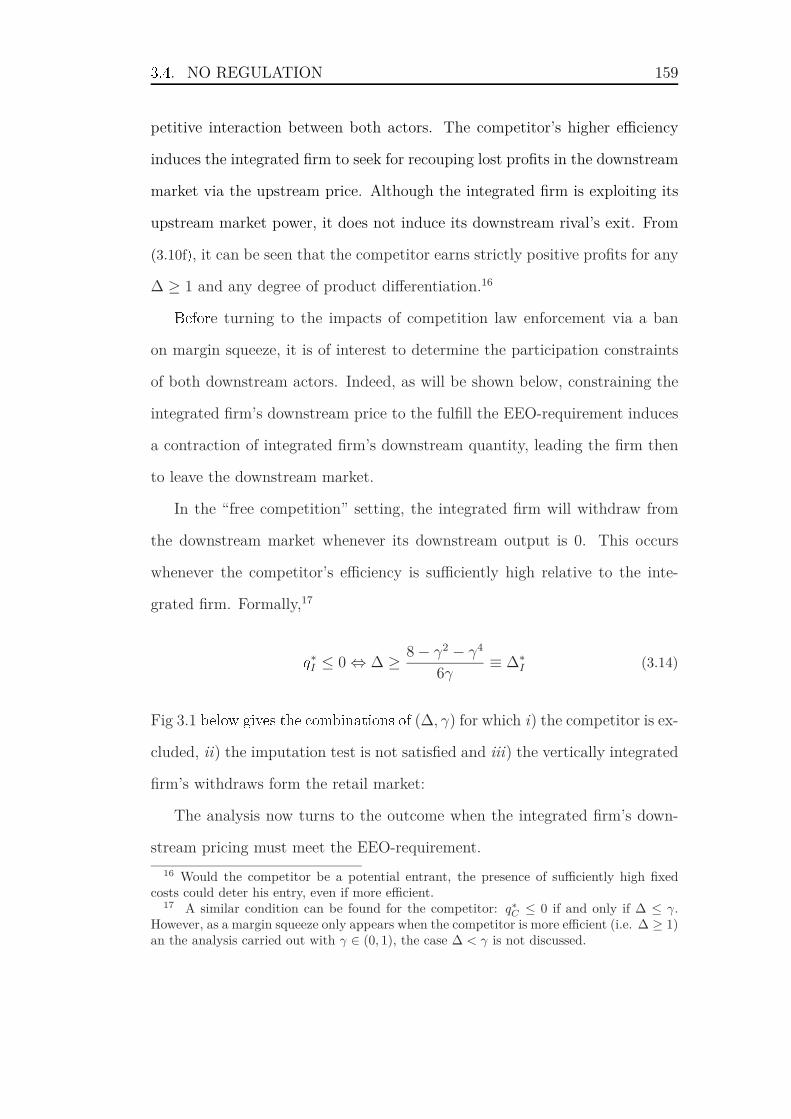
àáã. NO REGULATION 159
petitive interaction between both actors. The competitor’s higher efficiency
induces the integrated firm to seek for recouping lost profits in the downstream
market via the upstream price. Although the integrated firm is exploiting its
upstream market power, it does not induce its downstream rival’s exit. From
(3.10fâ, it can be seen that the competitor earns strictly positive profits for any
∆ ≥ 1 and any degree of product differentiation.16
ôèíîêe turning to the impacts of competition law enforcement via a ban
on margin squeeze, it is of interest to determine the participation constraints
of both downstream actors. Indeed, as will be shown below, constraining the
integrated firm’s downstream price to the fulfill the EEO-requirement induces
a contraction of integrated firm’s downstream quantity, leading the firm then
to leave the downstream market.
In the “free competition” setting, the integrated firm will withdraw from
the downstream market whenever its downstream output is 0. This occurs
whenever the competitor’s efficiency is sufficiently high relative to the inte-
grated firm. Formally,17
õ∗I ≤ 0 ⇔ ∆ ≥ 8 − γ2 − γ4
6γ≡ ∆∗
I (3.14)
Fig 3.1 öèóî÷ ìßøèå Þñè éîòößëæÞßîëå îí (∆, γ) for which i) the competitor is ex-
cluded, ii) the imputation test is not satisfied and iii) the vertically integrated
firm’s withdraws form the retail market:
The analysis now turns to the outcome when the integrated firm’s down-
stream pricing must meet the EEO-requirement.
16 Would the competitor be a potential entrant, the presence of sufficiently high fixedcosts could deter his entry, even if more efficient.
17 A similar condition can be found for the competitor: q∗C ≤ 0 if and only if ∆ ≤ γ.
However, as a margin squeeze only appears when the competitor is more efficient (i.e. ∆ ≥ 1)an the analysis carried out with γ ∈ (0, 1), the case ∆ < γ is not discussed.

àáã. NO REGULATION 160
0.0 0.2 0.4 0.6 0.8 1.0
0.0
0.5
1.0
1.5
2.0
2.5
3.0
Γ
D
Imputation testnot satisfiedD > D�
Verticallyintegrated firm
withdrawsD > D
I
B
CompetitorexcludedD < Γ
ùúû´ ·´µ Market outcome (Imputed margin squeeze, firm I ’s withdrawal andcompetitor’s exclusion) when there is public intervention i.e. no upstream priceregulation and no ban on margin squeeze.
3.4.2 Enforcing competition law via a ban on margin
squeeze
This section analyses the outcome when competition law obliges the vertically
integrated firm to meet the EEO-requirement. The integrated firm’s down-
stream price must comply with the EEO-rule: pI ≥ cI + w.
The vertically integrated firm profit maximisation problem is then as fol-
lows:
maxpi,w
πI = (pi − ci − w)qi + w qc
s.t. pI ≥ cI + w (3.15)

àáã. NO REGULATION 161
If the constraint is saturated (i.e. pI = cI + w), the maximisation problem
becomes:
maxw
πI = w qc (3.16)
For any level of upstream price, profits are maximised with the following
equilibrium retail prices and quantities:
pBI (w) = cI + w (3.17a)
pBC(w) = cC + w +
∆ − γ − (1 − γ)w
2(3.17b)
Recall from the previous section that whenever the competitor is more
efficient (i.e. ∆ > 1), the integrated firm’s downstream price incurs a margin
squeeze, or equivalently a negative margin above costs which are cI+w. Thus, a
ban on margin squeeze can only be binding when ∆ > 1. It than immediately
follows that a ban on margin squeeze requires the integrated firm to set a
strictly non-negative mark-up, inducing a competition softening effect. This
effect has been acknowledge by several scholars (see Carlton Ù2008Úü Choné
et al. Ù2010Ú æòîëì îÞñèêåÚ æëç ßå ýëî÷ë Ýëçèê Þñè ëæòè îí price umbrella.
By an argument of strategic complementarity between downstream prices, it
follows that the competitor’s downstream price increases as well.
However, as the integrated firm earns profits on upstream market, it may
have the incentive to reduce the upstream price so as to boost the competitor’s
demand for the upstream good, maximising thereby its profits. This is a
standard trade-off a vertically integrated firm faces when it competes in the
downstream market: increasing the demand for its upstream good that stems
from its competitor despite the possible harm incurred by its own downstream
entity or being more aggressive in the downstream market despite the possible
harm incurred by its upstream entity.

àáã. NO REGULATION 162
Although, when the integrated firm has to fulfil the EEO-requirement, the
second option of this trade-off (that is, fiercer downstream competition) does
not emerge. Hence, the only profitable alternative is the reduction of the
upstream price. It remains however an open question whether this upstream
price reduction is sufficient to outweigh the downstream price increase. In
order to determine the balance of these two effect, the optimal upstream price
must be determined.
Plugging equations (3.17aâ and (3.17bâ into the integrated firm’s profit func-
tion and maximisation over w leads to
wB =2 + γ + ∆
2(3 + γ)(3.18)
Comparing the optimal upstream prices in a setting with and without
ban shows that the vertically integrated firm sets a lower upstream price and
thereby decreases the unintegrated competitor’s costs:
W(∆) ≡ (wB − w∗) =2 + γ + ∆
2(3 + γ)− 8∆ + γ3
2(8 + γ2)(3.19)
(3.20)
Evaluating the above at ∆ = ∆ shows that the upstream price decrease when-
ever a ban on margin squeeze is implemented:
W(∆ = ∆) = −γ(1 − γ)(4 + γ)
4(4 − γ)(3 + γ)
≤ 0 , ∀γ ∈ (0, 1) (3.21)
Furthermore, because the partial derivative of (3.19â with respect to ∆ is posi-
tive, a ban does induce a decrease of the upstream input price whenever ∆ ≥ ∆.
Therefore,

àáã. NO REGULATION 163
Proposition 3.2. Competition law enforcement via a ban on margins induces
a decreasing rival’s costs-effect (henceforth DRC-effect).
Given wB, the final market equilibrium under competition law enforcement
is characterised by the following lemma:
Lemma 3.2. Whenever competition law is enforced and thereby the integrated
firm required to meet the EEO-rule, the equilibrium industry outcome is as
follows:
pBI = cI +
2 + γ + ∆
2(3 + γ)(3.22a)
pBC = cC +
2 − γ(3 + γ) + ∆(3γ + 7)
4(3 + γ)(3.22b)
qBI =
8 + γ(1 − γ)(4 + γ) −[2 + γ(5 + γ)
]∆
4(1 − γ)(1 + γ)(3 + γ)(3.22c)
qBC =
∆(5 + 3γ) − γ(5 − γ) − 2
4(3 + γ)(1 − γ2)(3.22d)
πBI =
(2 + γ + ∆)2
8(1 + γ)(3 + γ)(3.22e)
πBC =
[2 + γ(5 + γ) − ∆(5 + 3γ)
]2
16(3 + γ)2(1 − γ2)(3.22f)
The impact of a ban on margin squeeze when the upstream market is un-
regulated can be disclosed by calculating the difference between the equilibria
given in lemma 3.2 æëç 3.1á
Consider first the impacts on the competitor. First of all, the difference
between its equilibrium price under a ban on margin squeeze and its price
without ban shows that the competitor incurs a stronger DRC-effect than a
PU-effect:
PC(∆) ≡ (pBC − p∗
C) =16(1 − ∆) + γ2[2 + γ(3 + γ) − (5 + γ)∆]
4(3 + γ) (8 + γ2)(3.23)
(3.24)

àáã. NO REGULATION 164
Evaluating PC(∆) at ∆ = ∆ shows that pBC is always lower than p∗
C :
PC(∆ = ∆) ≡ (pBC − p∗
C) = −γ(1 − γ)(1 + γ)(4 + γ)
8(4 − γ)(3 + γ)
< 0 ,∀γ ∈ (0, 1) (3.25)
Moreover, a marginal increase of ∆ on PC(∆) is always negative, which leads to
the conclusion that the more ∆ increases, the more the DRC-effect is amplified
compared to the PU-effect.18
ïèéîëçð provided that a firm’s quantities depend negatively on its own
price, it is immediate to see that the price decrease induced by the ban on
margin squeeze generates a higher output for the competitor.
Finally, it is shown that the competitor incurs higher profits whenever
competition law is enforced:
ΠC(∆) ≡ πBC − π∗
C =(8 + γ2)2[2 + γ(5 + γ) − ∆(3γ + 5)]2 − 16(3 + γ)2(2 + γ2)2(∆ − γ)2
16(3 + γ)2(1 − γ2)(8 + γ2)2
(3.26)
At ∆ = ∆, the above yields:
ΠC(∆ = ∆) =(1 − γ)2γ(4 + γ){48 + γ[20 + 7γ(3 + γ)]}
64(4 − γ)2(1 + γ)(3 + γ)2
> 0 , ∀γ ∈ (0, 1) (3.27)
A marginal increase in ∆ implies a higher profits whenever ∆ is at least 1 and
18 The marginal increase of ∆ on PC(∆) is equal to:
∂PC(∆)
∂∆= − 16 + (5 + γ)γ2
4(3 + γ)(8 + γ2)
< 0 , ∀γ ∈ (0, 1)

àáã. NO REGULATION 165
thus always when a ban is implemented.19
þñè ßòÜæéÞå îë Þñè ÝëßëÞèìêæÞèç çî÷ëåÞêèæò éîòÜèÞßÞîê éæë Þñèêèíîêè öè
summarised as follows:
Proposition 3.3. Requiring the vertically integrated firm to meet the EEO-
rule is beneficial for the competitor, as, ultimately, it earns higher profits.
The impacts on the vertically integrated firm are less straightforward.
Whether the PU-effect outweighs the DRC-effect or not depends on ∆. By
calculating the difference pBI − p∗
I , a threshold, denoted ∆P U can be derived
above which the integrated firm’s downstream price is always higher when a
ban on margin squeeze is implemented:
PI ≡ pBI − p∗
I > 0
⇔8(∆ − 1) − γ
[6∆ − γ(5 + 2γ − ∆)
]
2(3 + γ) (8 + γ2)> 0 (3.29)
⇒ ∆ >8 − γ2(5 + γ)
8 − γ(6 − γ2)≡ ∆P U (3.30)
This threshold ∆P U is however above ∆, i.e. the threshold for a margin squeeze
to arise:
∆P U ≥ ∆ (3.31)
(1 − γ)γ(4 + γ)(8 + γ2)
2(4 − γ)[8 − γ(6 + γ)]≥ 0, ∀γ ∈ (0, 1). (3.32)
Thus,
19 The marginal increase of ∆ on
∂ΠC(∆)
∂∆=
1
16(3 + γ)2(1 − γ2)(8 + γ2)2
{32(3 + γ)2(2 + γ2)2(γ − ∆)
− 2(5 + 3γ)(8 + γ2)2[2 + γ(5 + γ) − (5 + 3γ)∆]
}
> 0 , ∀γ ∈ (0, 1) (3.28)

àáã. NO REGULATION 166
Remark 3.1. If the competitor is sufficiently more efficient, ∆ > ∆P U , than
the equilibrium downstream price of the vertically integrated firm is such that
the PU-effect outweighs the DRC-effect, leading to an increase of its down-
stream price.
As for the integrated firm’s downstream quantities and profits, consider
first ∆ > ∆P U . The difference in quantities yields:
QI(∆) ≡ qBI − q∗
I =16(1 + γ) − γ2(10 + 2γ − 3γ2 − γ3) − ∆[4(4 + γ) − γ2(2 − 5γ − γ2)]
4(3 + γ)(1 − γ2)(8 + γ2)
(3.33)
Evaluated at ∆ = ∆P U , the above yields:
QI(∆ = ∆P U) = − γ2(4 + γ)
4(1 + γ)[8 − γ(6 + γ)]
< 0 , ∀γ ∈ (0, 0.71)
Since the marginal effect of ∆ on QI(∆) is strictly negative, it follows that the
more efficient the competitor is, the more a ban on margin squeeze induces the
integrated firm’s output to contract.20
ïßòßóæêly for profits:
ΠI(∆) ≡ πBI − π∗
I =1
8
{(2 + γ + ∆)2
(1 + γ)(3 + γ)
+2[3γ2 + γ4 + 8γ∆ − 4(2 + ∆2)]
8 − γ2(7 + γ2)
}(3.35)
20 The marginal effect of ∆ on QI(∆) is
∂QI(∆)
∂∆=
16 + γ{4 − γ[2 − γ(5 + γ)]}4(3 + γ)(1 − γ2)(8 + γ2)
< 0 , ∀γ ∈ (0, 1) (3.34)

àáã. NO REGULATION 167
and
ΠI(∆ = ∆P U) = −(1 − γ)γ2(4 + γ)(4 + 7γ)
8(1 + γ)[8 − γ(6 + γ)]2
< 0 , ∀γ ∈ (0, 1) (3.36)
Since, the marginal impact of ∆ on ΠI(∆) is negative, the following can be
stated:21
ÿP��osition 3.4. Suppose the unintegrated downstream competitor is suffi-
ciently more efficient. A ban on margin squeeze fosters the competitor’s profits
via the DRC-effect, whereas it harms to vertically integrated firm via the PU-
effect.
In contrast, suppose the unintegrated competitor is only “a bit” more effi-
cient, i.e. ∆P U > ∆ > ∆. It can be shown that the vertically integrated firm’s
quantities nor profits necessarily decrease, since the vertically integrated does
not incur a price umbrella.
Evaluating QI(∆) at ∆ = ∆ shows that the variation in quantities is not
always strictly negative:
QI(∆ = ∆) =(1 − γ)γ(8 + γ(6 + γ))
8(4 − γ)(1 + γ)(3 + γ)
> 0 , ∀γ ∈ (0, 1) (3.37)
21 The marginal effect of ∆ on ΠI(∆) is
∂ΠI(∆)
∂∆=
1
8(1 + γ)
[ 16(γ − ∆
(1 − γ)(8 + γ2)+
2(2 + γ + ∆)
3 + γ
]
< 0 , ∀∆ <16(1 + γ) + (1 − γ)γ2(2 + γ)
16(1 + γ − γ2(1 − γ)
Note that, 16(1+γ)+(1−γ)γ2(2+γ)16(1+γ−γ2(1−γ) < ∆, ∀γ ∈ (0, 1).

àáã. NO REGULATION 168
Therefore, it exists a threshold of ∆ that determines the impact on QI :
QI > 0
∆ ∈ [∆,16(1 + γ) − γ2[10 + γ(2 − 3γ − γ2)]
4(4 + γ) − γ2(2 − 5γ − γ2)] (3.38)
Similarly for the integrated firm’s profits:
ΠI(∆ = ∆) =(1 − γ)2γ2(4 + γ)2
32(4 − γ)2(1 + γ)(3 + γ)
> 0 , ∀γ ∈ (0, 1) (3.39)
and finally
ΠI > 0
∆ ∈[∆,
16(1 + γ) + γ2 (2 − γ − γ2)
16(1 + γ) − γ2(1 − γ)+
√2
√√√√(1 − γ)2γ2(1 + γ)(3 + γ) (8 + γ2)
(16(1 + γ) − γ2(1 − γ))2
]
(3.40)
Therefore,
Proposition 3.5. Suppose that the unintegrated downstream competitor is “a
bit” more efficient than the vertically integrated firm. Enforcing competition
law induces beneficial effect for both the vertically integrated and the uninte-
grated firm.
Fig. 3.2 çèÜßéÞs the different combinations of ∆ and γ and the associated
regions where a price umbrella occurs or the incumbent withdraws from the
retail market.
The preceding discussion above has important policy implications. First,
enforcing competition law by requiring the vertically integrated firm to meet
the EEO-rule benefits the competitor. Moreover, recall that a margin squeeze
arises as a by-product of competitive interaction between a vertically integrated

àáã. NO REGULATION 169
0.0 0.2 0.4 0.6 0.8 1.0
0.0
0.5
1.0
1.5
2.0
2.5
3.0
Γ
D
Price Umbrella
No Price Umbrella
Vertically integrated firm
withdraws
DPU
�
D��
DI
B¬
ùúû´ ·´¶ This figure shows the different combinations of ∆ and γ for which firmI withdraws and where its price incurs a price umbrella.
firm and a relatively more efficient downstream competitor. The downstream
pricing scheme may by exploitative, but despite the exploitation of upstream
market power, there is neither exclusionary conduct nor intent to monopolise
the downstream market. Competition authorities should therefore be care-
ful when it comes to evaluate possible anti-competitive behavior in vertically
related markets so as not to turn down any possible pro-competitive behavior.
This becomes even more essential when the integrated firm’s participation
constraint is considered. In effect, a ban induces the latter to withdraw from
the downstream market for less strong condition than in “free competition”
setting. In fact, the downstream output of the vertically integrated firm is

àáã. NO REGULATION 170
negative whenever:
qBI < 0 ⇔ 8 + γ(1 − γ)(4 + γ)
2 + 5γ(5 + γ)≡ ∆B
I (3.41)
Then, comparing equations (3.41â and (3.14â yields:
∆BI − ∆∗
I < 0
(γ − 1)(1 + γ)(2 + γ)[8 − γ
(8 − γ(3 + γ)
)]
6γ[2 + γ(5 + γ)
] ≤ 0 ∀γ ∈ (0, 1) (3.42)
The explanation for this result is as follows. Recall from the “free competition”
setting, that the more the competitor is efficient compared to the integrated
firm, the stronger the competitive pressure exerted and thus the smaller the
integrated firm’s output.22 ïßëéè æ òæêìßë åSÝèè�è öæë òæ� ßëçÝéè æ Üêßéè
umbrella on the integrated firm’s downstream price and a contraction of the
latter’s output in the downstream market, the competitive pressure is arti-
ficially amplified. The integrated firm is then left with a reduced scope to
compete against its rival. Although it should be recalled that the exclusion of
a less efficient firm is not a policy problem per se, artificially enhancing the
competitiveness in such an asymmetric fashion must be outweighed with the
possible loss in variety in the consumers’ choice.
3.4.3 Welfare analysis
Hitherto, this section has analysed of the impacts of competition law enforce-
ment when upstream market are not regulated. It concludes by presenting the
impacts on consumer surplus and social welfare. Social welfare is measured
by the sum of consumer surplus and industry profits and, using the utility
22 To see this, ∂q∗
I
∂∆ = − 3γ(1−γ)(1+γ)(8+γ2) .

àáã. NO REGULATION 171
function (3.1â, yields:
W (qI , qC) = U + πI + πC
= qI + ∆ qC − 1
2(qI + qC)2 + (1 − γ) qI qC (3.43)
Therefore, the following can be stated:
Proposition 3.6. In an unregulated vertically related industry, where an up-
stream monopolist competes in the downstream market with an unintegrated
firm, a ban on margin squeeze
i) increases the industry profits,
ii) increases consumer surplus,
iii) increases social welfare
Proof. All proofs are contained in appendix A.3.1á
This is explained as follows. Note first that pC always decreases when a
ban implemented. If pI decreases, consumer welfare unambiguously must in-
crease since pC always decreases. Furthermore, the competitor’s profits always
increase more than the firm I ’s profits (possibly) decrease, leading thus to
increased industry profits.
Consider next the situation with a price umbrella on the integrated firm’s
downstream price. As is shown in the appendix, the competitor’s price de-
creases more than the integrated firm’s price increases and the competitor’s
quantities increase more than the integrated firm’s decrease. Hence, there is
more output sold at a lower price (more of the competitor’s output qBC at the
lower price pBC). Thus, total consumer surplus increases, even though the re-
maining consumers of firm I enjoy a lower surplus. As for firms’ profits, it
can be shown that industry profits increase as well. Finally, with increasing
consumer surplus and industry profits, social welfare increases.
The next step of the analysis of the interaction between sector-specific

àá3. UPSTREAM MARKET REGULATION 172
regulation and competition law involves the introduction of upstream market
price regulation. Therefore, the next section reruns the precedent analysis
by integrating an exogenous regulator that sets a price cap on the vertically
integrated firm’s upstream price.
3.5 Equilibria with upstream market regulation
Upstream market regulation is a common characteristic of many utility in-
dustries like railways, electricity, water or telecommunications. A common
point of these industries is that an essential facility is involved, which prior
the liberalisation process during the 1990’s belonged to former legal monop-
olies. Ever since this process was accomplished, the essential infrastructure
has been under the scrutiny of a private company. However, the essentiality
of these infrastructures, the economic unfeasibility of duplication and the aim
to induce a competitive environment in these industries pushed governments
to assign NRAs to regulate, among others, the access to the infrastructure.23
WßÞhout such intervention, the public authorities considered the establishment
of competition jeopardised, as any downstream competitor that does not own
such an infrastructure would be unable to provide a downstream product.
The analysis first considers regulation as stand-alone policy (i.e. without
banning a margin squeeze) and then introduces competition law enforcement.
Note that regulation as stand-alone policy represents the US way of dealing
with margin squeeze case, whereas the joint implementation of sector-specific
regulation and competition law enforcement is akin to the EU approach.
23 the judgement by the European General Court in TeliaSonera weakened the charac-teristic of essentiality of the upstream good. Indeed, essentiality is no longer required atthe upstream level of the industry. The sole fact of holding a dominant position suffices forintervention.

àá3. UPSTREAM MARKET REGULATION 173
3.5.1 Regulation as stand-alone policy
The essential facility is the bottleneck input produced by the vertically inte-
grated firm in the upstream segment of the industry, which, in the remaining
analysis, is now regulated. In particular, it is assumed that a NRA exogenously
sets a price cap, denoted w, that the integrated firm is not allowed to exceed.
The most plausible range of w is [0, wM ], where wM = ∆2
represents the
monopoly upstream price, would the integrated firm not be active in the down-
stream market.24 þñè ÜêîTÞ�òæ�ßòßåßëì ÝÜåÞêèæò Üêßéè w∗ lies in between
these two boundaries and upstream market regulation is said to be constrain-
ing whenever w is set below w∗. This case will be the only one analysed in what
follows, as regulation that does not constrain the integrated firm’s upstream
pricing behavior is exactly equivalent to the analysis in section 3.4á þñèêèíîêèð
focus is laid on w ∈ [0, w∗).
Exogenous (and constraining) upstream market regulation implies that the
first stage of the game (the upstream price setting stage) disappears. Down-
stream price competition yields the same equilibrium expressions as in section
3.4.1ð ëæòèó� èSÝæÞßîëå (3.6aâ and (3.6bâ:
p∗I(w) = cI + w +
2 − γ2 − γ∆ − w(1 − γ)(4 + γ)
4 − γ2(3.44a)
p∗C(w) = cC + w +
(2 − γ2)∆ − γ − 2w(1 − γ2)
4 − γ2(3.44b)
A first thing to notice is the pro-competitive effect of upstream market regula-
tion on both prices. Because the upstream price is still merely a downstream
cost factor, a reduction of w induces downstream prices to decrease.
When applying the EEO-rule to the integrated firm’s price, it should be
24 If the integrated firm was not active in the downstream market (and thus be apure upstream monopolist), the competitor would face the following maximisation problem:maxpC
[(pC − cC − w)qC ], where qC = (αC − pC). This yields: pC(w) = (w + αC + cC)/2.Then, substituting this into qC , the upstream monopoly maximises maxw[w(αC −cC −w)/2,which, given that ∆ = αC − cC (recall that αI − cI = 1) leads to wM = ∆/2.

àá3. UPSTREAM MARKET REGULATION 174
recalled that the EEO-rule essentially tests whether the integrated firm’s down-
stream price-cost mark-up is positive would it have to buy the upstream good
at the same price charged to its competitor. It then follows that, using equation
(3.44aâ, the integrated firm’s downstream price-cost mark-up is
mRI (∆, w) =
2 − γ2 − γ∆ − w(1 − γ)(4 + γ)
4 − γ2(3.45)
. Hence, the EEO-test is equivalent to mRI T 0 and is no longer satisfied
whenever:
mRI < 0 ⇔ ∆ >
2 − w(1 − γ)(4 + γ) − γ2
γ≡ ∆R (3.46)
Moreover, due to concavity in w of its profit function, the integrated firm
will not undercut a constraining price cap. Rather, it seeks to be as near as
possible the profit-maximising level of w. As the upstream price charged to
the competitor is now the regulated price cap, it then follows that
∆R ∈(∆,
2 − γ2
γ
]if w ∈ [0, w∗) (3.47)
Note that ∆ ≤ 2−γ2
γ, ∀γ ∈ (0, 1) and w ≥ 0, with equality at w = 0. Thus,
as represented in Fig 3.3ð æë upward shift of ∆R is observed as the price cap
becomes tighter.
To understand this upward shift, note that the margin mRI is a decreasing
function of the upstream price, meaning that a decrease of the upstream price
(through regulatory intervention) implies an increase of the margin.25 Hèëéèð
whenever the competitor’s downstream efficiency is such that the integrated
firm’s downstream price entails a margin squeeze, i.e. a negative downstream
price-cost mark-up, a tighter price cap on the upstream price increases the
25 Indeed, ∂mRI
∂w= − (1−γ)(4+γ)
4−γ2 < 0.

àá3. UPSTREAM MARKET REGULATION 175
mark-up and therefore reduces the extent of a margin squeeze. Finally, since
the threshold ∆R is derived from mRI , a similar reasoning regarding the impact
of a marginal decrease of w applies to ∆R: the lower the price cap, the higher
∆R, as represented on figure 3.3á
With this finding, a common characteristic of essential facility regulation
applies. Market regulation is set up with the aim to lessen the ability to exploit
market power. This is in essence what happens here: by setting a tighter price
cap on the upstream price, the NRA narrows the integrated firm’s channel for
rent extraction on the upstream market.
A commonly known idea of upstream market regulation in a vertically
related industry is linked precisely this diminishing of rent extraction: tightly
regulating an integrated upstream monopolist may increase its incentive for
predatory pricing in the downstream market.26 þñè êèåÝóÞ ÜêèåèëÞèç æöîøè ßå
somehow at odds with this idea, because the extent of the negative mark-up
is closely linked to the regulatory strength: below-cost pricing only appears if
the price cap w is sufficiently high.
The reason is as follows. First, recall from proposition 3.1ð ÷ñßéñ ßå æÜ�
plicable at the highest possible price cap (this is, w = w∗), that a margin
squeeze arises whenever the competitor is more efficient. Moreover, the higher
efficiency of the competitor exerts a competitive pressure on the integrated
firm’s downstream price.27 ïèéîëçó�ð Þñè ÞßìñÞèê Þñè Üêßéè éæÜð Þñè óî÷èê Þñè
rents extracted from the competitor. Combining these two effects may thus
induce the integrated firm not to undercut its costs by setting a negative mar-
gin, as this would only further depress its aggregate profits. Furthermore, as
has been mentioned in discussing proposition 3.1ð æ òîêè è,éßèëÞ éîòÜèÞßÞîê
will not withdraw from the market, despite facing a margin squeeze. The inte-
grated firm is therefore in the impossibility to use its pricing strategy for any
26 See for instance Biglaiser and DeGraba (2001) �� González (2006)�27 See equation (3.8aâ.

àá3. UPSTREAM MARKET REGULATION 176
exclusionary conduct with sacrificing to much of its revenue.
Turn next to the downstream participation constraint of the integrated
firm. Similar to the “free competition” setting, the integrated firm will remain
in the downstream market as long as its output is positive:
qRI (wR) > 0 ⇔ 2 − γ2 − γ∆ − γ(1 − γ2)wR
(1 − γ2)(4 − γ2)
⇒ ∆ <2 − γ2 − γ(1 − γ2)wR
γ≡ ∆R
I (3.48)
This expression depends negatively on the upstream price, meaning that the
tighter the price cap, the more ∆RI shifts upwards.28 Hèëéèð ÞßìñÞèê ÝÜåÞêèæò
market regulation translates into higher output of the integrated firm. Regula-
tion may therefore have a positive impact because the integrated firm “delays”
its decision to withdraw from the retail market.
The effects of constraining regulation on the market outcome can be sum-
marised as follows:
Proposition 3.7. Constraining regulation i) reduces both downstream prices,
ii) reduce the scope for margin squeeze and iii) loosens the downstream partic-
ipation constraint of the integrated firm.
Before turning to the introduction of competition law enforcement via a
ban on margin squeeze, it is important to determine the relevant parameter
space (∆, γ) for this analysis. More specifically, ∆R and ∆RI define that space,
as they characterise a duopolistic market with a violated EEO-rule. This is of
importance, because a ban on margin squeeze is only relevant when there i) ac-
tually is a margin squeeze and ii) when both firms are active in the downstream
market. Therefore,
Lemma 3.3. If the upstream market regulation is constraining, a ban on
28 This is, ∆RI
∂wR
= −(1 − γ2) < 0, ∀γ ∈ (0, 1).

àá3. UPSTREAM MARKET REGULATION 177
margin squeeze is only binding whenever ∆ ∈ [∆R, ∆RI ] and for any value
of γ ∈ (0, 1).
As the discussion above explained, both thresholds ∆R and ∆RI shift up-
wards when the price cap becomes tighter and the upward shift of ∆R is
stronger:
∂∆R
∂wR= −(1 − γ)(4 + γ)
γ> −(1 − γ) =
∂∆RI
∂wR,∀γ ∈ (0, 1) (3.49)
Consequently, the relevant parameter space shrinks as the price cap becomes
tighter, as is depicted on Fig. 3.3 öèóî÷á bßëæóó�ð ßÞ åñîÝóç öè ëîÞèç ÞñæÞ æÞ
strict cost-oriented regulation with w = 0, ∆R = ∆RI , meaning that any scope
for a ban on margin squeeze in the present duopolistic setting has vanished.
The analysis turns now to the setting where upstream market regulation
is combined with a ban on margin squeeze. This setting is representative
for the EU approach. It is applicable to most public utility industries. For
instance, whenever an incumbent telecom operator commercialises a new offer
based on a price-regulated infrastructure (e.g. the copper network), it has to
ensure that alternative operators are able to replicate this new offer based on
the incumbent’s upstream offer. The next section analyses changes in market
outcomes in such a setting.
3.5.2 Competition law enforcement
This section considers the combination of upstream market regulation and
competition law enforcement.
The equilibrium in the downstream price setting stage is the same as in

àá3. UPSTREAM MARKET REGULATION 178
0.0 0.2 0.4 0.6 0.8 1.0
0.0
0.5
1.0
1.5
2.0
2.5
3.0
Γ
D
D�R�
DI
B®
� wR = w∗
0.0 0.2 0.4 0.6 0.8 1.0
0.0
0.5
1.0
1.5
2.0
2.5
3.0
Γ
D
D�R
�
DI
B®
�� 0 < wR < w∗
Fig. 3.3 The shaded areas depicted the combinations of ∆ and γ for which bothfirms are active in the downstream market and the EEO-requirement is not met.Banning a margin squeeze is only a relevant policy in these areas.
section 3.4.2:
pRBI (w) = cI + ¯w (3.50a)
pRBC (w) = cC + ¯w +
∆ − γ − ¯w(1 − γ)
2(3.50b)

àá3. UPSTREAM MARKET REGULATION 179
Similarly, to the unregulated setting, the vertically integrated firm would
ideally charge a smaller upstream price. The DRC-effect would thus still be
at play in the regulated setting. However, for regulation to be binding, the
price cap must be below the integrated firm’s optimal upstream price. Hence,
price cap regulation is constraining when ¯w ∈ [0, wB), where ¯w denotes the
exogenous price cap in the present setting.29
IÞ ßå ßòÜîêÞæëÞ Þî êèéæóó ÞñæÞ Þñè ÝÜåÞêèæò Üêßéè wB the integrated firm
would ideally set when it has to meet the EEO-rule is lower than w∗ from
the “free competition” setting (see proposition 3.2Úá þñßå ßå ßòÜîêÞæëÞ íîê Þñè
assessment of impacts induced by a ban on margin squeeze when the upstream
market is regulated. In effect, any price cap above in between wB but below
w∗ is constraining in the regulation-only setting, but not in the regulation &
ban setting. Thus, for the sake of consistency, the remaining analysis uses wB
as reference for regulation to be constraining.
As has been the case in the previous subsection 3.5.1ð ÝÜåÞêèæò òæêýèÞ êèì�
ulation has a pro-competitive effect on the downstream prices. Although, due
to the ban, the integrated firm’s downstream price also involves a PU-effect.
And, as it turns out, regarding the competitor’s price, the domination of the
PU-effect over the pro-competitive effect of regulation can longer be excluded.
Indeed, calculating the difference between the competitor’s prices from the reg-
ulation & ban setting (equation (3.50bâ) and from the regulation-only setting
(equation (3.44bâ), it appears that the PU-effect may dominate whenever the
competitor’s downstream efficiency index ∆ lies within the parameter range
stated in lemma 3.3á
To be precise, from the competitor’s price difference, it is possible to derive
a threshold of ∆ such that the price with a ban, pRBC is higher than pR
C , i.e the
29 As in regulation-only setting, only constraining regulation is considered, as, otherwise,the analysis would yield exactly the same outcome as in a unregulated environment with amargin squeeze ban.

àá3. UPSTREAM MARKET REGULATION 180
price without a ban:
pRBC − pR
C > 0
⇔ γ[γ(γ + ∆) − 2 + ¯w(1 − γ)(4 + γ)]
2(4 − γ2)> 0
⇒ ∆ >2 − ¯w(1 − γ)(4 + γ) − γ2
γ= ∆R (3.51)
It thus turns out that the competitor’s price always increases whenever the
EEO-rule would be binding. This stems from the fact that an unregulated up-
stream price constitutes an optimal balance between upstream demand stim-
ulation and downstream pricing discipline. With an exogenous price cap how-
ever, this balance is not sufficiently accounted for. Moreover, an exogenous
price cap does not account for the competitor’s higher downstream efficiency
∆. To see this, suppose the price cap ¯w to be a proportion ε ∈ [0, 1) of the
integrated firm’s preferred upstream price, i.e. ¯w = εwB = ε(
2+γ+∆2(3+γ)
). ε rep-
resents the regulatory strength, where price cap regulation is tighter when ε
approaches 0. The unintegrated competitor’s downstream prices with ban,
pRBC , and without ban pR
C would then yield:
pRBC ( ¯w = εwB) = cC + εwB +
∆ − γ − εwB(1 − γ)
2
= cC + ε(2 + γ + ∆
2(3 + γ)
)+
∆ − γ − ε(
2+γ+∆2(3+γ)
)(1 − γ)
2
= cC +∆[6 + ε + γ(2 + ε)] + (1 + γ)τ − Γ
4(3 + γ)(3.52)
pRC( ¯w = εwB) = cC + εwB +
(2 − γ2)∆ − γ − 2εwB(1 − γ2)
4 − γ2
= cC + ε(2 + γ + ∆
2(3 + γ)
)+
(2 − γ2)∆ − γ − 2ε(
2+γ+∆2(3+γ)
)(1 − γ2)
4 − γ2
= cC +∆[2(3 + γ)(2 − γ2) + (2 + γ2)ǫ] + (2 + γ2)τ − Γ
2(2 − γ)(2 + γ)(3 + γ)
(3.53)

àá3. UPSTREAM MARKET REGULATION 181
expression where τ = (2 + γ)ε and Γ = 2γ(3 + γ). Then, a marginal increase
in ∆ shows up more important when a ban on margin squeeze is implemented.
Indeed, ∀γ ∈ (0, 1) and ∀ε ∈ [0, 1):
∂pRBC ( ¯w = εwB)
∂∆− ∂pR
C( ¯w = εwB)
∂∆> 0
⇔6 + ε + γ(2 + ε)
4(3 + γ)− 2(3 + γ)(2 − γ2) + (2 + γ2)ǫ
2(2 − γ)(2 + γ)(3 + γ)> 0
⇒γ[γ(3 + γ)(2 − ε) + 4ε]
4(2 − γ)(2 + γ)(3 + γ)> 0 (3.54)
It then follows that, whenever the EEO-requirement is to be fulfilled (i.e.
∆ ∈ [∆R, ∆RI ]), the unintegrated competitor’s downstream price increases
more with its downstream efficiency, because only a proportion equal to ε
∆ is incorporated in the regulated upstream price. The PU-effect outweighs
the pro-competitive effect and the competitor is able to extract higher rents
from consumers.
Both results above also apply to the vertically integrated firm’s downstream
price. Its price difference increases whenever ∆ > ∆:
pRBI − pR
I > 0
⇔γ
(γ + ∆
)+ ¯w(1 − γ)(4 + γ) − 2
4 − γ2> 0
⇒∆ >2 − ¯w(1 − γ)(4 + γ) − γ2
γ= ∆R (3.55)
And, similarly to the calculations for the competitor, using ¯w = εwB shows
that a ban implies a higher price increase when ∆ increases. Plugging ¯w =
εwB = ε(
2+γ+∆2(3+γ)
)into (3.50aâ and (3.44aâ yields:
pRBI ( ¯w = εwB) = cI + ε
(2 + γ + ∆)
2(3 + γ)(3.56a)
pRI ( ¯w = εwB) = cI +
2(3 + γ)(2 − γ2) + 3γτ − γ∆(2(3 + γ) − 3ε)
2(2 − γ)(2 + γ)(3 + γ)(3.56b)

àá3. UPSTREAM MARKET REGULATION 182
and the difference is equal to
pRBI − pR
I =ε(2 + γ + ∆)(1 − γ)(4 + γ) − 2(3 + γ)[2 − γ(γ + ∆)]
2(3 + γ)(4 − γ2)(3.56c)
Then, a marginal increase in ∆ increases that the difference in prices given
by (3.56câ:
∂pRBI ( ¯w = εwB)
∂∆− ∂pR
I ( ¯w = εwB)
∂∆> 0 (3.57)
⇔ ε
2(3 + γ)−
{− γ[2(3 + γ) − 3ε]
2(2 − γ)(2 + γ)(3 + γ)> 0
}
⇒ γ(3 + γ)(2 − ε) + 4ε
2(2 − γ)(2 + γ)(3 + γ)> 0 , ∀γ ∈ (0, 1) and ∀ε ∈ [0, 1) (3.58)
An important insight becomes thus clear when the unregulated setting is
compared to the regulated one: the pro-competitive effect of competition law
enforcement absent upstream market regulation disappears. The mere effect of
a ban when the upstream market is regulated is to shift the ability to extract
rents from the upstream market (absent regulation, the monopolist extracted
rents from its competitor) to the downstream market where both firms extract
higher rents from consumers.
3.5.3 Welfare analysis
The implications for consumer surplus are evident. With higher prices to pay,
consumers are worse off when the EEO-requirement is binding with constrain-
ing upstream market regulation.
As for the firms’ profits, the relatively more efficient competitor always
earns higher revenues, leading to a profit increase. For the integrated firm,
the impact goes in the other direction. The latter’s profits always decrease.
Altogether, the impact on industry profits is less clear-cut. Only when prod-
uct differentiation is sufficiently strong, the competitor’s profit increase may

àá3. UPSTREAM MARKET REGULATION 183
outweigh the integrated firm’s losses.
The impact on social welfare is equally ambiguous. With an ever decreasing
consumer surplus, the increase of industry profits must be sufficiently high for
social welfare to increase. However, a decrease of social welfare can not be
excluded. Moreover, if social welfare increases in the presence of a ban on
margin squeeze, it will be to the detriment of consumers.
Therefore,
Proposition 3.8. Suppose the upstream market is exogenously regulated and
∆ ∈ [∆, ∆RI ]. A ban on margin squeeze
i) has a downstream competition softening effect via by the price umbrella,
ii) increases the competitor’s profits,
iii) decreases the integrated firm’s profits,
iv) decrases the industry output,
v) is likely decreases consumer surplus,
vi) has an ambiguous effect on industry profits and social welfare.
Proof. See appendix A.3.2á
Finally, expressions (3.51â and (3.55â showed that the price umbrella occurs
whenever a ban on margin squeeze is a potential option, i.e. ∆ ≥ ∆. Thus, the
same analysis of increasing regulatory strength applies. It has been discussed
below lemma 3.3: æ ÞßìñÞ Üêßéè éæÜ êèìÝóæÞßîë êèçÝéèå Þñè ÜæêæòèÞèê åÜæéè
where a margin squeeze occurs. Hence, a tighter price cap also reduces the
parameter space for the price umbrella to appear.
From the discussion above arises the question about what good a ban on
margin squeeze brings when the upstream market is regulated. Indeed, since
the mere effect of a ban is to shift rent extraction from one segment of the
industry to the other and its social desirability is challenged, it is question-
able whether a ban is actually necessary. Turned otherwise, this becomes “Is

àá . DISCUSSION AND CONCLUSION 184
upstream market regulation as stand-alone policy not sufficient?”, a question
that falls back to the comparison of the EU approach to the US approach. The
next section discusses the results above in order to reply to that question.
3.6 Discussion and conclusion
The debate on the complementarity or substitutability of market regulation
and competition law is vivid and mainly two opposing views exist. Whereas
the US are reluctant towards the application of competition law in a regulated
industry, the EU clearly considers that the market risks to function improperly
without competition law enforcement.
This chapter considered a duopoly in a vertically related industry in order
to assess the economic impacts on the outcome in either view by focussing on
the case of margin squeeze. It highlights the strength of regulation as stand-
alone policy, which appears to be a means sufficiently strong to annul any
margin squeeze threat. Moreover, since tighter regulation reduces the welfare
detrimental impact induced by competition law enforcement, a ban on margin
squeeze appears unnecessary and not desirable from a social welfare point
of view. Indeed, following the analysis, the pro-competitive effect of tighter
regulation are passed on to consumers with lower prices to be paid and more
output available.
The joint implementation of regulation and margin squeeze ban induces at
least one clearly loosing party: the consumers. Now, put into to context of
protection of the proper functioning of the market and ultimately consumers,
the EU approach is likely to miss its goal.
A margin squeeze may well appear as exploitation of market power, but
it also has a pro-competitive side. Due to vertical integration, the upstream
monopolist’s optimal pricing scheme may lead to a negative margin. However,
this exploitative margin squeeze can also be seen as a means to discipline more

àá . DISCUSSION AND CONCLUSION 185
efficient downstream competitors without, as is the case in setting analysed
here, excluding them. Indeed, strategic complementarity between downstream
prices would imply that both prices remain lower, which is undeniably benefi-
cial for consumers.
The conclusion of the present analysis is thus quite clear. The relation
between upstream market regulation and competition law enforcement should
be considered as one of substitution. Therefore, when market regulation is
set up in one level of the industry, authorities should consider to refrain from
regulating other levels. This holds for either form of regulation, whether bot-
tleneck access regulation or margin squeeze regulation: absent regulation, ban
on margin squeeze induced higher social welfare, whereas it yields an uncertain
outcome in a regulated environment.
There are however limits to the analysis presented here. For instance,
vertically related industries are often composed of more than two downstream
firms. A more competitive setting may be of interest as higher competitive
pressure could reduce the possibility to extract higher rents in a regulation
& ban setting, which may thus lead to different outcomes. The intuitions
are not clear-cut as the results will also depend on several parameters such
as downstream efficiency and product differentiation. In order to avoid false
positive, a rigorous analysis on that subject is called for.
Furthermore, important questions about investment incentives must be
looked into. It is not clear whether regulation & ban favours the upstream
investment of unintegrated competitors or not. At first sight, given the in-
crease in the latter’s profits, the intuition says it would so. But, anticipating
a possible decrease of regulatory strength, provided that upstream market be-
comes more competitive, may impede such upstream investment. Also, how
do the investment incentives of the vertically integrated firm change and how
does it react towards possible investment by downstream competitors? These

àá . DISCUSSION AND CONCLUSION 186
and other unanswered questions are possible avenues for further research.

B�����������
Beard T. R., Kaserman D. L., Mayo J. W., (2003). On the impotence of
imputation, Telecommunications Policy, 27, 585-595.
Biglaiser G., DeGraba P., (2001). Downstream integration by a bottleneck in-
put supplier whose regulated wholesale prices are above costs, RAND Jour-
nal of Economics, 32(2), 302-315.
Bouckaert J., Verboven F., (2004). Price Squeeze in a Regulatory Environment,
Journal of Regulatory Economics, 26(3), 321-351. DOI: 10.1007/s11149-004-
7554-3.
Briglauer W., Götz G., Schwarz A., (2011b). Margin Squeeze in Fixed-Network
Telephony Markets - Competitive or Anticompetitive?, Review of Network
Economics 10(4). DOI: 10.2202/1446-9022.1257.
Carlton D. W., (2008). Should Price Squeeze be a Recognized Form of An-
ticompetitive Conduct?, Journal of Competition Law and Economics, 4(2),
271-278. DOI:10.1093/joclec/nhn012.
Choné P., Komly B., Meunier V., (2010). Margin Squeeze, entry and "umbrella
effect, Mimeo.
Economides N., (1998). The incentive for non-price discrimination by an input
monopolist, International Journal of Industrial Economics 16(3), 271-284.
http://dx.doi.org/10.1016/S0167-7187(98)00005-8á
187
ôIô�I�����H� �
European Commission, (1998). Notice on the Application of the Competition
Rules to Access Agreements in the Telecommunications Sector, 98/C: 265/02
(also in Official Journal C 265, 22/08/1998:2-28). Available hereá
European Commission, (2009). Communication form the Commission - Guid-
ance on the Commission’s enforcement priorities in applying Article 82 of
the EC Treaty to abusive exclusionary conduct by dominant undertakings,
C 45/7 (also in Official Journal 2009/C 045/02). Available hereá
Ginsburg D. H., (2008). Judge Bork, consumer welfare, and antitrust law,
Harvard Journal of Law and Public Policy, 31(5), 449-454.
Gonzáles A., (2006). Antitrust and regulation, complements or substitutes?
The case of a vertically integrated firm. Avalaible hereá
Hastings J. S., Gilbert R. J., (2005). Market power, vertical integration and the
wholesale price of gasoline, Journal of Industrial Economics, 53(4), 469-492.
DOI:10.1111/j.1467-6451.2005.00266.x.
Hay G., McMahon K., (2012). The diverging approach to price squeeze in the
US and the EU, Journal of Competition Law & Economics, 8(2), 259-296.
Häckner J., (2000). A note on price and quantity competition in differentiated
oligopolies, Journal of Economic Theory, 93(2), 233-239. http://dx.doi.
org/10.1006/jeth.2000.2654á
Jaunaux L., Lebourges M., (2013), Economic Replicability Tests for Next-
Generation Access Networks. Available here
JÝóóßèë B., Rey P., Saavedra C., (2013). The Economics of Margin Squeeze,
IDEI Report. Available hereá
OFCOM, (2013). Final Decision of The Office of Communications,
CW/988/06/08: Complaint from THUS plc and Gamma Telecom Lim-
ôIô�I�����H� � !
ited against BT about alleged margin squeeze in Wholesale Calls pricing,
20/06/2013. Available hereá
Salop S. C., Scheffman D. T., (1983). Raising Rivals’ Costs. American Eco-
nomic Review, 73(2), 267-271.
Sibley D. S., Weisman D. L., (1998). Raising Rivals’ Costs: The entry of an
upstream monopolist into downstream markets, Information Economics and
Policy, 451-470. http://dx.doi.org/10.1016/S0167-6245(98)00012-2á
Sidak G., (2008). Abolishing the Price Squeeze as a Theory of Antitrust Lia-
bility, Journal of Competition Law and Economics, 4(2), 279-309. Available
hereá
Singh N., Vives X., (1984). Price and Quantity Competition in a Differentiated
Duopoly, The Rand Journal of Economics, 15(4), 546-554.
Zanchettin P., (2006). Differentiated Duopoly with Asymmetric Costs,
Journal of Economics and Management Strategy, 15(4), 999-1015. DOI:
10.1111/j.1530-9134.2006.00125.x.
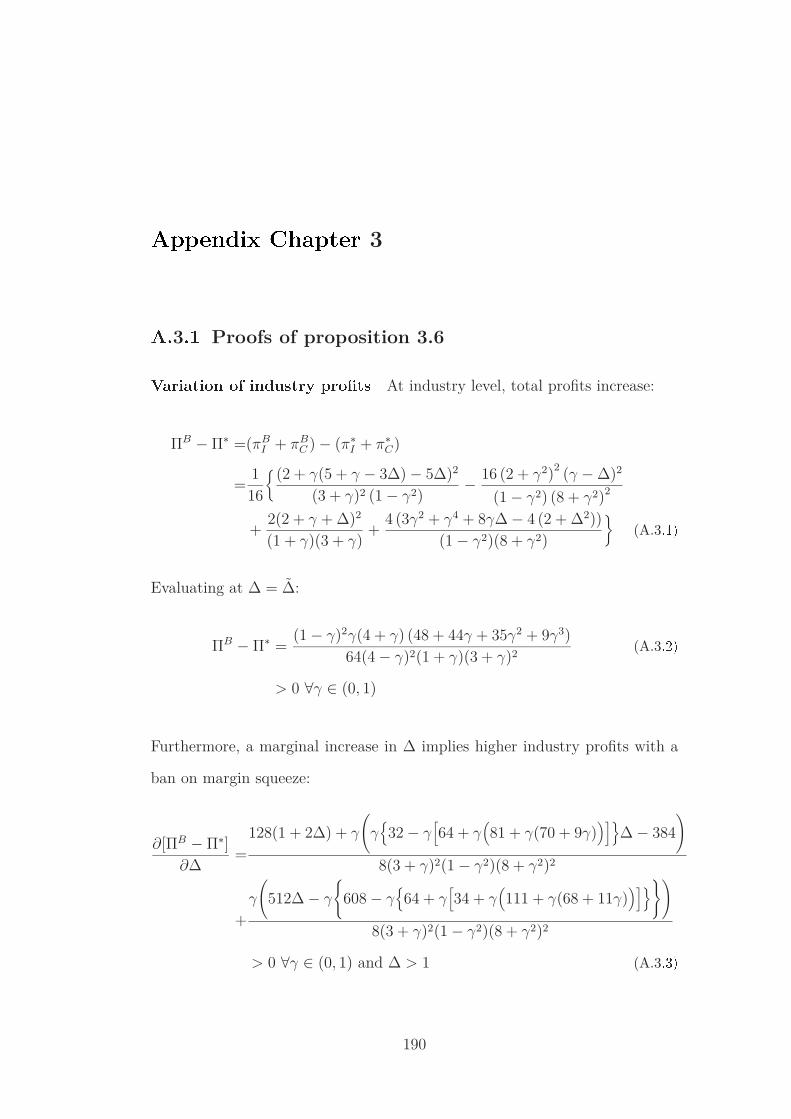
A��"#$�% &���'"� 3
*+3+. Proofs of proposition 3.6
V-P/-0/�1 �2 /14560P7 �P�806 At industry level, total profits increase:
ΠB − Π∗ =(πBI + πB
C ) − (π∗I + π∗
C)
=1
16
{(2 + γ(5 + γ − 3∆) − 5∆)2
(3 + γ)2 (1 − γ2)− 16 (2 + γ2)
2(γ − ∆)2
(1 − γ2) (8 + γ2)2
+2(2 + γ + ∆)2
(1 + γ)(3 + γ)+
4 (3γ2 + γ4 + 8γ∆ − 4 (2 + ∆2))
(1 − γ2)(8 + γ2)
}(A.39;â
Evaluating at ∆ = ∆:
ΠB − Π∗ =(1 − γ)2γ(4 + γ) (48 + 44γ + 35γ2 + 9γ3)
64(4 − γ)2(1 + γ)(3 + γ)2(A.39<â
> 0 ∀γ ∈ (0, 1)
Furthermore, a marginal increase in ∆ implies higher industry profits with a
ban on margin squeeze:
∂[ΠB − Π∗]
∂∆=
128(1 + 2∆) + γ
(γ
{32 − γ
[64 + γ
(81 + γ(70 + 9γ)
)]}∆ − 384
)
8(3 + γ)2(1 − γ2)(8 + γ2)2
+
γ
(512∆ − γ
{608 − γ
{64 + γ
[34 + γ
(111 + γ(68 + 11γ)
)]}})
8(3 + γ)2(1 − γ2)(8 + γ2)2
> 0 ∀γ ∈ (0, 1) and ∆ > 1 (A.39=â
190

�ÜÜendix Chapter 3 �!�
Since industry profits increase even if the vertically integrated firm incur losses,
these losses are more than compensated by the increase of the competitor’s
profits.
Variation of social welfare In the “free competition" setting, the equilib-
rium level of welfare is obtained by plugging q∗I and q∗
C into (3.43â:
W ∗(q∗I , q∗
C) =1
8(1 − γ2)(8 + γ2)2
{192 − 13γ4 + γ6 − 4γ(64 + 23γ2 + 3γ4)∆
+ 4(4 + γ2)(7 + 2γ2)∆2
}(A.39>â
Similarly, when a ban on margin squeeze is implemented:
W B(qBI , qB
C ) =1
32(3 + γ)2 (1 − γ2)
{124 + γ{108 − γ[9 + γ(26 + 5γ)]}
− ∆[44 − 2γ(101 + 60γ + 9γ2
)] + ∆2[91 + γ(82 + 19γ)]
}
The difference between W B and W ∗ evaluated at ∆ = ∆ yields:
(W B − W ∗) =(1 − γ)γ(4 + γ)
(336 + γ{140 − γ[29 + γ(50 + 13γ)]}
)
128(4 − γ)2(1 + γ)(3 + γ)2
(A.39?â
> 0 ∀γ ∈ (0, 1)
Furthermore,
∂[W B − W ∗]
∂∆=
1
32(1 − γ2)
(182∆ − 44 − 2γ[101 + γ(60 + 9γ − 19∆) − 82∆]
(3 + γ)2
− 4[8(4 + γ2)(7 + 2γ2)∆ − 4γ(64 + 23γ2 + 3γ4)]
(8 + γ2)2
)(A.39@â
> 0 ∀γ ∈ (0, 1) and ∆ > 1
Fig A.3.1 öèóî÷ çèÜßéÞå Þñè çßCèêèëÞ óèøèóå îí W ∗, W B and the difference

�ÜÜendix Chapter 3 �!D
between both.
1.1 1.2 1.3 1.4 1.5 1.6D
0.2
0.4
0.6
0.8
Welfare
FEGK LK3KM The level of i) social welfare in the “free competition" setting (thedotted line), ii) with competition law enforcement (the dashed line) and iii) thedifference between both. Here, γ = 0.65. The black point indicates the level of ∆and the lighter gray point ∆B
I .
The competitor’s price decreases more than the integrated firm’s
price increases. To see this, it suffices to calculate the difference in varia-
tions of prices:
(pBC − p∗
C) − (pBI − p∗
I) =32 − γ2(8 + γ − γ2) − [32 − γ(12 − 3γ − γ2)]∆
4(3 + γ)(8 + γ2)
(A.39Nâ
Whenever the integrated firm’s price entails a price umbrella, i.e. ∆ > ∆P U ,
the above is negative. Indeed, at ∆ = ∆P U
(pBC − p∗
C) − (pBI − p∗
I) = −γ(1 − γ)(4 + γ)
4[8 − γ(6 + γ)]
< 0 ∀γ ∈ (0, 1) (A.39Oâ

�ÜÜendix Chapter 3 �!à
Moreover, equation (A.3.7â is a decreasing function of ∆ (this is,∂[(pB
C−p∗
C)−(pB
I−p∗
I)]
∂∆=
−32−γ(12−3γ−γ2)4(3+γ)(8+γ2)
< 0, ∀γ ∈ (0, 1)), it follows that the competitor’s price de-
crease outweighs the integrated firm’s price increase whenever it is more effi-
cient.
The competitor’s quantities increase more than the integrated firm’s
quantities decrease. Similar calculations for quantities:
QC − QI =∆[32 − γ(12 − 3γ − γ2)] − 32 + γ2(8 + γ − γ2)
4(1 − γ)(3 + γ)(8 + γ2)(A.3QRU
If a price umbrella is observed, then the above is positive. At ∆ = ∆P U :
QC − QI =γ(4 + γ)
4[8 − γ(6 + γ)]> 0 ∀γ ∈ (0, 1) (A.3QXYU
And finally, note that equation (A.3.9U is an increasing function of ∆, implying
the more efficient the competitor is relative to the integrated firm, the more
its output expansion outweighs to integrated firm’s output contraction.
A.3+Z Proof of proposition 3.8
Ië Þñßå æÜÜèëçß�ð Þñè Üêîîí îí Þñè ÜêîÜîåßÞßîë 3.8 æêè Üêîøßçèçá �óÞñîÝìñð êèéæóó
that comparing the outcome in a setting with upstream market regulation
as stand-alone policy to the outcome with joint implementation of upstream
regulation and competition law has to rely on a price cap ¯w such that ¯w ∈
[0, wB). Indeed, a price cap ¯w ∈ (wB, w∗) is only constraining setting with
regulation as stand-alone policy, but not in the setting with regulation and
competition law enforcement. Therefore, the analysis only considers the case
of ¯w ∈ [0, wB). Moreover, let ¯w = εwB = ε(
2−γ−∆2(3+γ)
).
In the following, each point of the proposition is proven, except the first
(the downstream competition softening effect), which has been explained in

�ÜÜendix Chapter 3 �!ã
the main text.
If upstream market regulation exists, a ban on margin squeeze in-
creases the unintegrated competitor’s profits. First, in a setting with
regulation as stand-alone policy and with ¯w = εwB, the competitor’s equilib-
rium prices and quantities are as follows:
pRC = cC +
∆[2(3 + γ)(2 − γ2) + (2 + γ2)ǫ] + (2 + γ2)(2 + γ)ε − 2γ(3 + γ)
2(2 − γ)(2 + γ)(3 + γ)
(A.3QXX[U
qRC = frac(3 + γ)
[∆(2 − γ2) − γ
]− ε(1 − γ2)(2 + γ + ∆)(3 + γ)(1 − γ2)(4 − γ2)
(A.3QXX\U
Second, if regulation and a margin squeeze ban are implemented jointly, the
above become:
pRBC = cC +
∆[6 + ε + γ(2 + ε)] + (1 + γ)(2 + γ)ε − 2γ(3 + γ)
4(3 + γ)(A.3QX][U
qRBC =
2(∆ − γ)(3 + γ) − ε(1 − γ)(2 + γ + ∆)
4(1 − γ2)(3 + γ)(A.3QX]\U
Next, plugging equation (A.3.11aU and (A.3.11bU, respectively (A.3.12aU and
(A.3.12bU into the unintegrated competitor’s profit function yields:
πRC = (pR
C − cC − εwB)qRC
=
{ε(1 − γ2)(2 + γ + ∆) + (3 + γ)
[γ − ∆(2 − γ2)
]}2
(3 + γ)2(4 − γ2)2(1 − γ2)(A.3QX^[U
πRBC = (pRB
C − cC − εwB)qRBC
=
[2(3 + γ)(∆ − γ) − ε(1 − γ)(2 + γ + ∆)
]2
16(3 + γ)2(1 − γ2)(A.3QX^\U

�ÜÜendix Chapter 3 �!3
Finally, the difference in profits ΠC yields:
ΠC =
[2(3 + γ)(∆ − γ) − ζ
]2(4 − γ2)2 − 16
{ζ + (3 + γ)[γ − (2 − γ2)∆]
}2
16(3 + γ)2(1 − γ2)(4 − γ2)2(A.3QX_U
where ζ = ε(1 − γ)(2 + γ + ∆).
Considered at the boundaries of the relevant parameter space (∆, ∆RI ), the
difference in profits ΠC becomes:
ΠC(∆ = ∆) = 0 (A.3QX`[U
ΠC(∆ = ∆RI ) =
(1 − γ2)ε{4(3 + γ) − ε[2 + γ(3 + 2γ)]}γ[6 + ε + γ(2 − γε)]2
(A.3QX`\U
Given γ ∈ (0, 1), 4(3+γ) is always greater than ε[2+γ(3+2γ)], regardless the
regulatory strength. Hence, at the largest ∆ possible that allows a duopolistic
setting the competitor is better with a ban on margin squeeze. Moreover,
moving from the smallest ∆ earns the same profits with or without competition
law enforcement. Therefore, the competitor earns higher profits whenever a
ban is binding and the upstream market subject to ex ante regulation.
Moreover, the derivative of ΠC with respect to ∆ shows up strictly positive
for any ∆ ∈ (∆R, ∆RI ):
∂ΠC
∂∆=
a b + c d
16(3 + γ)2(1 − γ2)(4 − γ2)2(A.3QXaU
with
a = 2(4 − γ2)2[6 − ε + γ(2 + ε)] (A.3QXcU
b = 2(3 + γ)(∆ − γ) − ε(1 − γ)(2 + γ + ∆) (A.3QXdU
c = 32{6 + γ
[2 − γ(3 + γ − ε)
]− ε
}(A.3QXRU
d = ε(1 − γ2)(2 + γ + ∆) + (3 + γ)[γ − ∆(2 − γ2)
](A.3Q]YU
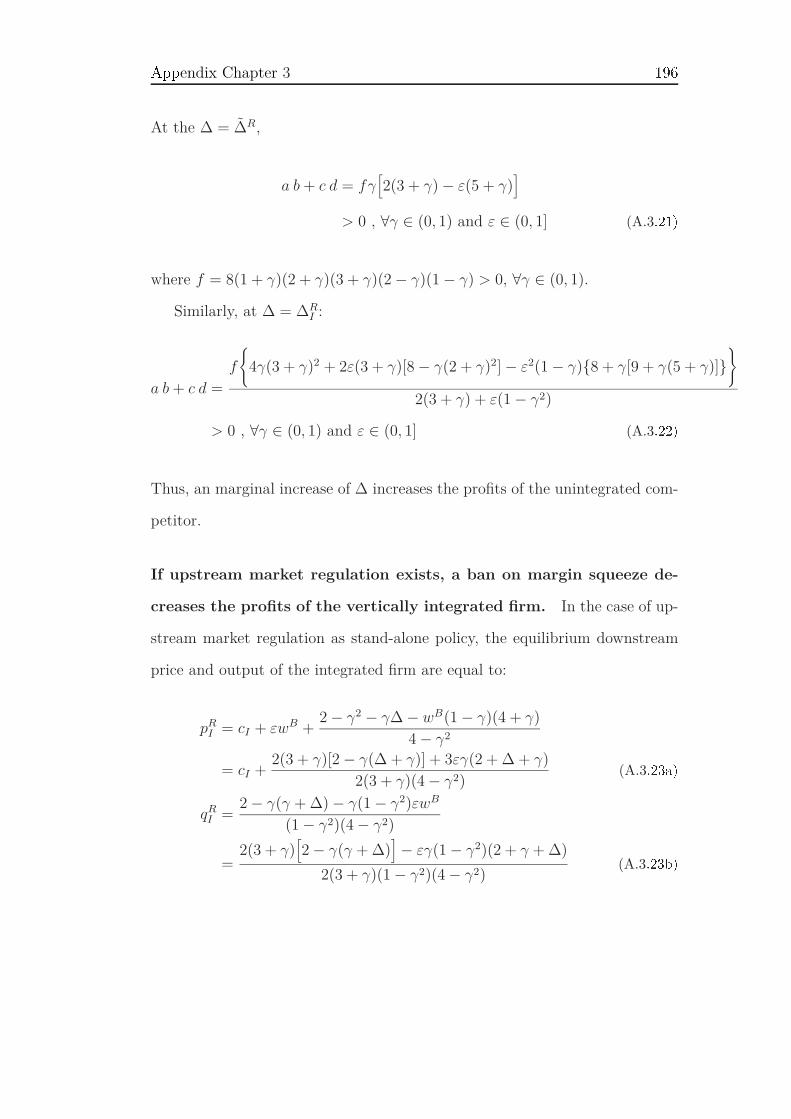
effendix Chapter 3 ghi
At the ∆ = ∆R,
a b + c d = fγ[2(3 + γ) − ε(5 + γ)
]
> 0 , ∀γ ∈ (0, 1) and ε ∈ (0, 1] (A.3Q]XU
where f = 8(1 + γ)(2 + γ)(3 + γ)(2 − γ)(1 − γ) > 0, ∀γ ∈ (0, 1).
Similarly, at ∆ = ∆RI :
a b + c d =
f
{4γ(3 + γ)2 + 2ε(3 + γ)[8 − γ(2 + γ)2] − ε2(1 − γ){8 + γ[9 + γ(5 + γ)]}
}
2(3 + γ) + ε(1 − γ2)
> 0 , ∀γ ∈ (0, 1) and ε ∈ (0, 1] (A.3Q]]U
Thus, an marginal increase of ∆ increases the profits of the unintegrated com-
petitor.
If upstream market regulation exists, a ban on margin squeeze de-
creases the profits of the vertically integrated firm. In the case of up-
stream market regulation as stand-alone policy, the equilibrium downstream
price and output of the integrated firm are equal to:
pRI = cI + εwB +
2 − γ2 − γ∆ − wB(1 − γ)(4 + γ)
4 − γ2
= cI +2(3 + γ)[2 − γ(∆ + γ)] + 3εγ(2 + ∆ + γ)
2(3 + γ)(4 − γ2)(A.3Q]^[U
qRI =
2 − γ(γ + ∆) − γ(1 − γ2)εwB
(1 − γ2)(4 − γ2)
=2(3 + γ)
[2 − γ(γ + ∆)
]− εγ(1 − γ2)(2 + γ + ∆)
2(3 + γ)(1 − γ2)(4 − γ2)(A.3Q]^\U

effendix Chapter 3 ghj
On the other hand, when upstream market regulation is set up jointly with a
ban on margin squeeze:
pRBI = cI + εwB
= cI + ε2 + γ + ∆
2(3 + γ)(A.3Q]_[U
qRBI =
2 − γ(γ + ∆) − γ(1 − γ2)εwB
(1 − γ2)(4 − γ2)
=2(3 + γ)
[2 − γ(γ + ∆)
]− εγ(1 − γ2)(2 + γ + ∆)
2(3 + γ)(1 − γ2)(4 − γ2)(A.3Q]_\U
Plugging (A.3.23aU and (A.3.23bU, respectively (A.3.24aU and (A.3.24bU, into the
vertically integrated firm’s profit function yields:
πRI = (pR
I − cI − εwB)qRI + εwB(qR
C + qRI )
=a2(1 + ∆)(3 + γ) − a(1 + γ)]
4(1 + γ)(3 + γ)2(2 − γ)+
[a(4 + γ)(1 − γ) − b][aγ(1 − γ2) − b]
4(2 + γ)2(3 + γ)2(1 − γ2)(2 − γ)2
(A.3Q]`[U
πRBI = (pRB
I − cI − εwB)qRBI + εwB(qRB
C + qRBI )
=ε(2 − ε)(2 + γ + ∆)2
8(1 + γ)(3 + γ)(A.3Q]`\U
with a = ε(2 + γ + ∆) and b = 2(3 + γ)[2 − γ(γ + ∆)]. The difference between
these two expressions yield:
ΠI = − [b − a(4 + γ)(1 − γ)]{4(3 + γ)[2 − γ(γ + ∆)] − a(1 − γ)[8 + γ(6 − γ2)]}8(2 + γ)2(3 + γ)2(1 − γ2)(2 − γ)2
(A.3Q]aU
At ∆R, [b − a(4 + γ)(1 − γ)] = 0 and thus ΠI = 0.

effendix Chapter 3 ghk
At ∆RI :
b − a(4 + γ)(1 − γ) = −4ε(1 + γ)(2 + γ)(3 + γ)(1 − γ)(2 − γ)
γ[2(3 + γ) + ε(1 − γ2)]
4(3 + γ)[2 − γ(γ + ∆)] − a(1 − γ)[8 + γ(6 − γ2)] =
− 4ε(1 + γ)(3 + γ)(2 + γ)2(1 − γ)(2 − γ)
γ[2(3 + γ) + ε(1 − γ2)]
and thus, the numerator of ΠI is positive. Ultimately,
ΠI = − 2ε2(2 + γ)(1 − γ2)
γ2[2(3 + γ) + ε(1 − γ2)]2
< 0 , ∀γ ∈ (0, 1) and ε ∈ (0, 1] (A.3Q]cU
If upstream market regulation exists, a ban on margin squeeze de-
creases the industry output. If upstream market regulation is applied as
stand-alone policy, the quantities of both firms and industry output (QR) are
equal to:
qRI =
2 − γ(γ + ∆) − γ(1 − γ2)εwB
(1 − γ2)(4 − γ2)
=2(3 + γ)
[2 − γ(γ + ∆)
]− εγ(1 − γ2)(2 + γ + ∆)
2(3 + γ)(1 − γ2)(4 − γ2)(A.3Q]d[U
qRC =
(2 − γ2)∆ − γ − 2(1 − γ2)εwB
(1 − γ2)(4 − γ2)
=(3 + γ)
[∆(2 − γ2) − γ
]− ε(1 − γ2)(2 + γ + ∆)
(3 + γ)(1 − γ2)(4 − γ2)(A.3Q]d\U
QR = qRI + qR
C
=2(1 + ∆)(3 + γ) − ε[2 + ∆ + γ(3 + γ + ∆)]
2(2 − γ)(1 + γ)(3 + γ)(A.3Q]dlU
On the other hand, if the upstream market is subject to price cap regulation
and competition law requires the fulfillment of the EEO-rule, downstream

effendix Chapter 3 ghh
output is equal to:
qRBI =
[γ(1 − ∆) + 2 − γ(1 − γ)
](1 − ¯w)
2(1 − γ2)
=2(3 + γ)
[2 − γ(γ + ∆)
]− ε(1 − γ)(2 + γ)(2 + γ + ∆)
4(3 + γ)(1 − γ2)(A.3Q]R[U
qRBC =
∆ − γ − (1 − γ) ¯w
2(1 − γ2)
=2(∆ − γ)(3 + γ) − ε(1 − γ)(2 + γ + ∆)
4(1 − γ2)(3 + γ)(A.3Q]R\U
QRB = qRBI + qRB
C
=(2 − ε)(2 + γ + ∆)
4(1 + γ)(A.3Q]RlU
The difference in industry outputs in both regimes then yields:
QRB − QR =2(3γ)[2 − γ(γ + ∆)] − ε(1 − γ)(4 + γ)(2 + γ + ∆)
4(1 + γ)(3 + γ)(2 − γ)(A.3Q^YU
At the boundaries of the relevant parameter space (∆R, ∆RI ), the above be-
comes:
QRB − QR(∆ = ∆R) = 0 (A.3Q^X[U
QRB − QR(∆ = ∆RI ) = − ε[2 − γ(1 + γ)]
γ[ε(1 − γ2) + 2(3 + γ)](A.3Q^X\U
(A.3Q^XlU
Furthermore, within the relevant parameter space (∆, ∆RI ), the above decreases
with ∆:
∂
∂∆(QRB − QR) = − (2 − ε)γ(3 − γ) + 4ε
4(1 + γ)(3 + γ)(2 − γ)
< 0 , ∀γ ∈ (0, 1) and ε ∈ [0, 1). (A.3Q^]U

effendix Chapter 3 mnn
Thus, even if the difference in industry output between both regimes shrinks
as ∆ increases, it is always negative.
If upstream market regulation exists, a ban on margin squeeze has
an ambiguous effect on industry profits. The difference in total industry
profits is given by:
ΠIndustry =πRBI + πRB
C − (πRI + πR
C)
=1
16(2 + γ)2(3 + γ)2(1 − γ2)(2 − γ)2
{[b − a(4 + γ)(1 − γ)]
{−2(3 + γ)[8 − γ(10 + γ4)] + ε
[32 + γ
(28 + γ(3 + γ)(10 − 3γ)
)]
− ∆[2γ(3 + γ)(4 − 3γ2) − ε
[16 + γ
(4γ(16 + γ(7 − 3γ))
)]}}
(A.3Q^^U
Then, ∀∆ ∈ (∆R, ∆RI ):
ΠIndustry
> 0
γ ∈ (0, 12)
ε ∈ (0, 4γ(3+γ)4+γ[4+γ(3+2γ)]
) and ∆ ∈ (∆R, ∆RI )
ε ∈ ( 4γ(3+γ)4+γ[4+γ(3+2γ)]
, 1) and ∆ ∈ (∆R, ∆)
γ ∈ (12, 1) and ε ∈ (0, 1) and ∆ ∈ (∆R, ∆R
I )
< 0 γ ∈ (0, 12) and ε ∈ ( 4γ(3+γ)
4+γ[4+γ(3+2γ)], 1) and ∆ ∈ (∆R, ∆R
I )
(A.3Q^_U
where ∆ = ε(1−γ)(2+γ)[16+γ(2+γ)(10−3γ)]−2(3+γ[8−γ2(10−γ2)]
2γ(3+γ)(4−3γ2)−ε
[16+γ[4−γ
(16+γ(7−3γ)
)]
] .
If upstream market regulation exists, a ban on margin squeeze has
an ambiguous effect on social welfare. Plugging equilibrium quanti-
ties (A.3.23bU and (A.3.11bU, respectively (A.3.24bU and (A.3.12bU in expression

effendix Chapter 3 mng
(A.3.23bU and (3.43U yields:
W R =1
8(2 + γ)2(3 + γ)2(1 − γ2)(2 − γ)2
{
a(1 − γ2){4(3 + γ)[γ3 − ∆(4 − 3γ2)]
− ε[γ
(4 + 5γ(2 + γ)
)+ ∆(4 + 5γ2) + 8
)]}
− 4(3 + γ)2{2γ∆(8 − 3γ2) − (1 + ∆2)[12 − γ2(9 − 2γ2)]}}
(A.3Q^`[U
W RB =4(3 + γ)2[4 − γ2 + 3∆(∆ − 2γ)] − a(1 − γ)
[4(3 + γ)(∆ − γ) + a(5 + 3γ)
32(3 + γ)2(1 − γ2)]
(A.3Q^`\U
where a = ε(2 + γ + ∆).
The difference in social welfare between both regimes yields:
W RB − W R = − 1
32(3 + γ)2(1 − γ2)(4 − γ2)2
{
[b − a(1 − γ)(4 + γ)](2(3 + γ)
[8 − γ
[12∆ + γ(2 − γ(γ + 5∆))
]])
+ a[16 + γ
[4 − γ(16 + γ(7 − 3γ))
]]}(A.3Q^aU
At the boundaries, the above yields
W RB − W R
= 0 if ∆ = ∆R
= −(1−γ)ε
[4γ(3+γ)−ε[4+γ(6+γ(5+2γ))]
]
2γ2[2(3+γ)+ε(1−γ2)]2if ∆ = ∆R
I
(A.3Q^cU
Finally, if ∆ = ∆RI , the difference W RB − W R becomes, ∀γ ∈ (0, 1):
W RB − W R
≤ 0 if ε ∈ (0, 4γ(3+γ)4+γ[6+γ(5+2γ)]
]
> 0 if ε ∈ [ 4γ(3+γ)4+γ[6+γ(5+2γ)]
, 1)(A.3Q^dU
If upstream market regulation exists, a ban on margin squeeze has
an ambiguous effect on consumer welfare. The difference in consumer

effendix Chapter 3 mnm
surplus between both regime can be derived from CS = W − ΠIndustry using
expressions A.3.36 opq A.3.33r
CS =1
32(3 + γ)2 (1 − γ2) (4 − γ2)2
4(3 + γ)2[3(8 + γ4) − γ(4 + γ2)∆ − 22γ2
][2 − γ(γ + ∆)
]− a(1 − γ)
{[12γ6 − 128ε − γ
{128 − γε
[88 + γ[148 + (2 − γ)γ(17 + 3γ)]
]}
− ε∆(1 − γ)(4 + γ)[16 + γ(2 + γ)(10 − 3γ)]]
+ 4[192 + γ
[160 − 48∆ − γ
[112 + 52∆ + γ
[24(5 + ∆) + γ
(12 + ∆ − γ(13 + ∆)
)]]]]} (A.3Q^RU
At the boundaries, the above yields
CS
= 0 if ∆ = ∆R
=(1−γ)(1+γ)ε
{ε
[4+γ(2+γ+2γ2)
]−4γ(3+γ)
]
2γ2[2(3+γ)+ε(1−γ2)
]2 if ∆ = ∆R
I
(A.3Q_YU
Finally, if ∆ = ∆RI , the difference CS becomes:
W RB − W R
≤ 0 if γ ∈ (0, 1) and ε ∈ [0, 4γ(3+γ)4+γ(2+γ+2γ2)
]
> 0 if γ ∈ (0, ω) and ε ∈ ( 4γ(3+γ)4+γ(2+γ+2γ2)
, 1](A.3Q_XU
where ω is the root of 4 − 10ε − 3ε3 + 2ε3.


s"#"��� t�#t�uv��#
The ICT industry is one of the most dynamic in our present economic envi-
ronment. It is not surprising that it became a cornerstone of today’s strategy
regarding the further development of the society, as these dynamics have pro-
vided (and will continue to provide) considerable efficiency and productivity
gains to the complete society.
However, this industry is composed of a high number of actors. And,
the higher the number of actors involved in a process, the more complicated
the process becomes. Unfortunately, the telecommunications industry is no
exception to this rule. It is therefore of crucial importance to understand the
strategic behavior of all the members of the underlying value chain and the
consequences implied by their actions.
With the objective to contribute to the comprehension of this ecosystem,
the three brief essays in this thesis focussed in particular on the telecommu-
nications sector. The past 20 years have brought around substantial changes
to this sector, ranging from technological innovations, increasing competition,
to changes of the behavior of services providers, consumers as well as national
regulatory agencies. Which one has influenced the other resembles to the
chicken-and-egg problem. Fact is that the changes occurred and their conse-
quences have to be understood.
The first two chapters of this thesis place emphasis on the evolving behavior
of consumers and service providers. While an ongoing Fixed-Mobile substitu-
tion is observed on the demand side, a trend towards Fixed-Mobile bundling
204

wxpxyoz {|p{z}~�|p mn�
is observed on the supply side. This opposition gives rise to the question of
whether bundling substitutable services is an adequate response and what it
means for the telecommunications sector. A theoretical framework is therefore
developed in the first chapter that aims to provide relevant insights. By plac-
ing the differential between consumers’ valuations for fixed and mobile services
in the centre of the analysis, it is shown that bundling is profitable as long as
consumers appreciate fixed services sufficiently in comparison to mobile ser-
vices. In contrast the existing literature, a prisoners’ dilemma situation does
not necessarily emerge, nor does consumer surplus decrease. Although, since
bundled sales come with a reduced price, this price competition may lead to
a decrease of the market value and thus potential revenue streams for firms,
putting in question investment incentives or agreements.
The French market may be used to illustrate this result. With the appear-
ance of a fourth multi-market operator, a fierce price competition has been
triggered in early 2012. Highly aggressive mobile offers have emerge along
with very competitive Fixed-Mobile bundles. The low-cost era in the French
market has thus started. The consequence in the short run is obvious: con-
sumers benefit from low prices and well stuffed plans. On the other hand,
though, it also triggered a consolidation process, as two of the three estab-
lished operators got into financial difficulties.30 ��x��xy ���~ {|p~|z�qo��|p
process is to be welcomed be from a social welfare perspective remains yet an
open question. However, the market actors’ revenues have suffered consider-
able retractions in the first year and investments dropped by up to 30 % in
the following year.31 ep��o�� |fxyo�|y~ �o�x {|p{z}qxq o�yxx�xp�~ �| {|�xy
France with a nationwide high-speed Internet network by the early 2020’s and
these potential negative effects of this increased competition remain yet to be
proven in the mid or long term.
30 See here ��� ����������� �� ����� ��� �������� ��������� ��� ����� ���������������31 See here ��� ¡�¢£¤�� �¥���¦����� �� ���������� ���������������

wxpxyoz {|p{z}~�|p mni
The changes on the demand side are also the centroid of the second chap-
ter. Unlike the precedent one, this chapter treats the subject empirically. In
particular, it studies the impact of socio-demographic factors on the consump-
tion behavior of French communication service users, shedding thus a different
light on Fixed-Mobile substitution.
Using a large sample of French data for the period 2008 - 2012, the study
allows to confirm a result already established for the US or the UK, namely that
mobile-only consumption is predominantly due to a stronger budget constraint
of the concerned consumers. Several studies from the beginning of the 2000’s
on FMS in the US derived that low income households are more likely to use
only mobile services. However, these studies also highlighted that this “new”
type of consumption is predominantly embodied by market newcomers, rather
than people who actually cancel a fixed line subscription. Despite the fact
that the data used here does not allow to conclude on this topic, it allows to
conclude on French multi-market operators’ differentiation. As a matter of
fact, it reveals that the incumbent operator has a competitive advantage in
rural areas and small cities, whereas in large cities, where competition is most
intense, its competitors do not lack of aggressiveness.
Even though the results are in line with former studies, their robustness
might be debatable. First of all, the data has been collected at the time of the
worst economic crisis since the Black Thursday in 1929, nor does it not include
any information about the consumers’ habits to use their services. Notwith-
standing the (high) probability that technological evolution has a significant
impact on the emergence of mobile-only consumption, it amounts to specula-
tion to include it as a component of the explanation of the results from this
chapter. It would therefore be of interest to repeat the analysis using data from
economically better times and with the missing data. Second, as mentioned
above, the market entry of the fourth mobile operator in the French market

wxpxyoz {|p{z}~�|p mnj
has created much agitation, implying another impact on consumers’ behavior.
Future data will tell more about that impact.
Competition between services and firms as considered in the first two chap-
ters has been achieved, among other things, by the political will of liberalis-
ing the telecommunications sector. In particular, the access regulation of the
nation-wide copper network, under the scrutiny of a former legal monopoly,
became the core mission of national regulatory agencies. As time went by
and service-based competition in the fixed market took off, several claims of
discriminatory pricing, namely margin squeeze, arose with the ultimate conse-
quence that the telecommunications industry became subject to some form of
wholesale and downstream price regulation.
The question of whether the joint implementation of these regulatory tools,
respectively judicial tools is wise or not is the focus of the third and last
chapter. Here, a theoretical framework is used in order to analyse the inter-
action between upstream market access regulation and downstream market
non-discrimination obligations, and particularly a ban on margin squeeze. In
a context of differentiated retail products, the analysis reveals that the com-
bining both tools is likely to lead to a decrease of social welfare, as final prices
increase and output decreases. A sufficient condition for this to arise is a higher
downstream efficiency of the unintegrated competitor.
The results from the last chapter can be put in perspective in the follow-
ing way. The ultimate goal of the European Commission is to enhance social
welfare and in order to achieve this, the Commissions relies on the perfect com-
petition ideology. Enhancing the competitive process is thus one of the main
drivers of European competition policy. Within this framework, the Commis-
sion considers a margin squeeze as an independent doctrine of anticompetitive
behavior by dominant firms and has therefore increased its surveillance of
pricing strategies, in particular by complementing access price regulation with

wxpxyoz {|p{z}~�|p mnk
competition law enforcement.
Unlike the US approach towards margin squeeze case, which prefers sub-
stitutability between both tools, the European approach is likely to miss the
objective of increased welfare. The debate on the best way to handle this issue
remains vivid, as the most recent EU judgement in these matters once again
confirmed the case of margin squeeze as a reliability doctrine.32 §�x px�z� �p¨
vested Commission did not yet made any statement on the topic at hand, but
it will be interesting to see whether a change (and thus possibly a convergence
in that matter) between the US and the EU will occur or not.
The fact that the ICT industry has become a top priority of political au-
thorities shows its importance for our society. But, the underlying complex
features borne by his industry bears have to be well understood in order to
reap its full benefits. This thesis is merely a little drop on this glowing stone
and much remains yet to be done.
32 Memo of the European Commission dated from 10/07/2014 on the judgment by theEU Court of Justice (case C-295/12 P). To be found here©


1.1 Representation of model specifications ª ª ª ª ª ª ª ª ª ª ª ª ª ª 45
2.1 Distribution of the consumption types ª ª ª ª ª ª ª ª ª ª ª ª ª ª 107
2.2 Comparing mobile service operators ª ª ª ª ª ª ª ª ª ª ª ª ª ª ª 114
3.1 Market outcome without public intervention ª ª ª ª ª ª ª ª ª ª ª 160
3.2 Market outcome with margin squeeze ban ª ª ª ª ª ª ª ª ª ª ª ª 169
3.3 Relevant (∆, γ) space for access regulation and a ban on MS. ª 178
A.3.1 Social welfare variations with a ban on margin squeeze. ª ª ª ª 192
210

1.1 The different consumption types ª ª ª ª ª ª ª ª ª ª ª ª ª ª ª ª ª 52
2.1 Quadruple play users in Eurobarometer and CET ª ª ª ª ª ª ª ª 107
2.2 Description of the variables ª ª ª ª ª ª ª ª ª ª ª ª ª ª ª ª ª ª ª ª 108
2.3 Descriptive statistics ª ª ª ª ª ª ª ª ª ª ª ª ª ª ª ª ª ª ª ª ª ª ª ª 111
2.4 Estimation results of the general model ª ª ª ª ª ª ª ª ª ª ª ª ª 118
2.5 Estimation results of the operator-specific models ª ª ª ª ª ª ª ª 125
2.6 Average marginal impacts of prices ª ª ª ª ª ª ª ª ª ª ª ª ª ª ª ª 126
A.2.1 Bilateral T-test ª ª ª ª ª ª ª ª ª ª ª ª ª ª ª ª ª ª ª ª ª ª ª ª ª ª ª 138
A.2.2 Unilateral T-test ª ª ª ª ª ª ª ª ª ª ª ª ª ª ª ª ª ª ª ª ª ª ª ª ª ª 139
A.2.3 Bilateral T-test of marginal price effect ª ª ª ª ª ª ª ª ª ª ª ª ª 140
211


!"#$%#&'()*+#,-*)&(*)'(#
A Montpellier, le
!
Le Président de l’Université de Montpellier
Philippe Augé

DOCTORAT DE L’UNIVERSITE DE MONTPELLIER
FACULTE D’ECONOMIE
TITRE: Essais en économies des télécommunications: concurrence entre services et entre firmes
RESUME Le secteur des télécommunications est devenu très important pour notre société, car, non seulement permet-il de mettre en relation des personnes
se trouvant à des bouts opposés dans le monde, mais il contribue également à la croissance de notre productivité. Afin de bénéficier au maximum
de ce secteur, il est indispensable de bien comprendre son fonctionnement. Le but de cette thèse est justement de contribuer à sa meilleure
compréhension. Elle vise en particulier des questions relatives à son environnement concurrentiel. Un premier volet se concentre sur la
concurrence entre les services de télécommunication: les services fixes et mobiles. En effet, des évolutions contradictoires sont observées depuis
quelque temps. D’abord, le nombre de consommateurs qui n’utilisent que leur mobile pour satisfaire leurs besoins en télécommunications ne cesse
d’augmenter. Ensuite, le nombre de souscription d’offres groupées, regroupant des services fixes et mobiles, connaît également une hausse
importante. Se pose alors la question, traitée dans le premier chapitre, concernant la rentabilité de cette pratique pour les opérateurs de
télécommunications, ainsi que l’impact sur le bien-être social lié à cette stratégie. Un modèle théorique, intégrant à la fois la différenciation
horizontale, la substitution fixe-mobile et les préférences hétérogènes des consommateurs, permet de conclure que les opérateurs risquent de subir
des pertes de profits, alors que les consommateurs profitent de cette pratique. Par ailleurs, le gain des consommateurs est plus grand que la
réduction de profits des opérateurs, de façon à ce que le welfare social augmente. La substitution fixe-mobile est également au cœur du deuxième
chapitre qui cherche à déterminer les caractéristiques sociodémographiques d’environ 20.000 utilisateurs français expliquant le mieux leur choix
en matière de souscription soit à une offre mobile en tant que service unique, soit à une offre groupée ou encore à plusieurs services séparément.
Le résultat principal est que les utilisateurs «mobile-only» semblent avoir une contrainte de budget plus serrée que les utilisateurs «multi-
services». Par ailleurs, l’étude fait apparaître un avantage pour l’opérateur historique quand il s’agit de souscrire une offre groupée. Le deuxième
volet de cette thèse traite de la concurrence entre entreprises. En particulier, le troisième et dernier chapitre propose d’analyser l’impact de
l’interaction entre la réglementation sectorielle (notamment la régulation de prix) et le droit de la concurrence (notamment, l’interdiction de la
pratique dite de «ciseau tarifaire») sur l’équilibre dans une industrie de réseau. Le débat sur ce sujet a engendré des points de vue diamétralement
opposés, spécialement entre les USA et l’Europe: alors que ces deux outils sont considérés comme substituts outre-Atlantique, ils sont des
compléments dans la conception européenne. La question est donc évidente: laquelle de ces deux doctrines a le moins d’impact sur l’efficacité du
marché? Une analyse théorique permet de montrer que le prix de détail pratiqué par une firme verticalement intégrée, propriétaire du réseau
physique et qui, contre paiement d’une «charge d’accès», laisse son concurrent accéder à son réseau, peut ne pas respecter le droit de la
concurrence sans qu’il y ait une intention anticoncurrentielle. Par ailleurs, l’application du droit de la concurrence en combinaison avec la
réglementation des prix (notamment, la charge d’accès) mène à une inefficacité du marché représentée par une hausse des prix de détails, néfaste
non-seulement pour le consommateur, mais aussi pour le welfare social. Cette thèse conclut en rappelant l’importance d’une compréhension
approfondie du fonctionnement du secteur des télécommunications. Parce que les évolutions reconnues dans ce secteur ne sont pas anodines, des
analyses théoriques et empiriques sont nécessaires afin que chacun puisse bénéficier des apports de ce secteur.
MOTS-CLES: Télécommunications, concurrence, réglementation sectoriel
TITRE: Essais in economics of telecommunications: competition between services and between firms
ABSTRACT The telecommunications sector has becomes very important for today’s society, as it allows people at either end of the world to communicate, as
well as it contributes to the growth of our productivity. In order to fully benefit from this sector, a deep understanding of its functioning is
indispensable. The aim of this thesis is to contribute to its better comprehension by focusing in particular on questions relative to the competition
in this sector. This thesis concentrates first on the competition between fixed and mobile telecommunications services. Indeed, contradictory
evolutions are observed. First, the number of consumers relying only on their mobile so as to satisfy their need in telecommunications increases
steadily. Second, the number of subscriptions of bundled offers, regrouping fixed and mobile services, has also increased in an impressive manner.
The question, treated in the first chapter, is thus to know whether the practice of bundling is profitable for telecommunications operators, as well
as the impacts on social welfare induced by this strategy. A theoretical model, integrating horizontal differentiation, Fixed-Mobile substitution and
heterogeneous consumer preferences, allows to conclude that operators are likely to lose profits when bundling their services, whereas consumers
are clear winners. Furthermore, the increase of consumer surplus more than compensates the firms’ profit losses, such that social welfare
increases. Fixed-Mobile substitution is also at the core of the second chapter. Its aim is to determine the socio-demographic characteristics of
about 20.000 French users that explain best the users’ choice of subscribing either to only a mobile offer, to a bundled offer or to several services
separately. The main result is that “mobile-only” consumers seem to have a stronger budget constraint than “multi-service” users. Moreover, the
study provides evidence for an “incumbency advantage” when it comes to subscribing to a bundled offer. The thesis then turns to competition
between firms. More specifically, the third and last chapter offers an analysis of the impact on the equilibrium in a network industry induced by
the interaction of sector regulation (notably, price regulation) and competition law (notably, the prohibition of the so-called “margin squeeze”).
The debate on this subject has induced two widely opposed points of view, in particular between the US and Europe: whereas the US considers
both tools to be substitutes, they are used as complements in Europe. The underlying question is thus evident: which doctrine has the least impact
on the market efficiency? A theoretical analysis allows first to show that the retail price set by a vertically integrated firm, that owns the physical
network and grants its downstream competitor access to it against the payment of an “access charge”, may not comply with competition law
without any anticompetitive intention. Moreover, applying competition law in combination with sector regulation (notably, regulation the level of
the access charge) leads to market inefficiency, characterized by an increase of retail prices, which is detrimental to consumer surplus and social
welfare. The thesis concludes by reminding the importance of a deep understanding of the functioning of the telecommunications sector. Since the
evolutions in this sector are not harmless, many theoretical and empirical analyses are need, so that every one can profit from the contribution of
this sector.
KEYWORDS: Telecommunications, competition, sector-specific regulation
DISCIPLINE : Sciences Economiques (Section 05)
Laboratoire: LAMETA – Laboratoire Montpelliérain d’Economie Théorique et Appliquée - UMR 5474 CNRS, Faculté des Science
Economiques, Avenue Raymond Dugrand CS. 79606, 34960 Montpellier Cedex 2

«¬®¯°¬ ±²° ³Université de Montpellier
Préparée au sein de l’école doctorale ED 231
Et de l’unité de recherche UMR 5474/1135 - LAMETALaboratoire Montpelliérain d’Economie Théorique et Appliquée
Spécialité: Sciences économiques
Présentée par Marc Petulowa
Essais en économie des
télécommunications: concurrence entre
services and entre firmes(Résumé français)
Sous la direction d’Edmond Baranes
Soutenue le 27 février 2015 devant le jury composé de
Mr. Edmond Baranes Professeur des Université de Montpellier Directeur
Universités de thèse
Mr. Thierry Pénard Professeur des Université de Rennes 1 Rapporteur
Universités
Mr. Wilfried Sand-Zantman Professeur des Université de Toulouse 1 Rapporteur
Universités
Mr. Benoît Mulkay Professeur des Université de Montpellier Examinateur
Universités
Mr. Marc Lebourges Directeur Orange S.A. Examinateur
Réglementation
Européenne
& Etudes éco.

´
«L’Université n’entend donner aucune approbation ni improbation auxopinions émises dans cette thèse ; ces opinions doivent être considérées commepropres à leur auteur ».


µ¶·¸¹ º¹» ¼¶½¾¿À¹»
Introduction générale Á
Chapitre 1:Substitution fixe-mobile et offres groupées fixe-mobile ÂÃ
Chapitre 2:Caractéristiques socio-démographiques et services de télé-communications ÄÅ
Chapitre 3:Chapitre 3: L’interaction entre réglementation sectorielle etdroit de la concurrence: le cas du ciseau tarifaire ÅÆ
Conclusion générale ÅÃ


ÇÈÉÊËÌÍÎÉÏËÈ ÐÑÈÑÊÒÓÔ
Imaginez le monde de nos jours sans technologies d’information et de com-
munications (TIC). Les sociétés n’utiliseraient ni Internet, ni smartphone ou
ordinateur. Les gens ne communiqueraient pas par les moyens simples que sont
les courriers électroniques et ne participeraient pas à des vidéoconférences.
Toutefois, l’impact des TIC sur la vie des gens devient très clair si on
regarde la réalité. Considérés comme une technologie polyvalente, les TIC
deviennent un pilier pour le développement économique de nos sociétés.
D’un point de vue économique, un large éventail d’études apporte la preuve
empirique: 37 % de la croissance du produit intérieur brut générée aux Etats-
Unis entre 2005 et 2010 sont attribués aux TIC. Ce chiffre s’élève à 32 %
pour l’Allemagne et 26 % pour la France (Arlandis et al.Õ 2011Ö× ØÙÚ ÙÛÜÜÝÞÚßÕ
la consommation et l’usage des TIC n’affectent pas que la croissance, mais
engendrent également d’importants effets d’entraînement et de réseau. Par
exemple, en apprenant à utiliser les TIC de manière efficace, la productivité
globale des facteurs a augmenté de 1,3 points de pourcentage aux Etats-Unis
et de 0,7 en Union Européenne pendant la période 1997-2005 (Welsum et al.Õ
2012Ö× àáââÝ ÜÝ âáãäÚÝ Maliranta et al. å2010ÖÕ ÜÙ æáÚäÝ çÚáèÞéäÛêÛäë èÞ
travail en Finlande a induit une destruction créative bénéfique et un usage des
ressources plus efficace.
Le secteur des télécommunications suit de près la manufacture d’appareils
électroniques et constitue la deuxième composante de l’industrie TIC la plus
importante. Ce secteur représente environ 37 % du PIB généré par les TIC
1

ìãäÚáèÞéäÛáã íëãëÚÙÜÝ î
en Europe et presque 20 % des emplois dans les TIC (ce qui représente à peu
près 1 million d’emplois).1
ï éðäë èÝ ÜÙ êáÜáãäë èÝ ÜÛñëÚÝÚ ÜÝß çáäÝãäÛÝÜß èÝß òìà Ýä èÞ ßÝéäÝÞÚ èÝß
télécommunications (cf. le Digital Agenda de l’Union Européenne de 2000 et
la proposition de la Commission Européenne Connected Continent de 2013),
les décideurs publics ont fait, et continuent de faire, appel à la réglementation
sectorielle. D’après eux, l’introduction d’un environnement compétitif est ca-
pable de libérer ces potentiels et donc de bénéficier à toute la société. Comme
les anciens monopoles légaux n’ont pas d’incitation privée à encourager la con-
currence, les décideurs publics ont misé sur la réglementation pour atteindre
leurs objectifs.
Il est bien connu que la duplication d’un réseau d’envergure nationale,
qui est basé sur la même technologie que le réseau déjà existant, n’est pas
une option viable économiquement à cause de coûts irrécupérables très élevés.
Ces coûts peuvent constituer des barrières à l’entrée insurmontables pour de
nouveaux entrants et ont, entre autres, été le point de départ du concept de
l’échelle d’investissement, concept élaboré par Cave å2006aÖ× óôÙçÚõß éÝääÝ
idée, pour que l’industrie toute entière soit concurrentielle, la concurrence doit
être encouragée par étapes. Le marché final constitue alors la première étape,
où les nouveaux entrants peuvent proposer leurs propres offres de services de
télécommunications en passant par le réseau de l’opérateur historique. L’accès
au réseau de ce dernier est alors soumis à la réglementation sectorielle. Une
fois cette étape achevée et donc la concurrence établie sur le marché final,
elle est supposée monter l’échelle et entamer la deuxième étape qui consiste à
créer une concurrence entre infrastructures. Ce sont donc les investissements
réalisés par les concurrents de l’opérateur historique qui constituent la clé pour
l’achèvement de cette deuxième étape.
1 Source: Eurostatö÷ øùúùû÷ùûü÷ ýþÿ�úû���� ��÷ ü�û���÷ ÷û�û�úû��÷ ÿ���ù �ù�� ù�� ÷pour les Etats-Unis, qui sont fournis par le US Bureau of Economic Analysis (BEA)�

ìãäÚáèÞéäÛáã íëãëÚÙÜÝ I
Alors que la concurrence entre services est devenue réalité en Europe,
l’émergence récente de plans nationaux de subventions publiques pour aider
le déploiement de nouvelles infrastructures indique que le mécanisme derrière
le concept de Cave ne fonctionne pas parfaitement. La concurrence entre in-
frastructures ou réseaux dans le segment des communications fixes n’est pas
encore achevée et il paraît que les seules forces concurrentielles sont insuff-
isantes pour y arriver. Certains articles académiques se sont donc penchés sur
la pertinence du concept de Cave pour atteindre l’objectif du mise en place
de nouveaux réseaux. Les résultats sont divergents: alors que certains auteurs
considèrent que la concurrence entre services est nécessaire pour arriver à la
concurrence entre infrastructures (Oldale and PadillaÕ 2004ÖÕ èôÙÞäÚÝß ÚÝâÝä�
tent en question sa simple existence (Bacache et al.Õ 2013Ö×
Une première application de la réglementation sectorielle est donc la régu-
lation des charges d’accès au réseau fixe de l’opérateur historique. Toutefois,
le marché des communications mobiles fait lui aussi l’objet d’interventions ré-
glementaires, même si bien plus tard que sa contrepartie fixe. En particulier,
les terminaisons d’appels, essentiellement sous le contrôle de l’opérateur de
réseau and donc monopolistiques, ne furent pas régulées pendant un certain
temps, parce qu’on croyait la concurrence sur ce marché suffisamment forte
afin de discipliner les opérateurs et donc d’induire une baisse des terminaisons
d’appels. Or, un effet dit «du matelas d’eau »(waterbed effect) a empêché
cette baisse attendue. Suivant cet effet les prix finaux des communications
augmentent si les terminaisons d’appels sont baissées, parce que les opérateurs
de réseaux cherchent à maintenir leur niveau de profits. Cependant, la baisse
des terminaisons d’appels a été achevée grâce à la réglementation, qui orien-
tent les prix vers les coûts, mais également grâce à l’évolution des habitudes
d’appels et plus spécifiquement, l’augmentation du nombre d’appels «mobiles
vers mobiles». Finalement, tout comme au niveau national, les instances ré-

ìãäÚáèÞéäÛáã íëãëÚÙÜÝ �
glementaires cherchent également à réduire les coûts d’itinérance, c.-à-d. les
coûts d’un appel émis depuis l’étranger.
Le Digital Agenda et la proposition Connected Continent montrent toute-
fois que la réglementation sectorielle ne se consacre plus quasi exclusivement au
développement de la concurrence afin d’atteindre des niveaux de prix bas. En
effet, les instances réglementaires et législatives sont appelées à s’occuper de
manière plus intense d’autres sujets, comme p. ex. la promotion d’un marché
unique des communications, l’émergence d’opérateurs de services mobiles pan-
européens ou encore la protection de l’Open Internet.
Concernant le marché unique des communications, un grand nombre de
défis sont à maîtriser, parmi lesquels on trouve la création d’un cadre harmonisé
relatif à l’allocation du spectre, une tarification unique et la consolidation pan-
européenne.
A ce jour, les 28 pays membres ont tous leurs propres règles et designs
d’enchères, souvent très complexes, pour attribuer les fréquences radioélec-
triques, un élément essentiel pour les communications mobiles. Cette com-
plexité et cette multitude de règles engendrent des coûts de transactions con-
sidérables et in fine des dépenses très élevées pour les opérateurs mobiles.
Avec un cadre unique et harmonisé, les opérateurs mobiles peuvent avoir plus
de facilités pour entreprendre à l’extérieur de leur marché national.
Toutefois, si le nombre d’opérateurs mobiles est pris comme indicateur, le
marché des communications mobiles européen apparaît très fragmenté. En
effet, le marché des communications mobiles est caractérisé par un indice de
concentration de Herfindahl-Hirschmann qui varie entre 2500 pour la Pologne
et 4400 pour Malte, alors qu’il est de ± 2300 pour tout le territoire des Etats-
Unis (GSMAÕ 2013bÖ× �Ù éÙçÙéÛäë èôÛãêÝßäÛßßÝâÝãä ãëéÝßßÙÛÚÝ � ÞãÝ ëêÝãäÞÝÜÜÝ
consolidation en Europe risque de ne pas être au rendez-vous, ce qui remet en
question le succès quant à l’émergence d’un opérateur pan-européen.

ìãäÚáèÞéäÛáã íëãëÚÙÜÝ �
Finalement, une tarification unique à travers toute l’Union Européenne
risque d’être tout aussi problématique, car il s’agit ici d’aligner les prix pra-
tiqués p.ex. en Roumanie (coût moyen d’un appel national: 2.2 ecents) et
ceux pratiqués p.ex. en France (coût moyen: 12.7 ecents).2
�Ý éLÞÚ èÞ çÚáñÜõâÝ çÙÚ ÚÙççáÚä � ÜÙ çÚáäÝéäÛáã èÝ Üô�çÝã ìãäÝÚãÝä Ýßä ÜÝ
concept de la neutralité du net, introduit par Wu å2003Ö× �ôÛèëÝ èÝÚÚÛõÚÝ éÝ
concept est la non-discrimination des données qui transitent à travers Internet.
Plus précisément, un opérateur de réseau ne doit pas avoir le droit de discrim-
iner les contenus échangés sur son réseau, même si ces contenus nécessitent
beaucoup de ressources, c.-à-d. de la bande passante. Comme ces ressources
sont essentiellement les câbles déployés et payés par l’opérateur de réseau, ce
dernier se voit habiliter de pouvoir monétiser l’utilisation de ses «tuyaux ». En
outre, l’évolution irrévocable des prix finaux vers des forfaits, forfaits qui con-
naissent par ailleurs des baisses considérables, a conduit l’opérateur de réseau
à se tourner vers les fournisseurs d’applications et de contenu pour trouver de
nouvelles sources de revenus.3 �Ýß áçëÚÙäÝÞÚß èÝ ÚëßÝÙÞ� Ýä ÜÝß æáÞÚãÛßßÝÞÚß
d’applications et de contenu sont évidemment en désaccord, car aucun camp
ne veut être le seul à contribuer à l’expansion du réseau et de chaque côté
on invoque des arguments relatifs à l’investissement et l’innovation des incita-
tions.4
2 Cf. le communiqué de presse �� �ú d���û÷÷û�� � � ú��ù ���� ���úùû� ú ÿ�ûþ �����d’un appel dans les pays membres de l’Union.
3 La littérature sur les marchés bi-face a montré qu’une plateforme (ici, les réseaux)préfèrent fixer des prix plus bas pour le côté le mieux valorisé, qui est ensuite subventionnépar des prix plus élevés sur l’autre côté (Armstrong, 2006; Rochet and Tirole, 2006)� ��÷ ü���sommateurs finaux sont souvent considérés comme étant le côté le mieux valorisé, puisqu’ilsprocurent des revenus publicitaires aux fournisseurs de contenus. Il apparaît donc cohérentque les opérateurs de réseaux se tournent vers les fournisseurs de contenus pour trouver denouvelles sources de revenus.
4 Beaucoup d’articles académiques sont également dédiés à ce débat. L’idée ici est dedécrire les incitations à innover et investir des opérateurs de réseaux ainsi que des four-nisseurs d’applications et de contenu. P.ex. Wu (2003) ü�ûù �� �öû���úùû�� ú �û�ú ��÷applications et contenus est plus importante que celle au niveau de réseau et le conduit àla conclusion de la supériorité en terme de bien-être social d’un régime de net neutralité. Al’inverse, Yoo (2010) �÷ù �� �öúû÷ �ö� � û�� �û÷ü�û�û�úù�û�� �� ����� ÿ�÷ �� !û����ù��social, car l’allocation de la bande passante (qui est une ressource rare) au plus efficace est

ìãäÚáèÞéäÛáã íëãëÚÙÜÝ "
Le débat sur la neutralité du net pose également des problèmes d’un point
de vue juridique. Par exemple, dans sa proposition sur le Connected Continent,
la Commission a défini des services spécialisés, c.-à-d. des services pouvant
bénéficier d’un traitement prioritaire. La définition sous-jacente invoque une
meilleure qualité de service pour ces services spécialisés, sans définir un seuil
pourtant, laissant ainsi beaucoup d’espace à l’interprétation. De nombreuses
discussions sont donc encore à venir.
Aux États-Unis, le problème ne réside pas dans la définition de services
pouvant bénéficier d’un traitement de faveur, mais dans la question de savoir
qui a le pouvoir de décider sur l’application ou non d’un régime de net neu-
tralité. En effet, la Federal Communication Commission (FCC) a publié en
2010 une ordonnance visant à interdire toute inégalité de traitement par le
fournisseur d’accès Internet.5 àÝçÝãèÙãäÕ éÝääÝ áÚèáããÙãéÝ Ù ëäë ÙããÞÜëÝ çÙÚ
la Cour d’appel américaine, faisant valoir que la FCC a choisi de ne pas classer
le broadband comme un service de télécommunications, mais comme Informa-
tion services.6 �ÚÕ ßÞÛêÙãä ÜÝ òÝÜÝéáââÞãÛéÙäÛáãß ïéä èÝ ´OO"Õ ÜÝ çáÞêáÛÚ èÝ
la FCC est limité aux seuls services de télécommunications.7 �Ýß Information
services ne sont donc pas sous le contrôle du régulateur fédéral américain. Une
réflexion sur le reclassement du broadband, pour qu’il tombe sous le mandat
de la FCC, est maintenant en cours, mais aussi et bien plus généralement, sur
la mission de la FCC dans l’ère d’Internet.
Comme indiqué ci-dessus, beaucoup de discussions restent encore à venir,
tout simplement «l’évolution naturelle d’un réseau qui cherche à satisfaire une demande de
la part du consommateur qui est en augmentation constante»(Yoo, 2010) (ù�ú�ûù ÿú� #ú�üPetulowa). D’autres auteurs concluent également qu’un régime discriminatoire est mieux enterme de bien-être social, car augmentant la diversification des contenus et applications ainsique des variétés de qualité de service, alors qu’un régime de net neutralité risque d’exclureles applications nécessitant une qualité moindre (Hermalin and Katz, 2007) � �ú��û÷ú�ùl’investissement en réseau et donc la réduction de la congestion (Bourreau et al., 2014)�
5 L’ordonnance «Open Internet Order »peut être trouvée ici�6 Cf. un article de Reuter’s ���úùû� r ü�ùù� � üû÷û���7 Le Telecommunications Act de 1996 est une loi qui régit le secteur de télécommunica-
tions aux Etats-Unis. Par ailleurs, elle définit les missions et leur étendue de la FCC.
ìãäÚáèÞéäÛáã íëãëÚÙÜÝ $
comme beaucoup de questions importantes sont encore sans réponse. Toute-
fois, le secteur des télécommunications s’est vu attribuer un rôle important
pour notre société. Il est donc crucial d’analyser et de comprendre les spéci-
ficités économiques sous-jacentes de ce secteur. L’objectif de cette thèse est
ainsi de contribuer à ces connaissance en se focalisant sur deux sujets majeurs
qui peuvent être classés dans le domaine de la concurrence dans le secteur des
télécommunications.
Concurrence entre services
Les deux premiers chapitres de cette thèse portent sur la concurrence entre
les services de communication fixes et mobiles. Cette concurrence est apparue
lorsque un nombre croissant de services de communications fixes sont égale-
ment devenus disponibles sur les réseaux mobiles.
L’émergence de la substitution fixe-mobile
Du côté de la demande, la concurrence entre services a commencé au niveau
des services vocaux. Comme les services de télécommunications mobiles sont
des biens d’expérience et en raison de prix et de facteurs hors-prix (p.ex. une
qualité de service moins bonne, la couverture du réseau géographique ou sim-
plement la maniabilité des téléphones mobiles disponibles à ce moment), le
taux de souscription aux offres mobiles était faible.8 ïêÝé ÜôÙâëÜÛáÚÙäÛáã èÝ
la couverture du réseau et la qualité de service, la substitution fixe-mobile
(SFM) a eu lieu et a commencé avec la substitution de la souscription d’une
deuxième ligne de téléphonie fixe par la souscription d’un forfait mobile. Puis,
la SFM en matière de services vocaux a continué à se développer. Mais cette
expansion a également été favorisée par les progrès technologiques. Le market-
8 Au début des années 1990, le poids d’un téléphone mobile variait entre 250 gr. et 500gr.

ìãäÚáèÞéäÛáã íëãëÚÙÜÝ %
ing et stratégie de prix comme appels on-net (c.-à-d. un appel émis et placé
sur le même réseau) ou comme c’est souvent le cas de nos jours, les appels
illimités, quel que soit le réseau de terminaison, sont également des facteurs
expliquant l’émergence de la SFM. Plus récemment, les opérateurs mobiles ont
aussi introduit des offres d’appels illimités de mobile vers les réseaux fixes. Par
conséquent, les appels nationaux, qu’ils soient terminés sur un réseau mobile
ou fixe, sont de plus en plus émis depuis un réseau mobile. D’après la Com-
mission, le trafic vocal sur les réseaux mobiles a dépassé le trafic vocal sur les
réseaux fixe en 2008 - 2009.
Le nombre de services disponibles à la fois sur l’infrastructure fixe et
l’infrastructure mobile n’a cessé de croître, entre autres, grâce à l’évolution
technologique. En 40 ans, quatre technologies, respectivement évolutions tech-
nologiques, ont été développées et commercialisées avec succès. Mais l’évolution
la plus impressionnante a eu lieu au cours des 15 dernières années avec l’émergence
de GSM, UMTS et enfin LTE.9
E&'*+-.'/ -013/'*'4.5+0 0- 1'66+/.17-.'/8 6'9.*08
Cette évolution technologique n’a pas affecté que les services vocaux, mais
a également permis de proposer des services nouveaux et innovants, avec le
haut débit mobile comme produit phare. Le haut débit mobile a bénéficié
de l’évolution technologique en ce que les vitesses de connexion et de trans-
mission ont constamment augmenté. La dernière technologie, LTE permettra
aux utilisateurs mobiles de surfer sur le Web à des vitesses de téléchargement
théoriques proches des100 Mbps.10 óÝ äÝÜß èëñÛäß èÝ èáããëÝß ßáãä ßÞDßÙãäß
9GSM: Global System for Mobile Communications, est arrivé au début des années 1990 etest à la base des technologie plus efficaces GPRS (General Packet Radio Service), introduitvers 2001 et EDGE (Enhanced Data rates for GSM Evolution), introduite vers 2004.UMTS: Universal Mobile Telecommunications System, avec l’extension HSPA (High Speed
Packet Access), introduite en 2010.LTE: Long Term Evolution.
10 Cependant, de telles vitesses de téléchargement sont sujettes à de nombreux facteurs,comme p. ex. le terminal utilisé, les fréquences utilisées par les opérateurs mobiles pour le

ìãäÚáèÞéäÛáã íëãëÚÙÜÝ O
pour permettre, entre autres, l’IP-TV sur les tablettes ou smartphones ou
encore visioconférence mobile.
La technologie permettant le broadband mobile la plus répandue à ce jour
est la HSPA (communément appelé 3G+), qui couvre pratiquement 100 % de
la population de l’Europe (Commission å2013ÖÕ ç× $IÖ× :ëÙãâáÛãßÕ ÜÝ äÙÞ�
de pénétration de l’Europe est, en moyenne, relativement faible par rapport à
d’autres parties dans le monde. A titre d’exemple et compte tenu de tous les
terminaux mobiles (smartphones, tablettes et ordinateurs portables), 54 % des
Européens ont souscrit à un forfait haut débit mobile à la fin de 2012 (idem, p.
74), alors que, le taux de pénétration de la Corée du Sud se rapproche de 110 %
(GSMA å2013aÖÕ ç× I<Ö× 11 àÝçÝãèÙãä ÜôÛâÙíÝ Ýßä äÚõß èÛêÝÚíÝãäÝ Ýã CÞÚáçÝ=
les pays nordiques annoncent un taux de pénétration de broadband mobile de
près ou au-dessus de 100 % (Danemark: 98 %, Suède: 106 %, Finlande: 107
%) et 18 des 27 Etats membres de l’UE ont des taux de pénétration en dessous
de la moyenne de l’UE (Commission å2013ÖÕ ç × $�Ö×
Souscription mobile croissante et tarification évolutive
Avec l’augmentation du taux de souscriptions mobiles, les opérateurs de réseaux
ont profité d’économies d’échelle, ce qui a conduit à une diminution du coût
moyen des services et donc des prix des abonnements mobiles. Mais les
économies d’échelle n’étaient pas le seul facteur de la baisse des prix des com-
munications mobiles. L’intensification de la concurrence joue également un rôle
majeur. Par exemple, en janvier 2012, Free Mobile est entré dans le marché
des communications mobiles français comme quatrième opérateur de réseau
déploiement LTE, le type d’antenne installé, le nombre de consommateurs connectés à unecellule donnée, etc.
11 GSMA (GSM Association) est une association qui représente les intérêts de plus de1000 opérateurs de télécommunications mobiles qui utilisent les normes GSM et visant àélaborer et à promouvoir des normes inter-réseaux, telles que par exemple l’utilisation decartes SIM.

ìãäÚáèÞéäÛáã íëãëÚÙÜÝ ´<
mobile.12 FÚÝÝ >áñÛÜÝ Ù ëäë ÜÙãéë ÙêÝé ÞãÝ çáÜÛäÛ?ÞÝ èÝ çÚÛ� ÙíÚÝßßÛêÝ Ýä Ù
déclenché l’ère du low cost dans le secteur des télécommunications français. A
titre d’exemple, la facture mensuelle moyenne pour les services mobiles peut
être mentionnée: la facture moyenne était approximativement de 23 e avant
l’entrée sur le marché de Free et, d’après l’ARCEP, environ de 18 e à la fin
de Septembre 2013 (ArcepÕ 2014bÖ× @ãÝ ÙÞäÚÝ ÚÙÛßáã Ý�çÜÛ?ÞÙãä ÜÙ ñÙÛßßÝ èÝß
forfaits mobiles est l’intervention réglementaire qui a induit une diminution
considérable des terminaisons d’appels mobiles.13
�Ýß évolutions technologiques mentionnées avant ont également été accom-
pagnées d’une évolution de la tarification des forfaits. Ainsi, avec l’introduction
de la technologie GPRS, la tarification est désormais basée sur la consomma-
tion effective et non plus sur la connexion. Autrement dit, avant GPRS, le
consommateur devait payer pour le temps qu’il a été connecté comme il oc-
cupait une "ligne" pleine pendant son temps de connexion. Ceci est due à
la technique dite de commutation de circuits. Avec le GPRS, le réseau évolué
vers la technique dite commutation de paquets qui permet le partage de la ligne
entre plusieurs utilisateurs connectés. Les frais à payer par l’utilisateur dans
une infrastructure à commutation de paquets sont donc basés sur le volume
de données (les paquets) effectivement envoyé ou reçu, et donc sur la base de
la consommation effective.
Il convient toutefois de noter que l’évolution des réseaux de communication
ne constitue pas le seul facteur responsable de l’évolution de l’écosystème des
12 Si les opérateurs de réseaux mobiles virtuels sont ajoutés, le marché français métropoli-tain compte pas moins de 47 opérateurs (tous marchés confondus, résidentiel et profession-nel). Même si la plupart des MVNO sont spécialisés dans un segment de marché donné (p.ex. les personnes âgées, les étrangers, etc.), ils représentaient au total 11,6 % du marchéfrançais en juin 2014 (Arcep, 2014a)�
13 Les terminaisons d’appels mobiles peuvent être défini comme la charge qu’un opérateurA doit payer un opérateur B pour que ce dernier achemine (termine) l’appel émis depuisle réseau du premier. En s’appuyant sur les chiffres fournis par BEREC (Body of Euro-pean Regulators of Electronic Communications), GSMA indique une diminution annuelleallant jusqu’à 18 % des terminaisons d’appels mobiles pendant la période 2006-2012 (GSMA(2013a), ÿ ���)�

ìãäÚáèÞéäÛáã íëãëÚÙÜÝ ´´
communications. Afin de bénéficier pleinement des avantages offerts par les
réseaux améliorés, les consommateurs doivent s’équiper de terminaux compat-
ibles. L’industrie des appareils mobiles tels que les smartphones et les tablettes
a réagi à ces nouvelles possibilités offertes par les réseaux mobiles en dévelop-
pant des terminaux qui sont loins d’être de simples téléphones. Cette nouvelle
génération de terminaux offre des possibilités d’usage similaires aux ordina-
teurs de bureau grâce à l’augmentation de la convivialité (p. ex. des icônes
d’illustration) ou de l’efficacité technique (p. ex. des processeurs plus efficaces,
des écrans avec une résolution plus élevée). L’utilisateur rencontre ainsi une
meilleure qualité de service lorsqu’il regarde un film sur sa tablette ou smart-
phone. En outre, les fournisseurs de contenu tels que les réseaux sociaux, la
vidéo ou la musique en streaming ont développé des applications qui permet-
tent aux utilisateurs de consommer ces contenus sur n’importe quel terminal,
ce qui augmente l’utilité de souscrire à une offre mobile des consommateurs.
Consommation de data croissante
Parallèlement au taux de pénétration mobile croissant, le taux de pénétration
des terminaux mobiles est également en forte augmentation. Ces terminaux
sont supposés contribuer à l’augmentation du trafic de données mobiles. Cisco
fournit un rapport et les prévisions de trafic de données mobiles. Ce rapport
indique qu’en 2012, le traffic de data mobile a augmenté de 70 % et que 885
pétaoctets par mois ont été échangés sur les réseaux mobiles, ce qui correspond
à «18 fois la taille de l’ensemble du traffic Internet en 2000»(Cisco å2014ÖÕ ç×
1).14 óÝ çÜÞßÕ àÛßéá ÝßäÛâÝ ?ÞÝ ÜÝ äÚÙAé èÝ èáããëÝß âáñÛÜÝß éÚáBäÚÙ � Þã äÙÞ�
de 66 % par an sur la période 2012 - 2017 (idem, p. 3). Cette croissance du
trafic sera soutenue par i) la poursuite du déploiement du réseau LTE («En
2012, [. . . ] une connexion 4G a généré en moyenne 19 fois plus de trafic que
14 Traduit par Marc Petulowa. 1 pétaoctet (Pb) = 1000 téraoctet (To) = 1 000 gigaoctets(Go) . Pour illustrer, un film de 2 heures en HD nécessite environ 4 Gb

ìãäÚáèÞéäÛáã íëãëÚÙÜÝ ´î
les connexions autre que 4G»(idem, p. 2)) et ii) l’importance croissante de
la pénétration des smartphones (environ 68 % du trafic mobile mondial sera
généré par les smartphones (idem, p. 7)).
Bien que le haut débit mobile va continuer à gagner en importance, il ne
représentera qu’une fraction du trafic Internet mondial. Comme Cisco å2013bÖ
le rapporte, le trafic de data mobile ne représente que 2 % du trafic IP mondial
en 2012 et environ 9 % en 2017. L’essentiel du trafic Internet sera ainsi généré
par le haut débit fixe, qui présente les avantages indéniables i) d’offrir des
vitesses de connexion plus élevés que le haut débit mobile et ii) des volumes de
données illimités.15 àÝ èÝÚãÛÝÚ ÙêÙãäÙíÝÕ äáÞäÝæáÛßÕ Ýßä èG � ÜÙ ÚÙÚÝäë èÞ ßçÝéäÚÝ
radioélectrique mis à disposition aux opérateurs mobiles afin de fournir leurs
services mobiles, ce qui réduit leur possibilité d’offrir des volumes de data
mobiles élevés.
Evolution technologique et communications fixes
Comme les réseaux mobiles, les réseaux fixes ont été améliorés également. Le
réseau cuivre traditionnel, qui, au début ne permettait que des services vocaux
analogiques et l’accès Internet à bande étroite, a fait l’objet d’une évolution
constante. La paire de cuivre a bénéficié de la numérisation et les informations
envoyées sur un réseau fixe sont désormais converties en données en s’appuyant
sur le protocole IP (Internet Protocol). Ceci a permis un usage plus efficace
de la bande passante, qui est accompagné d’une gamme élargie de service avec
notamment Voix sur IP (VoIP), TVIP avec les séances de rattrapage et la VsD
et finalement l’Internet haut débit.16 ïêÝé ÜÙ âÛßÝ � ãÛêÝÙÞ êÝÚß ÜÝ ÚëßÝÙÞ èÝ
15 Dans son rapport de 2012, un seul des opérateurs interrogés avait plafonné le volumede données inclus dans ses offres fixes (OECD (2012), ÿ� ��)�
16 Video sur Demande (VsD) est un service qui permet aux consommateurs de regardern’importe quelle émission télé à n’importe quel moment qu’ils souhaitent, à condition quele contenu soit compris dans le catalogue VoD de l’opérateur. Une séance de rattrapage
(Catch-up TV en anglais) est définie comme la possibilité de revoir une émission télé trèspeu de temps après sa première diffusion et ce pendant quelques jours seulement.

ìãäÚáèÞéäÛáã íëãëÚÙÜÝ ´I
fibre optique, le réseau fixe sera en mesure d’offrir des vitesses de connexion
jusqu’à 1 Gbps en liaison descendante et 10 Mbps pour la liaison montante.
Compte tenu du déploiement des dernières technologies fixes et mobiles,
il apparaît que les deux infrastructures convergentes. Cette convergence vers
tout IP implique que la relation entre les services fixes et mobiles change.
Comme indiqué avant, les services vocaux sont soumis à une substitution crois-
sante entre fixe et mobile: au début de 2011, environ 27 % des Européens ont
déclaré utiliser exclusivement des services de téléphonie mobiles contre 21 %
au tournant de 2005/2006 (EurobarometerÕ 2006Õ 2011Ö× Cã éÝ ?ÞÛ éáãéÝÚãÝ
les États-Unis, un sondage réalisé par le NHIS révèle que près de 45 % des mé-
nages américains étaient «mobile-only» au premier semestre de 2013, contre
approximativement 6 % fin 2005, début 2006 (Blumberg & LukeÕ 2007Õ 2014Ö×
Toutefois, la relation entre haut débit fixe et haut débit mobile est moins
nette. En fait, elle peut aller dans les deux sens.
Substitution fixe-mobile en matière de broadband
Évaluer cette relation sur le côté de la demande est délicate étant donné
l’hétérogénéité des besoins des consommateurs. Certains consommateurs sont
en mesure de satisfaire leurs besoins de consommation en utilisant unique-
ment une offre mobile. Selon une comparaison internationale faite en 2012
par le régulateur britannique OFCOM, plus d’un quart des ménages italiens
ont seulement le haut débit mobile à la maison (OFCOM å2013ÖÕ ç× î´IÖ×
17 ïÞßßÛÕ Þã âëãÙíÝ ÙÞßäÚÙÜÛÝã ßÞÚ éÛã? ÛãèÛ?ÞÝ ÞäÛÜÛßÝÚ Ý�éÜÞßÛêÝâÝãä ÜÝ HÙÞä
débit mobile pour se connecter à Internet. A l’inverse, certains consommateurs
sont de grands consommateurs d’Internet et sont abonnés à la fois à une offre
haut débit fixe et mobile afin de profiter de plus de volume de données.
La seule preuve de SFM en matière de haut débit, qui par ailleurs a été
17 Office of Communications.

ìãäÚáèÞéäÛáã íëãëÚÙÜÝ ´�
approuvée par une autorité nationale, est fournie par le marché autrichien. Au
cours de sa révision des marchés pertinents en 2009, l’autorité nationale de
régulation autrichienne, TKK, a considéré le haut débit mobile comme étant
«[. . . ]un substitut suffisamment proche pour les connexions DSL et câble [,
d’où la décision] de les inclure [toutes les connexions] dans le même marché
de détail»(BerecÕ 2011Ö×18 FÙéÝ � éÝ éáãßäÙäÕ òJJ Ù èëéÛèë èÝ ÚÝäÛÚÝÚ ÜÝß
contraintes réglementaires ex ante sur l’accès haut débit sur le marché de gros
pour les offres destinées aux particuliers.
SFM et le côté offre
Vu du côté de l’offre, les réseaux mobiles et fixes sont très probablement des
compléments, à cause de la capacité limitée des réseaux mobiles. N’utiliser
que les réseaux mobiles pour transiter le trafic de données mondial apparaît
comme une solution insoutenable. Comme la demande des consommateurs
dans le trafic de données est en augmentation constante, les opérateurs de
télécommunications ont besoins de leurs réseaux fixes pour décharger au moins
une partie des données passant par les réseaux mobiles afin d’assurer un niveau
donné de qualité de service.19
ÉêÛèÝââÝãäÕ ÜÝß éáãßáââÙäÝÞÚß ãÝ çáÞÚÚÙÛÝãä çÙß ñëãëAéÛÝÚ èÝß ëêáÜÞ�
tions technologiques décrites ci-dessus si les opérateurs de télécommunications
n’avaient pas investi dans les infrastructures. Le déploiement de telles infras-
tructures de réseau nécessite des coûts d’investissement énormes.20
KM Telekom - Control-Kommission19 Détourner le trafic de données mobiles est possible grâce au Wi-Fi Offload, par lequel les
consommateurs se connectent, via le Wi-Fi, avec leur terminal mobile à un réseau broadbandfixe. Dans certains pays, les opérateurs offrent à leurs abonnés haut débit fixe la possibilité«d’ouvrir» leur accès broadband fixe, créant ainsi un réseau Wi-Fi communautaire. Un autremoyen de déchargement de trafic est Femtocell, qui peut être défini comme une extensiondu réseau broadband fixe. Via une “station de base miniature" connectée à l’accès fixe,les opérateurs peuvent augmenter ou améliorer le signal du réseau mobile. Les donnéeséchangées sont, toutefois, transitées par le réseau fixe.
20 En France, les coûts total d’investissement pour le déploiement d’un réseau de fibreoptique à l’échelle nationale sont estimés autour de 20-30 milliards e. Les coûts de miseà niveau du réseau mobile vers LTE sont délicats à estimer, dépendant de l’équipement

ìãäÚáèÞéäÛáã íëãëÚÙÜÝ ´�
Des coûts d’investissement élevés et une concurrence féroce sur les marchés
de services ont poussé les opérateurs à adopter des stratégies permettant i)
d’attirer de nouveaux consommateurs, respectivement pour réduire la volonté
des consommateurs existants de changer d’opérateur et ii) d’encourager l’adoption
de nouvelles infrastructures. Ce dernier point est particulièrement important si
l’on tient compte des consommateurs mobile-only et les coûts d’investissement
importants dans les infrastructures de réseaux fixes. En outre, ceci devient
d’autant plus important qu’aucuns services innovants (le service dit killer ser-
vices) ont été développés. L’objectif d’un tel service est de créer un besoin
chez le consommateur et donc une incitation pour ce dernier de souscrire à
une nouvelle offre.21
N08 &0/-08 *.P08 1'660 .//'&7-.'/ 67QR0-./4
Une stratégie adoptée est la vente liée de plusieurs services. Dans le secteur
des télécommunications, le regroupement de services en une seule offre existe
sous des formes diverses. Dans le segment mobile, presque toute offre peut être
considérée comme une offre groupée incluant une quantité donnée de minutes
pour appeler, de SMS et un certain volume de data limité. Pareil pour le
marché fixe, où presque chaque opérateur offre une gamme complète d’offres
groupées de services avec deux des trois ou les trois services possibles (télé-
phonie fixe, haut débit fixe et TV). Les offres dual-play, c.-à-d. un ensemble
de services de deux sur trois, sont les plus populaires en Europe avec environ
25 %, suivies par des offres triple-play (16 %, Eurobarometer å2013ÖÕ ç× î"Ö×
La dernière évolution dans la pratique des ventes liées est la combinaison de
déjà installé dans les stations de base par chaque opérateur de réseau mobile. Toutefois,des consultants de Polyconseil estiment cette mise à niveau à environ 2 milliards e pour lesopérateurs Orange, SFR et Bouygues et à environ 1 milliard pour le participant Free Mobile.Outre les coûts de cette mise à niveau de l’infrastructure, les licences nécessaires devaientêtre acquises, pour lesquels les quatre opérateurs ont payés 3,5 milliards e. Le rapport dePolyconseil est consultable ici�
21 A titre d’exemple, ces killer services dans les communications mobiles sont le servicevoix pour la 2G et le haut débit mobile pour la 3G.

ìãäÚáèÞéäÛáã íëãëÚÙÜÝ ´"
services fixes et mobiles en une seule offre. Au niveau européen, ces offres n’ont
pas encore été souscrites (env. 4%), mais de nombreuses divergences existent
entre les États membres de l’UE. Dans certains pays, des offres quadruple-play
ne semblent pas attirer l’intérêt d’une grande partie des consommateurs. Un
rapport Analysys Mason de 2013 prévoit des taux d’abonnement quadruple-
play d’environ 10 % en Allemagne, en Pologne ou au Royaume-Uni. 22 ï
l’inverse, ces offres quadruple-play reçoivent beaucoup d’attention de la part
des consommateurs dans d’autres pays. En Espagne, par exemple, la com-
mercialisation de l’offre quadruple-play Fusiòn de Telefònica a incité 21 % des
ménages espagnols de souscrire à cette offre en 2012 (et son taux d’adoption
est estimé à doubler en 2017).23 �Ýß ménages français semblent également être
friands des offres quadruple-play, puisque le taux de souscription est estimé à
42 % en 2012 avec un taux prévu de 75 % en 2017.24
ØáÞÚ ÜÝß éáãßáââÙäÝÞÚßÕ éÝß áSÚÝß íÚáÞçëÝß çÚëßÝãäÝãä èÝ âÞÜäÛçÜÝß ÙêÙã�
tages. Outre le fait de plus de simplicité, de transparence et un nombre réduit
de factures, ils les paient également moins chères, puisqu’elles sont proposées
avec un rabais. Pour les entreprises par contre, les effets de cette pratique ne
sont pas toujours clairs. Le succès à court terme de Fusiòn de chez Telefònica,
ainsi que des offres quadruple-play en France est visible. En particulier, Tele-
fònica a réussi à récupérer toutes ses pertes en terme de clients des années
2011/2012 en seulement quelques mois après le lancement de Fusiòn.25 Cã éÝ
qui concerne le marché français, environ 3 ans après le lancement de son of-
fre quadruple play, Orange prétend qu’approximativement un tiers de sa base
client fixe ont souscrit à une offre quadruple-play. Il est par ailleurs estimé que
22 Le rapport d’Analysis Mason peut être trouvé ici�23 idem.24 idem.25 En 2011/2012, l’opérateur historique espagnol a abandonné le système de subventions
de terminaux, suite à quoi plus de 1 million de consommateurs ont quitté Telefònica pours’abonner auprès d’un des concurrents. Voir, par exemple here�

ìãäÚáèÞéäÛáã íëãëÚÙÜÝ ´$
près de la moitié de la base de clients de Free a souscrit à son offre groupée.26
òáÞäÝæáÛßÕ ÜÙ çÚÙäÛ?ÞÝ èÝß êÝãäÝß ÜÛëÝß çÝÞä ÙêáÛÚ Þã ÛãéáãêëãÛÝãä ÛâçáÚäÙãä×
Plus précisément, le haut débit mobile a été le service à valeur ajoutée pour les
opérateurs lorsque les forfaits mobiles avec accès 3G ont été commercialisés.
Désormais, ce service à valeur ajoutée fait partie d’une concurrence féroce
pour les parts de marché et l’augmentation de la fidélité des consommateurs.
Comme les consommateurs sont rationnels dans le sens où ils choisissent l’offre
la moins chère qui convient le mieux à leurs besoins, la vente liée avec son
rabais associé risque de diminuer la valeur de marché des services haut débit.
Mais, comme tous les opérateurs introduisent des offres groupées, il faut se
poser la question quant à la rentabilité de ces stratégies de tarification.
Chapitre 1: Substitution Fixe-Mobile et ventes liées
Le premier chapitre de cette thèse traite de cette question et analyse les im-
pacts potentiels de la pratique des ventes liées dans le secteur des télécom-
munications en tenant compte de la présence de la SFM. En particulier, via
une modélisation micro-économique, l’analyse porte sur l’impact d’introduire
un rabais sur la demande des consommateurs pour l’offre groupée fixe-mobile,
la demande pour le fixe et mobile en tant que services isolés et la demande
de mobile-only. Les effets sur les profits des opérateurs ainsi que le bien-être
social sont également analysés.
Cette analyse considère deux entreprises multi-marché et montre que, en
cas de symétrie, la pratique des ventes liées est une situation semblable au
dilemme du prisonnier: à l’équilibre, aucune entreprise ne veut, mais toutes les
deux doivent offrir un rabais, à cause de l’incitation individuelle à en proposer
et donc attirer plus de clients.27 �Ýß çÚáAäß èÝß ÝãäÚÝçÚÛßÝß èÛâÛãÞÝãäÕ âTâÝ
26 Source: La Tribune�27 Les entreprises sont supposées symétriques lorsque les consommateurs ont un même
prix de réserves pour les services fixes quel que soit l’entreprise qui offre le service.
ìãäÚáèÞéäÛáã íëãëÚÙÜÝ ´%
si la part des consommateurs qui s’abonnent à deux services augmente (c.-à-d.
que le nombre de consommateurs mobile-only diminue lors de l’introduction
des offre groupées). Mais, avec le rabais qui agit comme un outil concurrentiel,
les opérateurs attirent plus de consommateurs vers leur offre groupée. Comme
le prix ce cette dernière est inférieur à la somme des prix des services isolés,
les bénéfices sont réduits. Pour les consommateurs, cette réduction de prix
est parfaitement bénéfique. Par ailleurs, l’augmentation du surplus du con-
sommateur est telle que les pertes de bénéfices des opérateurs sont plus que
compensées, de sorte que, in fin, le bien-être social augmente.
Si, par contre, une entreprise est en mesure de fournir un service fixe de
plus grande valeur (c.à-d. si les entreprises ne sont pas symétriques), l’analyse
montre que cette entreprise s’accapare de profits plus importants en offrant un
rabais, alors que cette stratégie est une stratégie dite de Maximin pour le con-
current: en proposant également des offres groupées malgré son désavantage
compétitif, il minimise ses pertes. Néanmoins, l’entreprise qui propose le ser-
vice fixe le mieux valorisé par le consommateur n’a aucun intérêt à provoquer
une saturation complète du marché fixe et induire la totalité des consomma-
teurs mobile-only à s’abonner à un service fixe. En effet, la présence de ce
type de consommateur implique que le marché des services fixes ne soit pas
entièrement couvert. Si c’était le cas et le marché fixe entièrement couvert, la
pratique des ventes liées ne serait pas une stratégie rentable puisqu’à l’équilibre,
les opérateurs n’offriront pas de rabais. En outre, si les deux services étaient
parfaitement substituables, la stratégie en question ne serait pas rentable non-
plus. Cela montre que le bundling est rentable pour au moins une entreprise,
à condition que les services fixes et mobiles ne soient ni trop complémentaires,
ni trop substituables. Finalement, comme pour le cas symétrique, le surplus
du consommateur et de bien-être sociale augmente.

ìãäÚáèÞéäÛáã íëãëÚÙÜÝ ´O
Chapitre 2: Caractéristiques socio-démographiques et ser-
vices de télécommunications
La substitution fixe-mobile est également au cœur du deuxième chapitre de
cette thèse. Le chapitre 2 tente d’évaluer de manière empirique les effets des
variables socio-démographiques sur la demande des services de télécommuni-
cations en France.
En utilisant des données issues d’une enquête de satisfaction avec l’opérateur
mobile des consommateur, un modèle logit multinomial est développé. Ce tra-
vail vise à identifier les caractéristiques qui influencent la probabilité d’un
consommateur à être mobile-only, de souscrire à une offre groupée ou souscrire
à plusieurs services isolés. Les premiers résultats confirment les conclusions
de la littérature existante: moins le consommateur dispose de ressources fi-
nancières, et plus forte est la probabilité qu’il est mobile-only, ce qui suggère
l’existence d’une contrainte budgétaire forte pour ce type de consommateur.
Un autre résultat suggère un avantage compétitif de l’opérateur historique (et
plus particulièrement dans les zones rurales) dans le sens où les consommateurs
d’Orange sont moins susceptibles d’être mobile-only que les clients des autres
acteurs du marché.
L’interaction entre réglementation sectorielle et droit de
la concurrence: le cas du ciseau tarifaire
Les chapitres 1 et 2 portent sur la concurrence entre les services, qui peut
également être considérée comme la concurrence inter-plateforme ou une con-
currence basée sur les infrastructures. Mais, au début du processus de libérali-
sation à la fin des années 1990, la concurrence a eu lieu sur l’infrastructure fixe,
puisque les réseaux mobiles n’ont pas encore été suffisamment déployés pour
exercer une pression concurrentielle sur les réseaux fixes à cette époque. Ainsi,

ìãäÚáèÞéäÛáã íëãëÚÙÜÝ î<
la concurrence intra-plateforme est la première forme notable de concurrence
dans le secteur des télécommunications. La réglementation sectorielle a sa part
dans cet événement.
En plus des contraintes réglementaires, les acteurs du secteur des télé-
communications doivent également se conformer au droit de la concurrence.
Cependant, l’interaction entre la réglementation et du droit de la concurrence
peut avoir des répercussions importantes sur l’industrie. Le chapitre trois vise
à analyser cette interaction et ses impacts en considérant spécifiquement la
réglementation du ciseau tarifaire.
Le secteur des télécommunications est fortement influencé par la réglemen-
tation sectorielle. L’objectif de la réglementation sectorielle est de créer et de
promouvoir un environnement concurrentiel en utilisant différents outils tels
que l’obligation d’accès et la réglementation des prix. Même si ces outils pour-
raient concerner les deux secteurs mobiles et fixes, ce chapitre se concentrera
sur l’intervention réglementaire dans le secteur fixe.
La réglementation du secteur a été mise en place lorsque le processus de
libéralisation du secteur des télécommunications a été lancé.28 ïêÙãä éÝ çÚá�
cessus, les réseaux fixes étaient sous le contrôle d’un monopole légal ou privé,
parce qu’il était plus rationnel d’un point de vue économique que ce réseau
soit déployé par une seule entreprise, plutôt que par plusieurs entreprises con-
currentes. Avec l’introduction de la concurrence dans les marchés des télé-
communications fixes, la préoccupation principale des autorités était de créer
28 Plusieurs autorités sont impliquées dans le processus de libéralisation. Premièrement,la Commission en poursuivant son objectif de créer un marché intérieur unique au niveaueuropéen. Elle fixe des objectifs à atteindre et fournit un cadre réglementaire et les remèdesà d’éventuelles défaillances de marché. Voir par exemple l’avis de la Commission surl’application des règles de concurrence aux accords d’accès dans le secteur des télécom-munications (Commission (1998) (� ���� �ú�÷ ü� �û ÷ûù la communication relative à
l’application des règles de concurrence). Deuxièmement, au niveau national, les autoritésnationales de la concurrence (ci-après ANC ) surveillent l’application de la législation eu-ropéenne et nationale en matière de concurrence et le bon fonctionnement du processusconcurrentiel. Enfin, également au niveau national, les autorités nationales de réglementa-tion (ci-après ANR) ont pour mission spécifique la mise en place d’un cadre réglementairenational en accord avec les prescriptions de la Commission.

ìãäÚáèÞéäÛáã íëãëÚÙÜÝ î´
le meilleur environnement concurrentiel dans le marché en aval, compte tenu
du fait que l’infrastructure de réseau fut héritée par l’ancien monopole légal.
Ce dernier est ainsi devenu monopole contrôlant une infrastructure essentielle.
Cette configuration, un monopole en amont qui est verticalement intégré et
est en concurrence sur le marché en aval avec des concurrents qui doivent
s’appuyer sur le réseau de l’entreprise intégrée, a soulevé (et soulève encore)
des préoccupations d’abus de position dominante par l’entreprise intégrée.
De ce fait, une intervention réglementaire a été mise en place.
Quelques outils réglementaires
Un premier pas vers la concurrence en aval effective a été fait en introduisant
l’obligation de garantir l’accès au réseau imposée à l’entreprise verticalement
intégrée. Plus précisément, l’opérateur historique a été obligé de dégrouper
la boucle locale, c.-à-d. d’accorder l’accès à la partie du réseau qui relie le
consommateur au répartiteur principal.29 �Ý èëíÚáÞçÙíÝ çÝÞä TäÚÝ éáâçÚÛß
comme la location des lignes qui relient les clients au reste du réseau à un prix
dénommé «charge d’accès».
Toutefois, le dégroupage n’a pas suffi pour éviter d’éventuels abus de po-
sition dominante par le biais de charges d’accès excessives. Considéré comme
une entrave au bon fonctionnement du jeu concurrentiel, ce comportement
est interdit par le droit de la concurrence, et ce qu’il soit européen ou na-
tional.30 Cã áÞäÚÝÕ ÜÝß ï:U ßôÙççÞÛÝãä ßÞÚ ÞãÝ ÚëíÜÝâÝãäÙäÛáã ex ante des
charges d’accès.31 ØáÞÚ ?ÞÝ éÝ èÝÚãÛÝÚ áÞäÛÜ ßáÛä ÝDéÙéÝÕ ÜôÝãäÚÝçÚÛßÝ êÝÚäÛ�
29 Le répartiteur principal est un équipement qui recueille tous les fils qui relient lesclients à l’opérateur de télécommunications et qui établit l’interconnexion entre deux partiescommunicantes.
30 Voir notamment le Traité sur le fonctionnement de l’Union européenne, Art.102 (2008).Le Sherman Act de 1890, et notamment la §2, est la loi équivalente aux États-Unis.
31 Plusieurs méthodes de régulation des prix existent. Les plus courantes sont le Rate of
Return (ci-après, RoR) et le price cap (PC ). Alors que la première vise à établir un niveaude prix tel que les investisseurs gagnent un taux de rendement fixe sur le capital qu’ils ontinvesti, la dernière établit un niveau de prix maximum qui ne peut être dépassé. Le RoR a étéabandonné au profit du PC, parce le RoR peut inciter l’entreprise réglementée être inefficace

ìãäÚáèÞéäÛáã íëãëÚÙÜÝ îî
calement intégrée est soumise à une autre obligation: la séparation comptable
(CommissionÕ 2005Ö× VÝÜáã éÝääÝ áñÜÛíÙäÛáãÕ ÜôÝãäÚÝçÚÛßÝ éáãéÝÚãëÝ Ýßä áñÜÛíëÝ
de fournir les renseignements sur ses coûts liés à l’exploitation de son réseau
(coûts de déploiement et de maintenance, la dépréciation des actifs, etc.) à
son ANR. Cet échange devrait permettre aux ANR de déterminer de manière
transparente les éléments de coûts pertinents à être couverts par la charge
d’accès. Aussi, cette obligation est censée fournir des informations précises
afin de
«[. . . ]permettre de vérifier qu’il n’y a eu aucune discrimination in-
due entre les services fournis de façon interne et ceux fournis à
l’extérieur [. . . ]» (Commission å2005ÖÕ ïÚä× �Õ ç× î""W"$Ö×32
ïÞ�èÝÜ� èÝ ÜÙ ÚëíÜÝâÝãäÙäÛáã èÝß çÚÛ� Ýã ÙâáãäÕ ÜÙ ÚÝÜÙäÛáã ÝãäÚÝ ÜÝß çÚÛ� Ýã
amont et en aval préoccupe également. Comme indiqué ci-dessus, la fourniture
du service en amont doit être exempte de toute discrimination entre le bras
en aval de l’opérateur historique et son rival en aval. Les autorités sont donc
en terme de coûts (faible incitation à réduire les coûts et une forte incitation à surinvestir,et donc plus de revenus nécessaires pour récupérer les investissements, ce qui in fine faitgrimper les prix). Même si le PC a des inconvénients tels que l’asymétrie d’informationentre l’autorité de réglementation et de l’entreprise réglementée ou l’incitation à réduireles coûts par la réduction de la qualité, il est largement adopté. Une troisième approchede réglementation des prix est la règle du partage des profits (PP). Il définit un intervallede RoR et le partage des profits se fait de manière suivante: à chaque fois que le taux derendement effectivement réalisé au cours d’un exercice comptable se trouve à l’intérieur decet intervalle, l’entreprise peut garder tous ses bénéfices et, lorsque le taux de rendementeffectif dépasse l’intervalle, les gains sont partagés avec les consommateurs, p. ex. par lebiais d’une baisse, resp. augmentation des prix.
32 La séparation comptable est une pratique très répandue en Europe. En dehors du vieuxcontinent, les entités en amont et en aval des opérateurs historiques opèrent souvent sousdes formes de séparation verticale plus strictes. Par exemple, au Royaume-Uni en 2005, laproposition de l’opérateur historique britannique British Telecom (BT) pour une séparationverticale plus stricte fut approuvée par l’OFCOM, l’ ARN (et ACN) britannique. Depuis,certaines activités de gros sont gérées par une unité distincte de BT, où les gestionnairesont des incitations locales, ce qui veut dire qu’ils cherchent à maximiser les bénéfices deleur unité plutôt que les profits de l’ensemble du groupe (Cave, 2006b)� �öúù��÷ �þ��ÿ��÷de séparation verticale plus stricte sont le cas de l’opérateur historique australien Telstra(avec une approche similaire à celle de l’OFCOM) ou aux Etats-Unis avec une séparationstructurelle stricte des opérations de télécommunications. Toutefois, en 2006, les États-Unisont entamé une réflexion pour revenir sur l’approche de la séparation structurelle (OECD,2006)�

ìãäÚáèÞéäÛáã íëãëÚÙÜÝ îI
vigilantes en ce qui concerne l’écart entre les prix en amont de l’opérateur his-
torique (i.e. la charge d’accès) et son prix en aval. En particulier, elles veillent
à empêcher tout comportement anticoncurrentiel de la part de l’opérateur his-
torique qui pourrait apparaître si l’écart mentionné ci-dessus était trop étroit.
De ce fait, l’écart serait trop étroit pour qu’une entreprise non intégrée et ac-
tive sur le marché en aval soit viable économiquement. Un tel écart trop étroit
entre les prix en amont et en aval définit généralement un ciseau tarifaire.
Le débat sur le ciseau tarifaire
Une table ronde organisée par l’OCDE sur le sujet du ciseau tarifaire fournit
une définition du ciseau tarifaire généralement acceptée:
Un ciseau tarifaire ne peut émerger que lorsque a) une firme active
sur le marché en amont produit un input pour lequel il n’existe
pas de substituts suffisamment comparables, (b) la firme active sur
le marché en amont vend son input à un ou plusieurs firmes sur
le marché en aval et (c) la firme active sur le marché en amont
est en concurrence directe avec ces firmes sur le marché en aval.33
åOECD å2009cÖÕ ç× $Ö
Un débat vif est en cours sur la reconnaissance du ciseau tarifaire comme
infraction indépendante au droit de la concurrence ou bien s’il vaut mieux
traiter des cas de ciseau tarifaire comme une théorie du préjudice existante
(i.e. prix prédateurs ou refus de vente). Ce débat oppose deux positions
radicalement différentes prises par les États-Unis et l’UE.
La position américaine: le jugement Trinko
Une première caractéristique essentielle de l’approche américaine relative au
ciseau tarifaire, est que les tribunaux américains considèrent la réglementation
33 Traduit par Marc Petulowa.
ìãäÚáèÞéäÛáã íëãëÚÙÜÝ î�
sectorielle et le droit de la concurrence comme des substituts. Par ailleurs,
la réglementation, quand elle existe, prime sur le droit de la concurrence. Le
jugement historique dans l’affaire Trinko est parfaitement clair sur ce point.34
Cã î<<�Õ ÜôáçëÚÙäÝÞÚ HÛßäáÚÛ?ÞÝ èÞ :ÝX YáÚZÕ [ÝÚÛ\áãÕ Ù ëäë ÙééÞßë èôÙêáÛÚ
fourni à ses concurrents en aval un produit de gros (l’accès au réseau, dont
le prix a été régulé) de moindre qualité, empêchant ainsi ses concurrents à
rivaliser efficacement dans le marché en aval. Par ailleurs, l’entreprise accusée
avait l’obligation réglementaire de fournir l’accès à ses concurrents non intégrés.
La partie plaignante a invoqué une violation à la fois du cadre réglementaire
mis en place par la Federal Communications Commission (FCC) et le droit de
la concurrence, et notamment l’article 2 du Sherman Act.
Dans ce cas, la Cour Suprême des États-Unis a enquêté pour savoir si
les obligations réglementaires de faire du commerce (i.e. regulatory duty to
deal) induisent des obligations légales de faire du commerce (i.e. antitrust
duty to deal).35 �Ù àáÞÚ Ù ]Þíë ?ÞÝ ÜôáñÜÛíÙäÛáã ÚëíÜÝâÝãäÙÛÚÝÕ ßáÞß ÜÙ æáÚâÝ
d’obligation d’accès imposée au monopole en amont verticalement intégré, n’est
ni équivalent, ni induit-elle une obligation légale de commercer. En outre, dans
son avis, la Cour s’est montrée réticente quant à l’application du droit de la
concurrence en présence de la réglementation sectorielle:
«[la réglementation sectorielle est élaborée de manière à dissuader
et de remédier à tout préjudice anticoncurrentiel.»(Trinko, p. 12,
34 Verizon Communications, Inc. v. Law Offices of Curtis V. Trinko, 540 U.S. 398 (2004),(ci-après Trinko).
35 Suivant une déclaration des États-Unis au cours de la table ronde de l’OCDE sur leciseau tarifaire, il existe, depuis le jugement Trinko, une différence doctrinale entre uneobligation réglementaire et légale de faire du commerce. En effet, d’après le jugement,l’obligation réglementaire s’applique si le concurrent est déjà établi sur le marché en aval.Une différence institutionnelle est que le régulateur est mieux placé pour imposer des obli-gations de faire du commerce, compte tenu de leur proximité avec le secteur en question etune meilleure capacité d’équilibrage entre les effets à court terme sur la concurrence et leseffets dynamiques à long terme tels que les investissements (OECD (2009c), ÿ� �^_)� ý�`�,le délégué des États-Unis à la table ronde de l’OCDE a déclaré que, même si une obligationlégale existe, une plainte pour ciseau tarifaire devra être déposée en tant que plainte pourprix prédateurs (OECD (2009c), ÿ� �a��

ìãäÚáèÞéäÛáã íëãëÚÙÜÝ î�
traduit par Marc Petulowa).
Elle estime que les autorités spécifiques et dédiées à la régulation sont plus
appropriées et capables de gouverner l’environnement concurrentiel que les
lois générales relatives à la concurrence et souligne plusieurs inconvénients
éventuels liés à l’application simultanée. Ainsi, la Cour craignait p. ex. que
l’imposition d’une obligation légale de faire du commerce pourrait induire le
monopoleur en amont, ainsi que le concurrent en aval, à renoncer à la réalisa-
tion d’investissements pouvant renforcer la concurrence. En outre, imposer à
deux ou plusieurs parties de négocier peut engendrer de la collusion, induisant
donc une concurrence réduite au détriment du bien-être des consommateurs.
Le jugement linkLine
La réticence des États-Unis à accepter le ciseau tarifaire comme une infraction
indépendante est illustrée par le jugement dans l’affaire linkLine.36 Cã î<<OÕ
l’opérateur historique de la Californie AT&T fut accusé de compresser les
marges de ses concurrents et de leur refuser l’accès à l’infrastructure essentielle
de l’AT&T (son réseau DSL), alors qu’il y avait eu une obligation réglementaire
de fournir l’accès. La Cour Suprême a estimé, en se basant sur le jugement
Trinko, qu’AT&T n’avait aucune obligation légale de faire du commerce et
n’a donc pas d’obligation d’offrir des conditions de vente qui «préserve[nt] les
marges de ses concurrents».37
ØÙÚ ÙÛÜÜÝÞÚßÕ ÜÙ àáÞÚ ÝßäÛâÝ ?ÞôÞãÝ çÜÙÛãäÝ çáÞÚ éÛßÝÙÞ äÙÚÛæÙÛÚÝ èÝêÚÙÛä TäÚÝ
introduite sous la forme d’une plainte pour prix prédateurs. La Cour Suprême
a invoqué l’argument de «préoccupations institutionnelles» pour ne pas recon-
naître un effet de ciseaux comme une violation indépendante du droit de la
concurrence lorsque la réglementation sectorielle est mis en place (linkLine,
p. 4). Elle se voit mal adaptée pour surveiller en permanence les prix en36 Pacific Bell v. linkLine Communications, Inc., 555 U.S. 438 (2009), (ci-après linkLine).37 linkLine, p. 3.

ìãäÚáèÞéäÛáã íëãëÚÙÜÝ î"
amont et les prix en aval, ainsi que l’écart entre les deux, puisque cette tâche
reviendrait à agir comme un organisme de réglementation, ce qui est en dehors
des missions d’un tribunal.
La position européenne
L’approche de l’UE est en opposition frappante. Tout d’abord, même si la
recommandation de la Commission sur la séparation comptable confère une
tâche équivalente à la réglementation sectorielle que les États-Unis - à savoir
«[. . . ]identifier les comportements anticoncurrentiels potentiels, [. . . ]»(Commission
å2005ÖÕ ïÚä× å"ÖÕ î""W"�Ö � ÜÙ éáââÞãÛéÙäÛáã ÚÝÜÙäÛêÝ � ÜôÙççÜÛéÙäÛáã èÝß ÚõíÜÝß
de concurrence définit clairement les deux outils comme étant complémen-
taires:
«La Commission estime que les règles de concurrence et la régle-
mentation sectorielle forment un ensemble cohérent de mesures
propres à assurer un environnement de marché libéralisé et con-
currentiel dans le secteur des télécommunications de l’Union eu-
ropéenne.» (Commission å1998ÖÕ ïÚä× å´�OÖÕ î"�WîIÖ×
Cette complémentarité a, par la suite, été soutenue par la jurisprudence
européenne relative au ciseau tarifaire. Les décisions juridiques les plus im-
portantes et explicatives concernant le ciseau tarifaire ont été prises dans des
cas impliquant une entreprise active dans le secteur des télécommunications.
Le jugement Deutsche Telekom
Dans le cas de Deutsche Telekom (ci-après DT ), la Commission a estimé que le
système de tarification de l’opérateur en position dominante n’a laissé qu’une
marge insuffisante à ses concurrents, qui, par la suite, se sont retrouvés dans
l’impossibilité de couvrir des coûts spécifiques à leurs produits de détail (coûts

ìãäÚáèÞéäÛáã íëãëÚÙÜÝ î$
encourus sur le marché en aval afin fournir le service de détail ou produit
final).38
�Ý òÚÛñÞãÙÜ èÝ çÚÝâÛõÚÝ ÛãßäÙãéÝÕ ßáÞäÝãÞ çÙÚ ÜÙ ßÞÛäÝ çÙÚ ÜÙ àáÞÚ bëãëÚÙÜÝ
(désormais CG), a approuvé la décision de la Commission selon laquelle un
ciseau tarifaire constitue une violation indépendante de droit de la concurrence
en soulignant que
«[. . . ]le caractère abusif du comportement de la requérante est lié
au caractère non équitable de l’écart entre ses prix [de gros] pour
les [services intermédiaires d’accès à la boucle locale] et ses prix de
détail [pour les services d’accès aux abonnés], qui revêt la forme
[d’une compression des marges].39
àÝÜÙ ÛâçÜÛ?ÞÝ ?ÞÝ ÜÙ àáââÛßßÛáã ãôÝßä çÙß äÝãÞÝ èÝ çÚáÞêÝÚ ?ÞÝ ãÛ ÜÝ çÚÛ�
en amont, ni le prix en aval sont éventuellement illégaux, mais le caractère
inéquitable de l’écart entre ces deux éléments de prix constitue par lui-même
une violation de l’art. 102 du TFUE. Cette décision fut réaffirmée dans les
jugements Telefónica et TeliaSonera.
La Commission a fondé son analyse sur le critère du concurrent aussi ef-
ficace (ci-après CAE). Le but de ce test est de vérifier si le prix en aval de
l’opérateur historique permet de couvrir ses propres coûts spécifiques liés aux
produits de détail pertinents lorsque le prix d’accès facturé à ses concurrents
avait été imputé à son propre bras opérationnel en aval. Les tribunaux ont
confirmé la légalité de ce critère, car il fournit la sécurité juridique que tous
les paramètres de coûts sont connus par l’opérateur historique.40
@ã ÙÞäÚÝ ëÜëâÝãä ÛâçáÚäÙãä äÛÚë èÝ ÜôÙÚÚTä óò Ýßä ?ÞÝ ÜÙ ÚëíÜÝâÝãäÙäÛáã
sectorielle ne prévoit pas l’immunité face au droit de la concurrence. La Com-
38 Deutsche Telekom AG v. Commission, affaire T- 271/03 et appel C-280/08 P, du 14Octobre 2010.
39 Appel C-280/08 P, 14 October 2010, recital 142. Ecriture d’origine.40 Appel C-280/08 P, 14 October 2010, ¶201 et ¶202.

ìãäÚáèÞéäÛáã íëãëÚÙÜÝ î%
mission et le CG soulignent que l’environnement réglementaire était basé sur
le principe de plafonnement des prix, ce qui laisse au défendeur une marge
de manœvre suffisante pour ajuster son prix de détail et ainsi mettre fin à
la compression des marges.41 àáââÝ ÛãèÛ?Þë çÜÞß HÙÞäÕ ÜÙ ÚëíÞÜÙäÛáã èÝß
prix suivant un price cap établit un niveau maximal du prix à ne pas dépasser.
Comme le prix de DT n’était pas fixé au niveau maximum, DT avait les moyens
d’augmenter son prix et donc d’éviter un ciseau tarifaire. De par son inactiv-
ité à cet égard, DT a commis l’infraction qui se traduit par un comportement
anticoncurrentiel. Ce point du jugement DT souligne également la vision de
la Commission de la complémentarité entre les interventions réglementaires et
le droit de la concurrence .
Le jugement Telefónica
Dans l’affaire Telefónica, la Commission a adopté une méthodologie de calcul
plus sophistiquée.42 �ôápérateur historique espagnol, verticalement intégré,
fut accusé de ciseau tarifaire envers ses clients en amont avec lesquels il était
en concurrence dans le marché en aval. Afin de démontrer la présence d’une
compression des marges, la Commission a utilisé, outre le calcul année-sur-
année, la méthode actualisation des flux de trésorerie (ci-après DCF, issu de
l’expression anglaise discounted cash-flow) afin de vérifier la rentabilité à long
terme de l’entreprise accusée. Malgré les inconvénients possibles liés à cette
méthode (p. ex. faux positif en raison de flux de trésorerie futurs importants
qui l’emportent sur les pertes initiales (¶333 de la décision de la Commission
dans Telefónica)), la CG a rejeté l’appel de Telefónica contre l’utilisation de
DCF. La Cours a considéré que la Commission avait raison d’appliquer la
méthode DCF, vu que les deux méthodes ont déjà demontré la présence d’un
41 idem, ¶11.42 Telefónica & Telefónica de España v. Commission, affaires T-336/07 et T-398/07,
2007, et Telefónica & Telefónica de España v. Commission, affaire C-295/12 P.

ìãäÚáèÞéäÛáã íëãëÚÙÜÝ îO
ciseau tarifaire.
Dans son appel, Telefónica a affirmé que des investissements en amont ont
induit des charges d’accès élevées, alors qu’en même temps, le marché en aval
a fait l’objet d’une concurrence intense entre les offres convergentes. A cette
concurrence intense furent associées des pratiques de rabais importants, d’où
donc des prix de vente très bas sur le marché de détail. Contrairement au juge
Scalia dans Trinko, le CG ne reconnaissait pas d’obstacles quant aux incitations
d’investir si le droit de la concurrence était appliqué dans un environnement
réglementé. Au contraire, la CG était d’accord avec la Commission sur le fait
que l’obligation réglementaire de faire du commerce imposée Telefónica à
«[. . . ]result[ait] d’un équilibrage par les autorités publiques des inci-
tations de Telefónica et de ses concurrents à investir et à innover.»
Davantage d’explications ont été apportées par l’affaire TeliaSonera.43 óÙãß
cette affaire, l’opérateur historique suédois fut accusé par la ANC suédoise
d’abus de position dominante. Avant de prononcer son jugement, la Cour sué-
doise a adressé à la Cour de justice européenne une série de questions par
rapport à l’interprétation correcte de l’Art. 102 du TFUE.
Le jugement TeliaSonera
Dans TeliaSonera, le GC a souligné que le caractère essentiel, ou indispens-
able, de l’accès au réseau n’est pas une condition nécessaire à l’existence d’un
ciseau tarifaire. Elle a jugé que, compte tenu de la position dominante sur
le marché en amont de l’entreprise verticalement intégrée, l’accès amont n’a
pas besoin d’être indispensable pour que des effets anticoncurrentiels émergent
via un ciseau tarifaire. En particulier, si l’input en amont est essentiel pour
la concurrence en aval, alors des effets anticoncurrentiels sont probables, alors
que si l’input n’est pas indispensable, des effets anticoncurrentiels potentiels
43 Konkurrensverket v. TeliaSonera Sverige AB. affaire C-52/09, 2011.

ìãäÚáèÞéäÛáã íëãëÚÙÜÝ I<
peuvent exister et doivent être prouvés.44 ìÜ ÚëßÞÜäÝ èÝ ÜÙ èëéÛßÛáã òÝÜÛÙVáãÝÚÙ
que le champ d’application du ciseau tarifaire en tant que théorie du préjudice
est fortement élargi.
US vs. UE: deux vues opposées quant à la reconnaissance du ciseau
tarifaire comme abus indépendant
La discussion ci-dessus des jurisprudences américaine et européenne montre
qu’il existe deux points de vue diamétralement opposés: faut-il oui ou non
reconnaître le ciseau tarifaire comme théorie du préjudice dans un environ-
nement réglementé. Aux États-Unis, il ne faut clairement pas. Pour l’UE, la
réponse est oui et les décisions récentes ont même desserré les conditions de
son application. Chaque position peut avoir ses mérites, mais il faut bien com-
prendre les impacts qu’ont l’application conjointe du droit de la concurrence
et les restrictions réglementaires, puisque chaque outil affecte le comportement
stratégique des entreprises concernées.
Chapitre 3: Interaction entre réglementation sectorielle et droit de
la concurrence
Ce dernier chapitre de cette thèse analyse, d’un point de vue théorique, les
impacts potentiels que peuvent avoir l’application conjointe du droit de la
concurrence et la réglementation sectorielle.
Dans un modèle micro-économique, considérant un duopole avec des pro-
duits différenciés, une entreprise intégrée verticalement est supposée vendre
un produit de gros à un rival aval non intégré. Une asymétrie de la demande
émanante du consommateur est introduite par le biais de différences de qualité
entre les produits finaux et/ou de différence d’efficacité sur le marché en aval
entre l’entreprise intégrée et son concurrent. En outre, la modélisation permet
44 Cf. supra 43, ¶. 69 - 72.

ìãäÚáèÞéäÛáã íëãëÚÙÜÝ I´
de comparer le point de vue des États-Unis à la vision de l’UE en comparant
différents scénarios. Le premier scénario est celui de l’environnement concur-
rentiel, c.-à-d. sans aucune régulation en amont, ni interdiction de ciseau tari-
faire. Dans un second scénario, l’interdiction du ciseau tarifaire est introduite
en faisant appel au critère du concurrent aussi efficace (CAE), ce qui signifie
que l’écart entre le prix final et la charge d’accès de l’entreprise intégrée doit
permettre la couverture des coûts spécifiques au produit final. Les scénarios
trois et quatre refont l’analyse des scénarios un et deux, mais en introduisant
la réglementation du marché en amont.
L’analyse montre que, lorsque la régulation du marché en amont est ab-
sente, le prix en aval de l’opérateur historique ne satisfait pas le critère du
concurrent aussi efficace dès lors que l’entreprise non-intégrée est relativement
plus efficace (c.-à-d. si elle est plus efficace en terme de coûts en aval, si elle
offre une meilleure qualité ou toute combinaison possible de ces deux possibil-
ités). Cependant, dans ce cas, le concurrent en aval ne subit pas de pertes et
n’est donc pas exclu du marché. Ce résultat montre que l’efficacité du critère
du concurrent aussi efficace est fortement dépendante des conditions de marché
auxquelles les deux entreprises font face sur le marché en aval.
La comparaison du premier scénario au second révèle que la seule appli-
cation du droit de la concurrence, en interdisant la compression des marges,
peut avoir un effet positif sur le bien-être social.45 Cã ÝSÝäÕ éáââÝ ÜÝ çÚÛ�
de l’entreprise intégrée doit satisfaire le critère CAE, sa seule variable restant
à sa disposition pour optimiser ses profits est le prix en amont. L’entreprise
intégrée maximise alors ses profits globaux en baissant le prix en amont, ce
qui, à son tour, affecte de manière positive le prix fixé par le rival dans le
marché en aval: le prix final de ce dernier diminue et sa demande augmente.
D’autre part, le prix final de l’opérateur historique subit une hausse, ce qui
45 Il convient de rappeler que le marché en amont n’est pas régulé dans les deux premiersscénarios.

ìãäÚáèÞéäÛáã íëãëÚÙÜÝ Iî
pénalise alors ses consommateurs. Cependant, l’analyse du bien-être social
montre que l’augmentation des profits de la firme non-intégrée l’emporte sur
la baisse des profits de l’entreprise intégrée. Par ailleurs, comme plus de con-
sommateurs bénéficient du prix réduit du rival, le surplus du consommateur
augmente. Finalement, en l’absence de réglementation du marché en amont,
une interdiction du ciseau tarifaire a un effet bénéfique sur le bien-être social.
En revanche, l’analyse en présence de la régulation du marché en amont
montre des résultats opposés. Tout d’abord, lorsque le droit de la concurrence
est appliqué, l’effet baissier sur le prix en amont disparaît et les deux prix finaux
augmentent. Les consommateurs ne bénéficient plus de l’excédent d’efficacité
du concurrent par rapport à la firme intégrée. En raison de la hausse des prix,
les profits de l’industrie augmentent, alors que les consommateurs s’en sortent
moins bien. L’impact sur le bien-être social est toutefois ambigu.
Enfin, comme une interdiction augmente le fardeau imposé à l’entreprise
réglementée, celle-ci peut manifester moins d’initiatives dans le marché en aval.
En effet, à un certain niveau d’inefficacité (par rapport à son concurrent), elle
peut préférer de se retirer du marché en aval et de se concentrer sur la fourniture
du produit de gros à son rival, qui, lui, sera la seule entreprise sur le marché
en aval.46
�ôÙnalyse de ce chapitre suggère que la façon dont agit la Commission
face au ciseau tarifaire risque de compromettre l’achèvement de son objectif
de promotion de la concurrence et de protection des consommateurs. Les
tribunaux américains semblent avoir eu la bonne intuition en matière de ciseau
tarifaire en tant qu’infraction indépendante.
46 Comme un tel comportement n’a pas encore été observé dans le monde réel, le retraitde l’opérateur historique doit être relativisé. Il est, cependant, concevable que l’entrepriseintégrée puisse quitter certains segments de marché, tout en restant active dans d’autres.
cÏeÓÏËÐÊÒfgh
ARCEP (2014a). Observatoire des marchés des communications électroniques
(services mobiles). 2ème trimestre 2014. Available here×
ARCEP (2014b). Observatoire des marchés des communications électroniques
en France Q2 2014 - Observatoire des investissements et de l’emploi. 2ème
trimestre 2014 - Résultats définitifs. Available here×
Arlandis A., Ciriani S., Koleda G. (2011). L’économie numérique et la crois-
sance, poids, impact et enjeux d’un secteur stratégique, Document de travail
Nř 24. Available here× ïééÝßßÝè ÜÙßä= ´OW´´Wî<´�×
Armstrong M., (2006). Competition in two-sided markets, RAND Journal of
Economics, 37(3), 668-691.
Berec (2011). Berec Report on impact of Fixed-Mobile Substitution in Market
Definition, 8 December 2011, available here×
Blumberg S. J., Luke J. V. (2007). Wireless substitution: Early release of
estimates based on data from the National Health Interview Survey, July -
December 2006. National Center for Health Statistics, May 2007., available
here
iÜÞâberg S. J., Luke J. V. (2014). Wireless substitution: Early release of
estimates from the National Health Interview Survey, January - June 2014.
National Center for Health Statistics, December 2014, available here×
33

ìãäÚáèÞéäÛáã íëãëÚÙÜÝ I�
Bacache M., Bourreau M., Germain G., (2013). Dynamic Entry and Invest-
ment in New Infrastructures: Empirical Evidence from the Fixed Broadband
Industry. Review of Industrial Organization, 44(2), 179-209.
Bourreau M., Kourandi F., Valletti T., (2014). Net Neutrality with Competing
Internet Platforms, CEIS Research Paper 307, Tor Vergata University, CEIS,
revised 14 Feb 2014.
Cave M. (2006), Encouraging infrastructure competition via the ladder of in-
vestment. Telecommunications Policy, 30(3-4), 223-237.
Cave M. (2006), Six Degrees of Separation: Operational Separation as a Rem-
edy in European Telecommunications Regulation, MPRA Paper No. 3572,
posted 14/06/2007, available here×
Cisco (2014), Visual Networking Index: Global Mobile Data Traffic Forecast
Update 2013 - 2018, February 4, 2014, available here×
Cisco (2013b), Visual Networking Index: Forecast and Methodology 2012 -
2017, May 29, 2013, available here×
European Commission (1998), Notice on the Application of the Competition
Rules to Access Agreements in the Telecommunications Sector, (98/C), OJ
C 265, 22/08/1998:2-28.
European Commission (2005), Recommendation on accounting separation and
cost accounting systems under the regulatory framework for electronic com-
munications, (2005/698/EC), OJ L 266, 11/10/2005:64-69.
European Commission (2013), Commission Staff Working Document Digital
Agenda Scoreboard SWD (2013) 217 final.
Dogan P., Bourreau M., Manant M, (2009). A Critical Review of the “Ladder of

ìãäÚáèÞéäÛáã íëãëÚÙÜÝ I�
Investment" Approach. Scholarly Articles 4777447, Harvard Kennedy School
of Government. Available here×
Eurobarometer (2006), E-Communicatins Household Survey Report, Field-
work: December 2005 - January 2006, July 2006.
Eurobarometer (2011), E-Communicatins Household Survey Report, Field-
work: December 2011, June 2012,
Eurobarometer (2013), E-Communicatins Household Survey Report, Field-
work: February-March 2011, July 2011, available here×
GSM Association (2013a), Mobile Economy Europe 2013, available here×
GSM Association (2013b), Mobile Wireless Performance in the EU & the US,
May 2013, available here×
Hermalin B. E., Katz M. L., (2007). The economics of product-line restric-
tions with an application to the network neutrality debate, Information
Economics and Policy, 19(2), 215-248.
Jullien, B., Rey, P., Saavedra, C. (2013), The Economics of Margin Squeeze,
IDEI Report, available here×
Maliranta M., Rouvinen P., Ylä-Anttila P., (2010), Finland’s Path to the
Global Productivity Frontier through Creative Destruction, International
Productivity Monitor, Centre for the Study of Living Standards, 20, Fall,
68-84. Available here×
OECD (2006), Report on experiences with structural separation, 07/06/2006,
available here×
OECD (2009a), Information Economy Product Definitions Based On The Cen-
tral Product Classification (Version 2), available here×
ìãäÚáèÞéäÛáã íëãëÚÙÜÝ I"
OECD (2009b), Mobile Broadband: Pricing and Services, available here×
OECD (2009c), Policy Roundtables Margin Squeeze, 2009,
DAF/COMP(2009)36, available here×
OECD (2011), Broadband Bundling: Trends and Policy Implications, OECD
Digital Economy Papers, No. 175, OECD Publishing, available here×
OECD (2012), Fixed and Mobile Networks: Substitution, Complementarity
and Convergence, OECD Digital Economy Papers, No. 206, OECD Pub-
lishing, available here×
OFCOM (2013), International Communications Market Report, Research Doc-
ument, 12 December 2013, available here×
Oldale, A., Padilla, J. (2004). From state monopoly to the “investment ladder":
Competition policy and the NRF. in The Pros and Cons of Antitrust in
Deregulated Markets, Swedish Competition Authority.
Rochet J.-C., Tirole J., (2006). Two-sided markets: a progress report, RAND
Journal of Economics, 37(3), 645-667.
RTR (2009), Abgrenzung des Marktes für breitbandigen Zugang auf Vorleis-
tungsebene.
Welsum D., Overmeer W., Van Ark B., (2012). Unlocking the ICT growth
potential in Europe: Enabling people and businesses. A study prepared
for the European Commission DG Communications Networks, Content &
Technology. Available here× ïééÝßßÝè ÜÙßä= ´OW´´Wî<´�×
Wu T., (2003). Network Neutrality, Broadband Discrimination, Journal on
Telecommunications and High-Technology Law, 2, 141-176.
Yoo C., (2010). Network Neutrality or Internet Innovation? Regulation, 33(1),
22-29. Available on SSRN×


jklmÇnop q
Substitution fixe-mobile et offres groupées fixe-
mobile
La substitution fixe-mobile correspond au fait que les services fixes, notam-
ment les appels, sont de plus en plus substitués par les services mobiles. Ce
phénomène est apparu avec la convergence en performance des technologies
sous-jacentes. Ainsi, la technologie 3G sur les réseaux mobiles permet des us-
ages similaires à ceux possibles avec la technologie ADSL sur les réseaux fixes.1
ïêÝé ÜÝ èëçÜáÛÝâÝãä èÝ ÜÙ �b �òCÕ ÜÝß æÚáãäÛõÚÝß ÝãäÚÝ çáßßÛñÛÜÛäëß èôÞßÙíÝ ßÞÚ
les réseaux mobiles et les réseaux fixes utilisant l’ADSL s’effaceront encore
plus. Pour autant que la fibre optique n’est pas encore suffisamment établie
comme technologie sur les réseaux fixes, la substitution fixe-mobile continuera
à prendre de l’ampleur.
Par ailleurs, la concurrence entre les opérateurs multi-marchés, i.e. les
opérateurs actifs à la fois dans le marché des communications fixes et commu-
nications mobiles, a connu une intensification considérable. A titre d’exemple,
avec l’apparition de Free Mobile sur le marché mobile français, un quatrième
opérateur multi-marchés a signé son entrée. Le lancement de Free Mobile fut
accompagné d’une guerre des prix entre les quatre acteurs, comme le démontre
une étude de l’ARCEP. En effet, avec l’entrée de Free, la facture moyenne pour
1 La technologie ADSL, basée sur la paire de cuivre, est aujourd’hui la technologie laplus répandue en Europe.
38

àHÙçÛäÚÝ ´= VÞñßäÛäÞäÛáã A�Ý�âáñÛÜÝ Ýä áSÚÝß íÚáÞçëÝß A�Ý�âáñÛÜÝ IO
des services mobiles a diminué de 5 e ce qui représente une baisse d’environ
20 % (ArcepÕ 2014Ö×
Parallèlement à cette concurrence intense, les opérateurs multi-marchés
ont lancé des offres convergentes, c.-à-d. des offres groupées intégrant les
services fixes (Internet haut débit, TVIP, VoIP) et un forfait mobile. Ces
offres quadruple-play connaissent un succès remarquable: en Espagne, p. ex.
21 % des ménages ont souscrit à une telle offre vers la fin de l’année 2012 et en
France ce chiffre s’élève à environ 40 % pour la même époque. Un élément clé
de ces offres est le rabais que l’opérateur octroie à ses consommateurs lorsque
ces derniers souscrivent à une offre groupée. Le prix de l’offre groupée est donc
inférieur à la somme des prix des offres isolées.
Or, compte tenu de la substitution fixe-mobile qui se manifeste de plus en
plus et compte tenu de l’intensification de la concurrence, il faut se poser
la question si la pratique des ventes liées est une stratégie adéquate aux
phénomènes observés. Quels sont les impacts de cette pratique sur i) les profits
des opérateurs, ii) les demandes pour les services mobiles et fixes en tant que
ventes isolées ou vente groupées?
L’objectif de ce chapitre est de fournir des éléments de réponses pertinents
en se basant sur un modèle micro-économique. Ce modèle considère un duopole
à la Hotelling avec deux opérateurs multi-marchés, qui détiennent chacun ses
propres infrastructures fixes et mobiles.2 ïÞ éÝãäÚÝ èÝ ÜôÙãÙÜsßÝ ßÝ äÚáÞêÝãä ÜÝß
prix de réserve des consommateurs pour les deux services. L’écart entre ces
prix de réserve est utilisé comme mesure de la substituabilité entre le service
fixe et mobile: plus les prix de réserve sont proches, plus les services sont
substituts.3 ØÙÚ ÙÛÜÜÝÞÚßÕ ÜÝ âáèõÜÝ çáßÝ ÜôHsçáäHõßÝ ?ÞÝ ÜÝ éáãßáââÙäÝÞÚ
2 Cette hypothèse est certes simplificatrice, mais elle permet de se focaliser uniquementsur les effets induits par la pratique des ventes liées, sans devoir gérer d’éventuelles perturba-tions liées à l’intégration verticale d’un opérateur historique et les problèmes réglementairesliés à l’accès au réseau de ce dernier.
3 Toutefois, il est supposé que les prix de réserve pour les services fixes sont strictementsupérieurs aux prix de réserve pour les services mobiles. Sinon, les produits seraient des sub-

àHÙçÛäÚÝ ´= VÞñßäÛäÞäÛáã A�Ý�âáñÛÜÝ Ýä áSÚÝß íÚáÞçëÝß A�Ý�âáñÛÜÝ �<
choisit d’abord son offre mobile et puis, s’il anticipe une utilité nette positive,
il souscrit à une offre de services fixes. S’il souscrit à ces deux offres, il a le
choix entre l’achat d’une offre groupée (et donc de profiter du rabais) et l’achat
de deux offres isolées. Si, à l’inverse, le consommateur n’anticipe pas d’utilité
positive liée au fait d’avoir simultanément une offre fixe et mobile, il restera
mobile-only. Ainsi, l’existence de consommateurs mobile-only sous-entend que
le marché fixe n’est pas complètement couvert.
Finalement, alors que les prix de réserve pour les offres mobiles sont sup-
posés égaux pour les deux opérateurs, les services fixes peuvent être valorisés
différemment par les consommateurs. Ceci peut représenter des situations de
concurrence entre deux infrastructures fixes, comme p. ex. la fibre vs. l’ADSL.
Si les prix de réserve diffèrent, l’environnement est dit asymétrique.
Les résultats dans le cas symétrique, révèle l’émergence d’un dilemme du
prisonnier: à l’équilibre, les opérateurs proposent des offres groupées, même
s’ils préfèreraient ne pas le faire. Or, chacun est incité de le faire de manière
unilatérale, d’où l’émergence du dilemme du prisonnier. Ceci n’est pourtant
pas un résultat nouveau, car il a été identifié à plusieurs reprises par la littéra-
ture existante.4
VÛÕ par contre, les opérateurs évoluent dans un environnement asymétrique,
il n’y a pas émergence du dilemme du prisonnier. En effet, l’opérateur, dont le
service est mieux valorisé, peut augmenter ses profits en octroyant un rabais
aux clients qui souscrivent à une offre groupée. L’analyse montre la puissance
du rabais comme outil concurrentiel: vu que les consommateurs choisissent en
premier leur offre mobile et ensuite une éventuelle offre fixe, le rabais permet
d’augmenter la part de marché dans le marché mobile et donc d’augmenter la
demande potentielle pour l’offre groupée.5
÷ùûùù÷ ÿú��úûù÷, ü� �û �� ü����÷ÿ��� r �ú � ú�ûù , ü��ÿù� ù�� �� üú�úüù �û÷ùû��÷ ��÷ ÷��ûü�÷(fixe=volume data illimité et mobilité réduite; mobile=volume data limité et ubiquité).
4 Cf. Matutes and Régibeau (1992) � Thanassoulis (2007), ��ù�� úù��÷�5 Le résultat que le dilemme de prisonniers n’apparaît pas dans le cas d’un environnement

àHÙçÛäÚÝ ´= VÞñßäÛäÞäÛáã A�Ý�âáñÛÜÝ Ýä áSÚÝß íÚáÞçëÝß A�Ý�âáñÛÜÝ �´
Pour le concurrent, il s’avère que la pratique de ventes liées s’apparente à
une stratégie de Maximin, car, en proposant lui-aussi un rabais pour une offre
groupée, il s’en sort mieux que de laisser l’autre opérateur proposer des offres
groupées tout seul.
A noter également que, grâce au rabais, la demande pour le mobile-only
(c.-à-d. les consommateurs qui ne souscrivent pas du tout à une offre fixe)
diminue, ce qui implique une couverture plus importante du marché fixe. En
analysant les incitations de proposer un rabais dans le cas d’un marché fixe
complètement couvert, il apparaît que cette pratique n’est pas rentable pour
l’opérateur proposant le service fixe le mieux valorisé. La pratique des ventes
liées n’est par conséquent rentable uniquement lorsque le marché fixe n’est
pas entièrement couvert, ou de manière équivalente, lorsque les services fixes
et mobiles ne sont ni trop substituables (auquel cas, aucun consommateur ne
choisirait une offre fixe), ni trop complémentaires (auquel cas, le marché serait
trop couvert et la stratégie des offres groupées non-rentable).
Finalement, en ce qui concerne le bien-être social, les résultats montrent
que le consommateur est toujours gagnant lorsqu’il se voit proposer un prix
réduit pour les deux services, et ce tant dans un environnement symétrique que
dans un environnement asymétrique. A l’inverse, les profits de l’industrie (c.-à-
d. la somme des profits des deux opérateurs) diminue dans le cas symétrique,
alors qu’il ne varie pas dans l’autre cas. Ce dernier résultat est dû au fait
que l’opérateur proposant le service le mieux valorisé gagne ce que perd son
concurrent. Somme toute faite, le bien-être social augmente toujours, car la
baisse des profits de l’industrie est plus que compensée par l’accroissement du
surplus du consommateur.
En guise de conclusion, il est à noter que l’analyse du chapitre 1 montre que
asymétrique n’a pas encore été énoncé dans la littérature. Au contraire, Thanassoulis (2007),qui utilise un cadre similaire, estime que la pratique de la vente liée engendre ce dilemmemême en cas d’asymétrie.

àHÙçÛäÚÝ ´= VÞñßäÛäÞäÛáã A�Ý�âáñÛÜÝ Ýä áSÚÝß íÚáÞçëÝß A�Ý�âáñÛÜÝ �î
la rentabilité de la pratique des offres groupées est intimement liée au degré
de substituabilité entre les services. Par ailleurs, contrairement à la littérature
existante, le dilemme du prisonnier n’apparaît pas nécessairement. Finale-
ment, il reste à noter que la baisse des profits de l’industrie peut soulever des
problèmes de collusion entre les opérateurs, bien que dans un cas asymétrique,
cette question ne se posera vraisemblablement pas.
La substitution fixe-mobile sera également au cœur du prochain chapitre.
Cependant, le chapitre deux proposera une analyse empirique, et plus partic-
ulièrement, une analyse des facteurs qui influencent les choix de consommation
de services de communications des Français.

cÏeÓÏËÐÊÒfgh
ARCEP (2014). Observatoire des marchés des communications électroniques
(services mobiles). 2e trimestre 2014.
Matutes C., Régibeau P., (1992). Compatibility and bundling of complemen-
tary goods in a duopoly. Journal Of Industrial Economics, 40(1), 37-54.
Thanassoulis J., (2007). Competitive Mixed Bundling and Consumer Sur-
plus, Journal Of Economics & Management Strategy, 16(2), 437-467. DOI:
10.1111/j.1530-9134.2007.00145.x.
43


jklmÇnop t
Caractéristiques socio-démographiques et ser-
vices de télécommunications
Comme le premier chapitre, le deuxième est consacré à la substitution fixe-
mobile. Toutefois, le sujet sera maintenant traité de manière empirique.
Le but de ce chapitre est de dresser des profils de consommateur en se
basant sur les caractéristiques socio-démographiques d’environ 22000 utilisa-
teurs français de services de communications. Plus spécifiquement, ce travail
cherche à déterminer les facteurs qui influencent les choix des consommateurs.
Par ailleurs, il soulève la question de savoir si l’impact des facteurs ainsi déter-
minés varie d’un opérateur à l’autre.
Le point de départ pour cette analyse est le constat de l’évolution im-
pressionnante que connaît le marché des communications en France depuis
quelques années. Par exemple, la commercialisation par Bouygues Télécom de
la première offre quadruple-play en 2009 peut être vue comme une innovation
tarifaire. En offrant un avantage en prix allant jusqu’à 16 e, le troisième opéra-
teur français a créé une vraie incitation pour les consommateurs de changer
de comportement de consommation, en passant d’une série de services isolés à
une offre groupée. En outre, l’entrée sur le marché de Free Mobile, avec une
politique tarifaire très agressive, a marqué le début de l’ère du low cost dans le
secteur des télécommunications français. Ainsi, les prix ont baissé d’environ 20
45

àHÙçÛäÚÝ î= àÙÚÙéäëÚÛßäÛ?ÞÝß ßáéÛá�èëâáíÚÙçHÛ?ÞÝß Ýä ßÝÚêÛéÝß èÝtélécommunications 46
% et l’abondance en services vocaux et messages, combinée à des volumes de
data très généreux, est devenue la norme sur le marché. En guise de réponse,
les opérateurs établis ont également mis sur le marché des offres mobiles très
compétitives, mais ils ont aussi accéléré le déploiement de nouvelles technolo-
gies telles que la 4G LTE ou la fibre optique. Toutefois, cette accélération des
investissements en vue d’échapper à la concurrence n’a pas arrêté le trend du
low cost.
Il apparaît donc que le marché est en mouvement constant, ce qui implique
alors un changement de comportement de la part des consommateurs. Comme
il a été indiqué auparavant, un nombre croissant de consommateurs substituent
leurs services fixes par des services mobiles, alors que le nombre de souscrip-
tions à des offres convergentes est lui également en hausse. Reconnaître ces
changements est indispensable pour chaque opérateur afin de ne pas perdre de
vue les intérêts et les besoins du côté de la demande de services.
La motivation de ce travail est donc de contribuer à la compréhension de ces
changements en se concentrant sur les caractéristiques socio-démographiques
des consommateurs. Afin d’atteindre cet objectif, un modèle logit condition-
nel est développé qui met en relation les caractéristiques des individus et de
leurs offres souscrites avec leurs choix i) d’être mobile-only, ii) compléter leurs
services mobiles par un ou plusieurs services fixes isolés ou iii) de souscrire à
une offre groupée d’au moins deux services chez l’opérateur mobile. Les don-
nées sont issues d’une enquête de satisfaction avec l’opérateur mobile menée
auprès d’environ 22000 utilisateurs français pendant la période 2008-2012. Les
variables intégrées dans le modèle sont les suivantes: prix, opérateur mobile,
contrat (pré-payé ou post-pay), l’âge, catégorie socio-professionnelle (CSP),
revenu, composition du ménage, lieu de résidence et le sexe.1
ìÜ Ýßä êÚÙÛßÝâñÜÙñÜÝ ?ÞÝ ÜÝß ëêáÜÞäÛáãß äÝéHãáÜáíÛ?ÞÝß Ýã âÙäÛõÚÝ èÝ äÝÚ�
1 A noter que Free n’est pas compris dans la base de données.

àHÙçÛäÚÝ î= àÙÚÙéäëÚÛßäÛ?ÞÝß ßáéÛá�èëâáíÚÙçHÛ?ÞÝß Ýä ßÝÚêÛéÝß èÝtélécommunications 47
minaux et de possibilités d’usage affectent aussi les choix énumérés avant.
Toutefois, comme ces informations n’ont pas été collectées lors du sondage,
cette étude ne peut pas se prononcer sur un éventuel impact lié à ces variables.
La base de données est constituée d’à peu près 20 % de mobile-only, 15 %
de personnes ayant une offre groupées (ci-après bundlers) et environ 65 % de
personnes ayant plusieurs services sans que ces services ne soient regroupés en
une seule offre (ci-après non-bundlers). Alors que la proportion des mobile-only
correspond à ce qu’ont observé d’autres études pour le marché français, les deux
autres proportions méritent quelques explications. En effet, la proportion de
bundlers est très faible pour le marché français et, inversement, la proportion
des non-bundlers très élevée. Ceci s’explique par le fait que le sondage ne
demandait que si la personne a une offre groupée «chez l’opérateur mobile».
De ce fait, les personnes ayant une offre groupée chez un autre opérateur ne
sont pas identifiables et sont alors classées parmi les non-bundlers.
Le résultat principal de l’estimation du modèle général (i.e. sans spécifi-
cation par opérateur) est que les consommateurs de type mobile-only peuvent
être décrits comme ayant une contrainte budgétaire plus forte que les autres
types de consommation.2 Cã ÝSÝäÕ ÜÝß ÚëßÞÜäÙäß âáãäÚÝãä ?ÞÝ ÜÝß êÙÚÛÙñÜÝß çáÞ�
vant laisser penser à une fragilité financière ont un effet significatif et négatif
sur la probabilité de souscrire à une offre groupée ou à plusieurs services. Il
s’agit notamment des variables pré-payé, travail à temps partiel, H/F au foyer
ou encore faible revenu.3
ï ãáäÝÚ ?ÞÝ ÜÝ ÚëßÞÜäÙä èëéÚÛä ÙêÙãä Ù ëäë äÚáÞêë çáÞÚ èôÙÞäÚÝß çÙsß ëíÙÜÝ�
ment. Ainsi Schejter et al. å2010Ö ÜôÙ äÚáÞêë èÙãß ßáã ÙãÙÜsßÝ éáãéÝÚãÙãä ÜÝß
Etats-Unis. Il est également mentionné dans un rapport DotEcon å2001Ö çáÞÚ
le Royaume-Uni. Pour la France, le rapport du CREDOC å2013Ö çÝÞä ëíÙÜÝ�
2 Le pseudo-R2 est 0.64 et le pourcentage de prédictions correctes s’élève à ± 85%, cequi indique un bon pouvoir explicatif du modèle.
3 Ces variables sont toutes significatives au seuil 1 %$.

àHÙçÛäÚÝ î= àÙÚÙéäëÚÛßäÛ?ÞÝß ßáéÛá�èëâáíÚÙçHÛ?ÞÝß Ýä ßÝÚêÛéÝß èÝtélécommunications 48
ment être cité. Toutefois, ces deux derniers rapports fournissent des statis-
tiques descriptives plutôt qu’une estimation des influences des différentes vari-
ables, telle que proposée dans ce travail.
Les estimations par opérateurs confirment le résultat principal du modèle
général. De ce fait, les consommateurs mobile-only peuvent être décrits de
manière identique pour tous les opérateurs.
Par ailleurs, ces estimations font apparaître un avantage compétitif pour
l’opérateur historique. En effet, les clients Orange qui résident dans des zones
rurales ou des petites villes (≤ 1500 habitants/km2) sont plus enclins de
souscrire à plusieurs services (groupés ou non) que les clients SFR ou Bouygues.
Toutefois, dans les grandes villes, où la concurrence est plus intense, car une
demande potentielle plus élevée, cet avantage est plus faible.
Ce travail a pu identifier des éléments relatifs aux types de consommateur.
Premièrement, les personnes qui utilisent exclusivement leurs services mobiles
peuvent être caractérisées par une contrainte budgétaire plus stricte que les
personnes utilisant plusieurs services. Ceci paraît être un résultat robuste, car
il est confirmé par les régressions spécifiques aux opérateurs. Deuxièmement,
les consommateurs de plusieurs services de communications qui résident en-
dehors des grandes villes semblent préférer l’opérateur historique. Ce résultat
peut être vu comme une indication sur la différentiation entre les trois opéra-
teurs présents dans la base de données. Finalement, cette différentiation entre
les opérateurs semble conférer un avantage compétitif à l’opérateur historique,
du moins dans les zones rurales ou moyennement dense.
Reste à noter que cette étude a ses limites. Tout d’abord, parce qu’elle
ne dispose pas de données relatives à l’habitude d’usage des consommateurs.
Les profils dressés dans ce chapitre ne sont donc que partiels. Ensuite, la
période pendant laquelle les données ont été collectées correspond à une des
pires crises économiques depuis le jeudi noir en 1929. Beaucoup de ménages

àHÙçÛäÚÝ î= àÙÚÙéäëÚÛßäÛ?ÞÝß ßáéÛá�èëâáíÚÙçHÛ?ÞÝß Ýä ßÝÚêÛéÝß èÝtélécommunications 49
ont dû procéder à des coupes budgétaires, qui ont aussi affectées les dépenses
consacrées aux télécommunications. Les résultats dans ce chapitres risquent
donc de ne pas être généralisables.
Les chapitres un et deux de cette thèse se sont donc concentrés majoritaire-
ment sur la concurrence entre les services de communications. Le prochain
et dernier chapitre sera consacré à la concurrence entre les entreprises en se
focalisant sur l’interaction de deux outils qui façonnent le secteur des télé-
communications. Il s’agit ici de la réglementation sectorielle et du droit de la
concurrence.

cÏeÓÏËÐÊÒfgh
CREDOC, (2013). La diffusion des technologies de l’information
et de la communication dans la société française.
http://www.credoc.fr/pdf/Rapp/R297.pdf.
DotEcon, (2001). Fixed-Mobile Substitution. A report prepared for BT.
http://www.dotecon.com/assets/images/fmsub3.pdf.
Schejter A. M., Serenko A, Turel O, Mehdi Z., (2010). Policy implications of
market segmentation as a determinant of fixed-mobile service substitution:
What it means for carriers and policy makers. Telematics and Informatics,
22(1), 90-102. http://dx.doi.org/10.1016/j.tele.2009.05.002×
50


jklmÇnop u
Chapitre 3: L’interaction entre réglementation
sectorielle et droit de la concurrence: le cas du
ciseau tarifaire
Contrairement aux deux chapitres précédents, ce troisième et dernier chapitre
se consacre à la concurrence entre les firmes. Plus spécifiquement, il analyse
les effets de l’interaction entre la réglementation sectorielle et le droit de la
concurrence sur les comportements stratégiques des entreprises. Le travail
dans ce chapitre se concentre sur l’interdiction de ciseau tarifaire dans un
environnement réglementé.
Le cadre d’analyse est celui d’une industrie verticalement intégrée avec un
monopole sur le marché en amont. Ce monopole produit un input essentiel
pour la production d’un bien final. Par ailleurs, le monopoleur en amont
est verticalement intégré et est en concurrence sur le marché de détail avec
son client en amont. Ainsi, un ciseau tarifaire peut apparaître lorsque l’écart
entre le prix en amont et le prix de détail pratiqué par la firme verticalement
intégrée est insuffisant pour couvrir les coûts spécifiques au produit de détail,
de façon à ce que l’activité d’un concurrent au moins aussi efficace que la firme
verticalement intégrée n’est pas rentable.
La réglementation sectorielle et le droit de la concurrence sont omniprésents
dans le secteur des télécommunications et le façonnent de manière importante.
52

àHÙçÛäÚÝ I= �ôÛãäÝÚÙéäÛáã ÝãäÚÝ ÚëíÜÝâÝãäÙäÛáã ßÝéäáÚÛÝÜÜÝ Ýä èÚáÛä èÝ ÜÙconcurrence 53
Surtout en Europe, où ces deux outils sont considérés comme des compléments
et s’appliquent ainsi de manière conjointe (Commission å1998ÖÕ ¶149). Ceci
est en opposition diamétrale par rapport à la vision américaine sur ce sujet,
car plusieurs jugements juridiques aux Etats-Unis ont clairement identifié la
réglementation sectorielle et le droit de la concurrence comme étant des sub-
stituts, avec une primauté de la réglementation lorsque celle-ci existe.1 @ã
autre point de divergence entre les Etats-Unis et l’Union Européenne est que
l’UE reconnaît explicitement le ciseau tarifaire comme un abus indépendant,
c.-à-d. différent des prix prédateurs ou le refus de vente.2 ï ÜôÛãêÝÚßÝÕ ÜÝß
Etats-Unis considèrent qu’une plainte pour ciseau tarifaire doit être déclinée
soit en plainte pour prix prédateurs, soit en plainte pour refus de vente.3
ìÜ ßôÙíÛä ÛéÛ èôÞã èëñÙä êÛæ ?ÞÛ áééÞçÝ Þã ñáã ãáâñÚÝ èôÙéÙèëâÛ?ÞÝß× àÝçÝã�
dant, ces académiques ont un point commun. En effet, nombreux sont les pa-
piers qui critiquent notamment le critère du concurrence aussi efficace (CAE),
un test utilisé par la Commission Européenne pour détecter la présence d’un
ciseau tarifaire. Ce test impose, en quelque sorte, un prix-plancher à la firme
verticalement intégrée de façon à éviter que la marge entre le prix de détail et
le prix en amont est suffisante pour couvrir les coûts encourus sur le marché de
détail. D’après plusieurs études théoriques, imposer un tel plancher induit une
hausse des prix de détail, ce qui est évidemment néfaste pour le consommateur
(Carlton å2008Ö áÞ Choné et al. å2010ÖÕ ÝãäÚÝ ÙÞäÚÝßÖ×
Le travail mené dans ce chapitre s’inscrit dans la lignée de ces papiers, mais
en considérant un marché de détail avec des bien différenciés. Par ailleurs, le
modèle micro-économique développé ici propose la possibilité d’une différence
d’efficacité en terme de coûts encourus sur le marché de détail entre les deux
entreprises. Finalement, il considère 4 scénarios. Le premier est celui de la
1 Verizon Communications, Inc. v. Law Offices of Curtis V. Trinko, 540 U.S. 398 (2004)2 Le dernier jugement confirmant le ciseau comme abus indépendant: Telefónica & Tele-
fónica de España v. Commission, affaire C-295/12 P.3 Pacific Bell v. linkLine Communications, Inc., 555 U.S. 438 (2009).
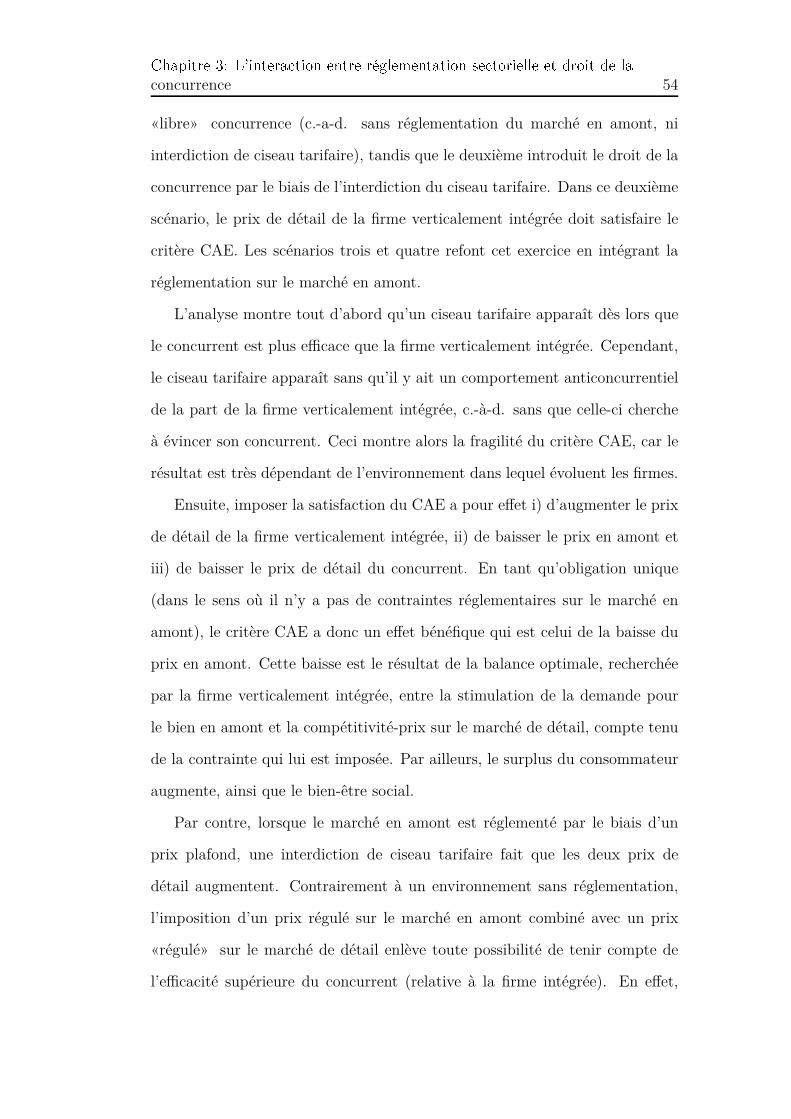
àHÙçÛäÚÝ I= �ôÛãäÝÚÙéäÛáã ÝãäÚÝ ÚëíÜÝâÝãäÙäÛáã ßÝéäáÚÛÝÜÜÝ Ýä èÚáÛä èÝ ÜÙconcurrence 54
«libre» concurrence (c.-a-d. sans réglementation du marché en amont, ni
interdiction de ciseau tarifaire), tandis que le deuxième introduit le droit de la
concurrence par le biais de l’interdiction du ciseau tarifaire. Dans ce deuxième
scénario, le prix de détail de la firme verticalement intégrée doit satisfaire le
critère CAE. Les scénarios trois et quatre refont cet exercice en intégrant la
réglementation sur le marché en amont.
L’analyse montre tout d’abord qu’un ciseau tarifaire apparaît dès lors que
le concurrent est plus efficace que la firme verticalement intégrée. Cependant,
le ciseau tarifaire apparaît sans qu’il y ait un comportement anticoncurrentiel
de la part de la firme verticalement intégrée, c.-à-d. sans que celle-ci cherche
à évincer son concurrent. Ceci montre alors la fragilité du critère CAE, car le
résultat est très dépendant de l’environnement dans lequel évoluent les firmes.
Ensuite, imposer la satisfaction du CAE a pour effet i) d’augmenter le prix
de détail de la firme verticalement intégrée, ii) de baisser le prix en amont et
iii) de baisser le prix de détail du concurrent. En tant qu’obligation unique
(dans le sens où il n’y a pas de contraintes réglementaires sur le marché en
amont), le critère CAE a donc un effet bénéfique qui est celui de la baisse du
prix en amont. Cette baisse est le résultat de la balance optimale, recherchée
par la firme verticalement intégrée, entre la stimulation de la demande pour
le bien en amont et la compétitivité-prix sur le marché de détail, compte tenu
de la contrainte qui lui est imposée. Par ailleurs, le surplus du consommateur
augmente, ainsi que le bien-être social.
Par contre, lorsque le marché en amont est réglementé par le biais d’un
prix plafond, une interdiction de ciseau tarifaire fait que les deux prix de
détail augmentent. Contrairement à un environnement sans réglementation,
l’imposition d’un prix régulé sur le marché en amont combiné avec un prix
«régulé» sur le marché de détail enlève toute possibilité de tenir compte de
l’efficacité supérieure du concurrent (relative à la firme intégrée). En effet,

àHÙçÛäÚÝ I= �ôÛãäÝÚÙéäÛáã ÝãäÚÝ ÚëíÜÝâÝãäÙäÛáã ßÝéäáÚÛÝÜÜÝ Ýä èÚáÛä èÝ ÜÙconcurrence 55
un prix plafond contraignant ne peut être qu’une proportion du prix optimale
que pratiquerait la firme intégrée en cas d’absence de réglementation. De ce
fait, seulement une proportion de l’efficacité du concurrent est pris en compte
par la réglementation. En ce qui concerne le bien-être social, les résultats sont
toutefois ambigus, car ils dépendent à la fois du degré de différentiation, de
l’efficacité du concurrent et du niveau du prix régulé sur le marché en amont.
Ce chapitre met donc en évidence la complexité de l’interaction entre la
réglementation sectorielle et le droit de la concurrence. Les bénéfices en terme
de bien-être social que pourrait procurer l’application conjointe de ces deux
outils sont très difficiles à cerner. L’approche américaine dans la matière semble
être meilleure que celle de l’UE.

cÏeÓÏËÐÊÒfgh
Carlton D. W., (2008). Should Price Squeeze be a Recognized Form of An-
ticompetitive Conduct?, Journal of Competition Law and Economics, 4(2),
271-278. DOI:10.1093/joclec/nhn012.
Choné P., Komly B., Meunier V., (2010). Margin Squeeze, entry and "umbrella
effect, Mimeo.
European Commission, (1998). Notice on the Application of the Competition
Rules to Access Agreements in the Telecommunications Sector, 98/C: 265/02
(also in Official Journal C 265, 22/08/1998:2-28). Available here×
56


jËÈÎÓÍvion générale
Le secteur des TIC est l’un des plus dynamiques dans notre environnement
économique actuel. Il n’est guère étonnant qu’il soit considéré comme une
pierre angulaire de la stratégie de poursuite de développement de notre so-
ciété, puisque ces dynamiques ont fourni (et continueront à fournir) des gains
d’efficacité et de productivité considérables à la société complète.
Cependant, ce secteur est composé d’un grand nombre d’acteurs. Et, plus
le nombre d’acteurs impliqués dans un processus est élevé, plus compliqué le
processus devient. Malheureusement, l’industrie des télécommunications n’est
pas une exception à cette règle. Il est donc d’une importance cruciale de bien
comprendre les comportements stratégiques de tous les membres de la chaîne
de valeur sous-jacente et les conséquences impliquées par leurs actions.
Avec l’objectif de contribuer à la compréhension de cet écosystème, les
trois essais, qui constituent cette thèse, ont porté plus particulièrement sur
le secteur des télécommunications. Les 20 dernières années ont été marquées
par des changements importants relatifs à ce secteur, allant des innovations
technologiques jusqu’aux changements de comportement des prestataires de
services, des consommateurs ainsi que des organismes de réglementation na-
tionaux. Savoir qui a influencé qui revient au problème de la poule et de l’oeuf.
Le fait est que les changements sont survenus et leurs conséquences doivent
être comprises.
Les deux premiers chapitres de cette thèse ont mis l’accent sur le com-
portement des consommateurs et l’évolution des prestataires de services. Alors
58

àáãéÜÞßÛáã íëãëÚÙÜÝ �O
qu’une substitution fixe-mobile soutenue est observée du côté de la demande,
une tendance vers les ventes liées, c.-à-d. des offres regroupant des services
fixes et mobiles, est observée du côté de l’offre. Cette opposition donne lieu
à la question de savoir si la pratique de regrouper des services substituables
est une réponse adéquate aux phénomènes observés et ce que cela signifie pour
le secteur des télécommunications. Un cadre théorique a donc été développé
dans le premier chapitre, qui vise à fournir des indications pertinentes. En
plaçant le différentiel entre les prix de réserve des consommateurs pour les
services fixes et mobiles au centre de l’analyse, il est démontré que la pra-
tique des ventes liées est rentable tant que les consommateurs valorisent les
services fixes suffisamment forts par rapport aux services mobiles. A l’inverse
des résultats dans la littérature existante, la situation de dilemme du prison-
nier n’émerge pas nécessairement, ni ne baisse le surplus du consommateur.
Néanmoins, puisque les offres groupées sont vendues à un prix réduit, cette
guerre de prix peut conduire à une diminution de la valeur de marché et donc
des flux de revenus pour les entreprises, remettant en question les incitations
ou des accords d’investissement.
Le marché français peut être utilisé à des fins d’illustration de ce résultat.
Avec l’apparition d’un quatrième opérateur multi-marchés, une guerre des prix
féroce a été déclenchée au début de l’année 2012. Des offres mobiles très agres-
sives ont émergé ainsi que des offres groupées fixe-mobile très compétitives.
L’ère du low cost sur le marché français a donc commencé. La conséquence
à court terme est évidente: les consommateurs bénéficient de prix bas et de
forfaits très généreux. D’un autre côté par contre, cette concurrence intense a
également déclenché un processus de consolidation de marché, une consolida-
tion qui est rendue visible à travers le fait que deux des trois opérateurs établis
ont vécu (et vivent toujours) des difficultés financières.4 wÞÝ éÝ çÚáéÝßßÞß èÝ
4 Cf. ici ÿ�� ��÷ û�����úùû��÷ ���úùû� r �ú � �� ú�û÷úùû�� ��÷ ���üùû�÷ ü��x øyz �ù ü��xBouygues Télécom.

àáãéÜÞßÛáã íëãëÚÙÜÝ "<
consolidation soit à saluer d’un point de vue bien-être social reste encore une
question ouverte. Cependant, les revenus des acteurs du marché ont souffert
des rétractions considérables dans la première année suivant l’apparition de
Free et les investissements ont chuté de presque 30 % l’année suivante.5 wÞáÛ
qu’il en soit, les opérateurs ont conclu des accords pour couvrir la France avec
un réseau Internet à très haute débit à l’échelle nationale vers le début de 2020
et ces éventuels effets négatifs dus à cette concurrence intense restent encore
à vérifier dans le moyen ou long terme.
Les changements du côté de la demande sont également au cœur du deux-
ième chapitre. Contrairement au précédent, ce chapitre traite le sujet de
manière empirique. En particulier, il étudie l’impact des facteurs socio-démographiques
sur le comportement de consommation des utilisateurs français des services de
communications.
En utilisant un large échantillon de données françaises pour la période 2008
- 2012, l’étude permet de confirmer un résultat déjà établi pour les États-Unis
ou le Royaume-Uni, à savoir que le type de consommateur mobile-only est prin-
cipalement dû à une contrainte budgétaire forte des consommateurs concernés.
Plusieurs études depuis le début des années 2000 aux États-Unis montrent que
les ménages à faible revenu sont plus susceptibles d’utiliser exclusivement des
services mobiles.6 �Ýß données utilisées ici permettent de conclure sur la dif-
férenciation des opérateurs français. En effet, l’étude révèle que l’opérateur
historique a un avantage concurrentiel dans les zones rurales et les petites
villes, alors que dans les grandes villes, où la concurrence est plus intense, cet
avantage semble réduit.
Même si les résultats sont en ligne avec des études antérieures, leur ro-
bustesse est peut-être discutable. Tout d’abord, les données ont été recueillies
5 Cf. ici ÿ�� �ö�!÷��úù�û�� ÷� ��÷ ü����ûüúùû��÷ ��üù���û��÷ �� �ö{zdý|�6 Cependant, ces études ont également souligné que ce nouveau type de consommateur
est principalement incarné par les nouveaux arrivants sur le marché plutôt que par des gensqui ont effectivement annulé leur abonnement de communications fixes.

àáãéÜÞßÛáã íëãëÚÙÜÝ "´
au moment de la pire crise économique depuis jeudi noir en 1929, et elles
n’incluent pas des informations sur les habitudes d’usage des consommateurs.
Malgré la (forte) probabilité que l’évolution technologique a un impact signifi-
catif sur l’émergence du type de consommation mobile-only, ce serait de la pure
spéculation de l’inclure comme une composante de l’explication des résultats
de ce chapitre. Par ailleurs, il serait intéressant de répéter l’analyse en util-
isant des données issues de temps meilleurs d’un point de vue économique ainsi
qu’avec les données manquantes sur l’usage. Deuxièmement, comme indiqué
ci-dessus, l’entrée sur le marché du quatrième l’opérateur mobile a fortement
agité le marché, ce qui implique d’autres impacts sur le comportement des
consommateurs. Des données futures sauront en dire plus sur cet impact.
La concurrence entre services et entreprises, telle que considérée dans les
deux premiers chapitres, fut atteinte, entre autres, par la volonté politique de
libéraliser le secteur des télécommunications. En particulier, la réglementa-
tion de l’accès du réseau de cuivre à l’échelle nationale, le plus souvent sous le
contrôle d’un monopole, est devenue une des missions principales des autorités
nationales de réglementation. Au fur et à mesure que la concurrence basée sur
les services dans le marché du fixe a décollé, plusieurs plaintes pour discrimina-
tion tarifaire, et plus particulièrement pour compression des marges, ont surgi
avec la conséquence ultime que le secteur des télécommunications est devenu
l’objet d’une certaine forme de réglementation des prix en amont et des prix
en aval.
La question de savoir si la mise en œuvre conjointe des outils réglemen-
taires et des outils juridiques est sage ou non fait l’objet du troisième et dernier
chapitre. Ici, un cadre théorique est utilisé afin d’analyser l’interaction entre la
régulation du marché en amont et des obligations de non-discrimination sur le
marché aval. L’analyse se focalise en particulier sur l’interdiction de ciseau tar-
ifaire. Dans un contexte de produits de détail différenciés, l’analyse révèle que

àáãéÜÞßÛáã íëãëÚÙÜÝ "î
la combinaison des deux outils est susceptible de conduire à une diminution du
bien-être social, que les prix finaux augmentent et que les quantités produites
diminuent. Une condition suffisante pour cet événement est une efficacité plus
élevée du concurrent non intégré.
Les résultats du dernier chapitre peuvent être mis en perspective de la
façon suivante. Le but ultime de la Commission Européenne est d’améliorer
le bien-être social en s’appuyant, entre autres, sur l’unification des marchés
nationaux et une concurrence intense. Améliorer le processus concurrentiel est
donc l’un des principaux moteurs de la politique européenne en matière de
concurrence. Dans ce cadre, la Commission considère que le ciseau tarifaire
est une théorie indépendante des théories du préjudice déjà existantes, telles
que les prix prédateurs ou le refus de vente. Elle a donc augmenté sa surveil-
lance des stratégies de tarification des entreprises en position dominante sur
un marché, notamment en complétant la réglementation des prix d’accès avec
l’application du droit de la concurrence.
Contrairement à l’approche américaine, qui préfère considérer ces deux
outils comme substituts, l’approche européenne est susceptible de manquer
l’objectif de promotion du bien-être social. Le débat sur la meilleure façon
de traiter cette question reste vif, puisque l’arrêt le plus récent de la Cour de
Justice de l’UE en matière de ciseau tarifaire a réaffirmé l’indépendance de cet
abus.7 �Ù ãáÞêÝÜÜÝ àáââÛßßÛáã ÝÞÚáçëÝããÝÕ ÛãêÝßäÛÝ � ÜÙ Aã èÝ ÜôÙããëÝ î<´�Õ
n’a pas encore fait de déclaration sur le sujet en question, mais il sera intéres-
sant de voir si un changement de vision a eu lieu, et donc si une convergence
de traitement du sujet entre les USA et l’UE aura lieu ou non.
Le fait que l’industrie des TIC est devenue une priorité des autorités poli-
tiques montre son importance pour notre société. Mais, les caractéristiques
complexes sous-jacentes doivent être maîtriser pour tirer pleinement avantage
7 Mémo de la Commission européenne en date du 10/07/2014 sur l’arrêt de la Coureuropéenne de justice dans affaire C- 295/12 P. Cf. ici�

àáãéÜÞßÛáã íëãëÚÙÜÝ "I
de cette industrie. Dans l’optique de contribuer à la compréhension de cette
industrie, cette thèse n’est néanmoins qu’une petite goutte dans cet océan
immense et il reste encore beaucoup à faire.


!"#$%#&'()*+#,-*)&(*)'(#
A Montpellier, le
!
Le Président de l’Université de Montpellier
Philippe Augé

DOCTORAT DE L’UNIVERSITE DE MONTPELLIER
FACULTE D’ECONOMIE
TITRE: Essais en économies des télécommunications: concurrence entre services et entre firmes
RESUME Le secteur des télécommunications est devenu très important pour notre société, car, non seulement permet-il de mettre en relation des personnes
se trouvant à des bouts opposés dans le monde, mais il contribue également à la croissance de notre productivité. Afin de bénéficier au maximum
de ce secteur, il est indispensable de bien comprendre son fonctionnement. Le but de cette thèse est justement de contribuer à sa meilleure
compréhension. Elle vise en particulier des questions relatives à son environnement concurrentiel. Un premier volet se concentre sur la
concurrence entre les services de télécommunication: les services fixes et mobiles. En effet, des évolutions contradictoires sont observées depuis
quelque temps. D’abord, le nombre de consommateurs qui n’utilisent que leur mobile pour satisfaire leurs besoins en télécommunications ne cesse
d’augmenter. Ensuite, le nombre de souscription d’offres groupées, regroupant des services fixes et mobiles, connaît également une hausse
importante. Se pose alors la question, traitée dans le premier chapitre, concernant la rentabilité de cette pratique pour les opérateurs de
télécommunications, ainsi que l’impact sur le bien-être social lié à cette stratégie. Un modèle théorique, intégrant à la fois la différenciation
horizontale, la substitution fixe-mobile et les préférences hétérogènes des consommateurs, permet de conclure que les opérateurs risquent de subir
des pertes de profits, alors que les consommateurs profitent de cette pratique. Par ailleurs, le gain des consommateurs est plus grand que la
réduction de profits des opérateurs, de façon à ce que le welfare social augmente. La substitution fixe-mobile est également au cœur du deuxième
chapitre qui cherche à déterminer les caractéristiques sociodémographiques d’environ 20.000 utilisateurs français expliquant le mieux leur choix
en matière de souscription soit à une offre mobile en tant que service unique, soit à une offre groupée ou encore à plusieurs services séparément.
Le résultat principal est que les utilisateurs «mobile-only» semblent avoir une contrainte de budget plus serrée que les utilisateurs «multi-
services». Par ailleurs, l’étude fait apparaître un avantage pour l’opérateur historique quand il s’agit de souscrire une offre groupée. Le deuxième
volet de cette thèse traite de la concurrence entre entreprises. En particulier, le troisième et dernier chapitre propose d’analyser l’impact de
l’interaction entre la réglementation sectorielle (notamment la régulation de prix) et le droit de la concurrence (notamment, l’interdiction de la
pratique dite de «ciseau tarifaire») sur l’équilibre dans une industrie de réseau. Le débat sur ce sujet a engendré des points de vue diamétralement
opposés, spécialement entre les USA et l’Europe: alors que ces deux outils sont considérés comme substituts outre-Atlantique, ils sont des
compléments dans la conception européenne. La question est donc évidente: laquelle de ces deux doctrines a le moins d’impact sur l’efficacité du
marché? Une analyse théorique permet de montrer que le prix de détail pratiqué par une firme verticalement intégrée, propriétaire du réseau
physique et qui, contre paiement d’une «charge d’accès», laisse son concurrent accéder à son réseau, peut ne pas respecter le droit de la
concurrence sans qu’il y ait une intention anticoncurrentielle. Par ailleurs, l’application du droit de la concurrence en combinaison avec la
réglementation des prix (notamment, la charge d’accès) mène à une inefficacité du marché représentée par une hausse des prix de détails, néfaste
non-seulement pour le consommateur, mais aussi pour le welfare social. Cette thèse conclut en rappelant l’importance d’une compréhension
approfondie du fonctionnement du secteur des télécommunications. Parce que les évolutions reconnues dans ce secteur ne sont pas anodines, des
analyses théoriques et empiriques sont nécessaires afin que chacun puisse bénéficier des apports de ce secteur.
MOTS-CLES: Télécommunications, concurrence, réglementation sectoriel
TITRE: Essais in economics of telecommunications: competition between services and between firms
ABSTRACT The telecommunications sector has becomes very important for today’s society, as it allows people at either end of the world to communicate, as
well as it contributes to the growth of our productivity. In order to fully benefit from this sector, a deep understanding of its functioning is
indispensable. The aim of this thesis is to contribute to its better comprehension by focusing in particular on questions relative to the competition
in this sector. This thesis concentrates first on the competition between fixed and mobile telecommunications services. Indeed, contradictory
evolutions are observed. First, the number of consumers relying only on their mobile so as to satisfy their need in telecommunications increases
steadily. Second, the number of subscriptions of bundled offers, regrouping fixed and mobile services, has also increased in an impressive manner.
The question, treated in the first chapter, is thus to know whether the practice of bundling is profitable for telecommunications operators, as well
as the impacts on social welfare induced by this strategy. A theoretical model, integrating horizontal differentiation, Fixed-Mobile substitution and
heterogeneous consumer preferences, allows to conclude that operators are likely to lose profits when bundling their services, whereas consumers
are clear winners. Furthermore, the increase of consumer surplus more than compensates the firms’ profit losses, such that social welfare
increases. Fixed-Mobile substitution is also at the core of the second chapter. Its aim is to determine the socio-demographic characteristics of
about 20.000 French users that explain best the users’ choice of subscribing either to only a mobile offer, to a bundled offer or to several services
separately. The main result is that “mobile-only” consumers seem to have a stronger budget constraint than “multi-service” users. Moreover, the
study provides evidence for an “incumbency advantage” when it comes to subscribing to a bundled offer. The thesis then turns to competition
between firms. More specifically, the third and last chapter offers an analysis of the impact on the equilibrium in a network industry induced by
the interaction of sector regulation (notably, price regulation) and competition law (notably, the prohibition of the so-called “margin squeeze”).
The debate on this subject has induced two widely opposed points of view, in particular between the US and Europe: whereas the US considers
both tools to be substitutes, they are used as complements in Europe. The underlying question is thus evident: which doctrine has the least impact
on the market efficiency? A theoretical analysis allows first to show that the retail price set by a vertically integrated firm, that owns the physical
network and grants its downstream competitor access to it against the payment of an “access charge”, may not comply with competition law
without any anticompetitive intention. Moreover, applying competition law in combination with sector regulation (notably, regulation the level of
the access charge) leads to market inefficiency, characterized by an increase of retail prices, which is detrimental to consumer surplus and social
welfare. The thesis concludes by reminding the importance of a deep understanding of the functioning of the telecommunications sector. Since the
evolutions in this sector are not harmless, many theoretical and empirical analyses are need, so that every one can profit from the contribution of
this sector.
KEYWORDS: Telecommunications, competition, sector-specific regulation
DISCIPLINE : Sciences Economiques (Section 05)
Laboratoire: LAMETA – Laboratoire Montpelliérain d’Economie Théorique et Appliquée - UMR 5474 CNRS, Faculté des Science
Economiques, Avenue Raymond Dugrand CS. 79606, 34960 Montpellier Cedex 2