the interface of competition and regulation in energy, telecommunications and ...€¦ · ·...
TRANSCRIPT

1
The interface of competition and regulation in energy, telecommunications and
transport in South Africa
DRAFT: NOT FOR CITATION
For presentation at Competition Commission and Tribunal Annual Conference, GIBS,
Johannesburg, 4 & 5 September 2014
Reena Das Nair and Simon Roberts (Centre for Competition, Regulation and Economic
Development, CCRED, University of Johannesburg)
[email protected] , [email protected]
This paper analyses the relationship between competition and regulation through a critical
assessment of the work of economic regulators and the competition authorities in South
Africa in the core areas of energy, telecommunications and transport. It draws on working
papers done as part of an in-depth review of economic regulation coordinated by CCRED for
national government. Economic regulation is generally understood as necessary to address
entrenched market power and/or market failures. What has attracted less attention is the fact
that market failures can be the basis for first-movers and incumbents to exclude entrants.
Given that market power and market imperfections are intrinsic to a market economy, it
makes sense to see economic regulation broadly - as the set of rules within which
businesses make investment, production and supply decisions. Viewed in this way, it is
important for economic regulators to take into account the dynamic gains from greater
competitive rivalry when setting rules and making decisions. Indeed, regulation may seek to
create what Ginsberg (2009) has termed ‘synthetic competition’ where the dynamic gains
from rivalry such as in terms of product and service development are judged to merit
ensuring several competitors, even although scale economies imply that only one firm would
minimise costs. The regulatory record in South Africa in key areas of the economy is
assessed through this lens.

2
1. Introduction
Economic regulation is largely about regulating the natural monopoly parts of value chains
and generally involves the regulation of enterprises that are, or were, state-owned.
Regulating access to, and pricing of, essential infrastructure, key inputs, and bottleneck
goods and services that cannot be easily replicated is seen as necessary to ensure that fair
access is provided and that monopoly prices are not charged (Viscusi et al., 1998).
Economic regulation is also seen as a mechanism by which significant market failures can
be corrected, or entrenched dominant positions kept in check. In certain industries, such as
network infrastructure, the private sector will underinvest as the social returns are generally
greater than the private returns, given the large externalities generated. In such industries,
economic regulation is necessary to ensure sufficient investment. Therefore, the scope of
economic regulation is broader than just controlling access and pricing. Dynamic
considerations such as the impact on investment decisions, the impact of infrastructure on
the development path of the economy, and the creative role of competitive rivalry all need to
be part of an effective economic regulatory regime.
While economic regulation is often viewed as the control of market power in instances where
competition is either not possible or is not desirable, competition policy is about regulating
potentially anti-competitive behaviour of dominant players and addressing structural changes
through the merger regime or through conditions. In this sense, economic regulation is
predominantly ex ante, where the rules of the game are set out up front, while competition
law enforcement is largely ex post, where past anticompetitive conduct is prosecuted after
the fact, except for the merger regime where accretions of concentration which could
potentially lead to anticompetitive outcomes are curbed ex ante. However, this dichotomy is
imprecise, as even economic regulation mainly uses past conduct and data to determine the
future course of action and competition policy aims to influence future conduct through
changing past undesirable behaviour. The two are even further interrelated - regulation is
required for competition to flourish, for instance, to ensure access to essential facilities or
inputs. A regulatory regime that favours incumbents over new entry hinders competitive
objectives and it is important that regulators take into account dynamic gains from greater
competitive rivalry in setting the rules of regulation and when making decisions. Similarly, it
is important that competition authorities appreciate the rationale for, and forms of, economic
regulation and, at the same time, understand that some matters regarding competitive
outcomes are more effectively resolved through regulatory intervention.
This paper draws lessons from experiences in three regulated industries in South Africa -
Energy, Telecommunications and Transport (ports and rail). These sectors were selected as
part of a national government-funded project aimed at building regulatory entities’ capacity.1
The project reviewed the performance of regulators in the wider context of: their mandates
and powers; the challenges they face in terms of regulatory capacity, accountability,
credibility and other constraints, including fiscal constraints; and industry performance in
terms of pricing outcomes, investment in the sector, allocative and productive efficiency. The
reviews further assessed whether economic regulation in these industries has contributed to,
1 “Regulatory Entities Capacity Building Project”, for the Economic Development Department. All outputs from
this project can be accessed at http://www.competition.org.za/regulatory-entities-capacity-building-project/
3
or has been in conflict with, other economic development mandates aimed at sustainable
development and inclusive growth. We draw on these reviews to identify important lessons
for the interface between competition and regulation in these sectors. This is useful for
economic regulators in terms of learning from each other, for engagement between
economic regulators and competition authorities, as well as for policy makers.
The different industries reflect a diversity of approaches, from which insights can be drawn.
In electricity we have an integrated State Owned Enterprise (SOE) with in independent
regulator, and with the introduction of new participants in the form of renewable energy
generators. In rail freight and ports there is an integrated SOE without a regulator until the
recently established port regulator. In telecommunications, the main operator has long been
effectively privatised, and there are private operators in mobile telephony, with a long
established regulator and enforcement actions by the competition authorities.
The structure of this paper is as follows. Sections 2, 3 and 4 evaluate the outcomes and
performance of the electricity, transport (ports and rail in particular) and telecommunications
sectors of South Africa respectively, highlighting how certain decisions of the relevant
regulator encouraged competitive outcome, whilst others discouraged it. Section 5
concludes by comparing and contrasting similarities and differences of each regulatory
regime and drawing together key lessons learnt.
2. Energy2
The Electricity Supply Industry (ESI) of South Africa is dominated by state-owned utility,
Eskom, which operates across the entire electricity value chain in electricity generation,
transmission and distribution. Eskom generates 95% of the electricity consumed in the
country with independent power producers (IPPs) representing a much smaller portion of
electricity generation.
After the corporatisation of Eskom, there were concerns around the dominance of Eskom
throughout the ESI, and around the poor performance on a technical level throughout the
value chain.3 Even though Eskom was funded by Government, alternative sources of
funding were needed to invest in and develop the ESI. These factors culminated in
developing a hybrid model, in which Eskom on one hand was given the responsibility for
immediate new investment and private IPPs on the other hand were given an opportunity to
participate in electricity generation. However, the industry is still dominated by Eskom in
terms of the size of its contribution to electricity generation, its ownership and operation of
Transmission Network Services (TNS) and its role in distributing electricity. At the distribution
level, Eskom distributes around 60% of the country’s power, with municipalities distributing
the balance. Although Eskom distributes more power than municipalities, it serves a fewer
2 The Energy sector reviews (Electricity and Renewable Energy) were undertaken by Trade and Industrial Policy
Strategies (TIPS) on behalf of CCRED- Das Nair, Montmasson-Clair and Ryan (2014) for electricity and Montmasson-Clair, Moilwa and Ryan (2014) on Renewable Energy. There was also a study of liquid fuel which is not included in this paper. 3 Transmission and distribution losses averaged 20% compared to the global average of 5%. Eskom was
strapped for cash and debt coverage ratios were high. Below-cost tariffs significantly contributed to poor technical and financial performance (Eberhard and Gratwick, 2008).

4
number of end-users, with long-term contracts with mining companies and other large
industry players at more favourable rates.
The ESI has been regulated by an independent regulator since 1995 (first by the National
Electricity Regulator (NER), followed by NERSA since 2005). The regulator is tasked with
price determination, licensing, dispute resolution and compliance of electricity suppliers.
Outcomes in the ESI and the regulator’s role in these outcomes
The outcomes observed in the ESI, particularly in terms of supply and pricing of coal-
generated electricity, are linked to investment patterns in generation infrastructure which, in
turn, are a product of regulatory decisions, but which have also been influenced by political
pressure, Eskom’s market power and influence by large electricity-intensive user groups.
Policy uncertainty and institutional complexity (several players with divergent views involved
in decision making and no clear energy policy4) have further resulted in certain detrimental
impacts on the sector and the economy as a whole, particularly during the 2008 load-
shedding crises. However, the success story of the ESI on the generation level has been the
Renewable Energy Independent Power Producers (REIPP) procurement programme,
discussed later. The evolution of the renewable energy industry emphasises how challenges
can be effectively addressed through proactive regulation that takes into account competition
principles.
The key question relating to average and relative prices charged to different electricity
customers is how the legacy of overinvestment in generation capacity in the 1980s has
influenced the structure of the economy and, in particular, its capital-intensive bias. As we
discuss below, over-investment in generation capacity led to power stations being built and
then mothballed in the 1980s. This meant that it was worth selling electricity as long as the
price earned was above the variable costs of generation and made some contribution to the
fixed costs. In a sense, the over-investment in capacity – which could clearly not be reversed
– created the basis for some buyers to receive a subsidised price. The question is which
buyers received this advantage. The easiest way to increase demand was by incentivising
large energy-intensive industries such as smelters, and this is largely what happened.
However, the unintended consequence was a skewing of the economy towards a very
capital-intensive structure. In effect, the cheap electricity amounted to an export subsidy for
these types of businesses, with the knock-on effect of supporting the exchange rate which in
turn makes other producers of traded goods less competitive. The second key implication is
that when electricity demand outstrips capacity then new capacity needs to be built, and the
rationale for the very cheap pricing no longer exists – pricing needs to cover the costs of
building the generation plant and not just the cost of operating the power station. The lack of
conditions that linked the low pricing to availability meant that the economy was rationed in
its electricity usage, and Eskom had to compensate large energy-intensive users for
reducing their consumption.
4 Department of Energy, the Department of Public Enterprises, the National Treasury, NERSA, Department of
Environmental Affairs, Department of Water Affairs, Eskom, Independent Power Producers, Energy Intensive Users Group of Southern Africa; South African Local Government Association; Association of Municipal Electricity Undertakings, Municipalities are some of the many key stakeholders in the ESI.

5
The result of the historic decisions regarding investment and pricing is that there has been a
path dependency on relatively cheap and non-renewable electricity. The adjustment towards
new priorities and appropriately priced electricity has been slow and riddled with difficulty. In
addition, the costs of the new build programme and the electricity prices required for the
financial sustainability of Eskom demonstrates just how big the effective subsidies have
been.
Average real prices declined over the 1980s and 1990s (Figure 1), although the average
price conceals the differences in prices to different users. The steep increases in average
prices coinciding with large infrastructure build are also evident.
Figure 1: Average electricity prices and increases from 1972-2013
Source: TIPS (2014), Das Nair, Montmasson-Clair and Ryan (2014), ‘Review of Regulation in the Electricity
Supply Industry’ based on Eskom’s 1996 Statistical Year Book and 2013 Historical Averages; Statistics South
Africa and Quantec data
Note: Base year: 2012. The average price is a simple average across all tariffs Eskom charges calculated by
taking total value of sales divided by the number of kilowatt-hours (kWh) sold per year. It is assumed that this
includes sales through special pricing deals.

6
Sub-optimal investment decisions in terms of planning, timing, size and technology choices
of power plant investments have affected the pricing trajectory. Between 1974 and 1978,
electricity prices rose by 70% in real terms due to capacity shortage, along with increasingly
frequent load-shedding up to 1981. In response, Eskom started a large new-build
programme. By 1983, the SoE had 22.26GW of generation capacity under construction or on
order (Steyn, 2006). Failure to properly plan and oversee investment decisions resulted in an
excessive capacity expansion programme and inefficiency in investment by Eskom
(Kessides et al., 2007). In order to service Eskom’s soaring debt, cost was passed on to
consumers, leading to steep average nominal price increases in the 1980s while the SoE
benefited from a monopoly position, government guarantees, open-ended Reserve Bank
forward cover and an exemption from taxes and dividends.
By the late 1980s / early 1990s, Eskom faced severe political pressure to reduce prices as
soon as declining debt levels would allow it (Steyn, 2003). Increased internal efficiency and
huge excess generation capacity (due to the economic downturn and the commissioning of
new power stations in the 1980s) allowed Eskom to reduce real electricity price increases for
the following 15 years. Moreover, in the 1990s, Eskom entered into a compact with its
customers to keep its prices low and to reduce the real cost of electricity by 20% over the
period 1991-1996. A reduction of 16.6% was achieved. This kept prices at a level that was
relatively low compared to global standards and previously explained, these low prices did
not adequately cover costs and did not allow for reinvestment.
As stated above, one solution was to increase demand by incentivising large energy-
intensive industries such as smelters and other heavy-users. Eskom in 1990s entered into
favourably-priced long term supply agreements5 with aluminium smelters (Alusaf, BHP
Billiton’s predecessor) and with ferrochrome smelters6 to ensure offtake of excess electricity
capacity and to promote downstream industry. These pricing structures, increasingly
favourable to large industrial users, were not amended by NERSA over the years according
to changing supply and demand balances and economic conditions. When the balance
changed and the country faced an electricity shortage in 2008, these contracts caused
considerable controversy as they were seen to favour big foreign-owned business that
contributed little to local downstream beneficiation (as they largely exported un-beneficiated
aluminium products) and employment at the expense of the local economy, which suffered
serious electricity shortages and escalating prices. Prices to heavy-users of electricity
arguably should be increasing relative to light users in tight supply situations so as to
discourage the use of electricity and encourage investment in energy efficiency and
renewable energy. While these select dominant customers get significantly cheaper prices7
compared to households and smaller industry partly due to lower costs to supply/serve8,
there appears to be few other cost-related reasons. This practice in effect created a path
dependency on cheap, dirty energy by heavy industry. These decisions have implications for
5 Special/Negotiated Pricing Agreements, where prices to the smelters were fixed in terms of international
aluminium prices and exchange rates 6 The ferrochrome smelter agreements were terminated, but certain of the BHP contracts are still in effect.
7 General industrial customers pay Megaflex rates, which are also cheaper than what households pay, although
not as favourable as what BHP Billiton pays. 8 There are also interruptability provisions in the contract with BHP which allow Eskom to cut supply to the
smelters when the grid is under stress, which is to the disadvantage of the smelters, and pricing admittedly does have to reflect this.
7
economic participation as it favours heavy users of electricity and limits participation for
those who cannot secure these favourable rates.
When demand once again outstripped supply the South African Government, through
Eskom, started a massive generation expansion programme in 20059. This reaction to the
increased demand on the grid was delayed, and not in time to prevent the 2008 crisis.
Although the programme considered the objectives of the latest Integrated Resource Plan,
especially the need to diversify the technology and fuel mix of generation, technology
choices were predominately influenced by the objective of ‘keeping the lights on’ at the
cheapest cost (at the time of decision-making). Hence, the programme favours large coal-
fired generation plants.
As in the 1980s, the financing requirements of this colossal investment programme have
contributed to pushing prices up, ultimately resulting in a trebling of the average standard
price from 2009/2010 to 2017/2018 (NERSA, 2013b, 2010). The repetition of a sub-optimal
investment pattern (over- and under-investment) could have been avoided through effective
(and implemented) policy learning and prudent investment decisions. A proactive strategy for
new generation capacity based on timely progressive building (rather than lumpy, large-
scale build) and matching demand trends and forecasts would have delivered a much
smoother price trajectory.
However, these outcomes were not because of NERSA’s actions (or inactions) alone.
Government made a number of public statements bypassing NERSA, compromising its
independence. For instance, government sent out mixed messages on whether Eskom
should invest in generation capacity or not. Initially, a blueprint for a competitive ESI
including a power exchange, the unbundling of distribution and transmission and a partial
unbundling of generation was produced for Cabinet in May 2001. The document
recommended that 30% of the generation capacity would be sold to the private sector,
Eskom retaining 70% of the market. It was stated that Eskom would not build any additional
generation capacity from 2001, thus transferring this to the private sector (Pickering, 2010).
But this message was reversed when government then announced that Eskom should build
power stations. This created uncertainty for private sector IPP investors about whether they
should invest or not. Further, with Cabinet approval, Eskom bypassed NERSA’s review
process of the construction of Kusile power station, again compromising the regulator’s
credibility.
With regards to unbundling, in 2011, the Independent Systems and Market Operator (ISMO)
Bill approved by Cabinet envisaged that an ISMO would invest, operate and maintain the
country’s high voltage transmission grid separately from Eskom to ensure that independent
generators would receive fair access to the transmission network. The ISMO has the
potential to accelerate the development of renewable energy and increase participation of
independent power producers (IPPs) in the country, empowering them to sell electricity
directly to customers without having to be routed through Eskom. However, the ISMO Bill is
9 Valued at ZAR 340 billion, excluding capitalised borrowing costs. By 2018/2019, the programme will add
17.1GW of capacity to the 2005 nominal generation capacity of 36.2GW (Eskom, 2013b).

8
back on hold after the motion to revive the ISMO Bill was once again dismissed in March
2014, potentially delaying rivalry with regards to access to the grid.10
At several points in time, there has been political pressure in the pricing of electricity. In the
80’s and 90’s, there was pressure on Eskom to suppress prices. In 2004, the Minister of
Public Enterprises announced that Eskom was prohibited from increasing prices above
inflation. This announcement questioned the independence of the regulator and tarnished
the credibility of administrated pricing system. As the actions of the Minister contradicted the
principles of the legislation, it created a sense of unease regarding “the government’s
respect for the role of independent regulatory processes” (Steyn, 2003).
During the implementation of the Multi-Year Price Determination (MYDP) mechanism11,
Eskom did not always receive the price increase it sought through the required revenue
pricing mechanism. In some instances, this was because an objective of lowest possible
electricity prices was prioritized. In other instances, it was because NERSA more strictly
questioned Eskom’s costs submissions (prices were determined based on covering full costs
and allowing a rate of return). It is argued that not allowing full cost recovery through the
tariff mechanism jeopardized Eskom’s ability to finance new generating capacity (Steyn,
2012). NERSA has nonetheless made significant progress in reducing uncertainty for
customers by making different Eskom’s tariff structures more transparent, user friendly and
more cost-reflective over the years.
The pricing of electricity sold through municipalities has been a further area of contention,
and an area in which although some headway has been made by NERSA, more could be
done in terms of ensuring investment in maintenance and repair of the distribution system.
Municipalities are primarily responsible for distribution and retail activities in urban areas,
and they purchase power from Eskom for resale to consumers within their boundaries.
Serious concerns have been raised by households and industry that electricity prices are
excessively marked-up by municipalities, over and above Eskom’s tariffs, with no
consistency across municipalities. This is said to have negative impacts on the
competitiveness of small industrial end-users, such as foundries and light manufacturing,
supplied by municipalities. Some estimates are that municipality mark-ups can be between
50 to 100% above the direct Eskom price (Clark and van Vuuren, 2013), placing those that
source from municipality immediately at a competitive disadvantage to rivals sourcing
directly from Eskom.
The reasons for this appear to partly stem from municipality funding models, where funds
generated from electricity sales are used to cross-subsidise other municipal activities
creating perverse incentives to inflate electricity tariffs through high mark-ups to earn more
revenue to fund other activities. In addition, there is regulatory uncertainty, or misalignment
when it comes to who is ultimately responsible for regulating municipal activities. The
10 While the ISMO Bill has been discussed and agreed on by the Portfolio Committee on Energy at two
occasions, it has been stalled in Parliament, being removed from the National Assembly Order Paper twice in June and November 2013 (Pressly, 2013) cited in Das Nair et al. (2014), p32. 11
The pricing methodology has historically and currently been one of full-cost recovery in principle. NERSA currently employs the mechanism of a Multi-Year-Price-Determination (MYPD) method to set electricity prices. The MYPD is essentially a rate of return method of price regulation where price level is set to cover all costs and allow a fair rate of return on the cost of capital.

9
Constitution grants municipalities the executive authority, and the right, to administer
electricity reticulation. While NERSA has the mandate to set the tariff that municipalities can
price electricity sales at, the Constitution allows municipalities the right to apply surcharges
or mark-ups over and above this NERSA determined price to municipal services.12
One of the biggest issues however remains the lack of maintenance and investment in
distribution infrastructure. Ageing infrastructure operating at maximum capacity is causing
the system to be overloaded, resulting in supply interruptions.13 A major refurbishment
backlog estimated at ZAR 27billion exists in the EDI, and continues to grow at an estimated
ZAR 2.5billion per annum (Louw, 2012, Rustomjee, 2013 and Noah, 2012). NERSA could
potentially play a much stronger role is in ensuring that there is investment by municipalities
in maintenance and refurbishment of distribution infrastructure.
The renewable energy experience14
The Renewable Energy Independent Power Producers (REIPP) procurement programme is
an interesting case study which highlights ways in which challenges in the ESI can be
addressed through effective regulation which proactively introduces competitive rivalry.
The evolution of the renewable energy programme has been a learning curve for
stakeholders. The early programmes to facilitate entry by Independent Power Producers
(IPPs) (2007-2008) were conceptualised, designed and administered by Eskom in 2007-
2008. In each of these programmes15 there were no power purchase agreements (PPAs)
between Eskom and IPPs. This made the commercial banks reluctant to finance these as it
placed considerable risk solely on the IPPs. Further, there was also reluctance on the part of
project developers to participate in the programmes given Eskom’s dual role as the dominant
industry player and administrators of the process.
Changing strategy given the poor results of the initial programmes, NERSA developed a
Renewable Energy Feed-In Tariff (REFIT) mechanism which sought to procure power output
from qualifying renewable energy generators at predetermined prices. Under this
programme, IPPs were to sell renewable energy-based electricity to Eskom (as the exclusive
buyer) under a PPA, and were entitled to receive regulated tariffs, based on the particular
generation technology. However, this was also unsuccessful and the feed-in tariff was never
implemented as it was considered to be too low by industry. In 2009, NERSA revised the
tariffs to allow greater returns on investment, but then subsequently lowered them again in
line with international benchmarks. There were significant other teething problems with the
REFIT programme, where again, it was felt that too much risk was allocated to IPPs. IPPs,
12
Through the Municipal Fiscal Powers and Functions Act No. 12 of 2007. Other legislation that governs municipalities includes Municipal Finance and Management Act and the Municipal Systems Act. 13
The international benchmark for distribution losses (as electricity moves through the network) is 3.5%. Distribution losses in South Africa’s best-run metros are significantly above the international benchmark. In 2011/2012 the most efficient municipality, eThekwini, achieved a distribution loss of 5.0% (National Treasury, 2011), whereas the two largest metros in SA, the City of Johannesburg and City of Cape Town, achieved 11% and 9.3% respectively (National Treasury, 2011). 14
This is drawn largely from TIPS (2014), ‘Review of Regulation in Renewable Energy’ submitted as part of the RECBP. 15
Pilot National Cogeneration Programme (PNCP), the Medium Term Power Purchase Programme (MTPPP) and the Multisite Base-load Independent Power Producer Programme (MBIPPP)

10
developers and financiers insisted on a PPA underwritten by Government to reduce this risk.
Because of this, and a range of other reasons including concerns around NERSA’s ability to
coordinate and administer such a system16 and conflicts with public finance and procurement
laws, the REIPP Procurement Programme (REIPPPP), which was a competitive bidding
procurement programme, came into being. This programme is run by Department of Energy
(DoE) and the National Treasury (NT).
The auction system designed in the REIPPP encourages both competitive pricing and local
manufacturing given local content requirements. The programme has been hailed a success
in many parts of the world and the implementation of the system has been recognised to
encourage maximisation of dynamic returns of competition.
Bids are evaluated on their price competitiveness (70%) and a set of economic development
criteria (30%). Economic development criteria are designed to advance government policies
on socio-economic development, such as job creation, procurement of locally manufactured
inputs and community ownership of renewable energy project companies. Most notably, in
order to secure local participation, the project company must comprise a 40% participation
by a South African entity. The localisation requirements and the funding support from the
Department of Trade and Industry (DTI) to local manufacturers have encouraged an
important emerging industry in South Africa.
Further, projects that meet a set of minimum requirements (in terms of environmental, land,
commercial, legal, economic development, financial and technical criteria) are selected as
preferred bidders in the REIPPPP. Following this, various stakeholders, including DoE,
NERSA, Eskom, commercial banks, development finance institutions and IPPs work
together to finalise the financial aspects of the project and then PPAs between preferred
bidders and Eskom are signed, underwritten by the NT, which includes details on the terms
on which the project company sells electricity to Eskom.
PPAs backed by National Treasury improved risk allocation gave much-needed certainty to
financiers and enabled lenders to provide financing on competitive terms to IPPs. Further,
the REIPP is conducted in a transparent manner, providing detailed feedback to
unsuccessful candidates to improve the quality of successive bids. In addition, the private
sector has played an important role in supporting the DoE to develop the PPAs and
economic development criteria of the programme.
The positive impact of encouraging competition is seen in the falling tariffs for various
sources of renewable energy in successive bidding rounds as shown in Table 1 below. This
was due to, in addition to increased competition, a combination of tariff caps imposed by
DoE, reduced price ceilings for wind and solar, increasing experience by bidders in
successive rounds, increasing maturity of technologies and the allocation of a capacity limit
for each technology from Round 2. The first three rounds of the programme were
oversubscribed revealing the interest in the programme. A total of ZAR 150 billion
investment has been committed to it thus far.
16
In fact, the DoE and NT considered that NERSA was acting beyond its mandate in being the custodian of this programme.

11
Table 1: REIPPP Programme Tariffs over Bidding Rounds (in ZAR per kWh)
Technology Round 1 Round 2 % Change Round 3 % Change
Onshore wind 1.14 0.89 -22% 0.66 -26%
Concentrated Solar Power 2.68 2.51 -6% 1.46 -42%
Solar Photovoltaic 2.75 1.65 -40% 0.88 -47%
Biomass N/A N/A N/A 1.24 N/A
Landfill Gas N/A N/A N/A 0.84 N/A
Small Hydro (≤10 MW) N/A 1.03 N/A N/A N/A
Source: Montmasson-Clair et al. (2014)
The outcomes of the REIPPPP highlight the importance of proactively encouraging
competitive rivalry between producers, as well as the state and the regulator’s roles in
creating a framework conducive to this. This was a deliberate and coordinated strategy by
relevant stakeholders to design the auction such that it introduced ‘synthetic competition’
through the scorecard method. Further, the REIPP procurement programme is an excellent
example of how multiple economic and social objectives can be incorporated into energy
policy through appropriate structuring of bidding processes.
3. Rail freight and ports17
The regulation of ports and freight rail shares much in common with electricity in that the
provision is under a state-owned entity which has been corporatised, and operates within a
policy framework determined by a line department. There are also similarities in terms of the
historic investment patterns which were oriented to heavy, mining and energy-intensive
industry (Fine and Rustomjee, 1996). Rail infrastructure was also developed for grain
farmers, with rail sidings linking with silos built for the agricultural co-operatives.
Transport infrastructure exhibits very substantial externality effects, however, given its
network and partial public good nature. This is why the state has constructed the transport
infrastructure in almost all countries – the returns from the infrastructure investment are
realised across the economy in the activity that is enabled and thus it is appropriate to
finance the investments out of tax revenues.
In competition terms, elements of the transport infrastructure can be considered essential
facilities as they cannot be easily replicated and access is required to provide a good or
service. The provision of the infrastructure and the terms of access are therefore critical to
participation in the economy, by different groups and by location. In South Africa, excellent
infrastructure was constructed for the prioritised groups under apartheid. If we are to
evaluate the regulatory framework and its implications for competition we need to consider it
17
See reports by Baloyi (2014), ‘The role of South Africa’s freight rail regulatory framework in General Freight’s sluggish growth performance’ and TIPS (2014), ‘Review of regulation in the Ports Sector’

12
in light of the historical context. How has the regulatory framework taken the inherited
structure into account, and incorporated social returns, and incentives for investment? Has it
opened up opportunities for increased participation and, if so, how?
We specifically consider rail freight and ports, both of which form part of state-owned
corporation Transnet. The evaluation is thus how the governance framework has impacted
on the decisions of Transnet, including the resources at its disposal.
The 1996 Transport White Paper envisaged an intermodal transport system with a greater
role for general rail freight and greater private participation in the system as a whole. It was
based on the potential gains from a more diversified and open national economy. As such, it
had to be understood in terms of the wider economic and industrial policy goals of the first
democratic government.
At the same time, in 1996 the shift in fiscal policy signalled by the Growth, Employment and
Redistribution strategy (Gear) meant that funding was not made available for investment in
transport infrastructure and, indeed, government investment in infrastructure overall was cut
back sharply (Roberts, 2004). This was compounded by the pension fund deficit which
Transnet had to cover on its own balance sheet for former employees of the South Africa
Transport Services.
Over the last two decades, the outcome has been that general freight movements have
shifted significantly away from rail to road. General freight prices have been increased to
levels which are above road freight charges (Figure 2). Port charges, as we discuss below,
have been far above international norms for general cargo. By comparison, the transport
costs for primary commodities such as coal and iron ore remained relatively low. The
outcomes have thus not been consistent with the objectives set out in 1996.
Figure 2: Average Revenue Per tonne for Freight Rail and Road, 2008-2012
Source: StatsSA Land Freight Monthly Survey
0
0.02
0.04
0.06
0.08
0.1
0.12
0.14
0.16
2008 2009 2010 2011 2012
Re
ven
ue
pe
r to
nn
e
Rail
Road

13
Transnet is itself responsible for setting rules on access, tariffs and investments. The state,
as owner, monitors performance and sets objectives for Transnet, with this responsibility
lying with the Department of Public Enterprises (DPE). The governance of Transnet as a
state corporation is the responsibility of the Transnet board. The policy framework lies with
the Department of Transport (DoT), and the widespread linkages of transport with economic
activity means there are substantial coordination challenges with, for example, industrial
policy. The DPE sets objectives through the shareholder compact. These objectives can in
principle be set with a view to the longer-term economic objectives which would require
careful specification and monitoring of non-financial measures of performance, alongside the
consideration of investment plans.
From the late 1990s the main objectives were focused on the financial performance of
Transnet. Not surprisingly this meant that the Transnet focus was not on investments which
would yield returns in the future, through enabling new economic activity, and where the
economic returns could not be captured by Transnet. Instead, the focus was on where
revenues could be earned from the existing infrastructure. This implied that the focus on the
mining sector was effectively increased, rather than being reoriented to more diversified
economic activities. Upgrades and expansions to the coal and iron ore lines were made.
The historic investments in the existing coal and iron ore lines naturally made incremental
expansions more financially profitable, in a simple path dependency effect. Cost-reflective
tariffs further mean that historically privileged interests locked-in their advantages as the
costs of these lines were lower given the existing base and the volumes already being
transported. Considering pricing and investment in a mature rail infrastructure, which simply
needs to be maintained and upgraded, is quite different from the investment decisions for an
industrialising economy where much of the infrastructure needs to be constructed with a
view to the changing structure of economy.
The apparent lack of coordination between the DPE and DoT, greater emphasis on short-
term financial measures, and lack of public finance for investment mean that governance
and decision-making was not consistent with the wider needs of economic development. For
example, the proportion of citrus moved by rail has fallen from 80% in 2005 to 5% in 2013
(Baloyi, 2014: 31). Even grain has seen a substantial fall, from 90% to 30%. The one sector
of manufacturing aside from heavy industries such as basic metals and basic chemicals that
has seen growth is automotive. It also relies on local and international transport for inputs
and finished vehicles. While there have been some improvements in transport of built up
models, automotive components (not contained in completely knocked down, CKD,
packages) are not well catered for by rail freight.
With regard to the pricing of different cargoes at ports a somewhat different picture emerges
since 2009. This may be at least partly attributed to the establishment of a Ports Regulator.
Outcomes in the ports sector and the role of the regulator in these outcomes18
South Africa’s geographic location and size means that access to efficient port infrastructure
is of critical importance for growth. Approximately 96% of South Africa’s exports (by volume)
are by sea, so the competitiveness of the country’s ports has a direct bearing on the
18
TIPS (2014), ‘Review of regulation in the Ports Sector’

14
competitiveness of its industrial and export activities. There have been concerns around the
skewed pricing and high tariffs of South African ports, and these have been highlighted in
recent government economic policy documents.19
The ports infrastructure in South Africa is 100% state owned through Transnet National
Ports Authority (TNPA). Majority of port operations are run by Transnet Port Terminal (TPT).
Until 2002, almost all infrastructure and services were provided by public sector entity
Portnet, owned by Transnet. In 2002, the port infrastructure was separated from the services
to form the National Ports Authority (NPA) and South African Ports Operator (SAPO), which
was later named Transnet Port Terminal (TPT), both continuing to be owned by Transnet.
As was the case with rail freight, port tariffs were used to improve the income of Transnet as
a whole, cross-subsidising other activities. However, this had serious negative
consequences on investments in port infrastructure and competitiveness of tariffs, and has
been to the detriment of promoting industrial policy objectives. Tariffs in South Africa were
higher than those internationally, efficiency levels lower and fewer and lower quality services
were provided by the ports. Further, the prices charged at the different ports within South
Africa, for equity reasons, are fairly uniform despite their different locations, demand drivers
and features. This limits competition between ports, as well as for services within ports, and
reduces the incentive to invest in infrastructure and to increase productivity. Competition
between ports remains weak largely because TNPA is the only entity permitted to develop,
manage and set tariffs for ports in South Africa. Intra-port competition is also low given the
dominance of TPT in service provision, such as in cargo handling and for highly specialised
terminals, and in most instances, traffic volumes are insufficient to support more than one
terminal of any type. Competition in container freight/handling is also weak.
Many of these problems stem from the conflict of interest of Transnet both owning the
landlord company (NPA) and the company that is the main user of the ports (TPT). That
conflict, linked to the approach of Transnet to use the profit generated by the ports operation
to subsidize other operations in the group, led to underinvestment in port infrastructure,
again highlighting the short-sighted outlook on the development of facilities through
investments.
In 2002, the gazetted National Commercial Ports Policy (NCPP) laid out the framework for
the role of the different players in the ports sector, the challenges that needed to be
addressed and the approach to regulation. The policy highlighted the strategic importance of
ports in contributing to the growth and development of the South African economy (NCPP
2002) and put forward key principles for effective ports regulation. The core of these was the
need for the NPA which was within Transnet to be separated from Transnet and to be
established as a new, independent state-owned corporate entity. This was to ensure that the
ports operate in the best interests of the country in line with the mandate spelt out in the
legislative framework rather than the narrower, profit-maximising interests of Transnet. The
NPA would then report to the DPE.
19
The New Growth Path emphasises the need to have competitive pricing in ports and the Industrial Policy Action Plan (IPAP) states that high ports charges remain a significant constraint and a threat to the manufacturing industry and employment. The fact that South African ports charges are among the highest in the world are also highlighted in these documents.

15
Recognising the complexity and financial implications on Transnet in setting up separate
institutions, a National Ports Regulator was established in 2009 as an interim measure until
the full separation could take place.
Although by 2013 the separation of powers had still not yet taken place, the Ports Regulator
has made significant progress in reducing tariffs through changing tariff structures to
different user groups. This it has done without a full staff complement or sophisticated pricing
mechanisms. While the approach taken by the Port Regulator was in the initial years to limit
the tariff increases to below or at-inflation levels, the 2013 tariff decision saw a significant
reduction in key tariff lines. This is in contrast with the approach of the regulator in the
electricity supply industry, where although NERSA has tried to keep tariff at cost-reflective
levels, it has done little to change the pre-existing relative tariff structures to different user
groups. The result is that historically prioritised industries are still favoured.
The Port Regulator decreased the tariff on cargo dues in certain areas. For instance,
container full export cargo dues were reduced by 43.2%; container full imported cargo dues
reduced by 14.3% (TIPS, 2014). It also undertook a tariff comparator study or benchmarking
exercise in April 2012, called the Global Port Pricing Comparator Study, which revealed that
the total general cargo tariffs at the Ports of Durban and Cape Town were very high by world
standards. For instance, TNPA charges US$275,000 for an average vessel, while the global
average was US$150,000. The average cost per vessel call in Durban and Cape Town was
around US$450‚000 compared to around US$200‚000 for Singapore. The study, which also
looked at specific sectors, found that the tariff for export of primary commodities, mainly coal
and iron ore, were well below the global average while the tariff on containers and
automotive are significantly higher than the average (Table 2). A specific study on the
automotive sector in South Africa was undertaken by the regulator comparing the South
African ports to 16 other ports. It found that Durban was considerably higher cost than most
of the others (even after rebates and discounts). This again highlights the historic bias
towards certain industries, which are in odds with the present-day developmental agenda of
the country.
Table 2: Summary of South Africa’s ports tariffs deviation from the global average,
2012: Port Regulators Global Port Pricing Comparator study
Sector Deviation from the global average
Containers (Total Ports Authority pricing including cargo dues with rebates) 294%
Containers (cargo dues with rebates) 721%
Automotive sector (ports authority tariffs with rebates) 212%
Automotive sector (cargo dues with rebates) 710%
Coal (TNPA costs faced by cargo owners) -50%
Iron ore (TNPA costs faced by cargo owners) -10%
Source: TIPS (2014) citing Ports Regulator of South Africa, 2012:6
The Ports Regulator and the National Association of Automobile Manufacturers of South
Africa (NAAMSA) have been engaging each other to find a solution to high port tariffs.
NAAMSA highlighted the significance of the automotive sector, which contributes between

16
12%-15% to South Africa’s manufacturing industry output and 6% to the country’s GDP.
(TIPS, 2014). A reduction in the automotive manufacturing sector’s port charges would
directly improve the export competitiveness of the automotive industry in turn resulting in
increased exports as well as the opportunity to secure contracts from within the global
operations of their members. Improved port tariffs would therefore contribute to the
economic development objectives of the country to create jobs and increase investment. The
Ports Regulator has considered these submissions seriously and has reduced the
automotive tariff charges in the tariff book adjustments for the tariff year 2013/14, with motor
vehicles exported ‘on own wheel’ cargo dues reduced by 21.1%. Although tariffs need to
reduce further to bring them closer to international levels, this is a positive movement
towards aligning tariffs while taking into account government economic (and social) policy
objectives. According to the Port Regulator, “It is clear from the data that South African cargo
owners and logistics operators face significantly higher infrastructure costs than the rest of
the sample when using containers to move cargo. With the bulk of South Africa’s
manufactured goods arguably exported through containers this is clearly contradictory to
current industrial policy aiming to incentivise value addition, broadening of the manufacturing
base and increasing manufactured exports.” (TIPS, 2014 citing the Ports Regulator 2012:9).
The proposed new pricing strategy (to be in effect 2015/2016) is aimed at enabling the on-
going investments in the maintenance and extension of the South African ports system, and
ensuring effective cost recovery across all national ports. Going forwards, there will be one
basic rate for cargo dues for each different cargo handling type (i.e. containers, dry bulk,
break bulk, liquid bulk, automotive) replacing the current differentiation of cargo dues by
commodity. Cargoes moving in large shiploads, such as dry bulks, will continue to pay lower
cargo dues per ton than cargoes using smaller vessels such as general cargo ships. Further,
deviations from the base rates for cargo dues will be introduced in line with government
priorities for promoting exports and beneficiation industries, but these reductions seem likely
to be determined fairly arbitrarily, and will have to be offset by increases in cargo dues for
other types of cargo. There will also be beneficiation rebates introduced, where lower tariffs
are charged for exports produced through the beneficiation of South Africa’s natural
resources. This is in line with the DTI policy objective of increasing local value add. TNPA’s
beneficiation proposals for the metals sector are that iron ore, a raw material, would receive
no rebate, whilst pig iron would receive a 10% discount, rolled steel and pipes a 60%
discount, and structural steel, machinery and white goods an 80% discount.
These developments are due to dynamic, and bold, steps by the Ports Regulator to increase
the competitiveness of South African ports and align pricing to support other industrial policy
objectives. The regulator has achieved this in a short space of time and faced with
substantial limitations in resources and regulatory capacity (it is still only operating at 45% of
its capacity). Through relatively simple benchmarking exercises and proactive decisions, it
has reduced tariffs and reversed past asymmetry in a short space of time.
The issues in rail and ports are essentially the same and yet changes have been made in
ports through the introduction of a regulator (and plans for vertical separation, not yet
realised). However, lest this be interpreted simplistically as an argument for regulation, the
ports case contrasts with electricity where the regulator has not adjusted the relative prices
of heavy mineral processing and diversified industry to rectify the historical bias.

17
Another contrast, in the opposite direction is that the REIPP example in electricity
demonstrated the potential learning from opening up access, even while pursuing non-
financial objectives. In ports access to facilities could be widened. This is not only about
private ownership – some of the terminals are private (such as for bulk chemicals) and have
been bottlenecks undermining competitors, while separating different levels even while
maintaining state ownership can change the incentives of managers (as was intended with
the NPA and contemplated in the ISMO for electricity).
4. Telecoms20
Telecommunications is often used as an example of where technology change means that
what was once a natural monopoly (and in almost all countries state-owned, due to the need
to invest in a fixed-line network) is no longer so. Mobile telephony is not subject to the same
utility-type cost structure and provides an alternative to relying on the fixed-line network. It
was even proposed that the need for regulation would wither away as competition took root
(Cave, 2006). South Africa has followed the orthodoxy in this regard with relatively light
regulation of mobile telephony and an expectation that as this segment expanded, coupled
with entry into fixed-line, competition would generate efficient economic outcomes.21
Reflecting these prior beliefs, regulation has been focused on interconnection to ensure that
newer participants can link with the existing networks so that their subscribers can make and
receive calls with subscribers on the other networks. However, the call termination rates
were simply to be set between the parties subject to broad principles. There are also
provisions for facilities leasing so that entrants can gain access to the facilities in existence
but, similarly, the terms and mechanisms for this were not specified.
On the face of it, the issues appear to be quite different from those in transport and energy.
After reviewing the outcomes and assessing the role of economic regulation and the links to
competition, we point to areas of common concern. In particular, we argue that the South
African experience of telecommunications regulation points to the need to regulate for
increased competitive rivalry and participation in the economy, recognising the implications
of the past state investment.
Outcomes in telecommunication
In terms of South Africa’s rankings for the information and communications technology
sector, the World Economic Forum’s Network Readiness Index (NRI) has South Africa at 70
out of 144 countries, while the International Telecommunications Union ICT Development
20
Drawn from Hawthorne (2014a), ‘Review of economic regulation of the telecommunications sector’ undertaken as part of the RECBP. 21
The Independent Communications Authority of South Africa Act, no. 13 of 2000 (the ICASA Act), provides for the establishment of the industry regulator, ICASA as well as for the Complaints and Compliance Committee (CCC). The ECA and the Competition Act provide an economic regulation mandate to the competition authorities and ICASA in a number of areas, including interconnection and facilities leasing, spectrum management and universal service and access and competition and price regulation.

18
Index ranked South Africa 84 out of 154 countries.22 These indices combine a number of
measures but to a large extent these outcomes reflects relatively poor broadband coverage,
speeds and pricing. The number of broadband internet subscribers is substantially below
South Africa’s peers (Figure 3). This could be attributed to the very unequal income
distribution in South Africa, however, in terms of broadband speeds South Africa has also
been falling behind other BRICS countries, aside from India (Figure 4). Prices for fixed
broadband are also substantially higher in South Africa, and four times those in India (Figure
5).
Figure 3: Fixed broadband internet subscribers per 100 people (2012)
Source: World Bank, http://data.worldbank.org/indicator/IT.NET.BBND.P2
Figure 4: Broadband speeds
Source: Analysis of Ookla Netindex (2013)
22
This compares with a rank based on purchasing power parity GDP per capita of 81 out of 185 countries calculated by the World Bank. Taking into account the number of countries, the ICT rankings are thus below the GDP per capita ranking.
0
5
10
15
20
25
30
35
40
Su
bsc
rib
ers
pe
r 1
00
pe
op
le
SA and peers
19
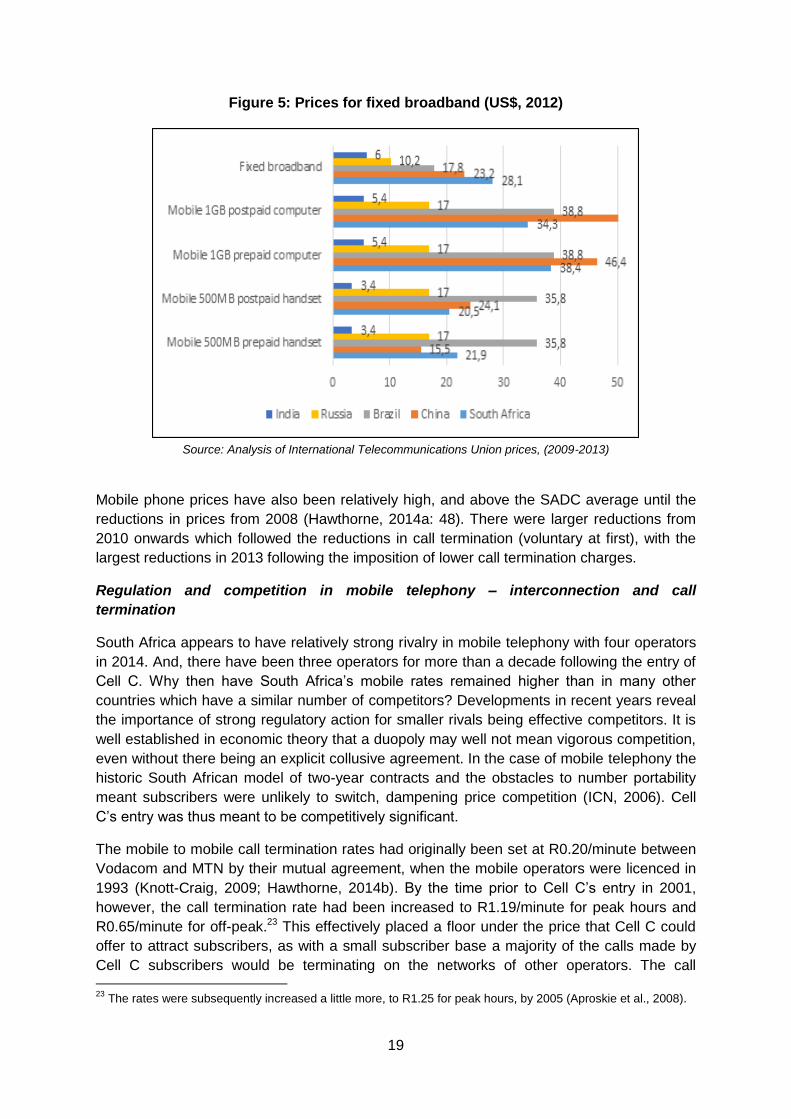
Figure 5: Prices for fixed broadband (US$, 2012)
Source: Analysis of International Telecommunications Union prices, (2009-2013)
Mobile phone prices have also been relatively high, and above the SADC average until the
reductions in prices from 2008 (Hawthorne, 2014a: 48). There were larger reductions from
2010 onwards which followed the reductions in call termination (voluntary at first), with the
largest reductions in 2013 following the imposition of lower call termination charges.
Regulation and competition in mobile telephony – interconnection and call
termination
South Africa appears to have relatively strong rivalry in mobile telephony with four operators
in 2014. And, there have been three operators for more than a decade following the entry of
Cell C. Why then have South Africa’s mobile rates remained higher than in many other
countries which have a similar number of competitors? Developments in recent years reveal
the importance of strong regulatory action for smaller rivals being effective competitors. It is
well established in economic theory that a duopoly may well not mean vigorous competition,
even without there being an explicit collusive agreement. In the case of mobile telephony the
historic South African model of two-year contracts and the obstacles to number portability
meant subscribers were unlikely to switch, dampening price competition (ICN, 2006). Cell
C’s entry was thus meant to be competitively significant.
The mobile to mobile call termination rates had originally been set at R0.20/minute between
Vodacom and MTN by their mutual agreement, when the mobile operators were licenced in
1993 (Knott-Craig, 2009; Hawthorne, 2014b). By the time prior to Cell C’s entry in 2001,
however, the call termination rate had been increased to R1.19/minute for peak hours and
R0.65/minute for off-peak.23 This effectively placed a floor under the price that Cell C could
offer to attract subscribers, as with a small subscriber base a majority of the calls made by
Cell C subscribers would be terminating on the networks of other operators. The call 23
The rates were subsequently increased a little more, to R1.25 for peak hours, by 2005 (Aproskie et al., 2008).

20
termination charges reinforced network effects, as the charges are obviously not payable for
on-net calls. When combined with the existing obstacles to switching, Cell C remained a
marginal player having an insignificant impact. Competition was not working in terms of
prices to consumers.
Regulation has an important role to play in understanding these outcomes. The
interconnection guidelines of 1999, 2000 and 2002 under the Telecommunications Act
required major operators to set their call termination rates at the long run incremental cost of
call termination (Aproskie et al., 2008). But, MTN and Vodacom were not declared major
operators by ICASA.24 Under the Electronic Communications Act which came into force in
2005 ICASA can, in general, regulate prices where markets are characterised by ineffective
competition (under Chapter10). It is also specifically empowered under section 41 may
prescribe regulations for wholesale interconnection rates. After a public inquiry into
interconnection in 2006 and 2007 ICASA decided it had to develop regulations for Chapter
10 before it could regulate interconnection. This effectively stalled the process until
regulations were published in November 2010 to come into effect in March 2011. ICASA
stipulated that MTN and Vodacom would charge call termination rates of R0.40/minute from
1 March 2013, while Cell C and Telkom Mobile could charge 10% more. Subsequent final
regulations in 2014 lowered termination rates further, and increased the asymmetry,
although these have been taken on review by MTN and Vodacom.25
Actual call termination rates were reduced earlier than stipulated in the regulations as the
Parliamentary Portfolio Committee on Communications held hearings in 2009 which led to
reductions being agreed by the operators with the Minister of Communications, to reduce
peak rates to R0.89/minute (Mcleod, 2009). This political pressure then provided the base
for ICASA’s subsequent regulations. While the agreed reductions in 2009 supported Cell C,
in particular, being a somewhat more effective competitor, reflected in increased subscribers
and some competitive pressure on prices, the really big change in prices towards those at
the lower end of SADC countries was only in 2013 (Figure 6) after the ICASA regulation
came into force.
A number of lessons can be drawn from the South African experience over the past two
decades. First, competition requires appropriate regulation. This includes incorporating
principles related to addressing market power, and the ability to enforce. Second,
competition does not equate to the number of competitors and nor can we be complacent
about technology changes meaning competition will blossoms of its own accord, even while
technical natural monopoly factors become less significant. Third, entrenched first movers
can protect their advantages. This motivates for asymmetry in call termination between
incumbents and entrants, although only for a relatively short time (Hawthorne, 2014b). In
other words, regulation is required to change the rules of the game to foster effective
competitive rivalry.
Fourth, the de jure independence of institutions is less important than their mandate, powers
and political support. In this case, the change appears closely linked to a shift in the balance
of interests evident in the portfolio committee hearings. This is possibly linked to the interest
24
Cell C made an application to have Vodacom and MTN declared major operators but later withdrew it. 25
Rates are to fall to R0.10 from 1 March 2016, while the smaller operators could charge R0.40, and R0.20 from 2017.

21
of Telkom as a new mobile entrant. The change in call termination certainly contrasts with
the developments in facilities leasing where Telkom is the incumbent, to which we turn now.
Figure 6: Prepaid mobile prices (US$), OECD usage basket
Source: Analysis based on data prepared by Research ICT Africa, 2013
Regulation and competition – facilities leasing
If anything, the competition and regulation issues related to the position and market power of
the fixed-line incumbent Telkom have been longer running than those of the mobile
operators. They are also arguably more important as they underpin the poor ICT
performance of the South African economy. There have been many reviews of these issues
(for example, Aproskie et al., 2008, Gillwald, et al., 2012, Makhaya and Roberts, 2003). The
South African fixed line telecommunications utility, Telkom, was incorporated in 1991 as a
state-owned enterprise governed by the Department of Posts and Telegraphs.26 The
privatisation of Telkom was presented as solution to attract investment and to assist a
financially ailing state-owned enterprise, through a 30% stake sold to a consortium
(Thintana) comprising of Malaysia Telecommunication and SBC Communications as
‘strategic equity partners’.27
The privatisation to these entities coincided with the extension of Telkom’s monopoly in
voice telephony for five years from 1997 to 2002, justified by the imposition of universal
service obligations.28 The monopoly period was also seen as necessary for Telkom to
prepare itself for the onslaught of competition. Competition was effectively delayed by a
further five years to 2007, due to various factors including a protracted licencing process
26
As per the Post Office Amendment Act 85 of 1991, before this telecommunication services were provided by the department itself. 27
SBC is an American company spun out of the AT&T stable. 28
It should be noted that by the end of the period of exclusivity, there was a net decline in fixed line and internet penetration (see Makhaya and Roberts, 2003).

22
(Horwitz and Currie, 2007). The Second National Operator (SNO) Neotel was licenced in
2005, launched in August 2006, and commenced services in 2007.
As with the entrant into mobile telecommunications, the presence of a competitor to the
incumbent did not realise apparently competitive outcomes. While the competition authorities
have taken on a number of matters, these are ex post evaluations of past conduct and the
rulings are many years after the conduct being complained of. They relate to conduct by
Telkom which undermined downstream competition (see Makhaya and Roberts 2014, and
Hawthorne 2014a, for a fuller review of the decisions).29 One rationale for this conduct is to
inhibit the growth of the upstream rival as downstream firms may support and provide
custom to the upstream entrant.
Facilities leasing, on which we focus here, is a more direct challenge for an entrant. To
address the incumbent’s position regulators have developed means of separating the
upstream and downstream divisions of vertically integrated upstream incumbents and have
developed open access frameworks for third parties to make use of monopoly inputs, being
Local Loop Unbundling (LLU). In South Africa the facilities leasing regulations under the
telecommunications legislation are designed to ensure that new entrants are able to gain
access to the existing facilities in order to build their own infrastructure linked into the
existing infrastructure and this to climb the “ladder of investment” (Hawthorne, 2014a).
The Electronic Communications Act of 2005 makes provision for the leasing of Telkom’s
facilities by other parties. However, Telkom declined to conclude an infrastructure sharing
agreement with Neotel, favouring a case by case approach to managing access. In 2007, a
policy decision was taken to commence with local loop unbundling. According to the
Ministerial Policy Directive of 2007, ICASA was given until November 2011 to publish local
loop unbundling (LLU) regulations.30 In 2010, ICASA issued regulations for general facilities
leasing, but not for LLU. By 2011, ICASA had not instituted any significant steps to effect the
orderly implementation of local loop unbundling, save for issuing a Discussion Paper and
holding public hearings into the matter. The Discussion Paper outlined various
methodologies to effect the policy directive on local loop unbundling. Telkom raised various
objections to this process. In its Findings Note,31 issued after its hearings on LLU, ICASA
found that the obligation to lease facilities applies to all licensees providing Electronic
Communications Network Services. The Findings Note also sets out a timetable for fixed-line
LLU, which had a numerous steps including further industry consultation and engagement, a
regulatory impact assessment on the costs and benefits of the various forms of LLU,
followed by market reviews, and the introduction of supplementary LLU Regulations. The
DOC set a deadline for ICASA to implement LLU by the end of 2011 but ICASA did not
achieve this target and has not to date implemented LLU.
In the midst of this vacuum, in December 2011, Neotel made a request to Telkom to lease
local loop infrastructure at two specific sites. Neotel framed this request under the provisions
of the Electronic Communications Act. Telkom rejected this approach by Neotel on the basis
that the regulatory framework envisages a separate process for local loop unbundling and, in
29
Tribunal case number 11/CR/Feb04. See Competition Commission media release, 14 June 2013 for the settlement of the second case. 30
These remained outstanding in February 2014. 31
Findings Note on the ICASA Framework for Introducing Local Loop Unbundling

23
any event, Neotel had not framed its request according to the provisions of the ECA.
Neotel’s subsequent complaint against Telkom32 was referred by ICASA to the Complaints
and Compliance Committee (CCC).33 The CCC34 is a mechanism for resolving disputes.
Alternatively, ICASA could impose a remedy unilaterally or negotiate with the parties to
resolve a matter. The CCC issued an interim order that acknowledges that Neotel’s request
is legally valid and holds that Telkom’s response to Neotel is inadequate. Thus Telkom has
contravened Regulation 3 (2) of the ECA Facilities Leasing Regulations of 2010. However,
as a matter of practicality, the CCC decided that it would be necessary for the LLU
Regulations to be in place to enable the leasing of copper infrastructure.35 The CCC
instructed ICASA to develop terms and conditions consistent with Chapter 8 of the ECA
within a period of three months from its decision, which was taken on 18 May 2012.
The LLU process, and the dispute between Telkom and Neotel with regards to the leasing of
infrastructure, demonstrates the privileges of incumbency enjoyed by Telkom and the
difficulties faced by an entrant in competing with such an incumbent. It also illustrates that
the rules have not properly addressed the conduct they were meant to, while more attention
needs to be paid to the way institutions work in practice.
The actions of the state as owner have been contradictory to its aims as a reformer and
economic policymaker. Unlike with other entities such as the transport and electricity
parastatals, the government shareholding in Telkom is held by the Department of
Communications which is also responsible for the policy framework. This compounds the
conflict of objectives and adds to the inclination to retard the development of ICASA into a
strong regulator. For example, Telkom’s long battle to keep competitors from offering voice
services was assisted by the Department of Communications delays in providing clarity to
the extent to which value added services providers could also provide voice services.36
5. Drawing implications for the interface between competition and
economic regulation
The reviews of the different regulated industries expose both similarities and differences in
the approach to regulation with regard to the consideration of competition values and
opening up the economy to greater participation. There are clear differences in regulator
structure, capacity and experience, and yet some of the most effective decisions which
promoted increased participation have been made by relatively new regulators with very
limited capacity. This illustrates that it would be mistaken to focus on ‘institutional capacity’,
as if all the issues can be addressed through more funds and training, in the absence of
considering the underlying objectives and priorities of the regulatory framework which is
where our inquiry regarding competition comes in.
32
Under section 43(5)(c) of the ECA. 33
The matter was heard on 16, 17 and 18 May. Case Number 59/2011 Neotel (Pty) Ltd vs Telkom SA Ltd. 34
Established in terms of section 17A of the ICASA Act of 2000 as amended 35
In accordance with s (44)(3)(m) of the ECA. 36
Only when Altech brought a case through the courts was it confirmed that under the ECA value added network service providers can convert licences into individual electronic communication services (I-ECNS) and roll out their own networks, as there was no legal monopoly held by Telkom.
24
In terms of structure, in electricity the fully integrated and corporatised SOE, Eskom, is
regulated by independent regulator, NERSA. In rail freight and ports there is also an
integrated SOE but without an independent regulator until the recently established Ports
Regulator. All operate within a policy framework determined by a line department. In
telecommunications, the main operator has been privatised with a long-established regulator
and enforcement actions by the competition authorities.
The reviews in each of these industries has shown that entrenched interests have frustrated
investments in infrastructure that would have otherwise increased participation in line with
government’s economic and social objectives. Favourable treatment of powerful industries
and groupings such as mining and metal smelters (justified by short-term financial
performance measures) has resulted in similarities in terms of the historic investment
patterns which were oriented to these industries. Regulators in many instances have not
taken into account diversified users’ needs. While there have been measures targeted at
low-income consumers, there has not been the necessary consideration of the links to the
structure of the economy and the implications of path dependency.
An exception is in the renewable energy sector, where a proactive and coordinated
approach by the state and the regulator in the renewable energy procurement programme
led to introducing greater participation in electricity generation by IPPs, the benefits of which
are evident in falling tariffs and encouraging local content. The critical insight we draw is that
changing the rules (in this case, because of the renewable energy objective) to open up
opportunities can further long-term objectives recognising social returns, if done
appropriately. It should also not be mistakenly equated with privatisation – the creative
options brought forward can involve public or co-operative ownership and funding. Indeed,
there is a strong argument for public pension fund and development finance investment
given its long-term orientation. The stalled ISMO bill would have been a positive step in
facilitating greater dynamism in the electricity supply industry.
By comparison, while there have been increased numbers of operators in mobile telephony,
the benefits of increased participation have not resulted in the desired outcomes. The
entrenched market power of the incumbents has been sustained, at least until very recent
interventions. The record over twenty years, including some of the changes in the past two
to three years, indicates the need to proactively regulate for increased competitive rivalry
and participation in the economy. Ex post competition law enforcement regarding discrete
anti-competitive conduct and arrangements does not generate increased competitive rivalry
when all the odds are stacked against the entrants. Unlike with other entities, the
government shareholding in Telkom is held by the Department of Communications which is
also responsible for the policy framework. This has compounded the conflict of objectives
and added to the inclination to retard the development of ICASA into a strong regulator in the
telecoms industry.
With regards to rail and ports, many of the problems of underinvestment need to be
understood in terms of the wider fiscal framework and corporatisation of Transnet as owner,
the user and self-regulator of the infrastructure (until recently for ports), along with the
governance exerted by the state as owner through DPE. These factors are related to the
practice of Transnet using the profit generated by rail and ports operation to subsidize other
operations in the group, and has led to underinvestment and inappropriate (and

25
uncompetitive) pricing, especially for diversified container freight. However, in contrast with
electricity pricing, the interim Ports Regulator has deliberately altered the tariff structure
relating to different user groups in–line with industrial policy to support diversified exports
and to reduce the benefits of historic investment patterns in favour of mining. This compares
with NERSA not having squarely changed the pre-existing relative tariff structures biased to
historically-favoured user groups and justified on the earlier over-investment in generation
capacity.
Also markedly different are the rates of reform in the sectors reviewed, which has little to do
with institutional capacity. Positive and pro-competitive outcomes were achieved quicker in
renewable energy and in ports compared to rail and telecoms. In the case of ports, this was
done with limited capacity. In renewable energy the regulator was intimately involved at
different stages, although ultimately the changes happened effectively alongside the
regulatory framework. Therefore, it is not necessarily about the capacity and experience of
the regulator - effective decisions can be taken quickly with limited capacity.
What is also evident is that there is limited transfer of learning between the regulators from
their respective experiences. For instance, useful lessons from the auction system design of
the renewable energy programme could potentially be adopted in other regulated industries.
We are particularly concerned with the extent to which the lessons point to the need to
address the advantages of incumbents, and the links to be drawn between regulation and
competition. It is apparent from the sector reviews that effective regulation is necessary to
ensure that the competitive space remains open and to govern aspects such as access to
critical infrastructure. Even in industries where scale economies would advocate that only
one firm operate, regulation that is conducive to creating ‘synthetic competition’ by ensuring
participation by several competitors has shown positive outcomes in terms of the dynamic
gains from rivalry. The work of the competition authorities has revealed the ways in which
incumbent firms allied with powerful interests can work to protect and maintain their position
but more competitive outcomes understood to include wider participation requires much
more than competition enforcement.

26
References
Aproskie, J., Hodge, J., Lipschitz, R., Sheik, F. (2008). ‘South African 15-year Telecommunications Policy Review’, available: http://www.thepresidency.gov.za/docs/reports/15year_review/economic/telecommuncations.pdf
Baloyi, B. 2014, ‘The role of South Africa’s freight rail regulatory framework in General Freight’s
sluggish growth performance’ available at
http://static.squarespace.com/static/52246331e4b0a46e5f1b8ce5/t/534e80b9e4b0da517e6d0716/139
7653689767/1400407_EDD-
UJ_RECBP_Project%20Report_App9_Rail%20Freight%20Review_Final.pdf
Cave, M. 2006. ‘Encouraging infrastructure competition through the ladder of investment’,
Telecommunications Policy, vol. 30
Clark, A. and B. van Vuuren, 2013. Nelson Mandela Bay Business Chamber NERSA Consultation
MYPD3 available at
http://www.nersa.org.za/Admin/Document/Editor/file/Consultations/Electricity/Presentations/Nelson%2
0Mandela%20Bay%20Business%20Chamber.pdf
Das Nair, R., G. Montmasson-Clair and Ryan, G. 2014, ‘Review of Regulation in the Electricity Supply
Industry’, available at
http://static.squarespace.com/static/52246331e4b0a46e5f1b8ce5/t/535a317ae4b004bfb615c339/139
8419834786/1400407_EDD-UJ_RECBP_Project%20Report_App4_Electricity%20Review_Final.pdf
Eberhard, A., Gratwick, K., 2008. Demise of the standard model for power sector reform and the
emergence of hybrid power markers. Energy Policy 36.
Eskom, 2013b. Integrated Report for the Year Ended 31 March 2013. Eskom, Johannesburg.
Fine, B. and Z. Rustomjee, 1996, ‘The Political Economy of South Africa: From Minerals-Energy
Complex to Industrialisation’, Westview Press A Division of Harper Collins Publishers
Gillwald, A., Moyo, & M., Stork, C. 2012. Understanding what is happening in ICT in South Africa: a
supply- and demand-side analysis of the ICT sector. Available from:
http://www.researchictafrica.net/docs/Policy%20Paper%207%20-
%20Understanding%20what%20is%20happening%20in%20ICT%20in%20South%20Africa.pdf
Ginsberg, D.H. 2009. ‘Synthetic Competition’, in Lévêque, F. and Shelanski, H. (eds) Antitrust and
Regulation in EU and US: Legal and economic perspectives. Cheltenham: Edward Elgar Publishing
Limited.
Hawthorne, R., 2014a, ‘Review of economic regulation of the telecommunications sector’, available at
http://static.squarespace.com/static/52246331e4b0a46e5f1b8ce5/t/537f2e60e4b0b4236d47a5bb/140
0843872601/1400407_EDD-
UJ_RECBP_Project%20Report_App10_Telecommunications%20Sector%20Review_Final.pdf
Hawthorne, R. 2014b, ‘Linkages between economic regulation of the mobile sector in South Africa,
sector performance and economic development: The call termination rate intervention’, presented at
Second SA Economic Regulators Conference, 18 and 19 March 2014, Birchwood Conference Centre,
Johannesburg.
Horwitz, R.B. and Currie, W. 2007, ‘Another instance where privatization trumped liberalization: The
politics of telecommunications reform in South Africa—A ten-year retrospective’, ScienceDirect

27
Telecommunications Policy 31 (2007) 445–462, available at
http://communication.ucsd.edu/_files/JTPO831.pdf
ICN, 2006. Report of ICN Working Group on Telecommunication Services, 5th Annual Conference,
Country case studies: South Africa
Kessides, I.N., Bogetic, Z., Maurer, L., 2007. Current and Forthcoming Issues in the South African
Electricity Sector (World Bank Policy Research Working Paper No. 4197). World Bank, Washington,
D.C.
Knott-Craig, A. 2009. ‘Interconnect: the real story’. TechCentral. Available from:
http://www.techcentral.co.za/interconnect-the-real-story-2/555/
Louw, D., Electricity Distribution Network Collapse Three Years Away, 2012, Engineering News Daily
– 27 July 2012. Accessed in April 2014 at Page 129 of 137
Makhaya, G. and S. Roberts, 2003. ‘Telecommunications in developing countries: reflections from the
South African experience’ Telecommunications Policy, Volume 27, Issues 1–2, February–March 2003,
Pages 41–59, Telecommunications in Africa
Makhaya, G. and Roberts, S. 2014. ‘The changing strategies of large corporations in South Africa
under democracy and the role of competition law’, Paper for Agence Française de Développement
project on rethinking criteria of “good governance” and institutions.
Mcleod, D. 2009a. ‘Cellular operators agree to cut interconnection rates’. TechCentral. Available from:
http://www.techcentral.co.za/cellular-operators-agree-to-cut-interconnection-rates/11233/
Mcleod, D. 2009b. ‘Cell C tables all-day 75c interconnection plan’. TechCentral. Available from:
http://www.techcentral.co.za/cell-c-tables-all-day-75c-interconnection-plan/10641/
Montmasson-Clair, G., K. Moilwa and Ryan, G. (2014), ‘Review of Regulation in Renewable Energy’
available at
http://static.squarespace.com/static/52246331e4b0a46e5f1b8ce5/t/535a76fae4b0d7c4f34d7ef9/1398
437626373/1400407_EDD-
UJ_RECBP_Project%20Report_App5_Renewable%20Energy%20Review_Final.pdf
NERSA, 2013b. NERSA’s Decision on Eskom’s Revenue Application for the Third Multi-Year Price
Determination Period 2013/14 to 2017/18. National Energy Regulator of South Africa, Pretoria.
NERSA, 2010. NERSA’s Decision on Eskom’s Required Revenue Application - Multi-Year Price
Determination 2010/11 to 2012/13 (MYPD 2). National Energy Regulator of South Africa, Pretoria.
Noah, A., 2012, Eskom’s Submission on Possible Solutions to Electricity Distribution Industry (EDI)
Challenges, Presentation to the Portfolio Committee on Energy, 25 July 2012.
Ports Regulator of South Africa, 2012. Global Port Pricing Comparator Study - 01/04/2012 Research
Summary
Pressly, D., 2013. ANC Mum on Stalled ISMO Bill [WWW Document]. IOL. URL
http://www.iol.co.za/business/news/anc-mum-on-stalled-ismo-bill-1.1607395#.UqgZ3uLpytw
(accessed 12.11.13).

28
Roberts, S. 2004 ‘Investment in South Africa – a comment on recent contributions’, Development Southern Africa, 21(4), 743-756, 2004 Rustomjee (2013), DTI Electricity pricing project, Final Report (Draft), 26 November 2013
Steyn, G., 2003. Administrated Prices: Electricity. National Treasury, Pretoria.
Steyn, G., 2006. Eskom: History’s Unheeded Lessons. Business Day.
Steyn, G., 2012. The Impact of Economic Regulation on the Management and Performance of South
Africa State Owned Enterprises. Presented at the South African Economic Regulators Conference,
National Energy Regulator of South Africa, Johannesburg.
Steyn, E., 2013. Dawn of a Competitive Electricity Sector for South Africa: The Independent System
and Market Operator Bill B 9-2012 – Context, Content and Comment. Jure 2, 539–556.
TIPS, 2014. ‘Review of regulation in the Ports Sector’, available at http://static.squarespace.com/static/52246331e4b0a46e5f1b8ce5/t/534f8d86e4b053dc26f7a617/1397722502506/1400407_EDD-UJ_RECBP_Project%20Report_App8_Ports%20Regulation%20Review_Final.pdf Viscusi, WK, J Vernon, J. Harrington (1998) Economics of Regulation and Antitrust. Cambridge Mass:
The MIT Press.