escap economic and social council - unescap.org · remaining gaps in the context of the 2030...
TRANSCRIPT

United Nations ESCAP/74/23
Economic and Social Council Distr.: General
5 March 2018
Original: English
Economic and Social Commission for Asia and the Pacific
Seventy-fourth session Bangkok, 11–16 May 2018
Item 3 (g) of the provisional agenda*
Review of issues pertinent to the subsidiary structure of
the Commission, including the work of the regional
institutions: social development
B18-00311 (E) TP110418
Key social development challenges in the Asia-Pacific region
in the context of the 2030 Agenda for Sustainable
Development
Note by the secretariat
Summary
The 2030 Agenda for Sustainable Development is a transformative
universal, integrated and people-centred agenda based on the commitment to
leave no one behind.
In that context, the present document contains an overview of the trends,
patterns and challenges in social development for the Asia-Pacific region and
recommendations to address the challenges to building inclusive societies for
greater social cohesion and sustainable development.
The Economic and Social Commission for Asia and the Pacific is invited
to review the issues and recommendations presented herein and provide
guidance for the future work of the secretariat in the area of social
development.
I. Introduction
1. The 2030 Agenda for Sustainable Development is a universal, integrated, transformative agenda of the people, by the people, and for the people.1 In the 2030 Agenda, it is recognized that eradicating poverty in all its forms and dimensions and ensuring that all human beings can fulfil their potential in dignity, equality and in a healthy environment are the greatest
challenges to and indispensable requirements for sustainable development.
2. To meet these challenges, States Members of the United Nations committed to achieving balanced and integrated sustainable development in its
economic, social and environmental dimensions. They recognized that people are at the centre of sustainable development and that achieving sustainable
* ESCAP/74/L.1/Rev.1.
1 General assembly resolution 70/1, para. 52.

ESCAP/74/23
2 B18-00311
development is in keeping with the vision, principles and call for action of the Charter of the United Nations and with the outcomes of all major United Nations conferences and summits.
3. In recent decades, the Asia-Pacific region has made significant achievements in socioeconomic development, but the progress has been uneven across and within countries and across the dimensions of development. The present document contains an analysis of social development trends and patterns in Asia and the Pacific and a discussion of how to address the remaining gaps in the context of the 2030 Agenda.
II. Key social development trends and challenges and related
actions by the Economic and Social Commission for Asia
and the Pacific
A. Population dynamics and sustainable development
1. Population trends: increasing life expectancy and declining fertility
4. The population of the Asia-Pacific region, which was 3.8 billion in 2000, is projected to increase to 4.5 billion in 2018. Although overall population growth rates have slowed, on average, 42 million people have been added per year over the past 18 years. By 2030, the economy will have to support approximately 4.9 billion people and 5.1 billion by 2050. The populations of East and North-East Asia are projected to decline as of 2029, but other subregions will continue to grow for at least the next 12 years (figure I).
Figure I Population in Asia and the Pacific, 1950–2050 (projected)
Source: Economic and Social Commission for Asia and the Pacific (ESCAP)
calculations based on United Nations, World Population Prospects: The 2017
Revision. Available from https://esa.un.org/unpd/wpp/ (accessed 8 February 2018).
5. Profound economic and social development throughout the region has reduced mortality rates and increased life expectancy. Over the past five decades, life expectancy has increased on average by 20 years. The most impressive gains have been in South and South-West Asia; average life expectancy at birth has increased by 29 years since 1960. Improvements are due to universal
0.0
0.5
1.0
1.5
2.0
2.5
1950
1955
1960
1965
1970
1975
1980
1985
1990
1995
2000
2005
2010
2015
2020
2025
2030
2035
2040
2045
2050
Mil
lion
s
East and North-East Asia South-East AsiaSouth and South-West Asia North and Central AsiaPacific

ESCAP/74/23
B18-00311 3
immunization, improved sanitation, access to clean water and improved nutrition, and healthier lifestyles and education.
6. In all countries, women live longer than men; the differences, as of 2018, are particularly noticeable in the Russian Federation, where women live roughly 11 years longer than men, and in Viet Nam, where they live 9 years longer. Bhutan, on the other hand, has the lowest gender gap – only six months.
7. Overall, the region has significantly reduced fertility and increased life expectancy in recent decades. The full implementation of the 2030 Agenda, particularly the Sustainable Development Goals and targets related to health and well-being, including child and maternal mortality (Goal 3), education (Goal 4) and gender equality and empowerment (Goal 5), could affect fertility and life expectancy, further resulting in longer and healthier lives for all.
2. Rapid population ageing
8. The combination of low fertility rates and rising life expectancy is sharply increasing the proportion of older persons, making Asia and the Pacific the fastest ageing region in the world. With 12 per cent of the region’s population aged 60 or older in 2016, the region’s population is in an ageing stage and will be in an aged stage by 2030.2
9. Although ageing is a universal trend, the timing and speed of this transition have varied across countries and regions. For instance, it took 115 years for France to move from an ageing to aged society. However, in Asia and the Pacific the transition is taking place much faster. It will take only 19 years for Viet Nam to make this transition for example.3 This leaves very little time to adjust and countries will need to speed up their efforts to strengthen social protection systems, including affordable health care services and old-age social security, while also providing employment opportunities for the young.
10. Ageing societies also have other important development challenges due to the changing age structures of population.4 Declining numbers of working-age people relative to the number of older persons leads to a rising dependency ratio. The old-age support ratio is the number of persons in the working age population (age 15–64) to those aged 65 or older. A declining old-age support ratio indicates fewer persons in the labour force to support a growing number of older persons. This raises questions regarding each country’s capacity to sustain economic growth, maintain fiscal sustainability and provide for the general welfare for all ages. Figure II shows the decline in the old-age support ratio in the five subregions of Asia and the Pacific. The ratio in East and North-East Asia, North and Central Asia, and the Pacific have already declined to very low levels, while the ratio in South-East Asia and South-West Asia is catching up.
2 For the purpose of this document a population is defined as ageing, aged, very aged
and hyper aged when the population aged 65 and older accounts for 7.0 to 9.9 per
cent, 10.0 to 19.9 per cent, 20.0 to 29.9 per cent, and 30.0 per cent or more of the total
population, respectively. When age 60 is considered the threshold, the population is
classified as ageing, aged, very aged and hyper aged at 10, 20, 30 and 35 per cent,
respectively.
3 ESCAP, “Ageing in Asia and the Pacific: overview” (Bangkok, 2017). Available
from www.unescap.org/resources/ageing-asia-and-pacific-overview.
4 The age structure of population can also be affected by international migration,
especially for countries with low levels of fertility that receive significant numbers of
immigrants.

ESCAP/74/23
4 B18-00311
Figure II Old-age support ratio in the Asia-Pacific region, 1980–2050 (projected)
Source: ESCAP calculations based on United Nations, World Population
Prospects (see figure I).
11. The Madrid International Plan of Action on Ageing, 2002, adopted at the Second World Assembly on Ageing, is an internationally agreed framework to address the challenge of ageing and building societies for all ages. The key provisions of the Madrid Plan of Action have also been enshrined and carried forward in the 2030 Agenda. ESCAP has been assisting member States in implementing the provisions of the Plan of Action, including through technical assistance and capacity-building activities on augmenting old-age income security.
12. In accordance with resolution 2015/5 of 8 June 2015 of the Economic and Social Council, ESCAP convened the Asia-Pacific Intergovernmental Meeting on the Third Review and Appraisal of the Madrid International Plan of Action on Ageing in Bangkok from 12 to 14 September 2017. Member States reaffirmed their commitment to the Plan of Action, reported on progress in its implementation, highlighted emerging areas that require further attention and identified policies to expedite implementation.5
3. Youth inclusion and empowerment
13. Although ageing is the leading demographic trend in the region, South and South-West Asia, the least developed countries and most Pacific island countries still have large youth populations. Indeed, just under 700 million young people aged 15 to 24 lived in the Asia-Pacific region in 2016. Youth unemployment in
5 See ESCAP/74/20.
0
2
4
6
8
10
12
14
16
Ra
tio
East and North-EastAsia
South-East Asia
South and South-West Asia
North and CentralAsia
Pacific
ESCAP/74/23
B18-00311 5
the region is approximately 10 per cent, more than double the rate for the total labour force, and young people face obstacles transitioning from school to work. Also, rates of adolescent childbearing in Asia and the Pacific, particularly in South and South-West Asia, remain among the highest in the world, largely due to the early marriage of girls.
14. For countries with a larger youth population and whose fertility rates remain high or are declining slowly, investments in education, vocational training and health care, including sexual and reproductive health-care services, are important to create a window of opportunity and reap the benefits of the demographic dividend inherent in a favourable ratio of workers to dependents. Countries in South and South-West Asia as well as the Pacific islands may still fall into this category and could take steps to enhance the productivity of their working-age population. They could also encourage personal savings and design sustainable social protection systems that meet the needs of old-age income security, while populations are still youthful.
15. In the context of the 2030 Agenda, ESCAP promotes the role of youth in development, while making it more inclusive and sustainable. During the period 2014–2017, ESCAP led the implementation of an interregional project to strengthen the capacity of Governments in Africa, Asia and the Pacific, and Western Asia to respond to the needs of youth in formulating inclusive and sustainable development policies. The project’s objective was to enhance youth policies, through the Youth Policy Toolbox, especially in the context of promoting smooth school-to-work transitions, green jobs and active youth engagement (http://yptoolbox.unescapsdd.org).
4. Migration and development
16. Asia and the Pacific has been an important source and destination for international migration. As of 2017, 102 million people from the region lived outside their countries of birth, and Asia-Pacific countries hosted more than 62 million migrants. In particular, there has been an increase in migrants from South and South-West Asia and South-East Asia, while the number of migrants from North and Central Asia has remained roughly constant (figure III). Importantly, most migration is South-South migration. In 2017, more than 52 per cent of migrants from the Asia-Pacific region lived in developing or least-developed countries.6,7
6 Towards Safe, Orderly and Regular Migration in the Asia-Pacific Region:
Challenges and Opportunities (United Nations publication, Sales No. E.18.II.F.3).
Available from www.unescap.org/publications/towards-safe-orderly-and-regular-
migration-asia-pacific-region.
7 Sustainable Social Development in Asia and the Pacific: Towards a People-Centred
Transformation (United Nations publication, Sales No. E.17.II.F.15). Available from
www.unescap.org/sites/default/files/publications/Sustainable%20Social%20Develop
ment%20in%20A-P.pdf.

ESCAP/74/23
6 B18-00311
Figure III Migrants in the Asia-Pacific region, 1990–2017
Source: ESCAP calculations based on United Nations, Department of Economic
and Social Affairs, Population Division, Trends in International Migrant Stock: the
2017 Revision.
17. People migrate for many reasons. They may be migrating to escape marginalization and poverty, migrating for study or marriage, or fleeing war and conflict. Most seek work, usually in other developing countries in the region or in the oil-producing countries of the Gulf Cooperation Council.6
18. Migration reshapes economies and societies, both in countries of origin and destination. In 2017, Asia-Pacific countries received almost $276 billion in remittances. Migrant households generally use remittances to reduce poverty. Remittances can purchase better housing, function as informal health insurance, fund better quality education and diversify incomes.6
19. At a macroeconomic level, remittances have become a stable, even countercyclical, source of foreign exchange for many countries, exceeding foreign direct investment, export receipts and official development assistance. They have also helped to keep current account deficits under control. Nevertheless, if countries become very dependent on remittances, they are vulnerable to fluctuations in inflows. Migration also makes an important contribution in countries of destination with migrant workers filling jobs that national workers either reject or for which they lack necessary skills.6
-100
-80
-60
-40
-20
0
20
40
60
80
1990 2000 2010 2017
Nu
mb
er o
f in
tern
ati
on
al
mig
ra
tns
(mil
lio
ns)
East and North-East Asia North and Central Asia South-East Asia
Pacific South and South-West Asia
Emigration
Immigration

ESCAP/74/23
B18-00311 7
20. A considerable proportion of international migration within and from the Asia-Pacific region is irregular. For example, the United Nations Office on Drugs and Crime (UNODC) reported that there are approximately 30,000 irregular migrants in the Maldives, more than one third of all migrant workers there. Estimates of the number of irregular migrants in Malaysia range from .6 million to 1.9 million.8 The gendered segmentation of work in countries of destination often assigns less importance to women’s work, forcing women into irregular migration channels and informal sectors of the labour market. Victims of human trafficking, asylum seekers, refugees, unaccompanied migrant children and labour migrants are also part of the irregular flows, creating mixed migration flows. Apart from the volume, the mixed composition and unclear status of these migrants adds complexity and many of them fall into a protection gap.6
21. For migrants to contribute to development, their human rights and successful integration in the community must be ensured. Often, migrants, regardless of their status, have limited access to services, such as health care, including sexual and reproductive health services, and other forms of social protection. They often face discrimination and exploitation. In the 2030 Agenda, member States committed themselves to cooperate internationally to ensure safe, orderly and regular migration, with full respect for human rights and the humane treatment of migrants regardless of migration status, of refugees and of displaced persons.
22. According to the Secretary-General in his report on making migration work for all, managing migration is one of the most urgent and profound tests of international cooperation. Migration is an engine of economic growth, innovation and sustainable development. Yet it is also a source of divisions within and between States and societies, often leaving migrants vulnerable to abuse and exploitation.9 In September 2016, the General Assembly adopted the New York Declaration for Refugees and Migrants and decided that a global compact for safe, orderly and regular migration should be adopted in 2018. The global compact will provide an opportunity for States Members of the United Nations to reinforce the benefits of migration and to address its challenges. In Sustainable Development Goal target 10.7, the global community is called upon to facilitate orderly, safe, regular and responsible migration and mobility of people, including through planned and well-managed migration policies. The global compact will be key to achieving this goal and the broader agenda of achieving sustainable development.
23. In support of the stocktaking phase of the global compact, ESCAP, in collaboration with United Nations partners, held the Asia-Pacific Regional Preparatory Meeting for the Global Compact for Safe, Orderly and Regular Migration in Bangkok from 6 to 8 November 2017. The Meeting highlighted the perspectives and priorities of the Asia-Pacific region for the global compact and made a number of recommendations, contained in the Chair’s summary. It also proposed that existing regional intergovernmental processes be used for follow-up to and review of the global compact, including through the regional commissions of the United Nations.10
8 UNODC, Migrant Smuggling in Asia: A Thematic Review of Literature (Bangkok, 2012).
Available from www.unodc.org/documents/human-
trafficking/2012/Migrant_Smuggling_in_Asia_A_Thematic_Review_of_Literature.pdf.
9 A/72/643.
10 See ESCAP/74/21 and ESCAP/74/21/Add.1.

ESCAP/74/23
8 B18-00311
B. Poverty, inequality and decent work
1. Persisting poverty
24. Asia-Pacific countries have been among the fastest growing economies in the world, with gross domestic product (GDP) per capita more than doubling, from $4,700 to $10,400 (2011 purchasing power parity), between 1990 and 2013. This has in turn created job opportunities and helped lift millions of people out of extreme poverty. Between 2000 and 2013, the proportion of people living in extreme poverty – on less than $1.90 a day – fell from approximately 29.7 to 10.3 per cent.7 Poverty rates declined in most subregions, but most of the reduction was in East Asia, the Pacific and South Asia (figure IV).
Figure IV Shifts in poverty in Asia and the Pacific
Source: Calculations based on ESCAP Statistical Online Database based on data
from the World Bank. Available from http://data.unescap.org/escap_stat/ (accessed 2
March 2018).
25. Despite this progress, nearly 400 million people were still trapped in extreme poverty in the region in 2013, and 32 per cent of the population was living on less than $3.10 per day. The rate of poverty reduction has varied between countries. The largest decline in this period was in China
0.0
10.0
20.0
30.0
40.0
50.0
60.0
0
500
1000
1500
2000
2000–2004 2010–2013 2000–2004 2010–2013
$1.90 $3.10
Prop
orti
on
of
pop
ula
tion
in
Asi
a-P
acif
ic liv
ing
in
poverty
(p
ercen
tag
e)
Peop
le l
ivin
g i
n p
overty
(m
illi
on
s)
South and South-West Asia East and North-East Asia South-East Asia
North and Central Asia Pacific Percentage of population

ESCAP/74/23
B18-00311 9
from 67 to 1.9 per cent,11 while the corresponding decline in India was from 46 to 21 per cent (figure V). In 1990, at least four countries in the region had poverty rates higher than 50 per cent: China (67), Nepal (62), Pakistan (59) and Indonesia (57). By 2012, however, except for Nepal (15 per cent), these countries had reduced their poverty levels substantially below the global level of 11 per cent. Currently, only India has an extreme poverty rate above 20 per cent, although the levels in Bangladesh, the Lao People’s Democratic Republic, Nepal and the Philippines also remain above the global average.
Figure V
Poverty rates for selected countries in the Asia-Pacific region
Source: Sustainable Social Development in Asia and the Pacific: Towards a
People-Centred Transformation (United Nations publication, Sales No. E.17.II.F.15).
Available from
www.unescap.org/sites/default/files/publications/Sustainable%20Social%20Develop
ment%20in%20A-P.pdf.
Note: Data were used from the earliest available year between 1990 and 1995, and
for the latest available year between 2010 and 2014, for all countries in Asia and the
Pacific for which data were available.
2. Widening inequalities of income and wealth
26. Despite sustained economic growth and substantial reductions in poverty, the gains have disproportionately benefited the richest, leading to rising inequality. One way to assess income inequality is to compare the
11 Due to changes in the methodology applied for the China 2013 household survey, on
which poverty data for that year are based, the comparability with previous years is
subject to caution. See also International Bank for Reconstruction and Development
and World Bank, Poverty and Shared Prosperity 2016: Taking on Inequality,
(Washington, D.C., 2016). Available from
https://openknowledge.worldbank.org/bitstream/handle/10986/25078/978146480958
3.pdf.
100 80 60 40 20 0 20 40 60 80 100
Russian Federation
Kazakhstan
Thailand
Iran (Islamic Republic of)
Mongolia
Turkey
Kyrgyzstan
China
Sri Lanka
Cambodia
Viet Nam
Pakistan
Indonesia
World
Philippines
Nepal
Lao People’s Democratic Republic
Bangladesh
India
Poverty rate (percent of population)
$1.90/day $3.10/day
1990s 2010s

ESCAP/74/23
10 B18-00311
income share of the top and bottom 10 per cent of the population over time (figure VI). The available data from 22 countries reveal that inequality has
increased in the region’s most populous countries. The change was greatest in China: in 1981, the richest 10 per cent had 6 times as much income as the
bottom 10 per cent; by 2009 they had 18 times more. In Georgia, Kyrgyzstan and the Russian Federation, the ratio increased by more than 4 percentage points. Even in countries where inequality fell, reductions occurred from
relatively high levels and often remained above the regional average.
Figure VI
Income share of the richest and poorest 10 per cent in the Asia-Pacific
region
Source: Sustainable Social Development in Asia and the Pacific: Towards a
People-Centred Transformation (see figure V).
Note: Data are from the earliest year for which data was available in the 1980s
and 1990s and to the latest year between 2008 and 2012 for all countries for which
data was available.
27. Even greater, however, is the inequality in wealth and asset ownership.
Wealth inequality can be measured through the Gini coefficient, which ranges from 0, meaning absolute equality, to 1, meaning one person owns everything. The Asia-Pacific region, with approximately 62 per cent of total global wealth,
has an average Gini coefficient of 0.90, as compared to 0.81 for Latin America.12
In India, for example, the wealthiest 10 per cent of the population now owns 36
times more wealth than the poorest 40 per cent. In China, they have 26 times more. In both India and China, the wealthiest 20 per cent have 78 per cent of
12 Anthony Shorrocks and others, “Global wealth report 2016” (Zurich, Credit Suisse
AG, 2016).
0
5
10
15
20
25
Armenia
Thailand
Azerbaijan
Pakistan
Malaysia
Cam
bodia
Turkey
Tajikistan
Viet Nam
Kazakhstan
India
Nepal
Philippines
Mongolia
Bangladesh
Sri Lanka
Indonesia
Lao People's Dem
ocratic Republic
Kyrgyzstan
Georgia
Russian Federation
China
Decreasing inequality Increasing inequality
Ch
an
ges
in t
he r
ati
o o
f th
e h
igh
est
to t
he l
ow
est
incom
e d
ecil
e
Earliest Latest

ESCAP/74/23
B18-00311 11
total wealth, and in Thailand they have 70 per cent. Japan is more equal: the richest 20 per cent have approximately half of all wealth.
28. While the increasing inequality of income or wealth has dominated the headlines, inequality of opportunity raises even more serious concerns. Inequality of opportunity is concerned with the distribution of access to key services necessary for meeting aspirations regarding quality of life: education and health services, a decent job, clean water and basic sanitation, clean fuels and electricity, financial services and modern technology. ESCAP research finds that across 13 key opportunities, there are stark gaps in access in almost all of the region’s developing economies, particularly between those belonging to the top or bottom of the wealth distribution, those whose parents have higher or lower education levels, as well as between rural and urban areas.13
3. Gaps in access to health care
29. Inequality of income and wealth mostly results from inequalities in opportunities, such as access to quality education and health. Poor health at a young age affects children throughout life; unhealthy living conditions, malnourishment and stunting drastically impede children’s cognitive development, influencing educational outcomes and future job prospects.
30. At least 4 out of 10 people in the region have no health-care coverage, and two thirds of health expenditures are paid out of pocket. High out-of-pocket expenditure increases the financial burden on individuals, particularly on the poor and vulnerable, who are most in need of health-care services. As a result, many poorer families either do not seek care or postpone it.
31. Maternal and reproductive health care during childbirth is key to reducing maternal mortality. There has been a 54 per cent decrease between 2000 and 2015 in maternal mortality in Asia and the Pacific. However, the number of women dying in childbirth in South and South-West Asia remains high, with roughly 22 per cent of global maternal deaths.14
32. The level of access to skilled birth attendance is often used as a proxy to measure overall access to health services, with a focus on women. As shown in figure VII, it is the poorest segments of society that suffer most from living in a relatively poorer country with limited access to services. Nearly all births in Armenia, Kazakhstan and Uzbekistan are attended by skilled personnel, regardless of income levels. In the Lao People’s Democratic Republic, however, approximately only 1 in 10 births are attended by skilled personnel for families belonging to the poorest 20 per cent, compared to 9 out of 10 of the richest 20 per cent.7
13 ESCAP, Inequality in Asia and the Pacific in the Era of the 2030 Agenda for
Sustainable Development (forthcoming).
14 ESCAP, ESCAP Statistical Online Database. Available from
http://data.unescap.org/escap_stat/ (accessed 24 January 2018).

ESCAP/74/23
12 B18-00311
Figure VII Birth attended by skilled personnel by wealth quintile, selected countries
in the Asia-Pacific region
Source: Sustainable Social Development in Asia and the Pacific: Towards a
People-Centred Transformation (see figure V).
Notes: Data refer to the most recent year available between 2003 and 2014. Box
plots show the distribution of the percentage of births attended by skilled personnel
by wealth quintile across countries. The box spans from the first quartile to the third
quartile, with the line depicting the median score. Lower and upper whiskers each
depict the location of the minimum and maximum value.
Abbreviations: ARM, Armenia; IND, Indonesia; KAZ, Kazakhstan; LAO, Lao
People’s Democratic Republic; NPL, Nepal; TLS, Timor-Leste; UZB, Uzbekistan;
VAN, Vanuatu.
4. Inequalities in universal access to quality education
33. Equal opportunities for education are key to ensuring that no one is left behind. Primary school net enrolment rates are higher than 90 per cent in almost every country in the region, with exceptions in the Pacific and South and South-West Asia.15 Thus, nearly every child enters primary school in most of the region’s countries. At the same time, inequalities persist, particularly regarding educational completion and secondary and tertiary education.16
15 The United Nations Educational, Scientific and Cultural Organization calculates that
there were 17.3 million out-of-school children of primary school age in 2013, the
majority of them in South and West Asia. See United Nations Educational, Scientific
and Cultural Organization, “Out-of-school children and adolescents in Asia and the
Pacific”, September 2015. Available from
http://unesdoc.unesco.org/images/0023/002351/235152E.pdf.
16 ESCAP, “Inequality of opportunity in Asia and the Pacific: education”, Social
Development Division Working Paper Series (ST/ESCAP/2817). Available from
www.unescap.org/resources/inequality-opportunity-asia-and-pacific-education.
LAO
LAO
LAO
LAO
LAO
IND
IND
IND
IND
IND
TLS
TLS
TLS
TLS
TLS
VAN
VAN
VAN
VAN VAN
NPL
NPL
NPL
NPL
NPL
ARM/UZB/KAZ ARM/UZB/KAZARM/UZB/KAZ
ARM/UZB/KAZ ARM/UZB/KAZ
0
20
40
60
80
100
Quintile 1(poorest)
Quintile 2 Quintile 3 Quintile 4 Quintile 5(richest)
Per
cen
tag
e
ESCAP/74/23
B18-00311 13
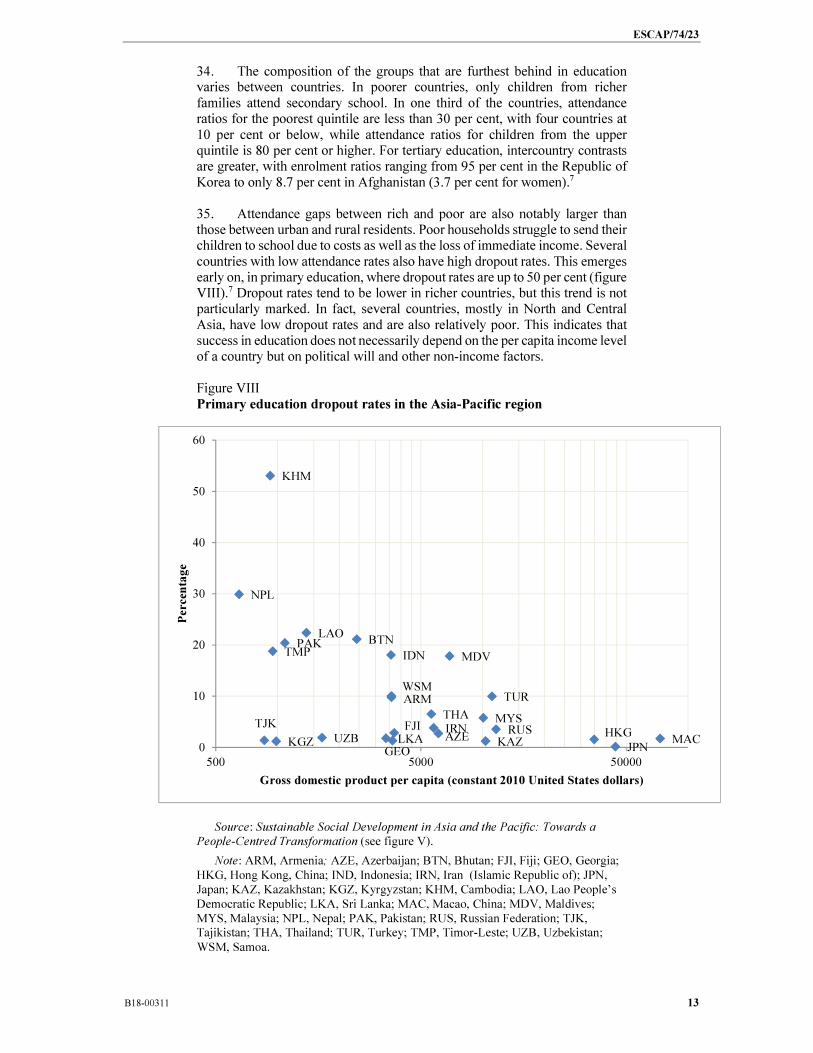
34. The composition of the groups that are furthest behind in education varies between countries. In poorer countries, only children from richer families attend secondary school. In one third of the countries, attendance ratios for the poorest quintile are less than 30 per cent, with four countries at 10 per cent or below, while attendance ratios for children from the upper quintile is 80 per cent or higher. For tertiary education, intercountry contrasts are greater, with enrolment ratios ranging from 95 per cent in the Republic of Korea to only 8.7 per cent in Afghanistan (3.7 per cent for women).7 35. Attendance gaps between rich and poor are also notably larger than those between urban and rural residents. Poor households struggle to send their children to school due to costs as well as the loss of immediate income. Several countries with low attendance rates also have high dropout rates. This emerges early on, in primary education, where dropout rates are up to 50 per cent (figure VIII).7 Dropout rates tend to be lower in richer countries, but this trend is not particularly marked. In fact, several countries, mostly in North and Central Asia, have low dropout rates and are also relatively poor. This indicates that success in education does not necessarily depend on the per capita income level of a country but on political will and other non-income factors. Figure VIII Primary education dropout rates in the Asia-Pacific region
Source: Sustainable Social Development in Asia and the Pacific: Towards a
People-Centred Transformation (see figure V).
Note: ARM, Armenia; AZE, Azerbaijan; BTN, Bhutan; FJI, Fiji; GEO, Georgia;
HKG, Hong Kong, China; IND, Indonesia; IRN, Iran (Islamic Republic of); JPN,
Japan; KAZ, Kazakhstan; KGZ, Kyrgyzstan; KHM, Cambodia; LAO, Lao People’s
Democratic Republic; LKA, Sri Lanka; MAC, Macao, China; MDV, Maldives;
MYS, Malaysia; NPL, Nepal; PAK, Pakistan; RUS, Russian Federation; TJK,
Tajikistan; THA, Thailand; TUR, Turkey; TMP, Timor-Leste; UZB, Uzbekistan;
WSM, Samoa.
ARM
AZE
BTN
KHM
HKGMAC
FJI
GEO
IDN
IRN
JPNKAZKGZ
LAO
MYS
MDV
NPL
PAK
RUS
WSM
LKA
TJKTHA
TMP
TUR
UZB0
10
20
30
40
50
60
500 5000 50000
Percen
tage
Gross domestic product per capita (constant 2010 United States dollars)

ESCAP/74/23
14 B18-00311
5. Persisting rural-urban gaps in access to basic services
36. Equal opportunities for education are key to ensuring that no one is left behind. Primary school net enrolment rates are higher than 90 per cent in almost every country in the region; rural-urban gaps are behind much of the observed inequality in access to opportunities, as shown above. In many of the region’s developing countries, residing in a rural area reduces the chances of obtaining a secondary education by 50 per cent or more.16 The rural-urban divide is also among the leading determinants of inequality in access to various household-based opportunities, particularly improved sanitation (figure IX), drinking water, electricity and clean fuels.13
Figure IX Differences in the availability of improved sanitation facilities in the
Asia-Pacific region, 2015
(Percentage)
Source: ESCAP calculations based on World Health Organization, Global Health
Observatory data. Available from
http://apps.who.int/gho/data/node.main.WSHSANITATION?lang=en (accessed 11
April 2017).
Note: Only countries for which urban and rural data for both water and sanitation
was available were included in the graph.
37. Residing in a rural area is one of the main factors that determines inequality in decent employment and lack of access to adequate nutrition.13,16 Realizing Sustainable Development Goal 2, with its focus on rural development, and other related Goals and targets will contribute to improving the situation of the population in rural areas. An urgent policy priority for the region is to close the gaps in access to basic services such as education, health, drinking water, sanitation and clean energy for people living in rural areas. The aspiration contained in the 2030 Agenda to leave no one behind will never be fulfilled without closing those gaps.
0
20
40
60
80
100
Pap
ua
New
Gu
inea
Afg
han
ista
n
Mo
ng
oli
a
Kir
ibat
i
Tim
or-
Les
te
Taj
ikis
tan
Ca
mb
od
ia
Lao
Peo
ple
's D
emo
crat
ic R
epu
bli
c
My
anm
ar
So
lom
on
Isl
and
s
Ba
ng
lad
esh
Aze
rbai
jan
Ind
on
esia
Mic
ron
esia
(F
eder
ated
Sta
tes
of)
Ky
rgy
zsta
n
Pak
ista
n
Nep
al
Ph
ilip
pin
es
Ka
zak
hst
an
Ind
ia
Va
nu
atu
Mar
shal
l Is
lan
ds
Ch
ina
Sri
Lan
ka
Fij
i
Iran
(Is
lam
ic R
epu
bli
c o
f)
Ru
ssia
n F
ed
erat
ion
Jord
an
Vie
t N
am
Th
ail
and
Ma
lay
sia
Niu
e
Mal
div
es
Sam
oa
To
ng
a
Dem
ocr
atic
Peo
ple
's R
epu
bli
c o
f K
ore
a
Bh
uta
n
Geo
rgia
Arm
enia
Tu
rkey
Au
stra
lia
Jap
an
Po
pu
lati
on
usi
ng
im
pro
ved
sa
nit
ati
on
fa
cil
itie
s
Total Urban Rural

ESCAP/74/23
B18-00311 15
6. Social protection and decent work
38. Social protection and decent work can play a key role in achieving several Sustainable Development Goals by reducing vulnerabilities, preventing people from falling into poverty, empowering vulnerable populations, addressing inequalities in income and improving access to basic social services. Despite significant regional increases in social protection coverage and spending, some 60 per cent of all women, men and children are still excluded from adequate social protection.17 Only 21 of 49 countries offer benefits to children and families, contributing to high levels of stunting, malnutrition and child mortality.18 Only one in five unemployed working-age adults receive unemployment benefits. Just 3 in 10 mothers with newborns receive maternity benefits.19 Just over half of all older persons receive an old age pension and less than one third of the labour force is actively contributing to a pension scheme.20 These wide coverage gaps in social protection leave most people highly vulnerable. 39. Despite significant GDP growth over the past 15 years, total employment grew only moderately and in some countries even fell. Many countries have also seen an increase in vulnerable employment, characterized by inadequate earnings, low productivity and poor working conditions that undermine workers’ fundamental rights.21 These decent work deficits are often highest in the informal economy and affect women and vulnerable population groups in particular. 40. In almost half the 49 countries or areas for which data are available, vulnerable employment accounts for more than half of total employment, and in Bangladesh, India and the Lao People’s Democratic Republic, the proportion is greater than three quarters (figure X). Moreover, in two thirds of these countries or areas, the proportion of women workers in vulnerable employment is far greater than that of men. This mostly corresponds to countries or areas with high overall vulnerable employment, indicating that informality is disproportionally disadvantageous for women.
17 Asian Development Bank (ADB), “12 pillars for the transformation of Asia and the
Pacific region”, 20 September 2013. Available from
www.adb.org/news/infographics/12-pillars-transformation-asia-and-pacific-region.
18 International Labour Organization (ILO), World Social Protection Report 2017-19:
Universal Social Protection to Achieve the Sustainable Development Goals (Geneva,
2017). Available from www.ilo.org/wcmsp5/groups/public/---dgreports/---dcomm/---
publ/documents/publication/wcms_604882.pdf. Refer to table B.4 in the annexes for
further information.
19 Ibid. Refer to table B.6 in the annexes for further information.
20 Ibid. Only 55.2 per cent of older persons in Asia and the Pacific receive a pension, and
only 23.6 per cent of the labour force currently contribute to a pension.
21 Vulnerable employment often comprises own-account workers (without employees
of their own) and contributing family workers.

ESCAP/74/23
16 B18-00311
Figure X Proportion of workers in vulnerable employment in the Asia-Pacific
region, 2016
Source: Sustainable Social Development in Asia and the Pacific: Towards a
People-Centred Transformation (see figure V).
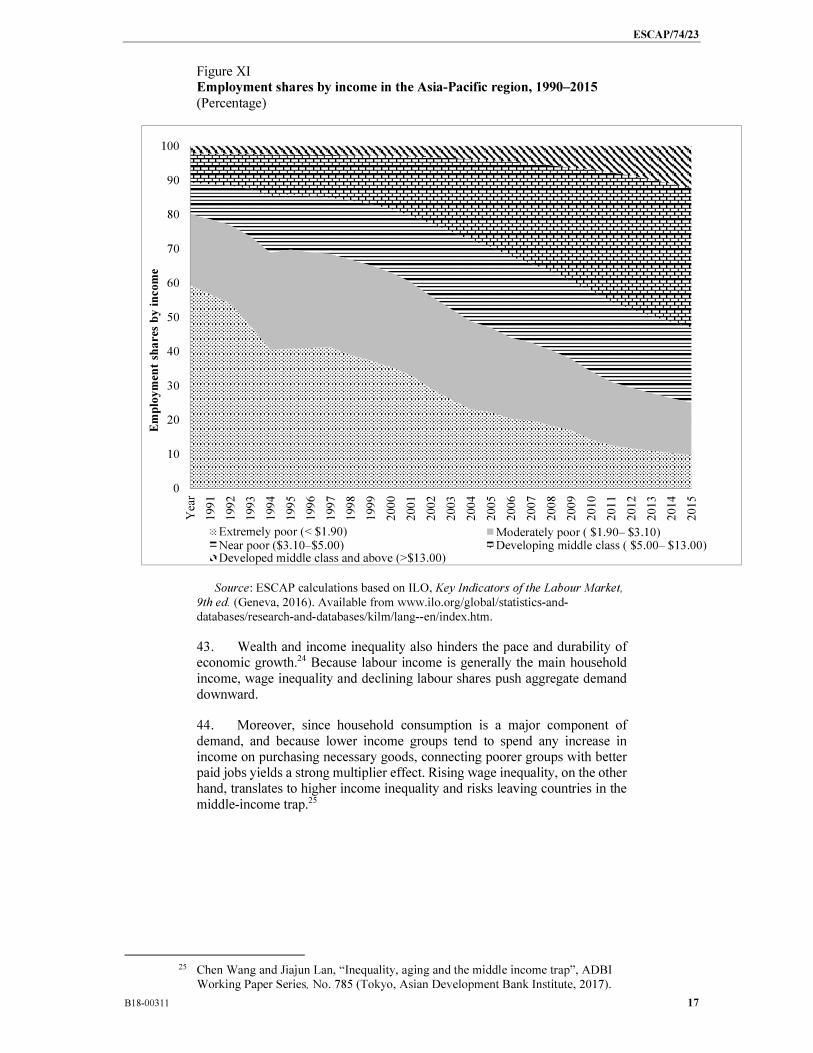
41. Inequality in access to decent work accompanies wage inequality, leaving many with low disposable incomes, dampening household consumption and hindering economic growth.22 On average, wages in Asia and the Pacific are growing faster than in any other region. However, while wages grew by 4 per cent in 2015, 23 the labour share of GDP fell from 61 to 54 per cent between the early 2000s and 2015.24 42. The disconnect between wages and productivity means that fewer people benefit from decent jobs and economic growth, while the majority see only marginal changes in their income. Although extreme working poverty fell from 35.5 to 9.9 per cent in the Asia-Pacific region between 2000 and 2015, the proportion of workers living in or near poverty remains at 47 per cent (figure XI).
22 ILO, Key Indicators of the Labour Market, 9th ed. (Geneva, 2016). Available from
www.ilo.org/global/statistics-and-databases/research-and-databases/kilm/lang--
en/index.htm.
23 ILO, Global Wage Report 2016/17: Wage Inequality in the Workplace (Geneva,
2016).
24 Statistical Yearbook for Asia and the Pacific 2016: SDG Baseline Report (United
Nations publication, Sales No. E.17.II.F.1).
0
10
20
30
40
50
60
70
80
90
100L
ao P
eop
le’s
Dem
ocr
atic
Rep
ub
lic
Ba
ng
lad
esh
Ind
iaM
yan
mar
Nep
al
So
lom
on
Isl
and
sT
imo
r-L
este
Bh
uta
nP
apu
a N
ew G
uin
eaA
fgh
anis
tan
Cam
bo
dia
Vie
t N
amP
akis
tan
Ind
on
esia
Geo
rgia
Va
nu
atu
Aze
rbai
jan
To
ng
aT
ha
ilan
dG
uam
Mo
ng
oli
aS
amo
aW
orl
dC
hin
aT
ajik
ista
nK
yrg
yz
stan
Sri
Lan
ka
Arm
enia
Fij
iIr
an
(Is
lam
ic R
epu
bli
c o
f)P
hil
ipp
ines
Uzb
ekis
tan
Tu
rkey
Kaz
akh
stan
Rep
ub
lic
of
Ko
rea
Mal
div
esT
urk
me
nis
tan
Mal
ay
sia
Ne
w C
ale
do
nia
Fre
nc
h P
oly
nes
iaN
ew Z
eala
nd
Au
stra
lia
Jap
anS
ing
apo
reH
on
g K
on
g,
Ch
ina
Ru
ssia
n F
ed
erat
ion
Bru
nei
Da
russ
alam
Mac
ao,
Ch
ina
Total Male Female
ESCAP/74/23
B18-00311 17
Figure XI Employment shares by income in the Asia-Pacific region, 1990–2015 (Percentage)
Source: ESCAP calculations based on ILO, Key Indicators of the Labour Market,
9th ed. (Geneva, 2016). Available from www.ilo.org/global/statistics-and-
databases/research-and-databases/kilm/lang--en/index.htm.
43. Wealth and income inequality also hinders the pace and durability of economic growth.24 Because labour income is generally the main household income, wage inequality and declining labour shares push aggregate demand downward.
44. Moreover, since household consumption is a major component of demand, and because lower income groups tend to spend any increase in income on purchasing necessary goods, connecting poorer groups with better paid jobs yields a strong multiplier effect. Rising wage inequality, on the other hand, translates to higher income inequality and risks leaving countries in the middle-income trap.25
25 Chen Wang and Jiajun Lan, “Inequality, aging and the middle income trap”, ADBI
Working Paper Series, No. 785 (Tokyo, Asian Development Bank Institute, 2017).
0
10
20
30
40
50
60
70
80
90
100
Year
1991
1992
1993
1994
1995
1996
1997
1998
1999
2000
2001
2002
2003
2004
2005
2006
2007
2008
2009
2010
2011
2012
2013
2014
2015
Em
plo
ym
en
t sh
ares
by i
ncom
e
Extremely poor (< $1.90) Moderately poor ( $1.90– $3.10)Near poor ($3.10–$5.00) Developing middle class ( $5.00– $13.00) Developed middle class and above (>$13.00)
ESCAP/74/23
18 B18-00311
C. Gender equality and women’s empowerment
1. Education
45. The Asia-Pacific region has made significant progress in achieving gender parity in primary education enrolment and is nearing parity at secondary and tertiary levels. Eight member States have achieved parity at all three levels. In all subregions except South and South-West Asia, women now outnumber men in tertiary institutions, with a regional gender parity index of 1.07.14 However, continued challenges, including low education quality, urban-rural disparities, limited resources, poor infrastructure and sociocultural barriers, contribute to girls’ lower attendance and achievement rates.
46. Enrolment statistics available for educational pathways show female representation is markedly low in the fields of science, technology, engineering and mathematics. Female participation in these fields is often limited to certain disciplines.26 Factors include persistent gender stereotypes in teaching and learning materials; limited gender-responsive career counselling and mentoring opportunities; fewer female role models; and psychosocial influences moulded, in part, by social norms and parental expectations. The lack of women in these fields has a detrimental impact on occupational segregation.
2. Sexual and reproductive health
47. In 2015, 86 per cent of married or in-union women in Asia and the Pacific had access to modern family planning services, higher than the global average of 82 per cent.27 An analysis of data on the proportion of demand for family planning satisfied through modern contraception indicates that women who are married or in a union in the least developed countries have less access than those in other developing countries.
48. In most of the developing countries, contraceptive prevalence is lower among women who are poorer, rural or less educated in comparison to their richer, urban and more highly educated counterparts. Bangladesh, Bhutan, Cambodia and Thailand are exceptions, with contraceptive prevalence rates higher among the poorest 20 per cent of the population than they are among the richest 20 per cent.28 In such countries, measures to expand family planning coverage have led to narrowing the gap between the richest and poorest households in rates of contraceptive prevalence. However, significant challenges remain for the entire region in reaching underserved populations, particularly women in rural and remote areas, and adolescents and youth.
26 United Nations Educational, Scientific and Cultural Organization, A Complex
Formula: Girls and Women in Science, Technology, Engineering and Mathematics in
Asia (Paris, 2015). Available from
http://unesdoc.unesco.org/images/0023/002315/231519e.pdf.
27 ESCAP, ADB and UNDP, Asia-Pacific Sustainable Development Goals Outlook
(Bangkok, 2017). Available from
www.adb.org/sites/default/files/publication/232871/asia-pacific-sdgoutlook-
2017.pdf.
28 United Nations Population Fund, The State of World Population 2017: Worlds Apart
- Reproductive Health and Rights in an Age of Inequality (New York, 2017).

ESCAP/74/23
B18-00311 19
3. Economic empowerment
49. As a result of structural barriers and historically unequal power relations, women cannot fully exercise their rights to decent work in the region. Female-to-male labour force participation ratios have declined in Asia and the Pacific, from 0.67 in 1990 to an estimated 0.61 in 2017, with South and South-West Asia registering the lowest level (figure XII).29 An estimated 78 per cent of women workers in South and South-West Asia and 60 per cent in South-East Asia are concentrated in vulnerable employment, characterized by low wages, informal contracts and often hazardous working conditions.30 Women are also paid approximately 20 per cent less than men for work of equal value.7, 24
Figure XII Female-to-male labour force participation rates in the Asia-Pacific
region, 1990–2017
Source: ESCAP calculations based on ILO, ILOSTAT. Available from
www.ilo.org/ilostat/faces/ilostat-home/home?_adf.ctrl-
state=eafa6zhmt_86&_afrLoop=2147343543978612#!\ (accessed 24 January 2018).
50. Gender inequalities with regard to property, assets, credit and technology remain pervasive. Although there are 61.3 million women entrepreneurs in the Association of Southeast Asian Nations (ASEAN)
29 ESCAP calcualtions based on ILO, ILOSTAT. Available from
www.ilo.org/ilostat/faces/ilostat-home/home?_adf.ctrl-
state=eafa6zhmt_86&_afrLoop=2147343543978612#! (accessed 24 January 2018).
30 ESCAP calculations based on ILO Trends Unit, “Trends Econometric Models”,
prepared for the Global Employment Trends and related reports, Geneva, November
2015.
0.3
0.4
0.5
0.6
0.7
0.8
0.9
1990
1991
1992
1993
1994
1995
1996
1997
1998
1999
2000
2001
2002
2003
2004
2005
2006
2007
2008
2009
2010
2011
2012
2013
2014
2015
2016
2017
Rati
o
East and North-East Asia South-East Asia South and South-West Asia
North and Central Asia Pacific Asia and the Pacific

ESCAP/74/23
20 B18-00311
region,31 the proportion of women-owned micro-, small and medium-sized enterprises with access to finance averages only 5 to 6 per cent for micro-enterprises and 12 to 15 per cent for small firms. 32 Additionally, women perform a significant share of unpaid care and domestic work, adversely affecting their labour force participation and wages. Women in the region devote between 2.4 and 6 hours on average per day for unpaid work, while men spend between 18 minutes and 2.3 hours. 33 ESCAP has recognized that women’s entrepreneurship is a key pathway for advancing women’s economic empowerment and that it has multiplier effects on decent employment, poverty eradication and economic growth. ESCAP promotes women’s entrepreneurship by advocating for policies that create a gender-responsive ecosystem in countries in the region. ESCAP also provides technical assistance on enhancing capacity for gender-based budgeting to its members.
4. Women’s participation in decision-making and leadership
51. Women’s political representation in the region continues to be low.7 As of 2017, the proportion of women in national parliaments was 19 per cent, compared with 23.5 per cent globally (figure XIII). Except in the Philippines, Nepal, New Zealand and Timor-Leste, the representation of women in parliament was below the internationally agreed target of 30 per cent, with three countries reporting no women in their national parliaments.34
Figure XIII Women in parliament, 2017
(Percentage)
Source: ESCAP calculations based on Inter-Parliamentary Union, Women in
national parliaments dataset. Available from www.ipu.org/wmn-
e/arc/classif010717.htm (accessed 24 January 2018).
31 Fostering Women’s Entrepreneurship in ASEAN: Transforming Prospects,
Transforming Societies (United Nations publication, Sales no. E.17.II.F.20).
32 US-ASEAN Business Alliance for Competitive Small and Medium Sized
Enterprises, US-ASEAN Business Council, USAID and ASEAN, “Beyond AEC
2015: policy recommendations for ASEAN SME competitiveness” (n.p., 2014).
33 United Nations Statistics Division, Allocation of time and time-use data portal.
Available from unstats.un.org/unsd/gender/timeuse/index.html (accessed 24 January
2018).
34 In this discussion, reference is made to the representation of women in the lower
house of the parliament.
15
19
23
25
28
29
0 5 10 15 20 25 30 35
Other countries/areas
Asia and the Pacific
Africa
North America
Latin America and the Caribbean
Europe

ESCAP/74/23
B18-00311 21
52. Beyond the political arena, in 2015, in 20 developing Asian economies, women made up 40 per cent of the workforce but only 14.4 per cent of corporate boardroom members and senior managers.35
5. Violence against women and girls
53. Violence against women and girls is a severe manifestation of gender inequality and disrupts the health, survival, safety and freedom of women and their families. Reporting on violence is limited due to stigma, shame, restricted access to justice and limited service provision. The proportion of women experiencing physical or sexual violence by an intimate partner in their lifetime varies across the region, with the highest prevalence in Kiribati and Papua New Guinea, at 68 per cent.36 Currently, only 34 countries in the region have dedicated domestic violence legislation, 14 have criminalized marital rape and 17 have national action plans on violence.37
D. Persons in vulnerable situations
1. Persons with disabilities
54. The Asia-Pacific region is home to an estimated 690 million persons with disabilities. They face barriers to full and effective participation in society. The difference in poverty rates between persons with disabilities and the overall population ranges from 4 to 21 per cent in Asia-Pacific countries. This is exacerbated by barriers to education and employment. Persons with disabilities are two to six times less likely to be employed than those without disabilities (figure XIV), and approximately 50 per cent of children with disabilities drop out of school during the transition from primary to secondary education. Persons with disabilities are underrepresented in political participation and decision-making bodies. The situation is even worse for women and girls with disabilities, who face additional barriers.38
35 ADB, Asian Development Outlook 2015 Update: Enabling Women, Energizing Asia
(Manila, 2015).
36 United Nations Population Fund, “Violence against women-regional snapshot
(2017)” (Bangkok, 2017). Available from
http://asiapacific.unfpa.org/en/publications/violence-against-women-regional-
snapshot-2017.
37 United Nations Entity for Gender Equality and the Empowerment of Women
(UN-Women) and others, “Mapping of data on violence against women in Asia and
the Pacific”, prepared for the Asia-Pacific UNiTE Secretariat, Bangkok, January
2018.
38 Building Disability-Inclusive Societies in Asia and the Pacific: Assessing Progress of
the Incheon Strategy (United Nations publications, Sales No. E.18.II.F.4).

ESCAP/74/23
22 B18-00311
Figure XIV Employment rates of persons with disabilities compared to the overall
population
Source: Building Disability-Inclusive Societies in Asia and the Pacific: Assessing
Progress of the Incheon Strategy (United Nations publications, Sales No.
E.18.II.F.4).
Note: 0=perfect inequality; 1=perfect equality. A ratio below 1 means that
persons with disabilities are not integrated into the labour market to the same degree
as persons without disabilities.
55. To support the implementation of disability-inclusive development and the Asian and Pacific Decade of Persons with Disabilities, 2013–2022, ESCAP member States adopted the Incheon Strategy to “Make the Right Real” for Persons with Disabilities in Asia and the Pacific, the world’s first regionally agreed disability-specific, time-bound development strategy. A review of the implementation of the Incheon Strategy was conducted at the High-level Intergovernmental Meeting on the Midpoint Review of the Asian and Pacific Decade of Persons with Disabilities, 2013–2022, held in Beijing from 27 November to 1 December 2017. The Meeting adopted the Beijing Declaration and the Action Plan to Accelerate the Implementation of the Incheon Strategy. Its goals and targets are also linked with the Sustainable Development Goal targets. 39 ESCAP will continue to provide technical assistance to member States on improving disability statistics and supporting the development of evidence-based national policies to address the challenges persons with disabilities face and support their full participation in all aspects of society.
2. Persons with HIV/AIDS
56. HIV/AIDS remains a key challenge for the region. In 26 countries there were an estimated 5.1 million people living with HIV and 170,000 AIDS-related deaths in 2016. Although numbers of new infections continue to decrease, there were still some 270,000 new infections in 2016; 2.4 million
39 ESCAP/74/22 and ESCAP/74/22/Add.1.
0.0
0.2
0.4
0.6
0.8
1.0
Ratio
Both male and female Male Female

ESCAP/74/23
B18-00311 23
people were estimated to be receiving treatment for HIV in 2016, with the treatment gap continuing to narrow.
57. To accelerate progress towards ending HIV, member States agreed to the Regional Framework for Action on HIV and AIDS beyond 2015, which focuses on promoting access to medicines, diagnostics and vaccines; developing evidence-based HIV investment cases and sustainability plans to support financing for HIV responses; and reviews and consultations on legal and policy barriers to key populations. Member States called for progress to be reviewed in 2018 through the Commission’s intergovernmental platform.
III. Addressing key social development challenges in the
context of the 2030 Agenda: conclusions and
recommendations
58. Social development is fundamental to the achievement of not only the social Sustainable Development Goals but also contributes to the realization of the other Goals. Achieving sustainable development requires a whole-of-government approach that ensures horizontal and vertical policy coherence across all sectors of government and broad multi-stakeholder partnerships with a strong sense of ownership and a commitment to active participation.
59. Member States may wish to consider the following conclusions and recommendations on closing socioeconomic development gaps:
(a) Population dynamics present significant challenges as well as opportunities to sustainable development now and will continue to do so in the future. People-centred policies that allow people to maximize their capacities, resources and opportunities, while respecting their human rights, will contribute to reducing poverty and inequalities, promoting inclusive and sustained economic growth and addressing environmental challenges. For example, for countries with declining fertility rates and an increasing share of older persons, policies and institutions are needed to foster healthy and productive ageing by mobilizing savings for effective investment in human and physical capital. Family-friendly work policies, such as part-time and flexible employment opportunities for both men and women, are important to ensure both labour market participation and care for older persons. In the field of migration, pre-departure programmes could provide basic information to departing migrant workers to ease their transition into the country of destination and empower them to maximize the benefits of their overseas employment. Overall, forward-looking, broad and inclusive policies that help to integrate population issues into a broader policy agenda are needed for building inclusive societies for greater social cohesion and sustainable development. The forthcoming 25-year review and appraisal of the Programme of Action of the International Conference on Population and Development at the regional level, which will be conducted by ESCAP in collaboration with the United Nations Population Fund in November 2018, feeding into the global review to be conducted at the Commission on Population and Development in 2019, present an opportunity to take these issues forward especially in conjunction with the 2030 Agenda;
(b) Robust economic growth in Asia and the Pacific has not yielded enough decent job opportunities. The job creation issue is linked to the nature of structural transformation and technological change. For countries passing through a youth bulge in their demographic transition, such as those in South Asia, structural transformation oriented towards the manufacturing sector might help to create jobs. To exploit the potential of manufacturing,

ESCAP/74/23
24 B18-00311
Governments need to undertake reforms to improve the investment climate and the ease of doing business as part of industrial policy, while enforcing labour laws for all workers, including migrant workers, and improve social security to support the creation of decent jobs. For other countries in the region with ageing societies, diversification into services may help to harness the benefits of a global workforce, and to keep older persons in the labour force, if they so desire, with active ageing policies;
(c) Social protection is central to the 2030 Agenda and can help reduce poverty, empower vulnerable populations, and address inequalities in income and in access to services. Social protection can take many forms, such as labour market interventions that are designed to promote employment or the protection of workers; social insurance which mitigates, for example, risks associated with unemployment, ill health or disability; and social assistance through cash or in-kind resources transferred to vulnerable individuals or households. Social protection schemes can help people address immediate needs as well as longer-term goals. Overall, social protection should be anchored in the universal right of everyone to an adequate standard of living and well-being. To assist countries in developing broader and more robust social protection systems, the concept of a social protection floor offers a framework for income security and access to basic social services. Availability, accessibility and adequacy are prerequisites for inclusive social protection;40
(d) The provision of universal access to basic services, including health care, and basic infrastructure, such as safe and affordable drinking water and sanitation and modern energy, as well as universal access to education, are crucial for empowerment. This in turn will strengthen the three dimensions of sustainable development. A healthy, well-educated and trained workforce that lives in dignity is not only fundamental to accelerating economic growth through productivity enhancements and to inclusion, it can also help to reduce environmental footprints;
(e) The success of the 2030 Agenda hinges on ensuring gender equality and the empowerment of women. Effective laws and frameworks are essential to integrating gender equality in national institutions, policies and programmes; providing women workers with social protection and income security; and recognizing, reducing and redistributing unpaid care work. It is vital, for example, to bridge gender gaps in labour force participation, entrepreneurship, pay, working conditions, rights to ownership, including control of land, property and other resources, and equal rights to inheritance. Beyond political commitment, the mobilization of sustained financing and capacity-building is imperative for the full implementation of initiatives to empower women, including through women’s entrepreneurship;
(f) Universal respect for human rights and human dignity, the rule of law, justice, equality and non-discrimination on the basis of race, ethnicity and cultural diversity, and equal opportunity for all are essential for leaving no one behind. In addition to broad-based socioeconomic policies, countries can implement inclusive policies, including financial inclusion, and measures that address the special situation of persons in vulnerable situations. New technologies can be used to facilitate financial inclusion through mobile banking and remittance transfers for migrants or to help vulnerable groups, such as older persons, to obtain medical advice through smartphone technologies. Overall, social inclusion policies and measures should follow a
40 United Nations, Department of Economic and Social Affairs, “Promoting inclusion
through social protection: report on the world social situation 2017 – executive
summary” (New York, 2017). Available from
www.un.org/development/desa/dspd/wp-content/uploads/sites/22/2015/06/RWSS17-
ExecutiveSummary-web.pdf.

ESCAP/74/23
B18-00311 25
holistic approach. People who are fully integrated into society will become productive members of a sustainable society;
(g) Reliable and timely age- and sex-disaggregated qualitative and quantitative data are essential for planning, implementing and monitoring achievements of the 2030 Agenda. Governments should support any initiative that improves data collection, processing, dissemination and analysis of disaggregated data. The 2020 round of censuses is an important opportunity for member States to take stock and plan for the future. In addition, systems of civil registration and vital statistics, as well as centralized population registers and national household survey programmes should be strengthened. Open access to data facilitates decisions informed by evidence and big data can provide useful supplementary information on key aspects of sustainable development.
IV. For consideration by the Commission
60. The Commission is invited to review the issues and recommendations summarized in the present document and provide the secretariat with guidance for its future work, including the identification of regional priorities and areas for future research, policy support and capacity-building needs.
_________________