error, uncertainty, and loss in digital evidence
TRANSCRIPT

International Journal of Digital Evidence Summer 2002, Volume 1, Issue 2
Error, Uncertainty, and Loss in Digital Evidence Eoghan Casey, MA
To be useful, measurements must be reliable. Having incorrect information is
potentially more damaging than having no information. The situation, of course,
raises the question of accuracy or uncertainty of a measurement. Arnold O.
Beckman, founder of Beckman Instruments, has stated, “One thing you learn in
science is that there is no perfect answer, no perfect measure.”1 (Beckwith, T. G.,
Marangoni, R. D., Lienhard, J. H., 1993)
Abstract
Despite the potentially grave ramifications of relying on faulty information in the
investigative or probabitive stages, the uncertainty in digital evidence is not being
evaluated at present, thus making it difficult to assess the reliability of evidence stored on
and transmitted using computer networks. As scientists, forensic examiners have a
responsibility to reverse this trend and address formally the uncertainty in any evidence
they rely on to reach conclusions. This paper discusses inherent uncertainties in network
related evidence that can be compounded by data corruption, loss, tampering, or errors in
interpretation and analysis. Methods of estimating and categorizing uncertainty in digital
data are introduced and examples are presented.
1 Reliability refers to the consistency of a measuring or recording process. A perfectly reliable process will record the same value when repeated measurements of the same entity are taken. Accuracy and error both refer to the difference between the true value and measured/recorded value. Uncertainty is the probable upper bound of the error.

International Journal of Digital Evidence Summer 2002, Volume 1, Issue 2
1. Introduction
When evaluating evidence, its reliability and accuracy are of grave importance both in the
investigative and probative stages of a case. Whether digital evidence is being used to
implicate or exonerate a person, how reliably and accurately the data represents actual
events can impact an individual’s liberty and life. The need for measures of error in
forensic analysis of computer systems is apparent in the history of scientific evidence
(Palmer, 2002). Generally accepted guidelines for evaluating scientific evidence include
quantifying the technique’s potential rate of error (Daubert, 1993) and more rigorous
requirements are being called for (Pollack, 2002). Therefore, forensic examiners have a
duty to estimate how closely the measured values represented in their data approximate
reality.
When criminal activities on a computer network are being reconstructed using digital
records, every aspect has some degree of error. The origin and time of the events, as well
as who was responsible for the events can be uncertain. Lost data can give an incomplete
picture of the crime. It is even possible that an event never occurred but that a digital
record was fabricated to misdirect investigators or implicate an innocent person. The
computer system and process that generates records can introduce more subtle errors that
are only detectable through detailed analysis.
Ideally, we should evaluate computer-generated records based on the reliability of the
system and process that generated the records.
International Journal of Digital Evidence Summer 2002, Volume 1, Issue 2
Because records of this type are not the counterpart of a statement by a human
declarant, which should ideally be tested by cross-examination of that declarant,
they should not be treated as hearsay, but rather their admissibility should be
determined on the basis of the reliability and accuracy of the process involved.
(Strong, J. W., 1992)
However, the reliability of a particular computer system or process can be difficult to
assess. Programmers are fallible and can unintentionally or purposefully embed errors in
their applications. Also, complex systems can have unforeseen operating errors,
occasionally resulting in data corruption or catastrophic crashes. Possibly because of
these complexities, courts are not closely examining the reliability of computer systems
or processes and are evaluating the reliability of digital evidence without considering
error rates or uncertainty. For instance, in a sexual assault case, the court did not examine
a telephone billing system closely and assumed that its records were reliable and accurate
because a computer had generated them.
Figlio's testimony was sufficient to confirm the reliability of the telephone
records. She explained that entries in the record were made instantaneously with
the making of the calls and that AT&T would send Southwestern Bell the billing
tapes, which established when the call took place, the originating number and the
terminating number. She explained that the source of the information was a
computer, which monitored Southwestern Bell's switching operations. The circuit
court was correct in concluding that these records were uniquely reliable in that

International Journal of Digital Evidence Summer 2002, Volume 1, Issue 2
they were computer-generated rather than the result of human entries. (State of
Missouri v. Dunn, 1999)
Even if it is not possible to exactly quantify the uncertainty in a given piece of digital
evidence, courts should look to experts for a clear sense of how reliable the data are. All
digital evidence has some degree of uncertainty and an expert should be capable of
describing and estimating the level of certainty that can be placed in a given piece of
evidence. If we do not make an effort to estimate uncertainty in digital evidence, it could
be argued that there is no basis on which to assess the reliability or accuracy of the
evidence. Additionally, forensic examiners who do not account for error, uncertainty, and
loss during their analysis may reach incorrect conclusions in the investigative stage and
may find it harder to justify their assertions when cross-examined. Furthermore, unless
courts require some quantification of the uncertainty associated with given digital
evidence, technical experts are less likely to provide it, and the resulting rulings will be
weakened accordingly.
This paper explores the inherent uncertainty in evidence collected from computer
networks and describes some potential sources of error and loss. The aim of this work is
to provide a basis to help forensic examiners implement the scientific method by
detecting, quantifying and compensating for errors and loss in evidence collected from
networked systems. A method for estimating and reporting the level of certainty of digital
evidence in a standard manner is provided in Table 1 in Subsection 2.3. This paper
focuses on logs relating to network activities including server logon records, router

International Journal of Digital Evidence Summer 2002, Volume 1, Issue 2
NetFlow logs, and network capture logs. The general concepts and approaches to
assessing uncertainty can be generalized to other computer, network and
telecommunication systems.
2. Separation: Time, Space and Abstraction
Digital data are separated by both time and distance from the events they represent. A log
file that records network activities is an historic record of events that happened at various
places in the world. Even when viewing network traffic using a sniffer, there is a delay
between the activity that generated the traffic and the display of the data on the monitor.
Additionally, networks are comprised of layers that perform different functions from
carrying electronic pulses over network cables to presenting data in a form that computer
applications can interpret. For instance, the Open System Interconnection (OSI) reference
model divides networks into seven layers: the application, presentation, session,
transport, network, data link, and physical layers.2 Each layer of abstraction hides the
complexity of lower layer and provides a new opportunity for error and loss as is
discussed throughout this paper.
Each of these dimensions of separation prevents examiners from viewing the true data
and can distort what the examiner sees. Learning how to quantify and account for the
resulting uncertainty is a critical aspect of a forensic examiner’s work.
2 For more information about network layers and the digital evidence they contain, see (Casey, 2000)
International Journal of Digital Evidence Summer 2002, Volume 1, Issue 2
2.1 Temporal Uncertainty
When investigating a crime, it is almost invariably desirable to know the time and
sequence of events. Fortunately, in addition to storing, retrieving, manipulating, and
transmitting data, computers associate date/time stamps with almost every task they
perform. However, forensic examiners must keep in mind that computer clocks are
inherently limited, with resolutions in the millisecond or microsecond range and can drift
over time (Stevens, 1994). Although these time periods may be negligible in some cases,
there are situations where small discrepancies can be important. For instance, when
creating a timeline using sniffer logs from several systems that record hundreds of events
in the same second, minor clock discrepancies can make it difficult to create an accurate
chronological sequence of actions. Also, small discrepancies can accumulate to create
larger errors such as clock drift resulting in a large offset. Until errors are actually
quantified it cannot be stated with certainty that they are negligible.
The most common source of temporal error is system clock offset. If a router’s clock is
several hours fast, this discrepancy can make it difficult to correlate events with logs
from other systems and can impair subsequent analysis. Also, errors in an evidence
collection system's clock can create discrepancies during the analysis and reporting
stages. For instance, most syslog servers generate a date/time stamp for log entries that
they receive from remote systems over the network. Thus, a clock offset on the server can
introduce error even if the clock of the computer that sent the syslog message is correct.
International Journal of Digital Evidence Summer 2002, Volume 1, Issue 2
Determining whether a system clock was accurate when specific records were generated
can be a challenging task in a networked environment. The system clock of interest may
be elsewhere on the network and might be overlooked during the initial search. For
instance, in a 1995 homicide case the primary suspect claimed that he was at work at the
time of the murder and his alibi depended largely on the last configuration time of a
network device – a Shiva Fastpath. The last configuration time of the device supported
the suspect’s alibi but investigators believed that the evidence had been fabricated several
days after the crime.
The Fastpath device did not have an internal time-keeping source and relied on an
external time source – the system time of the remote management console on a
Macintosh computer. Furthermore, the log showing the last configuration time of the
Fastpath was only recorded on the management console. Therefore, because the suspect
had full control over the management console, it was possible for him to reset the time on
the device from the management console to give the impression that the device was last
configured at a specific time. In this case, the management console had not been collected
as evidence during the initial search, making it impossible to determine conclusively if
the date/time stamps had been fabricated. Because the management console was not
collected during the initial search and seizure, there was a high degree of uncertainty in
the date/time stamp, the suspect’s alibi could not be confirmed, and he was convicted of
the murder.
International Journal of Digital Evidence Summer 2002, Volume 1, Issue 2
Time zone differences are another common source of temporal error in network logs.
Some Web servers (e.g., Microsoft IIS) create logs with date/time stamps in GMT and
computer systems around the world often use local time in their logs. A failure to correct
for time zone offsets can result in a great deal of confusion. For instance, when
requesting information from an Internet Service Provider, a time zone discrepancy can
cause the ISP to provide the wrong subscriber information and thus possibly implicate an
innocent individual.
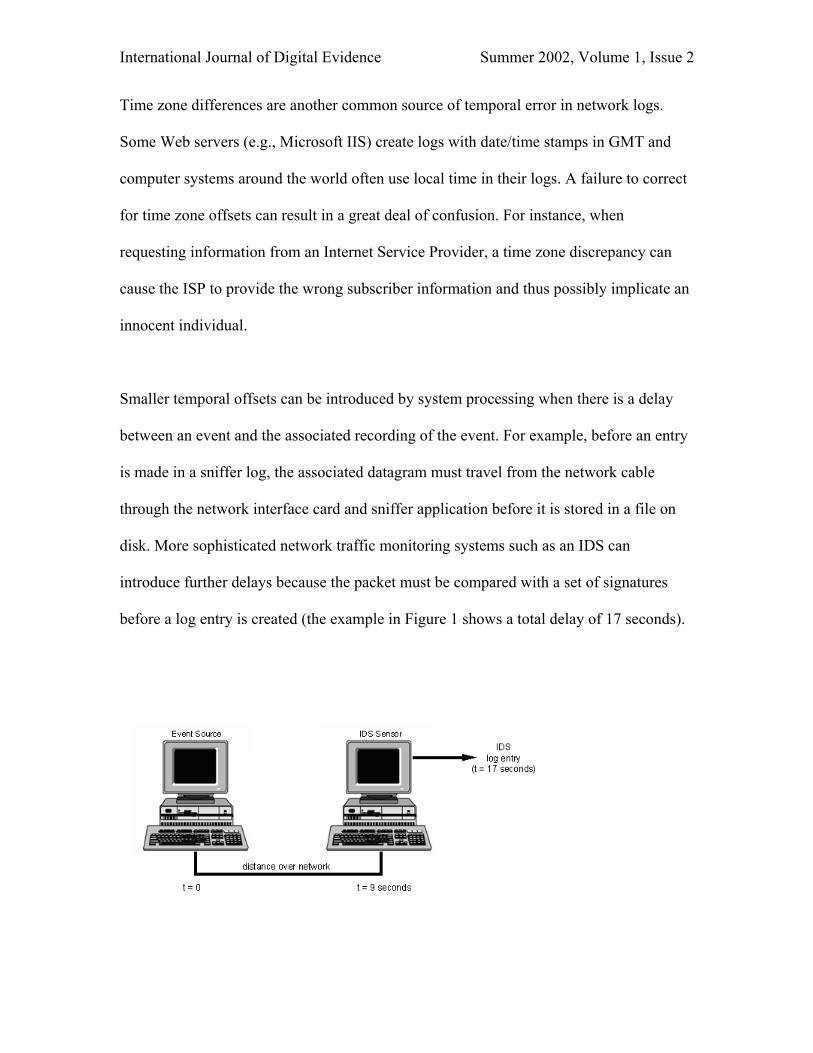
Smaller temporal offsets can be introduced by system processing when there is a delay
between an event and the associated recording of the event. For example, before an entry
is made in a sniffer log, the associated datagram must travel from the network cable
through the network interface card and sniffer application before it is stored in a file on
disk. More sophisticated network traffic monitoring systems such as an IDS can
introduce further delays because the packet must be compared with a set of signatures
before a log entry is created (the example in Figure 1 shows a total delay of 17 seconds).

International Journal of Digital Evidence Summer 2002, Volume 1, Issue 2
Figure 1: Example of distance and lag between network event and corresponding
IDS log entry
Similarly, the login process on Unix systems performs several steps prior to making an
entry in the login accounting files (utmp, lastlog, and wtmp). Thus, there may be a small
disparity between the time of the initial connection to the system as seen in network
traffic logs and the date/time stamp of the associated login accounting records on the
system. Although such minor discrepancies may not change conclusions based on the
evidence, a failure to detect and explain these differences can weaken an argument.
2.2 Uncertainty of Origin
Determining the origin of events on a network is an important step towards apprehending
offenders. However, the distributed and insecure nature of networks can introduce
significant uncertainty of origin in digital evidence.
One of the most commonly encountered examples of origin uncertainty on networks is
forged e-mail. Individuals who impersonate others in e-mail, unsolicited bulk e-mailers
(a.k.a. SPAMers), and malicious programs such as the Klez worm all fabricate e-mail to
make it more difficult to determine where the message came from. The “From” header in
an e-mail message is easily falsified and, therefore, has a high degree of uncertainty.
“Received” headers often contain the originating IP address of an e-mail message along
with a date/time stamp from the servers that handled the message. “Received” headers are
more reliable than “From” headers, provided an individual or program did not fabricate
them at the source.

International Journal of Digital Evidence Summer 2002, Volume 1, Issue 2
Origin uncertainty is created on the Web when individuals configure their browsers to
connect via a proxy to conceal their actual IP address. It is also possible to connect to
IRC, FTP, Telnet servers and other servers via SOCKS proxies and all AOL users are
connected to the Internet through proxies. Additionally, many computer intruders break
into systems specifically to install programs (a.k.a. bots) that enable them to connect to
IRC networks without disclosing their actual location. This allows individuals to trade
copyright protected media and other illegal materials through the compromised system
rather than directly from their personal computer.
A network address translation (NAT) device can provide many machines with Internet
access through a single point of contact. Thus, an event originating from any machine
behind a NAT device will appear to come from the NAT device’s IP address. From a
distance, it is not possible to distinguish between machines behind a NAT box. A virtual
private network (VPN) allows individuals to connect to a network from anywhere in the
world. Thus, a computer in California can connect to the Internet via a VPN server in
Connecticut, giving the impression that online activities are originating in Connecticut.
These possibilities reduce the degree of certainty in a given IP address as the actual origin
of an event even when multiple, independent sources of evidence corroborate the fact that
a given IP address was involved.
Being mindful of origination uncertainty can help forensic examiners avoid making
incorrect conclusions. For instance, in one intrusion investigation that did not take into

International Journal of Digital Evidence Summer 2002, Volume 1, Issue 2
account origination uncertainty, a warrant was served at a suspected hacker’s home in
California. All that law enforcement officers found were a compromised home computer
connected to the Internet via DSL and an innocent, frightened computer owner.
2.3 Estimating Uncertainty in Network Related Evidence
In some instances, it may be relatively easy for a forensic examiner to qualify assertions
with appropriate uncertainty. For instance, when network traffic statistics are only
available in aggregate form, the examiner may be provided with summarized data about
connections to/from a suspect’s computer that are totaled every ten minutes. With this
data, it is not possible to distinguish between a Web site that the suspect accessed for ten
minutes and a Web site that was only viewed for a few seconds. To ensure that the
resulting uncertainty is conveyed to others, the examiner's report should indicate that the
date/time stamps associated with the suspect's network activity are accurate to within 10
minutes.
Another approach to calculating uncertainty is using probability distribution functions.
For example, clock offsets of 355 computers on a university network were calculated.3
Four of the machines’ clocks were more than six years slow and another machine’s clock
was over one year slow. Factoring these systems into the calculations places the
uncertainty into years as opposed to hours. Excluding these outliers and plotting a
histogram of the remaining 350 values shows a dominant central peak with gradual
decline on both sides (Figure 2) suggesting that this data has a normal distribution
3 These values are not intended to be representative but simply to demonstrate a common approach to calculating uncertainty.

International Journal of Digital Evidence Summer 2002, Volume 1, Issue 2
enabling us to calculate the standard deviation (σ = 6.7 hours).4 Thus, there is a 95%
probability that time measured by a system clock is within +/- 13.1 hours (1.96σ) of the
actual time.
0
20
40
60
80
100
120
140
# C
ompu
ters
-60 -50 -40 -30 -20 -10 0 10 20 30 40 50 60Minutes
Histogram of Clock Offsets on 350 Unix computers(extreme values not shown)
Figure 2: Histogram of clock offsets showing a Gaussian distribution
Based on these results, a forensic examiner might qualify all assertions by stating that
date/time stamps from any given system are accurate to +/- 13 hours (with 95%
confidence). However, this uncertainty was calculated using data that may not be
representative of computers involved in crime and five inconvenient values were
4 Although excluding these anomalous values simplifies this demonstration, it also weakens the underlying assumption that the temporal errors in this experiment have a Gaussian distribution and may invalidate the associated uncertainty computation.

International Journal of Digital Evidence Summer 2002, Volume 1, Issue 2
excluded for convenience, making the results highly suspect. So, although it is relatively
straightforward to estimate uncertainty in this way, it is not necessarily applicable or
accurate.
In most cases, quantifying uncertainty in network related evidence is very difficult. The
state of a network changes constantly, tampering and corruption are unpredictable, and
quantifying temporal or origination uncertainty of a given log entry may not be possible.
Consider the following example from a Microsoft IIS Web server access log showing an
intrusion:
2002-03-08 04:42:31 10.10.24.93 - 192.168.164.88 80 GET /scripts/..%5c../winnt/system32/cmd.exe /c+tftp+-i+172.16.19.42+get+su.exe+c:\inetpub\scripts\su.exe 502
The date/time stamps of this type of log file are usually in GMT but can be configured to
use local time. Without additional information, we cannot determine if this event
occurred on 2002-03-08 at 04:42 GMT or 2002-03-07 at 23:42 EST. Additionally, the
system clock of the computer could be incorrect by minutes, hours, or days. Of course,
these potential errors can be avoided by documenting the system clock time and the Web
server configuration but origination uncertainty can be more problematic. In the above
example, the attacker could be connecting through a proxy so the IP address 10.10.24.93
may not be on the same local area network or even in the same geographical region as the
attacker.
Also note that the Web server request recorded in this log entry was constructed to
exploit a vulnerability that allows an attacker to execute commands on the server. In this
case, the attacker is instructing the Web server to fetch a file called su.exe from another

International Journal of Digital Evidence Summer 2002, Volume 1, Issue 2
system (172.16.19.42). We do not know if the IP address 172.16.19.42 is in the same
geographical region as the attacker and we do not even know if this command was
successful.5 Finally, since the intruder could execute commands on the Web server,
he/she could have fabricated this log entry to misdirect investigators or deleted log entries
that implicated him/her as is discussed in Section 3. The total potential uncertainty in the
above log entry is a combination of these (and possibly other) uncertainties. However, it
is not clear how the individual uncertainties interact or how they can be combined to
estimate the maximum potential uncertainty. Given the number of unknowns in the
equation, this problem is effectively indeterminate. So, it is necessary to estimate
uncertainty in a heuristic manner.
To strike a balance between the need for some estimate of certainty in digital evidence on
networked systems versus the cost and complexity of calculating uncertainty, the
following chart is provided, from lowest level of certainty (C0) to highest level of
certainty (C6).6
Certainty Level
Description/Indicators Commensurate Qualification
Examples
C0 Evidence contradicts known facts. Erroneous/Incorrect Examiners found a vulnerability in Internet Explorer (IE) that allowed scripts on a particular Web site to create questionable files, desktop shortcuts, and IE favorites. The suspect did not purposefully create these items on the system.
C1 Evidence is highly questionable. Highly Uncertain Missing entries from log files or signs of tampering.
C2 Only one source of evidence that is not protected against tampering.
Somewhat Uncertain E-mail headers, sulog entries, and syslog with no other supporting evidence.
C3 The source(s) of evidence are more difficult to tamper with but there is not enough evidence to support a firm conclusion or there
Possible An intrusion came from Czechoslovakia suggesting that the intruder might be from that area. However, a later connection came from Korea suggesting that the
5 A 200 return code would tell us that the command was executed but a 502 return code indicates that the server became overloaded and may or may not have executed the command. 6 Similar types of scales have been found extremely useful in meteorology such as the Beaufort Wind Scale and the Fujita Tornado Scale, which was introduced by F. T. Fujita in 1971 and has been universally adopted in rating the intensity of tornados by examining the damage they have done (The Fujita Scale, 1999).

International Journal of Digital Evidence Summer 2002, Volume 1, Issue 2
are unexplained inconsistencies in the available evidence.
intruder might be elsewhere or that there is more than one intruder.
C4 Evidence is protected against tampering or multiple, independent sources of evidence agree but evidence is not protected against tampering.
Probable Web server defacement probably originated from a given apartment since tcpwrapper logs show FTP connections from the apartment at the time of the defacement and Web server access logs show the page being accessed from the apartment shortly after the defacement.
C5 Agreement of evidence from multiple, independent sources that are protected against tampering. However small uncertainties exist (e.g., temporal error, data loss).
Almost Certain IP address, user account, and ANI information lead to suspect’s home. Monitoring Internet traffic indicates that criminal activity is coming from the house.
C6 The evidence is tamper proof and unquestionable.
Certain Although this is inconceivable at the moment, such sources of digital evidence may exist in the future.
Table 1: A proposed scale for categorizing levels of certainty in digital evidence
In the 1995 homicide mentioned in Subsection 2.1, the certainty level of the last
configuration time of a Shiva Fastpath was greater than C0 (absence of evidence is not
evidence of absence) and was greater than C1 because there was no evidence of
tampering. However, since the date/time stamp was easily falsified, it had a relatively low
certainty level (C2). E-mail headers that do not appear to be forged also have a C2
certainty level but can drop to C1 certainty level if any inconsistencies or signs of forgery
are detected. If there is an indication that an offender is using a proxy or some other
method of concealing his/her location, there is virtually no certainty in associated IP
addresses recorded in log files (C1).
When multiple sources of evidence are available, the certainty level in the data is
bolstered because details can be corroborated (C4).7 However, if there are inconsistencies
between the various sources the certainty level is reduced (C3) and signs of tampering in
7 Investigators should seek the sources, conduits, and targets of an offense. Each of these three areas can have multiple sources of digital evidence and can be used to establish the continuity of offense (COO). Notably, additional systems may be peripherally involved in an offense and may have related evidence. The more corroborating evidence that investigators can obtain, the more certainty they can have in their conclusions.

International Journal of Digital Evidence Summer 2002, Volume 1, Issue 2
the available sources of evidence reduce the certainty level even further (C1). When there
is complete agreement between protected sources of digital evidence, there is a relatively
high certainty level (C5) in the evidence but some uncertainty still exists. Currently, there
are no tamper proof sources of digital evidence (C6) but future developments may
provide this level of certainty.
The certainty levels in Table 1 apply to data, not to conclusions based on digital evidence
since erroneous conclusions can be drawn from reliable data. Also, the certainty level in
digital evidence depends on its context, which includes offender actions and can only be
assessed after a crime has been committed. An entry in a single log file that is susceptible
to tampering has a low certainty level (C2) unless there are other independent sources of
corroborating evidence (C4). A standard syslog entry has a lower certainty level (C2)
than a cryptographically signed entry (C4) unless there is some indication that the signed
logs have been compromised, in which case the certainty level drops to C1.
In addition to providing forensic examiners with a practical method for estimating
uncertainty, this heuristics approach allows investigators, attorneys, judges, and jurors
who do not have a deep technical understanding of network technology to assess the
reliability of a given piece of digital evidence.
3. Log Tampering, Corruption and Loss
Errors and losses can be introduced into log files at various stages:
• At the time of the event: a fake IP address can be inserted into a packet or a log
entry can be fabricated to misdirect investigators

International Journal of Digital Evidence Summer 2002, Volume 1, Issue 2
• During observation: Spanning ports on a switch to monitor network traffic
increases the load on the switch and may introduce loading error, increasing the
number of dropped datagrams.
• At the time of the log creation: remote logging facilities such as syslog can have
some percentage of lost messages and a clock offset on the logging system can
result in incorrect date/time stamps.
• After creation: log files can become corrupted or can be altered to mislead
investigators
• During examination: the application used to represent log files can introduce
errors by incorrectly interpreting data or by failing to display certain details
• During analysis: mistakes by an examiner can result in incorrect conclusions
When dealing with networked systems, it is crucial to extend one’s thinking beyond the
single computer and consider other connected systems. We will concentrate on simple
scenarios since they are more likely than sophisticated attacks. However, one should keep
in mind that DNS records can be modified to make an attacker’s computer appear to be a
trusted computer, logging programs such as tcpwrappers can be maliciously altered
(CERT, 1999), and many other components of a network can be tampered with to create
error and loss.
3.1 Log Tampering
On Unix, system messages are sent to syslogd through the /dev/log socket and are written
to a file on disk or sent to a remote logging host. Since /dev/log usually allows anyone on
the system to write to it and syslogd is often configured to accept messages over the
network from any system, it is relatively easy to fabricate a syslog entry. Additionally,

International Journal of Digital Evidence Summer 2002, Volume 1, Issue 2
syslogd does not add a date/time stamp to locally generated messages that already have a
time stamp. So, even if a user does not have write access to the syslog file, he/she can
fabricate an entry with any date/time stamp and pass it through /dev/log using a simple
program as shown here:
$ ls -latc /var/log/messages -rw------- 1 root root 756174 May 6 17:34 /var/log/messages $ ls -latc /dev/log srw-rw-rw- 1 root root 0 Apr 22 14:18 /dev/log $ ./make-syslog "Apr 13 04:55:05 lpd[1534]: unexpected error from 192.168.35.65" $ su Password: # tail -f /var/log/messages May 6 17:35:00 server1 CROND[21478]: (root) CMD (/usr/local/security/regular-job.pl) Apr 13 04:55:05 server1 lpd[1534]: unexpected error from 192.168.35.65 May 6 17:36:00 server1 CROND[21482]: (root) CMD (/usr/local/security/regular-jop.pl)
The only component of a syslog message that cannot be fabricated in this way is the
hostname (server1 in this instance) making standard syslog a relatively unreliable source
of evidence (C2).
Although Unix utmp and wtmp files (C3) are harder to tamper with because root access
is required, they provide another example of log file tampering. Logon sessions to Unix
systems are recorded in the wtmp and utmp files which are maintained by login and init.
The wtmp file retains an historical record of logon sessions whereas the utmp file shows
who is currently logged into the system. As noted in the manual page for utmp:
The utmp file allows one to discover information about who is currently using the system. There may be more users currently using the system, because not all programs use utmp logging. Warning: utmp must not be writable, because many system programs (foolishly) depend on its integrity. You risk faked system logfiles and modifications of system files if you leave utmp writable to any user.
International Journal of Digital Evidence Summer 2002, Volume 1, Issue 2
The same warnings apply to the wtmp log since not all legitimate programs utilize the
login process and most intruder backdoors purposefully avoid making log entries.
Additionally, it is common for intruders who gain unauthorized root access to computer
systems to remove entries from the wtmp log using programs such as wzap to conceal
their activities. Although Windows NT logon entries are difficult to fabricate (C3), very
little logging is enabled by default and, when they are enabled, the logs can be deleted
using programs such as WinZapper.8 Application logs such as Web server access logs are
even easier to alter, making them even less reliable (C2).9
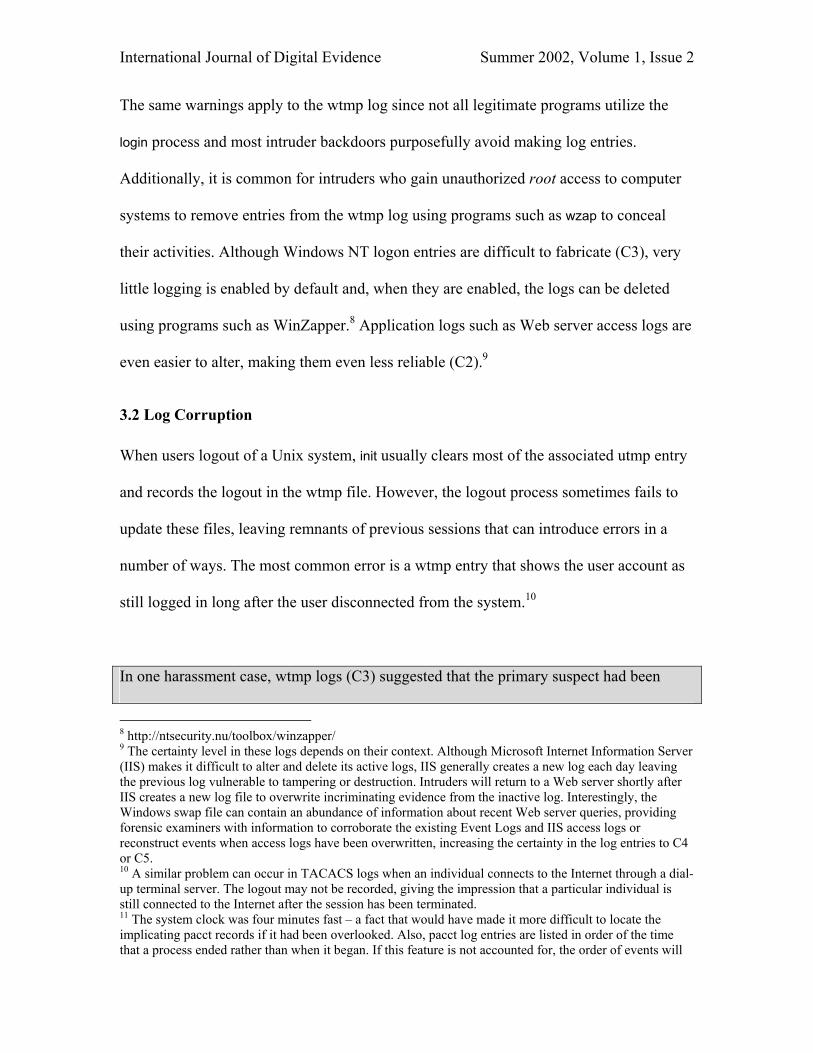
3.2 Log Corruption
When users logout of a Unix system, init usually clears most of the associated utmp entry
and records the logout in the wtmp file. However, the logout process sometimes fails to
update these files, leaving remnants of previous sessions that can introduce errors in a
number of ways. The most common error is a wtmp entry that shows the user account as
still logged in long after the user disconnected from the system.10
In one harassment case, wtmp logs (C3) suggested that the primary suspect had been
8 http://ntsecurity.nu/toolbox/winzapper/ 9 The certainty level in these logs depends on their context. Although Microsoft Internet Information Server (IIS) makes it difficult to alter and delete its active logs, IIS generally creates a new log each day leaving the previous log vulnerable to tampering or destruction. Intruders will return to a Web server shortly after IIS creates a new log file to overwrite incriminating evidence from the inactive log. Interestingly, the Windows swap file can contain an abundance of information about recent Web server queries, providing forensic examiners with information to corroborate the existing Event Logs and IIS access logs or reconstruct events when access logs have been overwritten, increasing the certainty in the log entries to C4 or C5. 10 A similar problem can occur in TACACS logs when an individual connects to the Internet through a dial-up terminal server. The logout may not be recorded, giving the impression that a particular individual is still connected to the Internet after the session has been terminated. 11 The system clock was four minutes fast – a fact that would have made it more difficult to locate the implicating pacct records if it had been overlooked. Also, pacct log entries are listed in order of the time that a process ended rather than when it began. If this feature is not accounted for, the order of events will

International Journal of Digital Evidence Summer 2002, Volume 1, Issue 2
logged into a system at the time of one act. A closer examination of the log entry showed
that a logout entry had never been entered for his session, giving the impression that the
suspect had been logged in for 5 days, 16 hours, and 44 minutes.
serverZ% last userA pts/14 roosevelt.corpX. Sun Dec 9 13:10 - 13:17 (00:07) userB pts/2 pc01.sales.corpX Sun Dec 9 13:09 - 13:29 (00:10) userC pts/13 lincoln.corpX.co Sun Dec 9 13:01 - 16:16 (03:15) userH pts/3 homepc.isp.com Fri Dec 7 14:14 - 10:53 (6+20:38) suspect pts/7 201.4.136.24 Fri Dec 7 08:39 - 01:23 (5+16:44)
An examination of the process accounting logs (C3) for the time in question showed that
no processes had been running under the suspect’s account and that only one of the other
logon sessions had been active, implicating another individual.11
A less common, secondary logging error occurs when someone logs into a Unix terminal
that has an associated utmp entry that was not properly cleared and then uses the su
(substitute user) command. Instead of making an entry in the sulog (C2) showing the
current user su-ing, su erroneously obtains the user name of the previous user from the
utmp file and makes an entry in the sulog showing the previous user su-ing. This anomaly
can give the impression that someone escalated their privileges on a system without
authorization when in fact an authorized individual escalated privileges and the logs
mislabeled the act. Both of these examples show how corrupt log files can implicate an
innocent individual if potential errors are not accounted for.
be illogical, and important events may be overlooked because the corresponding log entries appear after the time period of interest.

International Journal of Digital Evidence Summer 2002, Volume 1, Issue 2
3.3 Data Loss
In addition to the log tampering and corruption, uncertainty can be introduced by lost log
entries. Because syslog and other logging mechanisms like NetFlow (detailed in
Subsection 4.2) use UDP by default when sending messages to remote systems, there is
no guarantee of delivery. When a remote logging host is heavily loaded it may drop some
syslog messages sent from remote hosts, thus leaving gaps in the logs. Alternatives to the
standard syslog use TCP and sequence numbers to increase reliability and facilitate loss
calculations. Also, some alternatives use digital signatures to check the integrity of log
files (C4), making it more difficult to modify logs without detection (Tan, J., 2001).
Losses can also occur in system kernels and at the hardware level, missing important
details. Figure 3 illustrates some losses that can occur on a networked system used to
monitor network communications.

International Journal of Digital Evidence Summer 2002, Volume 1, Issue 2
Figure 3: Potential data losses as pulses in network cables are translated into human
readable form
Network interface cards and network devices such as switches, routers, and firewalls can
drop packets. Also, programs used to monitor network traffic can become overloaded and
fail to retain all packets captured by the kernel as described in Subsection 4.1. Although
TCP is designed to retransmit dropped packets, network sniffers are not active
participants in the communication channel and will not cause packets to be resent.
Furthermore, network-monitoring applications may show only certain types of data (e.g.,
only Internet Protocol data) and may introduce error or discard information by design or
unintentionally during operation.
4. Quantifying and Reducing Losses12
Because of the transient nature of evidence on a network, there is usually only one
opportunity to capture it, and it can be difficult to determine what information was not
collected. Although it may not be possible to infer the content of lost datagrams, it is
useful to quantify the percentage loss. Quantifying the amount of loss gives a sense of the
completeness of the logs and the resulting crime reconstruction. High losses during the
monitoring and collection phase translate to low level of certainty in the crime
reconstruction phase. Furthermore, quantification can help identify and minimize the
cause of data loss as demonstrated in Subsection 4.2.
12 The Snort and NetFlow data in this section were collected at Yale University, Information Security Office.

International Journal of Digital Evidence Summer 2002, Volume 1, Issue 2
4.1 Sniffer Losses
Resource limitations in a system can cause losses while capturing network traffic using a
sniffer. For instance, network-monitoring programs like tcpdump13, Snort14, and
NetWitness15 read network traffic that is buffered in memory by libpcap16. If the program
cannot read the data quickly enough, libpcap records this fact before discarding unread
packets to make space for new ones. The number of packets that were not read by the
packet capture program are reported by libpcap when the collection process is terminated
as shown here:17
# tcpdump -X host 192.168.12.5
tcpdump: listening on xl0
.....[data displayed on screen]…
^C
29451 packets received by filter
4227 packets dropped by kernel
In this instance, the high number of dropped packets was reduced by writing the data to a
file instead of displaying it on the screen as shown here:
# tcpdump -w tcpdump-042002 host 192.168.12.5
tcpdump: listening on xl0
^C
84446 packets received by filter
0 packets dropped by kernel
Like tcpdump, Snort displays the number of dropped packets reported by libpcap after the
process is terminated.
13 www.tcpdump.org 14 www.snort.org 15 www.forensicsexplorers.com 16 www.tcpdump.org 17 Unmodified Linux kernels do not provide information about dropped packets, in which case tcpdump will only show the number of received packets making it more difficult to quantify the loss.

International Journal of Digital Evidence Summer 2002, Volume 1, Issue 2
Snort analyzed 936893902 out of 1062045648 packets, dropping 125151746 (11.784%) packets
The percentage of packets dropped by one Snort system18 over a 74-day period on a
network that peaks regularly at 60 Mbits/second is shown in Figure 4. This chart
indicates that the number of packets missed by Snort increases with total traffic.19 The
high percentage losses at low traffic levels may be due to higher than normal loads on the
collection system.
0
5
10
15
20
25
30
0 500000000 1E+09 1.5E+09 2E+09 2.5E+09
Total packets captured by libpcap
Perc
enta
ge lo
ss
Figure 4: High losses in Snort correspond to higher total number of packets
captured by libpcap
18 A standard desktop computer with a Pentium processor, 100Mbit network interface card and 256MB RAM, running FreeBSD. 19 These losses do not include packets dropped by the network interface card as will be discussed later in this section. In this instance, the losses in the network interface card are negligible in comparison to the losses in the kernel.

International Journal of Digital Evidence Summer 2002, Volume 1, Issue 2
These results suggests that a more powerful machine is required to run Snort on this
network.
4.2 NetFlow Losses
NetFlow logs contain basic information relating to each flow that passes through a router
such as source and destination IP addresses, duration of flows, and amount of data
transferred. Like syslog, NetFlow uses UDP to transfer information from routers to
remote logging systems. NetFlow datagrams contain sequence numbers to help determine
when log entries have been lost in transit. For instance, the following output shows no
losses when the network is lightly loaded at 05:00 but high losses when the network is
heavily loaded at 18:30.
% flow-header < ft-v05.2002-04-15.0500-0400 # mode: normal # capture hostname: flow # exporter IP address: 130.132.1.100 # capture start: Mon Apr 15 05:00:00 2002 # capture end: Mon Apr 15 05:15:00 2002 # capture period: 900 seconds # compress: on # byte order: big # stream version: 3 # export version: 5 # lost flows: 0 # corrupt packets: 0 # sequencer resets: 0 # capture flows: 199830 % flow-header < ft-v05.2002-04-15.183000-0400 # mode: normal # capture hostname: flow # exporter IP address: 130.132.1.100 # capture start: Mon Apr 15 18:30:00 2002 # capture end: Mon Apr 15 18:45:00 2002 # capture period: 900 seconds # compress: on # byte order: big # stream version: 3 # export version: 5 # lost flows: 179520 # corrupt packets: 0 # sequencer resets: 1 # capture flows: 206760

International Journal of Digital Evidence Summer 2002, Volume 1, Issue 2
In an effort to identify the cause of the high losses, the number of lost NetFlow log
entries was tracked over a four-day period in 15 minute intervals and is plotted in Figure
5. The peak losses occurred between 14:45 and 16:45 each day, which corresponds with
times of peak inbound traffic for the network. Zero losses occurred between 04:30 and
07:00, corresponding with times of low network usage. More notably, the number of
captured flows never exceeded 219090 flows in any 15 minute interval, indicating that
some limiting factor was causing the large losses.
The limiting factor turned out to be a rate-limiting device called a Packeteer that was
unintentionally restricting the NetFlow UDP traffic between the router and collector. The
rate-limiting was removed and losses over another four-day period are plotted in Figure
6, showing significant reduction in losses (predominantly zero) and increase in the total
number of captured flows. This example demonstrates that uncertainty can be introduced
in unexpected ways on a network.

International Journal of Digital Evidence Summer 2002, Volume 1, Issue 2
NetFlow: Captured and Lost Flows
050000
100000150000200000250000300000350000400000450000
0 20 40 60 80 100
Hours
Flow
s lost flowscaptured flows
Figure 5: Captured and lost flows between Apr 15 00:00 – Apr 18 20:15, 2002. High
losses in NetFlow correspond to higher traffic loads between 14:45 and 16:45 each
day

International Journal of Digital Evidence Summer 2002, Volume 1, Issue 2
NetFlow: Captured and Lost Flows
0
100000
200000
300000
400000
500000
600000
0 20 40 60 80 100
Hours
Flow
s lost flowscaptured flows
Figure 6: Captured and lost flows between May 9, 21:45 – May 13 17:45, 2002.
Losses are significantly reduced after limiting factor (Packeteer rule) was removed.
In this situation, the NetFlow collector was running on a Sun Netra system that was not
physically close to the router. The losses could be further reduced by connecting the
collector directly to the router using a dedicated interface thus eliminating the physical
distance and shared bandwidth that can cause UDP datagrams to be dropped. Connecting
the NetFlow collector directly to the router would have the added benefit of reducing the
potential for loading error.20 Using a more powerful computer may also reduce the losses
if the processor or disk access speeds are limiting factors.
20 Exporting NetFlow logs from a router through one of its existing interfaces consumes bandwidth that interferes with the transmission of other data passing through the router, thus introducing loading error.

International Journal of Digital Evidence Summer 2002, Volume 1, Issue 2
4.3 Network Interface Losses
Some communication devices have Control/Status Registers that record the number of
dropped datagrams and packets. For instance, Universal Asynchronous
Receiver/Transmitter (UART) devices such as modems and network interface cards
(NIC) have registers that are updated each time the device encounters a problem with a
datagram. One manufacturer provides the following information about interface errors,
including datagrams lost due to receiver overruns a.k.a. FIFO overruns (NX Networks,
1997).
• packet too long or failed, frame too long: "The interface received a packet that is larger than the maximum size
of 1518 bytes for an Ethernet frame."
• CRC error or failed, FCS (Frame Check Sequence) error: "The interface received a packet with a CRC error."
• Framing error or failed, alignment error: "The interface received a packet whose length in bits is not a multiple of
eight."
• FIFO Overrun: "The Ethernet chipset is unable to store bytes in the local packet buffer as fast as they come off
the wire."
• Collision in packet: "Increments when a packet collides as the interface attempts to receive a packet, but the
local packet buffer is full. This error indicates that the network has more traffic than the interface can handle."
• Buffer full warnings: "Increments each time the local packet buffer is full."
• Packet misses: "The interface attempted to receive a packet, but the local packet buffer is full. This error
indicates that the network has more traffic than the interface can handle."
Many network interface cards also have a register that indicates how many datagrams
were captured by the device but were not read by the system. Figure 7 depicts these
losses when tcpdump is used.

International Journal of Digital Evidence Summer 2002, Volume 1, Issue 2
Figure 7: Potential losses when monitoring/capturing network traffic using tcpdump
In Figure 7, when the Ethernet card’s buffer is full and is unable to capture a datagram
from the Ethernet cable, an error is generated and stored in a Control/Status Register on
the card (receiver overruns = datagrams on the wire – datagrams captured by NIC). If
libpcap does not read packets from the NIC’s buffer quickly enough, each unread packet
is recorded as a dropped packet by the NIC (dropped packets = packets available on NIC
– packets read by libpcap; reported by netstat or ifconfig). When an application such as
tcpdump does not process packets stored by libpcap quickly enough, each unread packet
is recorded as a dropped packet by libpcap as shown in Subsection 4.1 (dropped packets
= packets read by libpcap – packets read by tcpdump).
Some system kernels display receiver overruns based on Control/Status Register values
in Ethernet cards. For example, on Linux systems netstat and ifconfig can be used to

International Journal of Digital Evidence Summer 2002, Volume 1, Issue 2
display data in network structures including receiver overruns.21 Output of these
commands on a Linux machine is shown below with receiver overruns in bold (also
viewable using cat /proc/net/dev).
% netstat -nid Kernel Interface table Iface MTU Met RX-OK RX-ERR RX-DRP RX-OVR TX-OK TX-ERR TX-DRP TX-OVR Flg eth0 1500 0 19877416 0 0 128 7327647 0 0 0 BRU % /sbin/ifconfig eth0 Link encap:Ethernet HWaddr 00:B0:D0:F3:CB:B5 inet addr:128.36.232.10 Bcast:128.36.232.255 Mask:255.255.255.0 UP BROADCAST RUNNING MULTICAST MTU:1500 Metric:1 RX packets:19877480 errors:0 dropped:0 overruns:128 frame:0 TX packets:7327676 errors:0 dropped:0 overruns:0 carrier:1 collisions:442837 txqueuelen:100 Interrupt:23 Base address:0xec80
Similar information is available on network devices such as switches, routers and
firewalls. The following output obtained from a PIX firewall using the show interface
command gives a significant amount of error information, including overruns.
# show inter interface ethernet0 "outside" is up, line protocol is up Hardware is i82557 ethernet, address is 00a0.c5d1.35d3 IP address 192.168.12.15, subnet mask 255.255.255.0 MTU 1500 bytes, BW 100000 Kbit full duplex 1600481967 packets input, 4258033917 bytes, 1172 no buffer Received 969256 broadcasts, 0 runts, 0 giants 3 input errors, 3 CRC, 0 frame, 0 overrun, 3 ignored, 0 abort 1974900124 packets output, 1524603379 bytes, 12 underruns 0 output errors, 0 collisions, 0 interface resets 0 babbles, 0 late collisions, 0 deferred 0 lost carrier, 0 no carrier input queue (curr/max blocks): hardware (128/128) software (0/129) output queue (curr/max blocks): hardware (0/128) software (0/167)
Although it may not be feasible to prevent such errors, it is important to document them
when collecting evidence. For instance, when network traffic is being monitored through
a spanned port on a switch, the interface on some switches can be polled for errors when
21 FreeBSD, Solaris, and other versions of Unix do not report receiver overruns in the netstat or ifconfig output but this and other information about network interfaces can be obtained using SNMP. For instance, information about interfaces on FreeBSD can be obtained using snmpwalk and snmpnetstat in net-snmp distribution (e.g., snmpwalk localhost public interfaces.ifTable.ifEntry)

International Journal of Digital Evidence Summer 2002, Volume 1, Issue 2
the capture is complete. Additionally, errors on the collection system’s network interface
card can be similarly documented. Presumably these losses will be negligible unless the
system is malfunctioning but documenting the errors or lack thereof will help establish
this fact.
5. Errors in Reconstruction and Interpretation
Given the complexity of networked systems, large amounts of data, and occurrence of
evidence dynamics22 there is a high potential for mistakes and misinterpretations in the
analysis phase of an investigation. Tools exist to help us process and examine the vast
amounts of data common in network investigations but these tools add another layer of
abstraction and are useful only when sufficient data are obtained and the meaning of the
data are understood. Windows Event Log analysis provides a useful example of how
analysis tools can introduce errors. To facilitate analysis of Windows NT Event Logs,
many examiners dump the log entries into a text file using dumpel or dempevt. Although
dempevt presents more information than dumpel, it can incorrectly interpret date/time
stamps after one hour is inserted for daylight savings time. The output from dempevt fails
to correct for the time change and represents times prior to daylight savings one hour off
(Casey, 2001).
Uncertainty in origin can also lead to interpretation error, as was demonstrated when a
pharmaceutical company in the United Kingdom relied on a forged “From” e-mail header
(C1) to accuse a researcher in the United States of purposefully sending a virus to several
22 Evidence dynamic is any influence that changes, relocates, obscures, or obliterates evidence, regardless of intent, between the time evidence is transferred and the time the case is adjudicated (Chisum, Turvey 2000), (Casey 2001)

International Journal of Digital Evidence Summer 2002, Volume 1, Issue 2
e-mail accounts that had been targeted by extreme animal rights groups in the past. By
examining the “Received” headers (C2) of the offending e-mail messages, investigators
located the computer that was used to send the messages. The computer was a public
workstation that the accused researcher did not remember using. Investigators found that
the computer was infected with the Sircam worm – the worm had evidently obtained the
pharmaceutical company’s e-mail addresses from a Web page in the browser cache and
forged a message to these accounts, making it appear to come from the researcher’s e-
mail address. The Sircam worm was spreading itself to others in a similar manner,
weakening the already feeble theory that the research purposefully targeted the
pharmaceutical company.
A more subtle example of interpretation error arose in a case of an employee suspected of
downloading several pornographic files to disk, creating shortcuts on the desktop to
several pornographic sites, and adding several Favorite items to the Internet Explorer
Web browser. The employee denied all knowledge of these items. An analysis of the
Web sites that were viewed by the employee at the time in question helped examiners
determine that one site exploited a vulnerability in Internet Explorer (Microsoft, 1999)
and created the offending items on the computer. Although the suspect’s online behavior
did not cross the criminal threshold, it was sufficiently reprehensible to justify his
termination.
There are many potential interpretation errors that can occur when tracing a logged event
back to its source. Locating a computer intruder, for instance, often begins with an IP

International Journal of Digital Evidence Summer 2002, Volume 1, Issue 2
address in a log file. However, relying on information from only one source can result in
the wrong IP address.
In one Web defacement case, a system administrator asserted that a specific individual
was responsible because he was the only person logged into the Web server at the time of
the defacement. However, this conclusion was based on one log file – the wtmp log (C3)
on a Unix machine that shows when user accounts logged on and off. A thorough
examination of other log files on the system showed the following:
1) The tcpwrappers log showed an FTP connection from a PC to the Web server
shortly before the page was defaced
2) The Web server access log showed the defaced page being viewed from several
PCs shortly after the defacement
These supporting log entries (C4) were used to locate the general source of the attack – a
shared apartment – and personal interviews of the reduced suspect pool led to the vandal.
The original suspect was not involved and, even if the initial suspect's account had been
used to deface the Web page, this does not necessarily imply that the account owner was
responsible. A wtmp entry does not necessarily indicate that the user logged in at a given
time since it is possible that someone else used the individual’s account.
Once there is a high degree of certainty that a given IP address is the actual origin of the
attack, the responsible ISP is contacted for subscriber information. In one intrusion case,

International Journal of Digital Evidence Summer 2002, Volume 1, Issue 2
an ISP became very concerned when an intrusion appeared to originate from one of their
employees. It transpired that the IP address had been transcribed incorrectly in the
subpoena. The intrusion was actually committed using a Californian subscriber’s account.
However, the subscriber’s password had been stolen and used by the intruder without her
knowledge, making it more difficult to identify the offender. Fortunately, the ISP used
Automatic Number Identification (ANI), allowing the investigators to determine the
originating phone number in Texas for each connection to the compromised systems.
Although the phone number led to the intruder in this case, ANI information is not
always conclusive since someone could have broken into the individual’s home computer
and used it as a launching pad for attacks.
Even when an examiner understands the meaning of a given log entry, interpretation
errors can result when the possibility of a wily offender is ignored. It is not uncommon
for computer intruders to fabricate log entries to give a false origin of attack. Therefore,
forensic examiners should always entertain the possibility that a sophisticated attacker in
one location has staged a crime scene to make it appear to be an unsophisticated intruder
in a different location.
Mistakes in interpretation and analysis can be reduced by rigorous application of the
scientific method – performing exhaustive investigation and research, questioning all
assumptions, and developing a theory that explains the facts. Even if a forensic examiner
has a high degree of confidence in his/her assumptions, potential errors and alternate
explanations should be explored and eliminated or at least documented as unlikely. If a

International Journal of Digital Evidence Summer 2002, Volume 1, Issue 2
forensic examiner has complete confidence in his/her conclusions, this is usually an
indication that he/she is missing something – there is always uncertainty and all
assertions should be qualified accordingly as discussed in Subsection 2.3.
6. Case Example23
On 04/23/02, an organization found that a server containing sensitive information had
been compromised. Although there were no unusual logon entries in the wtmp log (C3),
the contents of the root account’s command history file (/.sh_history) gave a sense of
what the intruder was doing on a system.
# cat /.sh_history mkdir nisplus cd nisplus mkdir /dev/pts/01 w cp /lib/boot/uconf.inv /dev/pts/01 wget ftp://ftp.uu.net/tmp/genocide-AIX-000DC06D4C00-20020419.tar.gz gzip -dc *|tar -xvf - ./setup telnet 192.168.34.30 4580 TERM=xterm export TERM rm -rf /tmp/.new telnet 192.168.34.30 4580
Although the filename appears to contain a date 20020419, all of the information in the
command history file has a high temporal uncertainty (C2) because it does not have
date/time stamps associated with each entry. Also, although this log contains the host
ftp.uu.net, it is unlikely that this is the origin of the initial intrusion.
The ctime of the /dev/pts/01 directory shown in the .sh_history file suggests April 23 as a
date, but this is not necessarily the time that the directory was created as on a Windows
23 Some hostnames and IP addresses in this example have been modified to protect the innocent

International Journal of Digital Evidence Summer 2002, Volume 1, Issue 2
system.24 Misinterpreting the inode ctime as the creation time can lead to errors in
analysis.
# ls -latc /dev/pts/ total 24 crw--w--w- 1 user staff 27, 1 Apr 23 15:40 1 crw--w--w- 1 root system 27, 4 Apr 23 15:40 4 crw--w--w- 1 user staff 27, 0 Apr 23 15:35 0 crw--w--w- 1 user staff 27, 3 Apr 23 15:34 3 crw--w--w- 1 user staff 27, 2 Apr 23 15:31 2 drwxr-xr-x 2 root system 512 Apr 23 15:22 01
The ctime of the /dev/pts/01/uconf.inv file shown in the .sh_history suggests that the
intruder copied this rootkit configuration file on April 21 at 22:25.
# ls -latc /dev/pts/01 | head -5 total 48 drwxr-xr-x 2 root system 512 Apr 23 15:22 . -rwxr-xr-x 1 root system 4675 Apr 23 15:22 a.out -rw-r--r-- 1 root system 85 Apr 23 15:22 foo.c -rw-r--r-- 1 root system 437 Apr 21 22:25 uc nf.inv odrwxr-xr-x 3 root system 3584 Apr 21 22:23 ..
A search for other files created on April 21 supports the hypothesis that the entries in the
.sh_history file were from April 21 between 22:25 and 22:36 (genocide-AIX-
000DC06D4C00-20020419.tar.gz).
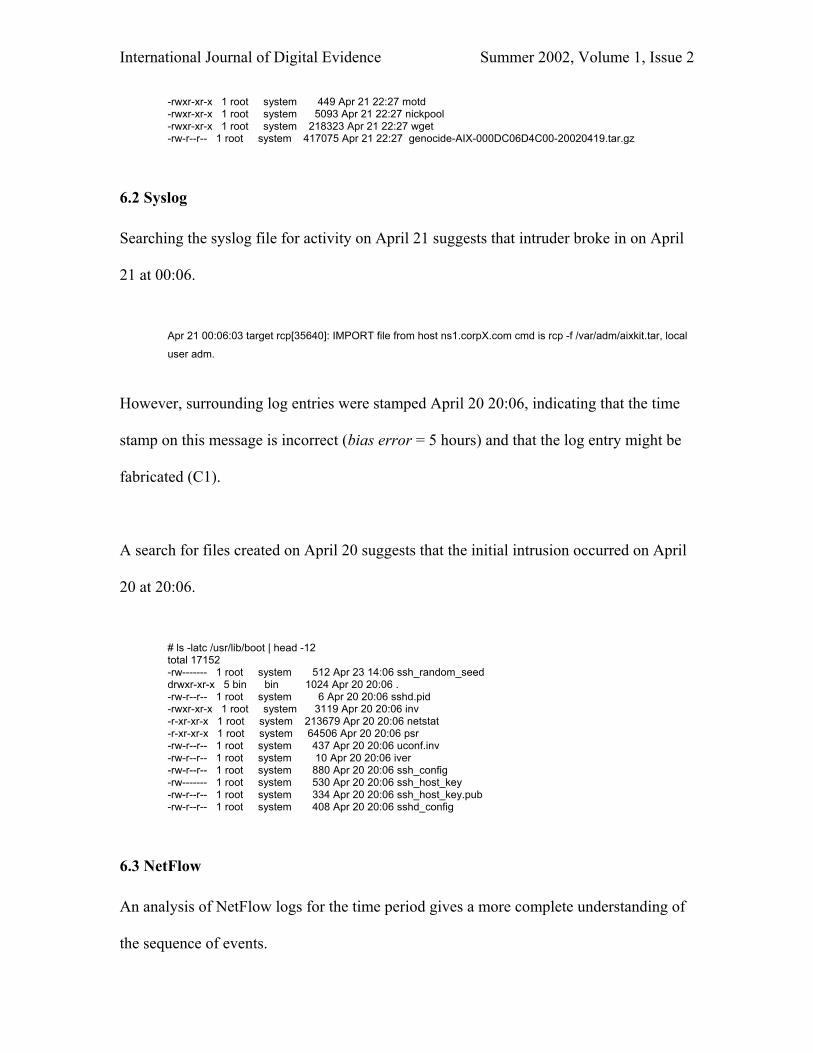
# ls -latc /usr/lib/security/nisplus | head -22 total 3016 drwxr-xr-x 3 root system 1024 Apr 23 14:00 . -rw------- 1 root system 24099 Apr 23 14:00 drone2.dat -rw-r--r-- 1 root system 91 Apr 23 14:00 servers -rw-r--r-- 1 root system 0 Apr 21 22:36 identd -rw-r--r-- 1 root system 6 Apr 21 22:35 pid.drone -rw-r--r-- 1 root system 1769 Apr 21 22:35 cront -rwxr-xr-x 1 root system 1472 Apr 21 22:35 droneload -rw-r--r-- 1 root system 3 Apr 21 22:35 binname -rw-r--r-- 1 root system 6 Apr 21 22:35 nick -rw-r--r-- 1 root system 5 Apr 21 22:35 port -rw-r--r-- 1 root system 5 Apr 21 22:35 user -rw-r--r-- 1 root system 15 Apr 21 22:35 vhost -rw-r--r-- 1 root system 14 Apr 21 22:35 realname -rw-r--r-- 1 root system 6 Apr 21 22:34 ircnick -rwxr-xr-x 1 root system 769266 Apr 21 22:29 sh -rw-r--r-- 1 root system 805 Apr 21 22:27 drone.dat -rwxr-xr-x 1 root system 449 Apr 21 22:27 geno.ans -rwxr-xr-x 1 root system 455 Apr 21 22:27 loader
24 In this instance, the ctime was probably updated when files were added to the directory.
International Journal of Digital Evidence Summer 2002, Volume 1, Issue 2
-rwxr-xr-x 1 root system 449 Apr 21 22:27 motd -rwxr-xr-x 1 root system 5093 Apr 21 22:27 nickpool -rwxr-xr-x 1 root system 218323 Apr 21 22:27 wget -rw-r--r-- 1 root system 417075 Apr 21 22:27 genocide-AIX-000DC06D4C00-20020419.tar.gz
6.2 Syslog
Searching the syslog file for activity on April 21 suggests that intruder broke in on April
21 at 00:06.
Apr 21 00:06:03 target rcp[35640]: IMPORT file from host ns1.corpX.com cmd is rcp -f /var/adm/aixkit.tar, local
user adm.
However, surrounding log entries were stamped April 20 20:06, indicating that the time
stamp on this message is incorrect (bias error = 5 hours) and that the log entry might be
fabricated (C1).
A search for files created on April 20 suggests that the initial intrusion occurred on April
20 at 20:06.
# ls -latc /usr/lib/boot | head -12 total 17152 -rw------- 1 root system 512 Apr 23 14:06 ssh_random_seed drwxr-xr-x 5 bin bin 1024 Apr 20 20:06 . -rw-r--r-- 1 root system 6 Apr 20 20:06 sshd.pid -rwxr-xr-x 1 root system 3119 Apr 20 20:06 inv -r-xr-xr-x 1 root system 213679 Apr 20 20:06 netstat -r-xr-xr-x 1 root system 64506 Apr 20 20:06 psr -rw-r--r-- 1 root system 437 Apr 20 20:06 uconf.inv -rw-r--r-- 1 root system 10 Apr 20 20:06 iver -rw-r--r-- 1 root system 880 Apr 20 20:06 ssh_config -rw------- 1 root system 530 Apr 20 20:06 ssh_host_key -rw-r--r-- 1 root system 334 Apr 20 20:06 ssh_host_ke .pub y-rw-r--r-- 1 root system 408 Apr 20 20:06 sshd_config
6.3 NetFlow
An analysis of NetFlow logs for the time period gives a more complete understanding of
the sequence of events.

International Journal of Digital Evidence Summer 2002, Volume 1, Issue 2
• On 04/20 between 18:55 and 19:11, there was an automated scan from
alcor.hknet.cz of the entire network for vulnerable FTP servers.
• On 04/20 between 20:11:39 and 20:12:13, an individual using alcor.hknet.cz
gained unauthorized access to the target system via a vulnerability in the FTP
server. The intruder downloaded data to the compromised system from
ns1.corpX.com apparently using rcp (port 514) as suggested in the questioned
syslog entry:
Start End SrcIPaddress SrcP DstIPaddress DstP P Fl Pkts Octets 0420.20:11:39.737 0420.20:11:42.861 192.168.34.30 21 195.113.115.170 4113 6 6 2 84 0420.20:11:39.873 0420.20:11:41.33 192.168.34.30 21 195.113.115.170 4113 6 1 11 2776 0420.20:11:43.890 0420.20:11:43.890 192.168.34.30 21 195.113.115.170 4123 6 2 1 44 0420.20:11:44.22 0420.20:11:49.186 192.168.34.30 21 195.113.115.170 4123 6 0 10 2762 0420.20:11:51.110 0420.20:11:51.110 192.168.34.30 0 17.16.103.2 2048 1 0 1 1500 0420.20:11:51.110 0420.20:12:13.210 192.168.34.30 1023 17.16.103.2 514 6 3 283 11364
• On 04/21 between 22:27 and 22:30 an intruder accessed a hacked SSH server on
port 38290 of the compromised system from Seoul National Polytechnic
University (203.246.80.143).
• On 04/21 between 22:33:04 and 22:33:09, the intruder downloaded and installed
an IRC bot from ftp.uu.net (192.48.96.9) as recorded in the .sh_history file and
installed the bot a few minutes later. The intruder returned several times through
the hacked SSH server on port 38290:
Start End SrcIPaddress SrcP DstIPaddress DstP P Fl Pkts Octets 0421.22:27:48.2 0421.22:27:48.2 192.168.34.30 0 203.246.80.143 2048 1 0 1 1500 0421.22:27:48.2 0421.22:27:48.2 192.168.34.30 38290 203.246.80.143 1022 6 2 1 44 0421.22:28:28.294 0421.22:28:36.118 192.168.34.30 38290 203.246.80.143 1022 6 0 13 1272 0421.22:30:56.229 0421.22:31:24.781 192.168.34.30 38290 203.246.80.143 1022 6 0 32 2032 0421.22:33:04.694 0421.22:33:09.170 192.168.34.30 35334 192.48.96.9 21 6 7 19 901 0421.22:33:04.694 0421.22:33:04.694 192.168.34.30 0 192.48.96.9 2048 1 0 1 1500 0421.22:34:17.123 0421.22:34:18.443 192.168.34.30 38290 203.246.80.143 1022 6 0 7 908 0421.22:37:38.798 0421.22:37:38.798 192.168.34.30 0 203.246.80.143 2048 1 0 1 1500 0421.22:45:59.949 0421.22:46:00.205 192.168.34.30 38290 203.246.80.143 1022 6 1 4 200

International Journal of Digital Evidence Summer 2002, Volume 1, Issue 2
In summary, log files and file system information on the compromised host gave a sense
of when the attack occurred but have low levels of certainty (C1 – C3). The reliability of
the data is questionable because the clock on the compromised system was approximately
5 minutes slow giving all timestamps a bias error of -5 minutes. Also, the intruder gained
root access and had the ability to change any information on the system and one relevant
syslog entry had a bias error of +5 hours. Additionally, the origin of the attack was not
evident from information on the host. In fact, information on the host could have led
investigators to incorrectly assume that ftp.uu.net or ns1.corpX.com.
NetFlow logs give a more complete overview of events but a significant amount of data
was not being collected at the time of the intrusion due to the losses shown in Figure 5.
Therefore, although the NetFlow logs have more accurate date/time stamps, the
information associated with each NetFlow entry has some degree of uncertainty due to
the high losses (C4). Also, the NetFlow logs indicate that the attack was launched from
alcor.hknet.cz but did not indicate where the intruder was physically located. It is likely
that the intruder was not proximate to the computer used to launch the attack, further
supported by the later connections from Korea. Of course, there could be multiple
attackers in different countries – the point is that there is a degree of uncertainty
regarding the intruder’s physical location and other aspects of the intrusion that would
need to be addressed through further investigation.

International Journal of Digital Evidence Summer 2002, Volume 1, Issue 2
Notably, if the system clocks on both the router and compromised host had not been
documented, the bias error could be inferred from the data, and the discrepancy could be
documented by stating that all timestamps have an uncertainty of +/- 5 minutes (within
some level of confidence). This would not significantly alter the conclusions in the report
regarding the origin and time of the intrusion but would help readers understand
discrepancies and generate subpoenas for the attacking system. For instance, if the
subpoena asked for subscriber information and only provided a specific time (Apr 20
20:06 EST) rather than a range of time (Apr 20 20:01 - 20:17), the incorrect subscriber
information might be given.
7. Summary and Conclusions
Each layer of abstraction on a network provides a new opportunity for error. The origin
and time of events can be uncertain, errors can occur in logging applications, system
limitations can exacerbate data loss, individuals can conceal or fabricate evidence, and
mistakes can occur in data presentation and analysis. At the same time, networks provide
many opportunities from a forensic standpoint. One of the advantages of networks as a
source of evidence is that a single event leaves traces on multiple systems. Therefore, it is
possible to compare traces from different systems for consistency and it is difficult for
criminals to destroy or alter all digital traces of their network activities.
To reduce the incidence of incorrect conclusions based on unreliable or inaccurate data it
is necessary to quantify uncertainty and correct for it whenever possible. In addition to
using corroborating data from multiple, independent sources, forensic examiners should
attempt to rate their level of confidence in the relevant digital evidence. A practical

International Journal of Digital Evidence Summer 2002, Volume 1, Issue 2
approach to categorizing uncertainty in digital data was proposed in Subsection 2.3, and
numerous examples were given. Using this type of systematic method to qualify
conclusions helps decision makers assess the reliability of the information they are being
given and anticipates the challenges that will be raised in courts as attorneys become
more familiar with digital evidence. Describing measures taken to document and
minimize loss of data can further raise the confidence in evidence collected from a
network.
Even when uncertainty is addressed, completely reliable sources of digital evidence do
not exist and digital data is circumstantial at best, making it difficult to implicate an
individual directly with digital data alone. Therefore, it is generally necessary to seek
firmer proof such as confessions, video surveillance, or physical evidence to overcome
the inherent uncertainty of digital evidence.25 The amount of supporting evidence that is
required depends on the reliability of the available digital evidence.
Ultimately, abiding by the scientific method will help forensic examiners to avoid
egregious errors. Carefully exploring potential sources of error, hypothesis testing, and
qualifying conclusions with appropriate uncertainty will protect forensic examiners from
overstating or misinterpreting the facts.
Acknowledgements
I am grateful to Professor James Casey at the University of California, Berkeley for a
critical reading of the manuscript and for introducing me to the Fujita Tornado scale, 25 Some video surveillance is stored in digital form and is subject to the uncertainties of any other digital data. Time stamps can be incorrect, the content is mutable, and the examiner’s analysis can be incorrect.

International Journal of Digital Evidence Summer 2002, Volume 1, Issue 2
which guided my thinking about rating uncertainty. Thanks to Andrew Fisher for a
fruitful discussion regarding statistical analysis of uncertainty in evidence. Thanks also to
my colleagues at Yale University for their insights and assistance, especially H. Morrow
Long and Andy Newman for their technical clarifications, and the Data Network
Operations staff.
References
Beckwith, T. G., Marangoni, & R. D., Lienhard, J. H. (1993). Mechanical Measurements
5th Ed., Reading MA: Addison Wesley
Casey, E. (2000). Digital Evidence and Computer Crime: Forensic Science, Computers,
and the Internet, London: Academic Press
Casey, E. (2001). Handbook of Computer Crime Investigation: Forensic Tools and
Technology, London: Academic Press
CERT (1999). Trojan horse version of TCP Wrappers, CERT Advisory CA-1999-01
[online]. Available: http://www.cert.org/advisories/CA-1999-01.html
Chisum,W. J., & Turvey, B. (2000). Evidence dynamics: Locard’s Exchange Principle
and crime reconstruction, Journal of Behavioral Profiling, Vol. 1, No. 1, 25. Retrieved
May 31, 2002 from http://www.profiling.org/
Cisco (2000). NetFlow services and applications whitepaper [online]. Available:
http://www.cisco.com/warp/public/cc/pd/iosw/ioft/neflct/tech/napps_wp.htm.
Daubert v. Merrell Dow Pharaceutical, Inc (1993) 113 S. Ct. 2786
Microsoft (1999), Vulnerability in "ImportExportFavorites", Knowledge Base Article ID:
Q241438 [online]. Available:
http://support.microsoft.com/support/kb/articles/Q241/4/38.ASP

International Journal of Digital Evidence Summer 2002, Volume 1, Issue 2
NX Networks (1997), LAN/WAN Interface Guide [online]. Available:
http://www.nxnetworks.com/Docs/software_documentation/openroute_21/lanwan/ethmo
n4.htm
Palmer, G. (2002), Forensic Analysis in the Digital World, IJDE, Volume 1, Issue 1.
Retrieved May 31, 2002 from http://www.ijde.org/gary_article.html
State of Missouri v. Dunn (1999). Retrieved May 31, 2002 from
http://www.missourilawyersweekly.com/mocoa/56028.htm
Stevens, S. W. (1994). TCP/IP Illustrated, Appendix B, Volume 1: The Protocols.
Addison Wesley.
Strong, J. W. (1992). McCormick on Evidence, section 294 (4th Ed.), West Wadsworth
Tan, J. (2001). Forensic Readiness, @Stake. Retrieved May 31, 2002 from
http://@stake.com/research/reports/index.html#forensic_readiness
The Fujita Scale (1999). The Tornado Project. Retrieved May 31, 2002 from
http://www.tornadoproject.com/fujitascale/fscale.htm
© 2002 International Journal of Digital Evidence
About the Author
Eoghan Casey ([email protected]) is System Security Administrator at Yale
University where he investigates computer intrusions, cyberstalking reports, and other
computer-related crimes, and assists in the research and implementation of university
wide security solutions. He is the author of Digital Evidence and Computer Crime and
the editor of the Handbook of Computer Crime Investigation. Mr. Casey is also a partner
in Knowledge Solutions, LLC. Additional information about the author is available at

International Journal of Digital Evidence Summer 2002, Volume 1, Issue 2
http://www.corpus-delicti.com/eco/. The views expressed in this article are those of the
authors and do not necessarily reflect those of Yale University. Address correspondence
to: Eoghan Casey, 175 Whitney Ave., New Haven, CT 06520.