equity valuation: applications and processes...
TRANSCRIPT
1
CHAPTER 1
EQUITY VALUATION: APPLICATIONS
AND PROCESSES
LEARNING OUTCOMES
After completing this chapter, you will be able to do the following :
Defi ne valuation and intrinsic value and explain two possible sources of perceived mispricing. Explain the going - concern assumption, contrast a going concern to a liquidation value concept of value, and identify the defi nition of value most relevant to public company valuation. List and discuss the uses of equity valuation. Explain the elements of industry and competitive analysis and the importance of evaluat-ing the quality of fi nancial statement information. Contrast absolute and relative valuation models and describe examples of each type of model. Illustrate the broad criteria for choosing an appropriate approach for valuing a particular company.
1. INTRODUCTION
Every day, thousands of participants in the investment profession — investors, portfolio man-agers, regulators, researchers — face a common and often perplexing question: What is the value of a particular asset? The answers to this question usually determine success or failure in achieving investment objectives. For one group of those participants — equity analysts — the question and its potential answers are particularly critical, because determining the value of an ownership stake is at the heart of their professional activities and decisions. Valuation is the estimation of an asset ’ s value based on variables perceived to be related to future invest-ment returns, on comparisons with similar assets, or, when relevant, on estimates of immedi-ate liquidation proceeds. Skill in valuation is a very important element of success in investing.
•
•
••
•
•
c01.indd 1c01.indd 1 12/14/09 7:36:50 AM12/14/09 7:36:50 AM
COPYRIG
HTED M
ATERIAL
2 Equity Asset Valuation
In this introductory chapter, we address some basic questions: What is value? Who uses equity valuations? What is the importance of industry knowledge? How can the analyst effec-tively communicate his analysis? This chapter answers these and other questions and lays a foundation for the remainder of this book.
The balance of this chapter is organized as follows: Section 2 defi nes value and describes the various uses of equity valuation. Section 3 examines the steps in the valuation process, including a discussion of the analyst ’ s role and responsibilities. Section 4 discusses how valua-tion results are communicated and provides some guidance on the content and format of an effective research report. Section 5 summarizes the chapter, and practice problems conclude it.
2. VALUE DEFINITIONS AND VALUATIONAPPLICATIONS
Before summarizing the various applications of equity valuation tools, it is helpful to defi ne what is meant by value and to understand that the meaning can vary in different contexts. The context of a valuation, including its objective, generally determines the appropriate defi nition of value and thus affects the analyst ’ s selection of a valuation approach.
2.1. What Is Value?
Several perspectives on value serve as the foundation for the variety of valuation models avail-able to the equity analyst. Intrinsic value is the necessary starting point, but other concepts of value — going - concern value, liquidation value, and fair value — are also important.
2.1.1. Intrinsic Value A critical assumption in equity valuation, as applied to publicly traded securities, is that the market price of a security can differ from its intrinsic value . The intrinsic value of any asset is the value of the asset given a hypothetically complete understanding of the asset ’ s invest-ment characteristics. For any particular investor, an estimate of intrinsic value refl ects his or her view of the “ true ” or “ real ” value of an asset. If one assumed that the market price of an equity security perfectly refl ected its intrinsic value, valuation would simply require looking at the market price. Roughly, it is just such an assumption that underpins traditional effi cient market theory, which suggests that an asset ’ s market price is the best available estimate of its intrinsic value.
An important theoretical counter to the notion that market price and intrinsic value are identical can be found in the Grossman - Stiglitz paradox . If market prices, which are essen-tially freely obtainable, perfectly refl ect a security ’ s intrinsic value, then a rational investor would not incur the costs of obtaining and analyzing information to obtain a second esti-mate of the security ’ s value. If no investor obtains and analyzes information about a security, however, then how can the market price refl ect the security ’ s intrinsic value? The rational effi cient markets formulation (Grossman and Stiglitz 1980) recognizes that investors will not rationally incur the expenses of gathering information unless they expect to be rewarded by higher gross returns compared with the free alternative of accepting the market price. Furthermore, modern theorists recognize that when intrinsic value is diffi cult to determine, as is the case for common stock, and when trading costs exist, even further room exists for price to diverge from value (Lee, Myers, and Swaminathan 1999).
c01.indd 2c01.indd 2 12/14/09 7:36:51 AM12/14/09 7:36:51 AM
Chapter 1 Equity Valuation: Applications and Processes 3
Thus, analysts often view market prices both with respect and with skepticism. They seek to identify mispricing. At the same time, they often rely on price eventually converg-ing to intrinsic value. They also recognize distinctions among the levels of market effi ciency in different markets or tiers of markets (for example, stocks heavily followed by analysts and stocks neglected by analysts). Overall, equity valuation, when applied to market - traded securities, admits the possibility of mispricing. Throughout this book, then, we distinguish between the market price, P , and the intrinsic value ( “ value ” for short), V .
For an active investment manager, valuation is an inherent part of the attempt to produce investment returns that exceed the returns commensurate with the investment ’ s risk; that is, positive excess risk - adjusted return. An excess risk - adjusted return is also called an abnormal return or alpha . (Return concepts are more fully discussed in Chapter 2 .) The active investment manager hopes to capture a positive alpha as a result of his efforts to estimate intrinsic value. Any departure of market price from the manager ’ s estimate of intrinsic value is a perceived mispricing (a difference between the estimated intrinsic value and the market price of an asset).
These ideas can be illuminated through the following expression that identifi es two possible sources of perceived mispricing: 1
V E � P � ( V � P ) � ( V E � V )
where
V E � estimated value P � market price V � intrinsic value
This expression states that the difference between a valuation estimate and the prevailing market price is, by defi nition, equal to the sum of two components. The fi rst component is the true mispricing, that is, the difference between the true but unobservable intrinsic value V and the observed market price P (this difference contributes to the abnormal return). The second component is the difference between the valuation estimate and the true but unobser-vable intrinsic value, that is, the error in the estimate of the intrinsic value.
To obtain a useful estimate of intrinsic value, an analyst must combine accurate forecasts with an appropriate valuation model. The quality of the analyst ’ s forecasts, in particular the expectational inputs used in valuation models, is a key element in determining investment success. For an active security selection to be consistently successful, the manager ’ s expecta-tions must differ from consensus expectations and be, on average, correct as well.
Uncertainty is constantly present in equity valuation. Confi dence in one ’ s expectations is always realistically partial. In applying any valuation approach, analysts can never be sure that they have accounted for all the sources of risk refl ected in an asset ’ s price. Because compet-ing equity risk models will always exist, there is no obvious fi nal resolution to this dilemma. Even if an analyst makes adequate risk adjustments, develops accurate forecasts, and employs appropriate valuation models, success is not assured. Temporal market conditions may pre-vent the investor from capturing the benefi ts of any perceived mispricing. Convergence of the market price to perceived intrinsic value may not happen within the investor ’ s investment horizon, if at all. So, besides evidence of mispricing, some active investors look for the pres-ence of a particular market or corporate event ( catalyst ) that will cause the marketplace to reevaluate a company ’ s prospects.
1Derived as VE � P � VE � P � V � V � (V � P ) � (VE � V ).
c01.indd 3c01.indd 3 12/14/09 7:36:52 AM12/14/09 7:36:52 AM
4 Equity Asset Valuation
2.1.2. Going - Concern Value and Liquidation Value A company generally has one value if it is to be immediately dissolved and another value if it will continue in operation. In estimating value, a going - concern assumption is the assump-tion that the company will continue its business activities into the foreseeable future. In other words, the company will continue to produce and sell its goods and services, use its assets in a value - maximizing way for a relevant economic time frame, and access its optimal sources of fi nancing. The going - concern value of a company is its value under a going - concern assumption. Models of going - concern value are the focus of these chapters.
Nevertheless, a going - concern assumption may not be appropriate for a company in fi nancial distress. An alternative to a company ’ s going - concern value is its value if it were dis-solved and its assets sold individually, known as its liquidation value. For many companies, the value added by assets working together and by human capital applied to managing those assets makes estimated going - concern value greater than liquidation value (although a per-sistently unprofi table business may be worth more dead than alive). Beyond the value added by assets working together or by applying managerial skill to those assets, the value of a company ’ s assets would likely differ depending on the time frame available for liquidating them. For example, the value of nonperishable inventory that had to be immediately liqui-dated would typically be lower than the value of inventory that could be sold during a longer period of time, in an orderly fashion. Thus, concepts such as orderly liquidation value are sometimes distinguished.
2.1.3. Fair Market Value and Investment Value For an analyst valuing public equities, intrinsic value is typically the relevant concept of value. In other contexts, however, other defi nitions of value are relevant. For example, a buy - sell agreement among the owners of a private business — specifying how and when the owners (e.g., shareholders or partners) can sell their ownership interest and at what price — might be primarily concerned with equitable treatment of both sellers and buyers. In that context, the relevant defi nition of value would likely be fair market value. Fair market value is the price at which an asset (or liability) would change hands between a willing buyer and a will-ing seller when the former is not under any compulsion to buy and the latter is not under any compulsion to sell. Furthermore, the concept of fair market value generally includes an assumption that both buyer and seller are informed of all material aspects of the underlying investment. Fair market value has often been used in valuation related to assessing taxes. In a fi nancial reporting context — for example, in valuing an asset for the purpose of impair-ment testing — fi nancial reporting standards reference fair value , a related (but not identical) concept. 2
Assuming the marketplace has confi dence that the company ’ s management is acting in the owners ’ best interests, market prices should tend, in the long run, to refl ect fair market value. In some situations, however, an asset is worth more to a particular buyer (e.g., because of potential operating synergies). The concept of value to a specifi c buyer taking account of potential syner-gies and based on the investor ’ s requirements and expectations is called investment value .
2Accounting standards provide specifi c defi nitions of fair value. As of late 2008, the International Accounting Standards Board (IASB) is seeking to develop a single International Financial Reporting Standard on fair value measurement (see www.iasb.org for more information). The IASB is explicitly considering in its work the requirements of Statement of Financial Accounting Standards (SFAS) 157, which states (paragraph 5): “Fair value is the price that would be received to sell an asset or paid to transfer a liability in an orderly transaction between market participants at the measurement date.”
c01.indd 4c01.indd 4 12/14/09 7:36:52 AM12/14/09 7:36:52 AM
Chapter 1 Equity Valuation: Applications and Processes 5
2.1.4. Defi nitions of Value: Summary Analysts valuing an asset need to be aware of the defi nition or defi nitions of value relevant to the assignment. For the valuation of public equities, an intrinsic value defi nition of values is generally relevant. Intrinsic value, estimated under a going - concern assumption, is the focus of this equity valuation book.
2.2. Applications of Equity Valuation
Investment analysts work in a wide variety of organizations and positions; as a result, they apply the tools of equity valuation to address a range of practical problems. In particular, analysts use valuation concepts and models to accomplish the following:
Selecting stocks . Stock selection is the primary use of the tools presented in these chapters. Equity analysts continually address the same question for every common stock that is either a current or prospective portfolio holding, or for every stock that they are respon-sible for covering: Is this security fairly priced, overpriced, or underpriced relative to its current estimated intrinsic value and relative to the prices of comparable securities? Inferring ( extracting ) market expectations . Market prices refl ect the expectations of investors about the future performance of companies. Analysts may ask: What expectations about a company ’ s future performance are consistent with the current market price for that com-pany ’ s stock? What assumptions about the company ’ s fundamentals would justify the current price? ( Fundamentals are characteristics of a company related to profi tability, fi nancial strength, or risk.) These questions may be relevant to the analyst for several reasons:
The analyst can evaluate the reasonableness of the expectations implied by the market price by comparing the market ’ s implied expectations to his own expectations. The market ’ s expectations for a fundamental characteristic of one company may be use-ful as a benchmark or comparison value of the same characteristic for another company.
To extract or reverse - engineer a market expectation, the analyst selects a valuation model that relates value to expectations about fundamentals and is appropriate given the charac-teristics of the stock. Next, the analyst estimates values for all fundamentals in the model except the fundamental of interest. The analyst then solves for that value of the fundamen-tal of interest that results in a model value equal to the current market price.
Evaluating corporate events . Investment bankers, corporate analysts, and investment analysts use valuation tools to assess the impact of such corporate events as mergers, acquisitions, divestitures, spin - offs, and going - private transactions. ( Merger is the general term for the combination of two companies. An acquisition is also a combination of two companies, with one of the companies identifi ed as the acquirer, the other the acquired. In a divestiture , a company sells some major component of its business. In a spin - off , the company separates one of its component businesses and transfers the ownership of the separated business to its shareholders. A leveraged buyout is an acquisition involving signifi cant leverage [i.e., debt], which is often collateralized by the assets of the company being acquired.) Each of these events affects a company ’ s future cash fl ows and thus the value of its equity. Furthermore, in mergers and acquisitions, the company ’ s own common stock is often used as currency for the purchase; investors then want to know whether the stock is fairly valued. Rendering fairness opinions . The parties to a merger may be required to seek a fairness opin-ion on the terms of the merger from a third party, such as an investment bank. Valuation is central to such opinions.
•
•
•
•
•
•
c01.indd 5c01.indd 5 12/14/09 7:36:53 AM12/14/09 7:36:53 AM
6 Equity Asset Valuation
Evaluating business strategies and models . Companies concerned with maximizing shareholder value evaluate the effect of alternative strategies on share value. Communicating with analysts and shareholders . Valuation concepts facilitate communication and discussion among company management, shareholders, and analysts on a range of cor-porate issues affecting company value. Appraising private businesses . Valuation of the equity of private businesses is important for transactional purposes (e.g., acquisitions of such companies or buy - sell agreements for the transfer of equity interests among owners when one of them dies or retires) and tax report-ing purposes (e.g., for the taxation of estates) among others. The absence of a market price imparts distinctive characteristics to such valuations, although the fundamental models are shared with public equity valuation. An analyst encounters these characteristics when eval-uating initial public offerings, for example. An initial public offering (IPO) is the initial issuance of common stock registered for public trading by a company whose shares were not formerly publicly traded, either because it was formerly privately owned or government - owned, or because it is a newly formed entity. Share - based payment (compensation) . Share - based payments (e.g., restricted stock grants) are sometimes part of executive compensation. Estimation of their value frequently depends on using equity valuation tools.
•
•
•
•
3In this book, the shares of real companies are identifi ed by an abbreviation for the stock exchange or electronic marketplace where the shares of the company are traded, followed by a ticker symbol or formal acronym for the shares. For example, NASDAQ-GS stands for “Nasdaq Global Select Market,” and INTC is the ticker symbol for Intel Corporation on the NASDAQ-GS. (Many stocks are traded on a number of exchanges worldwide, and some stocks may have more than one formal acronym; we usu-ally state just one marketplace and one ticker symbol.)
EXAMPLE 1 - 1 Inferring Market Expectations
On 21 September 2000, Intel Corporation (NASDAQ - GS: INTC) 3 issued a press release containing information about its expected revenue growth for the third quarter of 2000. The announced growth fell short of the company ’ s own prior prediction by 2 to 4 percentage points and short of analysts ’ projections by 3 to 7 percentage points. In response to the announcement, Intel ’ s stock price fell nearly 30 percent during the following fi ve days — from $ 61.50 just prior to the press release to only $ 43.31 fi ve days later.
To assess whether the information in Intel ’ s announcement was suffi cient to explain such a large loss of value, Cornell (2001) estimated the value of a company ’ s equity as the present value of expected future cash fl ows from operations minus the expenditures needed to maintain the company ’ s growth. (We discuss such free cash fl ow models in detail in Chapter 4 .)
Using a conservatively low discount rate, Cornell estimated that Intel ’ s price before the announcement, $ 61.50, was consistent with a forecasted growth rate of 20 percent a year for the subsequent 10 years and then 6 percent per year thereafter. Intel ’ s price after the announcement, $ 43.31, was consistent with a decline of the 10 - year growth rate to well under 15 percent per year. In the fi nal year of the forecast horizon (2009), projected
c01.indd 6c01.indd 6 12/14/09 7:36:53 AM12/14/09 7:36:53 AM
Chapter 1 Equity Valuation: Applications and Processes 7
Example 1-1 describes the market reaction to an earnings release by Intel in 2000.A retrospective on Intel eight years later (in September 2008, the company ’ s share price was around $ 20) illustrates the diffi culty of equity valuation and the risk to growth stocks from disappointing results as compared to optimistic previous expectations. This example also illustrates that differences between market price and intrinsic value sometimes persist, offer-ing opportunities for the astute investment manager to generate alpha.
3. THE VALUATION PROCESS
In general, the valuation process involves the following fi ve steps:
1. Understanding the business . Industry and competitive analysis, together with an analysis of fi nancial statements and other company disclosures, provides a basis for forecasting com-pany performance.
2. Forecasting company performance . Forecasts of sales, earnings, dividends, and fi nancial posi-tion (pro forma analysis) provide the inputs for most valuation models.
revenues with the lower growth rate would be $ 50 billion below the projected revenues based on the preannouncement price. Because the press release did not obviously point to any changes in Intel ’ s fundamental long - run business conditions (Intel attributed the quarterly revenue growth shortfall to a cyclical slowing of demand in Europe), Cornell ’ s detailed analysis left him skeptical that the stock market ’ s reaction could be explained in terms of fundamentals.
Assuming Cornell ’ s methodology was sound, one interpretation is that investors ’ reaction to the press release was irrational. An alternative interpretation is that Intel ’ s stock was overvalued prior to the press release, and the press release was “ a kind of cat-alyst that caused movement toward a more rational price, even though the release itself did not contain suffi cient long - run valuation information to justify that movement ” (Cornell 2001, 134). How could one evaluate these two possible interpretations?
Solution : To evaluate whether the market reaction to Intel ’ s announcement was an irrational reaction or a rational reduction of a previously overvalued price, one could compare the expected 20 percent growth implicit in the preannouncement stock price to some benchmark — for example, the company ’ s actual recent revenue growth, the industry ’ s recent growth, and/or forecasts for the growth of the industry or the economy. Finding the growth rate implied in the company ’ s stock price is an exam-ple of using a valuation model and a company ’ s actual stock price to infer market expectations.
Note : Cornell (2001) observed that the 20 percent revenue growth rate implied by the preannouncement stock price was much higher than Intel ’ s average growth rate during the previous fi ve years, which occurred when the company was much smaller. He con-cluded that Intel ’ s stock was overvalued prior to the press release.
c01.indd 7c01.indd 7 12/14/09 7:36:54 AM12/14/09 7:36:54 AM
8 Equity Asset Valuation
3. Selecting the appropriate valuation model. Depending on the characteristics of the company and the context of valuation, some valuation models will be more appropriate than others.
4. Converting forecasts to a valuation . Beyond mechanically obtaining the output of valuation models, estimating value involves judgment.
5. Applying the valuation conclusions . Depending on the purpose, an analyst may use the valuation conclusions to make an investment recommendation about a particular stock, provide an opinion about the price of a transaction, or evaluate the economic merits of a potential strategic investment.
Most of these steps are addressed in detail in the ensuing chapters; here, we provide an over-view of each.
3.1. Understanding the Business
To forecast a company ’ s fi nancial performance that will, in turn, determine the value of an investment in the company or its securities, it is helpful to understand the economic and industry context in which the company operates, the company ’ s strategy, and the company ’ s previous fi nancial performance. Industry and competitive analysis, together with an analysis of the company ’ s fi nancial reports, provides a basis for forecasting performance.
3.1.1. Industry and Competitive Analysis Because similar economic and technological factors typically affect all companies in an indus-try, industry knowledge helps analysts understand the basic characteristics of the markets served by a company and the economics of the company. An airline industry analyst will know that labor costs and jet fuel costs are the two largest expenses of airlines, and that in many mar-kets airlines have diffi culty passing through higher fuel prices by raising ticket prices. Using this knowledge, the analyst may inquire about the degree to which different airlines hedge the commodity price risk inherent in jet fuel costs. With such information in hand, the analyst is better able to evaluate risk and forecast future cash fl ows. In addition, the analyst would run sensitivity analyses to determine how different levels of fuel prices would affect valuation.
Various frameworks exist for industry and competitive analysis. The primary useful-ness of such frameworks is that they can help ensure that an analysis gives appropriate atten-tion to the most important economic drivers of a business. In other words, the objective is not to prepare some formal framework representing industry structure or corporate strategy, but rather to use a framework to organize thoughts about an industry and to better under-stand a company ’ s prospects for success in competition with other companies in that industry. Further, although frameworks can provide a template, obviously the informational content added by an analyst makes the framework relevant to valuation. Ultimately, an industry and competitive analysis should highlight which aspects of a company ’ s business present the great-est challenges and opportunities and should thus be the subject of further investigation, and/or more extensive sensitivity analysis (an analysis to determine how changes in an assumed input would affect the outcome of an analysis). Frameworks may be useful as analysts focus on the following questions relevant to understanding a business.
How attractive are the industries in which the company operates in terms of offering prospects for sustained profi tability?
Inherent industry profi tability is one important factor in determining a company ’ s profi tability. Analysts should try to understand industry structure — the industry ’ s underlying economic
•
c01.indd 8c01.indd 8 12/14/09 7:36:54 AM12/14/09 7:36:54 AM
Chapter 1 Equity Valuation: Applications and Processes 9
and technical characteristics — and the trends affecting that structure. Basic economic factors — supply and demand — provide a fundamental framework for understanding an industry.
Porter ’ s (1985, 2008) fi ve forces characterizing industry structure are summarized here with an explanation of how each could positively affect inherent industry profi tability. For each force, the opposite situation would negatively affect inherent industry profi tability.
1. Intra - industry rivalry . Lower rivalry among industry participants — for example, in a faster growing industry with relatively few competitors and/or good brand identifi cation — enhances inherent industry profi tability.
2. New entrants . Relatively high costs to enter an industry (or other entry barriers, such as government policies) result in fewer new participants and less competition, thus enhanc-ing inherent industry profi tability.
3. Substitutes . When few potential substitutes exist and/or the cost to switch to a substitute is high, industry participants are less constrained in raising prices, thus enhancing inherent industry profi tability.
4. Supplier power . When many suppliers of the inputs needed by industry participants exist, suppliers have limited power to raise prices and thus would not represent inherent down-ward pressure on industry profi tability.
5. Buyer power . When many customers for an industry ’ s product exist, customers have lim-ited power to negotiate lower prices and thus would not represent inherent downward pressure on industry profi tability.
Analysts must also stay current on facts and news concerning all the industries in which the company operates, including recent developments (e.g., management, technological, or fi nancial). Particularly important to valuation are any factors likely to affect the industry ’ s longer - term profi tability and growth prospects such as demographic trends.
What is the company ’ s relative competitive position within its industry, and what is its competi-tive strategy?
The level and trend of the company ’ s market share indicate its relative competitive position within an industry. In general, a company ’ s value is higher to the extent that it can create and sustain an advantage relative to its competition. Porter identifi es three generic corporate strat-egies for achieving above - average performance:
1. Cost leadership — being the lowest - cost producer while offering products comparable to those of other companies, so that products can be priced at or near the industry average.
2. Differentiation — offering unique products or services along some dimensions that are widely valued by buyers so that the company can command premium prices.
3. Focus — seeking a competitive advantage within a target segment or segments of the indus-try, based on either cost leadership (cost focus) or differentiation (differentiation focus).
The term business model refers generally to how a company makes money: which customers it targets, what products or services it will sell to those customers, and how it delivers those products or services (including how it fi nances its activities). The term is broadly used and sometimes encompasses aspects of the generic strategies previously described. For example, an airline with a generic cost leadership strategy might have a business model characterized as a low - cost carrier. Low - cost carriers offer a single class of service and use a single type of aircraft to minimize training costs and maintenance charges.
•
c01.indd 9c01.indd 9 12/14/09 7:36:55 AM12/14/09 7:36:55 AM
10 Equity Asset Valuation
How well has the company executed its strategy and what are its prospects for future execution?
Competitive success requires both appropriate strategic choices and competent execution. Analyzing the company ’ s fi nancial reports provides a basis for evaluating a company ’ s perfor-mance against its strategic objectives and for developing expectations about a company ’ s likely future performance. A historical analysis means more than just reviewing, say, the 10 - year historical record in the most recent annual report. It very often means looking at the annual reports from 10 years prior, 5 years prior, and the most recent 2 years. Why? Because looking at annual reports from prior years often provides useful insights into how management has historically foreseen challenges and adapted to changes in business conditions through time. (In general, the investor relations sections of most publicly traded companies ’ web sites pro-vide electronic copies of their annual reports from at least the most recent years.)
In examining fi nancial and operational strategic execution, two caveats merit mention. First, the importance of qualitative, that is, nonnumeric factors must be considered. Such nonnumeric factors include, for example, the company ’ s ownership structure, its intellec-tual and physical property, the terms of its intangible assets such as licenses and franchise agreements, and the potential consequences of legal disputes or other contingent liabilities. Second, it is important to avoid simply extrapolating past operating results when forecast-ing future performance. In general, economic and technological forces can often contribute to the phenomenon of regression toward the mean . Specifi cally, successful companies tend to draw more competitors into their industries and fi nd that their ability to generate above - average profi ts comes under pressure. Conversely, poorly performing companies are often restructured in such a manner as to improve their long - term profi tability. Thus, in many cases, analysts making long - term - horizon growth forecasts for a company ’ s earnings and prof-its (e.g., forecasts beyond the next 10 years) plausibly assume company convergence toward the forecasted average growth rate for the underlying economy.
3.1.2. Analysis of Financial Reports The aspects of a fi nancial report that are most relevant for evaluating a company ’ s success in implementing strategic choices vary across companies and industries. For established compa-nies, fi nancial ratio analysis is useful. Individual drivers of profi tability for merchandising and manufacturing companies can be evaluated against the company ’ s stated strategic objectives. For example, a manufacturing company aiming to create a sustainable competitive advantage by building strong brand recognition could be expected to have substantial expenditures for advertising but relatively higher prices. Compared with a company aiming to compete on cost, the branded company would be expected to have higher gross margins but also higher selling expenses as a percent of sales.
•
EXAMPLE 1 - 2 Competitive Analysis
According to Standard & Poor ’ s Corporation (S & P), the fi ve largest providers of oil-fi eld services (based on January 2008 market capitalization) are Schlumberger Ltd. (NYSE: SLB), Halliburton Co. (NYSE: HAL), National Oilwell Varco (NYSE: NOV), Baker Hughes Inc. (NYSE: BHI), and Weatherford International Ltd. (NYSE: WFT).
c01.indd 10c01.indd 10 12/14/09 7:36:55 AM12/14/09 7:36:55 AM
Chapter 1 Equity Valuation: Applications and Processes 11
With newer companies, or companies involved in creating new products or markets, nonfi nancial measures may be critical to obtaining an accurate picture of corporate prospects. For example, a biotechnology company ’ s clinical trial results or an Internet company ’ s unique visitors per day may provide information helpful for evaluating future revenue.
3.1.3. Sources of Information An important perspective on industry and competition is sometimes provided by compa-nies themselves in regulator - mandated disclosures, regulatory fi lings, company press releases,
These companies provide tools and services — often of a very technical nature — to expedite the drilling activities of oil and gas producers and drilling companies.
1. Discuss the economic factors that may affect demand for the services provided by oilfi eld services companies, and explain a logical framework for analyzing and fore-casting revenue for these companies.
2. Explain how comparing the level and trend in profi t margin (net income/sales) and revenue per employee for these companies may help in evaluating whether one of these companies is the cost leader in the peer group.
Solution to 1 : Because the products and services of these companies relate to oil and gas exploration and production, the levels of exploration and production activities by oil and gas producers are probably the major factors that determine the demand for their services. In turn, the prices of natural gas and crude oil are important in determining the level of exploration and production activities. Therefore, among other economic factors, an ana-lyst should research those relating to supply and demand for natural gas and crude oil.
Supply factors in natural gas, such as natural gas inventory levels. Demand factors in natural gas, including household and commercial use of natural gas and the amount of new power generation equipment being fi red by natural gas. Supply factors in crude oil, including capacity constraints and production levels in OPEC and other oil - producing countries, as well as new discoveries of off - shore and land - based oil reserves. Demand factors in crude oil, such as household and commercial use of oil and the amount of new power generation equipment using oil products as its primary fuel. For both crude oil and natural gas, projected economic growth rates could be exam-ined as a demand factor and depletion rates as a supply side factor.
Note : Energy analysts should be familiar with sources for researching supply and demand information, such as the International Energy Agency (IEA), the European Petroleum Industry Association (EUROPIA), the Energy Information Administration (EIA), the American Gas Association (AGA), and the American Petroleum Institute (API).
Solution to 2 : Profi t margin refl ects cost structure; in interpreting profi t margin, how-ever, analysts should evaluate any differences in companies ’ abilities to affect profi t margin through power over price. A successfully executed cost leadership strategy will lower costs and raise profi t margins. All else equal, we would also expect a cost leader to have relatively high sales per employee, refl ecting effi cient use of human resources.
••
•
•
•
c01.indd 11c01.indd 11 12/14/09 7:36:56 AM12/14/09 7:36:56 AM
12 Equity Asset Valuation
investor relations materials, and contacts with analysts. Analysts can compare the information provided directly by companies to their own independent research.
Regulatory requirements concerning disclosures and fi lings vary internationally. In some markets, such as Canada and the United States, some mandatory fi lings require management to provide industry and competitive information, and access to those fi lings is freely available on the Internet (e.g., www.sedar.com for Canadian fi lings and at www.sec.gov for U.S. fi lings). To take the case of the United States, in annual fi lings with the Securities and Exchange Commission made on Form 10 - K for U.S. companies and Form 20 - F for non - U.S. companies, companies provide industry and competitive information in the sections for business description and for management discussion and analysis (MD & A). Interim fi lings (e.g., the quarterly SEC Form 10 - Q for U.S. companies and Form 6 - K for non - U.S. companies) provide interim fi nancial statements but typically less detailed coverage of industry and competition.
So far as analyst – management contacts are concerned, analysts must be aware when regulations (e.g., Regulation FD in the United States) prohibit companies from disclosing material nonpublic information to analysts without also disseminating that information to the public. 4 General management insights based on public information, however, can still be useful to analysts, and many analysts consider in - person meetings with a company ’ s manage-ment to be essential to understanding a company.
The CFA Institute Code of Ethics and Standards of Professional Conduct prohibit use of material inside information, and Regulation FD (and similar regulations in other coun-tries) is designed to prohibit companies from selectively offering such information. These ethical and legal requirements assist analysts by clarifying their main role and purpose.
Company - provided sources of information in addition to regulatory fi lings include press releases and investor relations materials. The press releases of most relevance to analysts are the press releases that companies issue to announce their periodic earnings. Companies typically issue these earnings press releases several weeks after the end of an accounting period and several weeks before they fi le their interim fi nancial statements. Earnings press releases summarize the company ’ s performance for the period, usually include explanations for the performance, and usually include fi nancial statements (often abbreviated versions). Following their earnings press releases, many companies host conference calls in which they further elaborate on their reported performance and typically allocate some time to answer questions posed by analysts. On their corporate web sites, many companies post audio downloads and transcripts of conference calls and of presentations made in analyst conferences. The audio fi les and transcripts of conference calls and conference presentations provide access not only to the company ’ s reports but also to analysts ’ questions and the company ’ s answers to those questions.
Apart from company - provided sources of information, analysts also obtain information from third - party sources such as industry organizations, regulatory agencies, and commercial providers of market intelligence.
3.1.4. Considerations in Using Accounting Information In evaluating a company ’ s historical performance and developing forecasts of future performance, analysts typically rely heavily on companies ’ accounting information and fi nancial disclosures. Companies ’ reported results vary in their persistence, or in other words,
4There may be special fi lings, for example Form 8-K in the United States, associated with public disclosure of material corporate events.
c01.indd 12c01.indd 12 12/14/09 7:36:56 AM12/14/09 7:36:56 AM
Chapter 1 Equity Valuation: Applications and Processes 13
sustainability. In addition, the information that companies disclose can vary substantially with respect to the accuracy of reported accounting results as refl ections of economic perfor-mance and the detail in which results are disclosed.
The term quality of earnings analysis broadly includes the scrutiny of all fi nancial statements, including the balance sheet, to evaluate both the sustainability of a company ’ s performance and how accurately the reported information refl ects economic reality. Equity analysts will generally develop better insights into a company and improve forecast accuracy by developing an ability to assess a company ’ s quality of earnings. With regard to sustain-ability of performance, an analyst aims to identify aspects of reported performance that are less likely to recur. For example, earnings with signifi cant components of nonrecurring events such as positive litigation settlements, nonpermanent tax reductions, or gains on sales of non-operating assets are considered to be of lower quality than earnings derived mainly from the company ’ s core business operations.
In addition to identifying nonrecurring events, an analyst aims to identify reporting decisions that may result in a level of reported earnings that is unlikely to continue. A good starting point for this type of quality of earnings analysis is a comparison of a company ’ s net income with its operating cash fl ow. As a simple hypothetical example, consider a company that generates revenues and net income but no operating cash fl ow because it makes all sales on account and never collects its receivables. One systematic way to make the comparison is to decompose net income into a cash component (combining operating and investing cash fl ows) and an accrual component (defi ned as net income minus the cash component). Capital markets research shows that the cash component is more persistent than the accrual compo-nent of earnings, with the result that a company with a relatively higher amount of current accruals will have a relatively lower ROA in the future (Sloan 1996). Here, greater persistency means that, compared to accruals in the current period, the cash component in the current period is more predictive of future net income. A relatively higher proportion of accruals can be interpreted as lower earnings quality.
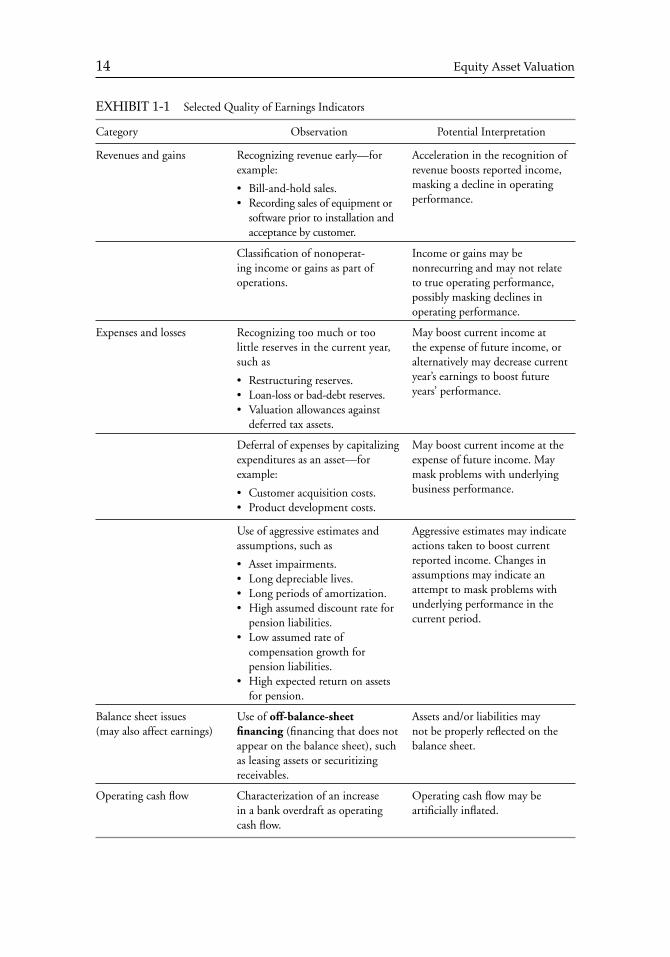
A quality of earnings analysis for a particular company requires careful scrutiny of accounting statements, footnotes, and other relevant disclosures. Sources for studying quality of earnings analysis and accounting risk factors include Richardson and Tuna (2009), Mulford and Comiskey (2005), and Schilit (2002), as well as the American Institute of Certifi ed Public Accountants ’ Consideration of Fraud in a Financial Statement Audit (28 February 2002) and the International Federation of Accountants, International Standards on Auditing 240, The Auditor ’ s Responsibility to Consider Fraud and Error in an Audit of Financial Statements (March 2001). Examples of a few of the many available indicators of possible problems with a company ’ s quality of earnings are provided in Exhibit 1 - 1 .
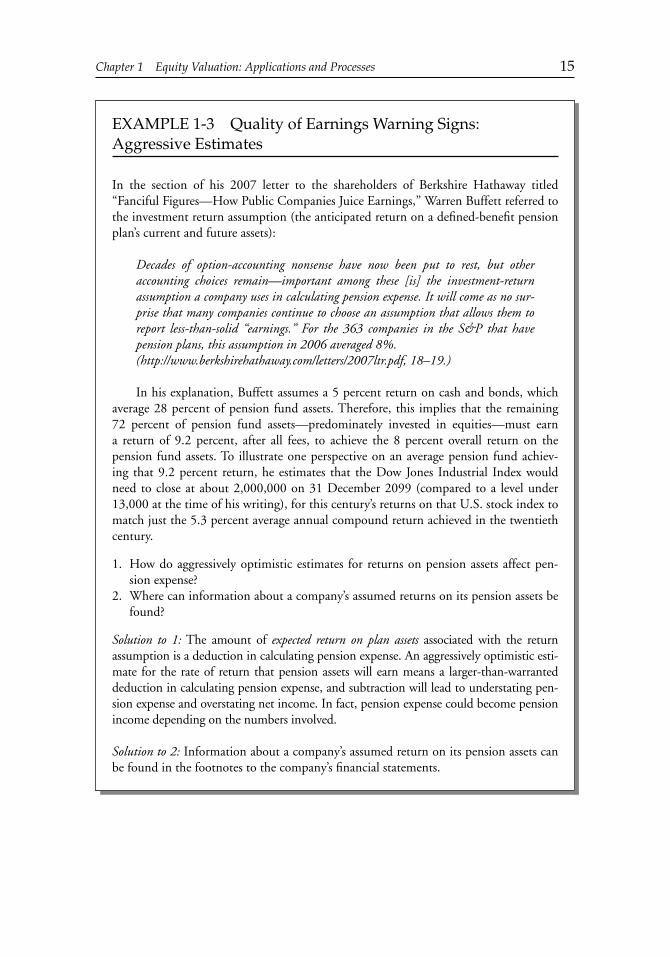
Example 1 - 3 illustrates the importance of accounting practices in infl uencing reported fi nancial results and the need for analysts to exercise judgment when using those results in any valuation model.
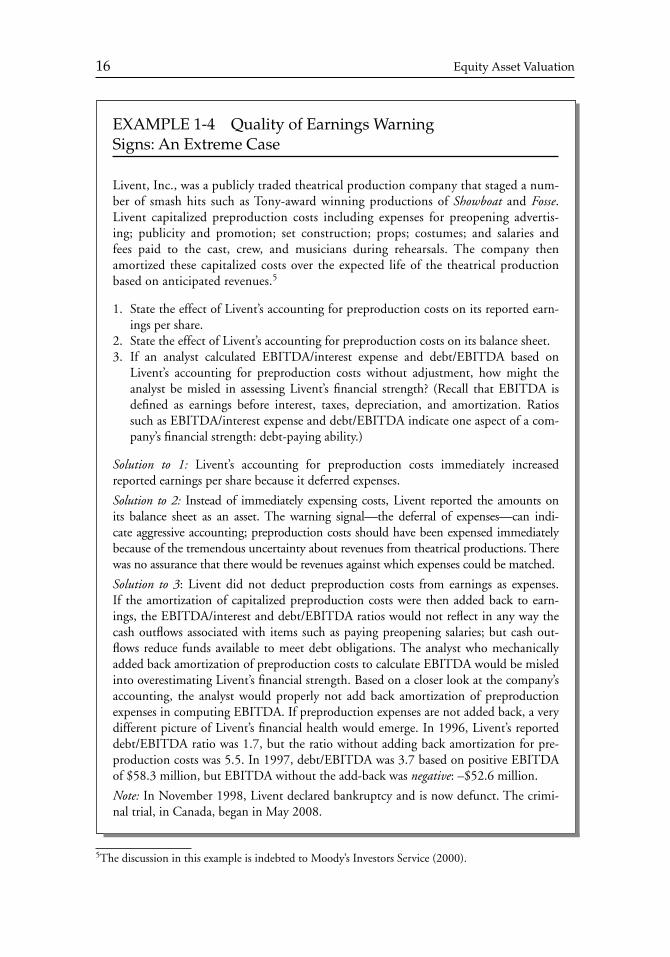
The next example of poor earnings quality (Example 1 - 4 ), in which management made choices going beyond making an aggressive estimate, is reminiscent of a humorous vignette from Benjamin Graham in which the chairman of a company outlines plans for a return to profi tability, as follows: “ Contrary to expectations, no changes will be made in the company ’ s manufacturing or selling policies. Instead, the bookkeeping system is to be entirely revamped. By adopting and further improving a number of modern account-ing and fi nancial devices, the corporation ’ s earning power will be amazingly transformed ” (Graham 1936) .
c01.indd 13c01.indd 13 12/14/09 7:36:57 AM12/14/09 7:36:57 AM
14 Equity Asset Valuation
EXHIBIT 1 - 1 Selected Quality of Earnings Indicators
Category Observation Potential Interpretation
Revenues and gains Recognizing revenue early — for example:
Bill - and - hold sales. Recording sales of equipment or software prior to installation and acceptance by customer.
••
Acceleration in the recognition of revenue boosts reported income, masking a decline in operating performance.
Classifi cation of nonoperat-ing income or gains as part of operations.
Income or gains may be nonrecurring and may not relate to true operating performance, possibly masking declines in operating performance.
Expenses and losses Recognizing too much or too little reserves in the current year, such as
Restructuring reserves. Loan - loss or bad - debt reserves. Valuation allowances against deferred tax assets.
•••
May boost current income at the expense of future income, or alternatively may decrease current year ’ s earnings to boost future years ’ performance.
Deferral of expenses by capitalizing expenditures as an asset — for example:
Customer acquisition costs. Product development costs.
••
May boost current income at the expense of future income. May mask problems with underlying business performance.
Use of aggressive estimates and assumptions, such as
Asset impairments. Long depreciable lives. Long periods of amortization. High assumed discount rate for pension liabilities. Low assumed rate of compensation growth for pension liabilities. High expected return on assets for pension.
••••
•
•
Aggressive estimates may indicate actions taken to boost current reported income. Changes in assumptions may indicate an attempt to mask problems with underlying performance in the current period.
Balance sheet issues(may also affect earnings)
Use of off - balance-sheet fi nancing (fi nancing that does not appear on the balance sheet), such as leasing assets or securitizing receivables.
Assets and/or liabilities may not be properly refl ected on the balance sheet.
Operating cash fl ow Characterization of an increasein a bank overdraft as operating cash fl ow.
Operating cash fl ow may be artifi cially infl ated.
c01.indd 14c01.indd 14 12/14/09 7:36:57 AM12/14/09 7:36:57 AM
Chapter 1 Equity Valuation: Applications and Processes 15
EXAMPLE 1 - 3 Quality of Earnings Warning Signs:
Aggressive Estimates
In the section of his 2007 letter to the shareholders of Berkshire Hathaway titled “ Fanciful Figures — How Public Companies Juice Earnings, ” Warren Buffett referred to the investment return assumption (the anticipated return on a defi ned - benefi t pension plan ’ s current and future assets):
Decades of option - accounting nonsense have now been put to rest, but other accounting choices remain — important among these [is] the investment - return assumption a company uses in calculating pension expense. It will come as no sur-prise that many companies continue to choose an assumption that allows them to report less - than - solid “ earnings. ” For the 363 companies in the S & P that have pension plans, this assumption in 2006 averaged 8%. ( http://www.berkshirehathaway.com/letters/2007ltr.pdf , 18 – 19.)
In his explanation, Buffett assumes a 5 percent return on cash and bonds, which average 28 percent of pension fund assets. Therefore, this implies that the remaining 72 percent of pension fund assets — predominately invested in equities — must earn a return of 9.2 percent, after all fees, to achieve the 8 percent overall return on the pension fund assets. To illustrate one perspective on an average pension fund achiev-ing that 9.2 percent return, he estimates that the Dow Jones Industrial Index would need to close at about 2,000,000 on 31 December 2099 (compared to a level under 13,000 at the time of his writing), for this century ’ s returns on that U.S. stock index to match just the 5.3 percent average annual compound return achieved in the twentieth century.
1. How do aggressively optimistic estimates for returns on pension assets affect pen-sion expense?
2. Where can information about a company ’ s assumed returns on its pension assets be found?
Solution to 1 : The amount of expected return on plan assets associated with the return assumption is a deduction in calculating pension expense. An aggressively optimistic esti-mate for the rate of return that pension assets will earn means a larger - than - warranted deduction in calculating pension expense, and subtraction will lead to understating pen-sion expense and overstating net income. In fact, pension expense could become pension income depending on the numbers involved.
Solution to 2 : Information about a company ’ s assumed return on its pension assets can be found in the footnotes to the company ’ s fi nancial statements.
c01.indd 15c01.indd 15 12/14/09 7:36:58 AM12/14/09 7:36:58 AM
16 Equity Asset Valuation
5The discussion in this example is indebted to Moody’s Investors Service (2000).
EXAMPLE 1 - 4 Quality of Earnings Warning
Signs: An Extreme Case
Livent, Inc., was a publicly traded theatrical production company that staged a num-ber of smash hits such as Tony - award winning productions of Showboat and Fosse . Livent capitalized preproduction costs including expenses for preopening advertis-ing; publicity and promotion; set construction; props; costumes; and salaries and fees paid to the cast, crew, and musicians during rehearsals. The company then amortized these capitalized costs over the expected life of the theatrical production based on anticipated revenues. 5
1. State the effect of Livent ’ s accounting for preproduction costs on its reported earn-ings per share.
2. State the effect of Livent ’ s accounting for preproduction costs on its balance sheet. 3. If an analyst calculated EBITDA/interest expense and debt/EBITDA based on
Livent ’ s accounting for preproduction costs without adjustment, how might the analyst be misled in assessing Livent ’ s fi nancial strength? (Recall that EBITDA is defi ned as earnings before interest, taxes, depreciation, and amortization. Ratios such as EBITDA/interest expense and debt/EBITDA indicate one aspect of a com-pany ’ s fi nancial strength: debt - paying ability.)
Solution to 1 : Livent ’ s accounting for preproduction costs immediately increased reported earnings per share because it deferred expenses.
Solution to 2 : Instead of immediately expensing costs, Livent reported the amounts on its balance sheet as an asset. The warning signal — the deferral of expenses — can indi-cate aggressive accounting; preproduction costs should have been expensed immediately because of the tremendous uncertainty about revenues from theatrical productions. There was no assurance that there would be revenues against which expenses could be matched.
Solution to 3 : Livent did not deduct preproduction costs from earnings as expenses. If the amortization of capitalized preproduction costs were then added back to earn-ings, the EBITDA/interest and debt/EBITDA ratios would not refl ect in any way the cash outfl ows associated with items such as paying preopening salaries; but cash out-fl ows reduce funds available to meet debt obligations. The analyst who mechanically added back amortization of preproduction costs to calculate EBITDA would be misled into overestimating Livent ’ s fi nancial strength. Based on a closer look at the company ’ s accounting, the analyst would properly not add back amortization of preproduction expenses in computing EBITDA. If preproduction expenses are not added back, a very different picture of Livent ’ s fi nancial health would emerge. In 1996, Livent ’ s reported debt/EBITDA ratio was 1.7, but the ratio without adding back amortization for pre-production costs was 5.5. In 1997, debt/EBITDA was 3.7 based on positive EBITDA of $ 58.3 million, but EBITDA without the add - back was negative : – $ 52.6 million.
Note : In November 1998, Livent declared bankruptcy and is now defunct. The crimi-nal trial, in Canada, began in May 2008.
c01.indd 16c01.indd 16 12/14/09 7:36:58 AM12/14/09 7:36:58 AM
Chapter 1 Equity Valuation: Applications and Processes 17
In general, growth in an asset account (such as deferred costs in the Livent example) at a much faster rate than the growth rate of sales may indicate aggressive accounting. Analysts recognize a variety of risk factors that may signal possible future negative surprises. A working selection of these risk factors would include the following (AICPA 2002):
Poor quality of accounting disclosures, such as segment information, acquisitions, account-ing policies and assumptions, and a lack of discussion of negative factors. Existence of related - party transactions. Existence of excessive offi cer, employee, or director loans. High management or director turnover. Excessive pressure on company personnel to make revenue or earnings targets, particularly when combined with a dominant, aggressive management team or individual. Material nonaudit services performed by audit fi rm. Reported (through regulatory fi lings) disputes with and/or changes in auditors. Management and/or directors ’ compensation tied to profi tability or stock price (through ownership or compensation plans). Although such arrangements are usually desirable, they can be a risk factor for aggressive fi nancial reporting. Economic, industry, or company - specifi c pressures on profi tability, such as loss of market share or declining margins. Management pressure to meet debt covenants or earnings expectations. A history of securities law violations, reporting violations, or persistent late fi lings.
3.2. Forecasting Company Performance
The second step in the valuation process — forecasting company performance — can be viewed from two perspectives: the economic environment in which the company operates and the company ’ s own operating and fi nancial characteristics.
Companies do business within larger contexts of particular industries, national economies, and world trade. Viewing a company within those larger contexts, a top - down forecasting approach moves from international and national macroeconomic forecasts to industry fore-casts and then to individual company and asset forecasts. 6 For example, a revenue forecast for a major home appliance manufacturer could start with industry unit sales forecasts that are in turn based on GDP forecasts. Forecasted company unit sales would equal forecasted industry unit sales multiplied by the appliance manufacturer ’ s forecasted market share. A revenue projection would be based on forecasted company unit sales and sales prices.
Alternatively, a bottom - up forecasting approach aggregates forecasts at a micro level to larger scale forecasts, under specifi c assumptions. For example, a clothing retailer may have several stores in operation with two new stores about to open. Using information
•
••••
•••
•
••
6A related but distinct concept is top-down investing versus bottom-up investing as one broad descrip-tion of types of active investment styles. For example, a top-down investor uses macroeconomic fore-casts to identify sectors of the economy representing potentially attractive investment opportunities. In contrast, an investor following a bottom-up investing approach might decide that a security is under-valued based on some valuation indicator, for example, without making an explicit judgment on the overall economy or the relative value of different sectors.
c01.indd 17c01.indd 17 12/14/09 7:36:59 AM12/14/09 7:36:59 AM
18 Equity Asset Valuation
based on the sales per square meter of the existing stores (perhaps during their initial period of operation), the analyst could forecast sales per square meter of the new stores that, added to forecasts of a similar type for existing stores, would give a sales forecast for the company as a whole. In making such a bottom - up sales forecast, the analyst would be making assumptions about selling prices and merchandise costs. Forecasts for individ-ual retailers could be aggregated into forecasts for the group, continuing in a bottom - up fashion.
In general, analysts integrate insights from industry and competitive analysis with fi nancial statement analysis to formulate specifi c forecasts of such items as a company ’ s sales, earnings, and cash fl ow. Analysts generally consider qualitative as well as quantita-tive factors in fi nancial forecasting and valuation. For example, an analyst might modify his forecasts and valuation judgments based on qualitative factors, such as the analyst ’ s opin-ion about the business acumen and integrity of management, and/or the transparency and quality of a company ’ s accounting practices. Such qualitative factors are necessarily subjective.
3.3. Selecting the Appropriate Valuation Model
This section discusses the third step in the valuation process — selecting the appropriate model for the valuation task at hand. Detailed descriptions of the valuation models are presented in later chapters. Absolute valuation models and relative valuation models are the two broad types of valuation models that incorporate a going - concern assumption. Here, we describe absolute and relative valuation models in general terms and discuss a number of issues in model selection. In practice, an analyst may use a variety of models to estimate the value of a company or its common stock.
3.3.1. Absolute Valuation Models An absolute valuation model is a model that specifi es an asset ’ s intrinsic value. Such models are used to produce an estimate of value that can be compared with the asset ’ s market price. The most important type of absolute equity valuation models are present value models. In fi nance theory, present value models are considered the fundamental approach to equity valu-ation. The logic of such models is that the value of an asset to an investor must be related to the returns that investor expects to receive from holding that asset. Generally speaking, those returns can be referred to as the asset ’ s cash fl ows, and present value models are also referred to as discounted cash fl ow models.
A present value model or discounted cash fl ow model applied to equity valuation derives the value of common stock as the present or discounted value of its expected future cash fl ows. 7 For common stock, one familiar type of cash fl ow is dividends, which are discretionary distributions to shareholders authorized by a corporation ’ s board of directors. Dividends repre-sent cash fl ows at the shareholder level in the sense that they are paid directly to shareholders. Present value models based on dividends are called dividend discount models . Rather than defi ning cash fl ows as dividends, analysts frequently defi ne cash fl ows at the company level.
7In private business appraisal, such models are known as income models of valuation.
c01.indd 18c01.indd 18 12/14/09 7:36:59 AM12/14/09 7:36:59 AM
Chapter 1 Equity Valuation: Applications and Processes 19
Common shareholders in principle have an equity ownership claim on the balance of the cash fl ows generated by a company after payments have been made to claimants senior to common equity, such as bondholders and preferred stockholders (and the government as well, which takes taxes), whether such fl ows are distributed in the form of dividends or not.
The two main company - level defi nitions of cash fl ow in current use are free cash fl ow and residual income. Free cash fl ow is based on cash fl ow from operations but takes into account the reinvestment in fi xed assets and working capital necessary for a going concern. The free cash fl ow to equity model defi nes cash fl ow net of payments to providers of debt, whereas the free cash fl ow to the fi rm model defi nes cash fl ows before those payments. We defi ne free cash fl ow and each model with more precision in later chapters. Residual income models are based on accrual accounting earnings in excess of the opportunity cost of generating those earnings.
Because the present value approach is the familiar technique for valuing bonds, 8 it is helpful to contrast the application of present value models to equity valuation with present value models as applied to bond valuation. The application of present value models to com-mon stock typically involves greater uncertainty than is the case with bonds; that uncertainty centers on two critical inputs for present value models — the cash fl ows and the discount rate(s). Bond valuation discounts a stream of cash payments specifi ed in a legal contract (the bond indenture ). In contrast, in equity valuation an analyst must defi ne the specifi c cash fl ow stream to be valued — dividends or free cash fl ow — and then forecast the amounts of those cash fl ows. Unlike bond valuation, no cash fl ow stream is contractually owed to c ommon stockholders. Clearly, a company ’ s total cash fl ows, and therefore the cash fl ows potentially available to common stockholders, will be affected by business, fi nancial, techno-logical, and other factors and are subject to greater variation than the contractual cash fl ow of a bond. Furthermore, the forecasts for common stock cash fl ows extend indefi nitely into the future because common stock has no maturity date. In addition to the greater uncer-tainty involved in forecasting cash fl ows for equity valuation, signifi cant uncertainty exists in estimating an appropriate rate at which to discount those cash fl ows. In contrast with bond valuation, in which a discount rate can usually be based on market interest rates and bond ratings, equity valuation typically involves a more subjective and uncertain assessment of the appropriate discount rate. 9 Finally, in addition to the uncertainty associated with cash fl ows and discount rates, the equity analyst may need to address other issues, such as the value of corporate control or the value of unused assets.
The present value approach applied to stock valuation, therefore, presents a high order of complexity. Present value models are ambitious in what they attempt — an estimate of intrin-sic value — and offer many challenges in application. Graham and Dodd (1934) suggested that the analyst consider stating a range of intrinsic values, and that suggestion remains a valid one. To that end, sensitivity analysis is an essential tool in applying discounted cash fl ow valuation. We discuss sensitivity analysis in more detail below.
8The word bond throughout this section is used in the general sense and refers to all debt securities and loans.9For some bond market instruments such as mortgage-backed securities and structured notes, the estimation of cash fl ows and an appropriate discount rate can pose challenges comparable to equity investment.
c01.indd 19c01.indd 19 12/14/09 7:37:00 AM12/14/09 7:37:00 AM
20 Equity Asset Valuation
Another type of absolute valuation is asset - based valuation that values a company on the basis of the market value of the assets or resources it controls. For appropriate companies, asset - based valuation can provide an independent estimate of value, and an analyst typically fi nds alternative, independent estimates of value to be useful. Example 1 - 5 describes instances in which this approach to absolute valuation could be appropriate.
3.3.2. Relative Valuation Models Relative valuation models constitute the second broad type of going - concern valuation models. Relative valuation models estimate an asset ’ s value relative to that of another asset. The idea underlying relative valuation is that similar assets should sell at similar prices, and relative valuation is typically implemented using price multiples (ratios of stock price to a fundamental such as cash fl ow per share) or enterprise value multiples (ratios of the total value of common stock and debt net of cash and short - term investments to a fundamental such as operating earnings).
Perhaps the most familiar price multiple is the price - to - earnings ratio (P/E), which is the ratio of a stock ’ s market price to the company ’ s earnings per share. A stock selling at a P/E that is low relative to the P/E of another closely comparable stock (in terms of anticipated earnings growth rates and risk, for example) is relatively undervalued (a good buy) relative to the comparison stock. For brevity, an analyst might state simply undervalued , but the analyst must realize that if the comparison stock is overvalued (in an absolute sense, in relation to intrinsic value), so might be the stock being called undervalued. Therefore, it is useful to maintain the distinction between undervalued and relatively undervalued . Investing to exploit perceived mispricing in either case (absolute or relative mispricing) relies on a basis of differ-ential expectations, that is, investor expectations that differ from and are more accurate than those refl ected in market prices, as discussed earlier.
The more conservative investing strategies based on relative valuation involve over-weighting (underweighting) relatively undervalued (overvalued) assets, with reference to benchmark weights. The more aggressive strategies allow short - selling of perceived overval-ued assets. Such aggressive approaches are known as relative value investing (or relative spread
EXAMPLE 1 - 5 Asset - Based Valuation
Analysts often apply asset - based valuation to natural resource companies. For example, a crude oil producer such as Petrobras (NYSE: PBR) might be valued on the basis of the market value of its current proven reserves in barrels of oil, minus a discount for estimated extraction costs. A forest industry company such as Weyerhaeuser (NYSE: WY) might be valued on the basis of the board meters (or board feet) of timber it controls. Today, however, fewer companies than in the past are involved only in natural resources extraction or production. For example, Occidental Petroleum (NYSE: OXY) features petroleum in its name but also has substantial chemical manufacturing opera-tions. For such cases, the total company might be valued as the sum of its divisions, with the natural resource division valued on the basis of its proven resources.
c01.indd 20c01.indd 20 12/14/09 7:37:00 AM12/14/09 7:37:00 AM
Chapter 1 Equity Valuation: Applications and Processes 21
investing, if using implied discount factors). A classic example is pairs trading that utilizes pairs of closely related stocks (e.g., two automotive stocks), buying the relatively undervalued stock and selling short the relatively overvalued stock. Regardless of which direction the over-all stock market goes, the investor will be better off to the extent that the relatively underval-ued stock ultimately rises more (falls less) than the relatively overvalued stock.
Frequently, relative valuation involves a group of comparison assets, such as an industry group, rather than a single comparison asset. The application of relative valuation to equity is often called the method of comparables (or just comparables ) and is the subject of Chapter 6 .
The method of comparables is characterized by a wide range of possible implementation choices; Chapter 6 discusses various alternative price and enterprise multiples. Practitioners will often examine a number of price and enterprise multiples for the complementary infor-mation they can provide. In summary, the method of comparables does not specify intrinsic value without making the further assumption that the comparison asset is fairly valued. The method of comparables has the advantages of being simple, related to market prices, and grounded in a sound economic principle (that similar assets should sell at similar prices). Price and enterprise multiples are widely recognized by investors, so analysts can communi-cate the results of an absolute valuation in terms of a price or enterprise multiple.
EXAMPLE 1 - 6 Relative Valuation Models
While researching Smithson Genomics, Inc., a (fi ctitious) health care information ser-vices company, you encounter a difference of opinions. One analyst ’ s report claims that Smithson is at least 15 percent overvalued , based on a comparison of its P/E with the median P/E of peer companies in the health care information services industry and taking account of company and peer group fundamentals. A second analyst asserts that Smithson is undervalued by 10 percent, based on a comparison of Smithson ’ s P/E with the median P/E of the Russell 3000 Index, a broad - based U.S. equity index. Both anal-yses appear to be carefully executed and reported. Can both analysts be right?
Solution : Yes. The assertions of both analysts concern relative valuations, and their benchmarks for comparisons differ. The fi rst analyst compared Smithson to its peers in the health care information services industry and considers the company to be relatively overvalued compared to that group. The second analyst compared Smithson to the overall market as represented by the Russell 3000 and considers the company to be relatively undervalued compared to that group. If the entire health care information services industry is undervalued in relation to the Russell 3000, both analysts can be right because they are making relative valuations.
The investment implications of each analyst ’ s valuation generally would depend on additional considerations, including whether the market price of the Russell 3000 fairly represents that index ’ s intrinsic value and whether the market liquidity of an otherwise attractive investment would accommodate the intended position size. The analyst in many cases may want to supplement relative valuation with estimates of intrinsic value.
c01.indd 21c01.indd 21 12/14/09 7:37:00 AM12/14/09 7:37:00 AM
22 Equity Asset Valuation
3.3.3. Valuation of the Total Entity and Its Components A variation to valuing a company as a single entity is to estimate its value as the sum of the estimated values of its various businesses considered as independent, going - concern entities. A valuation that sums the estimated values of each of the company ’ s businesses as if each business were an independent going concern is known as a sum - of - the - parts valuation . The value derived using a sum - of - the - parts valuation is sometimes called the breakup value or private market value ; however, such a valuation approach need not imply an expectation about restructuring.
Each of these valuation methods could potentially be applied either to the total entity or to one or more of its component parts. Example 1 - 7 , showing a case in which a sum - of - the - parts valuation approach would be appropriate, refers to in - process research and development. In - process research and development (IPRD) are R & D costs relating to projects that are not yet completed, such as have been incurred by a company that is being acquired.
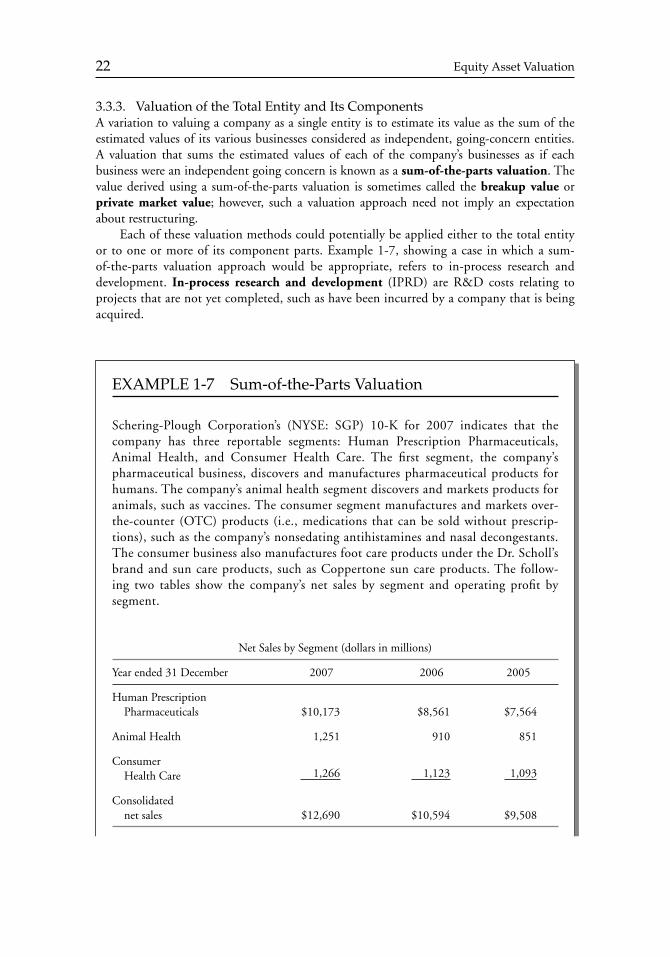
EXAMPLE 1 - 7 Sum - of - the - Parts Valuation
Schering - Plough Corporation ’ s (NYSE: SGP) 10 - K for 2007 indicates that the company has three reportable segments: Human Prescription Pharmaceuticals, Animal Health, and Consumer Health Care. The fi rst segment, the company ’ s pharmaceutical business, discovers and manufactures pharmaceutical products for humans. The company ’ s animal health segment discovers and markets products for animals, such as vaccines. The consumer segment manufactures and markets over - the - counter (OTC) products (i.e., medications that can be sold without prescrip-tions), such as the company ’ s nonsedating antihistamines and nasal decongestants. The consumer business also manufactures foot care products under the Dr. Scholl ’ s brand and sun care products, such as Coppertone sun care products. The follow-ing two tables show the company ’ s net sales by segment and operating profi t by segment.
Net Sales by Segment (dollars in millions)
Year ended 31 December 2007 2006 2005
Human Prescription Pharmaceuticals $ 10,173 $ 8,561 $ 7,564
Animal Health 1,251 910 851
Consumer Health Care 1,266 1,123 1,093
Consolidated net sales $ 12,690 $ 10,594 $ 9,508
c01.indd 22c01.indd 22 12/14/09 7:37:01 AM12/14/09 7:37:01 AM

Chapter 1 Equity Valuation: Applications and Processes 23
(Loss)/Profi t by Segment (dollars in millions)
Year ended 31 December 2007 a 2006 2005
Human Prescription Pharmaceuticals $ (1,206) $ 1,394 $ 733
Animal Health (582) 120 120
Consumer Health Care 275 228 235
Corporate and other (including net interest income of $ 150 million, $ 125 million, and $ 13 million in 2007, 2006, and 2005, respectively) 298 (259) (591)
Consolidated (loss)/profi t before tax and cumulative effect of a change in accounting principle $ (1,215) $ 1,483 $ 497
aIn 2007, the Human Prescription Pharmaceuticals segment’s loss includes $3.4 billion of purchase accounting items, including acquired in-process research and development of $3.2 billion. In 2007, the Animal Health segment’s loss includes $721 million of purchase accounting items, including acquired in-process research and development of $600 million.
1. Why might an analyst use the sum - of - the - parts approach to value Schering - Plough? 2. The footnote to the operating profi ts table indicates that the two segments reporting
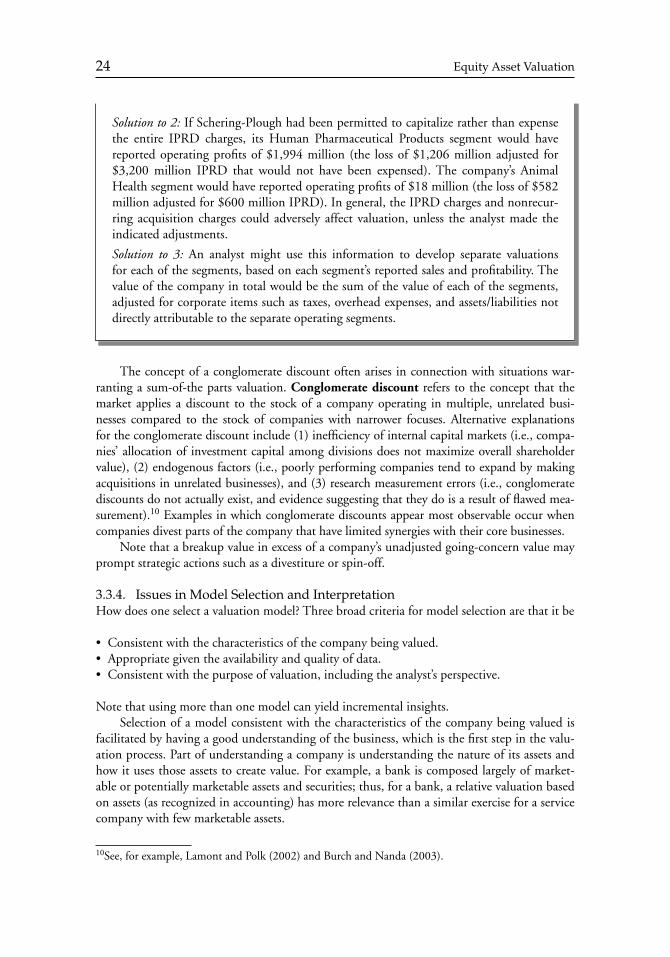
losses had substantial “ acquired in - process research and development. ” When these fi nancial statements were prepared, U.S. accounting standards required companies to separately identify any portion of acquisition costs associated with acquiring in - process research and development (IPRD) and then to immediately expense those amounts. After the U.S. standard was changed in December 2007 to converge with international accounting standards, immediate write - off is no longer required. With this background in mind, what operating profi ts would the segments have shown if the company had been permitted to capitalize rather than expense the in - process research and development? How would these IPRD charges and the nonrecurring nature of acquisition charges affect valuation generally?
3. How might an analyst use the preceding information in an analysis and valuation?
Solution to 1 : An analyst might use the sum - of - the - parts approach to value Schering - Plough because its three operating segments have very different economic profi les. For example, pharmaceutical companies rely on successful research efforts, and valuation requires an understanding of the company ’ s specifi c products (including patent protec-tion) and its pipeline of drugs undergoing requisite approvals prior to sale, whereas consumer products businesses rely on strong brands and effi cient distribution channels. Analysis and valuation typically involve identifying competitors of the company of interest. The relevant group of competitors would differ for each of Schering - Plough ’ s businesses.
c01.indd 23c01.indd 23 12/14/09 7:37:01 AM12/14/09 7:37:01 AM
24 Equity Asset Valuation
The concept of a conglomerate discount often arises in connection with situations war-ranting a sum - of - the parts valuation. Conglomerate discount refers to the concept that the market applies a discount to the stock of a company operating in multiple, unrelated busi-nesses compared to the stock of companies with narrower focuses. Alternative explanations for the conglomerate discount include (1) ineffi ciency of internal capital markets (i.e., compa-nies ’ allocation of investment capital among divisions does not maximize overall shareholder value), (2) endogenous factors (i.e., poorly performing companies tend to expand by making acquisitions in unrelated businesses), and (3) research measurement errors (i.e., conglomerate discounts do not actually exist, and evidence suggesting that they do is a result of fl awed mea-surement). 10 Examples in which conglomerate discounts appear most observable occur when companies divest parts of the company that have limited synergies with their core businesses.
Note that a breakup value in excess of a company ’ s unadjusted going - concern value may prompt strategic actions such as a divestiture or spin - off.
3.3.4. Issues in Model Selection and Interpretation How does one select a valuation model? Three broad criteria for model selection are that it be
Consistent with the characteristics of the company being valued. Appropriate given the availability and quality of data. Consistent with the purpose of valuation, including the analyst ’ s perspective.
Note that using more than one model can yield incremental insights. Selection of a model consistent with the characteristics of the company being valued is
facilitated by having a good understanding of the business, which is the fi rst step in the valu-ation process. Part of understanding a company is understanding the nature of its assets and how it uses those assets to create value. For example, a bank is composed largely of market-able or potentially marketable assets and securities; thus, for a bank, a relative valuation based on assets (as recognized in accounting) has more relevance than a similar exercise for a service company with few marketable assets.
•••
Solution to 2 : If Schering - Plough had been permitted to capitalize rather than expense the entire IPRD charges, its Human Pharmaceutical Products segment would have reported operating profi ts of $ 1,994 million (the loss of $ 1,206 million adjusted for $ 3,200 million IPRD that would not have been expensed). The company ’ s Animal Health segment would have reported operating profi ts of $ 18 million (the loss of $ 582 million adjusted for $ 600 million IPRD). In general, the IPRD charges and nonrecur-ring acquisition charges could adversely affect valuation, unless the analyst made the indicated adjustments.
Solution to 3 : An analyst might use this information to develop separate valuations for each of the segments, based on each segment ’ s reported sales and profi tability. The value of the company in total would be the sum of the value of each of the segments, adjusted for corporate items such as taxes, overhead expenses, and assets/liabilities not directly attributable to the separate operating segments.
10See, for example, Lamont and Polk (2002) and Burch and Nanda (2003).
c01.indd 24c01.indd 24 12/14/09 7:37:02 AM12/14/09 7:37:02 AM
Chapter 1 Equity Valuation: Applications and Processes 25
In selecting a model, data availability and quality can be limiting factors. For example, a dividend discount model is the simplest discounted cash fl ow model; but if a company has never paid dividends and no other information exists to assess a company ’ s future dividend policy, an analyst may have more confi dence applying an apparently more complex pres-ent value model. Similar considerations also apply in selecting a specifi c relative valuation approach. For example, meaningful comparisons using P/Es may be hard to make for a com-pany with highly volatile or persistently negative earnings.
Model selection can also be infl uenced by the purpose of the valuation or the perspective of the analyst. For example, an investor seeking a controlling equity position in a company may elect to value the company based on forecasted free cash fl ows rather than forecasted divi-dends because such fl ows might potentially be redirected by such an acquirer without affect-ing the value of the acquisition (this valuation approach is discussed in detail in Chapter 4 ). When an analyst reads valuations and research reports prepared by others, the analyst should consider how the writer ’ s perspective (and potential biases) may have affected the choice of a particular valuation approach and/or valuation inputs. Later chapters, discussing present value models and price multiples, offer specifi c guidance on model selection.
As a fi nal note to this introduction of model selection, it is important to recognize that professionals frequently use multiple valuation models or factors in common stock selection. According to the Merrill Lynch Institutional Factor Survey (2006), respondent institutional investors report using an average of approximately nine valuation factors in selecting stocks. 11 There are a variety of ways in which multiple factors can be used in stock selection. One prominent way, stock screens, is discussed in Chapter 6 . As another example, analysts can rank each security in a given investment universe by relative attractiveness according to a particular valuation factor. The rankings for individual securities could be combined into a single com-posite ranking by assigning weights to the individual factors. Analysts may use a quantitative model to assign those weights.
3.4. Converting Forecasts to a Valuation
Converting forecasts to valuation involves more than inputting the forecast amounts to a model to obtain an estimate of the value of a company or its securities. Two important aspects of converting forecasts to valuation are sensitivity analysis and situational adjustments.
Sensitivity analysis is an analysis to determine how changes in an assumed input would affect the outcome. Some sensitivity analyses are common to most valuations. For example, a sensitivity analysis can be used to assess how a change in assumptions about a company ’ s future growth — for example, decomposed by sales growth forecasts and margin forecasts — and/or a change in discount rates would affect the estimated value. Other sensitivity analyses depend on the context. For example, assume an analyst is aware that a competitor to the target company plans to introduce a competing product. Given uncertainty about the target company ’ s competitive response — will the company lower prices to retain market share, offer discounts to its distributors, increase advertising, or change a product feature — the analyst could create a baseline forecast and then analyze how different competitive responses would affect the forecasted fi nancials and in turn the estimated valuation.
Situational adjustments may be required to incorporate the valuation impact of spe-cifi c issues. Three such issues that could affect value estimates are control premiums, lack of
11In the report, the term factors covers valuation models as well as variables such as return on equity.
c01.indd 25c01.indd 25 12/14/09 7:37:02 AM12/14/09 7:37:02 AM
26 Equity Asset Valuation
marketability discounts, and illiquidity discounts. A controlling ownership position in a com-pany (e.g., more than 50 percent of outstanding shares, although a far smaller percentage often affords an investor the ability to signifi cantly infl uence a company) carries with it control of the board of directors and the valuable options of redeploying the company ’ s assets or changing the company ’ s capital structure. The value of a stock investment that would give an investor a controlling position will generally refl ect a control premium ; that is, it will be higher than a valuation produced by a generic quantitative valuation expression that did not explicitly model such a premium. A second issue generally not explicitly modeled is that investors require an extra return to compensate for lack of a public market or lack of marketability. The value of non – publicly traded stocks generally refl ects a lack of marketability discount . Among publicly traded (i.e., marketable) stocks, the prices of shares with less depth to their markets (less liquid-ity) often refl ect an illiquidity discount . An illiquidity discount would also apply if an investor wishes to sell an amount of stock that is large relative to that stock ’ s trading volume (assuming it is not large enough to constitute a controlling ownership). The price that could be realized for that block of shares would generally be lower than the market price for a smaller amount of stock, a so - called blockage factor . 12
3.5. Applying the Valuation Conclusion: The Analyst ’ s Roleand Responsibilities
As noted earlier, the purposes of valuation and the intended consumer of the valuation vary:
Analysts associated with investment fi rms ’ brokerage operations are perhaps the most vis-ible group of analysts offering valuation judgments — their research reports are widely distributed to current and prospective retail and institutional brokerage clients. Analysts who work at brokerage fi rms are known as sell - side analysts (because brokerage fi rms sell investments and services to institutions such as investment management fi rms). 13 In investment management fi rms, trusts and bank trust departments, and similar institu-tions, an analyst may report valuation judgments to a portfolio manager or to an invest-ment committee as input to an investment decision. Such analysts are widely known as buy - side analysts. The analyst ’ s valuation expertise is important not only in investment disciplines involving security selection based on detailed company analysis, but also in highly quantitative investment disciplines; quantitative analysts work in developing, test-ing, and updating security selection methodologies. 14 Analysts at corporations may perform some valuation tasks similar to those of analysts at money management fi rms (e.g., when the corporation manages in - house a sponsored pen-sion plan). Both corporate analysts and investment bank analysts may also identify and value companies that could become acquisition targets. Analysts at independent vendors of fi nancial information usually offer valuation informa-tion and opinions in publicly distributed research reports, although some focus solely on organizing and analyzing corporate information.
•
•
•
•
12Note, however, that the U.S. fair value accounting standard (SFAS No. 157) does not permit a block-age factor adjustment for actively traded shares. The value of a position is the product of the quoted price times the quantity held.13Brokerage is the business of acting as agents for buyers or sellers, usually in return for commissions.14Ranking stocks by some measure(s) of relative attractiveness (subject to a risk control discipline), as we discuss in more detail later, forms one key part of quantitative equity investment disciplines.
c01.indd 26c01.indd 26 12/14/09 7:37:03 AM12/14/09 7:37:03 AM
Chapter 1 Equity Valuation: Applications and Processes 27
In conducting their valuation activities, investment analysts play a critical role in collecting, organizing, analyzing, and communicating corporate information, and in some contexts, recom-mending appropriate investment actions based on sound analysis. When they do those tasks well, analysts help their clients, the capital markets, and the suppliers of capital:
Analysts help their clients achieve their investment objectives by enabling those clients to make better buy and sell decisions. Analysts contribute to the effi cient functioning of capital markets by providing analysis that leads to informed buy and sell decisions, and thus to asset prices that better refl ect underlying values. When asset prices accurately refl ect underlying values, capital fl ows more easily to its highest - value uses. Analysts benefi t the suppliers of capital, including shareholders, when they are effective monitors of management ’ s performance. This monitoring can serve to keep managers ’ actions more closely aligned with shareholders ’ best interests. 15
•
•
•
15See Jensen and Meckling (1976) for a classic analysis of the costs of stockholder-manager confl icts.
EXAMPLE 1 - 8 What Are Analysts Expected to Do?
When analysts at brokerage fi rms recommend a stock to the public that later performs very poorly, or when they fail to uncover negative corporate activities, they can some-times come under public scrutiny. Industry leaders may then be asked to respond to such criticism and to comment on expectations about the role and responsibilities of analysts. One such instance occurred in the United States as a consequence of the late 2001 collapse of Enron Corporation, an energy, utility, trading, and telecommunica-tion company. In testimony before the U.S. Senate, the president and CEO of AIMR (predecessor organization of CFA Institute) offered a summary of the working condi-tions and responsibilities of brokerage analysts. In the following excerpt, due diligence refers to investigation and analysis in support of a recommendation; the failure to exer-cise due diligence may sometimes result in liability according to various securities laws. Wall Street analysts refers to analysts working in the U.S. brokerage industry (sell - side analysts).
What are Wall Street analysts expected to do? These analysts are assigned compa-nies and industries to follow, are expected to research fully these companies and the industries in which they operate, and to forecast their future prospects. Based on this analysis, and using appropriate valuation models, they must then deter-mine an appropriate fair price for the company ’ s securities. After comparing this fair price to the current market price, the analyst is able to make a recommenda-tion. If the analyst ’ s “ fair price ” is signifi cantly above the current market price, it would be expected that the stock be rated a “ buy ” or “ market outperform. ”
How do Wall Street analysts get their information? Through hard work and due diligence. They must study and try to comprehend the information in numer-ous public disclosure documents, such as the annual report to shareholders and
c01.indd 27c01.indd 27 12/14/09 7:37:03 AM12/14/09 7:37:03 AM
28 Equity Asset Valuation
From the beginnings of the movement to organize fi nancial analysis as a profession rather than as a commercial trade, one guiding principle has been that the analyst must hold himself accountable to both standards of competence and standards of conduct. Competence in investment analysis requires a high degree of training, experience, and discipline. 17 Additionally, the investment professional is in a position of trust, requiring ethical conduct toward the public, clients, prospects, employers, employees, and fellow analysts. For CFA Institute members, this position of trust is refl ected in the Code of Ethics and Standards of Professional Conduct, as well as in the Professional Conduct Statement that they submit annually. The Code and Standards, which guide the analyst to independent, well - researched, and well - documented analysis, are described in the following sections.
4. COMMUNICATING VALUATION RESULTS
Writing is an important part of an analyst ’ s job. Whether written for review by an invest-ment committee or a portfolio manager in an investment management fi rm, or for distribu-tion to the retail or institutional clients of a brokerage fi rm, research reports share several common elements. In this section we discuss the content of an effective research report, one adaptable format for writing such a report, and the analyst ’ s responsibilities in preparing a research report. In many cases, institutional norms will guide the format and content of the written report.
regulatory fi lings . . . and gather the necessary quantitative and qualitative inputs to their valuation models.
This due diligence isn ’ t simply reading and analyzing annual reports. It also involves talking to company management, other company employees, competi-tors, and others, to get answers to questions that arise from their review of pub-lic documents. Talking to management must go beyond participation in regular conference calls. Not all questions can be voiced in those calls because of time constraints, for example, and because analysts, like journalists, rightly might not wish to “ show their cards, ” and reveal the insights they have gotten through their hard work, by asking a particularly probing question in the presence of their competitors.
Wall Street analysts are also expected to understand the dynamics of the industry and general economic conditions before fi nalizing a research report and making a recommendation. Therefore, in order for their fi rm to justify their continued employment, Wall Street analysts must issue research reports on their assigned companies and must make recommendations based on their reports to clients who purchase their fi rm ’ s research. 16
16Thomas A. Bowman, CFA. Testimony to the Committee on Governmental Affairs (excerpted) U.S. Senate, 27 February 2.17Competence in this sense is refl ected in the examination and work experience requirements that are prerequisites for obtaining the CFA designation.
c01.indd 28c01.indd 28 12/14/09 7:37:04 AM12/14/09 7:37:04 AM
Chapter 1 Equity Valuation: Applications and Processes 29
4.1. Contents of a Research Report
A primary determinant of a research report ’ s contents is what the intended readers seek to gain from reading the report. From a sell - side analyst ’ s report, an intended reader would be interested in the investment recommendation. In evaluating how much attention and weight to give to a recommendation, the reader will look for persuasive supporting arguments. A key element supporting any recommendation is the intrinsic value of the security.
Given the importance of the estimated intrinsic value of the security, most research reports provide the reader with information about the key assumptions and expectations underlying that estimated value. The information typically includes an update on the com-pany ’ s fi nancial and operating results, a description of relevant aspects of the current macro-economic and industry context, and an analysis and forecast for the industry and company. Because some readers of research reports are interested in background information, some reports contain detailed historical descriptive statistics about the industry and company.
A report can include specifi c forecasts, key valuation inputs (e.g., the estimated cost of capital), a description of the valuation model, and a discussion of qualitative factors and other considerations that affect valuation. Superior research reports also objectively address the uncertainty associated with investing in the security, and/or the valuation inputs involv-ing the greatest amount of uncertainty. By converting forecasts into estimated intrinsic value, a comparison between intrinsic value and market price provides the basis for an investment recommendation. When a research report states a target price for a stock (based on its intrin-sic value) in its investment recommendation, the report should clarify the basis for comput-ing the target, a time frame for reaching the target, and information on the uncertainty of reaching the target. An investment recommendation may be accompanied by an explana-tion of the underlying rationale (i.e., investment thesis), which summarizes why a particular investment offer would provide a way to profi t from the analyst ’ s outlook.
Just as a well - written report cannot compensate for a poor analysis, a poorly written report can detract from the credibility of an excellent analysis. Writing an effective research report is a challenging task. In summary, an effective research report
Contains timely information. Is written in clear, incisive language. Is objective and well researched, with key assumptions clearly identifi ed. Distinguishes clearly between facts and opinions. Contains analysis, forecasts, valuation, and a recommendation that are all internally consistent. Presents suffi cient information to allow a reader to critique the valuation. States the key risk factors involved in an investment in the company. Discloses any potential confl icts of interest faced by the analyst.
Although these general characteristics are all desirable attributes of a useful and respected report, in some situations the requirements are more specifi c. For example, regulations govern ing disclosures of confl icts and potential confl icts of interest vary across countries, so an analyst must remain up - to - date on relevant disclosure requirements. As another example, in some situations, investment recommendations are affected by policies of the fi rm employ-ing an analyst; for example, a policy might require that a security ’ s price be X percent below its estimated intrinsic value to be considered a buy . Even in the absence of such a policy, an analyst needs to maintain a conceptual distinction between a “ good company ” and a “ good
•••••
•••
c01.indd 29c01.indd 29 12/14/09 7:37:04 AM12/14/09 7:37:04 AM
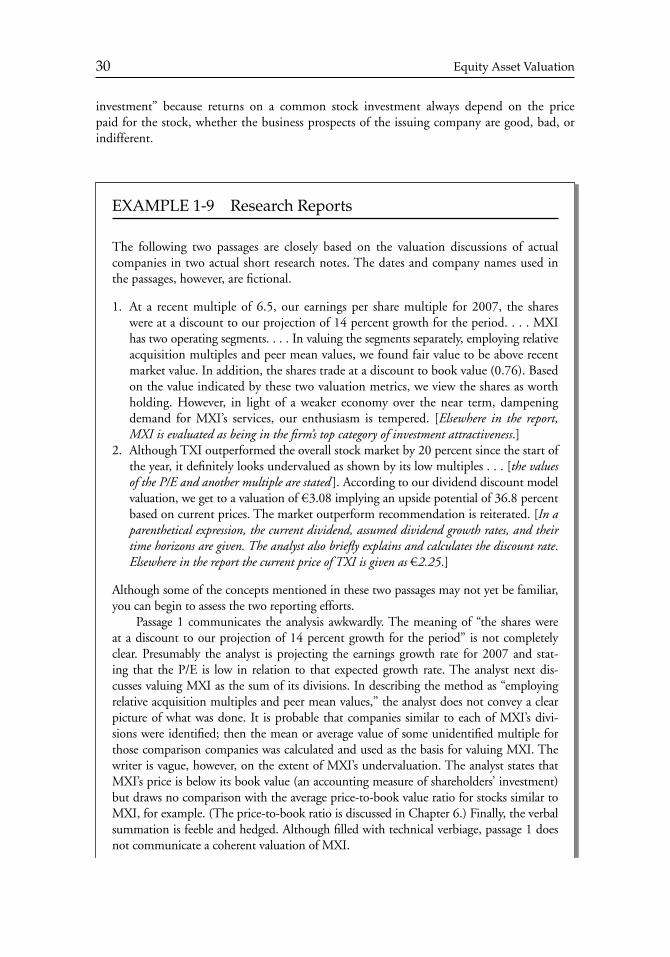
30 Equity Asset Valuation
investment ” because returns on a common stock investment always depend on the price paid for the stock, whether the business prospects of the issuing company are good, bad, or indifferent.
EXAMPLE 1 - 9 Research Reports
The following two passages are closely based on the valuation discussions of actual companies in two actual short research notes. The dates and company names used in the passages, however, are fi ctional.
1. At a recent multiple of 6.5, our earnings per share multiple for 2007, the shares were at a discount to our projection of 14 percent growth for the period. . . . MXI has two operating segments. . . . In valuing the segments separately, employing relative acquisition multiples and peer mean values, we found fair value to be above recent market value. In addition, the shares trade at a discount to book value (0.76). Based on the value indicated by these two valuation metrics, we view the shares as worth holding. However, in light of a weaker economy over the near term, dampening demand for MXI ’ s services, our enthusiasm is tempered. [ Elsewhere in the report, MXI is evaluated as being in the fi rm ’ s top category of investment attractiveness .]
2. Although TXI outperformed the overall stock market by 20 percent since the start of the year, it defi nitely looks undervalued as shown by its low multiples . . . [ the values of the P/E and another multiple are stated ]. According to our dividend discount model valuation, we get to a valuation of € 3.08 implying an upside potential of 36.8 percent based on current prices. The market outperform recommendation is reiterated. [ In a parenthetical expression, the current dividend, assumed dividend growth rates, and their time horizons are given. The analyst also briefl y explains and calculates the discount rate . Elsewhere in the report the current price of TXI is given as € 2.25 .]
Although some of the concepts mentioned in these two passages may not yet be familiar, you can begin to assess the two reporting efforts.
Passage 1 communicates the analysis awkwardly. The meaning of “ the shares were at a discount to our projection of 14 percent growth for the period ” is not completely clear. Presumably the analyst is projecting the earnings growth rate for 2007 and stat-ing that the P/E is low in relation to that expected growth rate. The analyst next dis-cusses valuing MXI as the sum of its divisions. In describing the method as “ employing relative acquisition multiples and peer mean values, ” the analyst does not convey a clear picture of what was done. It is probable that companies similar to each of MXI ’ s divi-sions were identifi ed; then the mean or average value of some unidentifi ed multiple for those comparison companies was calculated and used as the basis for valuing MXI. The writer is vague, however, on the extent of MXI ’ s undervaluation. The analyst states that MXI ’ s price is below its book value (an accounting measure of shareholders ’ investment) but draws no comparison with the average price - to - book value ratio for stocks similar to MXI, for example. (The price - to - book ratio is discussed in Chapter 6 .) Finally, the verbal summation is feeble and hedged. Although fi lled with technical verbiage, passage 1 does not communicate a coherent valuation of MXI.
c01.indd 30c01.indd 30 12/14/09 7:37:05 AM12/14/09 7:37:05 AM
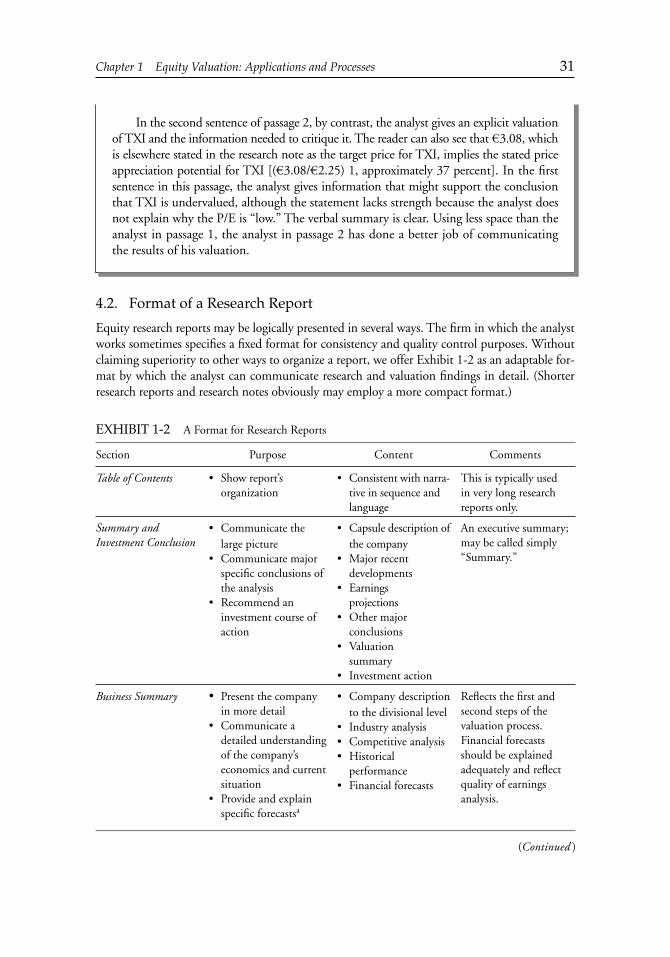
Chapter 1 Equity Valuation: Applications and Processes 31
4.2. Format of a Research Report
Equity research reports may be logically presented in several ways. The fi rm in which the analyst works sometimes specifi es a fi xed format for consistency and quality control purposes. Without claiming superiority to other ways to organize a report, we offer Exhibit 1 - 2 as an adaptable for-mat by which the analyst can communicate research and valuation fi ndings in detail. (Shorter research reports and research notes obviously may employ a more compact format.)
In the second sentence of passage 2, by contrast, the analyst gives an explicit valuation of TXI and the information needed to critique it. The reader can also see that € 3.08, which is elsewhere stated in the research note as the target price for TXI, implies the stated price appreciation potential for TXI [( € 3.08/ € 2.25) 1, approximately 37 percent]. In the fi rst sentence in this passage, the analyst gives information that might support the conclusion that TXI is undervalued, although the statement lacks strength because the analyst does not explain why the P/E is “ low. ” The verbal summary is clear. Using less space than the analyst in passage 1, the analyst in passage 2 has done a better job of communicating the results of his valuation.
EXHIBIT 1 - 2 A Format for Research Reports
Section Purpose Content Comments
Table of Contents Show report ’ s organization
• Consistent with narra-tive in sequence and language
• This is typically used in very long research reports only.
Summary and Investment Conclusion
Communicate the large picture Communicate major specifi c conclusions of the analysis Recommend an investment course of action
•
•
•
Capsule description of the company Major recent developments Earningsprojections Other major conclusions Valuationsummary Investment action
•
•
•
•
•
•
An executive summary; may be called simply “ Summary. ”
Business Summary Present the company in more detail Communicate a detailed understanding of the company ’ s economics and current situation Provide and explain specifi c forecasts a
•
•
•
Company description to the divisional level Industry analysis Competitive analysis Historical performance Financial forecasts
•
•••
•
Refl ects the fi rst and second steps of the valuation process. Financial forecasts should be explained adequately and refl ect quality of earnings analysis.
(Continued )
c01.indd 31c01.indd 31 12/14/09 7:37:05 AM12/14/09 7:37:05 AM
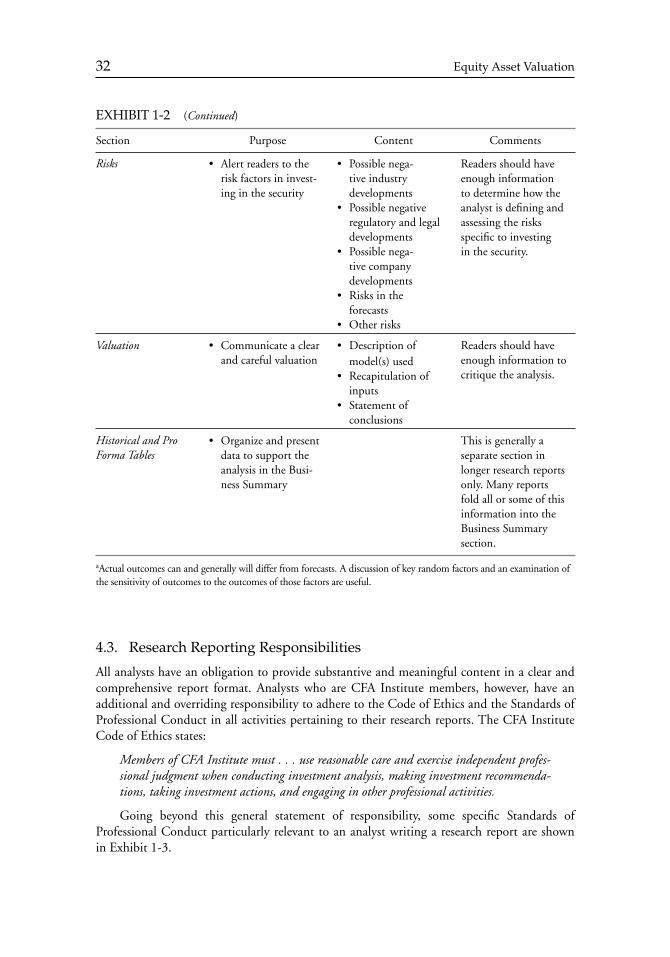
32 Equity Asset Valuation
4.3. Research Reporting Responsibilities
All analysts have an obligation to provide substantive and meaningful content in a clear and comprehensive report format. Analysts who are CFA Institute members, however, have an additional and overriding responsibility to adhere to the Code of Ethics and the Standards of Professional Conduct in all activities pertaining to their research reports. The CFA Institute Code of Ethics states:
Members of CFA Institute must . . . use reasonable care and exercise independent profes-sional judgment when conducting investment analysis, making investment recommenda-tions, taking investment actions, and engaging in other professional activities.
Going beyond this general statement of responsibility, some specifi c Standards of Professional Conduct particularly relevant to an analyst writing a research report are shown in Exhibit 1 - 3 .
EXHIBIT 1 - 2 (Continued)
Section Purpose Content Comments
Risks Alert readers to the risk factors in invest-ing in the security
• Possible nega-tive industry developmentsPossible negative regulatory and legal developmentsPossible nega-tive company developmentsRisks in the forecastsOther risks
•
•
•
•
•
Readers should have enough information to determine how the analyst is defi ning and assessing the risks specifi c to investing in the security.
Valuation Communicate a clear and careful valuation
• Description of model(s) used Recapitulation of inputs Statement of conclusions
•
•
•
Readers should have enough information to critique the analysis.
Historical and Pro Forma Tables
Organize and present data to support the analysis in the Busi-ness Summary
• This is generally a separate section in longer research reports only. Many reports fold all or some of this information into the Business Summary section.
aActual outcomes can and generally will differ from forecasts. A discussion of key random factors and an examination of the sensitivity of outcomes to the outcomes of those factors are useful.
c01.indd 32c01.indd 32 12/14/09 7:37:06 AM12/14/09 7:37:06 AM
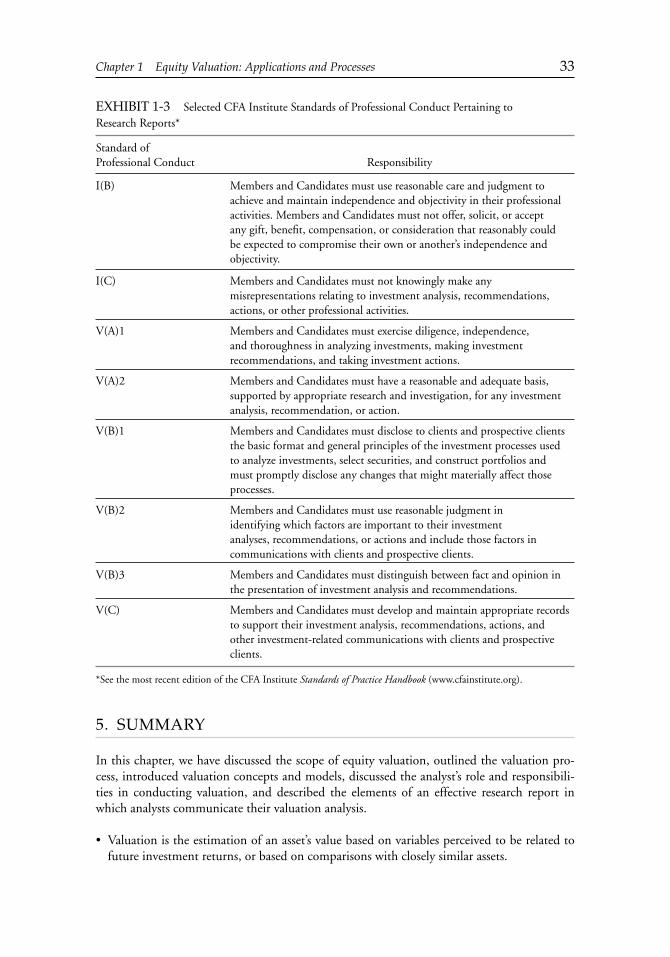
Chapter 1 Equity Valuation: Applications and Processes 33
5. SUMMARY
In this chapter, we have discussed the scope of equity valuation, outlined the valuation pro-cess, introduced valuation concepts and models, discussed the analyst ’ s role and responsibili-ties in conducting valuation, and described the elements of an effective research report in which analysts communicate their valuation analysis.
Valuation is the estimation of an asset ’ s value based on variables perceived to be related to future investment returns, or based on comparisons with closely similar assets.
•
EXHIBIT 1 - 3 Selected CFA Institute Standards of Professional Conduct Pertaining to Research Reports *
Standard ofProfessional Conduct Responsibility
I(B) Members and Candidates must use reasonable care and judgment to achieve and maintain independence and objectivity in their professional activities. Members and Candidates must not offer, solicit, or accept any gift, benefi t, compensation, or consideration that reasonably could be expected to compromise their own or another ’ s independence and objectivity.
I(C) Members and Candidates must not knowingly make any misrepresentations relating to investment analysis, recommendations, actions, or other professional activities.
V(A)1 Members and Candidates must exercise diligence, independence, and thoroughness in analyzing investments, making investment recommendations, and taking investment actions.
V(A)2 Members and Candidates must have a reasonable and adequate basis, supported by appropriate research and investigation, for any investment analysis, recommendation, or action.
V(B)1 Members and Candidates must disclose to clients and prospective clients the basic format and general principles of the investment processes used to analyze investments, select securities, and construct portfolios and must promptly disclose any changes that might materially affect those processes.
V(B)2 Members and Candidates must use reasonable judgment in identifying which factors are important to their investment analyses, recommendations, or actions and include those factors in communications with clients and prospective clients.
V(B)3 Members and Candidates must distinguish between fact and opinion in the presentation of investment analysis and recommendations.
V(C) Members and Candidates must develop and maintain appropriate records to support their investment analysis, recommendations, actions, and other investment - related communications with clients and prospective clients.
*See the most recent edition of the CFA Institute Standards of Practice Handbook (www.cfainstitute.org).
c01.indd 33c01.indd 33 12/14/09 7:37:06 AM12/14/09 7:37:06 AM
34 Equity Asset Valuation
The intrinsic value of an asset is its value given a hypothetically complete understanding of the asset ’ s investment characteristics. The assumption that the market price of a security can diverge from its intrinsic value — as suggested by the rational effi cient markets formulation of effi cient market theory — underpins active investing. Intrinsic value incorporates the going - concern assumption, that is, the assumption that a company will continue operating for the foreseeable future. In contrast, liquidation value is the company ’ s value if it were dissolved and its assets sold individually. Fair value is the price at which an asset (or liability) would change hands if neither buyer nor seller were under compulsion to buy/sell and both were informed about material underlying facts. In addition to stock selection by active traders, valuation is also used for
Inferring (extracting) market expectations. Evaluating corporate events. Issuing fairness opinions. Evaluating business strategies and models. Appraising private businesses.
The valuation process has fi ve steps:
1. Understanding the business. 2. Forecasting company performance. 3. Selecting the appropriate valuation model. 4. Converting forecasts to a valuation. 5. Applying the analytical results in the form of recommendations and conclusions.
Understanding the business includes evaluating industry prospects, competitive position, and corporate strategies, all of which contribute to making more accurate forecasts. Under-standing the business also involves analysis of fi nancial reports, including evaluating the quality of a company ’ s earnings. In forecasting company performance, a top - down forecasting approach moves from macro-economic forecasts to industry forecasts and then to individual company and asset forecasts. A bottom - up forecasting approach aggregates individual company forecasts to industry fore-casts, which in turn may be aggregated to macroeconomic forecasts. Selecting the appropriate valuation approach means choosing an approach that is
Consistent with the characteristics of the company being valued. Appropriate given the availability and quality of the data. Consistent with the analyst ’ s valuation purpose and perspective.
Two broad categories of valuation models are absolute valuation models and relative valua-tion models.
Absolute valuation models specify an asset ’ s intrinsic value, supplying a point estimate of value that can be compared with market price. Present value models of common stock (also called discounted cash fl ow models) are the most important type of absolute valuation model. Relative valuation models specify an asset ’ s value relative to the value of another asset. As applied to equity valuation, relative valuation is also known as the method of com-parables, which involves comparison of a stock ’ s price multiple to a benchmark price multiple. The benchmark price multiple can be based on a similar stock or on the aver-age price multiple of some group of stocks.
•
•
•
•
•
•••••
•
•
•
•
•••
•
•
•
c01.indd 34c01.indd 34 12/14/09 7:37:07 AM12/14/09 7:37:07 AM
Chapter 1 Equity Valuation: Applications and Processes 35
Two important aspects of converting forecasts to valuation are sensitivity analysis and situ-ational adjustments.
Sensitivity analysis is an analysis to determine how changes in an assumed input would affect the outcome of an analysis. Situational adjustments include control premiums (premiums for a controlling interest in the company), discounts for lack of marketability (discounts refl ecting the lack of a public market for the company ’ s shares), and illiquidity discounts (discounts refl ecting the lack of a liquid market for the company ’ s shares).
Applying valuation conclusions depends on the purpose of the valuation. In performing valuations, analysts must hold themselves accountable to both standards of competence and standards of conduct. An effective research report
Contains timely information. Is written in clear, incisive language. Is objective and well researched, with key assumptions clearly identifi ed. Distinguishes clearly between facts and opinions. Contains analysis, forecasts, valuation, and a recommendation that are internally consistent. Presents suffi cient information that the reader can critique the valuation. States the risk factors for an investment in the company. Discloses any potential confl icts of interest faced by the analyst.
Analysts have an obligation to provide substantive and meaningful content. CFA Institute members have an additional overriding responsibility to adhere to the CFA Institute Code of Ethics and relevant specifi c Standards of Professional Conduct.
PROBLEMS
1. Critique the statement: “ No equity investor needs to understand valuation models because real - time market prices for equities are easy to obtain online. ”
2. The text defi ned intrinsic value as “ the value of an asset given a hypothetically complete understanding of the asset ’ s investment characteristics. ” Discuss why “ hypothetically ” is included in the defi nition and the practical implication(s).
3. A. Explain why liquidation value is generally not relevant to estimating intrinsic value for profi table companies.
B. Explain whether making a going - concern assumption would affect the value placed on a company ’ s inventory.
4. Explain how the procedure for using a valuation model to infer market expectations about a company ’ s future growth differs from using the same model to obtain an inde-pendent estimate of value.
5. Example 1 - 1 , based on a study of Intel Corporation that used a present value model (Cornell 2001), examined what future revenue growth rates were consistent with Intel ’ s stock price of $ 61.50 just prior to its earnings announcement, and $ 43.31 only fi ve days later. The example states, “ Using a conservatively low discount rate, Cornell esti-mated that Intel ’ s price before the announcement, $ 61.50, was consistent with a fore-casted growth rate of 20 percent a year for the subsequent 10 years and then 6 percent
•
•
•
••
•
••••••••
•
c01.indd 35c01.indd 35 12/14/09 7:37:07 AM12/14/09 7:37:07 AM
36 Equity Asset Valuation
per year thereafter. ” Discuss the implications of using a higher discount rate than Cornell did.
6. Discuss how understanding a company ’ s business (the fi rst step in equity valuation) might be useful in performing a sensitivity analysis related to a valuation of the company.
7. In a research note on the ordinary shares of the Milan Fashion Group (MFG) dated early July 2007 when a recent price was € 7.73 and projected annual dividends were € 0.05, an analyst stated a target price of € 9.20. The research note did not discuss how the target price was obtained or how it should be interpreted. Assume the target price represents the expected price of MFG. What further specifi c pieces of information would you need to form an opinion on whether MFG was fairly valued, overvalued, or undervalued?
8. You are researching XMI Corporation (XMI). XMI has shown steady earnings - per - share growth (18 percent a year during the past seven years) and trades at a very high multiple to earnings (its P/E is currently 40 percent above the average P/E for a group of the most comparable stocks). XMI has generally grown through acquisition, by using XMI stock to purchase other companies whose stock traded at lower P/Es. In investigating the fi nancial disclosures of these acquired companies and talking to industry contacts, you conclude that XMI has been forcing the companies it acquires to accelerate the payment of expenses before the acquisition deals are closed. As one example, XMI asks acquired companies to immediately pay all pending accounts payable, whether or not they are due. Subsequent to the acquisition, XMI reinstitutes normal expense payment patterns.
A. What are the effects of XMI ’ s preacquisition expensing policies? B. The statement is made that XMI ’ s “ P/E is currently 40 percent above the average P/E
for a group of the most comparable stocks. ” What type of valuation model is implicit in that statement?
c01.indd 36c01.indd 36 12/14/09 7:37:08 AM12/14/09 7:37:08 AM