equity market outlook - icici prudential amc
TRANSCRIPT


Equity Market Outlook
O v e r v i e wThe MarketTechnicals as on Aug 31, 2019
Aug-19 July-19Investments by Institutions in the cash segment (Rs. billion)
Avg Advance Decline Ratio
Valuation Ratios Aug-19 10 Year Average
Aug-19Indices Movement Last 1 Yr
None of the aforesaid recommendations are based on any assumptions. These are purely for reference and the investors are requested to consult their financial advisors before investing.
BSE 1.11 0.85
NSE 1.11 0.72
FIIs (Net Purchases / Sales) -175.92 -124.19
MFs (Net Purchases / Sales) 174.07 150.84
P/E ratio- Sensex 26.25 20.30
P/E ratio- Nifty 27.27 19.81
Price/Book Value Ratio-Sensex 2.82 2.90
Price/Book Value Ratio-Nifty 3.35 2.81
Dividend Yield-Sensex 1.24 1.39
Dividend Yield-Nifty 1.39 1.37
S&P BSE Sensex -0.40% -3.40%
Nifty 50 -0.85% -5.63%
S&P BSE Auto 1.92% -36.20%
S&P BSE Bankex -5.32% -2.50%
S&P BSE Capitalgoods -3.50% -10.82%
S&P BSE Consumerdurables 4.82% 7.94%
S&P BSE Fast Moving Consumer Goods 0.13% -13.27%
S&P BSE Healthcare 1.35% -19.25%
S&P BSE Information Technology 2.64% 3.86%
S&P BSE Metal -11.99% -38.33%
S&P BSE MidCap -1.29% -20.22%
S&P BSE Oil & Gas -0.55% -12.70%
S&P BSE PSU -8.88% -19.71%
S&P BSE Realty -0.94% -4.38%
S&P BSE SmallCap -1.24% -27.10%
S&P BSE Teck 2.16% 0.46%
Data Source: Sebi, NSDL, BSE, NSE, CRISIL Research
Aug-19 July-19
Global economy
Growth of real gross domestic product (GDP) in the Organisation for Economic Co-operation and Development (OECD) region slowed to 0.5% in the second quarter of 2019, compared with 0.6% in the previous quarter.
The US' GDP grew at an annualised rate of 2% in the second quarter, slightly lower than the first estimate of 2.1%. The economy grew 3.1% in the first quarter of 2019. The US Federal Reserve's (Fed's) July 2019 meeting minutes showed that the bank's officials who voted earlier to lower interest rates agreed that the move should not be viewed as an indication that there is a “pre-set course” for future cuts. The summary indicated that policymakers viewed the move as a “mid-cycle adjustment”.
Eurozone's GDP growth eased to 1.1% in the second quarter of 2019 compared with 1.2% in the first quarter, as per the Eurostat data. The minutes of the European Central Bank's (ECB's) July 2019 policy meeting minutes showed that the central bank is considering several measures including combination of a rate cuts, asset purchases, changes in the guidance on interest rates and support for banks through partial relief from the ECB's negative interest rate.
The UK economy expanded at a slower pace of 1.2% in the second quarter of 2019 after rising 1.8% in the first quarter. Bank of England Governor Mark Carney said a no-deal Brexit would make highly profitable UK industries uneconomic and can give an instantaneous shock to the economy.
Japan's GDP grew at an annualised 1.8% in the second quarter compared with a revised 2.8% growth in the first quarter.
The People's Bank of China (PBC), China's central bank, unveiled a key interest rate reform in an attempt to improve monetary policy transmission and reduce the financing costs for businesses struggling with a cooling economy.
Source: CRISIL Research
After increasing for five consecutive months, retail inflation based on Consumer Price Index (CPI) eased marginally in July 2019 to 3.15% from 3.18% in June 2019. Inflation remained below the Reserve Bank of India's (RBI's) medium-term target of 4% for the 12th straight month.
Food inflation rose for the fifth consecutive month, to 2.3% in July 2019 from 2.2% in June 2019.
Fuel inflation (comprising petrol, diesel, fuel and light components) was in the negative territory for the second consecutive month. In July 2019, fuel inflation fell to -1.5%, compared with -0.1% in June.
Core inflation rose for the second consecutive month in July 2019, after decelerating in the previous three months. At 4.56% in July 2019, it was up from 4.41% in June 2019. The upturn was led by housing, followed by personal care and effects, and recreation and amusement. While health and education inflation remained high, they both softened over June.
Wholesale price-based inflation continued to fall for the third straight month. At 1.08% in July 2019, it was at its lowest in 25 months and down from 2.02% in June 2019. The decline was broad-based and was led by fuel inflation which came in negative for the second consecutive month as international crude oil prices softened.
Inflation
Fundamentals and economics:
Growth
India's gross domestic product (GDP) slipped to 5% in the April-June quarter (Q1) – slowest in more than six years compared to 5.8% in the previous quarter.
Industrial sector output growth, measured by the Index of Industrial Production (IIP), dropped to 2% in June 2019 from the upwardly revised 4.6% in May 2019. June 2019 saw a sharp slowdown in the manufacturing sector, followed by mining, while the electricity sector stayed strong.
The eight core sector industries growth slowed to 2.1% in July 2019 compared to 7.3% growth seen in the same month last year.
Source: Mospi.nic.in, CRISIL Centre for Economic Research (CCER)
Source: Mospi.nic.in, CCER
Inflation
0.0
1.0
2.0
3.0
4.0
5.0
6.0
Rate
(%
)
CPI WPI
2
O v e r v i e wThe MarketEquity Market Outlook
None of the aforesaid recommendations are based on any assumptions. These are purely for reference and the investors are requested to consult their financial advisors before investing.
Currency
The rupee weakened against the US dollar, with the exchange rate settling at Rs 71.41 per dollar on August 30, as against Rs 68.78 per dollar on July 31, tracking sporadic declines in local equities amid fears of more outflows from the domestic financial market. Intermittent declines in the yuan and other Asian currencies due to concerns of Sino-US trade war escalation weighed on the local unit. Concerns that the Centre may increase spending to support economic growth triggered concerns about fiscal slippage, and dented sentiment. The domestic currency was put under more pressure following the US Fed's monetary policy decision. The US central bank slashed interest rates as widely expected. However, US Fed Chair Jerome Powell described the central bank's action as 'a mid-cycle adjustment' to policy, thereby dashing hopes of a deeper interest rate cut cycle from the central bank going ahead. Appetite for the rupee was also hit by month-end dollar demand from importers and fears of a global recession. Further rupee depreciation was limited by intermittent dollar sales by exporters. Hopes that the Centre may roll back the tax surcharge on foreign portfolio investors (FPIs) announced in the Union Budget, which was later realized, also helped the rupee recoup losses. Weakness in the dollar index prior to the release of the US Fed meeting minutes gave the rupee some support.
Source: CRISIL Research
One-year CD rate
One-year certificate of deposit (CD) rate was 6.39% on August 30, 2019, compared with 6.65% on July 31, 2019.
Source: CRISIL Fixed Income Database
Market sentiment
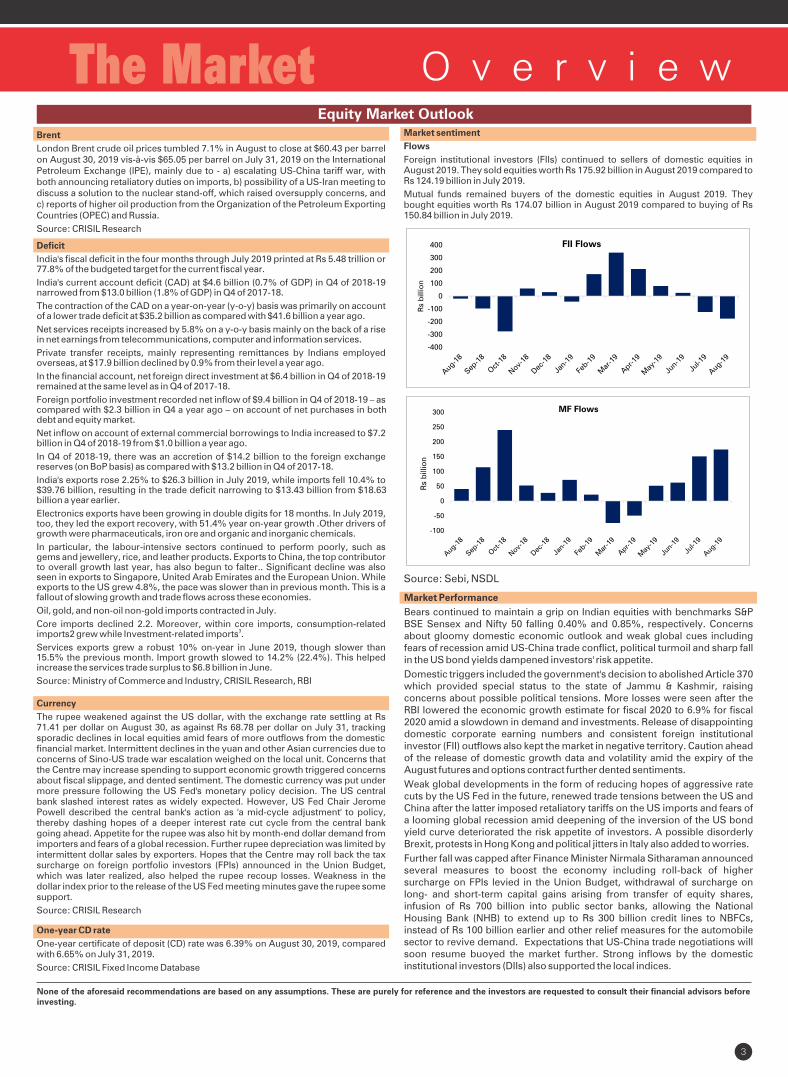
Flows
Foreign institutional investors (FIIs) continued to sellers of domestic equities in August 2019. They sold equities worth Rs 175.92 billion in August 2019 compared to Rs 124.19 billion in July 2019.
Mutual funds remained buyers of the domestic equities in August 2019. They bought equities worth Rs 174.07 billion in August 2019 compared to buying of Rs 150.84 billion in July 2019.
Source: Sebi, NSDL
Market Performance
Bears continued to maintain a grip on Indian equities with benchmarks S&P BSE Sensex and Nifty 50 falling 0.40% and 0.85%, respectively. Concerns about gloomy domestic economic outlook and weak global cues including fears of recession amid US-China trade conflict, political turmoil and sharp fall in the US bond yields dampened investors' risk appetite.
Domestic triggers included the government's decision to abolished Article 370 which provided special status to the state of Jammu & Kashmir, raising concerns about possible political tensions. More losses were seen after the RBI lowered the economic growth estimate for fiscal 2020 to 6.9% for fiscal 2020 amid a slowdown in demand and investments. Release of disappointing domestic corporate earning numbers and consistent foreign institutional investor (FII) outflows also kept the market in negative territory. Caution ahead of the release of domestic growth data and volatility amid the expiry of the August futures and options contract further dented sentiments.
Weak global developments in the form of reducing hopes of aggressive rate cuts by the US Fed in the future, renewed trade tensions between the US and China after the latter imposed retaliatory tariffs on the US imports and fears of a looming global recession amid deepening of the inversion of the US bond yield curve deteriorated the risk appetite of investors. A possible disorderly Brexit, protests in Hong Kong and political jitters in Italy also added to worries.
Further fall was capped after Finance Minister Nirmala Sitharaman announced several measures to boost the economy including roll-back of higher surcharge on FPIs levied in the Union Budget, withdrawal of surcharge on long- and short-term capital gains arising from transfer of equity shares, infusion of Rs 700 billion into public sector banks, allowing the National Housing Bank (NHB) to extend up to Rs 300 billion credit lines to NBFCs, instead of Rs 100 billion earlier and other relief measures for the automobile sector to revive demand. Expectations that US-China trade negotiations will soon resume buoyed the market further. Strong inflows by the domestic institutional investors (DIIs) also supported the local indices.
Brent
London Brent crude oil prices tumbled 7.1% in August to close at $60.43 per barrel on August 30, 2019 vis-à-vis $65.05 per barrel on July 31, 2019 on the International Petroleum Exchange (IPE), mainly due to - a) escalating US-China tariff war, with both announcing retaliatory duties on imports, b) possibility of a US-Iran meeting to discuss a solution to the nuclear stand-off, which raised oversupply concerns, and c) reports of higher oil production from the Organization of the Petroleum Exporting Countries (OPEC) and Russia.
Source: CRISIL Research
Deficit
India's fiscal deficit in the four months through July 2019 printed at Rs 5.48 trillion or 77.8% of the budgeted target for the current fiscal year.
India's current account deficit (CAD) at $4.6 billion (0.7% of GDP) in Q4 of 2018-19 narrowed from $13.0 billion (1.8% of GDP) in Q4 of 2017-18.
The contraction of the CAD on a year-on-year (y-o-y) basis was primarily on account of a lower trade deficit at $35.2 billion as compared with $41.6 billion a year ago.
Net services receipts increased by 5.8% on a y-o-y basis mainly on the back of a rise in net earnings from telecommunications, computer and information services.
Private transfer receipts, mainly representing remittances by Indians employed overseas, at $17.9 billion declined by 0.9% from their level a year ago.
In the financial account, net foreign direct investment at $6.4 billion in Q4 of 2018-19 remained at the same level as in Q4 of 2017-18.
Foreign portfolio investment recorded net inflow of $9.4 billion in Q4 of 2018-19 – as compared with $2.3 billion in Q4 a year ago – on account of net purchases in both debt and equity market.
Net inflow on account of external commercial borrowings to India increased to $7.2 billion in Q4 of 2018-19 from $1.0 billion a year ago.
In Q4 of 2018-19, there was an accretion of $14.2 billion to the foreign exchange reserves (on BoP basis) as compared with $13.2 billion in Q4 of 2017-18.
India's exports rose 2.25% to $26.3 billion in July 2019, while imports fell 10.4% to $39.76 billion, resulting in the trade deficit narrowing to $13.43 billion from $18.63 billion a year earlier.
Electronics exports have been growing in double digits for 18 months. In July 2019, too, they led the export recovery, with 51.4% year on-year growth .Other drivers of growth were pharmaceuticals, iron ore and organic and inorganic chemicals.
In particular, the labour-intensive sectors continued to perform poorly, such as gems and jewellery, rice, and leather products. Exports to China, the top contributor to overall growth last year, has also begun to falter.. Significant decline was also seen in exports to Singapore, United Arab Emirates and the European Union. While exports to the US grew 4.8%, the pace was slower than in previous month. This is a fallout of slowing growth and trade flows across these economies.
Oil, gold, and non-oil non-gold imports contracted in July.
Core imports declined 2.2. Moreover, within core imports, consumption-related 3imports2 grew while Investment-related imports .
Services exports grew a robust 10% on-year in June 2019, though slower than 15.5% the previous month. Import growth slowed to 14.2% (22.4%). This helped increase the services trade surplus to $6.8 billion in June.
Source: Ministry of Commerce and Industry, CRISIL Research, RBI
-400
-300
-200
-100
0
100
200
300
400
Rs
billio
n
FII Flows
-100
-50
0
50
100
150
200
250
300
Rs
billio
n
MF Flows
3
O v e r v i e wThe Market
None of the aforesaid recommendations are based on any assumptions. These are purely for reference and the investors are requested to consult their financial advisors before investing.
Equity Valuation Index
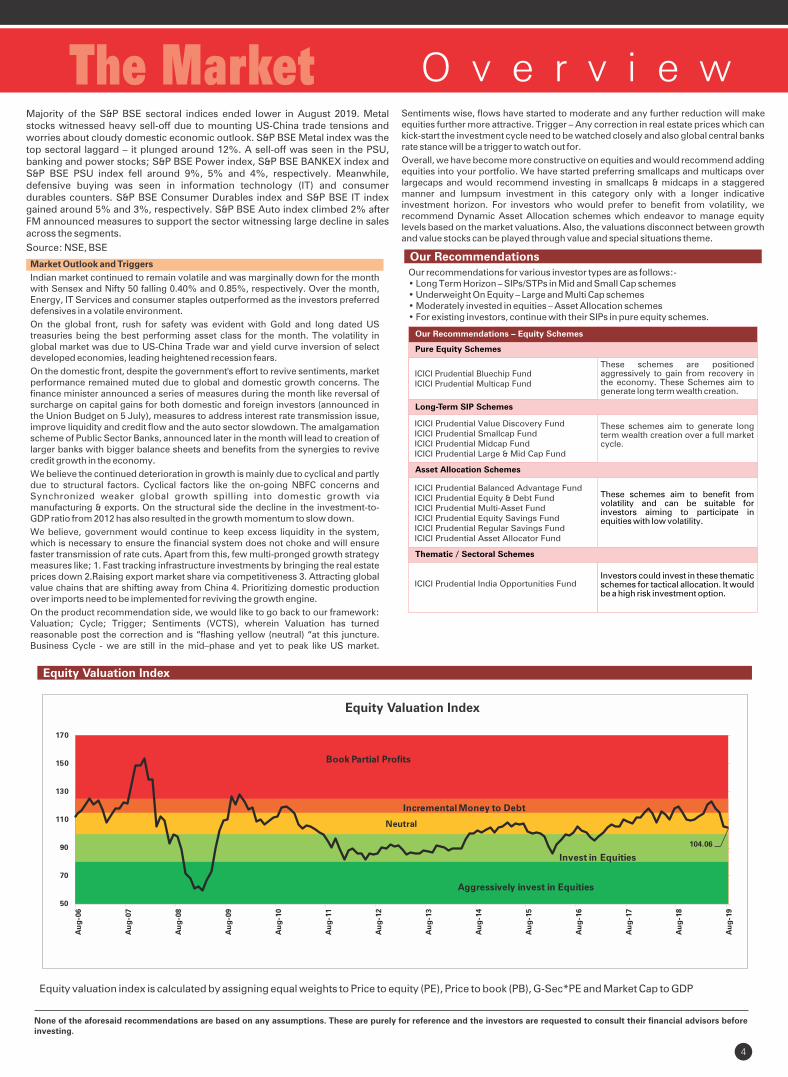
Equity valuation index is calculated by assigning equal weights to Price to equity (PE), Price to book (PB), G-Sec*PE and Market Cap to GDP
Equity Valuation Index
Our RecommendationsOur recommendations for various investor types are as follows:-• Long Term Horizon – SIPs/STPs in Mid and Small Cap schemes• Underweight On Equity – Large and Multi Cap schemes• Moderately invested in equities – Asset Allocation schemes• For existing investors, continue with their SIPs in pure equity schemes.
ICICI Prudential Bluechip FundICICI Prudential Multicap Fund
Pure Equity Schemes
These schemes are positioned aggressively to gain from recovery in the economy. These Schemes aim to generate long term wealth creation.
Our Recommendations – Equity Schemes
Long-Term SIP Schemes
ICICI Prudential Value Discovery FundICICI Prudential Smallcap FundICICI Prudential Midcap FundICICI Prudential Large & Mid Cap Fund
Asset Allocation Schemes
ICICI Prudential Balanced Advantage Fund ICICI Prudential Equity & Debt FundICICI Prudential Multi-Asset FundICICI Prudential Equity Savings FundICICI Prudential Regular Savings FundICICI Prudential Asset Allocator Fund
These schemes aim to benefit from volatility and can be suitable for investors aiming to participate in equities with low volatility.
These schemes aim to generate long term wealth creation over a full market cycle.
Thematic / Sectoral Schemes
ICICI Prudential India Opportunities FundInvestors could invest in these thematic schemes for tactical allocation. It would be a high risk investment option.
Majority of the S&P BSE sectoral indices ended lower in August 2019. Metal stocks witnessed heavy sell-off due to mounting US-China trade tensions and worries about cloudy domestic economic outlook. S&P BSE Metal index was the top sectoral laggard – it plunged around 12%. A sell-off was seen in the PSU, banking and power stocks; S&P BSE Power index, S&P BSE BANKEX index and S&P BSE PSU index fell around 9%, 5% and 4%, respectively. Meanwhile, defensive buying was seen in information technology (IT) and consumer durables counters. S&P BSE Consumer Durables index and S&P BSE IT index gained around 5% and 3%, respectively. S&P BSE Auto index climbed 2% after FM announced measures to support the sector witnessing large decline in sales across the segments.
Source: NSE, BSE
Market Outlook and Triggers
Indian market continued to remain volatile and was marginally down for the month with Sensex and Nifty 50 falling 0.40% and 0.85%, respectively. Over the month, Energy, IT Services and consumer staples outperformed as the investors preferred defensives in a volatile environment.
On the global front, rush for safety was evident with Gold and long dated US treasuries being the best performing asset class for the month. The volatility in global market was due to US-China Trade war and yield curve inversion of select developed economies, leading heightened recession fears.
On the domestic front, despite the government's effort to revive sentiments, market performance remained muted due to global and domestic growth concerns. The finance minister announced a series of measures during the month like reversal of surcharge on capital gains for both domestic and foreign investors (announced in the Union Budget on 5 July), measures to address interest rate transmission issue, improve liquidity and credit flow and the auto sector slowdown. The amalgamation scheme of Public Sector Banks, announced later in the month will lead to creation of larger banks with bigger balance sheets and benefits from the synergies to revive credit growth in the economy.
We believe the continued deterioration in growth is mainly due to cyclical and partly due to structural factors. Cyclical factors like the on-going NBFC concerns and Synchronized weaker global growth spilling into domestic growth via manufacturing & exports. On the structural side the decline in the investment-to-GDP ratio from 2012 has also resulted in the growth momentum to slow down.
We believe, government would continue to keep excess liquidity in the system, which is necessary to ensure the financial system does not choke and will ensure faster transmission of rate cuts. Apart from this, few multi-pronged growth strategy measures like; 1. Fast tracking infrastructure investments by bringing the real estate prices down 2.Raising export market share via competitiveness 3. Attracting global value chains that are shifting away from China 4. Prioritizing domestic production over imports need to be implemented for reviving the growth engine.
On the product recommendation side, we would like to go back to our framework: Valuation; Cycle; Trigger; Sentiments (VCTS), wherein Valuation has turned reasonable post the correction and is “flashing yellow (neutral) “at this juncture. Business Cycle - we are still in the mid–phase and yet to peak like US market.
Sentiments wise, flows have started to moderate and any further reduction will make equities further more attractive. Trigger – Any correction in real estate prices which can kick-start the investment cycle need to be watched closely and also global central banks rate stance will be a trigger to watch out for.
Overall, we have become more constructive on equities and would recommend adding equities into your portfolio. We have started preferring smallcaps and multicaps over largecaps and would recommend investing in smallcaps & midcaps in a staggered manner and lumpsum investment in this category only with a longer indicative investment horizon. For investors who would prefer to benefit from volatility, we recommend Dynamic Asset Allocation schemes which endeavor to manage equity levels based on the market valuations. Also, the valuations disconnect between growth and value stocks can be played through value and special situations theme.
104.06
50
70
90
110
130
150
170
Au
g-0
6
Au
g-0
7
Au
g-0
8
Au
g-0
9
Au
g-1
0
Au
g-1
1
Au
g-1
2
Au
g-1
3
Au
g-1
4
Au
g-1
5
Au
g-1
6
Au
g-1
7
Au
g-1
8
Au
g-1
9
Invest in Equities
Aggressively invest in Equities
Neutral
Incremental Money to Debt
Book Partial Profits
4

Note: None of the aforesaid recommendations are based on any assumptions. These are purely for reference and the investors are requested to consult their financial advisors
before investing.
O v e r v i e wThe MarketFixed Income Market Outlook
Average Liquidity Support by RBI
Rs -1257.00 billion (Includes: LAF, MSF, SLF & Term Repo)
Bank Credit Growth
11.6%
Bank Deposit Growth
10.2%
Money Market
Tenure CD
1M
Change CP Change
3M
6M
12M
Bond Market
Tenure G-Sec ChangeAAA
CBChange
1Y
3Y
5Y
10Y
Macro Economy Data Release
IndicatorLatest
Update
Previous
Update
IIP
GDP
USD/INR
WPI
CPI
Month Overview (as on August 30, 2019)
5.50
5.90
6.40
7.20
-41
-40
-75
-45
5.78
6.05
6.39
6.56
-12
-16
8
19
6.69
6.95
7.25
7.52
-41
-40
-22
2
2.00% (June)
5.0% (1QFY20)
71.41 (August)
1.08% (July)
3.15% (July)
4.55% (May)
5.8% (4QFY19)
68.78 (July)
2.02% (June)
3.18% (June)
-33
-35
-41
-26
5.30
5.50
5.92
6.39
INDICATORS
Credit Markets
Credit Spreads
Credit Spreads as on August 30, 2019
Tenure 6M 1Y 2Y 3Y 5Y 7Y 10Y 15Y
AAA 0.44% 1.04% 1.00% 0.81% 0.81% 0.86% 0.84% 0.53%
AA+ 0.80% 1.23% 1.19% 1.00% 1.08% 1.17% 1.20% 0.89%
AA 1.21% 1.52% 1.50% 1.36% 1.44% 1.51% 1.59% 1.28%
AA- 1.66% 1.67% 1.67% 1.64% 1.73% 1.87% 2.05% 1.74%
A+ 2.07% 1.91% 1.88% 1.93% 2.12% 2.21% 2.39% 2.08%
A 2.33% 2.08% 2.20% 2.25% 2.46% 2.55% 2.64% 2.33%
A- 3.01% 2.40% 2.59% 2.92% 3.01% 3.13% 3.29% 2.99%
Data Source – RBI, Mospi.Nic.in, CRISIL Fixed Income Database,LAF – Liquidity Adjustment Facility, MSF – Marginal Standing Facility, SLF – Standing Liquidity Facility, CP - Commercial Paper, CD – Certificate of Deposit, CB – Corporate Bond, IIP – India Industrial Production, CPI – Consumer Price Index, WPI – Wholesale Price Index, CAD – Current Account Deficit, GDP – Gross Domestic Product
Source: CRISIL
Credit Ratio
CRISIL's credit ratio – or the number of upgrades to downgrades – at 1.81 in the second half (H2) of fiscal 2019, is marginally up from 1.68 in the first half. There were 594 upgrades and 328 downgrades in the second half, a period marked by rebound in exports, and continued government spending. The positive trend in credit ratio is also consistent with asset quality as seen in the banking sector, where incremental slippages in non-performing assets declined sharply to 3.7% in H2, compared with 3.8% in H1 and an average of ~6% in fiscal 2017 and 2018. That said, while increased private consumption supported by budgetary announcements augur well for the fiscal 2020 credit outlook, some headwinds are gathering. CRISIL expects moderation in the credit ratio as global growth slackens and pace of government infrastructure spending slows.Source: CRISIL
Bank credit/ deposit growth
Bank credit growth rose 11.6% on-year in the fortnight ended August 16, 2019. Non-food bank credit fell to Rs 96.18 trillion as on August 16, 2019. Time deposit growth was 10.0% on-year in the fortnight ended August 16, 2019. Demand deposits witnessed 11.5% on-year growth in the fortnight ended August 16, 2019. India's M3 money supply rose 10.2% on-year in the fortnight ended August 16, 2019. Reserve money rose 11.9% on-year in the week ended August 23, 2019.
Source: RBI
Inflation
After increasing for five consecutive months, retail inflation based on Consumer Price Index (CPI) eased marginally in July 2019 to 3.15% from 3.18% in June 2019. Inflation remained below the Reserve Bank of India's (RBI's) medium-term target of 4% for the 12th straight month.
Food inflation rose for the fifth consecutive month, to 2.3% in July 2019 from 2.2% in June 2019.
Fuel inflation (comprising petrol, diesel, fuel and light components) was in the negative territory for the second consecutive month. In July 2019, fuel inflation fell to -1.5%.
Core inflation rose for the second consecutive month in July 2019, after decelerating in the previous three months. At 4.56% in July 2019, it was up from 4.41% in June 2018.
Wholesale price-based inflation continued to fall for the third straight month. At 1.08% in July 2019, it was at its lowest in 25 months and down from 2.02% in June 2019. The decline was broad-based and was led by fuel inflation which came in negative for the second consecutive month as international crude oil prices softened.
Source: Mospi.Nic.in, CRISIL Centre for Economic Research (CCER)
Currency in circulation rose 12.9% on-year in the week ended August 23, 2019, compared with 23.8% growth a year ago. The RBI, via its liquidity window, absorbed Rs 1257.00 billion on a net daily average basis in August 2019, compared with net liquidity absorption of Rs 1266.57 billion in July 2019.
Source: RBI, CRISIL Fixed Income Database
Money Markets
INDICATORS
Liquidity
Liquidity Update
Interbank call money rates remained near the RBI's repo rate of 5.40% in the month due to comfortable liquidity in the system, prompting the central bank to conduct frequent reverse repo auctions and provide banks with idle funds an opportunity to invest for the short term.
Source: CRISIL Research
INDICATORS
Bond Markets
Current Account India's current account deficit (CAD) at $4.6 billion (0.7% of GDP) in Q4 of 2018-19 narrowed from $13.0 billion (1.8% of GDP) in Q4 of 2017-18
The contraction of the CAD on a year-on-year (y-o-y) basis was primarily on account of a lower trade deficit at $35.2 billion as compared with $41.6 billion a year ago.
Net services receipts increased by 5.8% on a y-o-y basis mainly on the back of a rise in net earnings from telecommunications, computer and information services.
Private transfer receipts, mainly representing remittances by Indians employed overseas, at $17.9 billion declined by 0.9% from their level a year ago.
In the financial account, net foreign direct investment at $6.4 billion in Q4 of 2018-19 remained at the same level as in Q4 of 2017-18.
Foreign portfolio investment recorded net inflow of $9.4 billion in Q4 of 2018-19 – as compared with $2.3 billion in Q4 a year ago – on account of net purchases in both debt and equity market.
Net inflow on account of external commercial borrowings to India increased to $7.2 billion in Q4 of 2018-19 from $1.0 billion a year ago.
Credit Update
As highlighted above India's credit profile continues to improve, with the commodity prices being stable and financial companies are started to see improvement with their NPL (Non-Performing Loans) bottoming out. As capacity utilization is moderate, we do not expect further heavy investment in capital expenditure, thus, these companies are expected to repay their loans and reduce debt, thereby improving the balance sheet. We believe the economic recovery cycle is well underway, and that the credit market is gradually improving. However, any continued liquidity strain in the credit market could impact the availability and cost of funds for non-bank financiers and hence would be a key monitorable.
5
O v e r v i e wThe MarketFixed Income Market Outlook
Note: None of the aforesaid recommendations are based on any assumptions. These are purely for reference and the investors are requested to consult their financial advisors before investing. 6
Cash Management Solutions
These schemes aim to benefit from mitigating interest rate volatility
These schemes aim to benefit from better risk adjusted returns
Short Duration Schemes
Our Recommendations
Our RecommendationsFor new allocations we recommend short to medium duration, accrual based schemes or dynamically managed schemes.
ICICI Prudential Savings FundICICI Prudential Floating Interest FundICICI Prudential Ultra Short Term Fund
ICICI Prudential Short Term FundICICI Prudential Banking & PSU Debt FundICICI Prudential Corporate Bond Fund
Accrual Schemes
ICICI Prudential Credit Risk Fund ICICI Prudential Medium Term Bond Fund
These schemes aims to benefit from capturing yields at elevated levels
Dynamic Duration Scheme
ICICI Prudential All Seasons Bond FundThis scheme aims to benefit from volatility by actively managing duration
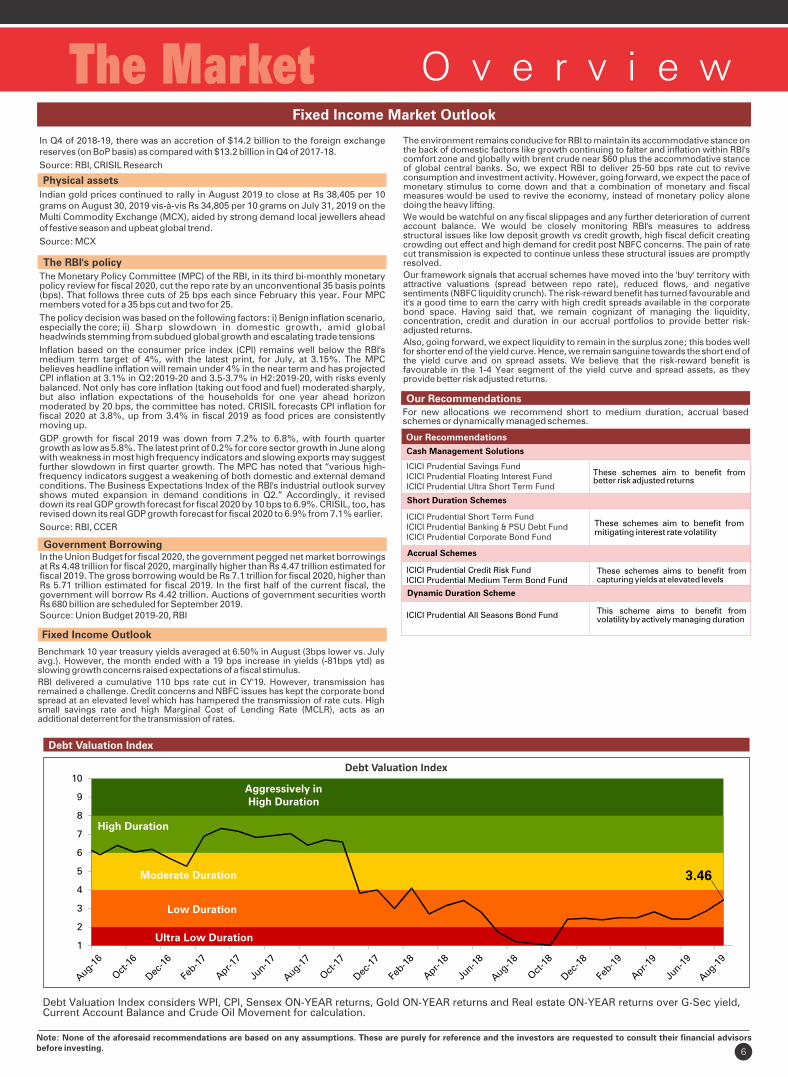
Debt Valuation Index considers WPI, CPI, Sensex ON-YEAR returns, Gold ON-YEAR returns and Real estate ON-YEAR returns over G-Sec yield, Current Account Balance and Crude Oil Movement for calculation.
Debt Valuation Index
Fixed Income Outlook
Benchmark 10 year treasury yields averaged at 6.50% in August (3bps lower vs. July avg.). However, the month ended with a 19 bps increase in yields (-81bps ytd) as slowing growth concerns raised expectations of a fiscal stimulus.
RBI delivered a cumulative 110 bps rate cut in CY'19. However, transmission has remained a challenge. Credit concerns and NBFC issues has kept the corporate bond spread at an elevated level which has hampered the transmission of rate cuts. High small savings rate and high Marginal Cost of Lending Rate (MCLR), acts as an additional deterrent for the transmission of rates.
Debt Valuation Index
The environment remains conducive for RBI to maintain its accommodative stance on the back of domestic factors like growth continuing to falter and inflation within RBI's comfort zone and globally with brent crude near $60 plus the accommodative stance of global central banks. So, we expect RBI to deliver 25-50 bps rate cut to revive consumption and investment activity. However, going forward, we expect the pace of monetary stimulus to come down and that a combination of monetary and fiscal measures would be used to revive the economy, instead of monetary policy alone doing the heavy lifting.
We would be watchful on any fiscal slippages and any further deterioration of current account balance. We would be closely monitoring RBI's measures to address structural issues like low deposit growth vs credit growth, high fiscal deficit creating crowding out effect and high demand for credit post NBFC concerns. The pain of rate cut transmission is expected to continue unless these structural issues are promptly resolved.
Our framework signals that accrual schemes have moved into the 'buy' territory with attractive valuations (spread between repo rate), reduced flows, and negative sentiments (NBFC liquidity crunch). The risk-reward benefit has turned favourable and it's a good time to earn the carry with high credit spreads available in the corporate bond space. Having said that, we remain cognizant of managing the liquidity, concentration, credit and duration in our accrual portfolios to provide better risk-adjusted returns.
Also, going forward, we expect liquidity to remain in the surplus zone; this bodes well for shorter end of the yield curve. Hence, we remain sanguine towards the short end of the yield curve and on spread assets. We believe that the risk-reward benefit is favourable in the 1-4 Year segment of the yield curve and spread assets, as they provide better risk adjusted returns.
Government Borrowing In the Union Budget for fiscal 2020, the government pegged net market borrowings at Rs 4.48 trillion for fiscal 2020, marginally higher than Rs 4.47 trillion estimated for fiscal 2019. The gross borrowing would be Rs 7.1 trillion for fiscal 2020, higher than Rs 5.71 trillion estimated for fiscal 2019. In the first half of the current fiscal, the government will borrow Rs 4.42 trillion. Auctions of government securities worth Rs 680 billion are scheduled for September 2019. Source: Union Budget 2019-20, RBI
Physical assets
Indian gold prices continued to rally in August 2019 to close at Rs 38,405 per 10 grams on August 30, 2019 vis-à-vis Rs 34,805 per 10 grams on July 31, 2019 on the Multi Commodity Exchange (MCX), aided by strong demand local jewellers ahead of festive season and upbeat global trend.
Source: MCX
The RBI's policy
The Monetary Policy Committee (MPC) of the RBI, in its third bi-monthly monetary policy review for fiscal 2020, cut the repo rate by an unconventional 35 basis points (bps). That follows three cuts of 25 bps each since February this year. Four MPC members voted for a 35 bps cut and two for 25.
The policy decision was based on the following factors: i) Benign inflation scenario, especially the core; ii) Sharp slowdown in domestic growth, amid global headwinds stemming from subdued global growth and escalating trade tensions
Inflation based on the consumer price index (CPI) remains well below the RBI's medium term target of 4%, with the latest print, for July, at 3.15%. The MPC believes headline inflation will remain under 4% in the near term and has projected CPI inflation at 3.1% in Q2:2019-20 and 3.5-3.7% in H2:2019-20, with risks evenly balanced. Not only has core inflation (taking out food and fuel) moderated sharply, but also inflation expectations of the households for one year ahead horizon moderated by 20 bps, the committee has noted. CRISIL forecasts CPI inflation for fiscal 2020 at 3.8%, up from 3.4% in fiscal 2019 as food prices are consistently moving up.
GDP growth for fiscal 2019 was down from 7.2% to 6.8%, with fourth quarter growth as low as 5.8%. The latest print of 0.2% for core sector growth in June along with weakness in most high frequency indicators and slowing exports may suggest further slowdown in first quarter growth. The MPC has noted that “various high-frequency indicators suggest a weakening of both domestic and external demand conditions. The Business Expectations Index of the RBI's industrial outlook survey shows muted expansion in demand conditions in Q2.” Accordingly, it revised down its real GDP growth forecast for fiscal 2020 by 10 bps to 6.9%. CRISIL, too, has revised down its real GDP growth forecast for fiscal 2020 to 6.9% from 7.1% earlier.
Source: RBI, CCER
In Q4 of 2018-19, there was an accretion of $14.2 billion to the foreign exchange reserves (on BoP basis) as compared with $13.2 billion in Q4 of 2017-18.
Source: RBI, CRISIL Research
3.46
1
2
3
4
5
6
7
8
9
10
Ultra Low Duration
Low Duration
Moderate Duration
High Duration
Aggressively in High Duration
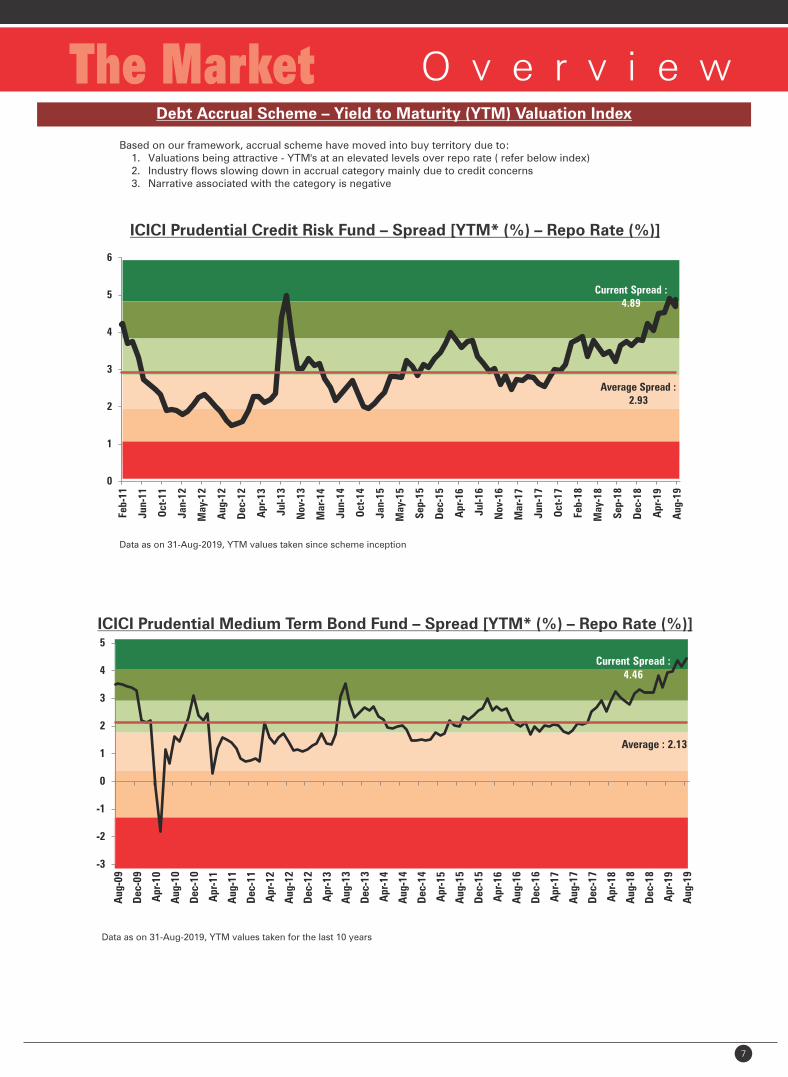
Based on our framework, accrual scheme have moved into buy territory due to: 1. Valuations being attractive - YTM's at an elevated levels over repo rate ( refer below index) 2. Industry flows slowing down in accrual category mainly due to credit concerns 3. Narrative associated with the category is negative
ICICI Prudential Credit Risk Fund – Spread [YTM* (%) – Repo Rate (%)]
Data as on 31-Aug-2019, YTM values taken since scheme inception
ICICI Prudential Medium Term Bond Fund – Spread [YTM* (%) – Repo Rate (%)]
Data as on 31-Aug-2019, YTM values taken for the last 10 years
7
O v e r v i e wThe MarketDebt Accrual Scheme – Yield to Maturity (YTM) Valuation Index
Average : 2.13
Current Spread : 4.46
-3
-2
-1
0
1
2
3
4
5
Aug
-09
Dec
-09
Apr
-10
Aug
-10
Dec
-10
Apr
-11
Aug
-11
Dec
-11
Apr
-12
Aug
-12
Dec
-12
Apr
-13
Aug
-13
Dec
-13
Apr
-14
Aug
-14
Dec
-14
Apr
-15
Aug
-15
Dec
-15
Apr
-16
Aug
-16
Dec
-16
Apr
-17
Aug
-17
Dec
-17
Apr
-18
Aug
-18
Dec
-18
Apr
-19
Aug
-19
Average Spread : 2.93
Current Spread : 4.89
0
1
2
3
4
5
6
Feb
-11
Jun
-11
Oct
-11
Jan
-12
May
-12
Aug
-12
Dec
-12
Apr
-13
Jul
-13
Nov
-13
Mar
-14
Jun
-14
Oct
-14
Jan
-15
May
-15
Sep
-15
Dec
-15
Apr
-16
Jul
-16
Nov
-16
Mar
-17
Jun
-17
Oct
-17
Feb
-18
May
-18
Sep
-18
Dec
-18
Apr
-19
Aug
-19

Index
8
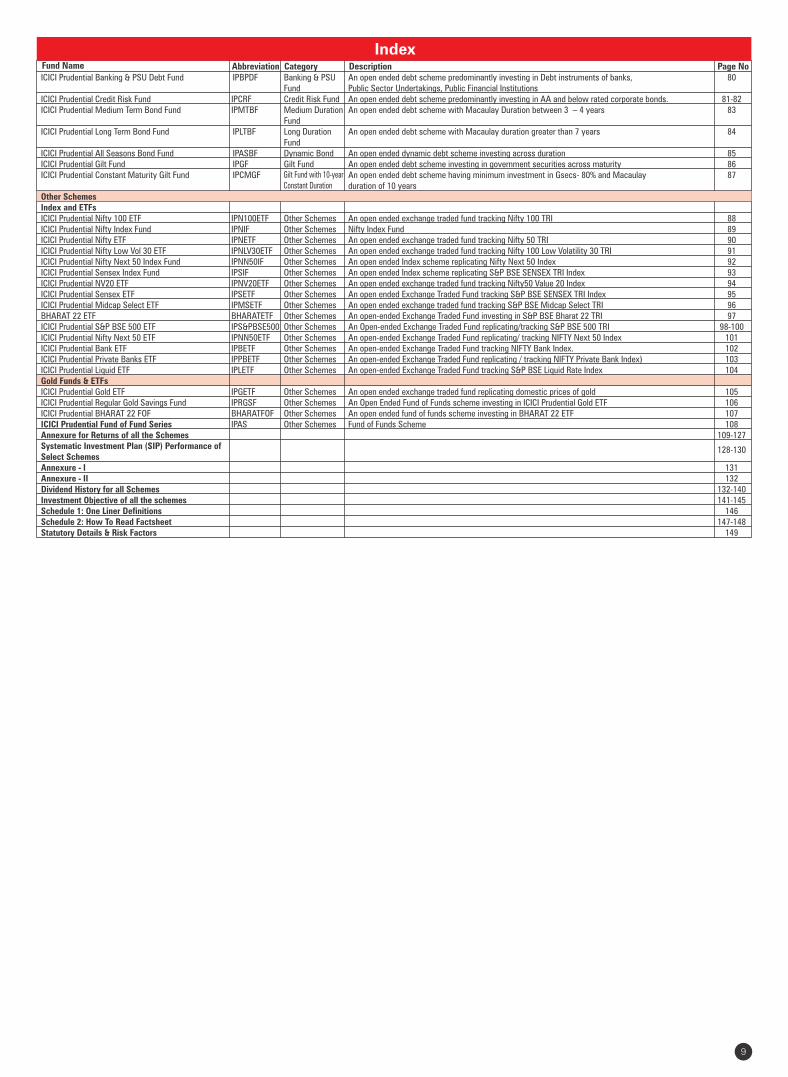
Equity SchemesAbbreviation Category Description Page No
ICICI Prudential Bluechip Fund IPBLUE Large Cap Fund An open ended equity scheme predominantly investing in large cap stocks 10ICICI Prudential Large & Mid Cap Fund IPLMCF Large & Mid Cap An open ended equity scheme investing in both large cap and mid cap stocks 11 Fund ICICI Prudential Multicap Fund IPMUF Multicap Fund An open ended equity scheme investing across large cap, mid cap, small cap stocks 12ICICI Prudential India Opportunities Fund IPIOF Thematic An open ended equity scheme following special situations theme 13ICICI Prudential Value Discovery Fund IPVDF Value Fund An open ended equity scheme following a value investment strategy 14ICICI Prudential Long Term Equity Fund (Tax Saving) IPLTEF An open Ended Equity Scheme with Tax Saving advantage 15
ICICI Prudential Focused Equity Fund IPFEF Focused Fund An open ended equity scheme investing in maximum 30 stocks 16ICICI Prudential Dividend Yield Equity Fund IPDYEF Dividend Yield An open ended equity scheme predominantly investing in dividend yielding stocks 17 FundICICI Prudential Midcap Fund IPMIDF Mid Cap Fund An open ended equity scheme predominantly investing in mid cap stocks 18ICICI Prudential Smallcap Fund IPSCF Small Cap Fund An open ended equity scheme predominantly investing in small cap stocks 19ICICI Prudential Banking & Financial Services Fund IPBFSF Sectoral An open ended equity scheme investing in banking & financial services sector 20ICICI Prudential FMCG Fund IPFMCGF Sectoral An open ended equity scheme investing in FMCG sector 21ICICI Prudential Technology Fund IPTEF Sectoral An open ended equity scheme investing in technology and related sectors 22ICICI Prudential Pharma Healthcare and IPPHF Thematic An Open Ended Equity Scheme following Pharma, Healthcare, Diagnostic and allied Theme. 23Diagnostics (P.H.D) FundICICI Prudential Exports and Services Fund IPEASF Thematic An open ended equity scheme following exports and services theme 24ICICI Prudential Infrastructure Fund IPINF Thematic An open ended equity scheme following infrastructure theme 25ICICI Prudential Manufacture in India Fund IPMIF Thematic An Open Ended Equity Scheme following manufacturing theme 26ICICI Prudential MNC Fund IPMNCF Thematic An open ended Equity Scheme following MNC theme 27 ICICI Prudential Bharat Consumption Fund IPBCOF Thematic An open ended scheme investing in companies engaged in consumption and consumption related activities. 28ICICI Prudential Global Stable Equity Fund IPGSEF Other Scheme Open ended Fund of Funds Scheme investing in overseas mutual fund schemes which invest in stable companies globally 29ICICI Prudential US Bluechip Equity Fund IPUSBEF Thematic An open ended equity scheme following bluechip companies listed in US 30Closed Ended Equity Funds ICICI Prudential Growth Fund - Series 1 IPGF1 Closed Ended Equity Scheme 31ICICI Prudential Growth Fund - Series 2 IPGF2 Closed Ended Equity Scheme 32ICICI Prudential Growth Fund - Series 3 IPGF3 Closed Ended Equity Scheme 33ICICI Prudential Value Fund - Series 8 IPVF8 Closed Ended Equity Scheme 34ICICI Prudential Value Fund - Series 9 IPVF9 Closed Ended Equity Scheme 35ICICI Prudential Value Fund - Series 10 IPVF10 Closed Ended Equity Scheme 36ICICI Prudential Value Fund - Series 11 IPVF11 Closed Ended Equity Scheme 37ICICI Prudential Value Fund - Series 12 IPVF12 Closed Ended Equity Scheme 38ICICI Prudential Value Fund - Series 13 IPVF13 Closed Ended Equity Scheme 39ICICI Prudential Value Fund - Series 14 IPVF14 Closed Ended Equity Scheme 40ICICI Prudential Value Fund - Series 15 IPVF15 Closed Ended Equity Scheme 41ICICI Prudential Value Fund - Series 16 IPVF16 Closed Ended Equity Scheme 42ICICI Prudential Value Fund - Series 17 IPVF17 Closed Ended Equity Scheme 43ICICI Prudential Value Fund - Series 18 IPVF18 Closed Ended Equity Scheme 44ICICI Prudential Value Fund - Series 19 IPVF19 Closed Ended Equity Scheme 45ICICI Prudential Value Fund - Series 20 IPVF20 Closed Ended Equity Scheme 46ICICI Prudential Bharat Consumption Fund - Series 1 IPBCOF1 Closed Ended Equity scheme following Consumption Theme 47ICICI Prudential Bharat Consumption Fund Series 2 IPBCOF2 Closed Ended Equity scheme following Consumption Theme - 48ICICI Prudential Bharat Consumption Fund Series 3 IPBCOF3 Closed Ended Equity scheme following Consumption Theme - 49ICICI Prudential Bharat Consumption Fund - Series 4 IPBCOF4 Closed Ended Equity scheme following Consumption Theme 50ICICI Prudential Bharat Consumption Fund - Series 5 IPBCOF5 Closed Ended Equity scheme following Consumption Theme 51ICICI Prudential Long Term Wealth Enhancement Fund IPLTWE Closed Ended Equity Linked Savings Scheme (ELSS) with a statutory lock in of 3 years and tax benefit 52ICICI Prudential R.I.G.H.T (Rewards of investing & generation of healthy tax savings) Fund IPRIGHT Closed Ended Equity ELSS 53Hybrid Category ICICI Prudential Equity & Debt Fund IPEDF Aggressive An open ended hybrid scheme investing predominantly in equity and equity related instruments 54-55 Hybrid Fund ICICI Prudential Equity Arbitrage Fund IPEAF Arbitrage Fund An open ended scheme investing in arbitrage opportunities 56-57ICICI Prudential Balanced Advantage Fund IPBAF An open ended dynamic asset allocation fund 58-59 ICICI Prudential Equity Savings Fund IPESF An open ended scheme investing in equity, arbitrage and debt 60-61ICICI Prudential Regular Savings Fund IPRSF Conservative An open ended hybrid scheme investing predominantly in debt instruments Hybrid Fund 62ICICI Prudential Multi-Asset Fund IPMAF Multi Asset An open ended scheme investing in multi assets 63-64 Allocation Fund Of Funds SchemesICICI Prudential Asset Allocator Fund IPAAF Other Scheme An open ended fund of funds scheme investing in equity oriented schemes, debt oriented schemes and 65 gold ETFs/schemes.Solution Oriented Scheme ICICI Prudential Child Care Fund (Gift Plan) IPCCF(GP) Solution oriented Diversified Long Term Child Benefit Oriented Plan 66 schemeICICI Prudential Retirement Fund IPRF Solution Oriented An open ended Retirement Solution Oriented Scheme 67-70 Scheme Debt Schemes ICICI Prudential Overnight Fund IPOF Overnight Fund An open ended debt scheme investing in overnight securities. 71ICICI Prudential Liquid Fund IPLF Liquid Fund Investment in Debt and money market securities with maturity of upto 91 days only 72ICICI Prudential Money Market Fund IPMMF Money Market An open ended debt scheme investing in money market instruments 73 Fund ICICI Prudential Ultra Short Term Fund IPUSTF Ultra Short An open ended debt scheme with Macaulay Duration between 3-6 months 74 Duration Fund ICICI Prudential Savings Fund IPSF Low Duration Fund An open ended debt scheme with Macaulay Duration between 6 - 12 months 75ICICI Prudential Floating Interest Fund IPFIF Floater Fund An open ended debt scheme predominantly investing in floating rate instruments 76ICICI Prudential Short Term Fund IPSTF Short Duration An open ended debt scheme with Macaulay Duration between 1 – 3 years 77 Fund ICICI Prudential Bond Fund IPBF Medium to Long An open ended debt scheme with Macaulay Duration between 4 – 7 years 78 Duration Fund ICICI Prudential Corporate Bond Fund IPCBF Corporate Bond An open ended debt scheme predominantly investing in AA+ or above rated securities. 79 Fund
Equity Linked Savings Scheme (ELSS)
Dynamic Asset Allocation/ Balanced Advantage Fund
Fund Name
Equity Savings Fund
Index
9
Abbreviation Category Description Page No
Gilt Fund with 10-year Constant Duration
Fund Name
ICICI Prudential Banking & PSU Debt Fund IPBPDF Banking & PSU An open ended debt scheme predominantly investing in Debt instruments of banks, 80 Fund Public Sector Undertakings, Public Financial Institutions ICICI Prudential Credit Risk Fund IPCRF Credit Risk Fund An open ended debt scheme predominantly investing in AA and below rated corporate bonds. 81-82ICICI Prudential Medium Term Bond Fund IPMTBF Medium Duration An open ended debt scheme with Macaulay Duration between 3 – 4 years 83 Fund ICICI Prudential Long Term Bond Fund IPLTBF Long Duration An open ended debt scheme with Macaulay duration greater than 7 years 84 Fund ICICI Prudential All Seasons Bond Fund IPASBF Dynamic Bond An open ended dynamic debt scheme investing across duration 85ICICI Prudential Gilt Fund IPGF Gilt Fund An open ended debt scheme investing in government securities across maturity 86ICICI Prudential Constant Maturity Gilt Fund IPCMGF An open ended debt scheme having minimum investment in Gsecs- 80% and Macaulay 87 duration of 10 yearsOther Schemes Index and ETFs ICICI Prudential Nifty 100 ETF IPN100ETF Other Schemes An open ended exchange traded fund tracking Nifty 100 TRI 88ICICI Prudential Nifty Index Fund IPNIF Other Schemes Nifty Index Fund 89ICICI Prudential Nifty ETF IPNETF Other Schemes An open ended exchange traded fund tracking Nifty 50 TRI 90ICICI Prudential Nifty Low Vol 30 ETF IPNLV30ETF Other Schemes An open ended exchange traded fund tracking Nifty 100 Low Volatility 30 TRI 91ICICI Prudential Nifty Next 50 Index Fund IPNN50IF Other Schemes An open ended Index scheme replicating Nifty Next 50 Index 92ICICI Prudential Sensex Index Fund IPSIF Other Schemes An open ended Index scheme replicating S&P BSE SENSEX TRI Index 93ICICI Prudential NV20 ETF IPNV20ETF Other Schemes An open ended exchange traded fund tracking Nifty50 Value 20 Index 94ICICI Prudential Sensex ETF IPSETF Other Schemes An open ended Exchange Traded Fund tracking S&P BSE SENSEX TRI Index 95ICICI Prudential Midcap Select ETF IPMSETF Other Schemes An open ended exchange traded fund tracking S&P BSE Midcap Select TRI 96BHARAT 22 ETF BHARATETF Other Schemes An open-ended Exchange Traded Fund investing in S&P BSE Bharat 22 TRI 97ICICI Prudential S&P BSE 500 ETF IPS&PBSE500 Other Schemes An Open-ended Exchange Traded Fund replicating/tracking S&P BSE 500 TRI 98-100ICICI Prudential Nifty Next 50 ETF ETF Other Schemes An open-ended Exchange Traded Fund replicating/ tracking NIFTY Next 50 IndexIPNN50 101ICICI Prudential Bank ETF IPBETF Other Schemes An open-ended Exchange Traded Fund tracking NIFTY Bank Index. 102ICICI Prudential Private Banks ETF IPPBETF Other Schemes An open-ended Exchange Traded Fund replicating / tracking NIFTY Private Bank Index) 103ICICI Prudential Liquid ETF IPLETF Other Schemes An open-ended Exchange Traded Fund tracking S&P BSE Liquid Rate Index 104Gold Funds & ETFs ICICI Prudential Gold ETF IPGETF Other Schemes An open ended exchange traded fund replicating domestic prices of gold 105ICICI Prudential Regular Gold Savings Fund IPRGSF Other Schemes An Open Ended Fund of Funds scheme investing in ICICI Prudential Gold ETF 106ICICI Prudential BHARAT 22 FOF BHARATFOF Other Schemes An open ended fund of funds scheme investing in BHARAT 22 ETF 107ICICI Prudential Fund of Fund Series IPAS Other Schemes Fund of Funds Scheme 108Annexure for Returns of all the Schemes 109-127Systematic Investment Plan (SIP) Performance of 128-130Select Schemes Annexure - I 131Annexure - II 132Dividend History for all Schemes 132-140Investment Objective of all the schemes 141-145Schedule 1: One Liner Definitions 146Schedule 2: How To Read Factsheet 147-148Statutory Details & Risk Factors 149
Style Box
Quantitative Indicators
Fund Details
• Top Ten HoldingsDerivatives are considered at exposure value.@Short Term < 8 Years, Long Term > 8 Years.
Fund Managers** :
Anish Tawakley(Managing this fund since Sep, 2018 & Overall 24 years of experience)Rajat Chandak(Managing this fund since Jul, 2017 &Overall 11 years of experience)
Indicative Investment Horizon: 5 yearsand above
Inception/Allotment date: 23-May-08
Options :Growth & Dividend(dividend payout*** and re-investment facility available)
Application Amount for freshSubscription :Rs.100 (plus in multiples of Re.1)
Min.Addl.Investment :Rs.100 (plus in multiples of Re.1)
Exit load for Redemption / Switchout :- Lumpsum & SIP / STP / SWP OptionUpto 1 Year from allotment - 1% of appli-cable NAV, more than 1 Year - Nil
##SIP :Daily, Weekly, Fortnightly & Monthly Frequency: Rs. 100/- and in multiple of Rs. 1/-Quarterly Frequency: Rs. 5,000/- and in multiple of Rs. 1/-
&&SWP :Rs. 500/- and in multiples of Rs. 1/-
STP/ Flex STP/ Value STP *:Daily Frequency: Rs. 250/- and inmultiples of Rs. 1/-Weekly, Monthly and Quarterly Frequency: Rs. 1,000/- and in multiples of Rs. 1/-
Min.Redemption Amt. :Rs. 100/- (plus in multiples of Re. 1/-)
10
Std Dev (Annualised) : 11.40% Sharpe Ratio : 0.23
Average P/E : 31.23 Average P/BV : 5.16 Average Dividend Yield : 1.58
Portfolio Beta : 0.86 R squared : 0.95
Portfolio turnover has been computed as the ratio of the lower value of purchase and sales, to the average net assets in the past one year (since inception for schemes that have not completed a year). The figures are not netted for derivative transactions.Risk-free rate based on the last Overnight MIBOR cut-off of 5.45%**In addition to the fund manager managing this fund, overseas investment is managed by Ms. Priyanka Khandelwal.@@ Total Expense Ratio is as on the last business day of the month.##
Daily, Weekly and Fortnightly frequencies are available in Systematic Investment Plan (SIP), in addition to existing Monthly & Quarterly frequencies with effect from February 1, 2019. Minimum number of installments for daily, weekly, fortnightly and monthly frequencies will be 6 and for Quarterly frequency will be 4.* Minimum number of installments for daily, weekly and monthly frequency will be 6 and for Quarterly frequency will be 4. w.e.f February 01, 2017. Refer page No. 148 for definition of Flex STP and Value STP.&& Monthly, Quarterly, Half Yearly and Annual frequencies are available in Systematic Withdrawal Plan (SWP). The minimum number of instalments for all the frequencies will be 2.*** In case the unit holder has opted for dividend payout option, the minimum amount for dividend payout shall be 100 (net of dividend distribution tax and other statutory levy, if any), else the dividend would be mandatorily reinvested.
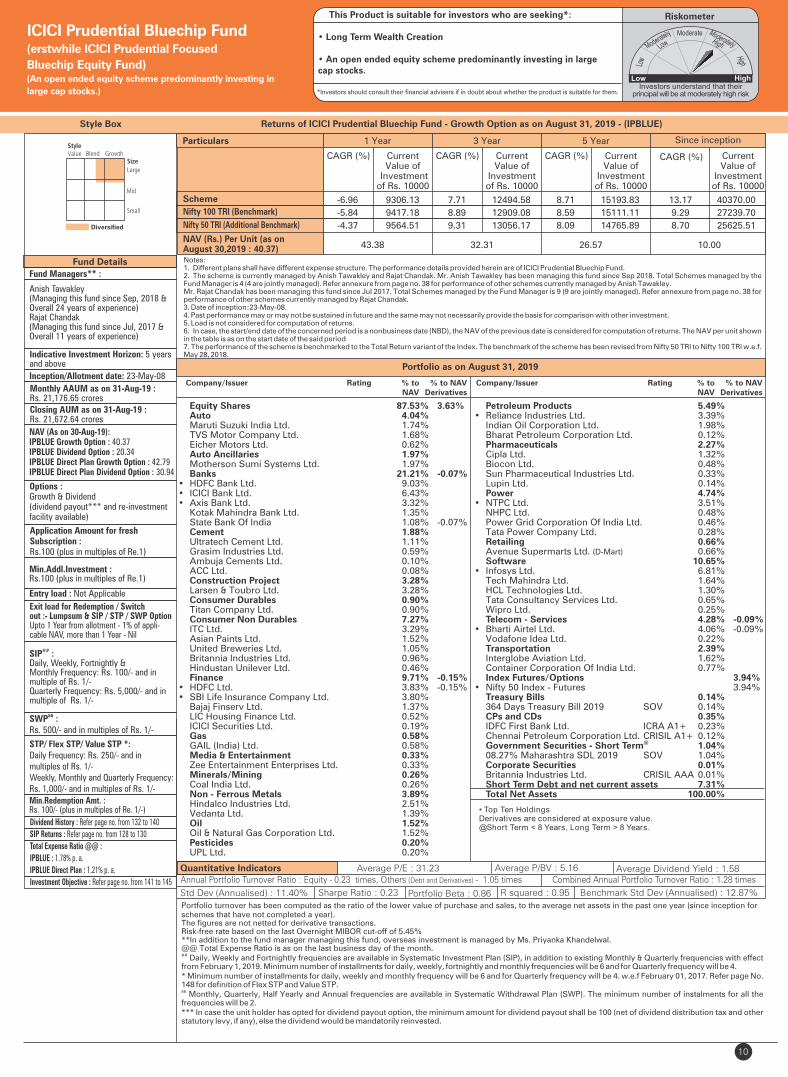
Style Box Returns of ICICI Prudential Bluechip Fund - Growth Option as on August 31, 2019 - (IPBLUE)
Monthly AAUM as on 31-Aug-19 : Rs. 21,176.65 crores
Portfolio as on August 31, 2019
ICICI Prudential Bluechip Fund(erstwhile ICICI Prudential Focused
Bluechip Equity Fund)(An open ended equity scheme predominantly investing in
large cap stocks.)
Closing AUM as on 31-Aug-19 : Rs. 21,672.64 crores
Benchmark Std Dev (Annualised) : 12.87%
Entry load : Not Applicable
Dividend History : Refer page no. from 132 to 140
SIP Returns : Refer page no. from 128 to 130
Total Expense Ratio @@ :
IPBLUE : 1.78% p. a.
IPBLUE Direct Plan : 1.21% p. a.
Investment Objective : Refer page no. from 141 to 145
Riskometer
• Long Term Wealth Creation
• An open ended equity scheme predominantly investing in large cap stocks.
This Product is suitable for investors who are seeking*:
*Investors should consult their financial advisers if in doubt about whether the product is suitable for them.
Annual Portfolio Turnover Ratio : Equity - 0.23 times, Others (Debt and Derivatives) - 1.05 times Combined Annual Portfolio Turnover Ratio : 1.28 times
Notes:1. Different plans shall have different expense structure. The performance details provided herein are of ICICI Prudential Bluechip Fund.2. The scheme is currently managed by Anish Tawakley and Rajat Chandak. Mr. Anish Tawakley has been managing this fund since Sep 2018. Total Schemes managed by the Fund Manager is 4 (4 are jointly managed). Refer annexure from page no. 38 for performance of other schemes currently managed by Anish Tawakley.Mr. Rajat Chandak has been managing this fund since Jul 2017. Total Schemes managed by the Fund Manager is 9 (9 are jointly managed). Refer annexure from page no. 38 for performance of other schemes currently managed by Rajat Chandak.3. Date of inception:23-May-08.4. Past performance may or may not be sustained in future and the same may not necessarily provide the basis for comparison with other investment.5. Load is not considered for computation of returns.6. In case, the start/end date of the concerned period is a nonbusiness date (NBD), the NAV of the previous date is considered for computation of returns. The NAV per unit shown in the table is as on the start date of the said period7. The performance of the scheme is benchmarked to the Total Return variant of the Index. The benchmark of the scheme has been revised from Nifty 50 TRI to Nifty 100 TRI w.e.f. May 28, 2018.
Scheme
NAV (Rs.) Per Unit (as on August 30,2019 : 40.37)
CAGR (%)
10.00
Nifty 100 TRI (Benchmark)
Since inception
CurrentValue of
Investment of Rs. 10000
CAGR (%) Current Value of
Investment of Rs. 10000
1 Year 3 Year 5 Year
CAGR (%) Current Value of
Investment of Rs. 10000
CAGR (%) Current Value of
Investment of Rs. 10000
43.38 32.31 26.57
Particulars
-6.96 9306.13 7.71 12494.58 8.71 15193.83 13.17 40370.00
-5.84 9417.18 8.89 12909.08 8.59 15111.11 9.29 27239.70
-4.37 9564.51 9.31 13056.17 8.09 14765.89 8.70 25625.51Diversified Nifty 50 TRI (Additional Benchmark)
NAV (As on 30-Aug-19):IPBLUE Growth Option : 40.37IPBLUE Dividend Option : 20.34IPBLUE Direct Plan Growth Option : 42.79IPBLUE Direct Plan Dividend Option : 30.94
Equity Shares 87.53% 3.63% Auto 4.04% Maruti Suzuki India Ltd. 1.74% TVS Motor Company Ltd. 1.68% Eicher Motors Ltd. 0.62% Auto Ancillaries 1.97% Motherson Sumi Systems Ltd. 1.97% Banks 21.21% -0.07%• HDFC Bank Ltd. 9.03% • ICICI Bank Ltd. 6.43% • Axis Bank Ltd. 3.32% Kotak Mahindra Bank Ltd. 1.35% State Bank Of India 1.08% -0.07% Cement 1.88% Ultratech Cement Ltd. 1.11% Grasim Industries Ltd. 0.59% Ambuja Cements Ltd. 0.10% ACC Ltd. 0.08% Construction Project 3.28% Larsen & Toubro Ltd. 3.28% Consumer Durables 0.90% Titan Company Ltd. 0.90% Consumer Non Durables 7.27% ITC Ltd. 3.29% Asian Paints Ltd. 1.52% United Breweries Ltd. 1.05% Britannia Industries Ltd. 0.96% Hindustan Unilever Ltd. 0.46% Finance 9.71% -0.15%• HDFC Ltd. 3.83% -0.15%• SBI Life Insurance Company Ltd. 3.80% Bajaj Finserv Ltd. 1.37% LIC Housing Finance Ltd. 0.52% ICICI Securities Ltd. 0.19% Gas 0.58% GAIL (India) Ltd. 0.58% Media & Entertainment 0.33% Zee Entertainment Enterprises Ltd. 0.33% Minerals/Mining 0.26% Coal India Ltd. 0.26% Non - Ferrous Metals 3.89% Hindalco Industries Ltd. 2.51% Vedanta Ltd. 1.39% Oil 1.52% Oil & Natural Gas Corporation Ltd. 1.52% Pesticides 0.20% UPL Ltd. 0.20%
Petroleum Products 5.49% • Reliance Industries Ltd. 3.39% Indian Oil Corporation Ltd. 1.98% Bharat Petroleum Corporation Ltd. 0.12% Pharmaceuticals 2.27% Cipla Ltd. 1.32% Biocon Ltd. 0.48% Sun Pharmaceutical Industries Ltd. 0.33% Lupin Ltd. 0.14% Power 4.74% • NTPC Ltd. 3.51% NHPC Ltd. 0.48% Power Grid Corporation Of India Ltd. 0.46% Tata Power Company Ltd. 0.28% Retailing 0.66% Avenue Supermarts Ltd. (D-Mart) 0.66% Software 10.65% • Infosys Ltd. 6.81% Tech Mahindra Ltd. 1.64% HCL Technologies Ltd. 1.30% Tata Consultancy Services Ltd. 0.65% Wipro Ltd. 0.25% Telecom - Services 4.28% -0.09%• Bharti Airtel Ltd. 4.06% -0.09% Vodafone Idea Ltd. 0.22% Transportation 2.39% Interglobe Aviation Ltd. 1.62% Container Corporation Of India Ltd. 0.77% Index Futures/Options 3.94%• Nifty 50 Index - Futures 3.94% Treasury Bills 0.14% 364 Days Treasury Bill 2019 SOV 0.14% CPs and CDs 0.35% IDFC First Bank Ltd. ICRA A1+ 0.23% Chennai Petroleum Corporation Ltd. CRISIL A1+ 0.12%
@ Government Securities - Short Term 1.04% 08.27% Maharashtra SDL 2019 SOV 1.04% Corporate Securities 0.01% Britannia Industries Ltd. CRISIL AAA 0.01% Short Term Debt and net current assets 7.31% Total Net Assets 100.00%
Company/Issuer Rating % to % to NAV NAV Derivatives
Company/Issuer Rating % to % to NAV NAV Derivatives
11
Fund Details
Quantitative Indicators
Style Box
Portfolio as on August 31, 2019
Fund Managers** :
Sankaran Naren (Managing this fund from Feb 2012, earlier managed from Aug 2009 to Feb 2011 & has Overall 29 Years of experience)Mr Prakash Gaurav Goel (Managing this fund since October, 2017 & Overall 16 years of experience)
Inception/Allotment date: 09-Jul-98
Indicative Investment Horizon: 5 yearsand above
NAV (As on 30-Aug-19):IPLMCF Growth Option : 303.52IPLMCF Dividend Option : 15.03IPLMCF Direct Plan Growth Option : 322.98IPLMCF Direct Plan Dividend Option : 21.04
Options :Growth, Dividend(dividend payout*** and re-investment facility available)
Application Amount for freshSubscription :Rs.5,000 (plus in multiples of Re.1)
Min.Addl.Investment :Rs.1,000 (plus in multiples of Re.1)
Exit load for Redemption / Switchout :- Lumpsum & SIP / STP / SWP OptionWithin 1 month from allotment - 1% ofapplicable NAV, more than 1 month - Nil(w.e.f. 1st Jan 2019)
&&SWP :Rs. 500/- and in multiples of Rs. 1/-
STP/ Flex STP/ Value STP * :Daily Frequency: Rs. 250/- and in multiples of Rs. 1/-Weekly, Monthly and Quarterly Frequency: Rs. 1,000/- and in multiples of Rs. 1/-
Min.Redemption Amt. :500/- or all units where amount is below 500/-
Std Dev (Annualised) : 11.96% Sharpe Ratio : -0.04
Average P/E : 25.59 Average P/BV : 2.93 Average Dividend Yield : 1.96
Portfolio Beta : 0.79 R squared : 0.84
Portfolio turnover has been computed as the ratio of the lower value of purchase and sales, to the average net assets in the past one year (since inception for schemes that have not completed a year). The figures are not netted for derivative transactions.Risk-free rate based on the last Overnight MIBOR cut-off of 5.45%**In addition to the fund manager managing this fund, overseas investment is managed by Ms. Priyanka Khandelwal.@@ Total Expense Ratio is as on the last business day of the month.
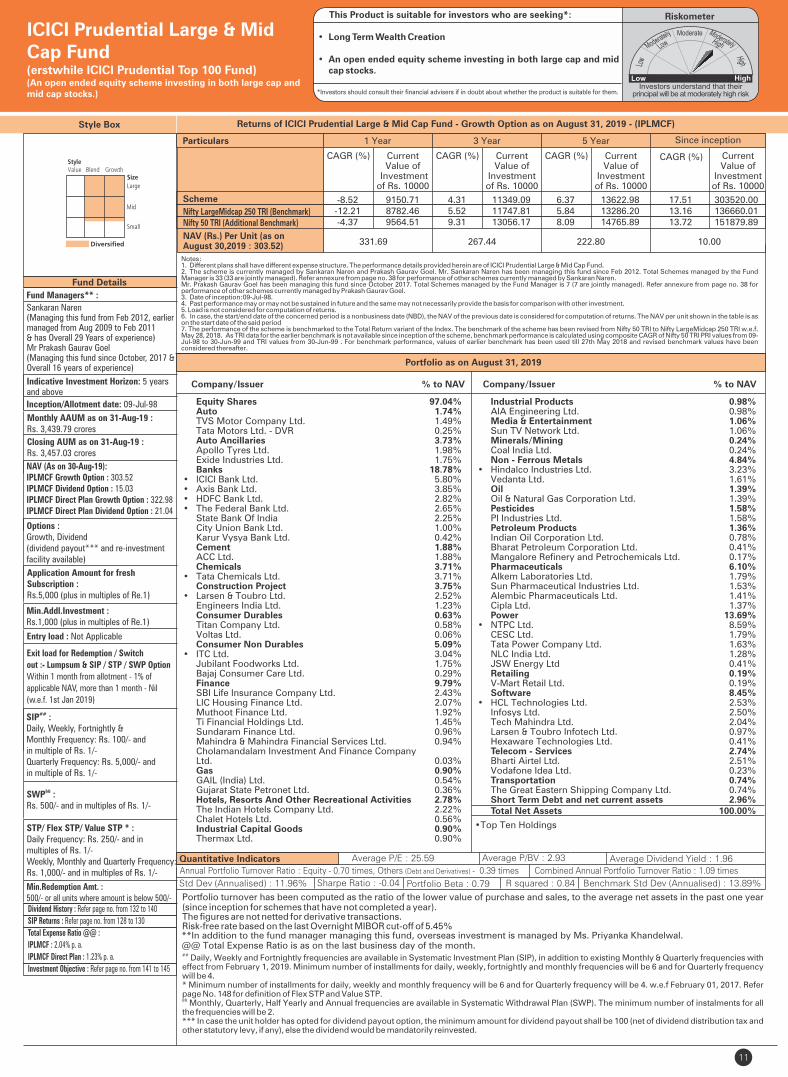
Returns of ICICI Prudential Large & Mid Cap Fund - Growth Option as on August 31, 2019 - (IPLMCF)
Monthly AAUM as on 31-Aug-19 : Rs. 3,439.79 crores
ICICI Prudential Large & Mid Cap Fund(erstwhile ICICI Prudential Top 100 Fund)(An open ended equity scheme investing in both large cap and mid cap stocks.)
Closing AUM as on 31-Aug-19 : Rs. 3,457.03 crores
Benchmark Std Dev (Annualised) : 13.89%
Entry load : Not Applicable
RiskometerThis Product is suitable for investors who are seeking*:
• Long Term Wealth Creation
• An open ended equity scheme investing in both large cap and mid cap stocks.
*Investors should consult their financial advisers if in doubt about whether the product is suitable for them.
Annual Portfolio Turnover Ratio : Equity - 0.70 times, Others (Debt and Derivatives) - 0.39 times Combined Annual Portfolio Turnover Ratio : 1.09 times
## Daily, Weekly and Fortnightly frequencies are available in Systematic Investment Plan (SIP), in addition to existing Monthly & Quarterly frequencies with
effect from February 1, 2019. Minimum number of installments for daily, weekly, fortnightly and monthly frequencies will be 6 and for Quarterly frequency will be 4.* Minimum number of installments for daily, weekly and monthly frequency will be 6 and for Quarterly frequency will be 4. w.e.f February 01, 2017. Refer page No. 148 for definition of Flex STP and Value STP.&& Monthly, Quarterly, Half Yearly and Annual frequencies are available in Systematic Withdrawal Plan (SWP). The minimum number of instalments for all the frequencies will be 2.*** In case the unit holder has opted for dividend payout option, the minimum amount for dividend payout shall be 100 (net of dividend distribution tax and other statutory levy, if any), else the dividend would be mandatorily reinvested.
Dividend History : Refer page no. from 132 to 140
SIP Returns : Refer page no. from 128 to 130
Total Expense Ratio @@ :
IPLMCF : 2.04% p. a.
IPLMCF Direct Plan : 1.23% p. a.
Investment Objective : Refer page no. from 141 to 145
##SIP :Daily, Weekly, Fortnightly & Monthly Frequency: Rs. 100/- and in multiple of Rs. 1/-Quarterly Frequency: Rs. 5,000/- and in multiple of Rs. 1/-
Notes:1. Different plans shall have different expense structure. The performance details provided herein are of ICICI Prudential Large & Mid Cap Fund.2. The scheme is currently managed by Sankaran Naren and Prakash Gaurav Goel. Mr. Sankaran Naren has been managing this fund since Feb 2012. Total Schemes managed by the Fund Manager . Refer annexure from page no. 38 for performance of other schemes currently managed by Sankaran Naren.is 33 (33 are jointly managed)Mr. Prakash Gaurav Goel has been managing this fund since October 2017. Total Schemes managed by the Fund Manager . Refer annexure from page no. 38 for is 7 (7 are jointly managed)performance of other schemes currently managed by Prakash Gaurav Goel. 3. Date of inception:09-Jul-98.4. Past performance may or may not be sustained in future and the same may not necessarily provide the basis for comparison with other investment.5. Load is not considered for computation of returns.6. In case, the start/end date of the concerned period is a nonbusiness date (NBD), the NAV of the previous date is considered for computation of returns. The NAV per unit shown in the table is as on the start date of the said period7. The performance of the scheme is benchmarked to the Total Return variant of the Index. The benchmark of the scheme has been revised from Nifty 50 TRI to Nifty LargeMidcap 250 TRI w.e.f. May 28, 2018. As TRI data for the earlier benchmark is not available since inception of the scheme, benchmark performance is calculated using composite CAGR of Nifty 50 TRI PRI values from 09-Jul-98 to 30-Jun-99 and TRI values from 30-Jun-99 . For benchmark performance, values of earlier benchmark has been used till 27th May 2018 and revised benchmark values have been considered thereafter.
Scheme
NAV (Rs.) Per Unit (as on August 30,2019 : 303.52)
CAGR (%)
10.00
Nifty LargeMidcap 250 TRI (Benchmark)
Since inception
CurrentValue of
Investment of Rs. 10000
CAGR (%) Current Value of
Investment of Rs. 10000
1 Year 3 Year 5 Year
CAGR (%) Current Value of
Investment of Rs. 10000
CAGR (%) Current Value of
Investment of Rs. 10000
331.69 267.44 222.80
Particulars
• Top Ten Holdings
Nifty 50 TRI (Additional Benchmark)
-8.52 9150.71 4.31 11349.09 6.37 13622.98 17.51 303520.00 -12.21 8782.46 5.52 11747.81 5.84 13286.20 13.16 136660.01 -4.37 9564.51 9.31 13056.17 8.09 14765.89 13.72 151879.89
Equity Shares 97.04% Auto 1.74% TVS Motor Company Ltd. 1.49% Tata Motors Ltd. - DVR 0.25% Auto Ancillaries 3.73% Apollo Tyres Ltd. 1.98% Exide Industries Ltd. 1.75% Banks 18.78%• ICICI Bank Ltd. 5.80%• Axis Bank Ltd. 3.85%• HDFC Bank Ltd. 2.82%• The Federal Bank Ltd. 2.65% State Bank Of India 2.25% City Union Bank Ltd. 1.00% Karur Vysya Bank Ltd. 0.42% Cement 1.88% ACC Ltd. 1.88% Chemicals 3.71%• Tata Chemicals Ltd. 3.71% Construction Project 3.75%• Larsen & Toubro Ltd. 2.52% Engineers India Ltd. 1.23% Consumer Durables 0.63% Titan Company Ltd. 0.58% Voltas Ltd. 0.06% Consumer Non Durables 5.09%• ITC Ltd. 3.04% Jubilant Foodworks Ltd. 1.75% Bajaj Consumer Care Ltd. 0.29% Finance 9.79% SBI Life Insurance Company Ltd. 2.43% LIC Housing Finance Ltd. 2.07% Muthoot Finance Ltd. 1.92% Ti Financial Holdings Ltd. 1.45% Sundaram Finance Ltd. 0.96% Mahindra & Mahindra Financial Services Ltd. 0.94% Cholamandalam Investment And Finance Company Ltd. 0.03% Gas 0.90% GAIL (India) Ltd. 0.54% Gujarat State Petronet Ltd. 0.36% Hotels, Resorts And Other Recreational Activities 2.78% The Indian Hotels Company Ltd. 2.22% Chalet Hotels Ltd. 0.56% Industrial Capital Goods 0.90% Thermax Ltd. 0.90%
Company/Issuer % to NAV
Industrial Products 0.98% AIA Engineering Ltd. 0.98% Media & Entertainment 1.06% Sun TV Network Ltd. 1.06% Minerals/Mining 0.24% Coal India Ltd. 0.24% Non - Ferrous Metals 4.84%• Hindalco Industries Ltd. 3.23% Vedanta Ltd. 1.61% Oil 1.39% Oil & Natural Gas Corporation Ltd. 1.39% Pesticides 1.58% PI Industries Ltd. 1.58% Petroleum Products 1.36% Indian Oil Corporation Ltd. 0.78% Bharat Petroleum Corporation Ltd. 0.41% Mangalore Refinery and Petrochemicals Ltd. 0.17% Pharmaceuticals 6.10% Alkem Laboratories Ltd. 1.79% Sun Pharmaceutical Industries Ltd. 1.53% Alembic Pharmaceuticals Ltd. 1.41% Cipla Ltd. 1.37% Power 13.69%• NTPC Ltd. 8.59% CESC Ltd. 1.79% Tata Power Company Ltd. 1.63% NLC India Ltd. 1.28% JSW Energy Ltd 0.41% Retailing 0.19% V-Mart Retail Ltd. 0.19% Software 8.45%• HCL Technologies Ltd. 2.53% Infosys Ltd. 2.50% Tech Mahindra Ltd. 2.04% Larsen & Toubro Infotech Ltd. 0.97% Hexaware Technologies Ltd. 0.41% Telecom - Services 2.74% Bharti Airtel Ltd. 2.51% Vodafone Idea Ltd. 0.23% Transportation 0.74% The Great Eastern Shipping Company Ltd. 0.74% Short Term Debt and net current assets 2.96% Total Net Assets 100.00%
Company/Issuer % to NAV

12
Style Box
Fund Details
Quantitative Indicators
Fund Managers** :
Sankaran Naren (Managing this fund from Oct, 2018 &Overall 29 years of experience)Atul Patel(Managing this fund since Aug, 2016 &Overall 10 years of experience)
Indicative Investment Horizon: 5 years and above
Inception/Allotment date: 01-Oct-94
NAV (As on 30-Aug-19):IPMUF Growth Option : 273.67IPMUF Dividend Option : 21.31IPMUF Direct Plan Growth Option : 289.94IPMUF Direct Plan Dividend Option : 29.42
Options :Growth & Dividend(dividend payout*** and re-investment facility available)
Application Amount for freshSubscription :Rs.5,000 (plus in multiples of Re.1)
Min.Addl.Investment :Rs.1,000 (plus in multiples of Re.1)
Exit load for Redemption / Switchout :- Lumpsum & SIP / STP / SWP OptionUp to 12 Months from allotment - 1% of applicable NAV, More than 12 Months - Nil(w.e.f. 24 August, 2018)
&&SWP :Rs. 500/- and in multiples of Rs. 1/-
STP/ Flex STP/ Value STP * :Daily Frequency: Rs. 250/- and in multiples of Rs. 1/-Weekly, Monthly and Quarterly Frequency: Rs. 1,000/- and in multiples of Rs. 1/-
Min.Redemption Amt. : 500/- or all units where amount is below 500/-
Std Dev (Annualised) : 12.23% Sharpe Ratio: 0.04
Average P/E : 26.72 Average P/BV : 3.39 Average Dividend Yield : 2.08
Portfolio Beta : 0.84 R squared : 0.87
Portfolio turnover has been computed as the ratio of the lower value of purchase and sales, to the average net assets in the past one year (since inception for schemes that have not completed a year). The figures are not netted for derivative transactions.Risk-free rate based on the last Overnight MIBOR cut-off of 5.45%**In addition to the fund manager managing this fund, overseas investment is managed by Ms. Priyanka Khandelwal.@@ Total Expense Ratio is as on the last business day of the month.##
Daily, Weekly and Fortnightly frequencies are available in Systematic Investment Plan (SIP), in addition to existing Monthly & Quarterly frequencies with effect from February 1, 2019. Minimum number of installments for daily, weekly, fortnightly and monthly frequencies will be 6 and for Quarterly frequency will be 4.* Minimum number of installments for daily, weekly and monthly frequency will be 6 and for Quarterly frequency will be 4. w.e.f February 01, 2017. Refer page No. 148 for definition of Flex STP and Value STP.&& Monthly, Quarterly, Half Yearly and Annual frequencies are available in Systematic Withdrawal Plan (SWP). The minimum number of instalments for all the frequencies will be 2.*** In case the unit holder has opted for dividend payout option, the minimum amount for dividend payout shall be 100 (net of dividend distribution tax and other statutory levy, if any), else the dividend would be mandatorily reinvested.
• Top Ten Holdings^ Value Less than 0.01% of NAV in absolute terms.
Portfolio as on August 31, 2019
Returns of ICICI Prudential Multicap Fund - Growth Option as on August 31, 2019 - (IPMUF)
Monthly AAUM as on 31-Aug-19 : Rs. 3,919.78 crores
Closing AUM as on 31-Aug-19 : Rs. 3,990.54 crores
ICICI Prudential Multicap Fund
Benchmark Std Dev (Annualised) : 13.49%
(An open ended equity scheme investing across large cap, mid cap and small cap stocks)
Entry load : Not Applicable
RiskometerThis Product is suitable for investors who are seeking*:
• Long Term Wealth Creation
• An open ended equity scheme investing across large cap, mid cap and small cap stocks.
*Investors should consult their financial advisers if in doubt about whether the product is suitable for them.
Annual Portfolio Turnover Ratio : Equity - 0.94 times, Others (Debt and Derivatives) - 0.24 times Combined Annual Portfolio Turnover Ratio : 1.18 times
Dividend History : Refer page no. from 132 to 140
SIP Returns : Refer page no. from 128 to 130
Total Expense Ratio @@ :
IPMUF : 2.08% p. a.
IPMUF Direct Plan : 1.19% p. a.
Investment Objective : Refer page no. from 141 to 145
##SIP :Daily, Weekly, Fortnightly & Monthly Frequency: Rs. 100/- and in multiple of Rs. 1/-Quarterly Frequency: Rs. 5,000/- and in multiple of Rs. 1/-
Notes:1. Different plans shall have different expense structure. The performance details provided herein are of ICICI Prudential Multicap Fund.2. The scheme is currently managed by Sankaran Naren and Atul Patel. Mr. Sankaran Naren has been managing this fund since Oct 2018. Total Schemes managed by the Fund Manager is 33 (33 are jointly managed). Refer annexure from page no. 38 for performance of other schemes currently managed by Sankaran Naren.Mr. Atul Patel has been managing this fund since Aug 2016 . Total Schemes managed by the Fund Manager is 8 (6 are jointly managed). Refer annexure from page no. 38 for performance of other schemes currently managed by Atul Patel .3. Date of inception:01-Oct-944. Past performance may or may not be sustained in future and the same may not necessarily provide the basis for comparison with other investment.5. Load is not considered for computation of returns.6. In case, the start/end date of the concerned period is a nonbusiness date (NBD), the NAV of the previous date is considered for computation of returns. The NAV per unit shown in the table is as on the start date of the said period7. As the scheme was launched before the launch of the benchmark index, benchmark index figures since inception or the required period are not available.8. The performance of the scheme is benchmarked to the Total Return variant of the Index. As TRI data is not available since inception of the scheme, the additional benchmark performance is calculated using composite CAGR of Nifty 50 TRI PRI values from 01-Oct-94 to 30-Jun-99 and TRI values since 30-Jun-99. The benchmark of the scheme has been revised from S&P BSE 200 Index to S&P BSE 500 TRI w.e.f. May 28, 2018.
Scheme
Nifty 50 TRI (Additional Benchmark)
NAV (Rs.) Per Unit (as on August 30,2019 : 273.67)
CAGR (%)
10.00
S&P BSE 500 TRI (Benchmark)
Since inception
CurrentValue of
Investment of Rs. 10000
CAGR (%) Current Value of
Investment of Rs. 10000
1 Year 3 Year 5 Year
CAGR (%) Current Value of
Investment of Rs. 10000
CAGR (%) Current Value of
Investment of Rs. 10000
305.11 234.37 176.04
Particulars
-10.33 8969.55 5.31 11676.84 9.21 15545.90 14.20 273670.00
-9.03 9099.31 7.68 12483.38 8.46 15015.76 NA NA
-4.37 9564.51 9.31 13056.17 8.09 14765.89 10.22 113104.05
Equity Shares 92.89% Auto 2.96% TVS Motor Company Ltd. 1.61% Maruti Suzuki India Ltd. 1.35% Auto Ancillaries 3.18% Motherson Sumi Systems Ltd. 1.57% Sandhar Technologies Ltd. 0.77% Varroc Engineering Ltd. 0.56% Apollo Tyres Ltd. 0.16% Minda Industries Ltd. 0.12% Banks 18.98%• ICICI Bank Ltd. 5.89%• State Bank Of India 4.76%• Axis Bank Ltd. 3.30% HDFC Bank Ltd. 2.00% The Federal Bank Ltd. 1.19% Bank Of Baroda 1.02% Karur Vysya Bank Ltd. 0.59% The Karnataka Bank Ltd. 0.22% Cement 2.87% ACC Ltd. 1.26% JK Cement Ltd. 0.65% Ambuja Cements Ltd. 0.51% Shree Cements Ltd. 0.46% Chemicals 2.82%• Tata Chemicals Ltd. 2.82% Construction 1.87% PNC Infratech Ltd. 0.48% Capacite Infraprojects Ltd. 0.47% KNR Constructions Ltd. 0.43% The Phoenix Mills Ltd. 0.34% Brigade Enterprises Ltd. 0.14% Construction Project 4.98%• Larsen & Toubro Ltd. 3.55% Engineers India Ltd. 1.43% Consumer Durables 2.28% Titan Company Ltd. 0.97% Voltas Ltd. 0.82% Relaxo Footwears Ltd. 0.25% Greenlam Industries Limited 0.14% Khadim India Ltd. 0.09% Orient Electric Ltd. 0.02% Consumer Non Durables 7.38%• ITC Ltd. 3.70% Asian Paints Ltd. 1.73% Marico Ltd. 1.45% Bajaj Consumer Care Ltd. 0.30% Britannia Industries Ltd. 0.20% Ferrous Metals 0.32% Tata Steel Ltd. 0.32% Finance 4.85% SBI Life Insurance Company Ltd. 1.83% HDFC Ltd. 1.09% LIC Housing Finance Ltd. 1.06% HDFC Standard Life Insurance Company Ltd. 0.39%
Company/Issuer % to NAV
IDFC Ltd. 0.24% Equitas Holdings Ltd. 0.21% The New India Assurance Company Ltd. 0.05% Gas 1.16% GAIL (India) Ltd. 1.16% Industrial Products 0.72% Cummins India Ltd. 0.72% Minerals/Mining 0.33% Gujarat Mineral Development Corporation Ltd. 0.25% Coal India Ltd. 0.09% Non - Ferrous Metals 4.41% Vedanta Ltd. 2.23% Hindalco Industries Ltd. 1.89% National Aluminium Co. Ltd. 0.29% Oil 4.36%• Oil & Natural Gas Corporation Ltd. 3.71% Oil India Ltd. 0.65% Petroleum Products 2.56% Indian Oil Corporation Ltd. 1.55% Bharat Petroleum Corporation Ltd. 0.45% Mangalore Refinery and Petrochemicals Ltd. 0.33% Chennai Petroleum Corporation Ltd. 0.24% Pharmaceuticals 7.17%• Sun Pharmaceutical Industries Ltd. 2.47% Cipla Ltd. 2.27% Alembic Pharmaceuticals Ltd. 1.29% Alkem Laboratories Ltd. 0.91% Dishman Carbogen Amcis Ltd. 0.23% Power 6.46%• NTPC Ltd. 5.86% CESC Ltd. 0.35% NLC India Ltd. 0.18% Tata Power Company Ltd. 0.07% Retailing 0.76% Arvind Fashions Limited 0.57% V-Mart Retail Ltd. 0.19% Software 7.34% Infosys Ltd. 1.84% Tech Mahindra Ltd. 1.53% HCL Technologies Ltd. 1.41% Cyient Ltd. 1.03% Oracle Financial Services Software Ltd. 0.82% Hexaware Technologies Ltd. 0.72% Telecom - Services 4.43%• Bharti Airtel Ltd. 4.43% Transportation 0.66% Blue Dart Express Ltd. 0.66% Corporate Securities ^ Britannia Industries Ltd. CRISIL AAA ^ Short Term Debt and net current assets 7.11% Total Net Assets 100.00%
Company/Issuer % to NAV
13
Fund Details
Quantitative Indicators
Note : - “Portfolio Beta, Standard Deviation, R Squared, Sharpe Ratio and Tracking Error of the Scheme is not computed owing to the short time frame since launch of the Scheme.”Portfolio turnover has been computed as the ratio of the lower value of purchase and sales, to the average net assets in the past one year (since inception for schemes that have not completed a year).@@ Total Expense Ratio is as on the last business day of the month.*** In case the unit holder has opted for dividend payout option, the minimum amount for dividend payout shall be 100 (net of dividend distribution tax and other statutory levy, if any), else the dividend would be mandatorily reinvested.**In addition to the fund manager managing this fund, overseas investment is managed by Ms. Priyanka Khandelwal.## Daily, Weekly and Fortnightly frequencies are available in Systematic Investment Plan (SIP), in addition to existing Monthly & Quarterly frequencies with effect from February 1, 2019. Minimum number of installments for daily, weekly, fortnightly and monthly frequencies will be 6 and for Quarterly frequency will be 4.* Minimum number of installments for daily, weekly and monthly frequency will be 6 and for Quarterly frequency will be 4. w.e.f February 01, 2017.&& Monthly, Quarterly, Half Yearly and Annual frequencies are available in Systematic Withdrawal Plan (SWP). The minimum number of instalments forall the frequencies will be 2.
Style Box
Fund Managers** :
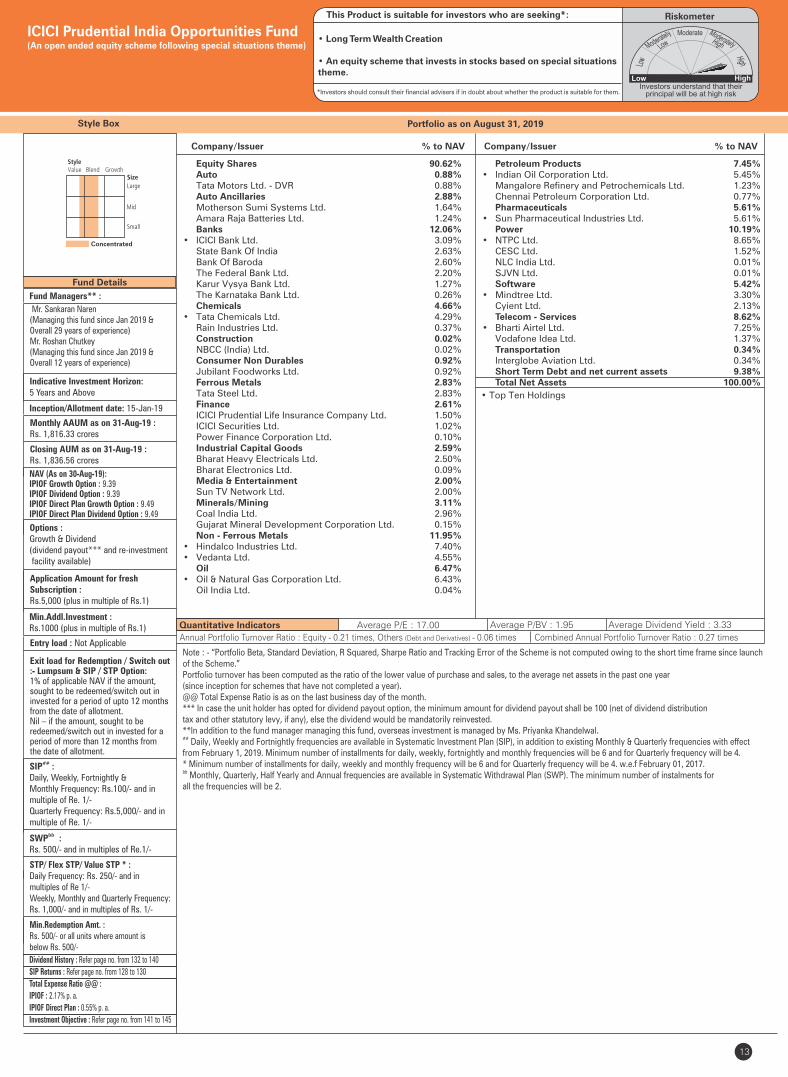
Mr. Sankaran Naren (Managing this fund since Jan 2019 & Overall 29 years of experience) Mr. Roshan Chutkey (Managing this fund since Jan 2019 & Overall 12 years of experience)
Indicative Investment Horizon: 5 Years and Above
Inception/Allotment date: 15-Jan-19
Options :Growth & Dividend (dividend payout*** and re-investment facility available)
Application Amount for freshSubscription :Rs.5,000 (plus in multiple of Rs.1)
Min.Addl.Investment :Rs.1000 (plus in multiple of Rs.1)
Exit load for Redemption / Switch out:- Lumpsum & SIP / STP Option:1% of applicable NAV if the amount, sought to be redeemed/switch out ininvested for a period of upto 12 months from the date of allotment. Nil – if the amount, sought to be redeemed/switch out in invested for a period of more than 12 months from the date of allotment.
##SIP :Daily, Weekly, Fortnightly & Monthly Frequency: Rs.100/- and in multiple of Re. 1/-Quarterly Frequency: Rs.5,000/- and in multiple of Re. 1/-
&&SWP :Rs. 500/- and in multiples of Re.1/-
STP/ Flex STP/ Value STP * :Daily Frequency: Rs. 250/- and in multiples of Re 1/-Weekly, Monthly and Quarterly Frequency: Rs. 1,000/- and in multiples of Rs. 1/-
Min.Redemption Amt. : Rs. 500/- or all units where amount is below Rs. 500/-
Portfolio as on August 31, 2019
Average P/E : 17.00 Average P/BV : 1.95 Average Dividend Yield : 3.33
ICICI Prudential India Opportunities Fund (An open ended equity scheme following special situations theme)
Entry load : Not Applicable
RiskometerThis Product is suitable for investors who are seeking*:
• Long Term Wealth Creation
• An equity scheme that invests in stocks based on special situations theme.
*Investors should consult their financial advisers if in doubt about whether the product is suitable for them.
NAV (As on 30-Aug-19):IPIOF Growth Option : 9.39IPIOF Dividend Option : 9.39IPIOF Direct Plan Growth Option : 9.49IPIOF Direct Plan Dividend Option : 9.49
Monthly AAUM as on 31-Aug-19 : Rs. 1,816.33 crores
Closing AUM as on 31-Aug-19 : Rs. 1,836.56 crores
Annual Portfolio Turnover Ratio : Equity - 0.21 times, Others (Debt and Derivatives) - 0.06 times Combined Annual Portfolio Turnover Ratio : 0.27 times
Dividend History : Refer page no. from 132 to 140
SIP Returns : Refer page no. from 128 to 130
Total Expense Ratio @@ :
IPIOF : 2.17% p. a.
IPIOF Direct Plan : 0.55% p. a.
Investment Objective : Refer page no. from 141 to 145
Concentrated
• Top Ten Holdings
Equity Shares 90.62% Auto 0.88% Tata Motors Ltd. - DVR 0.88% Auto Ancillaries 2.88% Motherson Sumi Systems Ltd. 1.64% Amara Raja Batteries Ltd. 1.24% Banks 12.06%• ICICI Bank Ltd. 3.09% State Bank Of India 2.63% Bank Of Baroda 2.60% The Federal Bank Ltd. 2.20% Karur Vysya Bank Ltd. 1.27% The Karnataka Bank Ltd. 0.26% Chemicals 4.66%• Tata Chemicals Ltd. 4.29% Rain Industries Ltd. 0.37% Construction 0.02% NBCC (India) Ltd. 0.02% Consumer Non Durables 0.92% Jubilant Foodworks Ltd. 0.92% Ferrous Metals 2.83% Tata Steel Ltd. 2.83% Finance 2.61% ICICI Prudential Life Insurance Company Ltd. 1.50% ICICI Securities Ltd. 1.02% Power Finance Corporation Ltd. 0.10% Industrial Capital Goods 2.59% Bharat Heavy Electricals Ltd. 2.50% Bharat Electronics Ltd. 0.09% Media & Entertainment 2.00% Sun TV Network Ltd. 2.00% Minerals/Mining 3.11% Coal India Ltd. 2.96% Gujarat Mineral Development Corporation Ltd. 0.15% Non - Ferrous Metals 11.95%• Hindalco Industries Ltd. 7.40%• Vedanta Ltd. 4.55% Oil 6.47%• Oil & Natural Gas Corporation Ltd. 6.43% Oil India Ltd. 0.04%
Company/Issuer % to NAV Company/Issuer % to NAV
Petroleum Products 7.45%• Indian Oil Corporation Ltd. 5.45% Mangalore Refinery and Petrochemicals Ltd. 1.23% Chennai Petroleum Corporation Ltd. 0.77% Pharmaceuticals 5.61%• Sun Pharmaceutical Industries Ltd. 5.61% Power 10.19%• NTPC Ltd. 8.65% CESC Ltd. 1.52% NLC India Ltd. 0.01% SJVN Ltd. 0.01% Software 5.42%• Mindtree Ltd. 3.30% Cyient Ltd. 2.13% Telecom - Services 8.62%• Bharti Airtel Ltd. 7.25% Vodafone Idea Ltd. 1.37% Transportation 0.34% Interglobe Aviation Ltd. 0.34% Short Term Debt and net current assets 9.38% Total Net Assets 100.00%
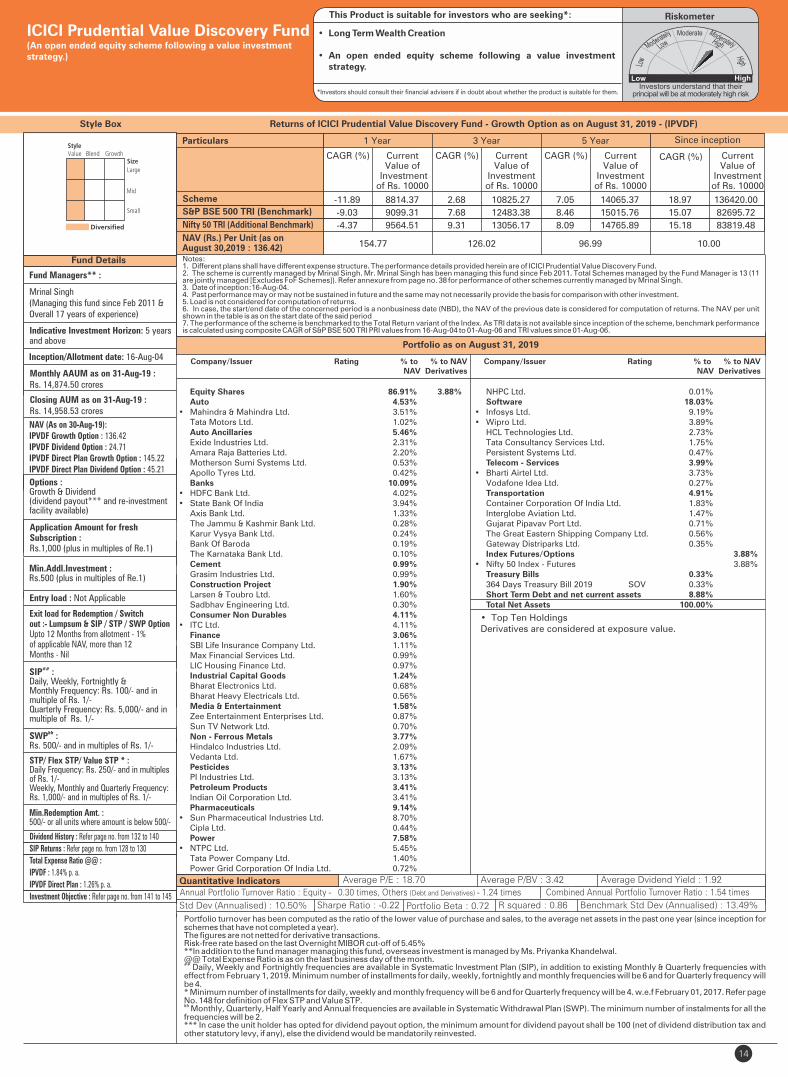
Fund Details
Quantitative Indicators
Portfolio as on August 31, 2019
Returns of ICICI Prudential Value Discovery Fund - Growth Option as on August 31, 2019 - (IPVDF)Style Box
14
Inception/Allotment date: 16-Aug-04
Fund Managers** :
Mrinal Singh(Managing this fund since Feb 2011 &Overall 17 years of experience)
Indicative Investment Horizon: 5 yearsand above
NAV (As on 30-Aug-19):IPVDF Growth Option : 136.42IPVDF Dividend Option : 24.71IPVDF Direct Plan Growth Option : 145.22IPVDF Direct Plan Dividend Option : 45.21
Options :Growth & Dividend(dividend payout*** and re-investment facility available)
Application Amount for freshSubscription :Rs.1,000 (plus in multiples of Re.1)
Min.Addl.Investment :Rs.500 (plus in multiples of Re.1)
Exit load for Redemption / Switchout :- Lumpsum & SIP / STP / SWP OptionUpto 12 Months from allotment - 1%of applicable NAV, more than 12Months - Nil
##SIP :Daily, Weekly, Fortnightly & Monthly Frequency: Rs. 100/- and in multiple of Rs. 1/-Quarterly Frequency: Rs. 5,000/- and in multiple of Rs. 1/-
&&SWP :Rs. 500/- and in multiples of Rs. 1/-
STP/ Flex STP/ Value STP * :Daily Frequency: Rs. 250/- and in multiples of Rs. 1/-Weekly, Monthly and Quarterly Frequency: Rs. 1,000/- and in multiples of Rs. 1/-
Min.Redemption Amt. :500/- or all units where amount is below 500/-
• Top Ten HoldingsDerivatives are considered at exposure value.
Std Dev (Annualised) : 10.50% Sharpe Ratio : -0.22
Average P/E : 18.70 Average P/BV : 3.42 Average Dvidend Yield : 1.92
Portfolio Beta : 0.72 R squared : 0.86
Portfolio turnover has been computed as the ratio of the lower value of purchase and sales, to the average net assets in the past one year (since inception for schemes that have not completed a year). The figures are not netted for derivative transactions.Risk-free rate based on the last Overnight MIBOR cut-off of 5.45%**In addition to the fund manager managing this fund, overseas investment is managed by Ms. Priyanka Khandelwal.@@ Total Expense Ratio is as on the last business day of the month.##
Daily, Weekly and Fortnightly frequencies are available in Systematic Investment Plan (SIP), in addition to existing Monthly & Quarterly frequencies with effect from February 1, 2019. Minimum number of installments for daily, weekly, fortnightly and monthly frequencies will be 6 and for Quarterly frequency will be 4.* Minimum number of installments for daily, weekly and monthly frequency will be 6 and for Quarterly frequency will be 4. w.e.f February 01, 2017. Refer page No. 148 for definition of Flex STP and Value STP.&&
Monthly, Quarterly, Half Yearly and Annual frequencies are available in Systematic Withdrawal Plan (SWP). The minimum number of instalments for all the frequencies will be 2.*** In case the unit holder has opted for dividend payout option, the minimum amount for dividend payout shall be 100 (net of dividend distribution tax and other statutory levy, if any), else the dividend would be mandatorily reinvested.
Monthly AAUM as on 31-Aug-19 : Rs. 14,874.50 crores
Closing AUM as on 31-Aug-19 : Rs. 14,958.53 crores
ICICI Prudential Value Discovery Fund(An open ended equity scheme following a value investment strategy.)
Benchmark Std Dev (Annualised) : 13.49%
Entry load : Not Applicable
RiskometerThis Product is suitable for investors who are seeking*:
• Long Term Wealth Creation
• An open ended equity scheme following a value investment strategy.
*Investors should consult their financial advisers if in doubt about whether the product is suitable for them.
Annual Portfolio Turnover Ratio : Equity - 0.30 times, Others (Debt and Derivatives) - 1.24 times Combined Annual Portfolio Turnover Ratio : 1.54 times
Dividend History : Refer page no. from 132 to 140
SIP Returns : Refer page no. from 128 to 130
Total Expense Ratio @@ :
IPVDF : 1.84% p. a.
IPVDF Direct Plan : 1.26% p. a.
Investment Objective : Refer page no. from 141 to 145
Notes:1. Different plans shall have different expense structure. The performance details provided herein are of ICICI Prudential Value Discovery Fund.2. The scheme is currently managed by Mrinal Singh. Mr. Mrinal Singh has been managing this fund since Feb 2011. Total Schemes managed by the Fund Manager is 13 (11 are jointly managed [Excludes FoF Schemes]) . Refer annexure from page no. 38 for performance of other schemes currently managed by Mrinal Singh.3. Date of inception:16-Aug-04.4. Past performance may or may not be sustained in future and the same may not necessarily provide the basis for comparison with other investment.5. Load is not considered for computation of returns.6. In case, the start/end date of the concerned period is a nonbusiness date (NBD), the NAV of the previous date is considered for computation of returns. The NAV per unit shown in the table is as on the start date of the said period7. The performance of the scheme is benchmarked to the Total Return variant of the Index. As TRI data is not available since inception of the scheme, benchmark performance is calculated using composite CAGR of S&P BSE 500 TRI PRI values from 16-Aug-04 to 01-Aug-06 and TRI values since 01-Aug-06.
Scheme
Nifty 50 TRI (Additional Benchmark)
NAV (Rs.) Per Unit (as on August 30,2019 : 136.42)
CAGR (%)
10.00
S&P BSE 500 TRI (Benchmark)
Since inception
CurrentValue of
Investment of Rs. 10000
CAGR (%) Current Value of
Investment of Rs. 10000
1 Year 3 Year 5 Year
CAGR (%) Current Value of
Investment of Rs. 10000
CAGR (%) Current Value of
Investment of Rs. 10000
154.77 126.02 96.99
Particulars
-11.89 8814.37 2.68 10825.27 7.05 14065.37 18.97 136420.00
-9.03 9099.31 7.68 12483.38 8.46 15015.76 15.07 82695.72
-4.37 9564.51 9.31 13056.17 8.09 14765.89 15.18 83819.48
Company/Issuer Rating % to % to NAV NAV Derivatives
Company/Issuer Rating % to % to NAV NAV Derivatives
Equity Shares 86.91% 3.88% Auto 4.53% • Mahindra & Mahindra Ltd. 3.51% Tata Motors Ltd. 1.02% Auto Ancillaries 5.46% Exide Industries Ltd. 2.31% Amara Raja Batteries Ltd. 2.20% Motherson Sumi Systems Ltd. 0.53% Apollo Tyres Ltd. 0.42% Banks 10.09% • HDFC Bank Ltd. 4.02% • State Bank Of India 3.94% Axis Bank Ltd. 1.33% The Jammu & Kashmir Bank Ltd. 0.28% Karur Vysya Bank Ltd. 0.24% Bank Of Baroda 0.19% The Karnataka Bank Ltd. 0.10% Cement 0.99% Grasim Industries Ltd. 0.99% Construction Project 1.90% Larsen & Toubro Ltd. 1.60% Sadbhav Engineering Ltd. 0.30% Consumer Non Durables 4.11% • ITC Ltd. 4.11% Finance 3.06% SBI Life Insurance Company Ltd. 1.11% Max Financial Services Ltd. 0.99% LIC Housing Finance Ltd. 0.97% Industrial Capital Goods 1.24% Bharat Electronics Ltd. 0.68% Bharat Heavy Electricals Ltd. 0.56% Media & Entertainment 1.58% Zee Entertainment Enterprises Ltd. 0.87% Sun TV Network Ltd. 0.70% Non - Ferrous Metals 3.77% Hindalco Industries Ltd. 2.09% Vedanta Ltd. 1.67% Pesticides 3.13% PI Industries Ltd. 3.13% Petroleum Products 3.41% Indian Oil Corporation Ltd. 3.41% Pharmaceuticals 9.14% • Sun Pharmaceutical Industries Ltd. 8.70% Cipla Ltd. 0.44% Power 7.58% • NTPC Ltd. 5.45% Tata Power Company Ltd. 1.40% Power Grid Corporation Of India Ltd. 0.72%
NHPC Ltd. 0.01% Software 18.03% • Infosys Ltd. 9.19% • Wipro Ltd. 3.89% HCL Technologies Ltd. 2.73% Tata Consultancy Services Ltd. 1.75% Persistent Systems Ltd. 0.47% Telecom - Services 3.99% • Bharti Airtel Ltd. 3.73% Vodafone Idea Ltd. 0.27% Transportation 4.91% Container Corporation Of India Ltd. 1.83% Interglobe Aviation Ltd. 1.47% Gujarat Pipavav Port Ltd. 0.71% The Great Eastern Shipping Company Ltd. 0.56% Gateway Distriparks Ltd. 0.35% Index Futures/Options 3.88%• Nifty 50 Index - Futures 3.88% Treasury Bills 0.33% 364 Days Treasury Bill 2019 SOV 0.33% Short Term Debt and net current assets 8.88% Total Net Assets 100.00%

15
Fund Details
Portfolio as on August 31, 2019
Quantitative Indicators
Style Box
Fund Managers** :
Indicative Investment Horizon: 5 yearsand above
Inception/Allotment date: 19-Aug-99
NAV (As on 30-Aug-19):IPLTEF Growth Option : 353.20IPLTEF Dividend Option : 19.48IPLTEF Direct Plan Growth Option : 376.98IPLTEF Direct Plan Dividend Option : 27.41
Options :Growth & Dividend
Application Amount for freshSubscription :Rs.500 (plus in multiples of Re.1)
Min.Addl.Investment :Rs.500 & in multiples thereof
Exit load for Redemption / Switch out:- Lumpsum & SIP / STP OptionNil
Min.Redemption Amt. :500/- or all units where amount is below 500/-
Std Dev (Annualised) : 12.06% Sharpe Ratio : 0.03
Average P/E : 28.48 Average P/BV : 3.58 Average Dividend Yield : 1.92
Portfolio Beta : 0.84 R squared : 0.89
• Top Ten Holdings
Returns of ICICI Prudential Long Term Equity Fund (Tax Saving) - Growth Option as on August 31, 2019 - (IPLTEF)
Equity Shares 92.61% Auto 4.33% Maruti Suzuki India Ltd. 2.28% TVS Motor Company Ltd. 1.51% Tata Motors Ltd. - DVR 0.54% Banks 15.84%• ICICI Bank Ltd. 5.77%• State Bank Of India 3.17% HDFC Bank Ltd. 2.61% Axis Bank Ltd. 2.37% Bank Of Baroda 0.78% DCB Bank Ltd. 0.64% Karur Vysya Bank Ltd. 0.32% The Karnataka Bank Ltd. 0.18% Cement 0.66% The Ramco Cements Ltd. 0.66% Chemicals 0.25% Bodal Chemicals Ltd. 0.25% Construction 0.30% PNC Infratech Ltd. 0.30% Construction Project 4.08%• Larsen & Toubro Ltd. 3.44% Engineers India Ltd. 0.64% Consumer Durables 4.64% Blue Star Ltd. 1.99% Voltas Ltd. 0.72% Titan Company Ltd. 0.67% Amber Enterprises India Ltd. 0.60% Dixon Technologies (India) Ltd. 0.50% Orient Electric Ltd. 0.15% Consumer Non Durables 6.24%• ITC Ltd. 5.05% Nestle India Ltd. 0.65% Bajaj Consumer Care Ltd. 0.55% Ferrous Metals 1.49% Tata Steel Ltd. 1.49% Finance 7.73%• SBI Life Insurance Company Ltd. 3.60% LIC Housing Finance Ltd. 2.32% HDFC Ltd. 1.76% Can Fin Homes Ltd. 0.04% Gas 2.01% GAIL (India) Ltd. 2.01%
Monthly AAUM as on 31-Aug-19 : Rs. 5,957.57 crores
Closing AUM as on 31-Aug-19 : Rs. 5,965.41 crores
Company/Issuer % to NAV
Healthcare Services 0.58% Narayana Hrudayalaya Ltd. 0.58% Media & Entertainment 0.25% PVR Ltd. 0.25% Non - Ferrous Metals 6.65%• Hindalco Industries Ltd. 4.51% Vedanta Ltd. 2.14% Oil 4.06%• Oil & Natural Gas Corporation Ltd. 4.06% Petroleum Products 1.84% Indian Oil Corporation Ltd. 1.53% Bharat Petroleum Corporation Ltd. 0.31% Pharmaceuticals 9.22% Sun Pharmaceutical Industries Ltd. 2.42% IPCA Laboratories Ltd. 2.10% Astrazeneca Pharma India Ltd. 1.74% Cipla Ltd. 1.55% Alembic Pharmaceuticals Ltd. 1.41% Power 6.50%• NTPC Ltd. 6.50% NLC India Ltd. 0.01% Retailing 1.68% Arvind Fashions Limited 0.98% V-Mart Retail Ltd. 0.69% Services 1.60% Thomas Cook (India) Ltd. 1.60% Software 6.14%• Infosys Ltd. 2.73% Larsen & Toubro Infotech Ltd. 1.74% Info Edge (India) Ltd. 1.17% HCL Technologies Ltd. 0.36% Wipro Ltd. 0.14% Telecom - Services 5.76%• Bharti Airtel Ltd. 5.76% Transportation 0.77% Gujarat Pipavav Port Ltd. 0.77% Short Term Debt and net current assets 7.39% Total Net Assets 100.00%
ICICI Prudential Long Term Equity Fund (Tax Saving)An open ended Equity Linked Savings Scheme with a statutory lock in of 3 years and tax benefit
Benchmark Std Dev (Annualised) : 13.57%
Entry load : Not Applicable
RiskometerThis Product is suitable for investors who are seeking*:
• Long term wealth creation solution
• An Equity Linked Savings Scheme that aims to generate long term capital appreciation by primarily investing in equity and related securities and provides tax benefit under section 80C of Income Tax Act, 1961.
*Investors should consult their financial advisers if in doubt about whether the product is suitable for them.
Annual Portfolio Turnover Ratio : Equity - 0.65 times, Others (Debt and Derivatives) - 0.07 times Combined Annual Portfolio Turnover Ratio : 0.72 times
Company/Issuer % to NAV
Dividend History : Refer page no. from 132 to 140
SIP Returns : Refer page no. from 128 to 130
Total Expense Ratio @@ :
IPLTEF : 2.15% p. a.
IPLTEF Direct Plan : 1.24% p. a.
Investment Objective : Refer page no. from 141 to 145
**In addition to the fund manager managing this fund, overseas investment is managed by Ms. Priyanka Khandelwal.@@ Total Expense Ratio is as on the last business day of the month.## Daily, Weekly and Fortnightly frequencies are available in Systematic Investment Plan (SIP), in addition to existing Monthly & Quarterly frequencies with effect from February 1, 2019. Minimum number of installments for daily, weekly, fortnightly and monthly frequencies will be 6 and for Quarterly frequency will be 4.*Minimum number of installments for daily, weekly and monthly frequency will be 6 and quarterly frequency will be 4 w.e.f 01 January 2018.&&
Monthly, Quarterly, Half Yearly and Annual frequencies are available in systematic Withdrawal Plan (SWP).The minimum number of installments for all the frequencies will be 2.
Portfolio turnover has been computed as the ratio of the lower value of purchase and sales, to the average net assets in the past one year (since inception for schemes that have not completed a year). The figures are not netted for derivative transactions.Risk-free rate based on the last Overnight MIBOR cut-off of 5.45%
SIP :##
Daily, Weekly, Fortnightly & Monthly Frequency: Rs. 500/- and in multiple of Rs. 1/-Quarterly Frequency: Rs. 500/- and in multiple of Rs. 1/-
&&SWP :Rs.500/- and in multiple of Rs. 1/-(SWP - Out facility shall be available under the scheme only post completion of lock-in period of 3 years.)
STP* :Daily Frequency: Rs. 250/- and inmultiple of Rs. 1/-Weekly, Monthly and Quarterly Frequency: Rs. 1000/- and in multiple of Rs. 1/-(STP - Out facility shall be available under the scheme only post completion of lock-in period of 3 years.)
Notes:1. Different plans shall have different expense structure. The performance details provided herein are of ICICI Prudential Long Term Equity Fund (Tax Saving).2. The scheme is currently managed by Sankaran Naren and Harish Bihani. Mr. Sankaran Naren has been managing this fund since Nov 2018. Total Schemes managed by the Fund Manager is 33 (33 are jointly managed). Refer annexure from page no. 38 for performance of other schemes currently managed by Sankaran Naren.Mr. Harish Bihani has been managing this fund since Nov 2018. Total Schemes managed by the Fund Manager is 2 (2 are jointly managed). Refer annexure from page no. 38 for performance of other schemes currently managed by Harish Bihani.3. Date of inception:19-Aug-99.4. Past performance may or may not be sustained in future and the same may not necessarily provide the basis for comparison with other investment.5. Load is not considered for computation of returns.6. In case, the start/end date of the concerned period is a nonbusiness date (NBD), the NAV of the previous date is considered for computation of returns. The NAV per unit shown in the table is as on the start date of the said period7. The performance of the scheme is benchmarked to the Total Return variant of the Index
Scheme
Nifty 50 TRI (Additional Benchmark)
NAV (Rs.) Per Unit (as on August 30,2019 : 353.20)
CAGR (%)
10.00
Nifty 500 TRI (Benchmark)
Since inception
CurrentValue of
Investment of Rs. 10000
CAGR (%) Current Value of
Investment of Rs. 10000
1 Year 3 Year 5 Year
CAGR (%) Current Value of
Investment of Rs. 10000
CAGR (%) Current Value of
Investment of Rs. 10000
386.63 302.83 244.30
Particulars
-8.67 9135.35 5.27 11663.31 7.64 14457.63 19.46 353200.00
-9.05 9097.85 7.57 12445.47 8.39 14970.01 13.54 127514.15
-4.37 9564.51 9.31 13056.17 8.09 14765.89 12.63 108410.47
Sankaran Naren (Managing this fund from Nov, 2018 &Overall 29 years of experience)
Harish Bihani(Managing this fund since Nov, 2018 &Overall above 11 Years of experience)

Fund Managers **:
Mrinal Singh(Managing this fund since Dec, 2015 &Overall 17 years of experience)Mittul Kalawadia(Managing this fund since Jan, 2018 &Overall 13 years of experience)
Indicative Investment Horizon : 5 years and above
Inception/Allotment date: 28-May-09
NAV (As on 30-Aug-19):IPFEF Growth Option : 28.35IPFEF Dividend Option : 13.96IPFEF Direct Plan Growth Option : 30.28IPFEF Direct Plan Dividend Option : 23.03
Options :Growth, Dividend(dividend payout*** and re-investment facility available)
Application Amount for freshSubscription :Rs.5,000 (plus in multiples of Re.1)
Min.Addl.Investment :Rs.1,000 (plus in multiples of Re.1)
Exit load for Redemption / Switchout :- Lumpsum Investment OptionWithin 1 Year from allotment - 1% ofapplicable NAV, more than 1 Year - Nil
Min.Redemption Amt. :500/- or all units where amount is below 500/-
Std Dev (Annualised) : 10.80% Sharpe Ratio : -0.10
Average P/E : 15.13 Average P/BV : 2.99 Average Dividend Yield : 2.39
Portfolio Beta : 0.71 R squared : 0.76
Note : Default trigger is now set at 50% of the appreciation of NAV.Portfolio turnover has been computed as the ratio of the lower value of purchase and sales, to the average net assets in the past one year (since inception for schemes that have not completed a year). The figures are not netted for derivative transactions.Risk-free rate based on the last Overnight MIBOR cut-off of 5.45%**In addition to the fund manager managing this fund, overseas investment is managed by Ms. Priyanka Khandelwal.@@ Total Expense Ratio is as on the last business day of the month.##
Daily, Weekly and Fortnightly frequencies are available in Systematic Investment Plan (SIP), in addition to existing Monthly & Quarterly frequencies with effect from February 1, 2019. Minimum number of installments for daily, weekly, fortnightly and monthly frequencies will be 6 and for Quarterly frequency will be 4.* Minimum number of installments for daily, weekly and monthly frequency will be 6 and for Quarterly frequency will be 4. w.e.f February 01, 2017. Refer page No. 148 for definition of Flex STP and Value STP.&& Monthly, Quarterly, Half Yearly and Annual frequencies are available in Systematic Withdrawal Plan (SWP). The minimum number of instalments for all the frequencies will be 2.*** In case the unit holder has opted for dividend payout option, the minimum amount for dividend payout shall be 100 (net of dividend distribution tax and other statutory levy, if any), else the dividend would be mandatorily reinvested.
Portfolio as on August 31, 2019
Monthly AAUM as on 31-Aug-19 : Rs. 631.54 crores
##SIP :Daily, Weekly, Fortnightly & Monthly Frequency: Rs. 100/- and in multiple of Rs. 1/-Quarterly Frequency: Rs. 5,000/- and in multiple of Rs. 1/-
STP/ Flex STP/ Value STP * :Daily Frequency: Rs. 250/- and in multiples of Rs. 1/-Weekly, Monthly and Quarterly Frequency: Rs. 1,000/- and in multiples of Rs. 1/-
Closing AUM as on 31-Aug-19 : Rs. 634.98 crores
Benchmark Std Dev (Annualised) : 13.31%
16
Style Box Returns of ICICI Prudential Focused Equity Fund - Growth Option as on August 31, 2019 - (IPFEF)
ICICI Prudential Focused Equity Fund(erstwhile ICICI Prudential Select Large Cap Fund)(An open ended equity scheme investing in maximum 30 stocks across market-capitalisation i.e. focus on multicap.)
Entry load : Not Applicable
RiskometerThis Product is suitable for investors who are seeking*:
• Long Term Wealth Creation
• An open ended equity scheme investing in maximum 30 stocks across market-capitalisation.
*Investors should consult their financial advisers if in doubt about whether the product is suitable for them.
&&SWP :Rs. 500/- and in multiples of Rs. 1/- Annual Portfolio Turnover Ratio : Equity - 0.43 times, Others (Debt and Derivatives) - 0.00 times Combined Annual Portfolio Turnover Ratio : 0.43 times
Dividend History : Refer page no. from 132 to 140
SIP Returns : Refer page no. from 128 to 130
Total Expense Ratio @@ :
IPFEF : 2.61% p. a.
IPFEF Direct Plan : 1.60% p. a.
Investment Objective : Refer page no. from 141 to 145
Notes:1. Different plans shall have different expense structure. The performance details provided herein are of ICICI Prudential Focused Equity Fund.2. The scheme is currently managed by Mrinal Singh and Mittul Kalawadia. Mr. Mrinal Singh has been managing this fund since Dec 2015. Total Schemes managed by the Fund Manager . Refer annexure from page no. 38 for performance of other schemes currently managed by Mrinal Singh.is 13 (11 are jointly managed [Excludes FoF Schemes])Mr. Mittul Kalawadia has been managing this fund since Jan 2018 . Total Schemes managed by the Fund Manager Refer annexure from page no. 38 is 8 (8 are jointly managed).for performance of other schemes currently managed by Mittul Kalawadia.3. Date of inception: 28-May-09.4. Past performance may or may not be sustained in future and the same may not necessarily provide the basis for comparison with other investment.5. Load is not considered for computation of returns.6. In case, the start/end date of the concerned period is a nonbusiness date (NBD), the NAV of the previous date is considered for computation of returns. The NAV per unit shown in the table is as on the start date of the said period7. The performance of the scheme is benchmarked to the Total Return variant of the Index. The benchmark of the scheme has been revised from S&P BSE 100 Index to S&P BSE 500 TRI w.e.f. May 28, 2018. For benchmark performance, values of earlier benchmark has been used till 27th May 2018 and revised benchmark values have been considered thereafter.
Scheme
Nifty 50 TRI (Additional Benchmark)
NAV (Rs.) Per Unit (as on August 30,2019 : 28.35)
CAGR (%)
10.00
S&P BSE 500 TRI (Benchmark)
Since inception
CurrentValue of
Investment of Rs. 10000
CAGR (%) Current Value of
Investment of Rs. 10000
1 Year 3 Year 5 Year
CAGR (%) Current Value of
Investment of Rs. 10000
CAGR (%) Current Value of
Investment of Rs. 10000
31.98 25.28 21.54
Particulars
-11.38 8864.92 3.90 11214.40 5.64 13161.56 10.69 28350.00
-9.03 9099.31 7.04 12262.54 7.22 14178.06 10.77 28561.12
-4.37 9564.51 9.31 13056.17 8.09 14765.89 10.89 28901.96
• Top Ten Holdings
Equity Shares 89.93% Auto 6.54%• Mahindra & Mahindra Ltd. 5.62% Tata Motors Ltd. 0.92% Auto Ancillaries 3.89% Amara Raja Batteries Ltd. 2.20% Motherson Sumi Systems Ltd. 1.70% Banks 4.58% State Bank Of India 3.02% Axis Bank Ltd. 1.57% Cement 1.12% Grasim Industries Ltd. 1.12% Consumer Non Durables 6.77%• ITC Ltd. 6.77% Finance 3.27% LIC Housing Finance Ltd. 2.28% SBI Life Insurance Company Ltd. 0.99% Gas 4.50%• GAIL (India) Ltd. 4.50% Industrial Capital Goods 1.17% Bharat Heavy Electricals Ltd. 1.17% Media & Entertainment 1.22% Sun TV Network Ltd. 1.22% Non - Ferrous Metals 1.97% Vedanta Ltd. 1.97% Petroleum Products 5.33%• Indian Oil Corporation Ltd. 5.33% Pharmaceuticals 8.53%• Sun Pharmaceutical Industries Ltd. 8.53% Power 7.86%• NTPC Ltd. 7.86%
Company/Issuer % to NAV Company/Issuer % to NAV
Software 17.37%• Infosys Ltd. 8.34%• HCL Technologies Ltd. 5.02%• Wipro Ltd. 4.01% Telecom - Services 8.51%• Bharti Airtel Ltd. 8.19% Vodafone Idea Ltd. 0.32% Transportation 7.29% Gujarat Pipavav Port Ltd. 3.87% Interglobe Aviation Ltd. 3.42% Short Term Debt and net current assets 10.07% Total Net Assets 100.00%
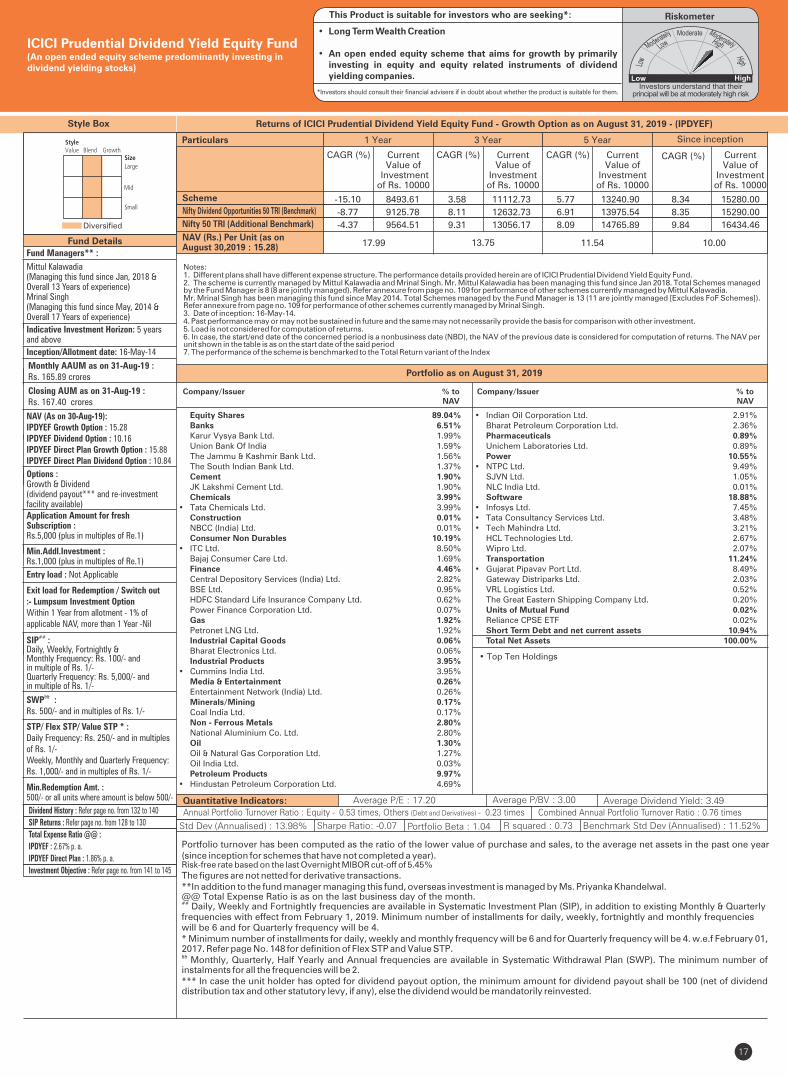
17
Style Box
Portfolio turnover has been computed as the ratio of the lower value of purchase and sales, to the average net assets in the past one year (since inception for schemes that have not completed a year). Risk-free rate based on the last Overnight MIBOR cut-off of 5.45%
The figures are not netted for derivative transactions.**In addition to the fund manager managing this fund, overseas investment is managed by Ms. Priyanka Khandelwal.@@ Total Expense Ratio is as on the last business day of the month.## Daily, Weekly and Fortnightly frequencies are available in Systematic Investment Plan (SIP), in addition to existing Monthly & Quarterly frequencies with effect from February 1, 2019. Minimum number of installments for daily, weekly, fortnightly and monthly frequencies will be 6 and for Quarterly frequency will be 4.* Minimum number of installments for daily, weekly and monthly frequency will be 6 and for Quarterly frequency will be 4. w.e.f February 01, 2017. Refer page No. 148 for definition of Flex STP and Value STP.&& Monthly, Quarterly, Half Yearly and Annual frequencies are available in Systematic Withdrawal Plan (SWP). The minimum number of instalments for all the frequencies will be 2.*** In case the unit holder has opted for dividend payout option, the minimum amount for dividend payout shall be 100 (net of dividend distribution tax and other statutory levy, if any), else the dividend would be mandatorily reinvested.
Fund Managers** :
Mittul Kalawadia(Managing this fund since Jan, 2018 &Overall 13 Years of experience)Mrinal Singh(Managing this fund since May, 2014 &Overall 17 Years of experience)
Indicative Investment Horizon: 5 years and above
Inception/Allotment date: 16-May-14
NAV (As on 30-Aug-19):IPDYEF Growth Option : 15.28IPDYEF Dividend Option : 10.16IPDYEF Direct Plan Growth Option : 15.88IPDYEF Direct Plan Dividend Option : 10.84
Fund Details
• Top Ten Holdings
Diversified
Quantitative Indicators: Average P/E : 17.20 Average P/BV : 3.00 Average Dividend Yield: 3.49
Monthly AAUM as on 31-Aug-19 : Rs. 165.89 crores
Closing AUM as on 31-Aug-19 : Rs. 167.40 crores
ICICI Prudential Dividend Yield Equity Fund(An open ended equity scheme predominantly investing individend yielding stocks)
Returns of ICICI Prudential Dividend Yield Equity Fund - Growth Option as on - (IPDYEF)August 31, 2019
Portfolio as on August 31, 2019
Riskometer
• Long Term Wealth Creation
• An open ended equity scheme that aims for growth by primarily investing in equity and equity related instruments of dividend yielding companies.
*Investors should consult their financial advisers if in doubt about whether the product is suitable for them.
This Product is suitable for investors who are seeking*:
Options :Growth & Dividend(dividend payout*** and re-investment facility available)Application Amount for freshSubscription :Rs.5,000 (plus in multiples of Re.1)
Min.Addl.Investment :Rs.1,000 (plus in multiples of Re.1)
Exit load for Redemption / Switch out:- Lumpsum Investment OptionWithin 1 Year from allotment - 1% of applicable NAV, more than 1 Year -Nil
SIP :##
Daily, Weekly, Fortnightly & Monthly Frequency: Rs. 100/- and in multiple of Rs. 1/-Quarterly Frequency: Rs. 5,000/- and in multiple of Rs. 1/-
&&SWP :Rs. 500/- and in multiples of Rs. 1/-
Min.Redemption Amt. :500/- or all units where amount is below 500/-
Entry load : Not Applicable
STP/ Flex STP/ Value STP * :Daily Frequency: Rs. 250/- and in multiples of Rs. 1/-Weekly, Monthly and Quarterly Frequency: Rs. 1,000/- and in multiples of Rs. 1/-
Annual Portfolio Turnover Ratio : Equity - 0.53 times, Others (Debt and Derivatives) - 0.23 times Combined Annual Portfolio Turnover Ratio : 0.76 timesDividend History : Refer page no. from 132 to 140
SIP Returns : Refer page no. from 128 to 130
Total Expense Ratio @@ :
IPDYEF : 2.67% p. a.
IPDYEF Direct Plan : 1.86% p. a.
Investment Objective : Refer page no. from 141 to 145
Notes:1. Different plans shall have different expense structure. The performance details provided herein are of ICICI Prudential Dividend Yield Equity Fund.2. The scheme is currently managed by Mittul Kalawadia and Mrinal Singh. Mr. Mittul Kalawadia has been managing this fund since . Total Schemes managed Jan 2018by the Fund Manager Refer annexure from page no. 109 for performance of other schemes currently managed by Mittul Kalawadia.is 8 (8 are jointly managed).Mr. Mrinal Singh has been managing this fund since . Total Schemes managed by the Fund Manager . May 2014 is 13 (11 are jointly managed [Excludes FoF Schemes])Refer annexure from page no. 109 for performance of other schemes currently managed by Mrinal Singh. 3. Date of inception: 16-May-14.4. Past performance may or may not be sustained in future and the same may not necessarily provide the basis for comparison with other investment.5. Load is not considered for computation of returns.6. In case, the start/end date of the concerned period is a nonbusiness date (NBD), the NAV of the previous date is considered for computation of returns. The NAV per unit shown in the table is as on the start date of the said period7. The performance of the scheme is benchmarked to the Total Return variant of the Index
Scheme
Nifty 50 TRI (Additional Benchmark)
NAV (Rs.) Per Unit (as on August 30,2019 : 15.28)
CAGR (%)
10.00
Nifty Dividend Opportunities 50 TRI (Benchmark)
Since inception
CurrentValue of
Investment of Rs. 10000
CAGR (%) Current Value of
Investment of Rs. 10000
1 Year 3 Year 5 Year
CAGR (%) Current Value of
Investment of Rs. 10000
CAGR (%) Current Value of
Investment of Rs. 10000
17.99 13.75 11.54
Particulars
-15.10 8493.61 3.58 11112.73 5.77 13240.90 8.34 15280.00
-8.77 9125.78 8.11 12632.73 6.91 13975.54 8.35 15290.00
-4.37 9564.51 9.31 13056.17 8.09 14765.89 9.84 16434.46
Std Dev (Annualised) : 13.98% Sharpe Ratio: -0.07 Portfolio Beta : 1.04 R squared : 0.73 Benchmark Std Dev (Annualised) : 11.52%
Equity Shares 89.04% Banks 6.51% Karur Vysya Bank Ltd. 1.99% Union Bank Of India 1.59% The Jammu & Kashmir Bank Ltd. 1.56% The South Indian Bank Ltd. 1.37% Cement 1.90% JK Lakshmi Cement Ltd. 1.90% Chemicals 3.99%• Tata Chemicals Ltd. 3.99% Construction 0.01% NBCC (India) Ltd. 0.01% Consumer Non Durables 10.19%• ITC Ltd. 8.50% Bajaj Consumer Care Ltd. 1.69% Finance 4.46% Central Depository Services (India) Ltd. 2.82% BSE Ltd. 0.95% HDFC Standard Life Insurance Company Ltd. 0.62% Power Finance Corporation Ltd. 0.07% Gas 1.92% Petronet LNG Ltd. 1.92% Industrial Capital Goods 0.06% Bharat Electronics Ltd. 0.06% Industrial Products 3.95%• Cummins India Ltd. 3.95% Media & Entertainment 0.26% Entertainment Network (India) Ltd. 0.26% Minerals/Mining 0.17% Coal India Ltd. 0.17% Non - Ferrous Metals 2.80% National Aluminium Co. Ltd. 2.80% Oil 1.30% Oil & Natural Gas Corporation Ltd. 1.27% Oil India Ltd. 0.03% Petroleum Products 9.97%• Hindustan Petroleum Corporation Ltd. 4.69%
• Indian Oil Corporation Ltd. 2.91% Bharat Petroleum Corporation Ltd. 2.36% Pharmaceuticals 0.89% Unichem Laboratories Ltd. 0.89% Power 10.55%• NTPC Ltd. 9.49% SJVN Ltd. 1.05% NLC India Ltd. 0.01% Software 18.88%• Infosys Ltd. 7.45%• Tata Consultancy Services Ltd. 3.48%• Tech Mahindra Ltd. 3.21% HCL Technologies Ltd. 2.67% Wipro Ltd. 2.07% Transportation 11.24%• Gujarat Pipavav Port Ltd. 8.49% Gateway Distriparks Ltd. 2.03% VRL Logistics Ltd. 0.52% The Great Eastern Shipping Company Ltd. 0.20% Units of Mutual Fund 0.02% Reliance CPSE ETF 0.02% Short Term Debt and net current assets 10.94% Total Net Assets 100.00%
Company/Issuer % to NAV
Company/Issuer % to NAV

18
**In addition to the fund manager managing this fund, overseas investment is managed by Ms. Priyanka Khandelwal.@@ Total Expense Ratio is as on the last business day of the month.## Daily, Weekly and Fortnightly frequencies are available in Systematic Investment Plan (SIP), in addition to existing Monthly & Quarterly frequencies with effect from February 1, 2019. Minimum number of installments for daily, weekly, fortnightly and monthly frequencies will be 6 and for Quarterly frequency will be 4.* Minimum number of installments for daily, weekly and monthly frequency will be 6 and for Quarterly frequency will be 4. w.e.f February 01, 2017. Refer page No. 148 for definition of Flex STP and Value STP.&& Monthly, Quarterly, Half Yearly and Annual frequencies are available in Systematic Withdrawal Plan (SWP). The minimum number of instalments forall the frequencies will be 2.*** In case the unit holder has opted for dividend payout option, the minimum amount for dividend payout shall be 100 (net of dividend distribution tax and other statutory levy, if any), else the dividend would be mandatorily reinvested.
Refer Disclaimer of NSE Indices Limited (NSE Indices) on page no. 130.
Quantitative Indicators
Style Box
Fund Details
Fund Managers** :
Mittul Kalawadia(Managing this fund since Apr, 2016 &Overall 13 years of experience)Mrinal Singh(Managing this fund since May 2011 &Overall 17 years of experience)
Indicative Investment Horizon: 5 years and above
Inception/Allotment date: 28-Oct-04
NAV (As on 30-Aug-19):IPMIDF Growth Option : 87.01IPMIDF Dividend Option : 20.90IPMIDF Direct Plan Growth Option : 92.51IPMIDF Direct Plan Dividend Option : 26.51
Options :Growth & Dividend(dividend payout*** and re-investment facility available)
Application Amount for freshSubscription :Rs.5,000 (plus in multiples of Re.1)
Min.Addl.Investment :Rs.1,000 (plus in multiples of Re.1)
Exit load for Redemption / Switch out:- Lumpsum & SIP / STP / SWP OptionWithin 1 Year from allotment - 1% ofapplicable NAV, more than 1 Year -Nil
##SIP :Daily, Weekly, Fortnightly & Monthly Frequency: Rs. 100/- and in multiple of Rs. 1/-Quarterly Frequency: Rs. 5,000/- and in multiple of Rs. 1/-
&&SWP :Rs. 500/- and in multiples of Rs. 1/-
STP/ Flex STP/ Value STP * :Daily Frequency: Rs. 250/- and in multiples of Rs. 1/-Weekly, Monthly and Quarterly Frequency: Rs. 1,000/- and in multiples of Rs. 1/-
Min.Redemption Amt. :500/- or all units where amount is below 500/-
Std Dev (Annualised) : 14.65% Sharpe Ratio : -0.01
Average P/E : 26.22 Average P/BV : 3.47 Average Dividend Yield : 1.45
Portfolio Beta : 0.80 R squared : 0.92
Portfolio turnover has been computed as the ratio of the lower value of purchase and sales, to the average net assets in the past one year (since inception for schemes that have not completed a year).The figures are not netted for derivative transactions. Risk-free rate based on the last Overnight MIBOR cut-off of 5.45%
• Top Ten HoldingsDerivatives are considered at exposure value.^ Value Less than 0.01% of NAV in absolute terms.
Portfolio as on August 31, 2019
Returns of ICICI Prudential Midcap Fund - Growth Option as on August 31, 2019 - (IPMIDF)
Monthly AAUM as on 31-Aug-19 : Rs. 1,641.61 crores
Closing AUM as on 31-Aug-19 : Rs. 1,647.69 crores
ICICI Prudential Midcap Fund(An open ended equity scheme predominantly investing in mid cap stocks.)
Benchmark Std Dev (Annualised) : 17.58%
Entry load : Not Applicable
RiskometerThis Product is suitable for investors who are seeking*:
• Long Term Wealth Creation
• An open-ended equity scheme that aims for capital appreciation by investing in diversified mid cap companies.
*Investors should consult their financial advisers if in doubt about whether the product is suitable for them.
Annual Portfolio Turnover Ratio : Equity - 0.30 times, Others (Debt and Derivatives) - 0.91 times Combined Annual Portfolio Turnover Ratio : 1.21 times
Dividend History : Refer page no. from 132 to 140
SIP Returns : Refer page no. from 128 to 130
Total Expense Ratio @@ :
IPMIDF : 2.34% p. a.
IPMIDF Direct Plan : 1.42% p. a.
Investment Objective : Refer page no. from 141 to 145
Notes:1. Different plans shall have different expense structure. The performance details provided herein are of ICICI Prudential Midcap Fund.2. The scheme is currently managed by Mittul Kalawadia and Mrinal Singh. Mr. Mittul Kalawadia has been managing this fund since Apr 2016. Total Schemes managed by the Fund Manager is 8 (8 are jointly managed). Refer annexure from page no. 38 for performance of other schemes currently managed by Mittul Kalawadia. Mr. Mrinal Singh has been managing this fund since May 2011. Total Schemes managed by the Fund Manager is 13 (11 are jointly managed [Excludes FoF Schemes]). Refer annexure from page no. 38 for performance of other schemes currently managed by Mrinal Singh .3. Date of inception: 28-Oct-04.4. Past performance may or may not be sustained in future and the same may not necessarily provide the basis for comparison with other investment.5. Load is not considered for computation of returns.6. In case, the start/end date of the concerned period is a nonbusiness date (NBD), the NAV of the previous date is considered for computation of returns. The NAV per unit shown in the table is as on the start date of the said period7. As the scheme was launched before the launch of the benchmark index, benchmark index figures since inception or the required period are not available.8. The performance of the scheme is benchmarked to the Total Return variant of the Index. The benchmark of the scheme has been revised from Nifty Midcap 100 Index to Nifty Midcap 150 TRI w.e.f. May 28, 2018.
Scheme
Nifty 50 TRI (Additional Benchmark)
NAV (Rs.) Per Unit (as on August 30,2019 : 87.01)
CAGR (%)
10.00
Nifty Midcap 150 TRI (Benchmark)
Since inception
CurrentValue of
Investment of Rs. 10000
CAGR (%) Current Value of
Investment of Rs. 10000
1 Year 3 Year 5 Year
CAGR (%) Current Value of
Investment of Rs. 10000
CAGR (%) Current Value of
Investment of Rs. 10000
99.44 76.51 58.48
Particulars
-12.53 8750.00 4.38 11372.37 8.26 14878.59 15.69 87010.00
-18.08 8196.16 4.99 11571.66 10.59 16554.98 NA NA
-4.37 9564.51 9.31 13056.17 8.09 14765.89 14.44 74076.33
Equity Shares 92.39% 0.16% Auto 1.46% TVS Motor Company Ltd. 1.46% Auto Ancillaries 6.67% • Exide Industries Ltd. 3.85% Apollo Tyres Ltd. 1.56% Amara Raja Batteries Ltd. 1.05% Precision Camshafts Ltd. 0.21% Banks 7.17% -0.63% The Federal Bank Ltd. 2.69% -0.63% Bank Of Baroda 1.82% The Jammu & Kashmir Bank Ltd. 1.46% Union Bank Of India 0.88% The South Indian Bank Ltd. 0.32% Cement 2.59% -0.06% ACC Ltd. 1.54% -0.06% JK Cement Ltd. 1.05% Chemicals 7.32% • Tata Chemicals Ltd. 4.68% Camlin Fine Sciences Ltd. 1.13% Bodal Chemicals Ltd. 0.82% Deepak Nitrite Ltd. 0.69% Construction ^ NBCC (India) Ltd. ^ Construction Project 2.81% Engineers India Ltd. 2.01% Ashoka Buildcon Ltd. 0.78% Gammon Infrastructure Projects Ltd. 0.02% Consumer Durables 4.68% • Voltas Ltd. 3.38% Orient Electric Ltd. 1.30% Consumer Non Durables 5.05% Jubilant Foodworks Ltd. 2.57% Kansai Nerolac Paints Ltd. 1.10% Bajaj Consumer Care Ltd. 0.84% Emami Ltd. 0.54% Ferrous Metals 0.79% Tata Steel Ltd. 0.79% Finance 12.68% -3.14%• LIC Housing Finance Ltd. 3.92% -0.83%• Muthoot Finance Ltd. 3.60% -0.98%• Mahindra & Mahindra Financial Services Ltd. 2.70% -0.51% Max Financial Services Ltd. 1.68% -0.83% HDFC Standard Life Insurance Company Ltd. 0.77% Power Finance Corporation Ltd. 0.01% Gas 2.38% Gujarat State Petronet Ltd. 2.38% Healthcare Services 2.88% • Fortis Healthcare Ltd. 2.88% Hotels, Resorts And Other Recreational Activities 7.22% • The Indian Hotels Company Ltd. 5.43% Chalet Hotels Ltd. 1.80% Industrial Capital Goods 0.55% Bharat Electronics Ltd. 0.55% Industrial Products 5.67% AIA Engineering Ltd. 2.41% Cummins India Ltd. 2.08%
Elgi Equipments Ltd. 1.17% Media & Entertainment 1.15% Inox Leisure Ltd. 0.66% Sun TV Network Ltd. 0.49% Minerals/Mining 0.03% Coal India Ltd. 0.03% Non - Ferrous Metals 1.75% National Aluminium Co. Ltd. 1.75% Oil 0.03% Oil & Natural Gas Corporation Ltd. 0.03% Oil India Ltd. ^ Paper 0.17% Orient Paper & Industries Ltd. 0.17% Pesticides 4.48% • PI Industries Ltd. 4.12% Rallis India Ltd. 0.36% Petroleum Products 0.81% Mangalore Refinery and Petrochemicals Ltd. 0.78% Indian Oil Corporation Ltd. 0.03% Pharmaceuticals 2.62% Syngene International Ltd. 1.05% IPCA Laboratories Ltd. 0.94% Unichem Laboratories Ltd. 0.62% Power 1.64% Tata Power Company Ltd. 1.60% NTPC Ltd. 0.03% Ksk Energy Ventures Ltd. 0.01% NLC India Ltd. ^ SJVN Ltd. ^ Retailing 0.76% Aditya Birla Fashion and Retail Ltd. 0.76% Services 1.75% Thomas Cook (India) Ltd. 1.75% Software 4.35% Hexaware Technologies Ltd. 1.84% Info Edge (India) Ltd. 1.24% Mphasis Ltd. 0.69% Mindtree Ltd. 0.58% Telecom - Services 0.30% Vodafone Idea Ltd. 0.16% Bharti Airtel Ltd. 0.14% Textile Products 0.82% Mayur Uniquoters Ltd. 0.82% Transportation 1.80% Gujarat Pipavav Port Ltd. 1.52% Spicejet Ltd. 0.28% Index Futures/Options 4.00%• Nifty 50 Index - Futures 4.00% Units of Mutual Fund 0.01% Reliance CPSE ETF 0.01% Short Term Debt and net current assets 7.45% Total Net Assets 100.00%
Company/Issuer % to % to NAV NAV Derivatives
Company/Issuer % to % to NAV NAV Derivatives

19
Fund Details
Quantitative Indicators
Style Box
Fund Managers** :
Sankaran Naren (Managing this fund from Feb, 2015 &Overall 29 years of experience)Harish Bihani(Managing this fund since Nov, 2018 &Overall above 11 Years of experience)
Indicative Investment Horizon: 5 yearsand above
Inception/Allotment date: 18-Oct-2007
Monthly AAUM as on 31-Aug-19 : Rs. 394.92 crores
Closing AUM as on 31-Aug-19 : Rs. 412.89 crores
NAV (As on 30-Aug-19):IPSCF Growth Option : 23.64IPSCF Dividend Option : 14.85IPSCF Direct Plan Growth Option : 24.61IPSCF Direct Plan Dividend Option : 22.83
Options :Growth & Dividend(dividend payout*** and re-investment facility available)
Application Amount for freshSubscription :Rs.5,000 (plus in multiples of Re.1)
Min.Addl.Investment :Rs.1,000 (plus in multiples of Re.1)
Entry load : Not Applicable
Exit load for Redemption / Switchout :- Lumpsum & SIP / STP / SWP OptionUpto 1 Year from allotment - 1% ofapplicable NAV, more than 1 Year - Nil
SIP :##
Daily, Weekly, Fortnightly & Monthly Frequency: Rs. 100/- and in multiple of Rs. 1/-Quarterly Frequency: Rs. 5,000/- and in multiple of Rs. 1/-
&&SWP :Rs. 500/- and in multiples of Rs. 1/-
STP/ Flex STP/ Value STP * :Daily Frequency: Rs. 250/- and in multiples of Rs. 1/-Weekly, Monthly and Quarterly Frequency: Rs. 1,000/- and in multiples of Rs. 1/-
Min.Redemption Amt. :500/- or all units where amount is below 500/-
Portfolio turnover has been computed as the ratio of the lower value of purchase and sales, to the average net assets in the past one year (since inception for schemes that have not completed a year). The figures are not netted for derivative transactions.Risk-free rate based on the last Overnight MIBOR cut-off of 5.45%.**In addition to the fund manager managing this fund, overseas investment is managed by Ms. Priyanka Khandelwal.@@ Total Expense Ratio is as on the last business day of the month.##
Daily, Weekly and Fortnightly frequencies are available in Systematic Investment Plan (SIP), in addition to existing Monthly & Quarterly frequencies with effect from February 1, 2019. Minimum number of installments for daily, weekly, fortnightly and monthly frequencies will be 6 and for Quarterly frequency will be 4.* Minimum number of installments for daily, weekly and monthly frequency will be 6 and for Quarterly frequency will be 4. w.e.f February 01, 2017. Refer page No. 148 for definition of Flex STP and Value STP.&&
Monthly, Quarterly, Half Yearly and Annual frequencies are available in Systematic Withdrawal Plan (SWP). The minimum number of instalments for all the frequencies will be 2.*** In case the unit holder has opted for dividend payout option, the minimum amount for dividend payout shall be 100 (net of dividend distribution tax and other statutory levy, if any), else the dividend would be mandatorily reinvested.
Std Dev (Annualised) : 18.41% Sharpe Ratio : -0.13
Average P/E : 21.33 Average P/BV : 3.01 Average Dividend Yield : 1.03
Portfolio Beta : 0.92 R squared : 0.77
Portfolio as on August 31, 2019
Returns of ICICI Prudential Smallcap Fund - Growth Option as on August 31, 2019 - (IPSCF)
• Top Ten Holdings
ICICI Prudential Smallcap Fund(erstwhile ICICI Prudential Indo Asia Equity Fund)(An open ended equity scheme predominantly investing in small cap stocks.)
Benchmark Std Dev (Annualised) : 17.51%
RiskometerThis Product is suitable for investors who are seeking*:
• Long Term Wealth Creation
• An open ended equity scheme that seeks to generate capital appreciation by predominantly investing in equity and equity related securities of small cap companies.
*Investors should consult their financial advisers if in doubt about whether the product is suitable for them.
Annual Portfolio Turnover Ratio : Equity - 0.43 times, Others (Debt and Derivatives) - 0.05 times Combined Annual Portfolio Turnover Ratio : 0.48 times
Dividend History : Refer page no. from 132 to 140
SIP Returns : Refer page no. from 128 to 130
Total Expense Ratio @@ :
IPSCF : 2.69% p. a.
IPSCF Direct Plan : 1.60% p. a.
Investment Objective : Refer page no. from 141 to 145
Notes:1. Different plans shall have different expense structure. The performance details provided herein are of ICICI Prudential Smallcap Fund.2. The scheme is currently managed by Sankaran Naren and Harish Bihani. Mr. Sankaran Naren has been managing this fund since Feb 2015. Total Schemes managed by the Fund Manager 33 (33 are jointly managed). Refer annexure from page no. 38 for performance of other schemes currently managed by Sankaran is Naren.Mr. Harish Bihani has been managing this fund since Nov 2018. Total Schemes managed by the Fund Manager ). Refer annexure from is 2 (2 are jointly managedpage no. 38 for performance of other schemes currently managed by Harish Bihani. 3. Date of inception:18-Oct-07.4. Past performance may or may not be sustained in future and the same may not necessarily provide the basis for comparison with other investment.5. Load is not considered for computation of returns.6. In case, the start/end date of the concerned period is a nonbusiness date (NBD), the NAV of the previous date is considered for computation of returns. The NAV per unit shown in the table is as on the start date of the said period 7. The performance of the scheme is benchmarked to the Total Return variant of the Index. The benchmark of the scheme has been revised from 65% Nifty 50 + 35% MSCI Asia ex-Japan Index to Nifty Smallcap 250 TRI w.e.f. May 28, 2018. For benchmark performance, values of earlier benchmark has been used till 27th May 2018 and revised benchmark values have been considered thereafter.
Scheme
Nifty 50 TRI (Additional Benchmark)
NAV (Rs.) Per Unit (as on August 30,2019 : 23.64)
CAGR (%)
10.00
Nifty Smallcap 250 TRI (Benchmark)
Since inception
CurrentValue of
Investment of Rs. 10000
CAGR (%) Current Value of
Investment of Rs. 10000
1 Year 3 Year 5 Year
CAGR (%) Current Value of
Investment of Rs. 10000
CAGR (%) Current Value of
Investment of Rs. 10000
26.37 22.64 18.18
Particulars
-10.38 8964.73 1.45 10441.70 5.38 13003.30 7.51 23640.00
-26.59 7346.79 -2.23 9347.58 0.70 10354.85 4.84 17537.02
-4.37 9564.51 9.31 13056.17 8.09 14765.89 7.57 23773.81
Equity Shares 92.54% Auto 1.25% V.S.T Tillers Tractors Ltd. 1.25% Auto Ancillaries 2.89% Varroc Engineering Ltd. 1.85% Sandhar Technologies Ltd. 1.03% Banks 7.10%• DCB Bank Ltd. 2.87% The Jammu & Kashmir Bank Ltd. 1.45% Karur Vysya Bank Ltd. 1.04% City Union Bank Ltd. 0.99% The South Indian Bank Ltd. 0.76% Cement 2.64%• JK Cement Ltd. 2.64% Chemicals 2.69% Camlin Fine Sciences Ltd. 1.05% Neogen Chemicals Limited 0.86% Sudarshan Chemical Industries Ltd. 0.78% Construction 13.74%• PNC Infratech Ltd. 3.09%• KNR Constructions Ltd. 2.38% Brigade Enterprises Ltd. 2.31% Somany Ceramics Ltd. 1.21% Capacite Infraprojects Ltd. 1.09% JMC Projects (India) Ltd. 1.06% Mahindra Lifespace Developers Ltd. 0.94% Ashiana Housing Ltd. 0.93% Somany Home Innovation Ltd 0.73% Construction Project 1.02% Ashoka Buildcon Ltd. 1.02% Consumer Durables 11.08%• Blue Star Ltd. 3.99%• Orient Electric Ltd. 2.92% Dixon Technologies (India) Ltd. 2.23% Amber Enterprises India Ltd. 1.94% Consumer Non Durables 6.75%• Bajaj Consumer Care Ltd. 2.76% Jyothy Laboratories Ltd. 1.57% VST Industries Ltd. 1.44% CCL Products (India) Ltd. 0.99% Ferrous Metals 1.64% Tata Metaliks Ltd. 1.64% Finance 10.63%• Can Fin Homes Ltd. 3.96% Equitas Holdings Ltd. 2.09% Cholamandalam Financial Holdings Ltd. 1.77% Repco Home Finance Ltd. 1.67% Multi Commodity Exchange Of India Ltd. 1.14%
Healthcare Services 1.32% Aster DM Healthcare Ltd. 1.32% Industrial Capital Goods 1.09% Cochin Shipyard Ltd. 0.70% TD Power Systems Ltd. 0.39% Industrial Products 1.85% Finolex Cables Ltd. 0.96% Elgi Equipments Ltd. 0.89% Media & Entertainment 4.41% Inox Leisure Ltd. 2.05% PVR Ltd. 1.89% Entertainment Network (India) Ltd. 0.46% Pharmaceuticals 1.80% J.B.Chemicals & Pharmaceuticals Ltd. 1.16% Dishman Carbogen Amcis Ltd. 0.64% Power 1.11% NTPC Ltd. 1.11% Retailing 7.59%• Arvind Fashions Limited 2.91%• V-Mart Retail Ltd. 2.85% IndiaMart InterMesh Ltd 1.83% Services 0.74% Matrimony.com Ltd. 0.74% Software 3.02% Cyient Ltd. 1.95% Persistent Systems Ltd. 1.07% Telecom - Equipment & Accessories 0.43% Astra Microwave Products Ltd. 0.43% Textile Products 2.13% S. P. Apparels Ltd. 0.88% K.P.R. Mill Ltd. 0.86% Mayur Uniquoters Ltd. 0.40% Transportation 5.61% Gujarat Pipavav Port Ltd. 1.90% Gateway Distriparks Ltd. 1.74% Spicejet Ltd. 0.99% VRL Logistics Ltd. 0.98% Short Term Debt and net current assets 7.46% Total Net Assets 100.00%
Company/Issuer % to NAV
Company/Issuer % to NAV
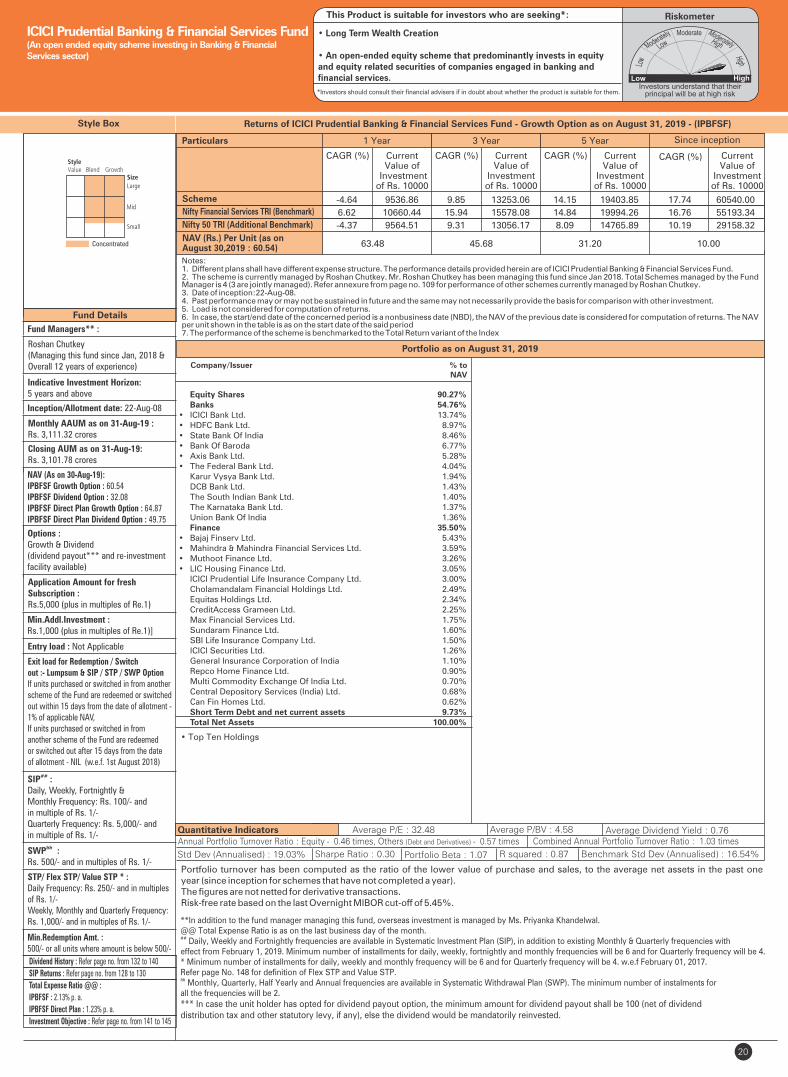
20
Fund Details
Quantitative Indicators
Portfolio turnover has been computed as the ratio of the lower value of purchase and sales, to the average net assets in the past one year (since inception for schemes that have not completed a year). The figures are not netted for derivative transactions.Risk-free rate based on the last Overnight MIBOR cut-off of 5.45%.
**In addition to the fund manager managing this fund, overseas investment is managed by Ms. Priyanka Khandelwal.@@ Total Expense Ratio is as on the last business day of the month.##
Daily, Weekly and Fortnightly frequencies are available in Systematic Investment Plan (SIP), in addition to existing Monthly & Quarterly frequencies with effect from February 1, 2019. Minimum number of installments for daily, weekly, fortnightly and monthly frequencies will be 6 and for Quarterly frequency will be 4.* Minimum number of installments for daily, weekly and monthly frequency will be 6 and for Quarterly frequency will be 4. w.e.f February 01, 2017.Refer page No. 148 for definition of Flex STP and Value STP.&& Monthly, Quarterly, Half Yearly and Annual frequencies are available in Systematic Withdrawal Plan (SWP). The minimum number of instalments for all the frequencies will be 2.
*** In case the unit holder has opted for dividend payout option, the minimum amount for dividend payout shall be 100 (net of dividend distribution tax and other statutory levy, if any), else the dividend would be mandatorily reinvested.
Fund Managers** :
Roshan Chutkey(Managing this fund since Jan, 2018 &Overall 12 years of experience)
Indicative Investment Horizon: 5 years and above
Inception/Allotment date: 22-Aug-08
NAV (As on 30-Aug-19):IPBFSF Growth Option : 60.54IPBFSF Dividend Option : 32.08IPBFSF Direct Plan Growth Option : 64.87IPBFSF Direct Plan Dividend Option : 49.75
Options :Growth & Dividend(dividend payout*** and re-investment facility available)
Application Amount for freshSubscription :Rs.5,000 (plus in multiples of Re.1)
Min.Addl.Investment :Rs.1,000 (plus in multiples of Re.1)]
Exit load for Redemption / Switchout :- Lumpsum & SIP / STP / SWP OptionIf units purchased or switched in from another scheme of the Fund are redeemed or switched out within 15 days from the date of allotment - 1% of applicable NAV,If units purchased or switched in fromanother scheme of the Fund are redeemedor switched out after 15 days from the dateof allotment - NIL (w.e.f. 1st August 2018)
SIP :##
Daily, Weekly, Fortnightly & Monthly Frequency: Rs. 100/- and in multiple of Rs. 1/-Quarterly Frequency: Rs. 5,000/- and in multiple of Rs. 1/-
&&SWP :Rs. 500/- and in multiples of Rs. 1/-
STP/ Flex STP/ Value STP * :Daily Frequency: Rs. 250/- and in multiples of Rs. 1/-Weekly, Monthly and Quarterly Frequency: Rs. 1,000/- and in multiples of Rs. 1/-
Min.Redemption Amt. :500/- or all units where amount is below 500/-
Std Dev (Annualised) : 19.03% Sharpe Ratio : 0.30
Average P/E : 32.48 Average P/BV : 4.58 Average Dividend Yield : 0.76
Portfolio Beta : 1.07 R squared : 0.87
Style Box
Portfolio as on August 31, 2019
Returns of ICICI Prudential Banking & Financial Services Fund - Growth Option as on August 31, 2019 - (IPBFSF)
• Top Ten Holdings
Concentrated
Monthly AAUM as on 31-Aug-19 : Rs. 3,111.32 crores
ICICI Prudential Banking & Financial Services Fund(An open ended equity scheme investing in Banking & Financial Services sector)
Closing AUM as on 31-Aug-19: Rs. 3,101.78 crores
Benchmark Std Dev (Annualised) : 16.54%
Entry load : Not Applicable
RiskometerThis Product is suitable for investors who are seeking*:
• Long Term Wealth Creation
• An open-ended equity scheme that predominantly invests in equity and equity related securities of companies engaged in banking and financial services.
*Investors should consult their financial advisers if in doubt about whether the product is suitable for them.
Annual Portfolio Turnover Ratio : Equity - 0.46 times, Others (Debt and Derivatives) - 0.57 times Combined Annual Portfolio Turnover Ratio : 1.03 times
Dividend History : Refer page no. from 132 to 140
SIP Returns : Refer page no. from 128 to 130
Total Expense Ratio @@ :
IPBFSF : 2.13% p. a.
IPBFSF Direct Plan : 1.23% p. a.
Investment Objective : Refer page no. from 141 to 145
Notes:1. Different plans shall have different expense structure. The performance details provided herein are of ICICI Prudential Banking & Financial Services Fund.2. The scheme is currently managed by Roshan Chutkey. Mr. Roshan Chutkey has been managing this fund since Jan 2018. Total Schemes managed by the Fund Manager 4 (3 ). Refer annexure from page no. 109 for performance of other schemes currently managed by Roshan Chutkey.is are jointly managed3. Date of inception:22-Aug-08.4. Past performance may or may not be sustained in future and the same may not necessarily provide the basis for comparison with other investment.5. Load is not considered for computation of returns.6. In case, the start/end date of the concerned period is a nonbusiness date (NBD), the NAV of the previous date is considered for computation of returns. The NAV per unit shown in the table is as on the start date of the said period7. The performance of the scheme is benchmarked to the Total Return variant of the Index
Scheme
Nifty 50 TRI (Additional Benchmark)
NAV (Rs.) Per Unit (as on August 30,2019 : 60.54)
CAGR (%)
10.00
Nifty Financial Services TRI (Benchmark)
Since inception
CurrentValue of
Investment of Rs. 10000
CAGR (%) Current Value of
Investment of Rs. 10000
1 Year 3 Year 5 Year
CAGR (%) Current Value of
Investment of Rs. 10000
CAGR (%) Current Value of
Investment of Rs. 10000
63.48 45.68 31.20
Particulars
-4.64 9536.86 9.85 13253.06 14.15 19403.85 17.74 60540.00
6.62 10660.44 15.94 15578.08 14.84 19994.26 16.76 55193.34
-4.37 9564.51 9.31 13056.17 8.09 14765.89 10.19 29158.32
Company/Issuer % to NAV
Equity Shares 90.27% Banks 54.76%• ICICI Bank Ltd. 13.74%• HDFC Bank Ltd. 8.97%• State Bank Of India 8.46%• Bank Of Baroda 6.77%• Axis Bank Ltd. 5.28%• The Federal Bank Ltd. 4.04% Karur Vysya Bank Ltd. 1.94% DCB Bank Ltd. 1.43% The South Indian Bank Ltd. 1.40% The Karnataka Bank Ltd. 1.37% Union Bank Of India 1.36% Finance 35.50%• Bajaj Finserv Ltd. 5.43%• Mahindra & Mahindra Financial Services Ltd. 3.59%• Muthoot Finance Ltd. 3.26%• LIC Housing Finance Ltd. 3.05% ICICI Prudential Life Insurance Company Ltd. 3.00% Cholamandalam Financial Holdings Ltd. 2.49% Equitas Holdings Ltd. 2.34% CreditAccess Grameen Ltd. 2.25% Max Financial Services Ltd. 1.75% Sundaram Finance Ltd. 1.60% SBI Life Insurance Company Ltd. 1.50% ICICI Securities Ltd. 1.26% General Insurance Corporation of India 1.10% Repco Home Finance Ltd. 0.90% Multi Commodity Exchange Of India Ltd. 0.70% Central Depository Services (India) Ltd. 0.68% Can Fin Homes Ltd. 0.62% Short Term Debt and net current assets 9.73% Total Net Assets 100.00%
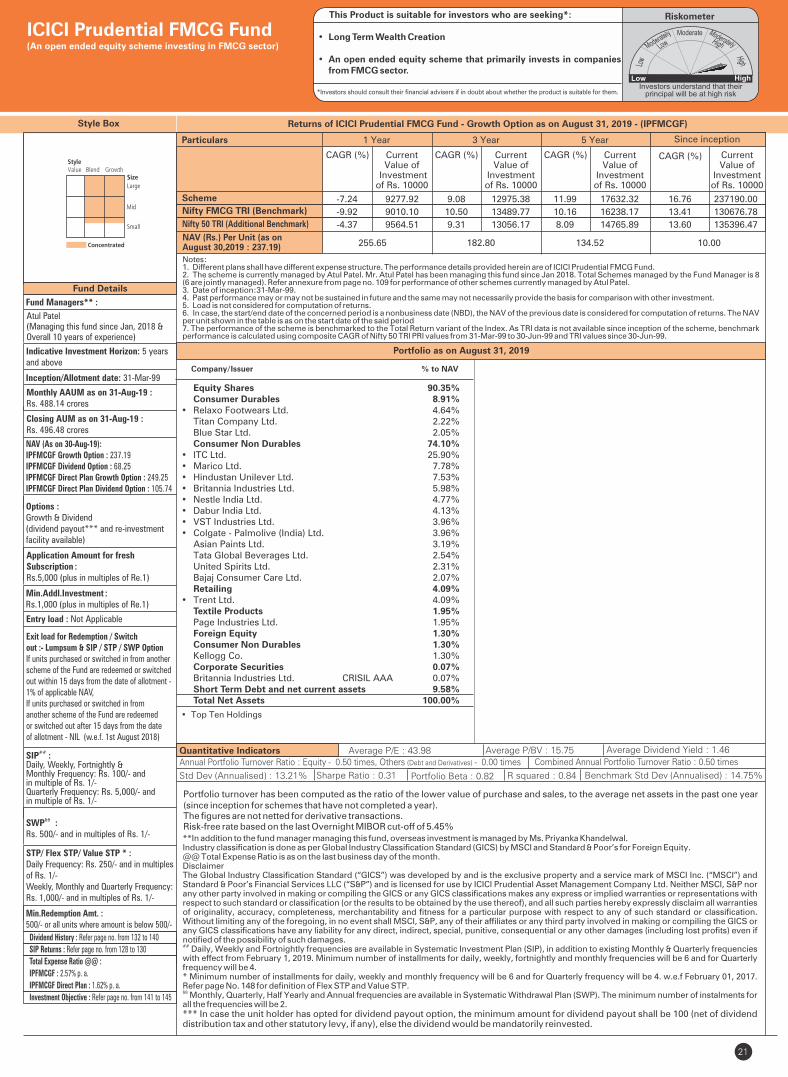
21
Fund Details
Quantitative Indicators
Style Box
Company/Issuer % to NAV
Fund Managers** :
Atul Patel(Managing this fund since Jan, 2018 &Overall 10 years of experience)
Indicative Investment Horizon: 5 yearsand above
Inception/Allotment date: 31-Mar-99
Monthly AAUM as on 31-Aug-19 : Rs. 488.14 crores
Closing AUM as on 31-Aug-19 : Rs. 496.48 crores
NAV (As on 30-Aug-19):IPFMCGF Growth Option : 237.19IPFMCGF Dividend Option : 68.25IPFMCGF Direct Plan Growth Option : 249.25IPFMCGF Direct Plan Dividend Option : 105.74
Options :Growth & Dividend(dividend payout*** and re-investment facility available)
Application Amount for freshSubscription :Rs.5,000 (plus in multiples of Re.1)
Min.Addl.Investment :Rs.1,000 (plus in multiples of Re.1)
Exit load for Redemption / Switchout :- Lumpsum & SIP / STP / SWP OptionIf units purchased or switched in from another scheme of the Fund are redeemed or switched out within 15 days from the date of allotment - 1% of applicable NAV,If units purchased or switched in fromanother scheme of the Fund are redeemedor switched out after 15 days from the dateof allotment - NIL (w.e.f. 1st August 2018)
SIP :##
Daily, Weekly, Fortnightly & Monthly Frequency: Rs. 100/- and in multiple of Rs. 1/-Quarterly Frequency: Rs. 5,000/- and in multiple of Rs. 1/-
&&SWP :Rs. 500/- and in multiples of Rs. 1/-
STP/ Flex STP/ Value STP * :Daily Frequency: Rs. 250/- and in multiples of Rs. 1/-Weekly, Monthly and Quarterly Frequency: Rs. 1,000/- and in multiples of Rs. 1/-
Min.Redemption Amt. :500/- or all units where amount is below 500/-
Portfolio turnover has been computed as the ratio of the lower value of purchase and sales, to the average net assets in the past one year (since inception for schemes that have not completed a year). The figures are not netted for derivative transactions.Risk-free rate based on the last Overnight MIBOR cut-off of 5.45%**In addition to the fund manager managing this fund, overseas investment is managed by Ms. Priyanka Khandelwal.Industry classification is done as per Global Industry Classification Standard (GICS) by MSCI and Standard & Poor’s for Foreign Equity.@@ Total Expense Ratio is as on the last business day of the month.DisclaimerThe Global Industry Classification Standard (“GICS”) was developed by and is the exclusive property and a service mark of MSCI Inc. (“MSCI”) and Standard & Poor’s Financial Services LLC (“S&P”) and is licensed for use by ICICI Prudential Asset Management Company Ltd. Neither MSCI, S&P nor any other party involved in making or compiling the GICS or any GICS classifications makes any express or implied warranties or representations with respect to such standard or classification (or the results to be obtained by the use thereof), and all such parties hereby expressly disclaim all warranties of originality, accuracy, completeness, merchantability and fitness for a particular purpose with respect to any of such standard or classification. Without limiting any of the foregoing, in no event shall MSCI, S&P, any of their affiliates or any third party involved in making or compiling the GICS or any GICS classifications have any liability for any direct, indirect, special, punitive, consequential or any other damages (including lost profits) even if notified of the possibility of such damages.## Daily, Weekly and Fortnightly frequencies are available in Systematic Investment Plan (SIP), in addition to existing Monthly & Quarterly frequencies with effect from February 1, 2019. Minimum number of installments for daily, weekly, fortnightly and monthly frequencies will be 6 and for Quarterly frequency will be 4.* Minimum number of installments for daily, weekly and monthly frequency will be 6 and for Quarterly frequency will be 4. w.e.f February 01, 2017. Refer page No. 148 for definition of Flex STP and Value STP.&& Monthly, Quarterly, Half Yearly and Annual frequencies are available in Systematic Withdrawal Plan (SWP). The minimum number of instalments for all the frequencies will be 2.*** In case the unit holder has opted for dividend payout option, the minimum amount for dividend payout shall be 100 (net of dividend distribution tax and other statutory levy, if any), else the dividend would be mandatorily reinvested.
Std Dev (Annualised) : 13.21% Sharpe Ratio : 0.31
Average P/E : 43.98 Average P/BV : 15.75 Average Dividend Yield : 1.46
Portfolio Beta : 0.82 R squared : 0.84
• Top Ten Holdings
Portfolio as on August 31, 2019
Returns of ICICI Prudential FMCG Fund - Growth Option as on August 31, 2019 - (IPFMCGF)
Equity Shares 90.35% Consumer Durables 8.91%• Relaxo Footwears Ltd. 4.64% Titan Company Ltd. 2.22% Blue Star Ltd. 2.05% Consumer Non Durables 74.10%• ITC Ltd. 25.90%• Marico Ltd. 7.78%• Hindustan Unilever Ltd. 7.53%• Britannia Industries Ltd. 5.98%• Nestle India Ltd. 4.77%• Dabur India Ltd. 4.13%• VST Industries Ltd. 3.96%• Colgate - Palmolive (India) Ltd. 3.96% Asian Paints Ltd. 3.19% Tata Global Beverages Ltd. 2.54% United Spirits Ltd. 2.31% Bajaj Consumer Care Ltd. 2.07% Retailing 4.09%• Trent Ltd. 4.09% Textile Products 1.95% Page Industries Ltd. 1.95% Foreign Equity 1.30% Consumer Non Durables 1.30% Kellogg Co. 1.30% Corporate Securities 0.07% Britannia Industries Ltd. CRISIL AAA 0.07% Short Term Debt and net current assets 9.58% Total Net Assets 100.00%
ICICI Prudential FMCG Fund(An open ended equity scheme investing in FMCG sector)
Benchmark Std Dev (Annualised) : 14.75%
Entry load : Not Applicable
Riskometer
• Long Term Wealth Creation
• An open ended equity scheme that primarily invests in companies from FMCG sector.
*Investors should consult their financial advisers if in doubt about whether the product is suitable for them.
This Product is suitable for investors who are seeking*:
Annual Portfolio Turnover Ratio : Equity - 0.50 times, Others (Debt and Derivatives) - 0.00 times Combined Annual Portfolio Turnover Ratio : 0.50 times
Dividend History : Refer page no. from 132 to 140
SIP Returns : Refer page no. from 128 to 130
Total Expense Ratio @@ :
IPFMCGF : 2.57% p. a.
IPFMCGF Direct Plan : 1.62% p. a.
Investment Objective : Refer page no. from 141 to 145
Notes:1. Different plans shall have different expense structure. The performance details provided herein are of ICICI Prudential FMCG Fund.2. The scheme is currently managed by Atul Patel. Mr. Atul Patel has been managing this fund since Jan 2018. Total Schemes managed by the Fund Manager is 8 (6 are jointly managed). Refer annexure from page no. 109 for performance of other schemes currently managed by Atul Patel.3. Date of inception:31-Mar-99.4. Past performance may or may not be sustained in future and the same may not necessarily provide the basis for comparison with other investment.5. Load is not considered for computation of returns.6. In case, the start/end date of the concerned period is a nonbusiness date (NBD), the NAV of the previous date is considered for computation of returns. The NAV per unit shown in the table is as on the start date of the said period7. The performance of the scheme is benchmarked to the Total Return variant of the Index. As TRI data is not available since inception of the scheme, benchmark performance is calculated using composite CAGR of Nifty 50 TRI PRI values from 31-Mar-99 to 30-Jun-99 and TRI values since 30-Jun-99.
Scheme
Nifty 50 TRI (Additional Benchmark)
NAV (Rs.) Per Unit (as on August 30,2019 : 237.19)
CAGR (%)
10.00
Nifty FMCG TRI (Benchmark)
Since inception
CurrentValue of
Investment of Rs. 10000
CAGR (%) Current Value of
Investment of Rs. 10000
1 Year 3 Year 5 Year
CAGR (%) Current Value of
Investment of Rs. 10000
CAGR (%) Current Value of
Investment of Rs. 10000
255.65 182.80 134.52
Particulars
-7.24 9277.92 9.08 12975.38 11.99 17632.32 16.76 237190.00
-9.92 9010.10 10.50 13489.77 10.16 16238.17 13.41 130676.78
-4.37 9564.51 9.31 13056.17 8.09 14765.89 13.60 135396.47
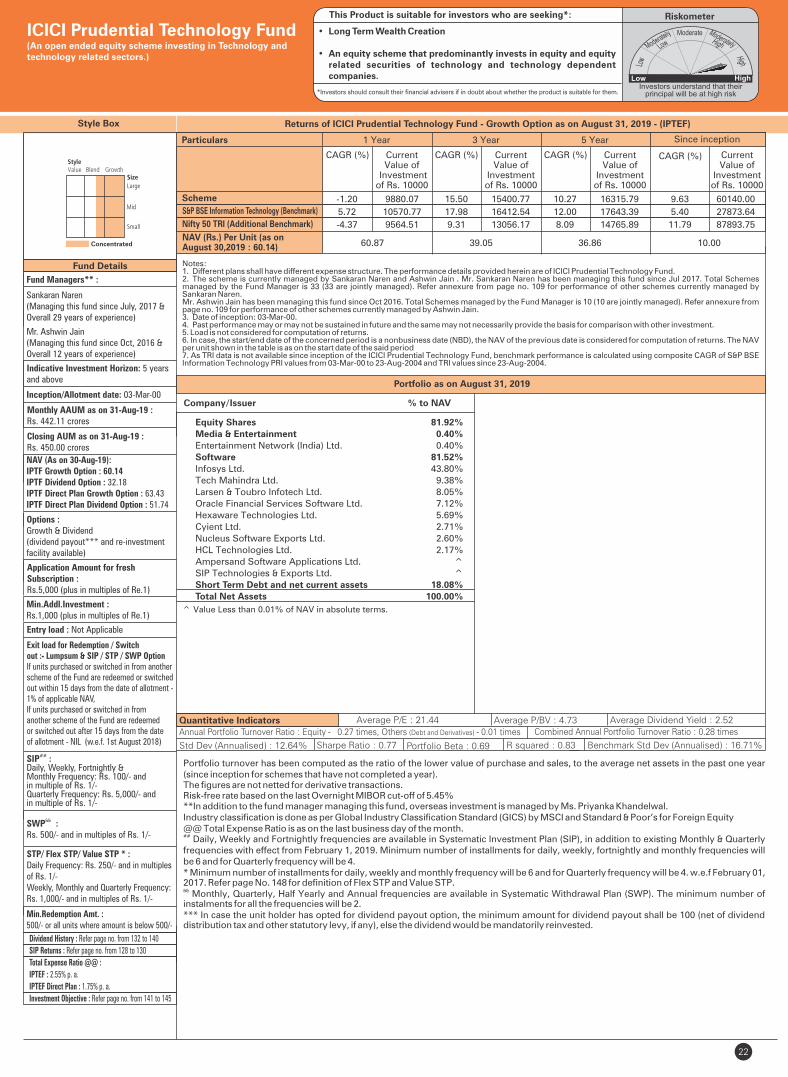
22
Fund Details
Quantitative Indicators
Style Box
Company/Issuer % to NAV
Fund Managers** :
Mr. Ashwin Jain (Managing this fund since Oct, 2016 & Overall 12 years of experience)
Indicative Investment Horizon: 5 yearsand above
Inception/Allotment date: 03-Mar-00
Monthly AAUM as on 31-Aug-19 : Rs. 442.11 crores
Closing AUM as on 31-Aug-19 : Rs. 450.00 crores
NAV (As on 30-Aug-19):IPTF Growth Option : 60.14IPTF Dividend Option : 32.18IPTF Direct Plan Growth Option : 63.43IPTF Direct Plan Dividend Option : 51.74
Options :Growth & Dividend(dividend payout*** and re-investment facility available)
Application Amount for freshSubscription :Rs.5,000 (plus in multiples of Re.1)
Min.Addl.Investment :Rs.1,000 (plus in multiples of Re.1)
Exit load for Redemption / Switchout :- Lumpsum & SIP / STP / SWP OptionIf units purchased or switched in from another scheme of the Fund are redeemed or switched out within 15 days from the date of allotment - 1% of applicable NAV,If units purchased or switched in fromanother scheme of the Fund are redeemedor switched out after 15 days from the dateof allotment - NIL (w.e.f. 1st August 2018)
SIP :##
Daily, Weekly, Fortnightly & Monthly Frequency: Rs. 100/- and in multiple of Rs. 1/-Quarterly Frequency: Rs. 5,000/- and in multiple of Rs. 1/-
&&SWP :Rs. 500/- and in multiples of Rs. 1/-
STP/ Flex STP/ Value STP * :Daily Frequency: Rs. 250/- and in multiples of Rs. 1/-Weekly, Monthly and Quarterly Frequency: Rs. 1,000/- and in multiples of Rs. 1/-
Min.Redemption Amt. : 500/- or all units where amount is below 500/-
Std Dev (Annualised) : 12.64% Sharpe Ratio : 0.77
Average P/E : 21.44 Average P/BV : 4.73 Average Dividend Yield : 2.52
Portfolio Beta : 0.69 R squared : 0.83
Portfolio turnover has been computed as the ratio of the lower value of purchase and sales, to the average net assets in the past one year (since inception for schemes that have not completed a year). The figures are not netted for derivative transactions.Risk-free rate based on the last Overnight MIBOR cut-off of 5.45%**In addition to the fund manager managing this fund, overseas investment is managed by Ms. Priyanka Khandelwal.Industry classification is done as per Global Industry Classification Standard (GICS) by MSCI and Standard & Poor’s for Foreign Equity@@ Total Expense Ratio is as on the last business day of the month.## Daily, Weekly and Fortnightly frequencies are available in Systematic Investment Plan (SIP), in addition to existing Monthly & Quarterly frequencies with effect from February 1, 2019. Minimum number of installments for daily, weekly, fortnightly and monthly frequencies will be 6 and for Quarterly frequency will be 4.* Minimum number of installments for daily, weekly and monthly frequency will be 6 and for Quarterly frequency will be 4. w.e.f February 01, 2017. Refer page No. 148 for definition of Flex STP and Value STP.&& Monthly, Quarterly, Half Yearly and Annual frequencies are available in Systematic Withdrawal Plan (SWP). The minimum number of instalments for all the frequencies will be 2.*** In case the unit holder has opted for dividend payout option, the minimum amount for dividend payout shall be 100 (net of dividend distribution tax and other statutory levy, if any), else the dividend would be mandatorily reinvested.
^ Value Less than 0.01% of NAV in absolute terms.
Portfolio as on August 31, 2019
Returns of ICICI Prudential Technology Fund - Growth Option as on August 31, 2019 - (IPTEF)
Equity Shares 81.92% Media & Entertainment 0.40% Entertainment Network (India) Ltd. 0.40% Software 81.52% Infosys Ltd. 43.80% Tech Mahindra Ltd. 9.38% Larsen & Toubro Infotech Ltd. 8.05% Oracle Financial Services Software Ltd. 7.12% Hexaware Technologies Ltd. 5.69% Cyient Ltd. 2.71% Nucleus Software Exports Ltd. 2.60% HCL Technologies Ltd. 2.17% Ampersand Software Applications Ltd. ^ SIP Technologies & Exports Ltd. ^ Short Term Debt and net current assets 18.08% Total Net Assets 100.00%
ICICI Prudential Technology Fund(An open ended equity scheme investing in Technology andtechnology related sectors.)
Benchmark Std Dev (Annualised) : 16.71%
Entry load : Not Applicable
Riskometer
• Long Term Wealth Creation
• An equity scheme that predominantly invests in equity and equity related securities of technology and technology dependent companies.
*Investors should consult their financial advisers if in doubt about whether the product is suitable for them.
This Product is suitable for investors who are seeking*:
Annual Portfolio Turnover Ratio : Equity - 0.27 times, Others (Debt and Derivatives) - 0.01 times Combined Annual Portfolio Turnover Ratio : 0.28 times
Dividend History : Refer page no. from 132 to 140
SIP Returns : Refer page no. from 128 to 130
Total Expense Ratio @@ :
IPTEF : 2.55% p. a.
IPTEF Direct Plan : 1.75% p. a.
Investment Objective : Refer page no. from 141 to 145
Sankaran Naren(Managing this fund since July, 2017 &Overall 29 years of experience)
Notes:1. Different plans shall have different expense structure. The performance details provided herein are of ICICI Prudential Technology Fund.2. The scheme is currently managed by Sankaran Naren and Ashwin Jain . Mr. Sankaran Naren has been managing this fund since Jul 2017. Total Schemes managed by the Fund Manager is 33 (33 are jointly managed). Refer annexure from page no. 109 for performance of other schemes currently managed by Sankaran Naren.Mr. Ashwin Jain has been managing this fund since Oct 2016. Total Schemes managed by the Fund Manager ). Refer annexure from is 10 (10 are jointly managedpage no. 109 for performance of other schemes currently managed by Ashwin Jain. 3. Date of inception: 03-Mar-00.4. Past performance may or may not be sustained in future and the same may not necessarily provide the basis for comparison with other investment.5. Load is not considered for computation of returns.6. In case, the start/end date of the concerned period is a nonbusiness date (NBD), the NAV of the previous date is considered for computation of returns. The NAV per unit shown in the table is as on the start date of the said period7. As TRI data is not available since inception of the ICICI Prudential Technology Fund, benchmark performance is calculated using composite CAGR of S&P BSE Information Technology PRI values from 03-Mar-00 to 23-Aug-2004 and TRI values since 23-Aug-2004.
Scheme
Nifty 50 TRI (Additional Benchmark)
NAV (Rs.) Per Unit (as on August 30,2019 : 60.14)
CAGR (%)
10.00
S&P BSE Information Technology (Benchmark)
Since inception
CurrentValue of
Investment of Rs. 10000
CAGR (%) Current Value of
Investment of Rs. 10000
1 Year 3 Year 5 Year
CAGR (%) Current Value of
Investment of Rs. 10000
CAGR (%) Current Value of
Investment of Rs. 10000
60.87 39.05 36.86
Particulars
-1.20 9880.07 15.50 15400.77 10.27 16315.79 9.63 60140.00
5.72 10570.77 17.98 16412.54 12.00 17643.39 5.40 27873.64
-4.37 9564.51 9.31 13056.17 8.09 14765.89 11.79 87893.75
Concentrated

23
Fund Details
Quantitative Indicators
Note : - “Portfolio Beta, Standard Deviation, R Squared, Sharpe Ratio and Tracking Error of the Scheme is not computed owing to the short time frame since launch of the Scheme.”Portfolio turnover has been computed as the ratio of the lower value of purchase and sales, to the average net assets in the past one year (since inception for schemes that have not completed a year).@@ Total Expense Ratio is as on the last business day of the month.*** In case the unit holder has opted for dividend payout option, the minimum amount for dividend payout shall be 100 (net of dividend distribution tax and other statutory levy, if any), else the dividend would be mandatorily reinvested.**In addition to the fund manager managing this fund, overseas investment is managed by Ms. Priyanka Khandelwal.## Daily, Weekly and Fortnightly frequencies are available in Systematic Investment Plan (SIP), in addition to existing Monthly & Quarterly frequencies with effect from February 1, 2019. Minimum number of installments for daily, weekly, fortnightly and monthly frequencies will be 6 and for Quarterly frequency will be 4.* Minimum number of installments for daily, weekly and monthly frequency will be 6 and for Quarterly frequency will be 4. w.e.f February 01, 2017.&& Monthly, Quarterly, Half Yearly and Annual frequencies are available in Systematic Withdrawal Plan (SWP). The minimum number of instalments forall the frequencies will be 2.
Style Box
Fund Managers** :
Mr. Ihab Dalwai (Managing this fund since Jul 2018 & Overall 8 years of experience)
Indicative Investment Horizon: 5 Years and Above
Inception/Allotment date: 13-Jul-18
Options :Growth & Dividend (dividend payout*** and re-investment facility available)
Application Amount for freshSubscription :Rs.5,000 (plus in multiple of Rs.1)
Min.Addl.Investment :Rs.1000 (plus in multiple of Rs.1)
Exit load for Redemption / Switch out:- Lumpsum & SIP / STP Option: 1% of the applicable NAV - If units purchased or switched in from another scheme of the Fund are redeemed or switched out within 15 days from the date of allotment NIL - If units purchased or switched in from another scheme of the Fund areredeemed or switched out after 15 daysfrom the date of allotment (w.e.f. 1st Jan 2019)
##SIP :Daily, Weekly, Fortnightly & Monthly Frequency: Rs.100/- and in multiple of Re. 1/-Quarterly Frequency: Rs.5,000/- and in multiple of Re. 1/-
&&SWP :Rs. 500/- and in multiples of Re.1/-
STP * :Daily Frequency: Rs. 250/- and in multiples of Rs. 1/- Weekly, Monthly and Quarterly Frequency: Rs. 1,000/- and in multiples of Rs. 1/-
Min.Redemption Amt. : Rs. 500/- or all units where amount is below Rs. 500/-
Average P/E : 29.75 Average P/BV : 3.73 Average Dividend Yield : 0.61
ICICI Prudential Pharma Healthcare and Diagnostics (P.H.D) Fund(An Open Ended Equity Scheme following Pharma, Healthcare, Diagnostic and allied Theme.)
Entry load : Not Applicable
RiskometerThis Product is suitable for investors who are seeking*:
• Long Term Wealth Creation
• An Equity Scheme that predominantly invest in pharma, healthcare, hospitals, diagnostics, wellness and allied companies.
*Investors should consult their financial advisers if in doubt about whether the product is suitable for them.
NAV (As on 30-Aug-19):IPPHF Growth Option : Rs. 9.58IPPHF Dividend Option : 9.58IPPHF Direct Plan Growth Option : Rs. 9.76IPPHF Direct Plan Dividend Option : 9.76
Monthly AAUM as on 31-Aug-19 : Rs. 1,327.30 crores
Closing AUM as on 31-Aug-19 : Rs. 1,331.22 crores
Annual Portfolio Turnover Ratio : Equity - 0.31 times, Others (Debt and Derivatives) - 1.49 times Combined Annual Portfolio Turnover Ratio : 1.80 times
Dividend History : Refer page no. from 132 to 140
SIP Returns : Refer page no. from 128 to 130
Total Expense Ratio @@ :
IPPHF : 2.19% p. a.
IPPHF Direct Plan : 0.81% p. a.
Investment Objective : Refer page no. from 141 to 145
Equity Shares 93.31% -3.33% Chemicals 1.47% Tata Chemicals Ltd. 1.47% Finance 4.73% • SBI Life Insurance Company Ltd. 4.73% Healthcare Services 4.37% Narayana Hrudayalaya Ltd. 2.46% Aster DM Healthcare Ltd. 1.36% Healthcare Global Enterprises Ltd. 0.27% Max India Ltd. 0.25% Shalby Ltd. 0.03% Pharmaceuticals 82.75% -3.33%• Sun Pharmaceutical Industries Ltd. 10.15% • Cipla Ltd. 9.68% • Dr. Reddy's Laboratories Ltd. 7.30% -2.82%• Lupin Ltd. 6.48% -0.51%• Cadila Healthcare Ltd. 5.57% • Biocon Ltd. 5.27% • Sanofi India Ltd. 4.83% • Torrent Pharmaceuticals Ltd. 4.20% • IPCA Laboratories Ltd. 3.99% Laurus Labs Ltd. 3.72% Divi's Laboratories Ltd. 3.64% J.B.Chemicals & Pharmaceuticals Ltd. 3.14% Dishman Carbogen Amcis Ltd. 2.73% Alembic Pharmaceuticals Ltd. 2.17% Natco Pharma Ltd. 1.96% Indoco Remedies Ltd. 1.74% Alkem Laboratories Ltd. 1.52% Astrazeneca Pharma India Ltd. 1.13% Panacea Biotec Ltd. 0.96% Gufic Biosciences Ltd. 0.87% Syngene International Ltd. 0.85% Neuland Laboratories Ltd. 0.85% Short Term Debt and net current assets 10.01% Total Net Assets 100.00%
Company/Issuer % to % to NAV NAV Derivatives
• Top Ten HoldingsDerivatives are considered at exposure value.
Scheme
Nifty 50 TRI Index (Additional Benchmark)
NAV (Rs.) Per Unit (as on August 30,2019 : 9.58)
CAGR (%)
10.00
S&P BSE Healthcare TRI Index (Benchmark)
Since inception
CurrentValue of
Investment of Rs. 10000
CAGR (%) Current Value of
Investment of Rs. 10000
1 Year 3 Year 5 Year
CAGR (%) Current Value of
Investment of Rs. 10000
CAGR (%) Current Value of
Investment of Rs. 10000
10.83 - -
Particulars
-11.57 8845.80 - - - - -3.72 9580.00
-18.65 8139.60 - - - - -6.52 9265.20
-4.37 9564.51 - - - - 1.49 10168.32
Portfolio as on August 31, 2019
Returns of ICICI Prudential Pharma Healthcare and Diagnostics (P.H.D) Fund - Growth Option as on August 31, 2019 - (IPPHF)
Notes:1. Different plans shall have different expense structure. The performance details provided herein are of ICICI Prudential Pharma Healthcare and Diagnostics (P.H.D) Fund.2. The scheme is currently managed by Ihab Dalwai. Mr. Ihab Dalwai has been managing this fund since July 2018. Total Schemes managed by the Fund Manager is 5 (4 are jointly managed). Refer annexure from page no. 109 for performance of other schemes currently managed by Ihab Dalwai.3. Date of inception: 13-Jul-2018.4. As the Scheme has completed more than 1 year but less than 3 years, the performance details of only since inception and 1 year are provided herein.5. Past performance may or may not be sustained in future and the same may not necessarily provide the basis for comparison with other investment.6. Load is not considered for computation of returns.7. In case, the start/end date of the concerned period is a nonbusiness date (NBD), the NAV of the previous date is considered for computation of returns. The NAV per unit shown in the table is as on the start date of the said period8. The performance of the scheme is benchmarked to the Total Return variant of the Index.

24
Fund Managers** :
Sankaran Naren(Managing this fund since July, 2017 &Overall 29 years of experience)Ashwin Jain(Managing this fund since Aug, 2016 &Overall 12 years of experience)
Indicative Investment Horizon: 5 yearsand above
Inception/Allotment date: 30-Nov-05
NAV (As on 30-Aug-19):IPEASF Growth Option : 54.13IPEASF Dividend Option : 20.80IPEASF Direct Plan Growth Option : 57.08IPEASF Direct Plan Dividend Option : 32.74
Application Amount for freshSubscription :Rs.5,000 (plus in multiples of Re.1)
Min.Addl.Investment :Rs.1,000 (plus in multiples of Re.1)
Exit load for Redemption / Switchout :- Lumpsum & SIP / STP / SWP OptionUpto 15 days from allotment - 1% ofapplicable NAV, more than 15 days - Nil (w.e.f. 1st Jan 2019)
SIP :##
Daily, Weekly, Fortnightly & Monthly Frequency: Rs. 100/- and in multiple of Rs. 1/-Quarterly Frequency: Rs. 5,000/- and in multiple of Rs. 1/-
&&SWP :Rs. 500/- and in multiples of Rs. 1/-
STP/ Flex STP/ Value STP * :Daily Frequency: Rs. 250/- and in multiples of Rs. 1/-Weekly, Monthly and Quarterly Frequency: Rs. 1,000/- and in multiples of Rs. 1/-
Min.Redemption Amt. :500/- or all units where amount is below 500/-
Portfolio turnover has been computed as the ratio of the lower value of purchase and sales, to the average net assets in the past one year (since inception for schemes that have not completed a year). The figures are not netted for derivative transactions.Risk-free rate based on the last Overnight MIBOR cut-off of 5.45%**In addition to the fund manager managing this fund, overseas investment is managed by Ms. Priyanka Khandelwal.@@ Total Expense Ratio is as on the last business day of the month.## Daily, Weekly and Fortnightly frequencies are available in Systematic Investment Plan (SIP), in addition to existing Monthly & Quarterly frequencies with effect from February 1, 2019. Minimum number of installments for daily, weekly, fortnightly and monthly frequencies will be 6 and for Quarterly frequency will be 4.* Minimum number of installments for daily, weekly and monthly frequency will be 6 and for Quarterly frequency will be 4. w.e.f February 01, 2017. Refer page No. 148 for definition of Flex STP and Value STP.&& Monthly, Quarterly, Half Yearly and Annual frequencies are available in Systematic Withdrawal Plan (SWP). The minimum number of instalments for all the frequencies will be 2.*** In case the unit holder has opted for dividend payout option, the minimum amount for dividend payout shall be 100 (net of dividend distribution tax and other statutory levy, if any), else the dividend would be mandatorily reinvested.
Std Dev (Annualised) : 11.43% Sharpe Ratio :-0.11
Average P/E : 22.55 Average P/BV : 2.74 Average Dividend Yield : 2.08
Portfolio Beta : 0.57 R squared : 0.44
Style Box
• Top Ten Holdings
Portfolio as on August 31, 2019
Returns of ICICI Prudential Exports and Services Fund - Growth Option as on August 31, 2019 - (IPEASF)
Monthly AAUM as on 31-Aug-19 : Rs. 706.22 crores
Closing AUM as on 31-Aug-19 : Rs. 707.58 crores
ICICI Prudential Exports and Services Fund(erstwhile ICICI Prudential Exports and Other Services Fund)(An open ended equity scheme following Exports & Servicestheme)
Benchmark Std Dev (Annualised) : 13.25%
Entry load : Not Applicable
RiskometerThis Product is suitable for investors who are seeking*:
• Long Term Wealth Creation
• An open-ended equity scheme that aims for growth by predominantly investing in companies belonging to Exports & Services industry.
*Investors should consult their financial advisers if in doubt about whether the product is suitable for them.
Annual Portfolio Turnover Ratio : Equity - 1.46 times, Others (Debt and Derivatives) - 0.02 times Combined Annual Portfolio Turnover Ratio : 1.48 times
Options :Growth & Dividend(dividend payout*** and re-investment facility available)
Dividend History : Refer page no. from 132 to 140
SIP Returns : Refer page no. from 128 to 130
Total Expense Ratio @@ :
IPEASF : 2.48% p. a.
IPEASF Direct Plan : 1.60% p. a.
Investment Objective : Refer page no. from 141 to 145
Notes:1. Different plans shall have different expense structure. The performance details provided herein are of ICICI Prudential Exports and Services Fund.2. The scheme is currently managed by Sankaran Naren and Ashwin Jain. Mr. Sankaran Naren has been managing this fund since Jul 2017. Total Schemes managed by the Fund Manager is 33 (33 are jointly managed). Refer annexure from page no. 109 for performance of other schemes currently managed by Sankaran Naren.Mr. Ashwin Jain has been managing this fund since Aug 2016. Total Schemes managed by the Fund Manager ). Refer annexure from page no. 98 is 10 (10 are jointly managedfor performance of other schemes currently managed by Ashwin Jain. 3. Date of inception: 30-Nov-05.4. Past performance may or may not be sustained in future and the same may not necessarily provide the basis for comparison with other investment.5. Load is not considered for computation of returns.6. In case, the start/end date of the concerned period is a nonbusiness date (NBD), the NAV of the previous date is considered for computation of returns. The NAV per unit shown in the table is as on the start date of the said period7. The performance of the scheme is benchmarked to the Total Return variant of the Index8. The performance of ICICI Prudential Exports & Services Fund is benchmarked to the Total Return variant of the Index. For benchmark performance, values of S&P BSE 500 TRI to be considered w.e.f. September 09, 2019 for returns since inception.
Scheme
Nifty 50 TRI (Additional Benchmark)
NAV (Rs.) Per Unit (as on August 30,2019 : 54.13)
CAGR (%)
10.00
Nifty Services Sector TRI (Benchmark)
Since inception
CurrentValue of
Investment of Rs. 10000
CAGR (%) Current Value of
Investment of Rs. 10000
1 Year 3 Year 5 Year
CAGR (%) Current Value of
Investment of Rs. 10000
CAGR (%) Current Value of
Investment of Rs. 10000
60.80 48.61 36.95
Particulars
-11.00 8902.96 3.65 11135.57 7.92 14649.53 13.06 54130.00
2.30 10229.41 13.60 14653.14 11.71 17412.88 13.21 55103.79
-4.37 9564.51 9.31 13056.17 8.09 14765.89 12.31 49365.27
Company/Issuer % to NAV
Power 22.80%• NTPC Ltd. 9.68%• Tata Power Company Ltd. 6.04% NLC India Ltd. 3.49% SJVN Ltd. 2.34% NHPC Ltd. 1.21% Kalpataru Power Transmission Ltd. 0.05% Software 14.67%• Infosys Ltd. 9.33% Tech Mahindra Ltd. 3.00% Oracle Financial Services Software Ltd. 2.34% Telecom - Services 10.42%• Bharti Airtel Ltd. 8.65% Vodafone Idea Ltd. 1.77% Transportation 7.60%• VRL Logistics Ltd. 5.40% Gujarat Pipavav Port Ltd. 2.20% Short Term Debt and net current assets 5.86% Total Net Assets 100.00%
Equity Shares 94.14% Banks 15.99%• ICICI Bank Ltd. 9.48%• State Bank Of India 3.90% The Federal Bank Ltd. 2.34% Bank Of Baroda 0.26% Construction 0.53% Capacite Infraprojects Ltd. 0.53% Construction Project 0.94% KEC International Ltd. 0.94% Finance 6.17%• SBI Life Insurance Company Ltd. 4.05% General Insurance Corporation of India 1.42% Mahindra & Mahindra Financial Services Ltd. 0.70% Industrial Capital Goods 0.09% Bharat Electronics Ltd. 0.09% Media & Entertainment 3.01% Sun TV Network Ltd. 3.01% Pharmaceuticals 11.93%• Sun Pharmaceutical Industries Ltd. 6.48%• Cipla Ltd. 4.98% Ajanta Pharma Ltd. 0.46%
Concentrated
Company/Issuer % to NAV

25
Fund Details
Portfolio as on August 31, 2019
Style Box
Quantitative Indicators
Returns of ICICI Prudential Infrastructure Fund - Growth Option as on August 31, 2019 - (IPINF)
Fund Managers** :
Sankaran Naren(Managing this fund since Dec, 2015 &Overall 29 years of experience)Ihab Dalwai(Managing this fund since June, 2017 & overall 8 years of experience)
Indicative Investment Horizon: 5 years and above
Inception/Allotment date: 31-Aug-05
NAV (As on 30-Aug-19):IPIF Growth Option : 46.71IPINF Dividend Option : 10.82IPINF Direct Plan Growth Option : 48.94IPINF Direct Plan Dividend Option : 14.85
Options :Growth & Dividend(dividend payout*** and re-investment facility available)
Application Amount for freshSubscription :Rs.5,000 (plus in multiples of Re.1)
Min.Addl. Investment :Rs.1,000 (plus in multiples of Re.1)
Exit load for Redemption / Switch out:- Lumpsum & SIP / STP / SWP OptionIf units purchased or switched in from another scheme of the Fund are redeemed or switched out within 15 days from the date of allotment - 1% of applicable NAV,If units purchased or switched in fromanother scheme of the Fund are redeemedor switched out after 15 days from the dateof allotment - NIL (w.e.f. 1st August 2018)
##SIP :Daily, Weekly, Fortnightly & Monthly Frequency: Rs. 100/- and in multiple of Rs. 1/-Quarterly Frequency: Rs. 5,000/- and in multiple of Rs. 1/-
&&SWP :Rs. 500/- and in multiples of Rs. 1/-
STP/ Flex STP/ Value STP * :Daily Frequency: Rs. 250/- and in multiples of Rs. 1/-Weekly, Monthly and Quarterly Frequency: Rs. 1,000/- and in multiples of Rs. 1/-
Min.Redemption Amt. :500/- or all units where amount is below 500/-
• Top Ten Holdings
Std Dev (Annualised) : 16.44% Sharpe Ratio : -0.05
Average P/E : 18.46 Average P/BV : 1.59 Average Dividend Yield : 2.99
Portfolio Beta : 0.91 R squared : 0.91
Portfolio turnover has been computed as the ratio of the lower value of purchase and sales, to the average net assets in the past one year (since inception for schemes that have not completed a year). The figures are not netted for derivative transactions.Risk-free rate based on the last Overnight MIBOR cut-off of 5.45%.**In addition to the fund manager managing this fund, overseas investment is managed by Ms. Priyanka Khandelwal.@@ Total Expense Ratio is as on the last business day of the month.## Daily, Weekly and Fortnightly frequencies are available in Systematic Investment Plan (SIP), in addition to existing Monthly & Quarterly frequencies with effect from February 1, 2019. Minimum number of installments for daily, weekly, fortnightly and monthly frequencies will be 6 and for Quarterly frequency will be 4.* Minimum number of installments for daily, weekly and monthly frequency will be 6 and for Quarterly frequency will be 4. w.e.f February 01, 2017. Refer page No. 148 for definition of Flex STP and Value STP.&&
Monthly, Quarterly, Half Yearly and Annual frequencies are available in Systematic Withdrawal Plan (SWP). The minimum number of instalments for all the frequencies will be 2.*** In case the unit holder has opted for dividend payout option, the minimum amount for dividend payout shall be 100 (net of dividend distribution tax and other statutory levy, if any), else the dividend would be mandatorily reinvested.
Monthly AAUM as on 31-Aug-19 : Rs. 1,107.75 crores
Closing AUM as on 31-Aug-19 : Rs. 1,089.45 crores
ICICI Prudential Infrastructure Fund(An open ended equity scheme following Infrastructure theme.)
Benchmark Std Dev (Annualised) : 17.28%
Entry load : Not Applicable
RiskometerThis Product is suitable for investors who are seeking*:
• Long Term Wealth Creation
• An open-ended equity scheme that aims for growth by primarily investing in companies belonging to infrastructure and allied sectors
*Investors should consult their financial advisers if in doubt about whether the product is suitable for them.
Annual Portfolio Turnover Ratio : Equity - 0.47 times, Others (Debt and Derivatives) - 0.23 times Combined Annual Portfolio Turnover Ratio : 0.70 times
Dividend History : Refer page no. from 132 to 140
SIP Returns : Refer page no. from 128 to 130
Total Expense Ratio @@ :
IPINF : 2.34% p. a.
IPINF Direct Plan : 1.62% p. a.
Investment Objective : Refer page no. from 141 to 145
Notes:1. Different plans shall have different expense structure. The performance details provided herein are of ICICI Prudential Infrastructure Fund.2. The scheme is currently managed by Sankaran Naren and Ihab Dalwai. Mr. Sankaran Naren has been managing this fund since Dec 2015. Total Schemes managed by the Fund Manager is 33 (33 are jointly managed). Refer annexure from page no. 109 for performance of other schemes currently managed by Sankaran Naren.Mr. Ihab Dalwai has been managing this fund since June 2017. Total Schemes managed by the Fund Manager is 5 . Refer annexure from page no. 109 (4 are jointly managed)for performance of other schemes currently managed by Ihab Dalwai.3. Date of inception:31-Aug-05.4. Past performance may or may not be sustained in future and the same may not necessarily provide the basis for comparison with other investment.5. Load is not considered for computation of returns.6. In case, the start/end date of the concerned period is a nonbusiness date (NBD), the NAV of the previous date is considered for computation of returns. The NAV per unit shown in the table is as on the start date of the said period7. The performance of the scheme is benchmarked to the Total Return variant of the Index
Scheme
Nifty 50 TRI (Additional Benchmark)
NAV (Rs.) Per Unit (as on August 30,2019 : 46.71)
CAGR (%)
10.00
Nifty Infrastructure TRI (Benchmark)
Since inception
CurrentValue of
Investment of Rs. 10000
CAGR (%) Current Value of
Investment of Rs. 10000
1 Year 3 Year 5 Year
CAGR (%) Current Value of
Investment of Rs. 10000
CAGR (%) Current Value of
Investment of Rs. 10000
51.71 42.25 38.06
Particulars
-9.69 9033.07 3.40 11055.62 4.17 12272.73 11.63 46710.00
-6.58 9344.16 2.62 10806.88 0.86 10437.43 5.25 20482.93
-4.37 9564.51 9.31 13056.17 8.09 14765.89 12.96 55105.37
Minerals/Mining 0.95% Gujarat Mineral Development Corporation Ltd. 0.95% Non - Ferrous Metals 10.14%• Vedanta Ltd. 4.38%• Hindalco Industries Ltd. 4.23% National Aluminium Co. Ltd. 1.53% Oil 5.66%• Oil & Natural Gas Corporation Ltd. 4.64% Oil India Ltd. 1.02% Paper 0.65% Tamil Nadu Newsprint & Papers Ltd. 0.65% Petroleum Products 5.27%• Indian Oil Corporation Ltd. 3.45% Chennai Petroleum Corporation Ltd. 1.32% Bharat Petroleum Corporation Ltd. 0.49% Power 14.70%• NTPC Ltd. 9.65% Tata Power Company Ltd. 2.13% Kalpataru Power Transmission Ltd. 2.08% NLC India Ltd. 0.84% Telecom - Equipment & Accessories 0.88% Astra Microwave Products Ltd. 0.88% Telecom - Services 7.64%• Bharti Airtel Ltd. 7.64% Transportation 10.09%• Gujarat Pipavav Port Ltd. 3.58% VRL Logistics Ltd. 2.15% The Great Eastern Shipping Company Ltd. 2.02% Container Corporation Of India Ltd. 1.23% Gateway Distriparks Ltd. 1.12% Short Term Debt and net current assets 2.27% Total Net Assets 100.00%
Equity Shares 97.73% Aerospace & Defense 0.28% Hindustan Aeronautics Ltd. 0.28% Banks 12.75%• State Bank Of India 8.30% Axis Bank Ltd. 1.92% ICICI Bank Ltd. 1.88% Union Bank Of India 0.65% Cement 3.87% JK Lakshmi Cement Ltd. 1.94% Orient Cement Ltd. 1.01% JK Cement Ltd. 0.91% Chemicals 0.55% Rain Industries Ltd. 0.55% Construction 9.95%• Brigade Enterprises Ltd. 3.06% PNC Infratech Ltd. 2.98% KNR Constructions Ltd. 2.84% Capacite Infraprojects Ltd. 0.80% Ashiana Housing Ltd. 0.27% Construction Project 7.22%• Larsen & Toubro Ltd. 4.11% Engineers India Ltd. 1.79% Ashoka Buildcon Ltd. 0.83% Techno Electric & Engineering Company Ltd. 0.49% Ferrous Metals 0.67% Tata Metaliks Ltd. 0.67% Finance 0.28% IDFC Ltd. 0.28% Gas 1.21% GAIL (India) Ltd. 1.21% Industrial Capital Goods 4.06% Triveni Turbine Ltd. 1.64% Siemens Ltd. 1.11% Bharat Heavy Electricals Ltd. 0.87% TD Power Systems Ltd. 0.23% Texmaco Rail & Engineering Ltd. 0.22% Industrial Products 0.91% Cummins India Ltd. 0.91%
Company/Issuer % to NAV
Company/Issuer % to NAV
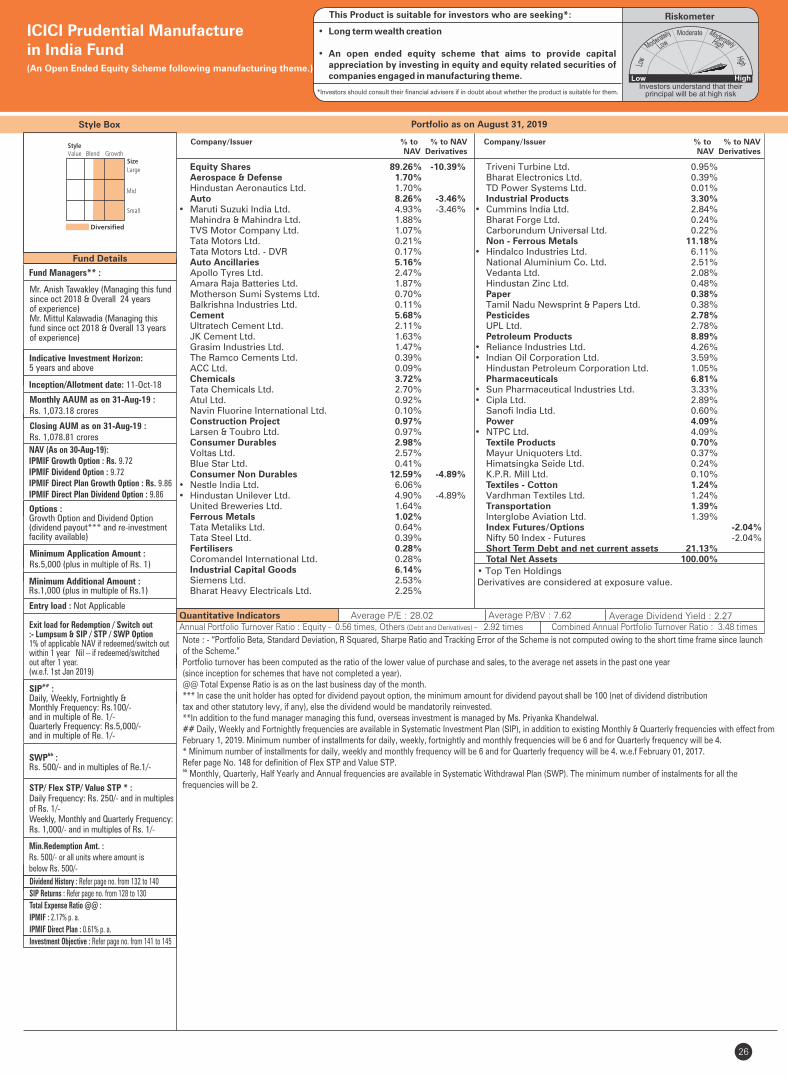
26
Fund Details
Portfolio as on August 31, 2019Style Box
Quantitative Indicators
Fund Managers** :
Mr. Anish Tawakley (Managing this fund since oct 2018 & Overall 24 years of experience) Mr. Mittul Kalawadia (Managing this fund since oct 2018 & Overall 13 years of experience)
Indicative Investment Horizon: 5 years and above
Inception/Allotment date: 11-Oct-18
NAV (As on 30-Aug-19):IPMIF Growth Option : Rs. 9.72IPMIF Dividend Option : 9.72IPMIF Direct Plan Growth Option : Rs. 9.86IPMIF Direct Plan Dividend Option : 9.86
Options :Growth Option and Dividend Option (dividend payout*** and re-investment facility available)
Minimum Application Amount :Rs.5,000 (plus in multiple of Rs. 1)
Minimum Additional Amount :Rs.1,000 (plus in multiple of Rs.1)
Exit load for Redemption / Switch out:- Lumpsum & SIP / STP / SWP Option1% of applicable NAV if redeemed/switch out within 1 year Nil – if redeemed/switched out after 1 year. (w.e.f. 1st Jan 2019)
##SIP :Daily, Weekly, Fortnightly & Monthly Frequency: Rs.100/- and in multiple of Re. 1/-Quarterly Frequency: Rs.5,000/- and in multiple of Re. 1/-
&&SWP :Rs. 500/- and in multiples of Re.1/-
STP/ Flex STP/ Value STP * :Daily Frequency: Rs. 250/- and in multiples of Rs. 1/- Weekly, Monthly and Quarterly Frequency: Rs. 1,000/- and in multiples of Rs. 1/-
Min.Redemption Amt. :Rs. 500/- or all units where amount is below Rs. 500/-
• Top Ten HoldingsDerivatives are considered at exposure value.
Average P/E : 28.02 Average P/BV : 7.62 Average Dividend Yield : 2.27
Monthly AAUM as on 31-Aug-19 : Rs. 1,073.18 crores
Closing AUM as on 31-Aug-19 : Rs. 1,078.81 crores
ICICI Prudential Manufacture in India Fund(An Open Ended Equity Scheme following manufacturing theme.)
Entry load : Not Applicable
RiskometerThis Product is suitable for investors who are seeking*:
• Long term wealth creation
• An open ended equity scheme that aims to provide capital appreciation by investing in equity and equity related securities of companies engaged in manufacturing theme.
*Investors should consult their financial advisers if in doubt about whether the product is suitable for them.
Annual Portfolio Turnover Ratio : Equity - 0.56 times, Others (Debt and Derivatives) - 2.92 times Combined Annual Portfolio Turnover Ratio : 3.48 times
Dividend History : Refer page no. from 132 to 140
SIP Returns : Refer page no. from 128 to 130
Total Expense Ratio @@ :
IPMIF : 2.17% p. a.
IPMIF Direct Plan : 0.61% p. a.
Investment Objective : Refer page no. from 141 to 145
Equity Shares 89.26% -10.39% Aerospace & Defense 1.70% Hindustan Aeronautics Ltd. 1.70% Auto 8.26% -3.46%• Maruti Suzuki India Ltd. 4.93% -3.46% Mahindra & Mahindra Ltd. 1.88% TVS Motor Company Ltd. 1.07% Tata Motors Ltd. 0.21% Tata Motors Ltd. - DVR 0.17% Auto Ancillaries 5.16% Apollo Tyres Ltd. 2.47% Amara Raja Batteries Ltd. 1.87% Motherson Sumi Systems Ltd. 0.70% Balkrishna Industries Ltd. 0.11% Cement 5.68% Ultratech Cement Ltd. 2.11% JK Cement Ltd. 1.63% Grasim Industries Ltd. 1.47% The Ramco Cements Ltd. 0.39% ACC Ltd. 0.09% Chemicals 3.72% Tata Chemicals Ltd. 2.70% Atul Ltd. 0.92% Navin Fluorine International Ltd. 0.10% Construction Project 0.97% Larsen & Toubro Ltd. 0.97% Consumer Durables 2.98% Voltas Ltd. 2.57% Blue Star Ltd. 0.41% Consumer Non Durables 12.59% -4.89%• Nestle India Ltd. 6.06% • Hindustan Unilever Ltd. 4.90% -4.89% United Breweries Ltd. 1.64% Ferrous Metals 1.02% Tata Metaliks Ltd. 0.64% Tata Steel Ltd. 0.39% Fertilisers 0.28% Coromandel International Ltd. 0.28% Industrial Capital Goods 6.14% Siemens Ltd. 2.53% Bharat Heavy Electricals Ltd. 2.25%
Triveni Turbine Ltd. 0.95% Bharat Electronics Ltd. 0.39% TD Power Systems Ltd. 0.01% Industrial Products 3.30% • Cummins India Ltd. 2.84% Bharat Forge Ltd. 0.24% Carborundum Universal Ltd. 0.22% Non - Ferrous Metals 11.18% • Hindalco Industries Ltd. 6.11% National Aluminium Co. Ltd. 2.51% Vedanta Ltd. 2.08% Hindustan Zinc Ltd. 0.48% Paper 0.38% Tamil Nadu Newsprint & Papers Ltd. 0.38% Pesticides 2.78% UPL Ltd. 2.78% Petroleum Products 8.89% • Reliance Industries Ltd. 4.26% • Indian Oil Corporation Ltd. 3.59% Hindustan Petroleum Corporation Ltd. 1.05% Pharmaceuticals 6.81% • Sun Pharmaceutical Industries Ltd. 3.33% • Cipla Ltd. 2.89% Sanofi India Ltd. 0.60% Power 4.09% • NTPC Ltd. 4.09% Textile Products 0.70% Mayur Uniquoters Ltd. 0.37% Himatsingka Seide Ltd. 0.24% K.P.R. Mill Ltd. 0.10% Textiles - Cotton 1.24% Vardhman Textiles Ltd. 1.24% Transportation 1.39% Interglobe Aviation Ltd. 1.39% Index Futures/Options -2.04% Nifty 50 Index - Futures -2.04% Short Term Debt and net current assets 21.13% Total Net Assets 100.00%
Company/Issuer % to % to NAV NAV Derivatives
Company/Issuer % to % to NAV NAV Derivatives
Note : - “Portfolio Beta, Standard Deviation, R Squared, Sharpe Ratio and Tracking Error of the Scheme is not computed owing to the short time frame since launch of the Scheme.”Portfolio turnover has been computed as the ratio of the lower value of purchase and sales, to the average net assets in the past one year (since inception for schemes that have not completed a year).@@ Total Expense Ratio is as on the last business day of the month.*** In case the unit holder has opted for dividend payout option, the minimum amount for dividend payout shall be 100 (net of dividend distribution tax and other statutory levy, if any), else the dividend would be mandatorily reinvested.**In addition to the fund manager managing this fund, overseas investment is managed by Ms. Priyanka Khandelwal.
Daily, Weekly and Fortnightly frequencies are available in Systematic Investment Plan (SIP), in addition to existing Monthly & Quarterly frequencies with effect from ## February 1, 2019. Minimum number of installments for daily, weekly, fortnightly and monthly frequencies will be 6 and for Quarterly frequency will be 4.* Minimum number of installments for daily, weekly and monthly frequency will be 6 and for Quarterly frequency will be 4. w.e.f February 01, 2017. Refer page No. 148 for definition of Flex STP and Value STP.&& Monthly, Quarterly, Half Yearly and Annual frequencies are available in Systematic Withdrawal Plan (SWP). The minimum number of instalments for all the frequencies will be 2.
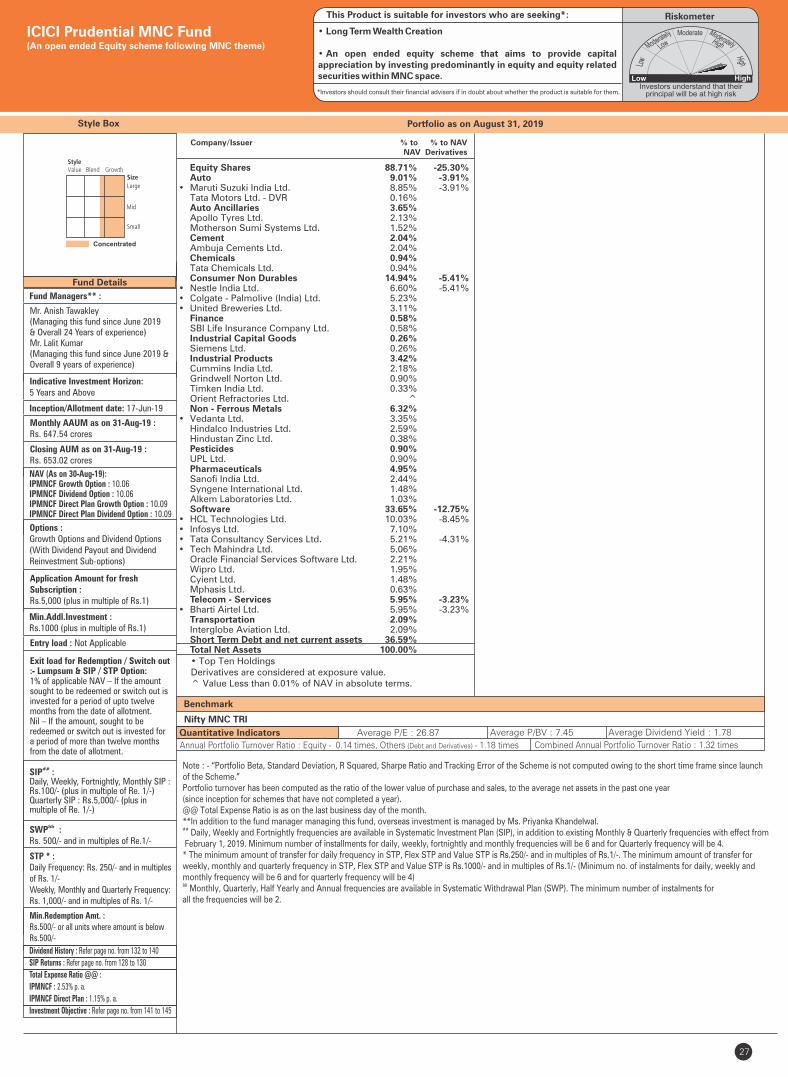
27
Fund Details
Quantitative Indicators
Note : - “Portfolio Beta, Standard Deviation, R Squared, Sharpe Ratio and Tracking Error of the Scheme is not computed owing to the short time frame since launch of the Scheme.”Portfolio turnover has been computed as the ratio of the lower value of purchase and sales, to the average net assets in the past one year (since inception for schemes that have not completed a year).@@ Total Expense Ratio is as on the last business day of the month.**In addition to the fund manager managing this fund, overseas investment is managed by Ms. Priyanka Khandelwal.## Daily, Weekly and Fortnightly frequencies are available in Systematic Investment Plan (SIP), in addition to existing Monthly & Quarterly frequencies with effect from February 1, 2019. Minimum number of installments for daily, weekly, fortnightly and monthly frequencies will be 6 and for Quarterly frequency will be 4.* The minimum amount of transfer for daily frequency in STP, Flex STP and Value STP is Rs.250/- and in multiples of Rs.1/-. The minimum amount of transfer for weekly, monthly and quarterly frequency in STP, Flex STP and Value STP is Rs.1000/- and in multiples of Rs.1/- (Minimum no. of instalments for daily, weekly and monthly frequency will be 6 and for quarterly frequency will be 4) && Monthly, Quarterly, Half Yearly and Annual frequencies are available in Systematic Withdrawal Plan (SWP). The minimum number of instalments forall the frequencies will be 2.
Style Box
Fund Managers** :
Mr. Anish Tawakley (Managing this fund since June 2019 & Overall 24 Years of experience)Mr. Lalit Kumar (Managing this fund since June 2019 &Overall 9 years of experience)
Indicative Investment Horizon: 5 Years and Above
Inception/Allotment date: 17-Jun-19
Options :Growth Options and Dividend Options(With Dividend Payout and Dividend Reinvestment Sub-options)
Application Amount for freshSubscription :Rs.5,000 (plus in multiple of Rs.1)
Min.Addl.Investment :Rs.1000 (plus in multiple of Rs.1)
Exit load for Redemption / Switch out:- Lumpsum & SIP / STP Option:1% of applicable NAV – If the amount sought to be redeemed or switch out is invested for a period of upto twelve months from the date of allotment.Nil – If the amount, sought to be redeemed or switch out is invested for a period of more than twelve months from the date of allotment.
##SIP :Daily, Weekly, Fortnightly, Monthly SIP : Rs.100/- (plus in multiple of Re. 1/-) Quarterly SIP : Rs.5,000/- (plus inmultiple of Re. 1/-)
&&SWP :Rs. 500/- and in multiples of Re.1/-
STP * :Daily Frequency: Rs. 250/- and in multiplesof Rs. 1/-Weekly, Monthly and Quarterly Frequency:Rs. 1,000/- and in multiples of Rs. 1/-
Min.Redemption Amt. : Rs.500/- or all units where amount is below Rs.500/-
Portfolio as on August 31, 2019
Average P/E : 26.87 Average P/BV : 7.45 Average Dividend Yield : 1.78
ICICI Prudential MNC Fund (An open ended Equity scheme following MNC theme)
Entry load : Not Applicable
RiskometerThis Product is suitable for investors who are seeking*:
• Long Term Wealth Creation
• An open ended equity scheme that aims to provide capital appreciation by investing predominantly in equity and equity related securities within MNC space.
*Investors should consult their financial advisers if in doubt about whether the product is suitable for them.
NAV (As on 30-Aug-19):IPMNCF Growth Option : 10.06IPMNCF Dividend Option : 10.06IPMNCF Direct Plan Growth Option : 10.09IPMNCF Direct Plan Dividend Option : 10.09
Monthly AAUM as on 31-Aug-19 : Rs. 647.54 crores
Closing AUM as on 31-Aug-19 : Rs. 653.02 crores
Annual Portfolio Turnover Ratio : Equity - 0.14 times, Others (Debt and Derivatives) - 1.18 times Combined Annual Portfolio Turnover Ratio : 1.32 times
Dividend History : Refer page no. from 132 to 140
SIP Returns : Refer page no. from 128 to 130
Total Expense Ratio @@ :
IPMNCF : 2.53% p. a.
IPMNCF Direct Plan : 1.15% p. a.
Investment Objective : Refer page no. from 141 to 145
Equity Shares 88.71% -25.30% Auto 9.01% -3.91%• Maruti Suzuki India Ltd. 8.85% -3.91% Tata Motors Ltd. - DVR 0.16% Auto Ancillaries 3.65% Apollo Tyres Ltd. 2.13% Motherson Sumi Systems Ltd. 1.52% Cement 2.04% Ambuja Cements Ltd. 2.04% Chemicals 0.94% Tata Chemicals Ltd. 0.94% Consumer Non Durables 14.94% -5.41%• Nestle India Ltd. 6.60% -5.41%• Colgate - Palmolive (India) Ltd. 5.23% • United Breweries Ltd. 3.11% Finance 0.58% SBI Life Insurance Company Ltd. 0.58% Industrial Capital Goods 0.26% Siemens Ltd. 0.26% Industrial Products 3.42% Cummins India Ltd. 2.18% Grindwell Norton Ltd. 0.90% Timken India Ltd. 0.33% Orient Refractories Ltd. ^ Non - Ferrous Metals 6.32% • Vedanta Ltd. 3.35% Hindalco Industries Ltd. 2.59% Hindustan Zinc Ltd. 0.38% Pesticides 0.90% UPL Ltd. 0.90% Pharmaceuticals 4.95% Sanofi India Ltd. 2.44% Syngene International Ltd. 1.48% Alkem Laboratories Ltd. 1.03% Software 33.65% -12.75%• HCL Technologies Ltd. 10.03% -8.45%• Infosys Ltd. 7.10% • Tata Consultancy Services Ltd. 5.21% -4.31%• Tech Mahindra Ltd. 5.06% Oracle Financial Services Software Ltd. 2.21% Wipro Ltd. 1.95% Cyient Ltd. 1.48% Mphasis Ltd. 0.63% Telecom - Services 5.95% -3.23%• Bharti Airtel Ltd. 5.95% -3.23% Transportation 2.09% Interglobe Aviation Ltd. 2.09% Short Term Debt and net current assets 36.59% Total Net Assets 100.00%
Company/Issuer % to % to NAV NAV Derivatives
• Top Ten HoldingsDerivatives are considered at exposure value.^ Value Less than 0.01% of NAV in absolute terms.
Concentrated
Benchmark
Nifty MNC TRI
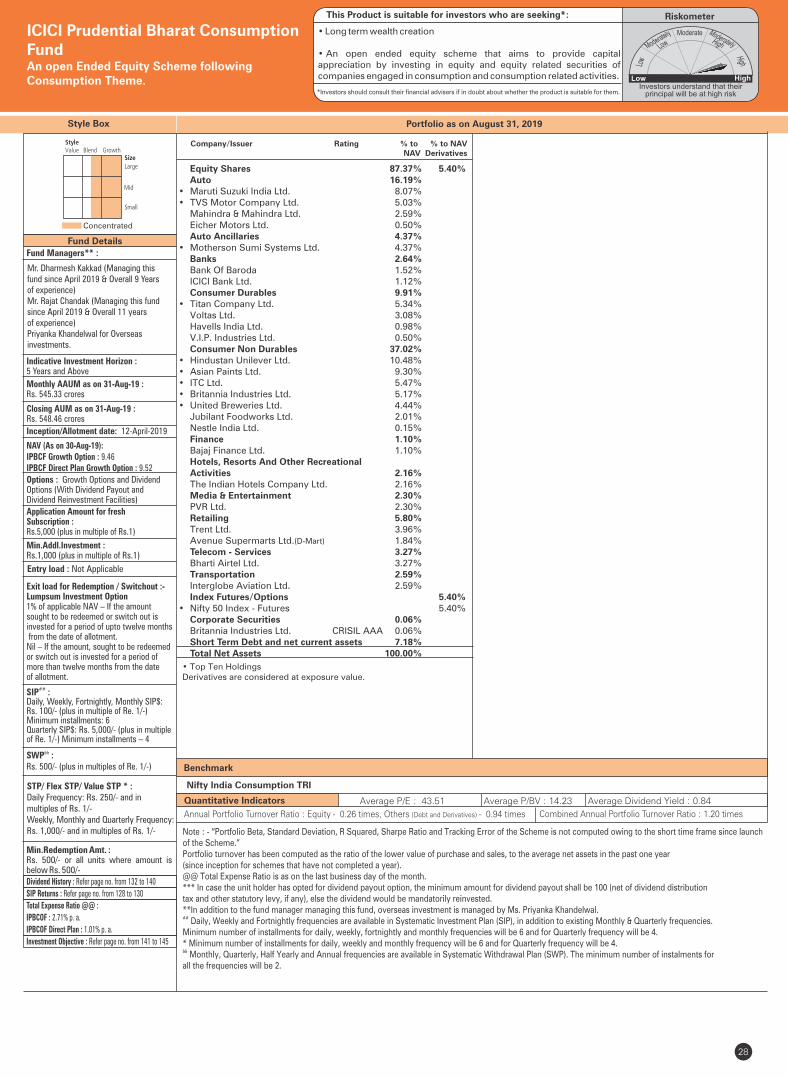
Style Box
Fund Managers** :
Indicative Investment Horizon : 5 Years and Above
Inception/Allotment date: 12-April-2019
&&SWP :Rs. 500/- (plus in multiples of Re. 1/-)
Min.Redemption Amt. :Rs. 500/- or all units where amount is below Rs. 500/-
##SIP :Daily, Weekly, Fortnightly, Monthly SIP$: Rs. 100/- (plus in multiple of Re. 1/-) Minimum installments: 6 Quarterly SIP$: Rs. 5,000/- (plus in multiple of Re. 1/-) Minimum installments – 4
NAV (As on 30-Aug-19):IPBCF Growth Option : 9.46IPBCF Direct Plan Growth Option : 9.52
Options : Growth Options and Dividend Options (With Dividend Payout and Dividend Reinvestment Facilities)
Application Amount for freshSubscription :Rs.5,000 (plus in multiple of Rs.1)
Min.Addl.Investment :Rs.1,000 (plus in multiple of Rs.1)
Exit load for Redemption / Switchout :- Lumpsum Investment Option1% of applicable NAV – If the amount sought to be redeemed or switch out is invested for a period of upto twelve months from the date of allotment.Nil – If the amount, sought to be redeemed or switch out is invested for a period of more than twelve months from the date of allotment.
28
Fund Details
Concentrated
Portfolio as on August 31, 2019
Quantitative Indicators
Benchmark
Average P/E : 43.51 Average P/BV : 14.23 Average Dividend Yield : 0.84
Nifty India Consumption TRI
ICICI Prudential Bharat Consumption FundAn open Ended Equity Scheme following Consumption Theme.
Monthly AAUM as on 31-Aug-19 : Rs. 545.33 crores
Closing AUM as on 31-Aug-19 : Rs. 548.46 crores
Entry load : Not Applicable
Annual Portfolio Turnover Ratio : Equity - 0.26 times, Others (Debt and Derivatives) - 0.94 times Combined Annual Portfolio Turnover Ratio : 1.20 times
Dividend History : Refer page no. from 132 to 140
SIP Returns : Refer page no. from 128 to 130
Total Expense Ratio @@ :
IPBCOF : 2.71% p. a.
IPBCOF Direct Plan : 1.01% p. a.
Investment Objective : Refer page no. from 141 to 145
Mr. Dharmesh Kakkad (Managing this fund since April 2019 & Overall 9 Years of experience) Mr. Rajat Chandak (Managing this fund since April 2019 & Overall 11 years of experience) Priyanka Khandelwal for Overseas investments.
• Top Ten HoldingsDerivatives are considered at exposure value.
RiskometerThis Product is suitable for investors who are seeking*:
• Long term wealth creation
• An open ended equity scheme that aims to provide capital appreciation by investing in equity and equity related securities of companies engaged in consumption and consumption related activities.
*Investors should consult their financial advisers if in doubt about whether the product is suitable for them.
STP/ Flex STP/ Value STP * :Daily Frequency: Rs. 250/- and in multiples of Rs. 1/- Weekly, Monthly and Quarterly Frequency: Rs. 1,000/- and in multiples of Rs. 1/- Note : - “Portfolio Beta, Standard Deviation, R Squared, Sharpe Ratio and Tracking Error of the Scheme is not computed owing to the short time frame since launch
of the Scheme.”Portfolio turnover has been computed as the ratio of the lower value of purchase and sales, to the average net assets in the past one year (since inception for schemes that have not completed a year).@@ Total Expense Ratio is as on the last business day of the month.*** In case the unit holder has opted for dividend payout option, the minimum amount for dividend payout shall be 100 (net of dividend distribution tax and other statutory levy, if any), else the dividend would be mandatorily reinvested.**In addition to the fund manager managing this fund, overseas investment is managed by Ms. Priyanka Khandelwal.## Daily, Weekly and Fortnightly frequencies are available in Systematic Investment Plan (SIP), in addition to existing Monthly & Quarterly frequencies.Minimum number of installments for daily, weekly, fortnightly and monthly frequencies will be 6 and for Quarterly frequency will be 4.* Minimum number of installments for daily, weekly and monthly frequency will be 6 and for Quarterly frequency will be 4. && Monthly, Quarterly, Half Yearly and Annual frequencies are available in Systematic Withdrawal Plan (SWP). The minimum number of instalments forall the frequencies will be 2.
Equity Shares 87.37% 5.40% Auto 16.19% • Maruti Suzuki India Ltd. 8.07% • TVS Motor Company Ltd. 5.03% Mahindra & Mahindra Ltd. 2.59% Eicher Motors Ltd. 0.50% Auto Ancillaries 4.37% • Motherson Sumi Systems Ltd. 4.37% Banks 2.64% Bank Of Baroda 1.52% ICICI Bank Ltd. 1.12% Consumer Durables 9.91% • Titan Company Ltd. 5.34% Voltas Ltd. 3.08% Havells India Ltd. 0.98% V.I.P. Industries Ltd. 0.50% Consumer Non Durables 37.02% • Hindustan Unilever Ltd. 10.48% • Asian Paints Ltd. 9.30% • ITC Ltd. 5.47% • Britannia Industries Ltd. 5.17% • United Breweries Ltd. 4.44% Jubilant Foodworks Ltd. 2.01% Nestle India Ltd. 0.15% Finance 1.10% Bajaj Finance Ltd. 1.10% Hotels, Resorts And Other Recreational Activities 2.16% The Indian Hotels Company Ltd. 2.16% Media & Entertainment 2.30% PVR Ltd. 2.30% Retailing 5.80% Trent Ltd. 3.96% Avenue Supermarts Ltd.(D-Mart) 1.84% Telecom - Services 3.27% Bharti Airtel Ltd. 3.27% Transportation 2.59% Interglobe Aviation Ltd. 2.59% Index Futures/Options 5.40%• Nifty 50 Index - Futures 5.40% Corporate Securities 0.06% Britannia Industries Ltd. CRISIL AAA 0.06% Short Term Debt and net current assets 7.18% Total Net Assets 100.00%
Company/Issuer Rating % to % to NAV NAV Derivatives
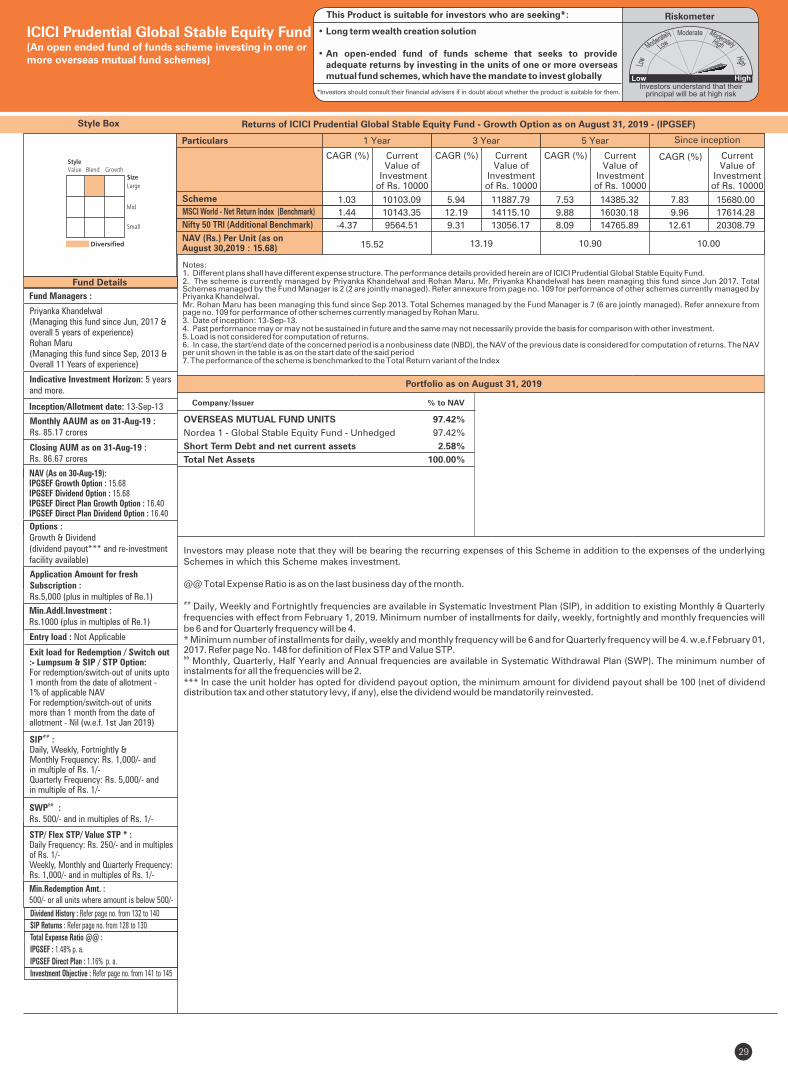
29
Style Box
Fund Details
Returns of ICICI Prudential Global Stable Equity Fund - Growth Option as on August 31, 2019 - (IPGSEF)
Company/Issuer % to NAV
Fund Managers :
Priyanka Khandelwal(Managing this fund since Jun, 2017 & overall 5 years of experience)Rohan Maru(Managing this fund since Sep, 2013 &Overall 11 Years of experience)
Indicative Investment Horizon: 5 yearsand more.
Inception/Allotment date: 13-Sep-13
Options :Growth & Dividend (dividend payout*** and re-investment facility available)
Application Amount for freshSubscription :Rs.5,000 (plus in multiples of Re.1)
Min.Addl.Investment :Rs.1000 (plus in multiples of Re.1)
Exit load for Redemption / Switch out:- Lumpsum & SIP / STP Option:For redemption/switch-out of units upto1 month from the date of allotment -1% of applicable NAVFor redemption/switch-out of unitsmore than 1 month from the date ofallotment - Nil (w.e.f. 1st Jan 2019)
SIP :##
Daily, Weekly, Fortnightly & Monthly Frequency: Rs. 1,000/- and in multiple of Rs. 1/-Quarterly Frequency: Rs. 5,000/- and in multiple of Rs. 1/-
&&SWP :Rs. 500/- and in multiples of Rs. 1/-
STP/ Flex STP/ Value STP * :Daily Frequency: Rs. 250/- and in multiples of Rs. 1/-Weekly, Monthly and Quarterly Frequency: Rs. 1,000/- and in multiples of Rs. 1/-
Min.Redemption Amt. : 500/- or all units where amount is below 500/-
Investors may please note that they will be bearing the recurring expenses of this Scheme in addition to the expenses of the underlying Schemes in which this Scheme makes investment.
@@ Total Expense Ratio is as on the last business day of the month.
## Daily, Weekly and Fortnightly frequencies are available in Systematic Investment Plan (SIP), in addition to existing Monthly & Quarterly frequencies with effect from February 1, 2019. Minimum number of installments for daily, weekly, fortnightly and monthly frequencies will be 6 and for Quarterly frequency will be 4.* Minimum number of installments for daily, weekly and monthly frequency will be 6 and for Quarterly frequency will be 4. w.e.f February 01, 2017. Refer page No. 148 for definition of Flex STP and Value STP.&& Monthly, Quarterly, Half Yearly and Annual frequencies are available in Systematic Withdrawal Plan (SWP). The minimum number of instalments for all the frequencies will be 2.*** In case the unit holder has opted for dividend payout option, the minimum amount for dividend payout shall be 100 (net of dividend distribution tax and other statutory levy, if any), else the dividend would be mandatorily reinvested.
Portfolio as on August 31, 2019
ICICI Prudential Global Stable Equity Fund(An open ended fund of funds scheme investing in one or more overseas mutual fund schemes)
Entry load : Not Applicable
RiskometerThis Product is suitable for investors who are seeking*:
• Long term wealth creation solution
• An open-ended fund of funds scheme that seeks to provide adequate returns by investing in the units of one or more overseas mutual fund schemes, which have the mandate to invest globally
*Investors should consult their financial advisers if in doubt about whether the product is suitable for them.
NAV (As on 30-Aug-19):IPGSEF Growth Option : 15.68IPGSEF Dividend Option : 15.68IPGSEF Direct Plan Growth Option : 16.40IPGSEF Direct Plan Dividend Option : 16.40
OVERSEAS MUTUAL FUND UNITS 97.42%
Nordea 1 - Global Stable Equity Fund - Unhedged 97.42%
Short Term Debt and net current assets 2.58%
Total Net Assets 100.00%
Monthly AAUM as on 31-Aug-19 : Rs. 85.17 crores
Closing AUM as on 31-Aug-19 : Rs. 86.67 crores
Dividend History : Refer page no. from 132 to 140
SIP Returns : Refer page no. from 128 to 130
Total Expense Ratio @@ :
IPGSEF : 1.48% p. a.
IPGSEF Direct Plan : 1.16% p. a.
Investment Objective : Refer page no. from 141 to 145
Notes:1. Different plans shall have different expense structure. The performance details provided herein are of ICICI Prudential Global Stable Equity Fund.2. The scheme is currently managed by Priyanka Khandelwal and Rohan Maru. Mr. Priyanka Khandelwal has been managing this fund since Jun 2017. Total Schemes managed by the Fund Manager Refer annexure from page no. 109 for performance of other schemes currently managed by is 2 (2 are jointly managed).Priyanka Khandelwal.Mr. Rohan Maru has been managing this fund since Sep 2013. Total Schemes managed by the Fund Manager ). Refer annexure from is 7 (6 are jointly managedpage no. 109 for performance of other schemes currently managed by Rohan Maru. 3. Date of inception: 13-Sep-13.4. Past performance may or may not be sustained in future and the same may not necessarily provide the basis for comparison with other investment.5. Load is not considered for computation of returns.6. In case, the start/end date of the concerned period is a nonbusiness date (NBD), the NAV of the previous date is considered for computation of returns. The NAV per unit shown in the table is as on the start date of the said period7. The performance of the scheme is benchmarked to the Total Return variant of the Index
Scheme
Nifty 50 TRI (Additional Benchmark)
NAV (Rs.) Per Unit (as on August 30,2019 : 15.68)
CAGR (%)
10.00
MSCI World - Net Return Index (Benchmark)
Since inception
CurrentValue of
Investment of Rs. 10000
CAGR (%) Current Value of
Investment of Rs. 10000
1 Year 3 Year 5 Year
CAGR (%) Current Value of
Investment of Rs. 10000
CAGR (%) Current Value of
Investment of Rs. 10000
15.52 13.19 10.90
Particulars
1.03 10103.09 5.94 11887.79 7.53 14385.32 7.83 15680.00
1.44 10143.35 12.19 14115.10 9.88 16030.18 9.96 17614.28
-4.37 9564.51 9.31 13056.17 8.09 14765.89 12.61 20308.79
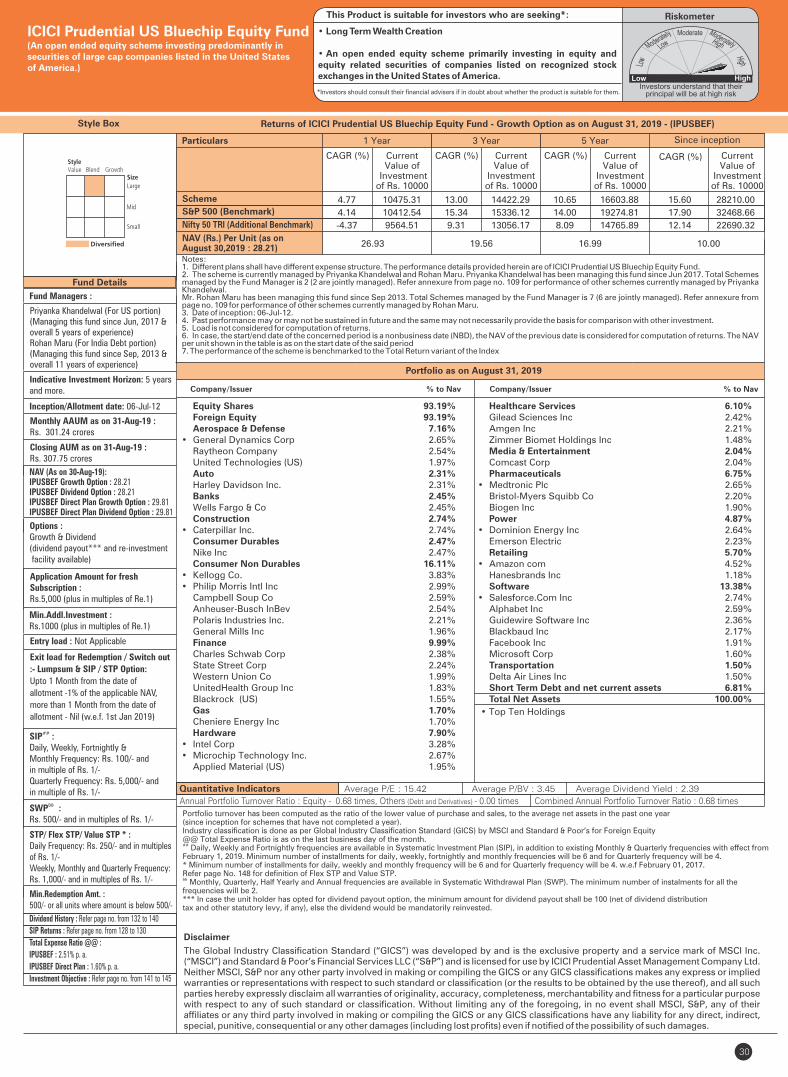
Healthcare Services 6.10% Gilead Sciences Inc 2.42% Amgen Inc 2.21% Zimmer Biomet Holdings Inc 1.48% Media & Entertainment 2.04% Comcast Corp 2.04% Pharmaceuticals 6.75%• Medtronic Plc 2.65% Bristol-Myers Squibb Co 2.20% Biogen Inc 1.90% Power 4.87%• Dominion Energy Inc 2.64% Emerson Electric 2.23% Retailing 5.70%• Amazon com 4.52% Hanesbrands Inc 1.18% Software 13.38%• Salesforce.Com Inc 2.74% Alphabet Inc 2.59% Guidewire Software Inc 2.36% Blackbaud Inc 2.17% Facebook Inc 1.91% Microsoft Corp 1.60% Transportation 1.50% Delta Air Lines Inc 1.50% Short Term Debt and net current assets 6.81% Total Net Assets 100.00%
30
Fund Details
Quantitative Indicators
Portfolio turnover has been computed as the ratio of the lower value of purchase and sales, to the average net assets in the past one year (since inception for schemes that have not completed a year).Industry classification is done as per Global Industry Classification Standard (GICS) by MSCI and Standard & Poor’s for Foreign Equity@@ Total Expense Ratio is as on the last business day of the month.## Daily, Weekly and Fortnightly frequencies are available in Systematic Investment Plan (SIP), in addition to existing Monthly & Quarterly frequencies with effect from February 1, 2019. Minimum number of installments for daily, weekly, fortnightly and monthly frequencies will be 6 and for Quarterly frequency will be 4.* Minimum number of installments for daily, weekly and monthly frequency will be 6 and for Quarterly frequency will be 4. w.e.f February 01, 2017. Refer page No. 148 for definition of Flex STP and Value STP.&& Monthly, Quarterly, Half Yearly and Annual frequencies are available in Systematic Withdrawal Plan (SWP). The minimum number of instalments for all the frequencies will be 2.*** In case the unit holder has opted for dividend payout option, the minimum amount for dividend payout shall be 100 (net of dividend distribution tax and other statutory levy, if any), else the dividend would be mandatorily reinvested.
Style Box
Company/Issuer % to Nav Company/Issuer % to Nav
Fund Managers :
Priyanka Khandelwal (For US portion)(Managing this fund since Jun, 2017 & overall 5 years of experience)Rohan Maru (For India Debt portion)(Managing this fund since Sep, 2013 &overall 11 years of experience)
Indicative Investment Horizon: 5 yearsand more.
Inception/Allotment date: 06-Jul-12
Options :Growth & Dividend (dividend payout*** and re-investment facility available)
Application Amount for freshSubscription :Rs.5,000 (plus in multiples of Re.1)
Min.Addl.Investment :Rs.1000 (plus in multiples of Re.1)
Exit load for Redemption / Switch out
:- Lumpsum & SIP / STP Option:
Upto 1 Month from the date of
allotment -1% of the applicable NAV,
more than 1 Month from the date of
allotment - Nil (w.e.f. 1st Jan 2019)
SIP :##
Daily, Weekly, Fortnightly & Monthly Frequency: Rs. 100/- and in multiple of Rs. 1/-Quarterly Frequency: Rs. 5,000/- and in multiple of Rs. 1/-
&&SWP :Rs. 500/- and in multiples of Rs. 1/-
STP/ Flex STP/ Value STP * :Daily Frequency: Rs. 250/- and in multiples of Rs. 1/-Weekly, Monthly and Quarterly Frequency: Rs. 1,000/- and in multiples of Rs. 1/-
Min.Redemption Amt. : 500/- or all units where amount is below 500/-
Disclaimer
The Global Industry Classification Standard (“GICS”) was developed by and is the exclusive property and a service mark of MSCI Inc. (“MSCI”) and Standard & Poor’s Financial Services LLC (“S&P”) and is licensed for use by ICICI Prudential Asset Management Company Ltd. Neither MSCI, S&P nor any other party involved in making or compiling the GICS or any GICS classifications makes any express or implied warranties or representations with respect to such standard or classification (or the results to be obtained by the use thereof), and all such parties hereby expressly disclaim all warranties of originality, accuracy, completeness, merchantability and fitness for a particular purpose with respect to any of such standard or classification. Without limiting any of the foregoing, in no event shall MSCI, S&P, any of their affiliates or any third party involved in making or compiling the GICS or any GICS classifications have any liability for any direct, indirect, special, punitive, consequential or any other damages (including lost profits) even if notified of the possibility of such damages.
• Top Ten Holdings
Portfolio as on August 31, 2019
Returns of ICICI Prudential US Bluechip Equity Fund - Growth Option as on August 31, 2019 - (IPUSBEF)
ICICI Prudential US Bluechip Equity Fund(An open ended equity scheme investing predominantly insecurities of large cap companies listed in the United Statesof America.)
Entry load : Not Applicable
RiskometerThis Product is suitable for investors who are seeking*:
• Long Term Wealth Creation
• An open ended equity scheme primarily investing in equity and equity related securities of companies listed on recognized stock exchanges in the United States of America.
*Investors should consult their financial advisers if in doubt about whether the product is suitable for them.
NAV (As on 30-Aug-19):IPUSBEF Growth Option : 28.21IPUSBEF Dividend Option : 28.21IPUSBEF Direct Plan Growth Option : 29.81IPUSBEF Direct Plan Dividend Option : 29.81
Equity Shares 93.19% Foreign Equity 93.19% Aerospace & Defense 7.16%• General Dynamics Corp 2.65% Raytheon Company 2.54% United Technologies (US) 1.97% Auto 2.31% Harley Davidson Inc. 2.31% Banks 2.45% Wells Fargo & Co 2.45% Construction 2.74%• Caterpillar Inc. 2.74% Consumer Durables 2.47% Nike Inc 2.47% Consumer Non Durables 16.11%• Kellogg Co. 3.83%• Philip Morris Intl Inc 2.99% Campbell Soup Co 2.59% Anheuser-Busch InBev 2.54% Polaris Industries Inc. 2.21% General Mills Inc 1.96% Finance 9.99% Charles Schwab Corp 2.38% State Street Corp 2.24% Western Union Co 1.99% UnitedHealth Group Inc 1.83% Blackrock (US) 1.55% Gas 1.70% Cheniere Energy Inc 1.70% Hardware 7.90%• Intel Corp 3.28%• Microchip Technology Inc. 2.67% Applied Material (US) 1.95%
Monthly AAUM as on 31-Aug-19 : Rs. 301.24 crores
Closing AUM as on 31-Aug-19 : Rs. 307.75 crores
Annual Portfolio Turnover Ratio : Equity - 0.68 times, Others (Debt and Derivatives) - 0.00 times Combined Annual Portfolio Turnover Ratio : 0.68 times
Dividend History : Refer page no. from 132 to 140
SIP Returns : Refer page no. from 128 to 130
Total Expense Ratio @@ :
IPUSBEF : 2.51% p. a.
IPUSBEF Direct Plan : 1.60% p. a.
Investment Objective : Refer page no. from 141 to 145
Notes:1. Different plans shall have different expense structure. The performance details provided herein are of ICICI Prudential US Bluechip Equity Fund.2. The scheme is currently managed by Priyanka Khandelwal and Rohan Maru. Priyanka Khandelwal has been managing this fund since Jun 2017. Total Schemes managed by the Fund Manager Refer annexure from page no. 109 for performance of other schemes currently managed by Priyanka is 2 (2 are jointly managed).Khandelwal.Mr. Rohan Maru has been managing this fund since Sep 2013. Total Schemes managed by the Fund Manager ). Refer annexure from is 7 (6 are jointly managedpage no. 109 for performance of other schemes currently managed by Rohan Maru. 3. Date of inception: 06-Jul-12.4. Past performance may or may not be sustained in future and the same may not necessarily provide the basis for comparison with other investment.5. Load is not considered for computation of returns.6. In case, the start/end date of the concerned period is a nonbusiness date (NBD), the NAV of the previous date is considered for computation of returns. The NAV per unit shown in the table is as on the start date of the said period7. The performance of the scheme is benchmarked to the Total Return variant of the Index
Scheme
Nifty 50 TRI (Additional Benchmark)
NAV (Rs.) Per Unit (as on August 30,2019 : 28.21)
CAGR (%)
10.00
S&P 500 (Benchmark)
Since inception
CurrentValue of
Investment of Rs. 10000
CAGR (%) Current Value of
Investment of Rs. 10000
1 Year 3 Year 5 Year
CAGR (%) Current Value of
Investment of Rs. 10000
CAGR (%) Current Value of
Investment of Rs. 10000
26.93 19.56 16.99
Particulars
4.77 10475.31 13.00 14422.29 10.65 16603.88 15.60 28210.00
4.14 10412.54 15.34 15336.12 14.00 19274.81 17.90 32468.66
-4.37 9564.51 9.31 13056.17 8.09 14765.89 12.14 22690.32
Average P/E : 15.42 Average P/BV : 3.45 Average Dividend Yield : 2.39

31
Style Box
Portfolio turnover has been computed as the ratio of the lower value of purchase and sales, to the average net assets in the past one year (since inception for schemes that have not completed a year). The figures are not netted for derivative transactions.Risk-free rate based on the last Overnight MIBOR cut-off of 5.45%**In addition to the fund manager managing this fund, overseas investment is managed by Ms. Priyanka Khandelwal.@@ Total Expense Ratio is as on the last business day of the month.
Fund Managers** :
Sankaran Naren(Managing this fund since July, 2017 &Overall 29 years of experience)Atul Patel(Managing this fund since Feb, 2015 &Overall 10 Years of experience)
Indicative Investment Horizon: 3 years
Inception/Allotment date: 20-Jun-14
NAV (As on 30-Aug-19):IPGF1 Dividend Option : 10.64IPGF1 Direct Plan Dividend Option : 11.60
Options :Only Dividend payout facility available
Application Amount for freshSubscription :Not available
Min.Addl.Investment :Not available
Exit load for Redemption / Switch out:- Lumpsum Investment OptionNot Available
SIP :Not Available
SWP :Not Available
Min.Redemption Amt. :No redemption/repurchase of units shall be allowed prior to the maturity of the Scheme. Investors wishing to exit may do so, only in demat mode, by selling through BSE Limited or any of the stock exchange(s) where units of the Scheme will be listed as the Trustee may decide from time to time.
Fund Details
• Top Ten HoldingsDerivatives are considered at exposure value.
Diversified
Quantitative Indicators:
Monthly AAUM as on 31-Aug-19 : Rs. 99.62 crores
Closing AUM as on 31-Aug-19 : Rs. 98.24 crores
Average P/E : 31.47 Average P/BV : 2.76 Average Dividend Yield : 1.65
ICICI Prudential Growth Fund – Series 1A Close ended equity scheme
Returns of ICICI Prudential Growth Fund - Series 1 - Dividend Option as on August 31, 2019 - (IPGF1)
Portfolio as on August 31, 2019
Entry load : Not Applicable
RiskometerThis Product is suitable for investors who are seeking*:
• Long term wealth creation solution
• A close ended diversifed equity fund that aims to provide capital appreciation by investing in equity and equity related instruments.
*Investors should consult their financial advisers if in doubt about whether the product is suitable for them.
Annual Portfolio Turnover Ratio : Equity - 0.36 times, Others (Debt and Derivatives) - 2.65 times Combined Annual Portfolio Turnover Ratio : 3.01 times
Dividend History : Refer page no. from 132 to 140
SIP Returns : Refer page no. from 128 to 130
Total Expense Ratio @@ :
IPGF1 : 1.41% p. a.
IPGF1 Direct Plan : 1.12% p. a.
Investment Objective : Refer page no. from 141 to 145
Equity Shares 81.03% -6.64%
Auto 2.52%
TVS Motor Company Ltd. 2.52%
Auto Ancillaries 2.62%
Motherson Sumi Systems Ltd. 2.62%
Banks 29.92%
• ICICI Bank Ltd. 9.02%
• HDFC Bank Ltd. 8.05%
• State Bank Of India 7.61%
• Axis Bank Ltd. 5.24%
Cement 4.72%
Shree Cements Ltd. 2.58%
Ambuja Cements Ltd. 2.14%
Construction 5.62%
• PNC Infratech Ltd. 3.56%
KNR Constructions Ltd. 2.07%
Construction Project 4.06%
• Larsen & Toubro Ltd. 4.06%
Finance 8.32% -6.64%
• HDFC Ltd. 6.62% -6.64%
SBI Life Insurance Company Ltd. 1.71%
Non - Ferrous Metals 5.29%
Hindalco Industries Ltd. 3.37%
Vedanta Ltd. 1.92%
Oil 1.76%
Oil & Natural Gas Corporation Ltd. 1.76%
Petroleum Products 3.71%
• Indian Oil Corporation Ltd. 3.71%
Company/Issuer % to % to NAV NAV Derivatives
Company/Issuer % to % to NAV NAV Derivatives
Pharmaceuticals 1.15%
Cadila Healthcare Ltd. 1.15%
Power 6.25%
• NTPC Ltd. 6.25%
Software 1.12%
HCL Technologies Ltd. 1.12%
Telecom - Services 3.99%
• Bharti Airtel Ltd. 3.99%
Short Term Debt and net current assets 25.61%
Total Net Assets 100.00%
Notes:1. Different plans shall have different expense structure. The performance details provided herein are of ICICI Prudential Growth Fund - Series 1.2. The scheme is currently managed by Sankaran Naren and Atul Patel. Mr. Sankaran Naren has been managing this fund since Jul 2017. Total Schemes managed by the Fund Manager is 33 (33 are jointly managed). Refer annexure from page no. 109 for performance of other schemes currently managed by Sankaran Naren.Mr. has been managing this fund since . Total Schemes managed by the Fund Manager ). Refer annexure from page Atul Patel Feb 2015 is 8 (6 are jointly managedno. 109 for performance of other schemes currently managed by . Atul Patel3. Date of inception: 20-Jun-14.4. Performance of dividend option would be Net of Dividend distribution tax, if any.5. Past performance may or may not be sustained in future and the same may not necessarily provide the basis for comparison with other investment.6. Load is not considered for computation of returns.7. In case, the start/end date of the concerned period is a nonbusiness date (NBD), the NAV of the previous date is considered for computation of returns. The NAV per unit shown in the table is as on the start date of the said period8. NAV is adjusted to the extent of dividend declared for computation of returns.9. The performance of the scheme is benchmarked to the Total Return variant of the Index
Scheme
NAV (Rs.) Per Unit (as on August 30,2019 : 10.64)
CAGR (%)
10.00
Nifty 50 TRI (Benchmark)
Since inception
CurrentValue of
Investment of Rs. 10000
CAGR (%) Current Value of
Investment of Rs. 10000
1 Year 3 Year 5 Year
CAGR (%) Current Value of
Investment of Rs. 10000
CAGR (%) Current Value of
Investment of Rs. 10000
10.63 11.28 10.82
Particulars
0.09 10009.41 7.70 12489.16 10.99 16855.96 12.26 18238.15
-4.37 9564.51 9.31 13056.17 8.09 14765.89 9.07 15698.95
Std Dev (Annualised) : 12.28% Sharpe Ratio :0.22 Portfolio Beta: 0.77 R squared : 0.64 Benchmark Std Dev (Annualised) : 12.74%
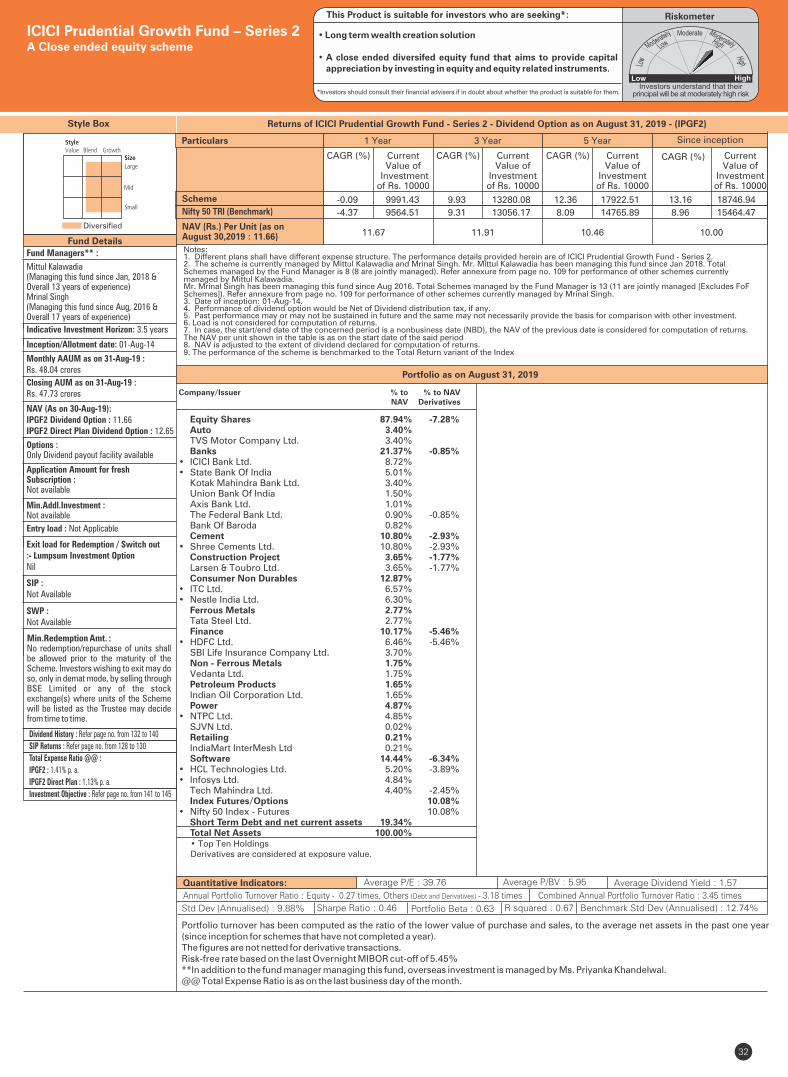
32
Style Box
Portfolio turnover has been computed as the ratio of the lower value of purchase and sales, to the average net assets in the past one year (since inception for schemes that have not completed a year). The figures are not netted for derivative transactions.Risk-free rate based on the last Overnight MIBOR cut-off of 5.45%**In addition to the fund manager managing this fund, overseas investment is managed by Ms. Priyanka Khandelwal.@@ Total Expense Ratio is as on the last business day of the month.
Fund Managers** :
Mittul Kalawadia(Managing this fund since Jan, 2018 &Overall 13 years of experience)Mrinal Singh (Managing this fund since Aug, 2016 & Overall 17 years of experience)
Indicative Investment Horizon: 3.5 years
Inception/Allotment date: 01-Aug-14
NAV (As on 30-Aug-19):IPGF2 Dividend Option : 11.66IPGF2 Direct Plan Dividend Option : 12.65
Options :Only Dividend payout facility available
Application Amount for freshSubscription :Not available
Min.Addl.Investment :Not available
Exit load for Redemption / Switch out:- Lumpsum Investment OptionNil
SIP :Not Available
SWP :Not Available
Min.Redemption Amt. :No redemption/repurchase of units shall be allowed prior to the maturity of the Scheme. Investors wishing to exit may do so, only in demat mode, by selling through BSE Limited or any of the stock exchange(s) where units of the Scheme will be listed as the Trustee may decide from time to time.
Fund Details
Diversified
Quantitative Indicators:
• Top Ten HoldingsDerivatives are considered at exposure value.
Monthly AAUM as on 31-Aug-19 : Rs. 48.04 crores
Closing AUM as on 31-Aug-19 : Rs. 47.73 crores
ICICI Prudential Growth Fund – Series 2A Close ended equity scheme
Average P/E : 39.76 Average P/BV : 5.95 Average Dividend Yield : 1.57
Portfolio as on August 31, 2019
Returns of ICICI Prudential Growth Fund - Series 2 - Dividend Option as on August 31, 2019 - (IPGF2)
Entry load : Not Applicable
RiskometerThis Product is suitable for investors who are seeking*:
• Long term wealth creation solution
• A close ended diversifed equity fund that aims to provide capital appreciation by investing in equity and equity related instruments.
*Investors should consult their financial advisers if in doubt about whether the product is suitable for them.
Annual Portfolio Turnover Ratio : Equity - 0.27 times, Others (Debt and Derivatives) - 3.18 times Combined Annual Portfolio Turnover Ratio : 3.45 times
Dividend History : Refer page no. from 132 to 140
SIP Returns : Refer page no. from 128 to 130
Total Expense Ratio @@ :
IPGF2 : 1.41% p. a.
IPGF2 Direct Plan : 1.13% p. a.
Investment Objective : Refer page no. from 141 to 145
Notes:1. Different plans shall have different expense structure. The performance details provided herein are of ICICI Prudential Growth Fund - Series 2.2. The scheme is currently managed by Mittul Kalawadia and Mrinal Singh. Mr. Mittul Kalawadia has been managing this fund since . Total Jan 2018Schemes managed by the Fund Manager Refer annexure from page no. 109 for performance of other schemes currently is 8 (8 are jointly managed).managed by Mittul Kalawadia.Mr. Mrinal Singh has been managing this fund since . Total Schemes managed by the Fund Manager Aug 2016 is 13 (11 are jointly managed [Excludes FoF Schemes]) . Refer annexure from page no. 109 for performance of other schemes currently managed by Mrinal Singh.3. Date of inception: 01-Aug-14.4. Performance of dividend option would be Net of Dividend distribution tax, if any.5. Past performance may or may not be sustained in future and the same may not necessarily provide the basis for comparison with other investment.6. Load is not considered for computation of returns.7. In case, the start/end date of the concerned period is a nonbusiness date (NBD), the NAV of the previous date is considered for computation of returns. The NAV per unit shown in the table is as on the start date of the said period8. NAV is adjusted to the extent of dividend declared for computation of returns.9. The performance of the scheme is benchmarked to the Total Return variant of the Index
Scheme
NAV (Rs.) Per Unit (as on August 30,2019 : 11.66)
CAGR (%)
10.00
Nifty 50 TRI (Benchmark)
Since inception
CurrentValue of
Investment of Rs. 10000
CAGR (%) Current Value of
Investment of Rs. 10000
1 Year 3 Year 5 Year
CAGR (%) Current Value of
Investment of Rs. 10000
CAGR (%) Current Value of
Investment of Rs. 10000
11.67 11.91 10.46
Particulars
-0.09 9991.43 9.93 13280.08 12.36 17922.51 13.16 18746.94
-4.37 9564.51 9.31 13056.17 8.09 14765.89 8.96 15464.47
Std Dev (Annualised) : 9.88% Sharpe Ratio : 0.46 Portfolio Beta : 0.63 R squared : 0.67 Benchmark Std Dev (Annualised) : 12.74%
Equity Shares 87.94% -7.28% Auto 3.40% TVS Motor Company Ltd. 3.40% Banks 21.37% -0.85%• ICICI Bank Ltd. 8.72% • State Bank Of India 5.01% Kotak Mahindra Bank Ltd. 3.40% Union Bank Of India 1.50% Axis Bank Ltd. 1.01% The Federal Bank Ltd. 0.90% -0.85% Bank Of Baroda 0.82% Cement 10.80% -2.93%• Shree Cements Ltd. 10.80% -2.93% Construction Project 3.65% -1.77% Larsen & Toubro Ltd. 3.65% -1.77% Consumer Non Durables 12.87% • ITC Ltd. 6.57% • Nestle India Ltd. 6.30% Ferrous Metals 2.77% Tata Steel Ltd. 2.77% Finance 10.17% -5.46%• HDFC Ltd. 6.46% -5.46% SBI Life Insurance Company Ltd. 3.70% Non - Ferrous Metals 1.75% Vedanta Ltd. 1.75% Petroleum Products 1.65% Indian Oil Corporation Ltd. 1.65% Power 4.87% • NTPC Ltd. 4.85% SJVN Ltd. 0.02% Retailing 0.21% IndiaMart InterMesh Ltd 0.21% Software 14.44% -6.34%• HCL Technologies Ltd. 5.20% -3.89%• Infosys Ltd. 4.84% Tech Mahindra Ltd. 4.40% -2.45% Index Futures/Options 10.08%• Nifty 50 Index - Futures 10.08% Short Term Debt and net current assets 19.34% Total Net Assets 100.00%
Company/Issuer % to % to NAV NAV Derivatives
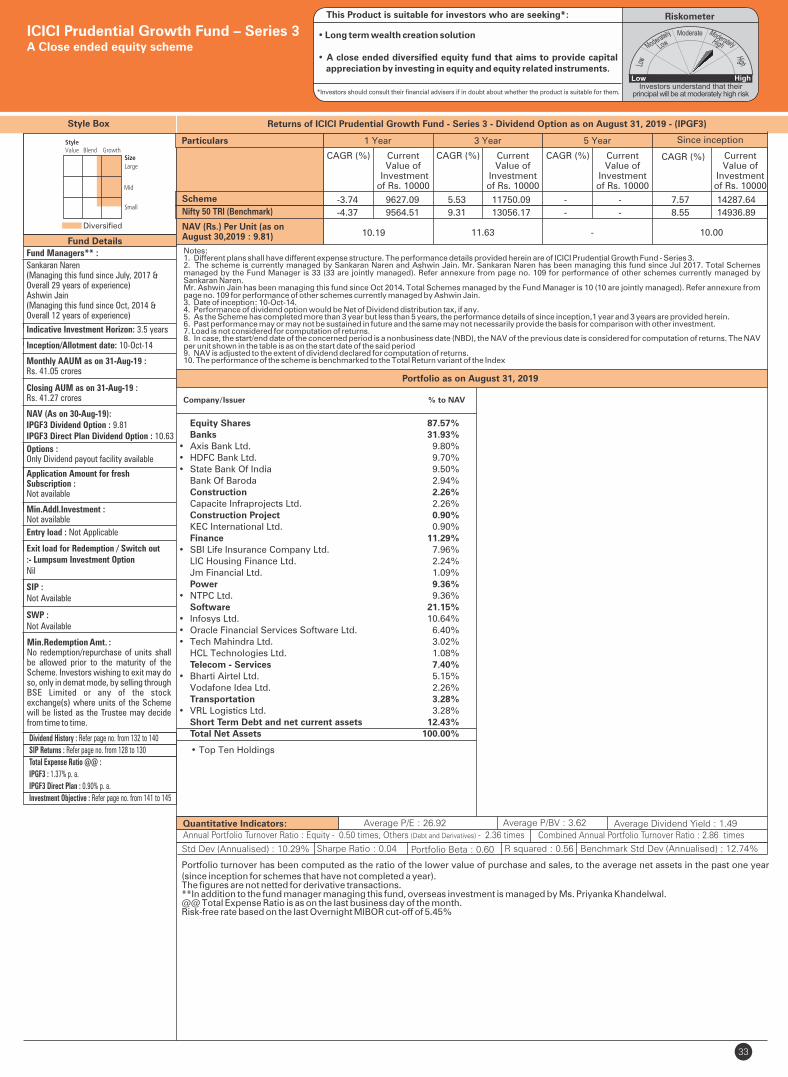
33
Style Box
Portfolio turnover has been computed as the ratio of the lower value of purchase and sales, to the average net assets in the past one year (since inception for schemes that have not completed a year). The figures are not netted for derivative transactions.**In addition to the fund manager managing this fund, overseas investment is managed by Ms. Priyanka Khandelwal. @@ Total Expense Ratio is as on the last business day of the month.Risk-free rate based on the last Overnight MIBOR cut-off of 5.45%
Fund Managers** :
Sankaran Naren(Managing this fund since July, 2017 &Overall 29 years of experience)Ashwin Jain(Managing this fund since Oct, 2014 &Overall 12 years of experience)
Indicative Investment Horizon: 3.5 years
Inception/Allotment date: 10-Oct-14
NAV (As on 30-Aug-19):IPGF3 Dividend Option : 9.81IPGF3 Direct Plan Dividend Option : 10.63
Options :Only Dividend payout facility available
Application Amount for freshSubscription :Not available
Min.Addl.Investment :Not available
Exit load for Redemption / Switch out:- Lumpsum Investment OptionNil
SIP :Not Available
SWP :Not Available
Min.Redemption Amt. :No redemption/repurchase of units shall be allowed prior to the maturity of the Scheme. Investors wishing to exit may do so, only in demat mode, by selling through BSE Limited or any of the stock exchange(s) where units of the Scheme will be listed as the Trustee may decide from time to time.
Fund Details
Diversified
Quantitative Indicators:
• Top Ten Holdings
Monthly AAUM as on 31-Aug-19 : Rs. 41.05 crores
Closing AUM as on 31-Aug-19 : Rs. 41.27 crores
ICICI Prudential Growth Fund – Series 3A Close ended equity scheme
Entry load : Not Applicable
Riskometer
• Long term wealth creation solution
• A close ended diversified equity fund that aims to provide capital appreciation by investing in equity and equity related instruments.
*Investors should consult their financial advisers if in doubt about whether the product is suitable for them.
This Product is suitable for investors who are seeking*:
Annual Portfolio Turnover Ratio : Equity - 0.50 times, Others (Debt and Derivatives) - 2.36 times Combined Annual Portfolio Turnover Ratio : 2.86 times
Portfolio as on August 31, 2019
Returns of ICICI Prudential Growth Fund - Series 3 - Dividend Option as on August 31, 2019 - (IPGF3)
Dividend History : Refer page no. from 132 to 140
SIP Returns : Refer page no. from 128 to 130
Total Expense Ratio @@ :
IPGF3 : 1.37% p. a.
IPGF3 Direct Plan : 0.90% p. a.
Investment Objective : Refer page no. from 141 to 145
Notes:1. Different plans shall have different expense structure. The performance details provided herein are of ICICI Prudential Growth Fund - Series 3.2. The scheme is currently managed by Sankaran Naren and Ashwin Jain. Mr. Sankaran Naren has been managing this fund since Jul 2017. Total Schemes managed by the Fund Manager is 33 (33 are jointly managed). Refer annexure from page no. 109 for performance of other schemes currently managed by Sankaran Naren.Mr. Ashwin Jain has been managing this fund since Oct 2014. Total Schemes managed by the Fund Manager ). Refer annexure from is 10 (10 are jointly managedpage no. 109 for performance of other schemes currently managed by Ashwin Jain. 3. Date of inception: 10-Oct-14.4. Performance of dividend option would be Net of Dividend distribution tax, if any.5. As the Scheme has completed more than 3 year but less than 5 years, the performance details of since inception,1 year and 3 years are provided herein.6. Past performance may or may not be sustained in future and the same may not necessarily provide the basis for comparison with other investment.7. Load is not considered for computation of returns.8. In case, the start/end date of the concerned period is a nonbusiness date (NBD), the NAV of the previous date is considered for computation of returns. The NAV per unit shown in the table is as on the start date of the said period9. NAV is adjusted to the extent of dividend declared for computation of returns.10. The performance of the scheme is benchmarked to the Total Return variant of the Index
Scheme
NAV (Rs.) Per Unit (as on August 30,2019 : 9.81)
CAGR (%)
10.00
Nifty 50 TRI (Benchmark)
Since inception
CurrentValue of
Investment of Rs. 10000
CAGR (%) Current Value of
Investment of Rs. 10000
1 Year 3 Year 5 Year
CAGR (%) Current Value of
Investment of Rs. 10000
CAGR (%) Current Value of
Investment of Rs. 10000
10.19 11.63 -
Particulars
-3.74 9627.09 5.53 11750.09 - - 7.57 14287.64
-4.37 9564.51 9.31 13056.17 - - 8.55 14936.89
Std Dev (Annualised) : 10.29% Sharpe Ratio : 0.04 Portfolio Beta : 0.60 R squared : 0.56 Benchmark Std Dev (Annualised) : 12.74%
Average P/E : 26.92 Average P/BV : 3.62 Average Dividend Yield : 1.49
Equity Shares 87.57% Banks 31.93%• Axis Bank Ltd. 9.80%• HDFC Bank Ltd. 9.70%• State Bank Of India 9.50% Bank Of Baroda 2.94% Construction 2.26% Capacite Infraprojects Ltd. 2.26% Construction Project 0.90% KEC International Ltd. 0.90% Finance 11.29%• SBI Life Insurance Company Ltd. 7.96% LIC Housing Finance Ltd. 2.24% Jm Financial Ltd. 1.09% Power 9.36%• NTPC Ltd. 9.36% Software 21.15%• Infosys Ltd. 10.64%• Oracle Financial Services Software Ltd. 6.40%• Tech Mahindra Ltd. 3.02% HCL Technologies Ltd. 1.08% Telecom - Services 7.40%• Bharti Airtel Ltd. 5.15% Vodafone Idea Ltd. 2.26% Transportation 3.28%• VRL Logistics Ltd. 3.28% Short Term Debt and net current assets 12.43% Total Net Assets 100.00%
Company/Issuer % to NAV
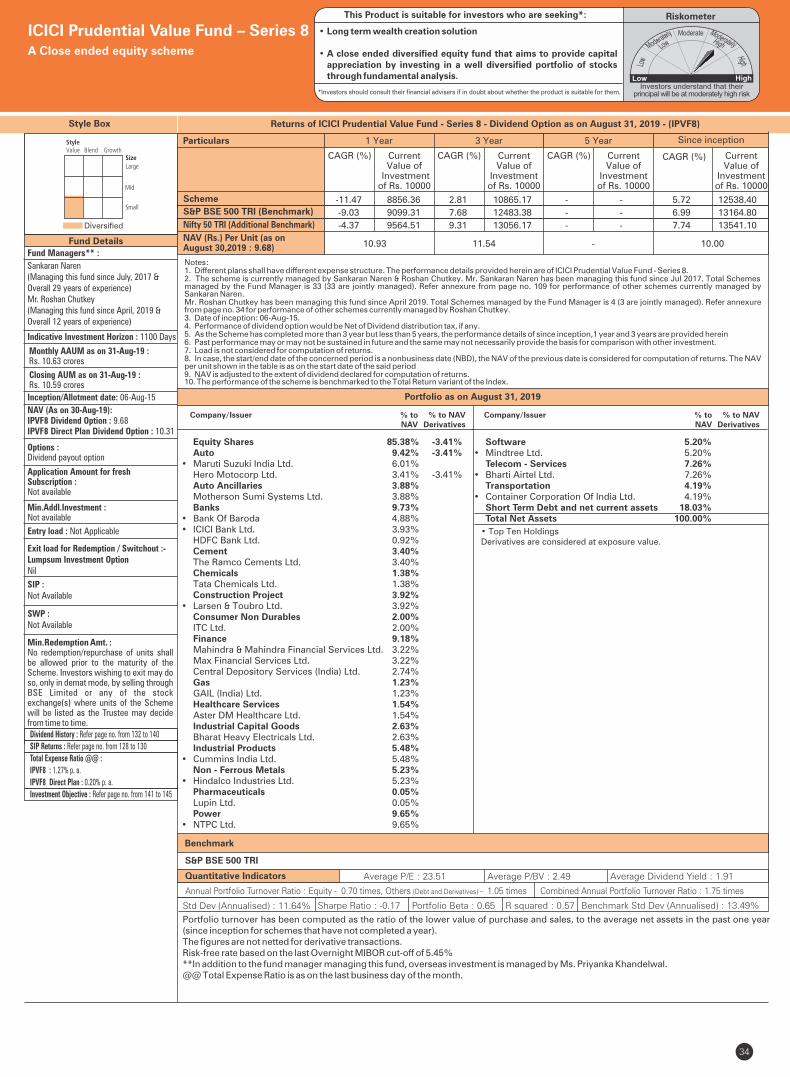
Style Box
Portfolio turnover has been computed as the ratio of the lower value of purchase and sales, to the average net assets in the past one year (since inception for schemes that have not completed a year). The figures are not netted for derivative transactions.Risk-free rate based on the last Overnight MIBOR cut-off of 5.45%**In addition to the fund manager managing this fund, overseas investment is managed by Ms. Priyanka Khandelwal.@@ Total Expense Ratio is as on the last business day of the month.
Fund Managers** :
Sankaran Naren(Managing this fund since July, 2017 &Overall 29 years of experience)Mr. Roshan Chutkey(Managing this fund since April, 2019 &Overall 12 years of experience)
Indicative Investment Horizon : 1100 Days
Inception/Allotment date: 06-Aug-15
SWP :Not Available
Min.Redemption Amt. :No redemption/repurchase of units shall be allowed prior to the maturity of the Scheme. Investors wishing to exit may do so, only in demat mode, by selling through BSE Limited or any of the stock exchange(s) where units of the Scheme will be listed as the Trustee may decide from time to time.
SIP :Not Available
NAV (As on 30-Aug-19):IPVF8 Dividend Option : 9.68IPVF8 Direct Plan Dividend Option : 10.31
Options :Dividend payout option
Application Amount for freshSubscription :Not available
Min.Addl.Investment :Not available
Exit load for Redemption / Switchout :- Lumpsum Investment OptionNil
34
Fund Details
Quantitative Indicators
Benchmark
Average P/E : 23.51 Average P/BV : 2.49 Average Dividend Yield : 1.91
S&P BSE 500 TRI
Diversified
ICICI Prudential Value Fund – Series 8A Close ended equity scheme
Entry load : Not Applicable
Riskometer This Product is suitable for investors who are seeking*:
• Long term wealth creation solution
• A close ended diversified equity fund that aims to provide capital appreciation by investing in a well diversified portfolio of stocks through fundamental analysis.
*Investors should consult their financial advisers if in doubt about whether the product is suitable for them.
Monthly AAUM as on 31-Aug-19 : Rs. 10.63 crores
Closing AUM as on 31-Aug-19 : Rs. 10.59 crores
Annual Portfolio Turnover Ratio : Equity - 0.70 times, Others (Debt and Derivatives) - 1.05 times Combined Annual Portfolio Turnover Ratio : 1.75 times
Dividend History : Refer page no. from 132 to 140
SIP Returns : Refer page no. from 128 to 130
Total Expense Ratio @@ :
IPVF8 : 1.27% p. a.
IPVF8 Direct Plan : 0.20% p. a.
Investment Objective : Refer page no. from 141 to 145
Portfolio as on August 31, 2019
Returns of ICICI Prudential Value Fund - Series 8 - Dividend Option as on August 31, 2019 - (IPVF8)
Notes:1. Different plans shall have different expense structure. The performance details provided herein are of ICICI Prudential Value Fund - Series 8.2. The scheme is currently managed by Sankaran Naren & Roshan Chutkey. Mr. Sankaran Naren has been managing this fund since Jul 2017. Total Schemes managed by the Fund Manager is 33 (33 are jointly managed). Refer annexure from page no. 109 for performance of other schemes currently managed by Sankaran Naren.Mr. Roshan Chutkey has been managing this fund since April 2019. Total Schemes managed by the Fund Manager is 4 (3 are jointly managed). Refer annexure from page no. 34 for performance of other schemes currently managed by Roshan Chutkey.3. Date of inception: 06-Aug-15.4. Performance of dividend option would be Net of Dividend distribution tax, if any.5. As the Scheme has completed more than 3 year but less than 5 years, the performance details of since inception,1 year and 3 years are provided herein6. Past performance may or may not be sustained in future and the same may not necessarily provide the basis for comparison with other investment.7. Load is not considered for computation of returns.8. In case, the start/end date of the concerned period is a nonbusiness date (NBD), the NAV of the previous date is considered for computation of returns. The NAV per unit shown in the table is as on the start date of the said period9. NAV is adjusted to the extent of dividend declared for computation of returns.10. The performance of the scheme is benchmarked to the Total Return variant of the Index.
Scheme
Nifty 50 TRI (Additional Benchmark)
NAV (Rs.) Per Unit (as on August 30,2019 : 9.68)
CAGR (%)
10.00
S&P BSE 500 TRI (Benchmark)
Since inception
CurrentValue of
Investment of Rs. 10000
CAGR (%) Current Value of
Investment of Rs. 10000
1 Year 3 Year 5 Year
CAGR (%) Current Value of
Investment of Rs. 10000
CAGR (%) Current Value of
Investment of Rs. 10000
10.93 11.54 -
Particulars
-11.47 8856.36 2.81 10865.17 - - 5.72 12538.40
-9.03 9099.31 7.68 12483.38 - - 6.99 13164.80
-4.37 9564.51 9.31 13056.17 - - 7.74 13541.10
• Top Ten HoldingsDerivatives are considered at exposure value.
Std Dev (Annualised) : 11.64% Sharpe Ratio : -0.17 Portfolio Beta : 0.65 R squared : 0.57 Benchmark Std Dev (Annualised) : 13.49%
Equity Shares 85.38% -3.41% Auto 9.42% -3.41%• Maruti Suzuki India Ltd. 6.01% Hero Motocorp Ltd. 3.41% -3.41% Auto Ancillaries 3.88% Motherson Sumi Systems Ltd. 3.88% Banks 9.73% • Bank Of Baroda 4.88% • ICICI Bank Ltd. 3.93% HDFC Bank Ltd. 0.92% Cement 3.40% The Ramco Cements Ltd. 3.40% Chemicals 1.38% Tata Chemicals Ltd. 1.38% Construction Project 3.92% • Larsen & Toubro Ltd. 3.92% Consumer Non Durables 2.00% ITC Ltd. 2.00% Finance 9.18% Mahindra & Mahindra Financial Services Ltd. 3.22% Max Financial Services Ltd. 3.22% Central Depository Services (India) Ltd. 2.74% Gas 1.23% GAIL (India) Ltd. 1.23% Healthcare Services 1.54% Aster DM Healthcare Ltd. 1.54% Industrial Capital Goods 2.63% Bharat Heavy Electricals Ltd. 2.63% Industrial Products 5.48% • Cummins India Ltd. 5.48% Non - Ferrous Metals 5.23% • Hindalco Industries Ltd. 5.23% Pharmaceuticals 0.05% Lupin Ltd. 0.05% Power 9.65% • NTPC Ltd. 9.65%
Company/Issuer % to % to NAV NAV Derivatives
Company/Issuer % to % to NAV NAV Derivatives
Software 5.20% • Mindtree Ltd. 5.20% Telecom - Services 7.26% • Bharti Airtel Ltd. 7.26% Transportation 4.19% • Container Corporation Of India Ltd. 4.19% Short Term Debt and net current assets 18.03% Total Net Assets 100.00%
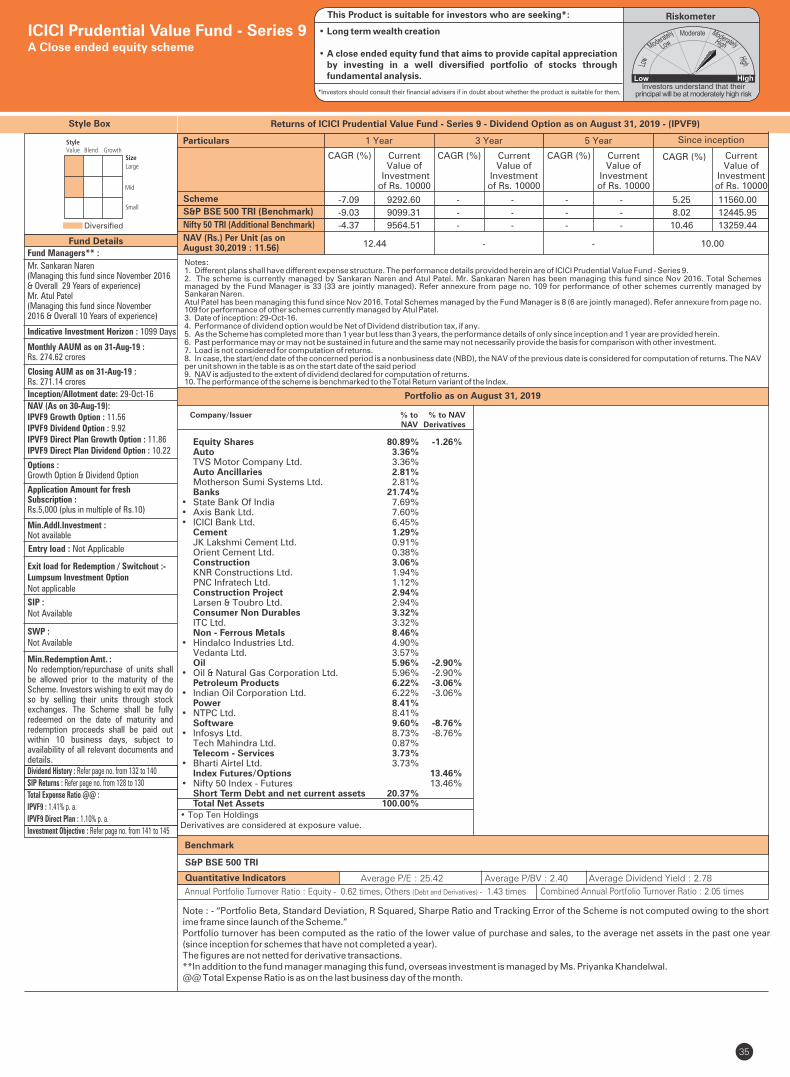
Style Box
Fund Managers** :
Mr. Sankaran Naren(Managing this fund since November 2016 & Overall 29 Years of experience)Mr. Atul Patel (Managing this fund since November 2016 & Overall 10 Years of experience)
Indicative Investment Horizon : 1099 Days
Inception/Allotment date: 29-Oct-16
SWP :Not Available
Min.Redemption Amt. :No redemption/repurchase of units shall be allowed prior to the maturity of the Scheme. Investors wishing to exit may do so by selling their units through stock exchanges. The Scheme shall be fully redeemed on the date of maturity and redemption proceeds shall be paid out within 10 business days, subject to availability of all relevant documents and details.
SIP :Not Available
NAV (As on 30-Aug-19):IPVF9 Growth Option : 11.56IPVF9 Dividend Option : 9.92IPVF9 Direct Plan Growth Option : 11.86IPVF9 Direct Plan Dividend Option : 10.22
Options :Growth Option & Dividend Option
Application Amount for freshSubscription :Rs.5,000 (plus in multiple of Rs.10)
Min.Addl.Investment :Not available
Exit load for Redemption / Switchout :- Lumpsum Investment OptionNot applicable
35
Fund Details
Diversified
Quantitative Indicators
Benchmark
Average P/E : 25.42 Average P/BV : 2.40 Average Dividend Yield : 2.78
S&P BSE 500 TRI
ICICI Prudential Value Fund - Series 9A Close ended equity scheme
RiskometerThis Product is suitable for investors who are seeking*:
*Investors should consult their financial advisers if in doubt about whether the product is suitable for them.
Monthly AAUM as on 31-Aug-19 : Rs. 274.62 crores
Closing AUM as on 31-Aug-19 : Rs. 271.14 crores
Entry load : Not Applicable
Annual Portfolio Turnover Ratio : Equity - 0.62 times, Others (Debt and Derivatives) - 1.43 times Combined Annual Portfolio Turnover Ratio : 2.05 times
Dividend History : Refer page no. from 132 to 140
SIP Returns : Refer page no. from 128 to 130
Total Expense Ratio @@ :
IPVF9 : 1.41% p. a.
IPVF9 Direct Plan : 1.10% p. a.
Investment Objective : Refer page no. from 141 to 145
• Top Ten HoldingsDerivatives are considered at exposure value.
Note : - “Portfolio Beta, Standard Deviation, R Squared, Sharpe Ratio and Tracking Error of the Scheme is not computed owing to the short ime frame since launch of the Scheme.”Portfolio turnover has been computed as the ratio of the lower value of purchase and sales, to the average net assets in the past one year (since inception for schemes that have not completed a year). The figures are not netted for derivative transactions.**In addition to the fund manager managing this fund, overseas investment is managed by Ms. Priyanka Khandelwal.@@ Total Expense Ratio is as on the last business day of the month.
• Long term wealth creation
• A close ended equity fund that aims to provide capital appreciation by investing in a well diversified portfolio of stocks through fundamental analysis.
Portfolio as on August 31, 2019
Notes:1. Different plans shall have different expense structure. The performance details provided herein are of ICICI Prudential Value Fund - Series 9.2. The scheme is currently managed by Sankaran Naren and Atul Patel. Mr. Sankaran Naren has been managing this fund since Nov 2016. Total Schemes managed by the Fund Manager is 33 (33 are jointly managed). Refer annexure from page no. 109 for performance of other schemes currently managed by Sankaran Naren.Atul Patel has been managing this fund since Nov 2016. Total Schemes managed by the Fund Manager is 8 (6 are jointly managed). Refer annexure from page no. 109 for performance of other schemes currently managed by Atul Patel.3. Date of inception: 29-Oct-16.4. Performance of dividend option would be Net of Dividend distribution tax, if any.5. As the Scheme has completed more than 1 year but less than 3 years, the performance details of only since inception and 1 year are provided herein.6. Past performance may or may not be sustained in future and the same may not necessarily provide the basis for comparison with other investment.7. Load is not considered for computation of returns.8. In case, the start/end date of the concerned period is a nonbusiness date (NBD), the NAV of the previous date is considered for computation of returns. The NAV per unit shown in the table is as on the start date of the said period9. NAV is adjusted to the extent of dividend declared for computation of returns.10. The performance of the scheme is benchmarked to the Total Return variant of the Index.
Scheme
Nifty 50 TRI (Additional Benchmark)
NAV (Rs.) Per Unit (as on August 30,2019 : 11.56)
CAGR (%)
10.00
S&P BSE 500 TRI (Benchmark)
Since inception
CurrentValue of
Investment of Rs. 10000
CAGR (%) Current Value of
Investment of Rs. 10000
1 Year 3 Year 5 Year
CAGR (%) Current Value of
Investment of Rs. 10000
CAGR (%) Current Value of
Investment of Rs. 10000
12.44 - -
Particulars
-7.09 9292.60 - - - - 5.25 11560.00
-9.03 9099.31 - - - - 8.02 12445.95
-4.37 9564.51 - - - - 10.46 13259.44
Returns of ICICI Prudential Value Fund - Series 9 - Dividend Option as on August 31, 2019 - (IPVF9)
Equity Shares 80.89% -1.26% Auto 3.36% TVS Motor Company Ltd. 3.36% Auto Ancillaries 2.81% Motherson Sumi Systems Ltd. 2.81% Banks 21.74% • State Bank Of India 7.69% • Axis Bank Ltd. 7.60% • ICICI Bank Ltd. 6.45% Cement 1.29% JK Lakshmi Cement Ltd. 0.91% Orient Cement Ltd. 0.38% Construction 3.06% KNR Constructions Ltd. 1.94% PNC Infratech Ltd. 1.12% Construction Project 2.94% Larsen & Toubro Ltd. 2.94% Consumer Non Durables 3.32% ITC Ltd. 3.32% Non - Ferrous Metals 8.46% • Hindalco Industries Ltd. 4.90% Vedanta Ltd. 3.57% Oil 5.96% -2.90%• Oil & Natural Gas Corporation Ltd. 5.96% -2.90% Petroleum Products 6.22% -3.06%• Indian Oil Corporation Ltd. 6.22% -3.06% Power 8.41% • NTPC Ltd. 8.41% Software 9.60% -8.76%• Infosys Ltd. 8.73% -8.76% Tech Mahindra Ltd. 0.87% Telecom - Services 3.73% • Bharti Airtel Ltd. 3.73% Index Futures/Options 13.46%• Nifty 50 Index - Futures 13.46% Short Term Debt and net current assets 20.37% Total Net Assets 100.00%
Company/Issuer % to % to NAV NAV Derivatives
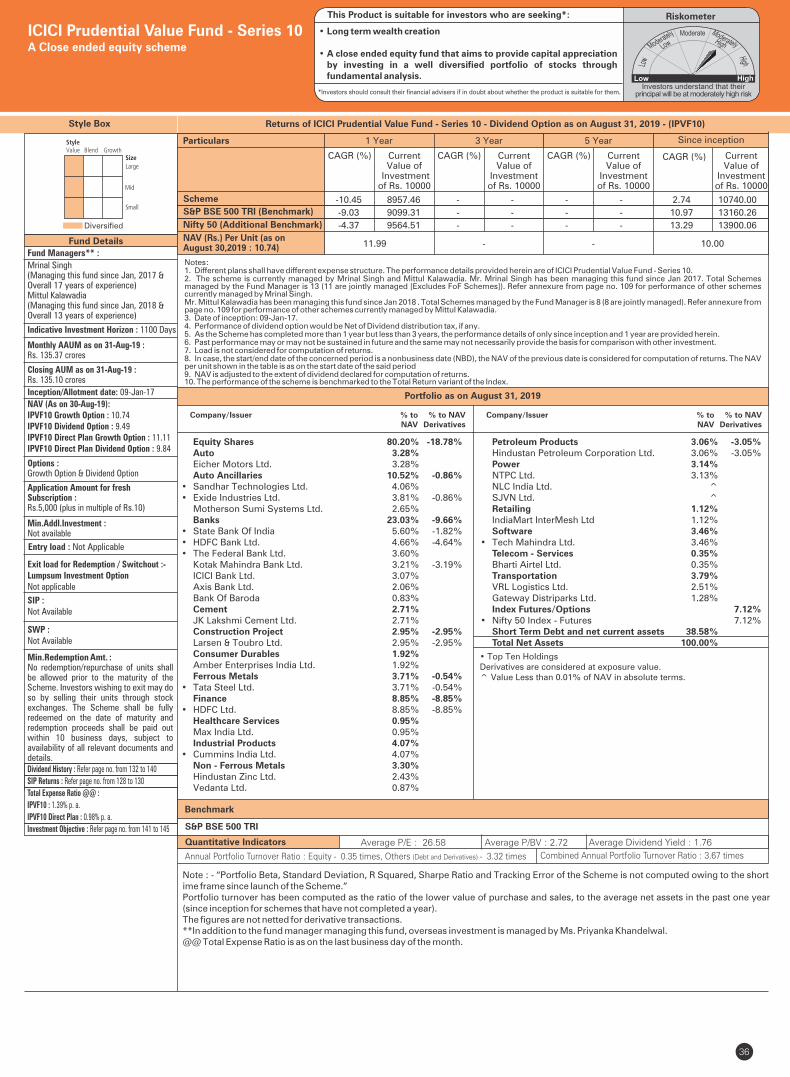
Style Box
Fund Managers** :
Indicative Investment Horizon : 1100 Days
Inception/Allotment date: 09-Jan-17
SWP :Not Available
Min.Redemption Amt. :No redemption/repurchase of units shall be allowed prior to the maturity of the Scheme. Investors wishing to exit may do so by selling their units through stock exchanges. The Scheme shall be fully redeemed on the date of maturity and redemption proceeds shall be paid out within 10 business days, subject to availability of all relevant documents and details.
SIP :Not Available
NAV (As on 30-Aug-19):IPVF10 Growth Option : 10.74IPVF10 Dividend Option : 9.49IPVF10 Direct Plan Growth Option : 11.11IPVF10 Direct Plan Dividend Option : 9.84
Options :Growth Option & Dividend Option
Application Amount for freshSubscription :Rs.5,000 (plus in multiple of Rs.10)
Min.Addl.Investment :Not available
Exit load for Redemption / Switchout :- Lumpsum Investment OptionNot applicable
36
Fund Details
Diversified
Quantitative Indicators
Benchmark
Average P/E : 26.58 Average P/BV : 2.72 Average Dividend Yield : 1.76
S&P BSE 500 TRI
ICICI Prudential Value Fund - Series 10A Close ended equity scheme
RiskometerThis Product is suitable for investors who are seeking*:
*Investors should consult their financial advisers if in doubt about whether the product is suitable for them.
Monthly AAUM as on 31-Aug-19 : Rs. 135.37 crores
Closing AUM as on 31-Aug-19 : Rs. 135.10 crores
• Top Ten HoldingsDerivatives are considered at exposure value.^ Value Less than 0.01% of NAV in absolute terms.
Entry load : Not Applicable
Annual Portfolio Turnover Ratio : Equity - 0.35 times, Others (Debt and Derivatives) - 3.32 times Combined Annual Portfolio Turnover Ratio : 3.67 times
Dividend History : Refer page no. from 132 to 140
SIP Returns : Refer page no. from 128 to 130
Total Expense Ratio @@ :
IPVF10 : 1.39% p. a.
IPVF10 Direct Plan : 0.98% p. a.
Investment Objective : Refer page no. from 141 to 145
Note : - “Portfolio Beta, Standard Deviation, R Squared, Sharpe Ratio and Tracking Error of the Scheme is not computed owing to the short ime frame since launch of the Scheme.”Portfolio turnover has been computed as the ratio of the lower value of purchase and sales, to the average net assets in the past one year (since inception for schemes that have not completed a year). The figures are not netted for derivative transactions.**In addition to the fund manager managing this fund, overseas investment is managed by Ms. Priyanka Khandelwal.@@ Total Expense Ratio is as on the last business day of the month.
Mrinal Singh (Managing this fund since Jan, 2017 & Overall 17 years of experience)Mittul Kalawadia(Managing this fund since Jan, 2018 & Overall 13 years of experience)
• Long term wealth creation
• A close ended equity fund that aims to provide capital appreciation by investing in a well diversified portfolio of stocks through fundamental analysis.
Scheme
Nifty 50 (Additional Benchmark)
NAV (Rs.) Per Unit (as on August 30,2019 : 10.74)
CAGR (%)
10.00
S&P BSE 500 TRI (Benchmark)
Since inception
CurrentValue of
Investment of Rs. 10000
CAGR (%) Current Value of
Investment of Rs. 10000
1 Year 3 Year 5 Year
CAGR (%) Current Value of
Investment of Rs. 10000
CAGR (%) Current Value of
Investment of Rs. 10000
11.99 - -
Particulars
-10.45 8957.46 - - - - 2.74 10740.00
-9.03 9099.31 - - - - 10.97 13160.26
-4.37 9564.51 - - - - 13.29 13900.06
Returns of ICICI Prudential Value Fund - Series 10 - Dividend Option as on August 31, 2019 - (IPVF10)
Notes:1. Different plans shall have different expense structure. The performance details provided herein are of ICICI Prudential Value Fund - Series 10.2. The scheme is currently managed by Mrinal Singh and Mittul Kalawadia. Mr. Mrinal Singh has been managing this fund since . Total Schemes Jan 2017managed by the Fund Manager . Refer annexure from page no. 109 for performance of other schemes is 13 (11 are jointly managed [Excludes FoF Schemes])currently managed by Mrinal Singh.Mr. Mittul Kalawadia has been managing this fund since Jan 2018 . Total Schemes managed by the Fund Manager Refer annexure from is 8 (8 are jointly managed).page no. 109 for performance of other schemes currently managed by Mittul Kalawadia.3. Date of inception: 09-Jan-17.4. Performance of dividend option would be Net of Dividend distribution tax, if any.5. As the Scheme has completed more than 1 year but less than 3 years, the performance details of only since inception and 1 year are provided herein.6. Past performance may or may not be sustained in future and the same may not necessarily provide the basis for comparison with other investment.7. Load is not considered for computation of returns.8. In case, the start/end date of the concerned period is a nonbusiness date (NBD), the NAV of the previous date is considered for computation of returns. The NAV per unit shown in the table is as on the start date of the said period9. NAV is adjusted to the extent of dividend declared for computation of returns.10. The performance of the scheme is benchmarked to the Total Return variant of the Index.
Portfolio as on August 31, 2019
Equity Shares 80.20% -18.78% Auto 3.28% Eicher Motors Ltd. 3.28% Auto Ancillaries 10.52% -0.86%• Sandhar Technologies Ltd. 4.06% • Exide Industries Ltd. 3.81% -0.86% Motherson Sumi Systems Ltd. 2.65% Banks 23.03% -9.66%• State Bank Of India 5.60% -1.82%• HDFC Bank Ltd. 4.66% -4.64%• The Federal Bank Ltd. 3.60% Kotak Mahindra Bank Ltd. 3.21% -3.19% ICICI Bank Ltd. 3.07% Axis Bank Ltd. 2.06% Bank Of Baroda 0.83% Cement 2.71% JK Lakshmi Cement Ltd. 2.71% Construction Project 2.95% -2.95% Larsen & Toubro Ltd. 2.95% -2.95% Consumer Durables 1.92% Amber Enterprises India Ltd. 1.92% Ferrous Metals 3.71% -0.54%• Tata Steel Ltd. 3.71% -0.54% Finance 8.85% -8.85%• HDFC Ltd. 8.85% -8.85% Healthcare Services 0.95% Max India Ltd. 0.95% Industrial Products 4.07% • Cummins India Ltd. 4.07% Non - Ferrous Metals 3.30% Hindustan Zinc Ltd. 2.43% Vedanta Ltd. 0.87%
Company/Issuer % to % to NAV NAV Derivatives
Petroleum Products 3.06% -3.05% Hindustan Petroleum Corporation Ltd. 3.06% -3.05% Power 3.14% NTPC Ltd. 3.13% NLC India Ltd. ^ SJVN Ltd. ^ Retailing 1.12% IndiaMart InterMesh Ltd 1.12% Software 3.46% • Tech Mahindra Ltd. 3.46% Telecom - Services 0.35% Bharti Airtel Ltd. 0.35% Transportation 3.79% VRL Logistics Ltd. 2.51% Gateway Distriparks Ltd. 1.28% Index Futures/Options 7.12%• Nifty 50 Index - Futures 7.12% Short Term Debt and net current assets 38.58% Total Net Assets 100.00%
Company/Issuer % to % to NAV NAV Derivatives
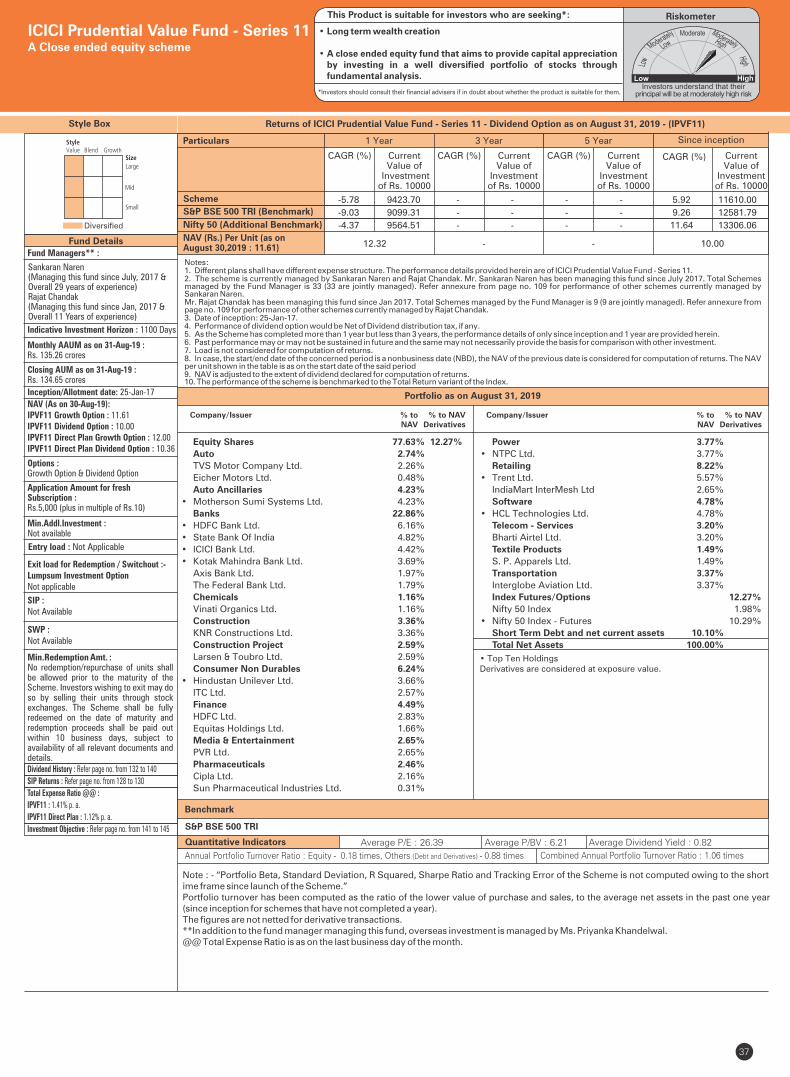
Style Box
Fund Managers** :
Indicative Investment Horizon : 1100 Days
Inception/Allotment date: 25-Jan-17
SWP :Not Available
Min.Redemption Amt. :No redemption/repurchase of units shall be allowed prior to the maturity of the Scheme. Investors wishing to exit may do so by selling their units through stock exchanges. The Scheme shall be fully redeemed on the date of maturity and redemption proceeds shall be paid out within 10 business days, subject to availability of all relevant documents and details.
SIP :Not Available
NAV (As on 30-Aug-19):IPVF11 Growth Option : 11.61IPVF11 Dividend Option : 10.00IPVF11 Direct Plan Growth Option : 12.00IPVF11 Direct Plan Dividend Option : 10.36
Options :Growth Option & Dividend Option
Application Amount for freshSubscription :Rs.5,000 (plus in multiple of Rs.10)
Min.Addl.Investment :Not available
Exit load for Redemption / Switchout :- Lumpsum Investment OptionNot applicable
37
Fund Details
Diversified
Quantitative Indicators
Benchmark
Average P/E : 26.39 Average P/BV : 6.21 Average Dividend Yield : 0.82
S&P BSE 500 TRI
ICICI Prudential Value Fund - Series 11A Close ended equity scheme
RiskometerThis Product is suitable for investors who are seeking*:
*Investors should consult their financial advisers if in doubt about whether the product is suitable for them.
Monthly AAUM as on 31-Aug-19 : Rs. 135.26 crores
Closing AUM as on 31-Aug-19 : Rs. 134.65 crores
• Top Ten HoldingsDerivatives are considered at exposure value.
Entry load : Not Applicable
Annual Portfolio Turnover Ratio : Equity - 0.18 times, Others (Debt and Derivatives) - 0.88 times Combined Annual Portfolio Turnover Ratio : 1.06 times
Dividend History : Refer page no. from 132 to 140
SIP Returns : Refer page no. from 128 to 130
Total Expense Ratio @@ :
IPVF11 : 1.41% p. a.
IPVF11 Direct Plan : 1.12% p. a.
Investment Objective : Refer page no. from 141 to 145
Note : - “Portfolio Beta, Standard Deviation, R Squared, Sharpe Ratio and Tracking Error of the Scheme is not computed owing to the short ime frame since launch of the Scheme.”Portfolio turnover has been computed as the ratio of the lower value of purchase and sales, to the average net assets in the past one year (since inception for schemes that have not completed a year). The figures are not netted for derivative transactions.**In addition to the fund manager managing this fund, overseas investment is managed by Ms. Priyanka Khandelwal.@@ Total Expense Ratio is as on the last business day of the month.
Sankaran Naren(Managing this fund since July, 2017 &Overall 29 years of experience)Rajat Chandak(Managing this fund since Jan, 2017 & Overall 11 Years of experience)
• Long term wealth creation
• A close ended equity fund that aims to provide capital appreciation by investing in a well diversified portfolio of stocks through fundamental analysis.
Scheme
Nifty 50 (Additional Benchmark)
NAV (Rs.) Per Unit (as on August 30,2019 : 11.61)
CAGR (%)
10.00
S&P BSE 500 TRI (Benchmark)
Since inception
CurrentValue of
Investment of Rs. 10000
CAGR (%) Current Value of
Investment of Rs. 10000
1 Year 3 Year 5 Year
CAGR (%) Current Value of
Investment of Rs. 10000
CAGR (%) Current Value of
Investment of Rs. 10000
12.32 - -
Particulars
-5.78 9423.70 - - - - 5.92 11610.00
-9.03 9099.31 - - - - 9.26 12581.79
-4.37 9564.51 - - - - 11.64 13306.06
Returns of ICICI Prudential Value Fund - Series 11 - Dividend Option as on August 31, 2019 - (IPVF11)
Notes:1. Different plans shall have different expense structure. The performance details provided herein are of ICICI Prudential Value Fund - Series 11.2. The scheme is currently managed by Sankaran Naren and Rajat Chandak. Mr. Sankaran Naren has been managing this fund since July 2017. Total Schemes managed by the Fund Manager is 33 (33 are jointly managed). Refer annexure from page no. 109 for performance of other schemes currently managed by Sankaran Naren.Mr. Rajat Chandak has been managing this fund since Jan 2017. Total Schemes managed by the Fund Manager is 9 (9 are jointly managed). Refer annexure from page no. 109 for performance of other schemes currently managed by Rajat Chandak.3. Date of inception: 25-Jan-17.4. Performance of dividend option would be Net of Dividend distribution tax, if any.5. As the Scheme has completed more than 1 year but less than 3 years, the performance details of only since inception and 1 year are provided herein.6. Past performance may or may not be sustained in future and the same may not necessarily provide the basis for comparison with other investment.7. Load is not considered for computation of returns.8. In case, the start/end date of the concerned period is a nonbusiness date (NBD), the NAV of the previous date is considered for computation of returns. The NAV per unit shown in the table is as on the start date of the said period9. NAV is adjusted to the extent of dividend declared for computation of returns.10. The performance of the scheme is benchmarked to the Total Return variant of the Index.
Portfolio as on August 31, 2019
Equity Shares 77.63% 12.27%
Auto 2.74%
TVS Motor Company Ltd. 2.26%
Eicher Motors Ltd. 0.48%
Auto Ancillaries 4.23%
• Motherson Sumi Systems Ltd. 4.23%
Banks 22.86%
• HDFC Bank Ltd. 6.16%
• State Bank Of India 4.82%
• ICICI Bank Ltd. 4.42%
• Kotak Mahindra Bank Ltd. 3.69%
Axis Bank Ltd. 1.97%
The Federal Bank Ltd. 1.79%
Chemicals 1.16%
Vinati Organics Ltd. 1.16%
Construction 3.36%
KNR Constructions Ltd. 3.36%
Construction Project 2.59%
Larsen & Toubro Ltd. 2.59%
Consumer Non Durables 6.24%
• Hindustan Unilever Ltd. 3.66%
ITC Ltd. 2.57%
Finance 4.49%
HDFC Ltd. 2.83%
Equitas Holdings Ltd. 1.66%
Media & Entertainment 2.65%
PVR Ltd. 2.65%
Pharmaceuticals 2.46%
Cipla Ltd. 2.16%
Sun Pharmaceutical Industries Ltd. 0.31%
Company/Issuer % to % to NAV NAV Derivatives
Power 3.77%
• NTPC Ltd. 3.77%
Retailing 8.22%
• Trent Ltd. 5.57%
IndiaMart InterMesh Ltd 2.65%
Software 4.78%
• HCL Technologies Ltd. 4.78%
Telecom - Services 3.20%
Bharti Airtel Ltd. 3.20%
Textile Products 1.49%
S. P. Apparels Ltd. 1.49%
Transportation 3.37%
Interglobe Aviation Ltd. 3.37%
Index Futures/Options 12.27%
Nifty 50 Index 1.98%
• Nifty 50 Index - Futures 10.29%
Short Term Debt and net current assets 10.10%
Total Net Assets 100.00%
Company/Issuer % to % to NAV NAV Derivatives
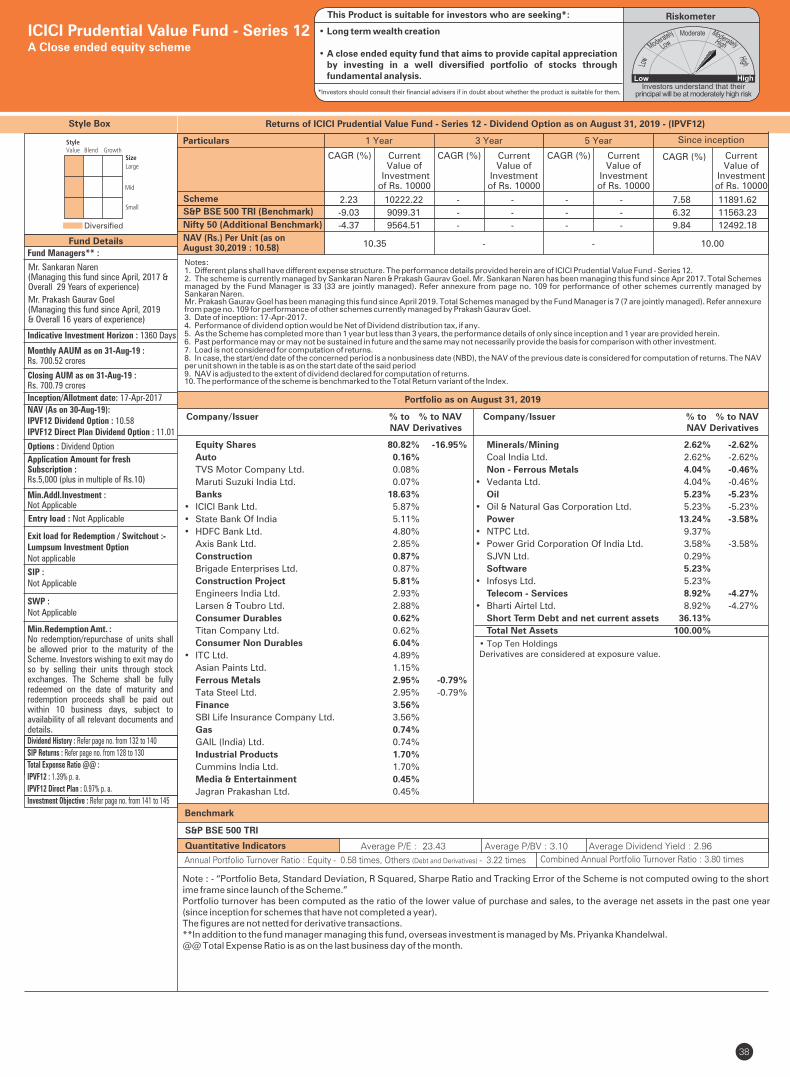
Style Box
Fund Managers** :
Indicative Investment Horizon : 1360 Days
Inception/Allotment date: 17-Apr-2017
SWP :Not Applicable
Min.Redemption Amt. :No redemption/repurchase of units shall be allowed prior to the maturity of the Scheme. Investors wishing to exit may do so by selling their units through stock exchanges. The Scheme shall be fully redeemed on the date of maturity and redemption proceeds shall be paid out within 10 business days, subject to availability of all relevant documents and details.
SIP :Not Applicable
NAV (As on 30-Aug-19):IPVF12 Dividend Option : 10.58IPVF12 Direct Plan Dividend Option : 11.01
Options : Dividend Option
Application Amount for freshSubscription :Rs.5,000 (plus in multiple of Rs.10)
Min.Addl.Investment :Not Applicable
Exit load for Redemption / Switchout :- Lumpsum Investment OptionNot applicable
38
Fund Details
Diversified
Quantitative Indicators
Benchmark
Average P/E : 23.43 Average P/BV : 3.10 Average Dividend Yield : 2.96
S&P BSE 500 TRI
ICICI Prudential Value Fund - Series 12A Close ended equity scheme
RiskometerThis Product is suitable for investors who are seeking*:
*Investors should consult their financial advisers if in doubt about whether the product is suitable for them.
Monthly AAUM as on 31-Aug-19 : Rs. 700.52 crores
Closing AUM as on 31-Aug-19 : Rs. 700.79 crores
Entry load : Not Applicable
Annual Portfolio Turnover Ratio : Equity - 0.58 times, Others (Debt and Derivatives) - 3.22 times Combined Annual Portfolio Turnover Ratio : 3.80 times
Dividend History : Refer page no. from 132 to 140
SIP Returns : Refer page no. from 128 to 130
Total Expense Ratio @@ :
IPVF12 : 1.39% p. a.
IPVF12 Direct Plan : 0.97% p. a.
Investment Objective : Refer page no. from 141 to 145
Note : - “Portfolio Beta, Standard Deviation, R Squared, Sharpe Ratio and Tracking Error of the Scheme is not computed owing to the short ime frame since launch of the Scheme.”Portfolio turnover has been computed as the ratio of the lower value of purchase and sales, to the average net assets in the past one year (since inception for schemes that have not completed a year). The figures are not netted for derivative transactions.**In addition to the fund manager managing this fund, overseas investment is managed by Ms. Priyanka Khandelwal.@@ Total Expense Ratio is as on the last business day of the month.
• Top Ten HoldingsDerivatives are considered at exposure value.
Equity Shares 80.82% -16.95%
Auto 0.16%
TVS Motor Company Ltd. 0.08%
Maruti Suzuki India Ltd. 0.07%
Banks 18.63%
• ICICI Bank Ltd. 5.87%
• State Bank Of India 5.11%
• HDFC Bank Ltd. 4.80%
Axis Bank Ltd. 2.85%
Construction 0.87%
Brigade Enterprises Ltd. 0.87%
Construction Project 5.81%
Engineers India Ltd. 2.93%
Larsen & Toubro Ltd. 2.88%
Consumer Durables 0.62%
Titan Company Ltd. 0.62%
Consumer Non Durables 6.04%
• ITC Ltd. 4.89%
Asian Paints Ltd. 1.15%
Ferrous Metals 2.95% -0.79%
Tata Steel Ltd. 2.95% -0.79%
Finance 3.56%
SBI Life Insurance Company Ltd. 3.56%
Gas 0.74%
GAIL (India) Ltd. 0.74%
Industrial Products 1.70%
Cummins India Ltd. 1.70%
Media & Entertainment 0.45%
Jagran Prakashan Ltd. 0.45%
Company/Issuer % to % to NAV NAV Derivatives
Mr. Sankaran Naren (Managing this fund since April, 2017 & Overall 29 Years of experience)
Mr. Prakash Gaurav Goel(Managing this fund since April, 2019 & Overall 16 years of experience)
• Long term wealth creation
• A close ended equity fund that aims to provide capital appreciation by investing in a well diversified portfolio of stocks through fundamental analysis.
Scheme
Nifty 50 (Additional Benchmark)
NAV (Rs.) Per Unit (as on August 30,2019 : 10.58)
CAGR (%)
10.00
S&P BSE 500 TRI (Benchmark)
Since inception
CurrentValue of
Investment of Rs. 10000
CAGR (%) Current Value of
Investment of Rs. 10000
1 Year 3 Year 5 Year
CAGR (%) Current Value of
Investment of Rs. 10000
CAGR (%) Current Value of
Investment of Rs. 10000
10.35 - -
Particulars
2.23 10222.22 - - - - 7.58 11891.62
-9.03 9099.31 - - - - 6.32 11563.23
-4.37 9564.51 - - - - 9.84 12492.18
Portfolio as on August 31, 2019
Minerals/Mining 2.62% -2.62%
Coal India Ltd. 2.62% -2.62%
Non - Ferrous Metals 4.04% -0.46%
• Vedanta Ltd. 4.04% -0.46%
Oil 5.23% -5.23%
• Oil & Natural Gas Corporation Ltd. 5.23% -5.23%
Power 13.24% -3.58%
• NTPC Ltd. 9.37%
• Power Grid Corporation Of India Ltd. 3.58% -3.58%
SJVN Ltd. 0.29%
Software 5.23%
• Infosys Ltd. 5.23%
Telecom - Services 8.92% -4.27%
• Bharti Airtel Ltd. 8.92% -4.27%
Short Term Debt and net current assets 36.13%
Total Net Assets 100.00%
Company/Issuer % to % to NAV NAV Derivatives
Notes:1. Different plans shall have different expense structure. The performance details provided herein are of ICICI Prudential Value Fund - Series 12.2. The scheme is currently managed by Sankaran Naren & Prakash Gaurav Goel. Mr. Sankaran Naren has been managing this fund since Apr 2017. Total Schemes managed by the Fund Manager is 33 (33 are jointly managed). Refer annexure from page no. 109 for performance of other schemes currently managed by Sankaran Naren.Mr. Prakash Gaurav Goel has been managing this fund since April 2019. Total Schemes managed by the Fund Manager is 7 (7 are jointly managed). Refer annexure from page no. 109 for performance of other schemes currently managed by Prakash Gaurav Goel.3. Date of inception: 17-Apr-2017.4. Performance of dividend option would be Net of Dividend distribution tax, if any.5. As the Scheme has completed more than 1 year but less than 3 years, the performance details of only since inception and 1 year are provided herein.6. Past performance may or may not be sustained in future and the same may not necessarily provide the basis for comparison with other investment.7. Load is not considered for computation of returns.8. In case, the start/end date of the concerned period is a nonbusiness date (NBD), the NAV of the previous date is considered for computation of returns. The NAV per unit shown in the table is as on the start date of the said period9. NAV is adjusted to the extent of dividend declared for computation of returns.10. The performance of the scheme is benchmarked to the Total Return variant of the Index.
Returns of ICICI Prudential Value Fund - Series 12 - Dividend Option as on August 31, 2019 - (IPVF12)
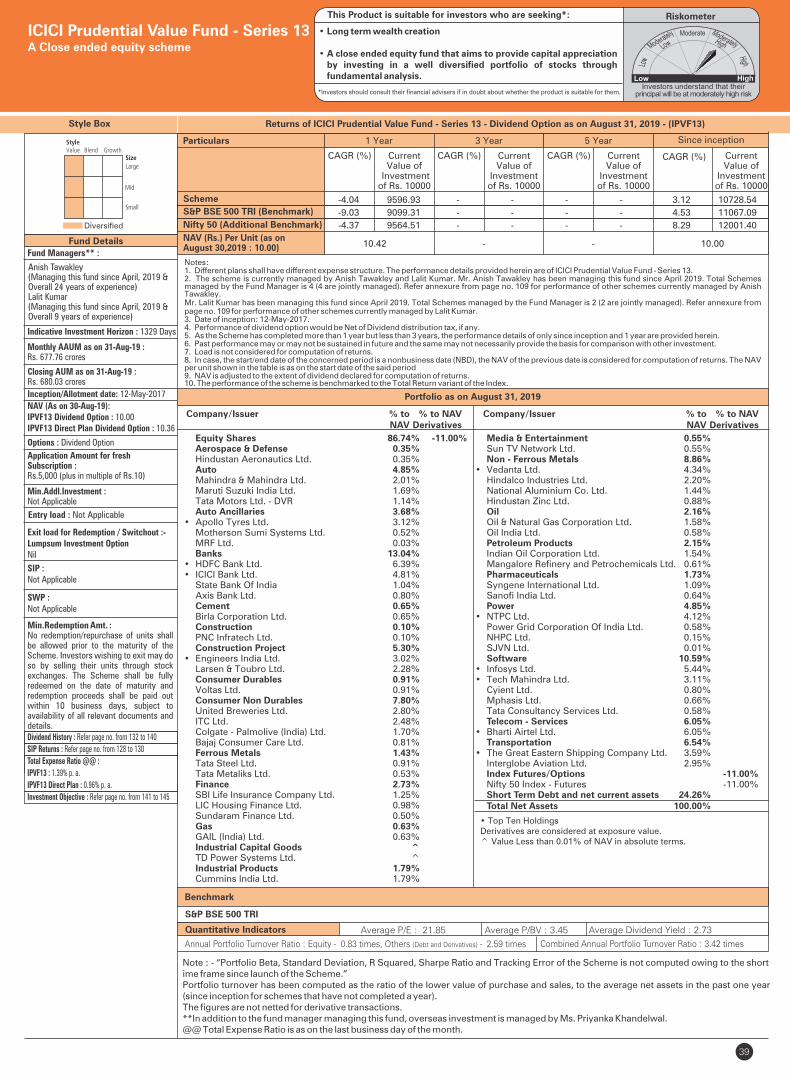
Style Box
Fund Managers** :
Indicative Investment Horizon : 1329 Days
Inception/Allotment date: 12-May-2017
SWP :Not Applicable
Min.Redemption Amt. :No redemption/repurchase of units shall be allowed prior to the maturity of the Scheme. Investors wishing to exit may do so by selling their units through stock exchanges. The Scheme shall be fully redeemed on the date of maturity and redemption proceeds shall be paid out within 10 business days, subject to availability of all relevant documents and details.
SIP :Not Applicable
NAV (As on 30-Aug-19):IPVF13 Dividend Option : 10.00IPVF13 Direct Plan Dividend Option : 10.36
Options : Dividend Option
Application Amount for freshSubscription :Rs.5,000 (plus in multiple of Rs.10)
Min.Addl.Investment :Not Applicable
Exit load for Redemption / Switchout :- Lumpsum Investment OptionNil
39
Fund Details
Diversified
Quantitative Indicators
Benchmark
Average P/E : 21.85 Average P/BV : 3.45 Average Dividend Yield : 2.73
S&P BSE 500 TRI
ICICI Prudential Value Fund - Series 13A Close ended equity scheme
RiskometerThis Product is suitable for investors who are seeking*:
*Investors should consult their financial advisers if in doubt about whether the product is suitable for them.
Monthly AAUM as on 31-Aug-19 : Rs. 677.76 crores
Closing AUM as on 31-Aug-19 : Rs. 680.03 crores
• Top Ten HoldingsDerivatives are considered at exposure value.^ Value Less than 0.01% of NAV in absolute terms.
Entry load : Not Applicable
Annual Portfolio Turnover Ratio : Equity - 0.83 times, Others (Debt and Derivatives) - 2.59 times Combined Annual Portfolio Turnover Ratio : 3.42 times
Dividend History : Refer page no. from 132 to 140
SIP Returns : Refer page no. from 128 to 130
Total Expense Ratio @@ :
IPVF13 : 1.39% p. a.
IPVF13 Direct Plan : 0.96% p. a.
Investment Objective : Refer page no. from 141 to 145
Note : - “Portfolio Beta, Standard Deviation, R Squared, Sharpe Ratio and Tracking Error of the Scheme is not computed owing to the short ime frame since launch of the Scheme.”Portfolio turnover has been computed as the ratio of the lower value of purchase and sales, to the average net assets in the past one year (since inception for schemes that have not completed a year). The figures are not netted for derivative transactions.**In addition to the fund manager managing this fund, overseas investment is managed by Ms. Priyanka Khandelwal.@@ Total Expense Ratio is as on the last business day of the month.
Anish Tawakley(Managing this fund since April, 2019 &Overall 24 years of experience)Lalit Kumar(Managing this fund since April, 2019 &Overall 9 years of experience)
• Long term wealth creation
• A close ended equity fund that aims to provide capital appreciation by investing in a well diversified portfolio of stocks through fundamental analysis.
Portfolio as on August 31, 2019
Scheme
Nifty 50 (Additional Benchmark)
NAV (Rs.) Per Unit (as on August 30,2019 : 10.00)
CAGR (%)
10.00
S&P BSE 500 TRI (Benchmark)
Since inception
CurrentValue of
Investment of Rs. 10000
CAGR (%) Current Value of
Investment of Rs. 10000
1 Year 3 Year 5 Year
CAGR (%) Current Value of
Investment of Rs. 10000
CAGR (%) Current Value of
Investment of Rs. 10000
10.42 - -
Particulars
-4.04 9596.93 - - - - 3.12 10728.54
-9.03 9099.31 - - - - 4.53 11067.09
-4.37 9564.51 - - - - 8.29 12001.40
Notes:1. Different plans shall have different expense structure. The performance details provided herein are of ICICI Prudential Value Fund - Series 13.2. The scheme is currently managed by Anish Tawakley and Lalit Kumar. Mr. Anish Tawakley has been managing this fund since April 2019. Total Schemes managed by the Fund Manager is 4 (4 are jointly managed). Refer annexure from page no. 109 for performance of other schemes currently managed by Anish Tawakley.Mr. Lalit Kumar has been managing this fund since April 2019. Total Schemes managed by the Fund Manager is 2 (2 are jointly managed). Refer annexure from page no. 109 for performance of other schemes currently managed by Lalit Kumar.3. Date of inception: 12-May-2017.4. Performance of dividend option would be Net of Dividend distribution tax, if any.5. As the Scheme has completed more than 1 year but less than 3 years, the performance details of only since inception and 1 year are provided herein.6. Past performance may or may not be sustained in future and the same may not necessarily provide the basis for comparison with other investment.7. Load is not considered for computation of returns.8. In case, the start/end date of the concerned period is a nonbusiness date (NBD), the NAV of the previous date is considered for computation of returns. The NAV per unit shown in the table is as on the start date of the said period9. NAV is adjusted to the extent of dividend declared for computation of returns.10. The performance of the scheme is benchmarked to the Total Return variant of the Index.
Returns of ICICI Prudential Value Fund - Series 13 - Dividend Option as on August 31, 2019 - (IPVF13)
Equity Shares 86.74% -11.00% Aerospace & Defense 0.35% Hindustan Aeronautics Ltd. 0.35% Auto 4.85% Mahindra & Mahindra Ltd. 2.01% Maruti Suzuki India Ltd. 1.69% Tata Motors Ltd. - DVR 1.14% Auto Ancillaries 3.68% • Apollo Tyres Ltd. 3.12% Motherson Sumi Systems Ltd. 0.52% MRF Ltd. 0.03% Banks 13.04% • HDFC Bank Ltd. 6.39% • ICICI Bank Ltd. 4.81% State Bank Of India 1.04% Axis Bank Ltd. 0.80% Cement 0.65% Birla Corporation Ltd. 0.65% Construction 0.10% PNC Infratech Ltd. 0.10% Construction Project 5.30% • Engineers India Ltd. 3.02% Larsen & Toubro Ltd. 2.28% Consumer Durables 0.91% Voltas Ltd. 0.91% Consumer Non Durables 7.80% United Breweries Ltd. 2.80% ITC Ltd. 2.48% Colgate - Palmolive (India) Ltd. 1.70% Bajaj Consumer Care Ltd. 0.81% Ferrous Metals 1.43% Tata Steel Ltd. 0.91% Tata Metaliks Ltd. 0.53% Finance 2.73% SBI Life Insurance Company Ltd. 1.25% LIC Housing Finance Ltd. 0.98% Sundaram Finance Ltd. 0.50% Gas 0.63% GAIL (India) Ltd. 0.63% Industrial Capital Goods ^ TD Power Systems Ltd. ^ Industrial Products 1.79% Cummins India Ltd. 1.79%
Company/Issuer % to % to NAV NAV Derivatives
Media & Entertainment 0.55% Sun TV Network Ltd. 0.55% Non - Ferrous Metals 8.86% • Vedanta Ltd. 4.34% Hindalco Industries Ltd. 2.20% National Aluminium Co. Ltd. 1.44% Hindustan Zinc Ltd. 0.88% Oil 2.16% Oil & Natural Gas Corporation Ltd. 1.58% Oil India Ltd. 0.58% Petroleum Products 2.15% Indian Oil Corporation Ltd. 1.54% Mangalore Refinery and Petrochemicals Ltd. 0.61% Pharmaceuticals 1.73% Syngene International Ltd. 1.09% Sanofi India Ltd. 0.64% Power 4.85% • NTPC Ltd. 4.12% Power Grid Corporation Of India Ltd. 0.58% NHPC Ltd. 0.15% SJVN Ltd. 0.01% Software 10.59% • Infosys Ltd. 5.44% • Tech Mahindra Ltd. 3.11% Cyient Ltd. 0.80% Mphasis Ltd. 0.66% Tata Consultancy Services Ltd. 0.58% Telecom - Services 6.05% • Bharti Airtel Ltd. 6.05% Transportation 6.54% • The Great Eastern Shipping Company Ltd. 3.59% Interglobe Aviation Ltd. 2.95% Index Futures/Options -11.00% Nifty 50 Index - Futures -11.00% Short Term Debt and net current assets 24.26% Total Net Assets 100.00%
Company/Issuer % to % to NAV NAV Derivatives
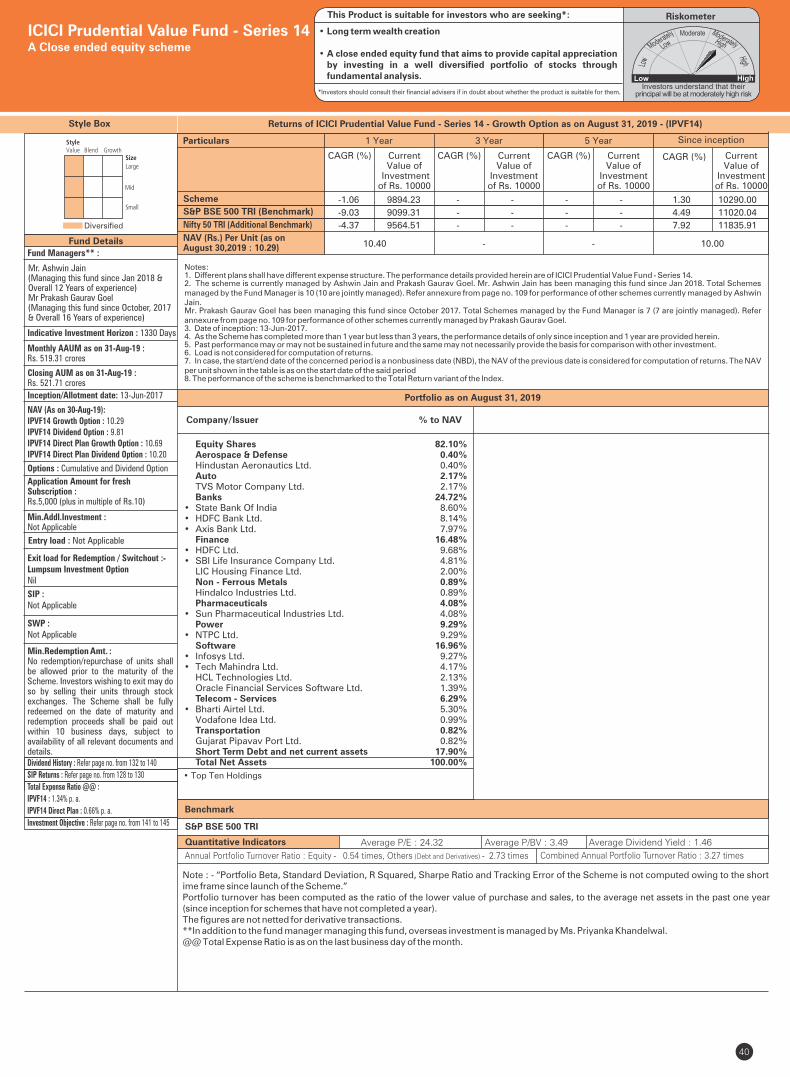
Style Box
Fund Managers** :
Indicative Investment Horizon : 1330 Days
Inception/Allotment date: 13-Jun-2017
SWP :Not Applicable
Min.Redemption Amt. :No redemption/repurchase of units shall be allowed prior to the maturity of the Scheme. Investors wishing to exit may do so by selling their units through stock exchanges. The Scheme shall be fully redeemed on the date of maturity and redemption proceeds shall be paid out within 10 business days, subject to availability of all relevant documents and details.
SIP :Not Applicable
NAV (As on 30-Aug-19):IPVF14 Growth Option : 10.29IPVF14 Dividend Option : 9.81IPVF14 Direct Plan Growth Option : 10.69IPVF14 Direct Plan Dividend Option : 10.20
Options : Cumulative and Dividend Option
Application Amount for freshSubscription :Rs.5,000 (plus in multiple of Rs.10)
Min.Addl.Investment :Not Applicable
Exit load for Redemption / Switchout :- Lumpsum Investment OptionNil
40
Fund Details
Diversified
Quantitative Indicators
Benchmark
Average P/E : 24.32 Average P/BV : 3.49 Average Dividend Yield : 1.46
S&P BSE 500 TRI
ICICI Prudential Value Fund - Series 14A Close ended equity scheme
RiskometerThis Product is suitable for investors who are seeking*:
Monthly AAUM as on 31-Aug-19 : Rs. 519.31 crores
*Investors should consult their financial advisers if in doubt about whether the product is suitable for them.
Closing AUM as on 31-Aug-19 : Rs. 521.71 crores
• Top Ten Holdings
Entry load : Not Applicable
Annual Portfolio Turnover Ratio : Equity - 0.54 times, Others (Debt and Derivatives) - 2.73 times Combined Annual Portfolio Turnover Ratio : 3.27 times
Dividend History : Refer page no. from 132 to 140
SIP Returns : Refer page no. from 128 to 130
Total Expense Ratio @@ :
IPVF14 : 1.34% p. a.
IPVF14 Direct Plan : 0.66% p. a.
Investment Objective : Refer page no. from 141 to 145
Note : - “Portfolio Beta, Standard Deviation, R Squared, Sharpe Ratio and Tracking Error of the Scheme is not computed owing to the short ime frame since launch of the Scheme.”Portfolio turnover has been computed as the ratio of the lower value of purchase and sales, to the average net assets in the past one year (since inception for schemes that have not completed a year). The figures are not netted for derivative transactions.**In addition to the fund manager managing this fund, overseas investment is managed by Ms. Priyanka Khandelwal.@@ Total Expense Ratio is as on the last business day of the month.
Mr. Ashwin Jain(Managing this fund since Jan 2018 & Overall 12 Years of experience)Mr Prakash Gaurav Goel
(Managing this fund since October, 2017 & Overall 16 Years of experience)
• Long term wealth creation
• A close ended equity fund that aims to provide capital appreciation by investing in a well diversified portfolio of stocks through fundamental analysis.
Equity Shares 82.10% Aerospace & Defense 0.40% Hindustan Aeronautics Ltd. 0.40% Auto 2.17% TVS Motor Company Ltd. 2.17% Banks 24.72%• State Bank Of India 8.60%• HDFC Bank Ltd. 8.14%• Axis Bank Ltd. 7.97% Finance 16.48%• HDFC Ltd. 9.68%• SBI Life Insurance Company Ltd. 4.81% LIC Housing Finance Ltd. 2.00% Non - Ferrous Metals 0.89% Hindalco Industries Ltd. 0.89% Pharmaceuticals 4.08%• Sun Pharmaceutical Industries Ltd. 4.08% Power 9.29%• NTPC Ltd. 9.29% Software 16.96%• Infosys Ltd. 9.27%• Tech Mahindra Ltd. 4.17% HCL Technologies Ltd. 2.13% Oracle Financial Services Software Ltd. 1.39% Telecom - Services 6.29%• Bharti Airtel Ltd. 5.30% Vodafone Idea Ltd. 0.99% Transportation 0.82% Gujarat Pipavav Port Ltd. 0.82% Short Term Debt and net current assets 17.90% Total Net Assets 100.00%
Company/Issuer % to NAV
Scheme
Nifty 50 TRI (Additional Benchmark)
NAV (Rs.) Per Unit (as on August 30,2019 : 10.29)
CAGR (%)
10.00
S&P BSE 500 TRI (Benchmark)
Since inception
CurrentValue of
Investment of Rs. 10000
CAGR (%) Current Value of
Investment of Rs. 10000
1 Year 3 Year 5 Year
CAGR (%) Current Value of
Investment of Rs. 10000
CAGR (%) Current Value of
Investment of Rs. 10000
10.40 - -
Particulars
-1.06 9894.23 - - - - 1.30 10290.00
-9.03 9099.31 - - - - 4.49 11020.04
-4.37 9564.51 - - - - 7.92 11835.91
Notes:1. Different plans shall have different expense structure. The performance details provided herein are of ICICI Prudential Value Fund - Series 14.2. The scheme is currently managed by Ashwin Jain and Prakash Gaurav Goel. Mr. Ashwin Jain has been managing this fund since Jan 2018. Total Schemes managed by the Fund Manager is 10 (10 are jointly managed). Refer annexure from page no. 109 for performance of other schemes currently managed by Ashwin Jain.Mr. Prakash Gaurav Goel has been managing this fund since October 2017. Total Schemes managed by the Fund Manager is 7 (7 are jointly managed). Refer annexure from page no. 109 for performance of other schemes currently managed by Prakash Gaurav Goel.3. Date of inception: 13-Jun-2017.4. As the Scheme has completed more than 1 year but less than 3 years, the performance details of only since inception and 1 year are provided herein.5. Past performance may or may not be sustained in future and the same may not necessarily provide the basis for comparison with other investment.6. Load is not considered for computation of returns.7. In case, the start/end date of the concerned period is a nonbusiness date (NBD), the NAV of the previous date is considered for computation of returns. The NAV per unit shown in the table is as on the start date of the said period8. The performance of the scheme is benchmarked to the Total Return variant of the Index.
Portfolio as on August 31, 2019
Returns of ICICI Prudential Value Fund - Series 14 - Growth Option as on August 31, 2019 - (IPVF14)
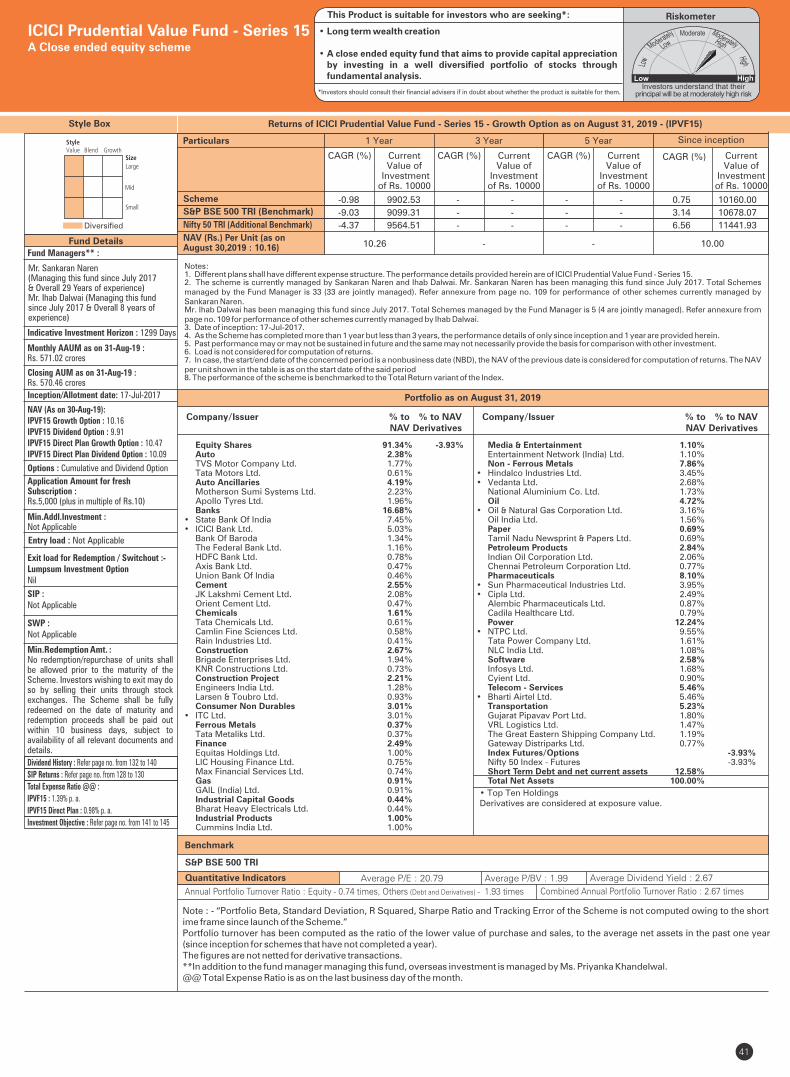
Style Box
Fund Managers** :
Indicative Investment Horizon : 1299 Days
Inception/Allotment date: 17-Jul-2017
SWP :Not Applicable
Min.Redemption Amt. :No redemption/repurchase of units shall be allowed prior to the maturity of the Scheme. Investors wishing to exit may do so by selling their units through stock exchanges. The Scheme shall be fully redeemed on the date of maturity and redemption proceeds shall be paid out within 10 business days, subject to availability of all relevant documents and details.
SIP :Not Applicable
NAV (As on 30-Aug-19):IPVF15 Growth Option : 10.16IPVF15 Dividend Option : 9.91IPVF15 Direct Plan Growth Option : 10.47IPVF15 Direct Plan Dividend Option : 10.09
Options : Cumulative and Dividend Option
Application Amount for freshSubscription :Rs.5,000 (plus in multiple of Rs.10)
Min.Addl.Investment :Not Applicable
Exit load for Redemption / Switchout :- Lumpsum Investment OptionNil
41
Fund Details
Diversified
Quantitative Indicators
Benchmark
Average P/E : 20.79 Average P/BV : 1.99 Average Dividend Yield : 2.67
S&P BSE 500 TRI
ICICI Prudential Value Fund - Series 15A Close ended equity scheme
RiskometerThis Product is suitable for investors who are seeking*:
*Investors should consult their financial advisers if in doubt about whether the product is suitable for them.
Monthly AAUM as on 31-Aug-19 : Rs. 571.02 crores
Closing AUM as on 31-Aug-19 : Rs. 570.46 crores
• Top Ten HoldingsDerivatives are considered at exposure value.
Entry load : Not Applicable
Annual Portfolio Turnover Ratio : Equity - 0.74 times, Others (Debt and Derivatives) - 1.93 times Combined Annual Portfolio Turnover Ratio : 2.67 times
Dividend History : Refer page no. from 132 to 140
SIP Returns : Refer page no. from 128 to 130
Total Expense Ratio @@ :
IPVF15 : 1.39% p. a.
IPVF15 Direct Plan : 0.98% p. a.
Investment Objective : Refer page no. from 141 to 145
Note : - “Portfolio Beta, Standard Deviation, R Squared, Sharpe Ratio and Tracking Error of the Scheme is not computed owing to the short ime frame since launch of the Scheme.”Portfolio turnover has been computed as the ratio of the lower value of purchase and sales, to the average net assets in the past one year (since inception for schemes that have not completed a year). The figures are not netted for derivative transactions.**In addition to the fund manager managing this fund, overseas investment is managed by Ms. Priyanka Khandelwal.@@ Total Expense Ratio is as on the last business day of the month.
Mr. Sankaran Naren (Managing this fund since July 2017 & Overall 29 Years of experience)Mr. Ihab Dalwai (Managing this fund since July 2017 & Overall 8 years of experience)
• Long term wealth creation
• A close ended equity fund that aims to provide capital appreciation by investing in a well diversified portfolio of stocks through fundamental analysis.
Equity Shares 91.34% -3.93% Auto 2.38% TVS Motor Company Ltd. 1.77% Tata Motors Ltd. 0.61% Auto Ancillaries 4.19% Motherson Sumi Systems Ltd. 2.23% Apollo Tyres Ltd. 1.96% Banks 16.68% • State Bank Of India 7.45% • ICICI Bank Ltd. 5.03% Bank Of Baroda 1.34% The Federal Bank Ltd. 1.16% HDFC Bank Ltd. 0.78% Axis Bank Ltd. 0.47% Union Bank Of India 0.46% Cement 2.55% JK Lakshmi Cement Ltd. 2.08% Orient Cement Ltd. 0.47% Chemicals 1.61% Tata Chemicals Ltd. 0.61% Camlin Fine Sciences Ltd. 0.58% Rain Industries Ltd. 0.41% Construction 2.67% Brigade Enterprises Ltd. 1.94% KNR Constructions Ltd. 0.73% Construction Project 2.21% Engineers India Ltd. 1.28% Larsen & Toubro Ltd. 0.93% Consumer Non Durables 3.01% • ITC Ltd. 3.01% Ferrous Metals 0.37% Tata Metaliks Ltd. 0.37% Finance 2.49% Equitas Holdings Ltd. 1.00% LIC Housing Finance Ltd. 0.75% Max Financial Services Ltd. 0.74% Gas 0.91% GAIL (India) Ltd. 0.91% Industrial Capital Goods 0.44% Bharat Heavy Electricals Ltd. 0.44% Industrial Products 1.00% Cummins India Ltd. 1.00%
Company/Issuer % to % to NAV NAV Derivatives
Company/Issuer % to % to NAV NAV Derivatives
Media & Entertainment 1.10% Entertainment Network (India) Ltd. 1.10% Non - Ferrous Metals 7.86% • Hindalco Industries Ltd. 3.45% • Vedanta Ltd. 2.68% National Aluminium Co. Ltd. 1.73% Oil 4.72% • Oil & Natural Gas Corporation Ltd. 3.16% Oil India Ltd. 1.56% Paper 0.69% Tamil Nadu Newsprint & Papers Ltd. 0.69% Petroleum Products 2.84% Indian Oil Corporation Ltd. 2.06% Chennai Petroleum Corporation Ltd. 0.77% Pharmaceuticals 8.10% • Sun Pharmaceutical Industries Ltd. 3.95% • Cipla Ltd. 2.49% Alembic Pharmaceuticals Ltd. 0.87% Cadila Healthcare Ltd. 0.79% Power 12.24% • NTPC Ltd. 9.55% Tata Power Company Ltd. 1.61% NLC India Ltd. 1.08% Software 2.58% Infosys Ltd. 1.68% Cyient Ltd. 0.90% Telecom - Services 5.46% • Bharti Airtel Ltd. 5.46% Transportation 5.23% Gujarat Pipavav Port Ltd. 1.80% VRL Logistics Ltd. 1.47% The Great Eastern Shipping Company Ltd. 1.19% Gateway Distriparks Ltd. 0.77% Index Futures/Options -3.93% Nifty 50 Index - Futures -3.93% Short Term Debt and net current assets 12.58% Total Net Assets 100.00%
Portfolio as on August 31, 2019
Scheme
Nifty 50 TRI (Additional Benchmark)
NAV (Rs.) Per Unit (as on August 30,2019 : 10.16)
CAGR (%)
10.00
S&P BSE 500 TRI (Benchmark)
Since inception
CurrentValue of
Investment of Rs. 10000
CAGR (%) Current Value of
Investment of Rs. 10000
1 Year 3 Year 5 Year
CAGR (%) Current Value of
Investment of Rs. 10000
CAGR (%) Current Value of
Investment of Rs. 10000
10.26 - -
Particulars
-0.98 9902.53 - - - - 0.75 10160.00
-9.03 9099.31 - - - - 3.14 10678.07
-4.37 9564.51 - - - - 6.56 11441.93
Notes:1. Different plans shall have different expense structure. The performance details provided herein are of ICICI Prudential Value Fund - Series 15.2. The scheme is currently managed by Sankaran Naren and Ihab Dalwai. Mr. Sankaran Naren has been managing this fund since July 2017. Total Schemes managed by the Fund Manager is 33 (33 are jointly managed). Refer annexure from page no. 109 for performance of other schemes currently managed by Sankaran Naren.Mr. Ihab Dalwai has been managing this fund since July 2017. Total Schemes managed by the Fund Manager is 5 (4 are jointly managed). Refer annexure from page no. 109 for performance of other schemes currently managed by Ihab Dalwai.3. Date of inception: 17-Jul-2017.4. As the Scheme has completed more than 1 year but less than 3 years, the performance details of only since inception and 1 year are provided herein.5. Past performance may or may not be sustained in future and the same may not necessarily provide the basis for comparison with other investment.6. Load is not considered for computation of returns.7. In case, the start/end date of the concerned period is a nonbusiness date (NBD), the NAV of the previous date is considered for computation of returns. The NAV per unit shown in the table is as on the start date of the said period8. The performance of the scheme is benchmarked to the Total Return variant of the Index.
Returns of ICICI Prudential Value Fund - Series 15 - Growth Option as on August 31, 2019 - (IPVF15)
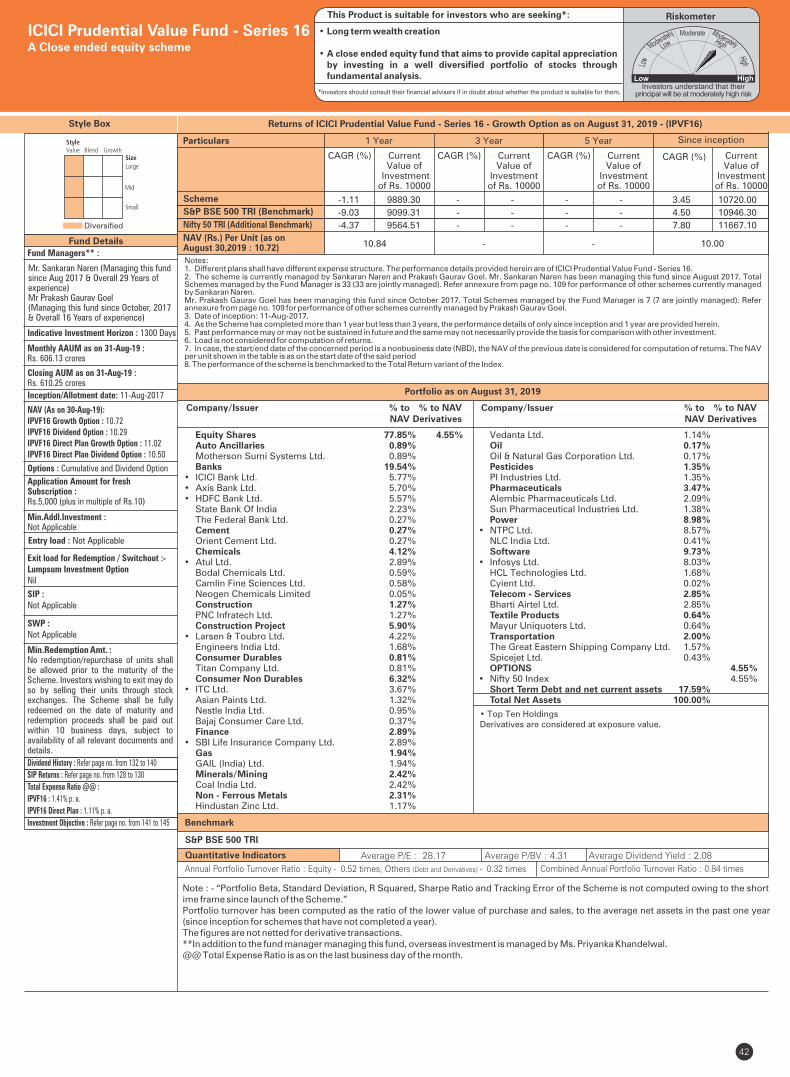
Style Box
Fund Managers** :
Indicative Investment Horizon : 1300 Days
Inception/Allotment date: 11-Aug-2017
SWP :Not Applicable
Min.Redemption Amt. :No redemption/repurchase of units shall be allowed prior to the maturity of the Scheme. Investors wishing to exit may do so by selling their units through stock exchanges. The Scheme shall be fully redeemed on the date of maturity and redemption proceeds shall be paid out within 10 business days, subject to availability of all relevant documents and details.
SIP :Not Applicable
NAV (As on 30-Aug-19):IPVF16 Growth Option : 10.72IPVF16 Dividend Option : 10.29IPVF16 Direct Plan Growth Option : 11.02IPVF16 Direct Plan Dividend Option : 10.50
Options : Cumulative and Dividend Option
Application Amount for freshSubscription :Rs.5,000 (plus in multiple of Rs.10)
Min.Addl.Investment :Not Applicable
Exit load for Redemption / Switchout :- Lumpsum Investment OptionNil
42
Fund Details
Diversified
Quantitative Indicators
Benchmark
Average P/E : 28.17 Average P/BV : 4.31 Average Dividend Yield : 2.08
S&P BSE 500 TRI
ICICI Prudential Value Fund - Series 16A Close ended equity scheme
RiskometerThis Product is suitable for investors who are seeking*:
*Investors should consult their financial advisers if in doubt about whether the product is suitable for them.
Monthly AAUM as on 31-Aug-19 : Rs. 606.13 crores
Closing AUM as on 31-Aug-19 : Rs. 610.25 crores
Entry load : Not Applicable
Annual Portfolio Turnover Ratio : Equity - 0.52 times, Others (Debt and Derivatives) - 0.32 times Combined Annual Portfolio Turnover Ratio : 0.84 times
Dividend History : Refer page no. from 132 to 140
SIP Returns : Refer page no. from 128 to 130
Total Expense Ratio @@ :
IPVF16 : 1.41% p. a.
IPVF16 Direct Plan : 1.11% p. a.
Investment Objective : Refer page no. from 141 to 145
Note : - “Portfolio Beta, Standard Deviation, R Squared, Sharpe Ratio and Tracking Error of the Scheme is not computed owing to the short ime frame since launch of the Scheme.”Portfolio turnover has been computed as the ratio of the lower value of purchase and sales, to the average net assets in the past one year (since inception for schemes that have not completed a year). The figures are not netted for derivative transactions.**In addition to the fund manager managing this fund, overseas investment is managed by Ms. Priyanka Khandelwal.@@ Total Expense Ratio is as on the last business day of the month.
Mr. Sankaran Naren (Managing this fund since Aug 2017 & Overall 29 Years of experience)
Mr Prakash Gaurav Goel(Managing this fund since October, 2017 & Overall 16 Years of experience)
Equity Shares 77.85% 4.55% Auto Ancillaries 0.89% Motherson Sumi Systems Ltd. 0.89% Banks 19.54% • ICICI Bank Ltd. 5.77% • Axis Bank Ltd. 5.70% • HDFC Bank Ltd. 5.57% State Bank Of India 2.23% The Federal Bank Ltd. 0.27% Cement 0.27% Orient Cement Ltd. 0.27% Chemicals 4.12% • Atul Ltd. 2.89% Bodal Chemicals Ltd. 0.59% Camlin Fine Sciences Ltd. 0.58% Neogen Chemicals Limited 0.05% Construction 1.27% PNC Infratech Ltd. 1.27% Construction Project 5.90% • Larsen & Toubro Ltd. 4.22% Engineers India Ltd. 1.68% Consumer Durables 0.81% Titan Company Ltd. 0.81% Consumer Non Durables 6.32% • ITC Ltd. 3.67% Asian Paints Ltd. 1.32% Nestle India Ltd. 0.95% Bajaj Consumer Care Ltd. 0.37% Finance 2.89% • SBI Life Insurance Company Ltd. 2.89% Gas 1.94% GAIL (India) Ltd. 1.94% Minerals/Mining 2.42% Coal India Ltd. 2.42% Non - Ferrous Metals 2.31% Hindustan Zinc Ltd. 1.17%
Company/Issuer % to % to NAV NAV Derivatives
Company/Issuer % to % to NAV NAV Derivatives
Vedanta Ltd. 1.14% Oil 0.17% Oil & Natural Gas Corporation Ltd. 0.17% Pesticides 1.35% PI Industries Ltd. 1.35% Pharmaceuticals 3.47% Alembic Pharmaceuticals Ltd. 2.09% Sun Pharmaceutical Industries Ltd. 1.38% Power 8.98% • NTPC Ltd. 8.57% NLC India Ltd. 0.41% Software 9.73% • Infosys Ltd. 8.03% HCL Technologies Ltd. 1.68% Cyient Ltd. 0.02% Telecom - Services 2.85% Bharti Airtel Ltd. 2.85% Textile Products 0.64% Mayur Uniquoters Ltd. 0.64% Transportation 2.00% The Great Eastern Shipping Company Ltd. 1.57% Spicejet Ltd. 0.43% OPTIONS 4.55%• Nifty 50 Index 4.55% Short Term Debt and net current assets 17.59% Total Net Assets 100.00%
• Top Ten HoldingsDerivatives are considered at exposure value.
• Long term wealth creation
• A close ended equity fund that aims to provide capital appreciation by investing in a well diversified portfolio of stocks through fundamental analysis.
Scheme
Nifty 50 TRI (Additional Benchmark)
NAV (Rs.) Per Unit (as on August 30,2019 : 10.72)
CAGR (%)
10.00
S&P BSE 500 TRI (Benchmark)
Since inception
CurrentValue of
Investment of Rs. 10000
CAGR (%) Current Value of
Investment of Rs. 10000
1 Year 3 Year 5 Year
CAGR (%) Current Value of
Investment of Rs. 10000
CAGR (%) Current Value of
Investment of Rs. 10000
10.84 - -
Particulars
-1.11 9889.30 - - - - 3.45 10720.00
-9.03 9099.31 - - - - 4.50 10946.30
-4.37 9564.51 - - - - 7.80 11667.10
Notes:1. Different plans shall have different expense structure. The performance details provided herein are of ICICI Prudential Value Fund - Series 16.2. The scheme is currently managed by Sankaran Naren and Prakash Gaurav Goel. Mr. Sankaran Naren has been managing this fund since August 2017. Total Schemes managed by the Fund Manager is 33 (33 are jointly managed). Refer annexure from page no. 109 for performance of other schemes currently managed by Sankaran Naren.Mr. Prakash Gaurav Goel has been managing this fund since October 2017. Total Schemes managed by the Fund Manager is 7 (7 are jointly managed). Refer annexure from page no. 109 for performance of other schemes currently managed by Prakash Gaurav Goel.3. Date of inception: 11-Aug-2017.4. As the Scheme has completed more than 1 year but less than 3 years, the performance details of only since inception and 1 year are provided herein.5. Past performance may or may not be sustained in future and the same may not necessarily provide the basis for comparison with other investment.6. Load is not considered for computation of returns.7. In case, the start/end date of the concerned period is a nonbusiness date (NBD), the NAV of the previous date is considered for computation of returns. The NAV per unit shown in the table is as on the start date of the said period8. The performance of the scheme is benchmarked to the Total Return variant of the Index.
Returns of ICICI Prudential Value Fund - Series 16 - Growth Option as on August 31, 2019 - (IPVF16)
Portfolio as on August 31, 2019

Style Box
Fund Managers** :
Indicative Investment Horizon : 1300 Days
Inception/Allotment date: 18-Sep-2017
SWP :Not Applicable
Min.Redemption Amt. :No redemption/repurchase of units shall be allowed prior to the maturity of the Scheme. Investors wishing to exit may do so by selling their units through stock exchanges. The Scheme shall be fully redeemed on the date of maturity and redemption proceeds shall be paid out within 10 business days, subject to availability of all relevant documents anddetails.
SIP :Not Applicable
NAV (As on 30-Aug-19):IPVF17 Growth Option : 10.24IPVF17 Dividend Option : 9.99IPVF17 Direct Plan Growth Option : 10.53IPVF17 Direct Plan Dividend Option : 10.28
Options : Cumulative and Dividend Option
Application Amount for freshSubscription :Rs.5,000 (plus in multiple of Rs.10)
Min.Addl.Investment :Not Applicable
Exit load for Redemption / Switchout :- Lumpsum Investment OptionNil
43
Fund Details
Diversified
Quantitative Indicators
Benchmark
Average P/E : 28.74 Average P/BV : 4.81 Average Dividend Yield : 2.03
S&P BSE 500 TRI
ICICI Prudential Value Fund - Series 17A Close ended equity scheme
RiskometerThis Product is suitable for investors who are seeking*:
*Investors should consult their financial advisers if in doubt about whether the product is suitable for them.
Monthly AAUM as on 31-Aug-19 : Rs. 188.98 crores
Closing AUM as on 31-Aug-19 : Rs. 189.79 crores
Entry load : Not Applicable
Annual Portfolio Turnover Ratio : Equity - 0.56 times, Others (Debt and Derivatives) - 2.55 times Combined Annual Portfolio Turnover Ratio : 3.11 times
Dividend History : Refer page no. from 132 to 140
SIP Returns : Refer page no. from 128 to 130
Total Expense Ratio @@ :
IPVF17 : 1.39% p. a.
IPVF17 Direct Plan : 0.98% p. a.
Investment Objective : Refer page no. from 141 to 145
Note : - “Portfolio Beta, Standard Deviation, R Squared, Sharpe Ratio and Tracking Error of the Scheme is not computed owing to the short ime frame since launch of the Scheme.”Portfolio turnover has been computed as the ratio of the lower value of purchase and sales, to the average net assets in the past one year (since inception for schemes that have not completed a year). The figures are not netted for derivative transactions.**In addition to the fund manager managing this fund, overseas investment is managed by Ms. Priyanka Khandelwal.@@ Total Expense Ratio is as on the last business day of the month.
Mr. Sankaran Naren (Managing this fund since September, 2017 & Overall 29Years of experience)
Mr Prakash Gaurav Goel(Managing this fund since October, 2017 & Overall 16 Years of experience)
• Top Ten HoldingsDerivatives are considered at exposure value.
• Long term wealth creation
• A close ended equity fund that aims to provide capital appreciation by investing in a well diversified portfolio of stocks through fundamental analysis.
Equity Shares 82.39% -5.95% Auto 1.48% -0.80% Maruti Suzuki India Ltd. 0.80% -0.80% TVS Motor Company Ltd. 0.69% Auto Ancillaries 0.89% Motherson Sumi Systems Ltd. 0.89% Banks 19.52% • ICICI Bank Ltd. 5.79% • HDFC Bank Ltd. 5.52% • Axis Bank Ltd. 4.49% • State Bank Of India 3.72% Cement 0.82% Orient Cement Ltd. 0.82% Chemicals 0.88% Bodal Chemicals Ltd. 0.62% Neogen Chemicals Limited 0.26% Construction 4.06% PNC Infratech Ltd. 2.17% Brigade Enterprises Ltd. 1.89% Construction Project 5.70% Larsen & Toubro Ltd. 2.92% Engineers India Ltd. 2.77% Consumer Durables 2.33% Titan Company Ltd. 2.33% Consumer Non Durables 10.97% • ITC Ltd. 4.31% • Asian Paints Ltd. 3.83% Nestle India Ltd. 2.33% Bajaj Consumer Care Ltd. 0.50% Finance 1.56% HDFC Ltd. 1.56%
Company/Issuer % to % to NAV NAV Derivatives
Minerals/Mining 0.97% Coal India Ltd. 0.97% Non - Ferrous Metals 1.47% Vedanta Ltd. 1.47% Oil 1.42% -1.39% Oil & Natural Gas Corporation Ltd. 1.42% -1.39% Pharmaceuticals 3.29% Sun Pharmaceutical Industries Ltd. 3.29% Power 14.01% • NTPC Ltd. 7.44% • NHPC Ltd. 3.81% CESC Ltd. 1.95% NLC India Ltd. 0.81% Software 10.56% • Infosys Ltd. 5.08% • HCL Technologies Ltd. 3.71% Cyient Ltd. 1.76% Telecom - Services 1.67% -1.36% Bharti Airtel Ltd. 1.67% -1.36% Transportation 0.78% Gateway Distriparks Ltd. 0.78% Index Futures/Options -2.40% Nifty 50 Index - Futures -2.40% Short Term Debt and net current assets 23.56% Total Net Assets 100.00%
Company/Issuer % to % to NAV NAV Derivatives
Portfolio as on August 31, 2019
Scheme
Nifty 50 TRI (Additional Benchmark)
NAV (Rs.) Per Unit (as on August 30,2019 : 10.24)
CAGR (%)
10.00
S&P BSE 500 TRI (Benchmark)
Since inception
CurrentValue of
Investment of Rs. 10000
CAGR (%) Current Value of
Investment of Rs. 10000
1 Year 3 Year 5 Year
CAGR (%) Current Value of
Investment of Rs. 10000
CAGR (%) Current Value of
Investment of Rs. 10000
10.17 - -
Particulars
0.69 10068.83 - - - - 1.22 10240.00
-9.03 9099.31 - - - - 1.49 10293.13
-4.37 9564.51 - - - - 5.75 11149.69
Notes:1. Different plans shall have different expense structure. The performance details provided herein are of ICICI Prudential Value Fund - Series 17.2. The scheme is currently managed by Sankaran Naren and Prakash Gaurav Goel. Mr. Sankaran Naren has been managing this fund since September 2017. Total Schemes managed by the Fund Manager is 33 (33 are jointly managed). Refer annexure from page no. 109 for performance of other schemes currently managed by Sankaran Naren.Mr. Prakash Gaurav Goel has been managing this fund since October 2017. Total Schemes managed by the Fund Manager is 7 (7 are jointly managed). Refer annexure from page no. 109 for performance of other schemes currently managed by Prakash Gaurav Goel.3. Date of inception: 18-Sep-2017.4. As the Scheme has completed more than 1 year but less than 3 years, the performance details of only since inception and 1 year are provided herein.5. Past performance may or may not be sustained in future and the same may not necessarily provide the basis for comparison with other investment.6. Load is not considered for computation of returns.7. In case, the start/end date of the concerned period is a nonbusiness date (NBD), the NAV of the previous date is considered for computation of returns. The NAV per unit shown in the table is as on the start date of the said period8. The performance of the scheme is benchmarked to the Total Return variant of the Index.
Returns of ICICI Prudential Value Fund - Series 17 - Growth Option as on August 31, 2019 - (IPVF17)

Style Box
Fund Managers** :
Indicative Investment Horizon : 1300 Days
Inception/Allotment date: 25-Oct-2017
SWP :Not Applicable
Min.Redemption Amt. :No redemption/repurchase of units shall be allowed prior to the maturity of the Scheme. Investors wishing to exit may do so by selling their units through stock exchanges. The Scheme shall be fully redeemed on the date of maturity and redemption proceeds shall be paid out within 10 business days, subject to availability of all relevant documents and details.
SIP :Not Applicable
NAV (As on 30-Aug-19):IPVF18 Growth Option : 11.27IPVF18 Dividend Option : 11.02IPVF18 Direct Plan Growth Option : 11.57IPVF18 Direct Plan Dividend Option : 11.29
Options : Cumulative and Dividend Option
Application Amount for freshSubscription :Rs.5,000 (plus in multiple of Rs.10)
Min.Addl.Investment :Not Applicable
Exit load for Redemption / Switchout :- Lumpsum Investment OptionNil
44
Fund Details
Diversified
Quantitative Indicators
Benchmark
Average P/E : 35.31 Average P/BV : 7.12 Average Dividend Yield : 1.15
S&P BSE 500 TRI
ICICI Prudential Value Fund - Series 18A Close ended equity scheme
RiskometerThis Product is suitable for investors who are seeking*:
*Investors should consult their financial advisers if in doubt about whether the product is suitable for them.
Monthly AAUM as on 31-Aug-19 : Rs. 132.56 crores
Closing AUM as on 31-Aug-19 : Rs. 133.51 crores
Entry load : Not Applicable
Annual Portfolio Turnover Ratio : Equity - 0.47 times, Others (Debt and Derivatives) - 3.10 times Combined Annual Portfolio Turnover Ratio : 3.57 times
Dividend History : Refer page no. from 132 to 140
SIP Returns : Refer page no. from 128 to 130
Total Expense Ratio @@ :
IPVF18 : 1.40% p. a.
IPVF18 Direct Plan : 1.03% p. a.
Investment Objective : Refer page no. from 141 to 145
Note : - “Portfolio Beta, Standard Deviation, R Squared, Sharpe Ratio and Tracking Error of the Scheme is not computed owing to the short ime frame since launch of the Scheme.”Portfolio turnover has been computed as the ratio of the lower value of purchase and sales, to the average net assets in the past one year (since inception for schemes that have not completed a year). The figures are not netted for derivative transactions.**In addition to the fund manager managing this fund, overseas investment is managed by Ms. Priyanka Khandelwal.@@ Total Expense Ratio is as on the last business day of the month.
Mr. Sankaran Naren (Managing this fund since October 2017 & Overall 29 Years of experience)Mr Prakash Gaurav Goel(Managing this fund since November, 2017& Overall 16 Years of experience)
• Top Ten HoldingsDerivatives are considered at exposure value.
• Long term wealth creation
• A close ended equity fund that aims to provide capital appreciation by investing in a well diversified portfolio of stocks through fundamental analysis.
Equity Shares 82.67% -12.47% Auto Ancillaries 3.24% Exide Industries Ltd. 2.06% Motherson Sumi Systems Ltd. 1.18% Banks 19.79% • ICICI Bank Ltd. 5.68% • HDFC Bank Ltd. 5.50% • Axis Bank Ltd. 4.97% State Bank Of India 2.43% Bank Of Baroda 0.79% The Jammu & Kashmir Bank Ltd. 0.42% Chemicals 5.06% -0.71%• Tata Chemicals Ltd. 4.13% -0.71% Bodal Chemicals Ltd. 0.93% Consumer Durables 0.80% Titan Company Ltd. 0.72% Orient Electric Ltd. 0.09% Consumer Non Durables 15.11% -3.94%• Asian Paints Ltd. 6.00% -1.82%• ITC Ltd. 4.60% Nestle India Ltd. 2.39% Hindustan Unilever Ltd. 2.11% -2.12% Finance 14.57% -4.03%• SBI Life Insurance Company Ltd. 6.33% Max Financial Services Ltd. 2.95% -2.97% HDFC Ltd. 2.17% -1.06% Sundaram Finance Ltd. 1.67% Jm Financial Ltd. 1.37% Sundaram Finance Holdings Ltd. 0.08% Pharmaceuticals 7.56% Sun Pharmaceutical Industries Ltd. 2.76%
Company/Issuer % to % to NAV NAV Derivatives
Portfolio as on August 31, 2019
Alembic Pharmaceuticals Ltd. 2.64% IPCA Laboratories Ltd. 2.16% Power 7.00% • NTPC Ltd. 4.49% CESC Ltd. 2.52% Software 9.20% -1.62%• Infosys Ltd. 4.89% • HCL Technologies Ltd. 3.21% -1.62% Tech Mahindra Ltd. 0.88% Hexaware Technologies Ltd. 0.23% Telecom - Services 0.34% Bharti Airtel Ltd. 0.34% Index Futures/Options -2.17% Nifty 50 Index - Futures -2.17% Short Term Debt and net current assets 29.80% Total Net Assets 100.00%
Company/Issuer % to % to NAV NAV Derivatives
Returns of ICICI Prudential Value Fund - Series 18 - Growth Option as on August 31, 2019 - (IPVF18)
Scheme
Nifty 50 TRI (Additional Benchmark)
NAV (Rs.) Per Unit (as on August 30,2019 : 11.27)
CAGR (%)
10.00
S&P BSE 500 TRI (Benchmark)
Since inception
CurrentValue of
Investment of Rs. 10000
CAGR (%) Current Value of
Investment of Rs. 10000
1 Year 3 Year 5 Year
CAGR (%) Current Value of
Investment of Rs. 10000
CAGR (%) Current Value of
Investment of Rs. 10000
10.73 - -
Particulars
5.05 10503.26 - - - - 6.69 11270.00
-9.03 9099.31 - - - - 0.86 10159.12
-4.37 9564.51 - - - - 5.27 10994.01
Notes:1. Different plans shall have different expense structure. The performance details provided herein are of ICICI Prudential Value Fund - Series 18.2. The scheme is currently managed by Sankaran Naren and Prakash Gaurav Goel. Mr. Sankaran Naren has been managing this fund since October 2017. Total Schemes managed by the Fund Manager is 33 (33 are jointly managed). Refer annexure from page no. 109 for performance of other schemes currently managed by Sankaran Naren.Mr. Prakash Gaurav Goel has been managing this fund since November 2017. Total Schemes managed by the Fund Manager is 7 (7 are jointly managed). Refer annexure from page no. 109 for performance of other schemes currently managed by Prakash Gaurav Goel.3. Date of inception: 25-Oct-2017.4. As the Scheme has completed more than 1 year but less than 3 years, the performance details of only since inception and 1 year are provided herein.5. Past performance may or may not be sustained in future and the same may not necessarily provide the basis for comparison with other investment.6. Load is not considered for computation of returns.7. In case, the start/end date of the concerned period is a nonbusiness date (NBD), the NAV of the previous date is considered for computation of returns. The NAV per unit shown in the table is as on the start date of the said period8. The performance of the scheme is benchmarked to the Total Return variant of the Index.
Rating Rating
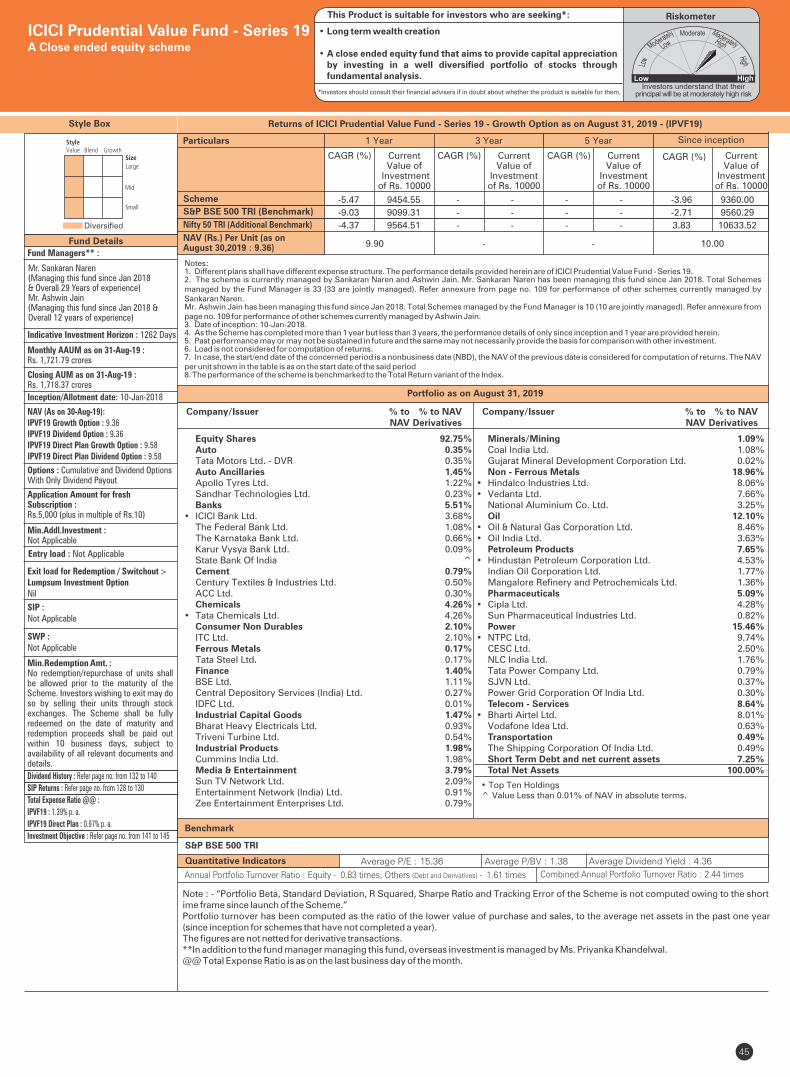
Style Box
Fund Managers** :
Indicative Investment Horizon : 1262 Days
Inception/Allotment date: 10-Jan-2018
SWP :Not Applicable
Min.Redemption Amt. :No redemption/repurchase of units shall be allowed prior to the maturity of the Scheme. Investors wishing to exit may do so by selling their units through stock exchanges. The Scheme shall be fully redeemed on the date of maturity and redemption proceeds shall be paid out within 10 business days, subject to availability of all relevant documents and details.
SIP :Not Applicable
NAV (As on 30-Aug-19):IPVF19 Growth Option : 9.36IPVF19 Dividend Option : 9.36IPVF19 Direct Plan Growth Option : 9.58IPVF19 Direct Plan Dividend Option : 9.58
Options : Cumulative and Dividend Options With Only Dividend Payout
Application Amount for freshSubscription :Rs.5,000 (plus in multiple of Rs.10)
Min.Addl.Investment :Not Applicable
Exit load for Redemption / Switchout :- Lumpsum Investment OptionNil
45
Fund Details
Diversified
Quantitative Indicators
Benchmark
Average P/E : 15.36 Average P/BV : 1.38 Average Dividend Yield : 4.36
S&P BSE 500 TRI
ICICI Prudential Value Fund - Series 19A Close ended equity scheme
RiskometerThis Product is suitable for investors who are seeking*:
*Investors should consult their financial advisers if in doubt about whether the product is suitable for them.
Monthly AAUM as on 31-Aug-19 : Rs. 1,721.79 crores
Closing AUM as on 31-Aug-19 : Rs. 1,718.37 crores
Entry load : Not Applicable
Annual Portfolio Turnover Ratio : Equity - 0.83 times, Others (Debt and Derivatives) - 1.61 times Combined Annual Portfolio Turnover Ratio : 2.44 times
Dividend History : Refer page no. from 132 to 140
SIP Returns : Refer page no. from 128 to 130
Total Expense Ratio @@ :
IPVF19 : 1.39% p. a.
IPVF19 Direct Plan : 0.97% p. a.
Investment Objective : Refer page no. from 141 to 145
Note : - “Portfolio Beta, Standard Deviation, R Squared, Sharpe Ratio and Tracking Error of the Scheme is not computed owing to the short ime frame since launch of the Scheme.”Portfolio turnover has been computed as the ratio of the lower value of purchase and sales, to the average net assets in the past one year (since inception for schemes that have not completed a year). The figures are not netted for derivative transactions.**In addition to the fund manager managing this fund, overseas investment is managed by Ms. Priyanka Khandelwal.@@ Total Expense Ratio is as on the last business day of the month.
Mr. Sankaran Naren (Managing this fund since Jan 2018 & Overall 29 Years of experience)Mr. Ashwin Jain (Managing this fund since Jan 2018 & Overall 12 years of experience)
• Top Ten Holdings^ Value Less than 0.01% of NAV in absolute terms.
• Long term wealth creation
• A close ended equity fund that aims to provide capital appreciation by investing in a well diversified portfolio of stocks through fundamental analysis.
Equity Shares 92.75% Auto 0.35% Tata Motors Ltd. - DVR 0.35% Auto Ancillaries 1.45% Apollo Tyres Ltd. 1.22% Sandhar Technologies Ltd. 0.23% Banks 5.51%• ICICI Bank Ltd. 3.68% The Federal Bank Ltd. 1.08% The Karnataka Bank Ltd. 0.66% Karur Vysya Bank Ltd. 0.09% State Bank Of India ^ Cement 0.79% Century Textiles & Industries Ltd. 0.50% ACC Ltd. 0.30% Chemicals 4.26%• Tata Chemicals Ltd. 4.26% Consumer Non Durables 2.10% ITC Ltd. 2.10% Ferrous Metals 0.17% Tata Steel Ltd. 0.17% Finance 1.40% BSE Ltd. 1.11% Central Depository Services (India) Ltd. 0.27% IDFC Ltd. 0.01% Industrial Capital Goods 1.47% Bharat Heavy Electricals Ltd. 0.93% Triveni Turbine Ltd. 0.54% Industrial Products 1.98% Cummins India Ltd. 1.98% Media & Entertainment 3.79% Sun TV Network Ltd. 2.09% Entertainment Network (India) Ltd. 0.91% Zee Entertainment Enterprises Ltd. 0.79%
Company/Issuer % to % to NAV NAV Derivatives
Company/Issuer % to % to NAV NAV Derivatives
Minerals/Mining 1.09% Coal India Ltd. 1.08% Gujarat Mineral Development Corporation Ltd. 0.02% Non - Ferrous Metals 18.96%• Hindalco Industries Ltd. 8.06%• Vedanta Ltd. 7.66% National Aluminium Co. Ltd. 3.25% Oil 12.10%• Oil & Natural Gas Corporation Ltd. 8.46%• Oil India Ltd. 3.63% Petroleum Products 7.65%• Hindustan Petroleum Corporation Ltd. 4.53% Indian Oil Corporation Ltd. 1.77% Mangalore Refinery and Petrochemicals Ltd. 1.36% Pharmaceuticals 5.09%• Cipla Ltd. 4.28% Sun Pharmaceutical Industries Ltd. 0.82% Power 15.46%• NTPC Ltd. 9.74% CESC Ltd. 2.50% NLC India Ltd. 1.76% Tata Power Company Ltd. 0.79% SJVN Ltd. 0.37% Power Grid Corporation Of India Ltd. 0.30% Telecom - Services 8.64%• Bharti Airtel Ltd. 8.01% Vodafone Idea Ltd. 0.63% Transportation 0.49% The Shipping Corporation Of India Ltd. 0.49% Short Term Debt and net current assets 7.25% Total Net Assets 100.00%
Portfolio as on August 31, 2019
Returns of ICICI Prudential Value Fund - Series 19 - Growth Option as on August 31, 2019 - (IPVF19)
Scheme
Nifty 50 TRI (Additional Benchmark)
NAV (Rs.) Per Unit (as on August 30,2019 : 9.36)
CAGR (%)
10.00
S&P BSE 500 TRI (Benchmark)
Since inception
CurrentValue of
Investment of Rs. 10000
CAGR (%) Current Value of
Investment of Rs. 10000
1 Year 3 Year 5 Year
CAGR (%) Current Value of
Investment of Rs. 10000
CAGR (%) Current Value of
Investment of Rs. 10000
9.90 - -
Particulars
-5.47 9454.55 - - - - -3.96 9360.00
-9.03 9099.31 - - - - -2.71 9560.29
-4.37 9564.51 - - - - 3.83 10633.52
Notes:1. Different plans shall have different expense structure. The performance details provided herein are of ICICI Prudential Value Fund - Series 19.2. The scheme is currently managed by Sankaran Naren and Ashwin Jain. Mr. Sankaran Naren has been managing this fund since Jan 2018. Total Schemes managed by the Fund Manager is 33 (33 are jointly managed). Refer annexure from page no. 109 for performance of other schemes currently managed by Sankaran Naren.Mr. Ashwin Jain has been managing this fund since Jan 2018. Total Schemes managed by the Fund Manager is 10 (10 are jointly managed). Refer annexure from page no. 109 for performance of other schemes currently managed by Ashwin Jain.3. Date of inception: 10-Jan-2018.4. As the Scheme has completed more than 1 year but less than 3 years, the performance details of only since inception and 1 year are provided herein.5. Past performance may or may not be sustained in future and the same may not necessarily provide the basis for comparison with other investment.6. Load is not considered for computation of returns.7. In case, the start/end date of the concerned period is a nonbusiness date (NBD), the NAV of the previous date is considered for computation of returns. The NAV per unit shown in the table is as on the start date of the said period8. The performance of the scheme is benchmarked to the Total Return variant of the Index.
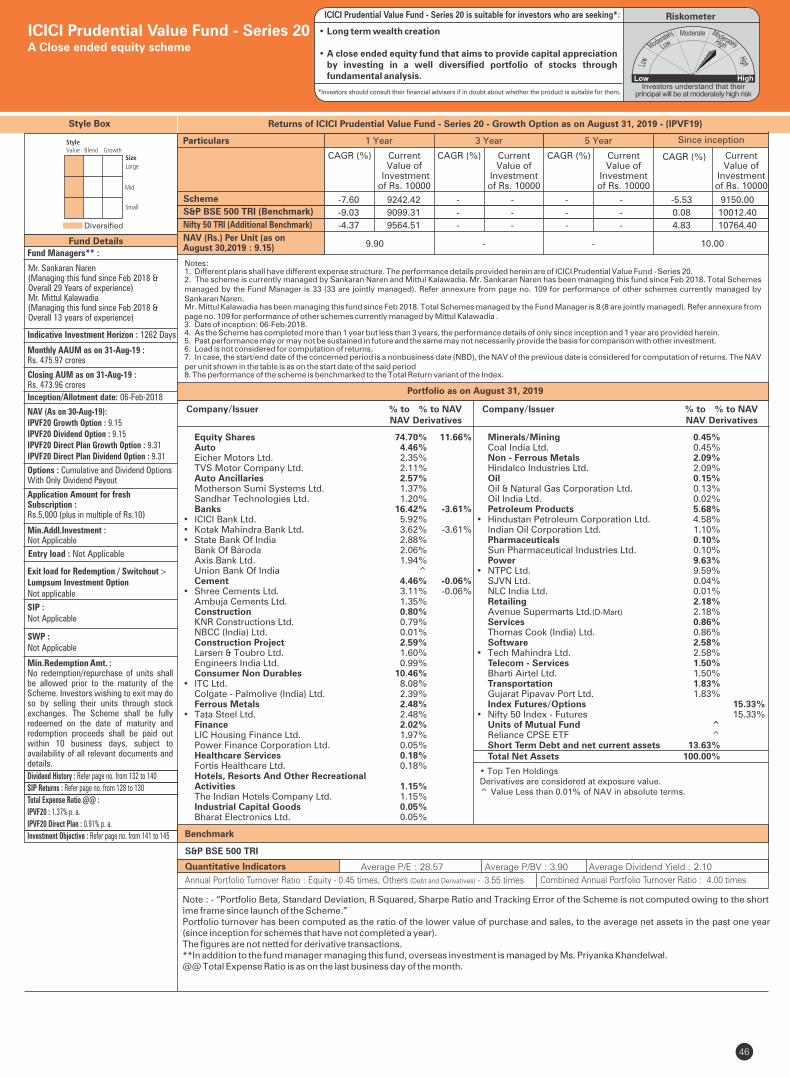
Style Box
Fund Managers** :
Indicative Investment Horizon : 1262 Days
Inception/Allotment date: 06-Feb-2018
SWP :Not Applicable
Min.Redemption Amt. :No redemption/repurchase of units shall be allowed prior to the maturity of the Scheme. Investors wishing to exit may do so by selling their units through stock exchanges. The Scheme shall be fully redeemed on the date of maturity and redemption proceeds shall be paid out within 10 business days, subject to availability of all relevant documents and details.
SIP :Not Applicable
NAV (As on 30-Aug-19):IPVF20 Growth Option : 9.15IPVF20 Dividend Option : 9.15IPVF20 Direct Plan Growth Option : 9.31IPVF20 Direct Plan Dividend Option : 9.31
Options : Cumulative and Dividend Options With Only Dividend Payout
Application Amount for freshSubscription :Rs.5,000 (plus in multiple of Rs.10)
Min.Addl.Investment :Not Applicable
Exit load for Redemption / Switchout :- Lumpsum Investment OptionNot applicable
46
Fund Details
Diversified
Quantitative Indicators
Benchmark
Average P/E : 28.57 Average P/BV : 3.90 Average Dividend Yield : 2.10
S&P BSE 500 TRI
ICICI Prudential Value Fund - Series 20A Close ended equity scheme
RiskometerICICI Prudential Value Fund - Series 20 is suitable for investors who are seeking*:
*Investors should consult their financial advisers if in doubt about whether the product is suitable for them.
Monthly AAUM as on 31-Aug-19 : Rs. 475.97 crores
Closing AUM as on 31-Aug-19 : Rs. 473.96 crores
Entry load : Not Applicable
Annual Portfolio Turnover Ratio : Equity - 0.45 times, Others (Debt and Derivatives) - 3.55 times Combined Annual Portfolio Turnover Ratio : 4.00 times
Dividend History : Refer page no. from 132 to 140
SIP Returns : Refer page no. from 128 to 130
Total Expense Ratio @@ :
IPVF20 : 1.37% p. a.
IPVF20 Direct Plan : 0.91% p. a.
Investment Objective : Refer page no. from 141 to 145
Note : - “Portfolio Beta, Standard Deviation, R Squared, Sharpe Ratio and Tracking Error of the Scheme is not computed owing to the short ime frame since launch of the Scheme.”Portfolio turnover has been computed as the ratio of the lower value of purchase and sales, to the average net assets in the past one year (since inception for schemes that have not completed a year). The figures are not netted for derivative transactions.**In addition to the fund manager managing this fund, overseas investment is managed by Ms. Priyanka Khandelwal.@@ Total Expense Ratio is as on the last business day of the month.
Mr. Sankaran Naren (Managing this fund since Feb 2018 & Overall 29 Years of experience)Mr. Mittul Kalawadia (Managing this fund since Feb 2018 & Overall 13 years of experience)
• Top Ten HoldingsDerivatives are considered at exposure value.^ Value Less than 0.01% of NAV in absolute terms.
• Long term wealth creation
• A close ended equity fund that aims to provide capital appreciation by investing in a well diversified portfolio of stocks through fundamental analysis.
Equity Shares 74.70% 11.66% Auto 4.46% Eicher Motors Ltd. 2.35% TVS Motor Company Ltd. 2.11% Auto Ancillaries 2.57% Motherson Sumi Systems Ltd. 1.37% Sandhar Technologies Ltd. 1.20% Banks 16.42% -3.61%• ICICI Bank Ltd. 5.92% • Kotak Mahindra Bank Ltd. 3.62% -3.61%• State Bank Of India 2.88% Bank Of Baroda 2.06% Axis Bank Ltd. 1.94% Union Bank Of India ^ Cement 4.46% -0.06%• Shree Cements Ltd. 3.11% -0.06% Ambuja Cements Ltd. 1.35% Construction 0.80% KNR Constructions Ltd. 0.79% NBCC (India) Ltd. 0.01% Construction Project 2.59% Larsen & Toubro Ltd. 1.60% Engineers India Ltd. 0.99% Consumer Non Durables 10.46% • ITC Ltd. 8.08% Colgate - Palmolive (India) Ltd. 2.39% Ferrous Metals 2.48% • Tata Steel Ltd. 2.48% Finance 2.02% LIC Housing Finance Ltd. 1.97% Power Finance Corporation Ltd. 0.05% Healthcare Services 0.18% Fortis Healthcare Ltd. 0.18% Hotels, Resorts And Other Recreational Activities 1.15% The Indian Hotels Company Ltd. 1.15% Industrial Capital Goods 0.05% Bharat Electronics Ltd. 0.05%
Company/Issuer % to % to NAV NAV Derivatives
Company/Issuer % to % to NAV NAV Derivatives
Minerals/Mining 0.45% Coal India Ltd. 0.45% Non - Ferrous Metals 2.09% Hindalco Industries Ltd. 2.09% Oil 0.15% Oil & Natural Gas Corporation Ltd. 0.13% Oil India Ltd. 0.02% Petroleum Products 5.68% • Hindustan Petroleum Corporation Ltd. 4.58% Indian Oil Corporation Ltd. 1.10% Pharmaceuticals 0.10% Sun Pharmaceutical Industries Ltd. 0.10% Power 9.63% • NTPC Ltd. 9.59% SJVN Ltd. 0.04% NLC India Ltd. 0.01% Retailing 2.18% Avenue Supermarts Ltd.(D-Mart) 2.18% Services 0.86% Thomas Cook (India) Ltd. 0.86% Software 2.58% • Tech Mahindra Ltd. 2.58% Telecom - Services 1.50% Bharti Airtel Ltd. 1.50% Transportation 1.83% Gujarat Pipavav Port Ltd. 1.83% Index Futures/Options 15.33%• Nifty 50 Index - Futures 15.33% Units of Mutual Fund ^ Reliance CPSE ETF ^ Short Term Debt and net current assets 13.63% Total Net Assets 100.00%
Returns of ICICI Prudential Value Fund - Series 20 - Growth Option as on August 31, 2019 - (IPVF19)
Scheme
Nifty 50 TRI (Additional Benchmark)
NAV (Rs.) Per Unit (as on August 30,2019 : 9.15)
CAGR (%)
10.00
S&P BSE 500 TRI (Benchmark)
Since inception
CurrentValue of
Investment of Rs. 10000
CAGR (%) Current Value of
Investment of Rs. 10000
1 Year 3 Year 5 Year
CAGR (%) Current Value of
Investment of Rs. 10000
CAGR (%) Current Value of
Investment of Rs. 10000
9.90 - -
Particulars
-7.60 9242.42 - - - - -5.53 9150.00
-9.03 9099.31 - - - - 0.08 10012.40
-4.37 9564.51 - - - - 4.83 10764.40
Notes:1. Different plans shall have different expense structure. The performance details provided herein are of ICICI Prudential Value Fund - Series 20.2. The scheme is currently managed by Sankaran Naren and Mittul Kalawadia. Mr. Sankaran Naren has been managing this fund since Feb 2018. Total Schemes managed by the Fund Manager 33 (33 are jointly managed). Refer annexure from page no. 109 for performance of other schemes currently managed by is Sankaran Naren.Mr. Mittul Kalawadia has been managing this fund since Feb 2018. Total Schemes managed by the Fund Manager is are jointly managed). Refer annexure from 8 (8page no. 109 for performance of other schemes currently managed by Mittul Kalawadia .3. Date of inception: 06-Feb-2018.4. As the Scheme has completed more than 1 year but less than 3 years, the performance details of only since inception and 1 year are provided herein.5. Past performance may or may not be sustained in future and the same may not necessarily provide the basis for comparison with other investment.6. Load is not considered for computation of returns.7. In case, the start/end date of the concerned period is a nonbusiness date (NBD), the NAV of the previous date is considered for computation of returns. The NAV per unit shown in the table is as on the start date of the said period8. The performance of the scheme is benchmarked to the Total Return variant of the Index.
Portfolio as on August 31, 2019

Style Box
Fund Managers** :
Indicative Investment Horizon : 1300 Days
Inception/Allotment date: 11-April-2018
SWP :Not Applicable
Min.Redemption Amt. :No redemption/repurchase of units shall be allowed prior to the maturity of the Scheme. Investors wishing to exit may do so by selling their units through stock exchanges. The Scheme shall be fully redeemed on the date of maturity and redemption proceeds shall be paid out within 10 business days, subject to availability of all relevant documents and details.
SIP :Not Applicable
NAV (As on 30-Aug-19):IPBCF1 Growth Option : 9.79IPBCF1 Dividend Option : 9.79IPBCF1 Direct Plan Growth Option : 9.97IPBCF1 Direct Plan Dividend Option : 9.97
Options : Cumulative and Dividend Options With Dividend Payout and Dividend Transfer Plan Facilities.
Application Amount for freshSubscription :Rs.5000 (plus in multiple of Rs.10 thereafter)The minimum application amount applies to switch also.
Min.Addl.Investment :Not Applicable
Exit load for Redemption / Switchout :- Lumpsum Investment OptionNot applicable
47
Fund Details
Concentrated
Quantitative Indicators
Benchmark
Average P/E : 41.59 Average P/BV : 10.78 Average Dividend Yield : 1.21
Nifty India Consumption TRI.
ICICI Prudential Bharat Consumption Fund - Series 1A Close ended equity scheme following Consumption Theme
Monthly AAUM as on 31-Aug-19 : Rs. 896.76 crores
Closing AUM as on 31-Aug-19 : Rs. 900.08 crores
Entry load : Not Applicable
Annual Portfolio Turnover Ratio : Equity - 0.40 times, Others (Debt and Derivatives) - 3.10 times Combined Annual Portfolio Turnover Ratio : 3.50 times
Dividend History : Refer page no. from 132 to 140
SIP Returns : Refer page no. from 128 to 130
Total Expense Ratio @@ :
IPBCOF1 : 1.39% p. a.
IPBCOF1 Direct Plan : 0.97% p. a.
Investment Objective : Refer page no. from 141 to 145Note : - “Portfolio Beta, Standard Deviation, R Squared, Sharpe Ratio and Tracking Error of the Scheme is not computed owing to the short ime frame since launch of the Scheme.”Portfolio turnover has been computed as the ratio of the lower value of purchase and sales, to the average net assets in the past one year (since inception for schemes that have not completed a year). The figures are not netted for derivative transactions.**In addition to the fund manager managing this fund, overseas investment is managed by Ms. Priyanka Khandelwal.@@ Total Expense Ratio is as on the last business day of the month.
Mr. Sankaran Naren (Managing this fund since Apr 2018 & Overall 29 Years of experience)Mr. Atul Patel (Managing this fund since Apr 2018 & Overall 10 Years of experience)
• Top Ten HoldingsDerivatives are considered at exposure value.
Equity Shares 89.83% -6.16% Auto 7.57% • TVS Motor Company Ltd. 4.13% Maruti Suzuki India Ltd. 1.79% Eicher Motors Ltd. 1.34% Mahindra & Mahindra Ltd. 0.32% Auto Ancillaries 5.54% • Motherson Sumi Systems Ltd. 4.25% Sandhar Technologies Ltd. 0.92% Minda Industries Ltd. 0.37% Banks 8.54% • State Bank Of India 5.70% Axis Bank Ltd. 1.48% ICICI Bank Ltd. 1.37% Consumer Durables 10.27% -2.69%• Titan Company Ltd. 6.21% -2.69% Voltas Ltd. 2.48% Blue Star Ltd. 1.59% Consumer Non Durables 36.36% • Asian Paints Ltd. 8.50% • ITC Ltd. 7.91% • Hindustan Unilever Ltd. 5.47% • Britannia Industries Ltd. 4.67% Marico Ltd. 3.65% Dabur India Ltd. 3.59% Nestle India Ltd. 1.14% Berger Paints India Ltd. 0.82% Bajaj Consumer Care Ltd. 0.60% Hotels, Resorts And Other Recreational Activities 1.67% EIH Ltd. 1.05% The Indian Hotels Company Ltd. 0.62%
Company/Issuer % to % to NAV NAV Derivatives
Rating
RiskometerThis Product is suitable for investors who are seeking*:
• Long term wealth creation
• An close ended equity scheme that aims to provide capital appreciation by investing in a well-diversified portfolio of stocks that could benefit from growth in consumption and related activities.
*Investors should consult their financial advisers if in doubt about whether the product is suitable for them.
Portfolio as on August 31, 2019
Company/Issuer % to % to NAV NAV Derivatives
Rating
Media & Entertainment 1.50% Entertainment Network (India) Ltd. 1.00% Zee Entertainment Enterprises Ltd. 0.50% Pharmaceuticals 4.22% Cipla Ltd. 1.78% Dishman Carbogen Amcis Ltd. 1.44% Cadila Healthcare Ltd. 1.00% Power 7.21% • NTPC Ltd. 6.71% Tata Power Company Ltd. 0.50% Telecom - Services 6.55% -3.47%• Bharti Airtel Ltd. 6.55% -3.47% Textile Products 0.40% Page Industries Ltd. 0.40% Corporate Securities 0.05% Britannia Industries Ltd. CRISIL AAA 0.05% Short Term Debt and net current assets 16.28% Total Net Assets 100.00%
Scheme
Nifty 50 TRI Index (Additional Benchmark)
NAV (Rs.) Per Unit (as on August 30,2019 : 9.79)
CAGR (%)
10.00
Nifty India Consumption TRI Index (Benchmark)
Since inception
CurrentValue of
Investment of Rs. 10000
CAGR (%) Current Value of
Investment of Rs. 10000
1 Year 3 Year 5 Year
CAGR (%) Current Value of
Investment of Rs. 10000
CAGR (%) Current Value of
Investment of Rs. 10000
10.32 - -
Particulars
-5.15 9486.43 - - - - -1.52 9790.00
-12.07 8795.98 - - - - -2.05 9716.59
-4.37 9564.51 - - - - 5.79 10811.44
Notes:1. Different plans shall have different expense structure. The performance details provided herein are of ICICI Prudential Bharat Consumption Fund - Series 1.2. The scheme is currently managed by Sankaran Naren and Atul Patel. Mr. Sankaran Naren has been managing this fund since April 2018. Total Schemes managed by the Fund Manager is 33 (33 are jointly managed). Refer annexure from page no. 109 for performance of other schemes currently managed by Sankaran Naren.Mr. Atul Patel has been managing this fund since April 2018. Total Schemes managed by the Fund Manager is 8 (6 are jointly managed). Refer annexure from page no. 109 for performance of other schemes currently managed by Atul Patel.3. Date of inception: 11-April-18.4. Performance of dividend option would be Net of Dividend distribution tax, if any.5. As the Scheme has completed more than 1 year but less than 3 years, the performance details of only since inception and 1 year are provided herein.6. Past performance may or may not be sustained in future and the same may not necessarily provide the basis for comparison with other investment.7. Load is not considered for computation of returns.8. In case, the start/end date of the concerned period is a nonbusiness date (NBD), the NAV of the previous date is considered for computation of returns. The NAV per unit shown in the table is as on the start date of the said period9. NAV is adjusted to the extent of dividend declared for computation of returns.10. The performance of the scheme is benchmarked to the Total Return variant of the Index.
ICICI Prudential Bharat Consumption Fund - Series 1 - Dividend Option as on August 31, 2019 - (IPBCF1)
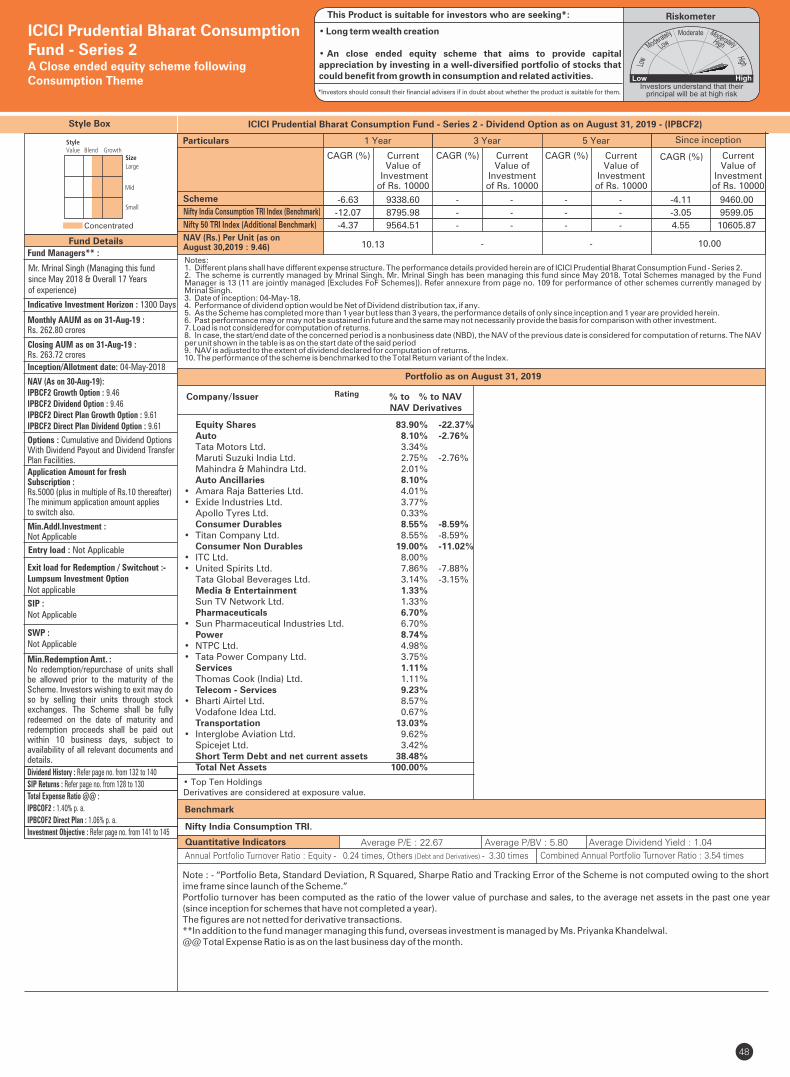
Style Box
Fund Managers** :
Indicative Investment Horizon : 1300 Days
Inception/Allotment date: 04-May-2018
SWP :Not Applicable
Min.Redemption Amt. :No redemption/repurchase of units shall be allowed prior to the maturity of the Scheme. Investors wishing to exit may do so by selling their units through stock exchanges. The Scheme shall be fully redeemed on the date of maturity and redemption proceeds shall be paid out within 10 business days, subject to availability of all relevant documents and details.
SIP :Not Applicable
NAV (As on 30-Aug-19):IPBCF2 Growth Option : 9.46IPBCF2 Dividend Option : 9.46IPBCF2 Direct Plan Growth Option : 9.61IPBCF2 Direct Plan Dividend Option : 9.61
Options : Cumulative and Dividend Options With Dividend Payout and Dividend Transfer Plan Facilities.
Application Amount for freshSubscription :Rs.5000 (plus in multiple of Rs.10 thereafter)The minimum application amount applies to switch also.
Min.Addl.Investment :Not Applicable
Exit load for Redemption / Switchout :- Lumpsum Investment OptionNot applicable
48
Fund Details
Concentrated
Quantitative Indicators
Benchmark
Average P/E : 22.67 Average P/BV : 5.80 Average Dividend Yield : 1.04
Nifty India Consumption TRI.
ICICI Prudential Bharat Consumption Fund - Series 2A Close ended equity scheme following Consumption Theme
Monthly AAUM as on 31-Aug-19 : Rs. 262.80 crores
Closing AUM as on 31-Aug-19 : Rs. 263.72 crores
Entry load : Not Applicable
Annual Portfolio Turnover Ratio : Equity - 0.24 times, Others (Debt and Derivatives) - 3.30 times Combined Annual Portfolio Turnover Ratio : 3.54 times
Dividend History : Refer page no. from 132 to 140
SIP Returns : Refer page no. from 128 to 130
Total Expense Ratio @@ :
IPBCOF2 : 1.40% p. a.
IPBCOF2 Direct Plan : 1.06% p. a.
Investment Objective : Refer page no. from 141 to 145
Note : - “Portfolio Beta, Standard Deviation, R Squared, Sharpe Ratio and Tracking Error of the Scheme is not computed owing to the short ime frame since launch of the Scheme.”Portfolio turnover has been computed as the ratio of the lower value of purchase and sales, to the average net assets in the past one year (since inception for schemes that have not completed a year). The figures are not netted for derivative transactions.**In addition to the fund manager managing this fund, overseas investment is managed by Ms. Priyanka Khandelwal.@@ Total Expense Ratio is as on the last business day of the month.
Mr. Mrinal Singh (Managing this fund since May 2018 & Overall 17 Years of experience)
• Top Ten HoldingsDerivatives are considered at exposure value.
Equity Shares 83.90% -22.37% Auto 8.10% -2.76% Tata Motors Ltd. 3.34% Maruti Suzuki India Ltd. 2.75% -2.76% Mahindra & Mahindra Ltd. 2.01% Auto Ancillaries 8.10% • Amara Raja Batteries Ltd. 4.01% • Exide Industries Ltd. 3.77% Apollo Tyres Ltd. 0.33% Consumer Durables 8.55% -8.59%• Titan Company Ltd. 8.55% -8.59% Consumer Non Durables 19.00% -11.02%• ITC Ltd. 8.00% • United Spirits Ltd. 7.86% -7.88% Tata Global Beverages Ltd. 3.14% -3.15% Media & Entertainment 1.33% Sun TV Network Ltd. 1.33% Pharmaceuticals 6.70% • Sun Pharmaceutical Industries Ltd. 6.70% Power 8.74% • NTPC Ltd. 4.98% • Tata Power Company Ltd. 3.75% Services 1.11% Thomas Cook (India) Ltd. 1.11% Telecom - Services 9.23% • Bharti Airtel Ltd. 8.57% Vodafone Idea Ltd. 0.67% Transportation 13.03% • Interglobe Aviation Ltd. 9.62% Spicejet Ltd. 3.42% Short Term Debt and net current assets 38.48% Total Net Assets 100.00%
Company/Issuer % to % to NAV NAV Derivatives
RiskometerThis Product is suitable for investors who are seeking*:
• Long term wealth creation
• An close ended equity scheme that aims to provide capital appreciation by investing in a well-diversified portfolio of stocks that could benefit from growth in consumption and related activities.
*Investors should consult their financial advisers if in doubt about whether the product is suitable for them.
Rating
Portfolio as on August 31, 2019
Scheme
Nifty 50 TRI Index (Additional Benchmark)
NAV (Rs.) Per Unit (as on August 30,2019 : 9.46)
CAGR (%)
10.00
Nifty India Consumption TRI Index (Benchmark)
Since inception
CurrentValue of
Investment of Rs. 10000
CAGR (%) Current Value of
Investment of Rs. 10000
1 Year 3 Year 5 Year
CAGR (%) Current Value of
Investment of Rs. 10000
CAGR (%) Current Value of
Investment of Rs. 10000
10.13 - -
Particulars
-6.63 9338.60 - - - - -4.11 9460.00
-12.07 8795.98 - - - - -3.05 9599.05
-4.37 9564.51 - - - - 4.55 10605.87
Notes:1. Different plans shall have different expense structure. The performance details provided herein are of ICICI Prudential Bharat Consumption Fund - Series 2.2. The scheme is currently managed by Mrinal Singh. Mr. Mrinal Singh has been managing this fund since . Total Schemes managed by the Fund May 2018Manager . Refer annexure from page no. 109 for performance of other schemes currently managed by is 13 (11 are jointly managed [Excludes FoF Schemes])Mrinal Singh.3. Date of inception: 04-May-18.4. Performance of dividend option would be Net of Dividend distribution tax, if any.5. As the Scheme has completed more than 1 year but less than 3 years, the performance details of only since inception and 1 year are provided herein.6. Past performance may or may not be sustained in future and the same may not necessarily provide the basis for comparison with other investment.7. Load is not considered for computation of returns.8. In case, the start/end date of the concerned period is a nonbusiness date (NBD), the NAV of the previous date is considered for computation of returns. The NAV per unit shown in the table is as on the start date of the said period9. NAV is adjusted to the extent of dividend declared for computation of returns.10. The performance of the scheme is benchmarked to the Total Return variant of the Index.
ICICI Prudential Bharat Consumption Fund - Series 2 - Dividend Option as on August 31, 2019 - (IPBCF2)
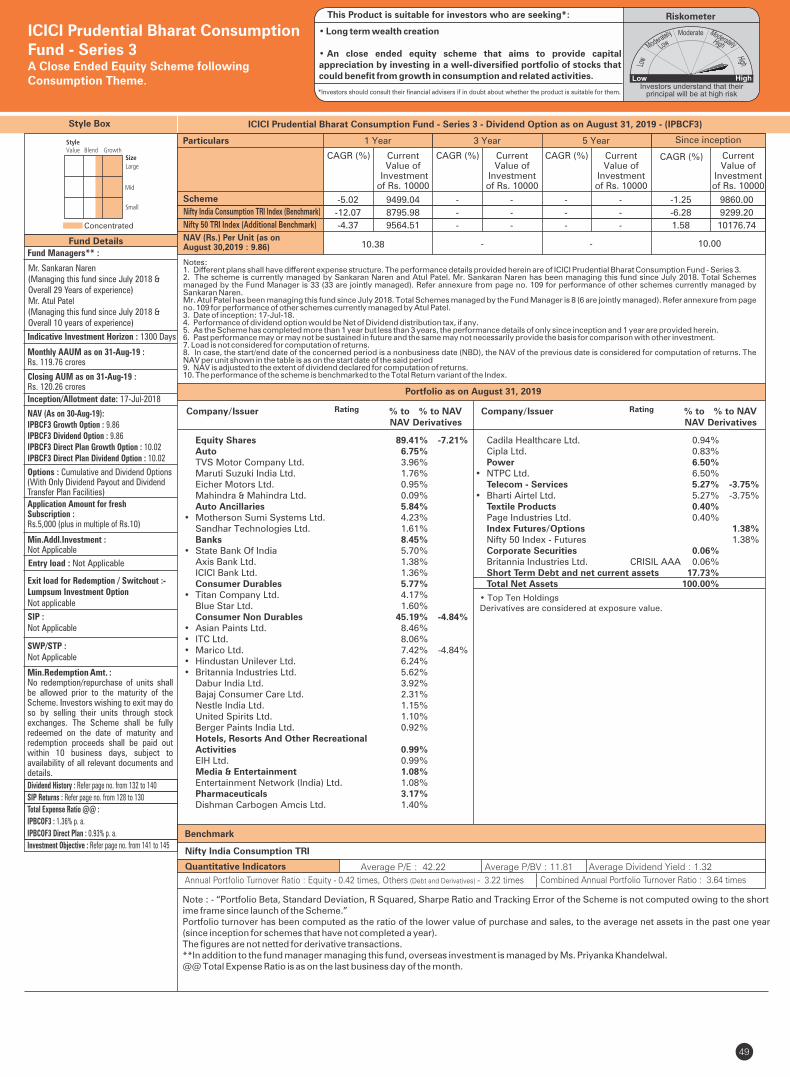
Style Box
Fund Managers** :
Indicative Investment Horizon : 1300 Days
Inception/Allotment date: 17-Jul-2018
SWP/STP :Not Applicable
Min.Redemption Amt. :No redemption/repurchase of units shall be allowed prior to the maturity of the Scheme. Investors wishing to exit may do so by selling their units through stock exchanges. The Scheme shall be fully redeemed on the date of maturity and redemption proceeds shall be paid out within 10 business days, subject to availability of all relevant documents and details.
SIP :Not Applicable
NAV (As on 30-Aug-19):IPBCF3 Growth Option : 9.86IPBCF3 Dividend Option : 9.86IPBCF3 Direct Plan Growth Option : 10.02IPBCF3 Direct Plan Dividend Option : 10.02
Options : Cumulative and Dividend Options(With Only Dividend Payout and Dividend Transfer Plan Facilities)
Application Amount for freshSubscription :Rs.5,000 (plus in multiple of Rs.10)
Min.Addl.Investment :Not Applicable
Exit load for Redemption / Switchout :- Lumpsum Investment OptionNot applicable
49
Fund Details
Concentrated
Quantitative Indicators
Benchmark
Average P/E : 42.22 Average P/BV : 11.81 Average Dividend Yield : 1.32
Nifty India Consumption TRI
ICICI Prudential Bharat Consumption Fund - Series 3A Close Ended Equity Scheme following Consumption Theme.
Monthly AAUM as on 31-Aug-19 : Rs. 119.76 crores
Closing AUM as on 31-Aug-19 : Rs. 120.26 crores
Entry load : Not Applicable
Annual Portfolio Turnover Ratio : Equity - 0.42 times, Others (Debt and Derivatives) - 3.22 times Combined Annual Portfolio Turnover Ratio : 3.64 times
Dividend History : Refer page no. from 132 to 140
SIP Returns : Refer page no. from 128 to 130
Total Expense Ratio @@ :
IPBCOF3 : 1.36% p. a.
IPBCOF3 Direct Plan : 0.93% p. a.
Investment Objective : Refer page no. from 141 to 145
Note : - “Portfolio Beta, Standard Deviation, R Squared, Sharpe Ratio and Tracking Error of the Scheme is not computed owing to the short ime frame since launch of the Scheme.”Portfolio turnover has been computed as the ratio of the lower value of purchase and sales, to the average net assets in the past one year (since inception for schemes that have not completed a year). The figures are not netted for derivative transactions.**In addition to the fund manager managing this fund, overseas investment is managed by Ms. Priyanka Khandelwal.@@ Total Expense Ratio is as on the last business day of the month.
Mr. Sankaran Naren (Managing this fund since July 2018 & Overall 29 Years of experience)Mr. Atul Patel (Managing this fund since July 2018 & Overall 10 years of experience)
• Top Ten HoldingsDerivatives are considered at exposure value.
Equity Shares 89.41% -7.21% Auto 6.75% TVS Motor Company Ltd. 3.96% Maruti Suzuki India Ltd. 1.76% Eicher Motors Ltd. 0.95% Mahindra & Mahindra Ltd. 0.09% Auto Ancillaries 5.84% • Motherson Sumi Systems Ltd. 4.23% Sandhar Technologies Ltd. 1.61% Banks 8.45% • State Bank Of India 5.70% Axis Bank Ltd. 1.38% ICICI Bank Ltd. 1.36% Consumer Durables 5.77% • Titan Company Ltd. 4.17% Blue Star Ltd. 1.60% Consumer Non Durables 45.19% -4.84%• Asian Paints Ltd. 8.46% • ITC Ltd. 8.06% • Marico Ltd. 7.42% -4.84%• Hindustan Unilever Ltd. 6.24% • Britannia Industries Ltd. 5.62% Dabur India Ltd. 3.92% Bajaj Consumer Care Ltd. 2.31% Nestle India Ltd. 1.15% United Spirits Ltd. 1.10% Berger Paints India Ltd. 0.92% Hotels, Resorts And Other Recreational Activities 0.99% EIH Ltd. 0.99% Media & Entertainment 1.08% Entertainment Network (India) Ltd. 1.08% Pharmaceuticals 3.17% Dishman Carbogen Amcis Ltd. 1.40%
Company/Issuer % to % to NAV NAV Derivatives
Rating
RiskometerThis Product is suitable for investors who are seeking*:
• Long term wealth creation
• An close ended equity scheme that aims to provide capital appreciation by investing in a well-diversified portfolio of stocks that could benefit from growth in consumption and related activities.
*Investors should consult their financial advisers if in doubt about whether the product is suitable for them.
Portfolio as on August 31, 2019
Scheme
Nifty 50 TRI Index (Additional Benchmark)
NAV (Rs.) Per Unit (as on August 30,2019 : 9.86)
CAGR (%)
10.00
Nifty India Consumption TRI Index (Benchmark)
Since inception
CurrentValue of
Investment of Rs. 10000
CAGR (%) Current Value of
Investment of Rs. 10000
1 Year 3 Year 5 Year
CAGR (%) Current Value of
Investment of Rs. 10000
CAGR (%) Current Value of
Investment of Rs. 10000
10.38 - -
Particulars
-5.02 9499.04 - - - - -1.25 9860.00
-12.07 8795.98 - - - - -6.28 9299.20
-4.37 9564.51 - - - - 1.58 10176.74
ICICI Prudential Bharat Consumption Fund - Series 3 - Dividend Option as on August 31, 2019 - (IPBCF3)
Company/Issuer % to % to NAV NAV Derivatives
Rating
Cadila Healthcare Ltd. 0.94% Cipla Ltd. 0.83% Power 6.50% • NTPC Ltd. 6.50% Telecom - Services 5.27% -3.75%• Bharti Airtel Ltd. 5.27% -3.75% Textile Products 0.40% Page Industries Ltd. 0.40% Index Futures/Options 1.38% Nifty 50 Index - Futures 1.38% Corporate Securities 0.06% Britannia Industries Ltd. CRISIL AAA 0.06% Short Term Debt and net current assets 17.73% Total Net Assets 100.00%
Notes:1. Different plans shall have different expense structure. The performance details provided herein are of ICICI Prudential Bharat Consumption Fund - Series 3.2. The scheme is currently managed by Sankaran Naren and Atul Patel. Mr. Sankaran Naren has been managing this fund since July 2018. Total Schemes managed by the Fund Manager is 33 (33 are jointly managed). Refer annexure from page no. 109 for performance of other schemes currently managed by Sankaran Naren.Mr. Atul Patel has been managing this fund since July 2018. Total Schemes managed by the Fund Manager is 8 (6 are jointly managed). Refer annexure from page no. 109 for performance of other schemes currently managed by Atul Patel.3. Date of inception: 17-Jul-18.4. Performance of dividend option would be Net of Dividend distribution tax, if any.5. As the Scheme has completed more than 1 year but less than 3 years, the performance details of only since inception and 1 year are provided herein.6. Past performance may or may not be sustained in future and the same may not necessarily provide the basis for comparison with other investment.7. Load is not considered for computation of returns.8. In case, the start/end date of the concerned period is a nonbusiness date (NBD), the NAV of the previous date is considered for computation of returns. The NAV per unit shown in the table is as on the start date of the said period9. NAV is adjusted to the extent of dividend declared for computation of returns.10. The performance of the scheme is benchmarked to the Total Return variant of the Index.

Style Box
Fund Managers** :
Indicative Investment Horizon : 1300 Days
Inception/Allotment date: 20-Aug-2018
SWP/STP :Not Applicable
Min.Redemption Amt. :No redemption/repurchase of units shall be allowed prior to the maturity of the Scheme. Investors wishing to exit may do so by selling their units through stock exchanges. The Scheme shall be fully redeemed on the date of maturity and redemption proceeds shall be paid out within 10 business days, subject to availability of all relevant documents and details.
SIP :Not Applicable
NAV (As on 30-Aug-19):IPBCF4 Growth Option : 9.40IPBCF4 Dividend Option : 9.40IPBCF4 Direct Plan Growth Option : 9.51IPBCF4 Direct Plan Dividend Option : 9.51
Options : Cumulative and Dividend Options(With Only Dividend Payout and Dividend Transfer Plan Facilities)
Application Amount for freshSubscription :Rs.5,000 (plus in multiple of Rs.10)
Min.Addl.Investment :Not Applicable
Exit load for Redemption / Switchout :- Lumpsum Investment OptionNot applicable
50
Fund Details
Concentrated
Quantitative Indicators
Benchmark
Average P/E : 43.80 Average P/BV : 14.14 Average Dividend Yield : 0.81
Nifty India Consumption TRI
ICICI Prudential Bharat Consumption Fund - Series 4A Close Ended Equity Scheme following Consumption Theme.
Monthly AAUM as on 31-Aug-19 : Rs. 380.70 crores
Closing AUM as on 31-Aug-19 : Rs. 387.45 crores
Entry load : Not Applicable
Annual Portfolio Turnover Ratio : Equity - 0.23 times, Others (Debt and Derivatives) - 1.19 times Combined Annual Portfolio Turnover Ratio : 1.42 times
Dividend History : Refer page no. from 132 to 140
SIP Returns : Refer page no. from 128 to 130
Total Expense Ratio @@ :
IPBCOF4 : 1.38% p. a.
IPBCOF4 Direct Plan : 0.90% p. a.
Investment Objective : Refer page no. from 141 to 145
Note : - “Portfolio Beta, Standard Deviation, R Squared, Sharpe Ratio and Tracking Error of the Scheme is not computed owing to the short ime frame since launch of the Scheme.”Portfolio turnover has been computed as the ratio of the lower value of purchase and sales, to the average net assets in the past one year (since inception for schemes that have not completed a year). The figures are not netted for derivative transactions.**In addition to the fund manager managing this fund, overseas investment is managed by Ms. Priyanka Khandelwal.@@ Total Expense Ratio is as on the last business day of the month.
Mr. Sankaran Naren (Managing this fund since August 2018 & Overall 29 Years of experience)Mr. Rajat Chandak (Managing this fund since August 2018 & Overall 11 years of experience)
• Top Ten HoldingsDerivatives are considered at exposure value.
Equity Shares 89.03% 1.61% Auto 15.53% • Maruti Suzuki India Ltd. 8.24% • TVS Motor Company Ltd. 5.24% Eicher Motors Ltd. 1.72% Mahindra & Mahindra Ltd. 0.33% Auto Ancillaries 4.53% • Motherson Sumi Systems Ltd. 4.53% Consumer Durables 13.66% • Titan Company Ltd. 5.37% • Voltas Ltd. 4.55% Relaxo Footwears Ltd. 2.32% Havells India Ltd. 1.42% Consumer Non Durables 35.22% • Asian Paints Ltd. 10.24% • Hindustan Unilever Ltd. 10.12% • ITC Ltd. 6.38% • Britannia Industries Ltd. 4.92% United Breweries Ltd. 3.55% Nestle India Ltd. 0.02% Hotels, Resorts And Other Recreational Activities 4.35% • The Indian Hotels Company Ltd. 4.35% Media & Entertainment 4.04% PVR Ltd. 4.04% Retailing 6.53% Trent Ltd. 4.19% Avenue Supermarts Ltd. (D-Mart) 2.34% Telecom - Services 2.15% Bharti Airtel Ltd. 2.15% Transportation 3.02% Interglobe Aviation Ltd. 3.02% Index Futures/Options 1.61% Nifty 50 Index - Futures 1.61% Corporate Securities 0.05% Britannia Industries Ltd. CRISIL AAA 0.05% Short Term Debt and net current assets 9.31% Total Net Assets 100.00%
Company/Issuer % to % to NAV NAV Derivatives
RiskometerThis Product is suitable for investors who are seeking*:
• Long term wealth creation
• An close ended equity scheme that aims to provide capital appreciation by investing in a well-diversified portfolio of stocks that could benefit from growth in consumption and related activities.
*Investors should consult their financial advisers if in doubt about whether the product is suitable for them.
Portfolio as on August 31, 2019
Scheme
Nifty 50 TRI Index (Additional Benchmark)
NAV (Rs.) Per Unit (as on August 30,2019 : 9.40)
CAGR (%)
10.00
Nifty India Consumption TRI Index (Benchmark)
Since inception
CurrentValue of
Investment of Rs. 10000
CAGR (%) Current Value of
Investment of Rs. 10000
1 Year 3 Year 5 Year
CAGR (%) Current Value of
Investment of Rs. 10000
CAGR (%) Current Value of
Investment of Rs. 10000
10.05 - -
Particulars
-6.48 9353.23 - - - - -5.84 9400.00
-12.07 8795.98 - - - - -11.32 8838.60
-4.37 9564.51 - - - - -3.16 9675.06
ICICI Prudential Bharat Consumption Fund - Series 4 - Dividend Option as on August 31, 2019 - (IPBCF4)
Notes:1. Different plans shall have different expense structure. The performance details provided herein are of ICICI Prudential Bharat Consumption Fund - Series 4.2. The scheme is currently managed by Sankaran Naren and Rajat Chandak. Mr. Sankaran Naren has been managing this fund since August 2018. Total Schemes managed by the Fund Manager 33 (33 are jointly managed). Refer annexure from page no. 109 for performance of other schemes currently managed by is Sankaran Naren.Mr. Rajat Chandak has been managing this fund since August 2018. Total Schemes managed by the Fund Manager 9 (9 are jointly managed). Refer annexure is from page no. 109 for performance of other schemes currently managed by Rajat Chandak.3. Date of inception: 20-Aug-18.4. Performance of dividend option would be Net of Dividend distribution tax, if any.5. As the Scheme has completed more than 1 year but less than 3 years, the performance details of only since inception and 1 year are provided herein.6. Past performance may or may not be sustained in future and the same may not necessarily provide the basis for comparison with other investment.7. Load is not considered for computation of returns.8. In case, the start/end date of the concerned period is a nonbusiness date (NBD), the NAV of the previous date is considered for computation of returns. The NAV per unit shown in the table is as on the start date of the said period9. NAV is adjusted to the extent of dividend declared for computation of returns.10. The performance of the scheme is benchmarked to the Total Return variant of the Index.
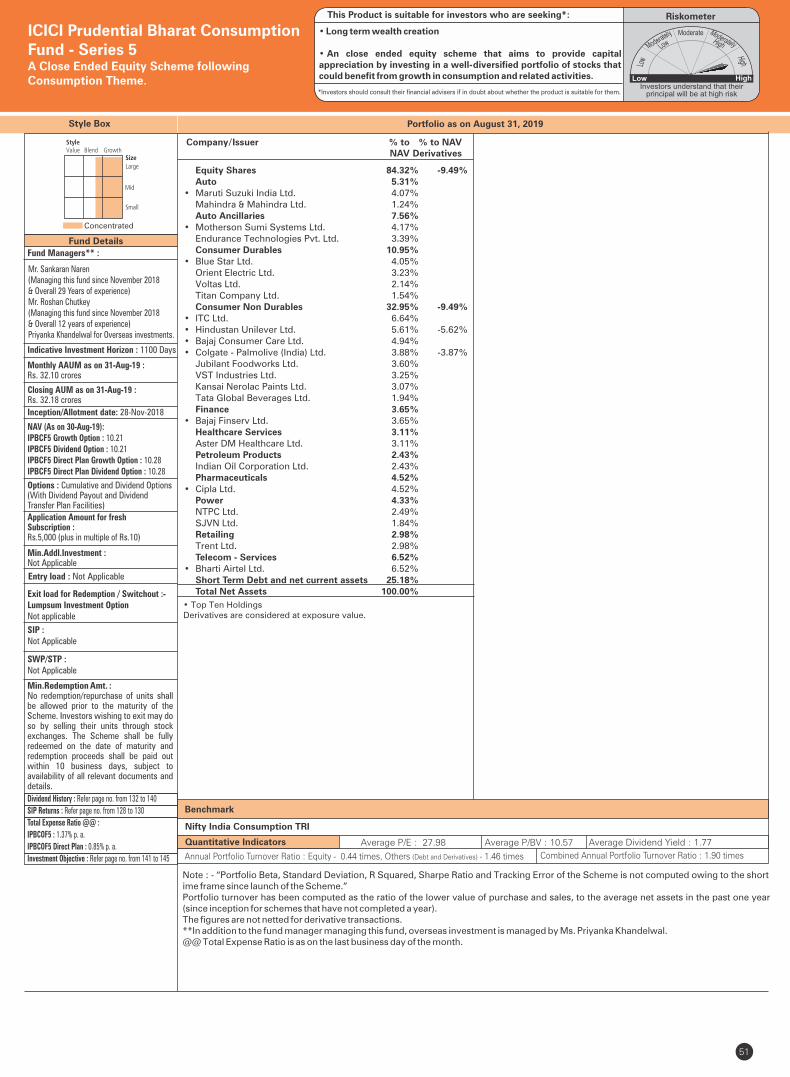
Style Box
Fund Managers** :
Indicative Investment Horizon : 1100 Days
Inception/Allotment date: 28-Nov-2018
SWP/STP :Not Applicable
Min.Redemption Amt. :No redemption/repurchase of units shall be allowed prior to the maturity of the Scheme. Investors wishing to exit may do so by selling their units through stock exchanges. The Scheme shall be fully redeemed on the date of maturity and redemption proceeds shall be paid out within 10 business days, subject to availability of all relevant documents and details.
SIP :Not Applicable
NAV (As on 30-Aug-19):IPBCF5 Growth Option : 10.21IPBCF5 Dividend Option : 10.21IPBCF5 Direct Plan Growth Option : 10.28IPBCF5 Direct Plan Dividend Option : 10.28
Options : Cumulative and Dividend Options(With Dividend Payout and Dividend Transfer Plan Facilities)
Application Amount for freshSubscription :Rs.5,000 (plus in multiple of Rs.10)
Min.Addl.Investment :Not Applicable
Exit load for Redemption / Switchout :- Lumpsum Investment OptionNot applicable
51
Fund Details
Concentrated
Portfolio as on August 31, 2019
Quantitative Indicators
Benchmark
Average P/E : 27.98 Average P/BV : 10.57 Average Dividend Yield : 1.77
Nifty India Consumption TRI
ICICI Prudential Bharat Consumption Fund - Series 5A Close Ended Equity Scheme following Consumption Theme.
Monthly AAUM as on 31-Aug-19 : Rs. 32.10 crores
Closing AUM as on 31-Aug-19 : Rs. 32.18 crores
Entry load : Not Applicable
Annual Portfolio Turnover Ratio : Equity - 0.44 times, Others (Debt and Derivatives) - 1.46 times Combined Annual Portfolio Turnover Ratio : 1.90 times
Dividend History : Refer page no. from 132 to 140
SIP Returns : Refer page no. from 128 to 130
Total Expense Ratio @@ :
IPBCOF5 : 1.37% p. a.
IPBCOF5 Direct Plan : 0.85% p. a.
Investment Objective : Refer page no. from 141 to 145
Note : - “Portfolio Beta, Standard Deviation, R Squared, Sharpe Ratio and Tracking Error of the Scheme is not computed owing to the short ime frame since launch of the Scheme.”Portfolio turnover has been computed as the ratio of the lower value of purchase and sales, to the average net assets in the past one year (since inception for schemes that have not completed a year). The figures are not netted for derivative transactions.**In addition to the fund manager managing this fund, overseas investment is managed by Ms. Priyanka Khandelwal.@@ Total Expense Ratio is as on the last business day of the month.
Mr. Sankaran Naren (Managing this fund since November 2018 & Overall 29 Years of experience)Mr. Roshan Chutkey (Managing this fund since November 2018 & Overall 12 years of experience)Priyanka Khandelwal for Overseas investments.
• Top Ten HoldingsDerivatives are considered at exposure value.
RiskometerThis Product is suitable for investors who are seeking*:
• Long term wealth creation
• An close ended equity scheme that aims to provide capital appreciation by investing in a well-diversified portfolio of stocks that could benefit from growth in consumption and related activities.
*Investors should consult their financial advisers if in doubt about whether the product is suitable for them.
Equity Shares 84.32% -9.49% Auto 5.31% • Maruti Suzuki India Ltd. 4.07% Mahindra & Mahindra Ltd. 1.24% Auto Ancillaries 7.56% • Motherson Sumi Systems Ltd. 4.17% Endurance Technologies Pvt. Ltd. 3.39% Consumer Durables 10.95% • Blue Star Ltd. 4.05% Orient Electric Ltd. 3.23% Voltas Ltd. 2.14% Titan Company Ltd. 1.54% Consumer Non Durables 32.95% -9.49%• ITC Ltd. 6.64% • Hindustan Unilever Ltd. 5.61% -5.62%• Bajaj Consumer Care Ltd. 4.94% • Colgate - Palmolive (India) Ltd. 3.88% -3.87% Jubilant Foodworks Ltd. 3.60% VST Industries Ltd. 3.25% Kansai Nerolac Paints Ltd. 3.07% Tata Global Beverages Ltd. 1.94% Finance 3.65% • Bajaj Finserv Ltd. 3.65% Healthcare Services 3.11% Aster DM Healthcare Ltd. 3.11% Petroleum Products 2.43% Indian Oil Corporation Ltd. 2.43% Pharmaceuticals 4.52% • Cipla Ltd. 4.52% Power 4.33% NTPC Ltd. 2.49% SJVN Ltd. 1.84% Retailing 2.98% Trent Ltd. 2.98% Telecom - Services 6.52% • Bharti Airtel Ltd. 6.52% Short Term Debt and net current assets 25.18% Total Net Assets 100.00%
Company/Issuer % to % to NAV NAV Derivatives
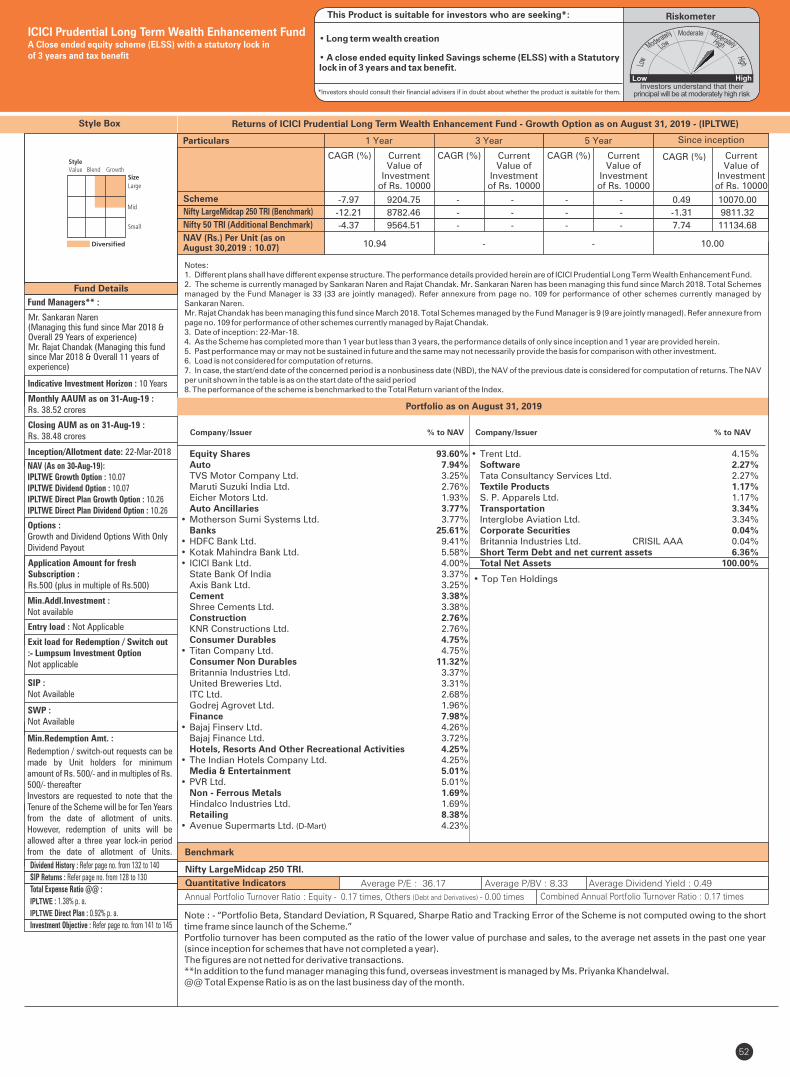
52
Fund Managers** :
Mr. Sankaran Naren (Managing this fund since Mar 2018 & Overall 29 Years of experience)Mr. Rajat Chandak (Managing this fund since Mar 2018 & Overall 11 years of experience)
Indicative Investment Horizon : 10 Years
Inception/Allotment date: 22-Mar-2018
NAV (As on 30-Aug-19):IPLTWE Growth Option : 10.07IPLTWE Dividend Option : 10.07IPLTWE Direct Plan Growth Option : 10.26IPLTWE Direct Plan Dividend Option : 10.26
Options :Growth and Dividend Options With Only Dividend Payout
Application Amount for freshSubscription :Rs.500 (plus in multiple of Rs.500)
Min.Addl.Investment :Not available
Exit load for Redemption / Switch out :- Lumpsum Investment OptionNot applicable
SIP :Not Available
SWP :Not Available
Min.Redemption Amt. :
Style Box
Portfolio as on August 31, 2019Monthly AAUM as on 31-Aug-19 : Rs. 38.52 crores
Closing AUM as on 31-Aug-19 : Rs. 38.48 crores
ICICI Prudential Long Term Wealth Enhancement FundA Close ended equity scheme (ELSS) with a statutory lock inof 3 years and tax benefit
Entry load : Not Applicable
RiskometerThis Product is suitable for investors who are seeking*:
• Long term wealth creation
• A close ended equity linked Savings scheme (ELSS) with a Statutory lock in of 3 years and tax benefit.
*Investors should consult their financial advisers if in doubt about whether the product is suitable for them.
Redemption / switch-out requests can be made by Unit holders for minimum amount of Rs. 500/- and in multiples of Rs. 500/- thereafterInvestors are requested to note that the Tenure of the Scheme will be for Ten Years from the date of allotment of units. However, redemption of units will be allowed after a three year lock-in period from the date of allotment of Units. Benchmark
Nifty LargeMidcap 250 TRI.
Note : - “Portfolio Beta, Standard Deviation, R Squared, Sharpe Ratio and Tracking Error of the Scheme is not computed owing to the short time frame since launch of the Scheme.”Portfolio turnover has been computed as the ratio of the lower value of purchase and sales, to the average net assets in the past one year (since inception for schemes that have not completed a year). The figures are not netted for derivative transactions.**In addition to the fund manager managing this fund, overseas investment is managed by Ms. Priyanka Khandelwal.@@ Total Expense Ratio is as on the last business day of the month.
Quantitative Indicators Average P/E : 36.17 Average P/BV : 8.33 Average Dividend Yield : 0.49
Annual Portfolio Turnover Ratio : Equity - 0.17 times, Others (Debt and Derivatives) - 0.00 times Combined Annual Portfolio Turnover Ratio : 0.17 times
• Top Ten Holdings
Equity Shares 93.60% Auto 7.94% TVS Motor Company Ltd. 3.25% Maruti Suzuki India Ltd. 2.76% Eicher Motors Ltd. 1.93% Auto Ancillaries 3.77%• Motherson Sumi Systems Ltd. 3.77% Banks 25.61%• HDFC Bank Ltd. 9.41%• Kotak Mahindra Bank Ltd. 5.58%• ICICI Bank Ltd. 4.00% State Bank Of India 3.37% Axis Bank Ltd. 3.25% Cement 3.38% Shree Cements Ltd. 3.38% Construction 2.76% KNR Constructions Ltd. 2.76% Consumer Durables 4.75%• Titan Company Ltd. 4.75% Consumer Non Durables 11.32% Britannia Industries Ltd. 3.37% United Breweries Ltd. 3.31% ITC Ltd. 2.68% Godrej Agrovet Ltd. 1.96% Finance 7.98%• Bajaj Finserv Ltd. 4.26% Bajaj Finance Ltd. 3.72% Hotels, Resorts And Other Recreational Activities 4.25%• The Indian Hotels Company Ltd. 4.25% Media & Entertainment 5.01%• PVR Ltd. 5.01% Non - Ferrous Metals 1.69% Hindalco Industries Ltd. 1.69% Retailing 8.38%• Avenue Supermarts Ltd. (D-Mart) 4.23%
• Trent Ltd. 4.15% Software 2.27% Tata Consultancy Services Ltd. 2.27% Textile Products 1.17% S. P. Apparels Ltd. 1.17% Transportation 3.34% Interglobe Aviation Ltd. 3.34% Corporate Securities 0.04% Britannia Industries Ltd. CRISIL AAA 0.04% Short Term Debt and net current assets 6.36% Total Net Assets 100.00%
Company/Issuer % to NAV Company/Issuer % to NAV
Dividend History : Refer page no. from 132 to 140
SIP Returns : Refer page no. from 128 to 130
Total Expense Ratio @@ :
: 1.38% p. a.IPLTWE
Direct Plan : 0.92% p. a.IPLTWE
Investment Objective : Refer page no. from 141 to 145
Scheme
Nifty 50 TRI (Additional Benchmark)
NAV (Rs.) Per Unit (as on August 30,2019 : 10.07)
CAGR (%)
10.00
Nifty LargeMidcap 250 TRI (Benchmark)
Since inception
CurrentValue of
Investment of Rs. 10000
CAGR (%) Current Value of
Investment of Rs. 10000
1 Year 3 Year 5 Year
CAGR (%) Current Value of
Investment of Rs. 10000
CAGR (%) Current Value of
Investment of Rs. 10000
10.94 - -
Particulars
-7.97 9204.75 - - - - 0.49 10070.00
-12.21 8782.46 - - - - -1.31 9811.32
-4.37 9564.51 - - - - 7.74 11134.68
Returns of ICICI Prudential Long Term Wealth Enhancement Fund - Growth Option as on August 31, 2019 - ( )IPLTWE
Notes:1. Different plans shall have different expense structure. The performance details provided herein are of ICICI Prudential Long Term Wealth Enhancement Fund.2. The scheme is currently managed by Sankaran Naren and Rajat Chandak. Mr. Sankaran Naren has been managing this fund since March 2018. Total Schemes managed by the Fund Manager is 33 (33 are jointly managed). Refer annexure from page no. 109 for performance of other schemes currently managed by Sankaran Naren.Mr. Rajat Chandak has been managing this fund since March 2018. Total Schemes managed by the Fund Manager is 9 (9 are jointly managed). Refer annexure from page no. 109 for performance of other schemes currently managed by Rajat Chandak.3. Date of inception: 22-Mar-18.4. As the Scheme has completed more than 1 year but less than 3 years, the performance details of only since inception and 1 year are provided herein.5. Past performance may or may not be sustained in future and the same may not necessarily provide the basis for comparison with other investment.6. Load is not considered for computation of returns.7. In case, the start/end date of the concerned period is a nonbusiness date (NBD), the NAV of the previous date is considered for computation of returns. The NAV per unit shown in the table is as on the start date of the said period8. The performance of the scheme is benchmarked to the Total Return variant of the Index.
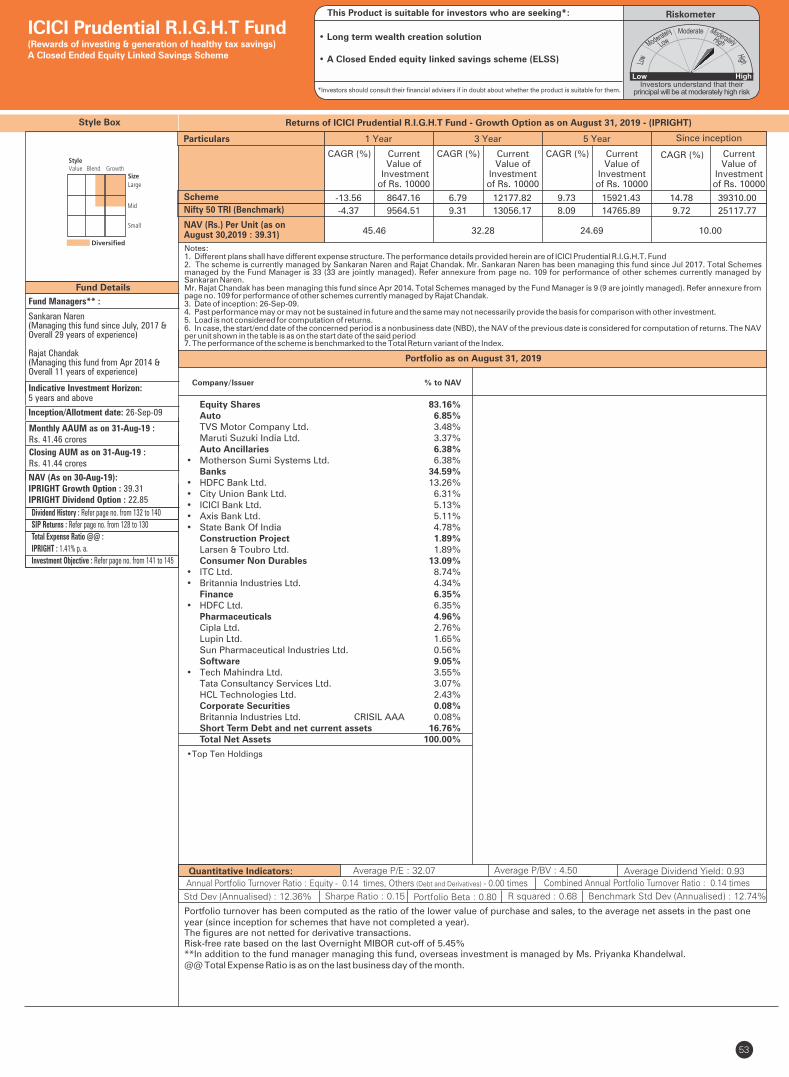
�
Quantitative Indicators:
Fund Details
Company/Issuer % to NAV
Fund Managers** :
Sankaran Naren(Managing this fund since July, 2017 &Overall 29 years of experience)
Rajat Chandak(Managing this fund from Apr 2014 &Overall 11 years of experience)
Indicative Investment Horizon:5 years and above
Inception/Allotment date: 26-Sep-09
Monthly AAUM as on 31-Aug-19 : Rs. 41.46 crores
Closing AUM as on 31-Aug-19 : Rs. 41.44 crores
NAV (As on 30-Aug-19):IPRIGHT Growth Option : 39.31IPRIGHT Dividend Option : 22.85
Std Dev (Annualised) : 12.36% Sharpe Ratio : 0.15
Average P/E : 32.07 Average P/BV : 4.50 Average Dividend Yield: 0.93
Portfolio Beta : 0.80 R squared : 0.68
Portfolio turnover has been computed as the ratio of the lower value of purchase and sales, to the average net assets in the past one year (since inception for schemes that have not completed a year). The figures are not netted for derivative transactions.Risk-free rate based on the last Overnight MIBOR cut-off of 5.45%**In addition to the fund manager managing this fund, overseas investment is managed by Ms. Priyanka Khandelwal.@@ Total Expense Ratio is as on the last business day of the month.
Style Box
• Top Ten Holdings
Portfolio as on August 31, 2019
Returns of ICICI Prudential R.I.G.H.T Fund - Growth Option as on August 31, 2019 - (IPRIGHT)
Equity Shares 83.16% Auto 6.85% TVS Motor Company Ltd. 3.48% Maruti Suzuki India Ltd. 3.37% Auto Ancillaries 6.38%• Motherson Sumi Systems Ltd. 6.38% Banks 34.59%• HDFC Bank Ltd. 13.26%• City Union Bank Ltd. 6.31%• ICICI Bank Ltd. 5.13%• Axis Bank Ltd. 5.11%• State Bank Of India 4.78% Construction Project 1.89% Larsen & Toubro Ltd. 1.89% Consumer Non Durables 13.09%• ITC Ltd. 8.74%• Britannia Industries Ltd. 4.34% Finance 6.35%• HDFC Ltd. 6.35% Pharmaceuticals 4.96% Cipla Ltd. 2.76% Lupin Ltd. 1.65% Sun Pharmaceutical Industries Ltd. 0.56% Software 9.05%• Tech Mahindra Ltd. 3.55% Tata Consultancy Services Ltd. 3.07% HCL Technologies Ltd. 2.43% Corporate Securities 0.08% Britannia Industries Ltd. CRISIL AAA 0.08% Short Term Debt and net current assets 16.76% Total Net Assets 100.00%
ICICI Prudential R.I.G.H.T Fund(Rewards of investing & generation of healthy tax savings) A Closed Ended Equity Linked Savings Scheme
Benchmark Std Dev (Annualised) : 12.74%
RiskometerThis Product is suitable for investors who are seeking*:
• Long term wealth creation solution
• A Closed Ended equity linked savings scheme (ELSS)
*Investors should consult their financial advisers if in doubt about whether the product is suitable for them.
Annual Portfolio Turnover Ratio : Equity - 0.14 times, Others (Debt and Derivatives) - 0.00 times Combined Annual Portfolio Turnover Ratio : 0.14 times
Dividend History : Refer page no. from 132 to 140
SIP Returns : Refer page no. from 128 to 130
Total Expense Ratio @@ :
IPRIGHT : 1.41% p. a.
Investment Objective : Refer page no. from 141 to 145
Notes:1. Different plans shall have different expense structure. The performance details provided herein are of ICICI Prudential R.I.G.H.T. Fund2. The scheme is currently managed by Sankaran Naren and Rajat Chandak. Mr. Sankaran Naren has been managing this fund since Jul 2017. Total Schemes managed by the Fund Manager is 33 (33 are jointly managed). Refer annexure from page no. 109 for performance of other schemes currently managed by Sankaran Naren.Mr. has been managing this fund since Apr 2014. Total Schemes managed by the Fund Manager Rajat Chandak is 9 (9 are jointly managed). Refer annexure from page no. 109 for performance of other schemes currently managed by Rajat Chandak.3. Date of inception: 26-Sep-09.4. Past performance may or may not be sustained in future and the same may not necessarily provide the basis for comparison with other investment.5. Load is not considered for computation of returns.6. In case, the start/end date of the concerned period is a nonbusiness date (NBD), the NAV of the previous date is considered for computation of returns. The NAV per unit shown in the table is as on the start date of the said period7. The performance of the scheme is benchmarked to the Total Return variant of the Index.
Scheme
NAV (Rs.) Per Unit (as on August 30,2019 : 39.31)
CAGR (%)
10.00
Nifty 50 TRI (Benchmark)
Since inception
CurrentValue of
Investment of Rs. 10000
CAGR (%) Current Value of
Investment of Rs. 10000
1 Year 3 Year 5 Year
CAGR (%) Current Value of
Investment of Rs. 10000
CAGR (%) Current Value of
Investment of Rs. 10000
45.46 32.28 24.69
Particulars
-13.56 8647.16 6.79 12177.82 9.73 15921.43 14.78 39310.00
-4.37 9564.51 9.31 13056.17 8.09 14765.89 9.72 25117.77
53
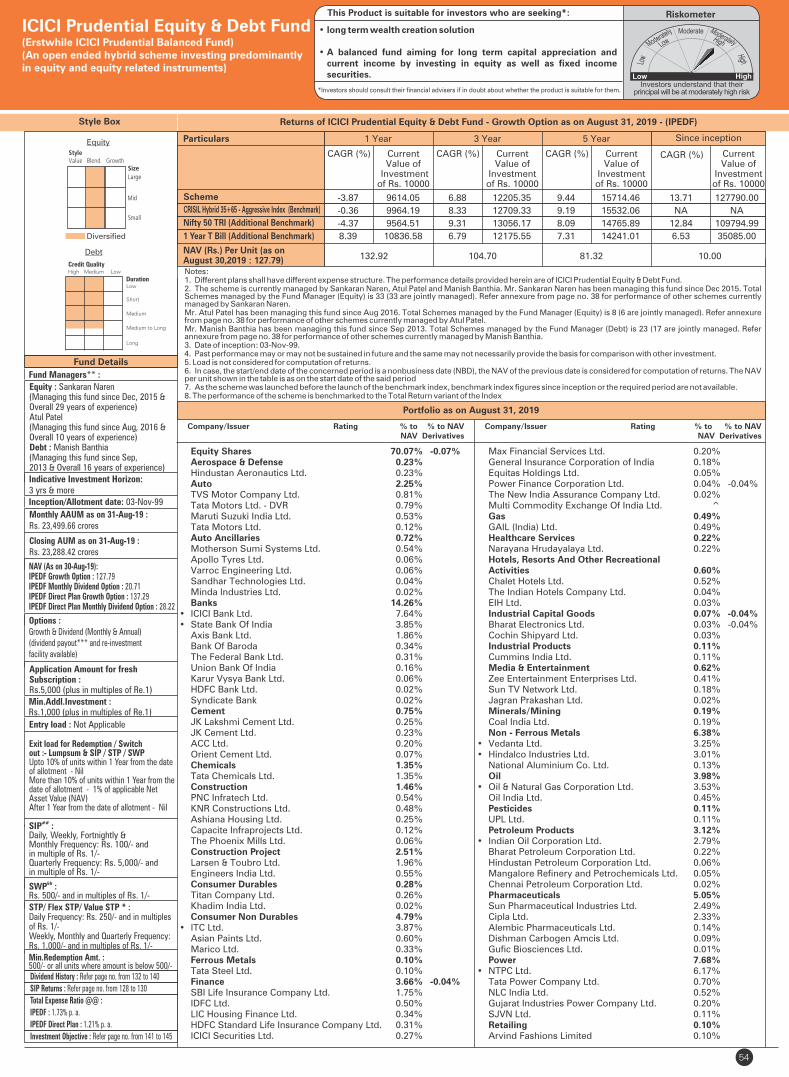
54
Fund Details
Style Box
Fund Managers** :
Equity : Sankaran Naren(Managing this fund since Dec, 2015 &Overall 29 years of experience)Atul Patel(Managing this fund since Aug, 2016 &Overall 10 years of experience)Debt : Manish Banthia (Managing this fund since Sep, 2013 & Overall 16 years of experience)Indicative Investment Horizon:3 yrs & moreInception/Allotment date: 03-Nov-99
Monthly AAUM as on 31-Aug-19 : Rs. 23,499.66 crores
Closing AUM as on 31-Aug-19 : Rs. 23,288.42 crores
NAV (As on 30-Aug-19):IPEDF Growth Option : 127.79IPEDF Monthly Dividend Option : 20.71IPEDF Direct Plan Growth Option : 137.29IPEDF Direct Plan Monthly Dividend Option : 28.22
Options :Growth & Dividend (Monthly & Annual)(dividend payout*** and re-investment facility available)
Application Amount for freshSubscription :Rs.5,000 (plus in multiples of Re.1)
Min.Addl.Investment :Rs.1,000 (plus in multiples of Re.1)
Exit load for Redemption / Switchout :- Lumpsum & SIP / STP / SWPUpto 10% of units within 1 Year from the date of allotment - Nil More than 10% of units within 1 Year from the date of allotment - 1% of applicable Net Asset Value (NAV) After 1 Year from the date of allotment - Nil
##SIP :Daily, Weekly, Fortnightly & Monthly Frequency: Rs. 100/- and in multiple of Rs. 1/-Quarterly Frequency: Rs. 5,000/- and in multiple of Rs. 1/-
&&SWP :Rs. 500/- and in multiples of Rs. 1/-
STP/ Flex STP/ Value STP * :Daily Frequency: Rs. 250/- and in multiples of Rs. 1/-Weekly, Monthly and Quarterly Frequency: Rs. 1,000/- and in multiples of Rs. 1/-
Min.Redemption Amt. :500/- or all units where amount is below 500/-
Portfolio as on August 31, 2019
Returns of ICICI Prudential Equity & Debt Fund - Growth Option as on August 31, 2019 - (IPEDF)
ICICI Prudential Equity & Debt Fund(Erstwhile ICICI Prudential Balanced Fund)(An open ended hybrid scheme investing predominantly in equity and equity related instruments)
Entry load : Not Applicable
RiskometerThis Product is suitable for investors who are seeking*:
• long term wealth creation solution
• A balanced fund aiming for long term capital appreciation and current income by investing in equity as well as fixed income securities.
*Investors should consult their financial advisers if in doubt about whether the product is suitable for them.
Dividend History : Refer page no. from 132 to 140
SIP Returns : Refer page no. from 128 to 130
Total Expense Ratio @@ :
IPEDF : 1.73% p. a.
IPEDF Direct Plan : 1.21% p. a.
Investment Objective : Refer page no. from 141 to 145
Notes:1. Different plans shall have different expense structure. The performance details provided herein are of ICICI Prudential Equity & Debt Fund.2. The scheme is currently managed by Sankaran Naren, Atul Patel and . Mr. Sankaran Naren has been managing this fund since Dec 2015. Total Manish BanthiaSchemes managed by the Fund Manager (Equity) is 33 (33 are jointly managed). Refer annexure from page no. 38 for performance of other schemes currently managed by Sankaran Naren.Mr. Atul Patel has been managing this fund since Aug 2016. Total Schemes managed by the Fund Manager . Refer annexure (Equity) is 8 (6 are jointly managed)from page no. 38 for performance of other schemes currently managed by Atul Patel .Mr. has been managing this fund since Sep 2013. Total Schemes managed by the Fund Manager . Refer Manish Banthia (Debt) is 23 (17 are jointly managedannexure from page no. 38 for performance of other schemes currently managed by .Manish Banthia3. Date of inception: 03-Nov-99.4. Past performance may or may not be sustained in future and the same may not necessarily provide the basis for comparison with other investment.5. Load is not considered for computation of returns.6. In case, the start/end date of the concerned period is a nonbusiness date (NBD), the NAV of the previous date is considered for computation of returns. The NAV per unit shown in the table is as on the start date of the said period7. As the scheme was launched before the launch of the benchmark index, benchmark index figures since inception or the required period are not available. 8. The performance of the scheme is benchmarked to the Total Return variant of the Index
Scheme
Nifty 50 TRI (Additional Benchmark)
CAGR (%)
CRISIL Hybrid 35+65 - Aggressive Index (Benchmark)
Since inception
CurrentValue of
Investment of Rs. 10000
CAGR (%) Current Value of
Investment of Rs. 10000
1 Year 3 Year 5 Year
CAGR (%) Current Value of
Investment of Rs. 10000
CAGR (%) Current Value of
Investment of Rs. 10000
NAV (Rs.) Per Unit (as on August 30,2019 : 127.79) 10.00132.92 104.70 81.32
Particulars
1 Year T Bill (Additional Benchmark)
Equity Shares 70.07% -0.07% Aerospace & Defense 0.23% Hindustan Aeronautics Ltd. 0.23% Auto 2.25% TVS Motor Company Ltd. 0.81% Tata Motors Ltd. - DVR 0.79% Maruti Suzuki India Ltd. 0.53% Tata Motors Ltd. 0.12% Auto Ancillaries 0.72% Motherson Sumi Systems Ltd. 0.54% Apollo Tyres Ltd. 0.06% Varroc Engineering Ltd. 0.06% Sandhar Technologies Ltd. 0.04% Minda Industries Ltd. 0.02% Banks 14.26% • ICICI Bank Ltd. 7.64% • State Bank Of India 3.85% Axis Bank Ltd. 1.86% Bank Of Baroda 0.34% The Federal Bank Ltd. 0.31% Union Bank Of India 0.16% Karur Vysya Bank Ltd. 0.06% HDFC Bank Ltd. 0.02% Syndicate Bank 0.02% Cement 0.75% JK Lakshmi Cement Ltd. 0.25% JK Cement Ltd. 0.23% ACC Ltd. 0.20% Orient Cement Ltd. 0.07% Chemicals 1.35% Tata Chemicals Ltd. 1.35% Construction 1.46% PNC Infratech Ltd. 0.54% KNR Constructions Ltd. 0.48% Ashiana Housing Ltd. 0.25% Capacite Infraprojects Ltd. 0.12% The Phoenix Mills Ltd. 0.06% Construction Project 2.51% Larsen & Toubro Ltd. 1.96% Engineers India Ltd. 0.55% Consumer Durables 0.28% Titan Company Ltd. 0.26% Khadim India Ltd. 0.02% Consumer Non Durables 4.79% • ITC Ltd. 3.87% Asian Paints Ltd. 0.60% Marico Ltd. 0.33% Ferrous Metals 0.10% Tata Steel Ltd. 0.10% Finance 3.66% -0.04% SBI Life Insurance Company Ltd. 1.75% IDFC Ltd. 0.50% LIC Housing Finance Ltd. 0.34% HDFC Standard Life Insurance Company Ltd. 0.31% ICICI Securities Ltd. 0.27%
-3.87 9614.05 6.88 12205.35 9.44 15714.46 13.71 127790.00
-0.36 9964.19 8.33 12709.33 9.19 15532.06 NA NA
-4.37 9564.51 9.31 13056.17 8.09 14765.89 12.84 109794.99
8.39 10836.58 6.79 12175.55 7.31 14241.01 6.53 35085.00
Max Financial Services Ltd. 0.20% General Insurance Corporation of India 0.18% Equitas Holdings Ltd. 0.05% Power Finance Corporation Ltd. 0.04% -0.04% The New India Assurance Company Ltd. 0.02% Multi Commodity Exchange Of India Ltd. ^ Gas 0.49% GAIL (India) Ltd. 0.49% Healthcare Services 0.22% Narayana Hrudayalaya Ltd. 0.22% Hotels, Resorts And Other Recreational Activities 0.60% Chalet Hotels Ltd. 0.52% The Indian Hotels Company Ltd. 0.04% EIH Ltd. 0.03% Industrial Capital Goods 0.07% -0.04% Bharat Electronics Ltd. 0.03% -0.04% Cochin Shipyard Ltd. 0.03% Industrial Products 0.11% Cummins India Ltd. 0.11% Media & Entertainment 0.62% Zee Entertainment Enterprises Ltd. 0.41% Sun TV Network Ltd. 0.18% Jagran Prakashan Ltd. 0.02% Minerals/Mining 0.19% Coal India Ltd. 0.19% Non - Ferrous Metals 6.38% • Vedanta Ltd. 3.25% • Hindalco Industries Ltd. 3.01% National Aluminium Co. Ltd. 0.13% Oil 3.98% • Oil & Natural Gas Corporation Ltd. 3.53% Oil India Ltd. 0.45% Pesticides 0.11% UPL Ltd. 0.11% Petroleum Products 3.12% • Indian Oil Corporation Ltd. 2.79% Bharat Petroleum Corporation Ltd. 0.22% Hindustan Petroleum Corporation Ltd. 0.06% Mangalore Refinery and Petrochemicals Ltd. 0.05% Chennai Petroleum Corporation Ltd. 0.02% Pharmaceuticals 5.05% Sun Pharmaceutical Industries Ltd. 2.49% Cipla Ltd. 2.33% Alembic Pharmaceuticals Ltd. 0.14% Dishman Carbogen Amcis Ltd. 0.09% Gufic Biosciences Ltd. 0.01% Power 7.68% • NTPC Ltd. 6.17% Tata Power Company Ltd. 0.70% NLC India Ltd. 0.52% Gujarat Industries Power Company Ltd. 0.20% SJVN Ltd. 0.11% Retailing 0.10% Arvind Fashions Limited 0.10%
Company/Issuer Rating % to % to NAV NAV Derivatives
Company/Issuer Rating % to % to NAV NAV Derivatives
Debt
Diversified
Equity
High Medium Low
Low
Short
Medium
Credit Quality
Duration
Medium to Long
Long
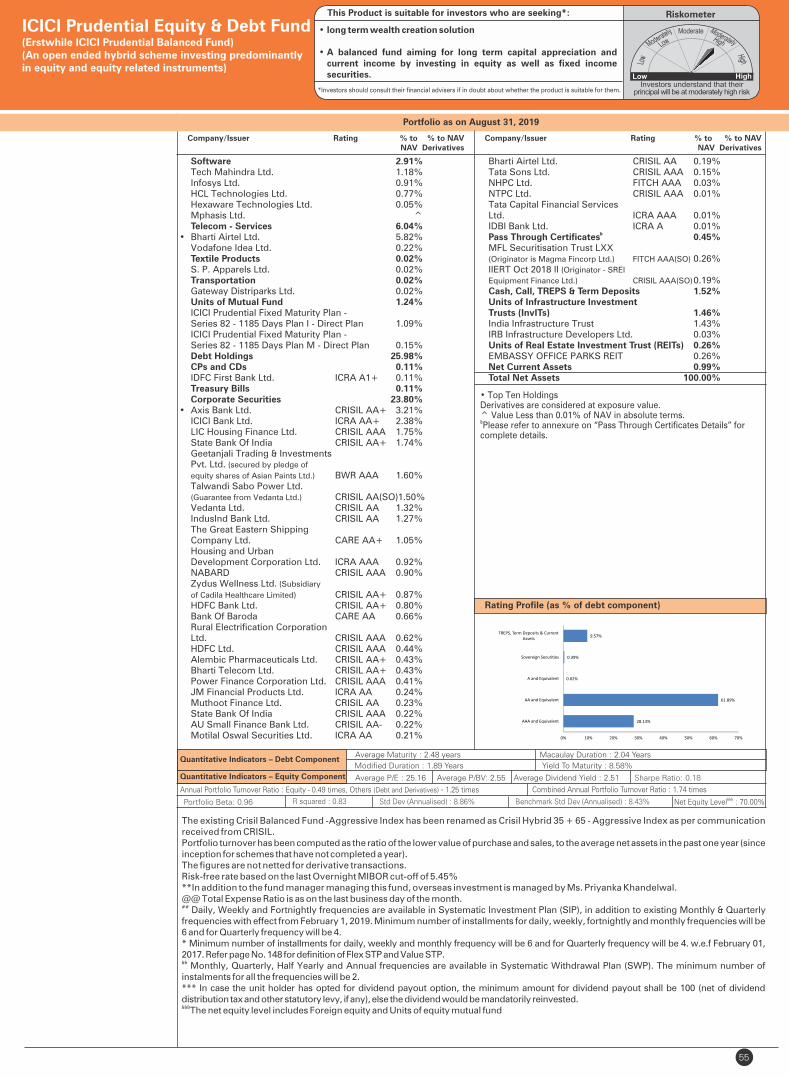
55
Rating Profile (as % of debt component)
Quantitative Indicators – Equity Component
Quantitative Indicators – Debt Component
The existing Crisil Balanced Fund -Aggressive Index has been renamed as Crisil Hybrid 35 + 65 - Aggressive Index as per communication received from CRISIL.Portfolio turnover has been computed as the ratio of the lower value of purchase and sales, to the average net assets in the past one year (since inception for schemes that have not completed a year). The figures are not netted for derivative transactions.Risk-free rate based on the last Overnight MIBOR cut-off of 5.45%**In addition to the fund manager managing this fund, overseas investment is managed by Ms. Priyanka Khandelwal.@@ Total Expense Ratio is as on the last business day of the month.## Daily, Weekly and Fortnightly frequencies are available in Systematic Investment Plan (SIP), in addition to existing Monthly & Quarterly frequencies with effect from February 1, 2019. Minimum number of installments for daily, weekly, fortnightly and monthly frequencies will be 6 and for Quarterly frequency will be 4.* Minimum number of installments for daily, weekly and monthly frequency will be 6 and for Quarterly frequency will be 4. w.e.f February 01, 2017. Refer page No. 148 for definition of Flex STP and Value STP.&& Monthly, Quarterly, Half Yearly and Annual frequencies are available in Systematic Withdrawal Plan (SWP). The minimum number of instalments for all the frequencies will be 2.*** In case the unit holder has opted for dividend payout option, the minimum amount for dividend payout shall be 100 (net of dividend distribution tax and other statutory levy, if any), else the dividend would be mandatorily reinvested.&&&The net equity level includes Foreign equity and Units of equity mutual fund
Average Maturity : 2.48 years Macaulay Duration : 2.04 Years
Yield To Maturity : 8.58%
Average P/E : 25.16 Average P/BV: 2.55 Average Dividend Yield : 2.51 Sharpe Ratio: 0.18
Portfolio Beta: 0.96 R squared : 0.83 Std Dev (Annualised) : 8.86%
• Top Ten Holdings Derivatives are considered at exposure value.^ Value Less than 0.01% of NAV in absolute terms.&Please refer to annexure on “Pass Through Certificates Details” for complete details.
Portfolio as on August 31, 2019
&&&Net Equity Level : 70.00%
ICICI Prudential Equity & Debt Fund(Erstwhile ICICI Prudential Balanced Fund)(An open ended hybrid scheme investing predominantly in equity and equity related instruments)
Benchmark Std Dev (Annualised) : 8.43%
RiskometerThis Product is suitable for investors who are seeking*:
• long term wealth creation solution
• A balanced fund aiming for long term capital appreciation and current income by investing in equity as well as fixed income securities.
*Investors should consult their financial advisers if in doubt about whether the product is suitable for them.
Annual Portfolio Turnover Ratio : Equity - 0.49 times, Others (Debt and Derivatives) - 1.25 times Combined Annual Portfolio Turnover Ratio : 1.74 times
Software 2.91% Tech Mahindra Ltd. 1.18% Infosys Ltd. 0.91% HCL Technologies Ltd. 0.77% Hexaware Technologies Ltd. 0.05% Mphasis Ltd. ^ Telecom - Services 6.04% • Bharti Airtel Ltd. 5.82% Vodafone Idea Ltd. 0.22% Textile Products 0.02% S. P. Apparels Ltd. 0.02% Transportation 0.02% Gateway Distriparks Ltd. 0.02% Units of Mutual Fund 1.24% ICICI Prudential Fixed Maturity Plan - Series 82 - 1185 Days Plan I - Direct Plan 1.09% ICICI Prudential Fixed Maturity Plan - Series 82 - 1185 Days Plan M - Direct Plan 0.15% Debt Holdings 25.98% CPs and CDs 0.11% IDFC First Bank Ltd. ICRA A1+ 0.11% Treasury Bills 0.11% Corporate Securities 23.80% • Axis Bank Ltd. CRISIL AA+ 3.21% ICICI Bank Ltd. ICRA AA+ 2.38% LIC Housing Finance Ltd. CRISIL AAA 1.75% State Bank Of India CRISIL AA+ 1.74% Geetanjali Trading & Investments Pvt. Ltd. (secured by pledge of
equity shares of Asian Paints Ltd.) BWR AAA 1.60% Talwandi Sabo Power Ltd. (Guarantee from Vedanta Ltd.) CRISIL AA(SO) 1.50% Vedanta Ltd. CRISIL AA 1.32% IndusInd Bank Ltd. CRISIL AA 1.27% The Great Eastern Shipping Company Ltd. CARE AA+ 1.05% Housing and Urban Development Corporation Ltd. ICRA AAA 0.92% NABARD CRISIL AAA 0.90% Zydus Wellness Ltd. (Subsidiary
of Cadila Healthcare Limited) CRISIL AA+ 0.87% HDFC Bank Ltd. CRISIL AA+ 0.80% Bank Of Baroda CARE AA 0.66% Rural Electrification Corporation Ltd. CRISIL AAA 0.62% HDFC Ltd. CRISIL AAA 0.44% Alembic Pharmaceuticals Ltd. CRISIL AA+ 0.43% Bharti Telecom Ltd. CRISIL AA+ 0.43% Power Finance Corporation Ltd. CRISIL AAA 0.41% JM Financial Products Ltd. ICRA AA 0.24% Muthoot Finance Ltd. CRISIL AA 0.23% State Bank Of India CRISIL AAA 0.22% AU Small Finance Bank Ltd. CRISIL AA- 0.22% Motilal Oswal Securities Ltd. ICRA AA 0.21%
Bharti Airtel Ltd. CRISIL AA 0.19% Tata Sons Ltd. CRISIL AAA 0.15% NHPC Ltd. FITCH AAA 0.03% NTPC Ltd. CRISIL AAA 0.01% Tata Capital Financial Services Ltd. ICRA AAA 0.01% IDBI Bank Ltd. ICRA A 0.01%
& Pass Through Certificates 0.45% MFL Securitisation Trust LXX (Originator is Magma Fincorp Ltd.) FITCH AAA(SO) 0.26% IIERT Oct 2018 II (Originator - SREI
Equipment Finance Ltd.) CRISIL AAA(SO) 0.19% Cash, Call, TREPS & Term Deposits 1.52% Units of Infrastructure Investment Trusts (InvITs) 1.46% India Infrastructure Trust 1.43% IRB Infrastructure Developers Ltd. 0.03% Units of Real Estate Investment Trust (REITs) 0.26% EMBASSY OFFICE PARKS REIT 0.26% Net Current Assets 0.99% Total Net Assets 100.00%
Company/Issuer Rating % to % to NAV NAV Derivatives
Company/Issuer Rating % to % to NAV NAV Derivatives
Modified Duration : 1.89 Years
28.13%
61.89%
0.02%
0.39%
9.57%
0% 10% 20% 30% 40% 50% 60% 70%
AAA and Equivalent
AA and Equivalent
A and Equivalent
Sovereign Securities
TREPS, Term Deposits & CurrentAssets
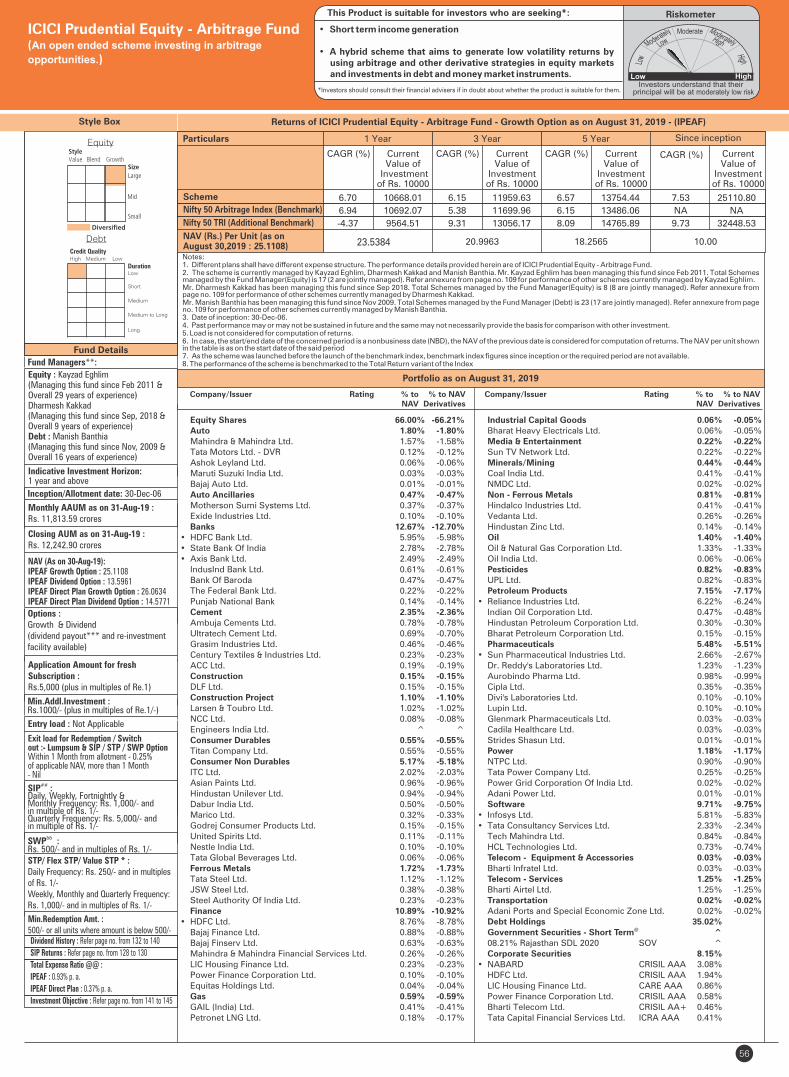
Equity Shares 66.00% -66.21% Auto 1.80% -1.80% Mahindra & Mahindra Ltd. 1.57% -1.58% Tata Motors Ltd. - DVR 0.12% -0.12% Ashok Leyland Ltd. 0.06% -0.06% Maruti Suzuki India Ltd. 0.03% -0.03% Bajaj Auto Ltd. 0.01% -0.01% Auto Ancillaries 0.47% -0.47% Motherson Sumi Systems Ltd. 0.37% -0.37% Exide Industries Ltd. 0.10% -0.10% Banks 12.67% -12.70%• HDFC Bank Ltd. 5.95% -5.98%• State Bank Of India 2.78% -2.78%• Axis Bank Ltd. 2.49% -2.49% IndusInd Bank Ltd. 0.61% -0.61% Bank Of Baroda 0.47% -0.47% The Federal Bank Ltd. 0.22% -0.22% Punjab National Bank 0.14% -0.14% Cement 2.35% -2.36% Ambuja Cements Ltd. 0.78% -0.78% Ultratech Cement Ltd. 0.69% -0.70% Grasim Industries Ltd. 0.46% -0.46% Century Textiles & Industries Ltd. 0.23% -0.23% ACC Ltd. 0.19% -0.19% Construction 0.15% -0.15% DLF Ltd. 0.15% -0.15% Construction Project 1.10% -1.10% Larsen & Toubro Ltd. 1.02% -1.02% NCC Ltd. 0.08% -0.08% Engineers India Ltd. ^ ^ Consumer Durables 0.55% -0.55% Titan Company Ltd. 0.55% -0.55% Consumer Non Durables 5.17% -5.18% ITC Ltd. 2.02% -2.03% Asian Paints Ltd. 0.96% -0.96% Hindustan Unilever Ltd. 0.94% -0.94% Dabur India Ltd. 0.50% -0.50% Marico Ltd. 0.32% -0.33% Godrej Consumer Products Ltd. 0.15% -0.15% United Spirits Ltd. 0.11% -0.11% Nestle India Ltd. 0.10% -0.10% Tata Global Beverages Ltd. 0.06% -0.06% Ferrous Metals 1.72% -1.73% Tata Steel Ltd. 1.12% -1.12% JSW Steel Ltd. 0.38% -0.38% Steel Authority Of India Ltd. 0.23% -0.23% Finance 10.89% -10.92%• HDFC Ltd. 8.76% -8.78% Bajaj Finance Ltd. 0.88% -0.88% Bajaj Finserv Ltd. 0.63% -0.63% Mahindra & Mahindra Financial Services Ltd. 0.26% -0.26% LIC Housing Finance Ltd. 0.23% -0.23% Power Finance Corporation Ltd. 0.10% -0.10% Equitas Holdings Ltd. 0.04% -0.04% Gas 0.59% -0.59% GAIL (India) Ltd. 0.41% -0.41% Petronet LNG Ltd. 0.18% -0.17%
56
Fund Details
Style Box
Equity
Fund Managers**:
Equity : Kayzad Eghlim (Managing this fund since Feb 2011 & Overall 29 years of experience)Dharmesh Kakkad(Managing this fund since Sep, 2018 & Overall 9 years of experience)Debt : Manish Banthia (Managing this fund since Nov, 2009 & Overall 16 years of experience)
Inception/Allotment date: 30-Dec-06
Monthly AAUM as on 31-Aug-19 : Rs. 11,813.59 crores
Closing AUM as on 31-Aug-19 : Rs. 12,242.90 crores
NAV (As on 30-Aug-19):IPEAF Growth Option : 25.1108IPEAF Dividend Option : 13.5961IPEAF Direct Plan Growth Option : 26.0634IPEAF Direct Plan Dividend Option : 14.5771
Options :Growth & Dividend(dividend payout*** and re-investment facility available)
Application Amount for freshSubscription :Rs.5,000 (plus in multiples of Re.1)
Min.Addl.Investment :Rs.1000/- (plus in multiples of Re.1/-)
Exit load for Redemption / Switchout :- Lumpsum & SIP / STP / SWP OptionWithin 1 Month from allotment - 0.25%of applicable NAV, more than 1 Month- Nil
SIP :##
Daily, Weekly, Fortnightly & Monthly Frequency: Rs. 1,000/- and in multiple of Rs. 1/-Quarterly Frequency: Rs. 5,000/- and in multiple of Rs. 1/-
&&SWP :Rs. 500/- and in multiples of Rs. 1/-STP/ Flex STP/ Value STP * :Daily Frequency: Rs. 250/- and in multiples of Rs. 1/-Weekly, Monthly and Quarterly Frequency: Rs. 1,000/- and in multiples of Rs. 1/-
Portfolio as on August 31, 2019
Returns of ICICI Prudential Equity - Arbitrage Fund - Growth Option as on August 31, 2019 - (IPEAF)
Company/Issuer Rating % to % to NAV NAV Derivatives
Industrial Capital Goods 0.06% -0.05% Bharat Heavy Electricals Ltd. 0.06% -0.05% Media & Entertainment 0.22% -0.22% Sun TV Network Ltd. 0.22% -0.22% Minerals/Mining 0.44% -0.44% Coal India Ltd. 0.41% -0.41% NMDC Ltd. 0.02% -0.02% Non - Ferrous Metals 0.81% -0.81% Hindalco Industries Ltd. 0.41% -0.41% Vedanta Ltd. 0.26% -0.26% Hindustan Zinc Ltd. 0.14% -0.14% Oil 1.40% -1.40% Oil & Natural Gas Corporation Ltd. 1.33% -1.33% Oil India Ltd. 0.06% -0.06% Pesticides 0.82% -0.83% UPL Ltd. 0.82% -0.83% Petroleum Products 7.15% -7.17%• Reliance Industries Ltd. 6.22% -6.24% Indian Oil Corporation Ltd. 0.47% -0.48% Hindustan Petroleum Corporation Ltd. 0.30% -0.30% Bharat Petroleum Corporation Ltd. 0.15% -0.15% Pharmaceuticals 5.48% -5.51%• Sun Pharmaceutical Industries Ltd. 2.66% -2.67% Dr. Reddy's Laboratories Ltd. 1.23% -1.23% Aurobindo Pharma Ltd. 0.98% -0.99% Cipla Ltd. 0.35% -0.35% Divi's Laboratories Ltd. 0.10% -0.10% Lupin Ltd. 0.10% -0.10% Glenmark Pharmaceuticals Ltd. 0.03% -0.03% Cadila Healthcare Ltd. 0.03% -0.03% Strides Shasun Ltd. 0.01% -0.01% Power 1.18% -1.17% NTPC Ltd. 0.90% -0.90% Tata Power Company Ltd. 0.25% -0.25% Power Grid Corporation Of India Ltd. 0.02% -0.02% Adani Power Ltd. 0.01% -0.01% Software 9.71% -9.75%• Infosys Ltd. 5.81% -5.83%• Tata Consultancy Services Ltd. 2.33% -2.34% Tech Mahindra Ltd. 0.84% -0.84% HCL Technologies Ltd. 0.73% -0.74% Telecom - Equipment & Accessories 0.03% -0.03% Bharti Infratel Ltd. 0.03% -0.03% Telecom - Services 1.25% -1.25% Bharti Airtel Ltd. 1.25% -1.25% Transportation 0.02% -0.02% Adani Ports and Special Economic Zone Ltd. 0.02% -0.02% Debt Holdings 35.02%
@ Government Securities - Short Term ^ 08.21% Rajasthan SDL 2020 SOV ^ Corporate Securities 8.15% • NABARD CRISIL AAA 3.08% HDFC Ltd. CRISIL AAA 1.94% LIC Housing Finance Ltd. CARE AAA 0.86% Power Finance Corporation Ltd. CRISIL AAA 0.58% Bharti Telecom Ltd. CRISIL AA+ 0.46% Tata Capital Financial Services Ltd. ICRA AAA 0.41%
Company/Issuer Rating % to % to NAV NAV Derivatives
ICICI Prudential Equity - Arbitrage Fund(An open ended scheme investing in arbitrage
opportunities.)
Entry load : Not Applicable
Indicative Investment Horizon: 1 year and above
Dividend History : Refer page no. from 132 to 140
SIP Returns : Refer page no. from 128 to 130
Total Expense Ratio @@ :
IPEAF : 0.93% p. a.
IPEAF Direct Plan : 0.37% p. a.
Investment Objective : Refer page no. from 141 to 145
Min.Redemption Amt. :500/- or all units where amount is below 500/-
Notes:1. Different plans shall have different expense structure. The performance details provided herein are of ICICI Prudential Equity - Arbitrage Fund.2. The scheme is currently managed by Kayzad Eghlim, Dharmesh Kakkad and Manish Banthia. Mr. Kayzad Eghlim has been managing this fund since Feb 2011. Total Schemes managed by the Fund Manager(Equity) is 17 (2 are jointly managed). Refer annexure from page no. 109 for performance of other schemes currently managed by Kayzad Eghlim.Mr. Dharmesh Kakkad has been managing this fund since Sep 2018. Total Schemes managed by the Fund Manager(Equity) is 8 (8 are jointly managed). Refer annexure from page no. 109 for performance of other schemes currently managed by Dharmesh Kakkad.Mr. Manish Banthia has been managing this fund since Nov 2009. Total Schemes managed by the Fund Manager (Debt) is 23 (17 are jointly managed). Refer annexure from page no. 109 for performance of other schemes currently managed by Manish Banthia.3. Date of inception: 30-Dec-06.4. Past performance may or may not be sustained in future and the same may not necessarily provide the basis for comparison with other investment.5. Load is not considered for computation of returns.6. In case, the start/end date of the concerned period is a nonbusiness date (NBD), the NAV of the previous date is considered for computation of returns. The NAV per unit shown in the table is as on the start date of the said period7. As the scheme was launched before the launch of the benchmark index, benchmark index figures since inception or the required period are not available. 8. The performance of the scheme is benchmarked to the Total Return variant of the Index
Scheme
Nifty 50 TRI (Additional Benchmark)
NAV (Rs.) Per Unit (as on August 30,2019 : 25.1108)
CAGR (%)
10.00
Nifty 50 Arbitrage Index (Benchmark)
Since inception
CurrentValue of
Investment of Rs. 10000
CAGR (%) Current Value of
Investment of Rs. 10000
1 Year 3 Year 5 Year
CAGR (%) Current Value of
Investment of Rs. 10000
CAGR (%) Current Value of
Investment of Rs. 10000
23.5384 20.9963 18.2565
Particulars
6.70 10668.01 6.15 11959.63 6.57 13754.44 7.53 25110.80
6.94 10692.07 5.38 11699.96 6.15 13486.06 NA NA
-4.37 9564.51 9.31 13056.17 8.09 14765.89 9.73 32448.53
High Medium Low
Low
Short
Medium
Credit Quality
Duration
Medium to Long
Long
Debt
RiskometerThis Product is suitable for investors who are seeking*:
• Short term income generation
• A hybrid scheme that aims to generate low volatility returns by using arbitrage and other derivative strategies in equity markets and investments in debt and money market instruments.
*Investors should consult their financial advisers if in doubt about whether the product is suitable for them. moderately low risk

Small Industries Development Bank Of India CARE AAA 0.41% Tube Investments of India Ltd. (Murugappa Group company) CRISIL AA+ 0.41% Treasury Bills 0.20% 364 Days Treasury Bill 2019 SOV 0.20% CPs and CDs 9.61% • HDFC Ltd. CRISIL A1+ 2.79% IndusInd Bank Ltd. CRISIL A1+ 1.91% Axis Bank Ltd. CRISIL A1+ 1.20% Tata Capital Financial Services Ltd. CRISIL A1+ 1.20% Punjab National Bank ICRA A1+ 1.19% NABARD CRISIL A1+ 1.19% Kotak Mahindra Investments Ltd. CRISIL A1+ 0.12% Cash, Call, TREPS & Term Deposits 17.06% Net Current Assets -1.03% Total Net Assets 100.00%
57
• Top Ten HoldingsDerivatives are considered at exposure value.@Short Term < 8 Years, Long Term > 8 Years.^ Value Less than 0.01% of NAV in absolute terms.
Quantitative Indicators
ICICI Prudential Blended Plan - Plan A(Merging Scheme) has been merged into ICICI Prudential Equity - Arbitrage Fund(Surviving Scheme) after the close of business hours on April 22, 2016.Portfolio turnover has been computed as the ratio of the lower value of purchase and sales, to the average net assets in the past one year (since inception for schemes that have not completed a year). The figures are not netted for derivative transactions.Risk-free rate based on the last Overnight MIBOR cut-off of 5.45%**In addition to the fund manager managing this fund, overseas investment is managed by Ms. Priyanka Khandelwal.@@ Total Expense Ratio is as on the last business day of the month.##
Daily, Weekly and Fortnightly frequencies are available in Systematic Investment Plan (SIP), in addition to existing Monthly & Quarterly frequencies with effect from February 1, 2019. Minimum number of installments for daily, weekly, fortnightly and monthly frequencies will be 6 and for Quarterly frequency will be 4.* Minimum number of installments for daily, weekly and monthly frequency will be 6 and for Quarterly frequency will be 4. w.e.f February 01, 2017. Refer page No. 148 for definition of Flex STP and Value STP.&&
Monthly, Quarterly, Half Yearly and Annual frequencies are available in Systematic Withdrawal Plan (SWP). The minimum number of instalments for all the frequencies will be 2.*** In case the unit holder has opted for dividend payout option, the minimum amount for dividend payout shall be 100 (net of dividend distribution tax and other statutory levy, if any), else the dividend would be mandatorily reinvested.Please note that ICICI Prudential Equity - Arbitrage Fund has undergone change in fundamental attributes with effect from closure of business hours on August 28, 2019. Investors may please visit website for further details.
Sharpe Ratio :1.03
Average P/E : 26.07 Average P/BV : 5.22 Average Dividend Yied : 1.43
Portfolio Beta :0.51 Std Dev (Annualised) : 0.51% Benchmark Std Dev (Annualised) : 0.68%
Portfolio as on August 31, 2019
Company/Issuer Rating % to % to NAV NAV Derivatives
ICICI Prudential Equity - Arbitrage Fund(An open ended scheme investing in arbitrage
opportunities.)
R squared : 0.45
Annual Portfolio Turnover Ratio : Equity - 1.18 times, Others (Debt and Derivatives) - 9.22 times Combined Annual Portfolio Turnover Ratio : 10.40 times
Rating Profile
66.00%
0.00%
16.88%
0.87%
0.21%
0% 20% 40% 60% 80%
Total Hedged Equity
Total Unhedged Equity
AAA and Equivalent
AA and Equivalent
Sovereign Securities
RiskometerThis Product is suitable for investors who are seeking*:
• Short term income generation
• A hybrid scheme that aims to generate low volatility returns by using arbitrage and other derivative strategies in equity markets and investments in debt and money market instruments.
*Investors should consult their financial advisers if in doubt about whether the product is suitable for them. moderately low risk

Equity Shares 66.07% -10.44% Auto 3.38% -0.74% TVS Motor Company Ltd. 1.08% Maruti Suzuki India Ltd. 1.02% -0.04% Eicher Motors Ltd. 0.56% Ashok Leyland Ltd. 0.28% -0.28% Tata Motors Ltd. 0.25% -0.24% Mahindra & Mahindra Ltd. 0.19% -0.19% Tata Motors Ltd. - DVR 0.01% Auto Ancillaries 2.17% -0.19% Motherson Sumi Systems Ltd. 1.42% Bosch Ltd. 0.26% -0.19% Exide Industries Ltd. 0.25% MRF Ltd. 0.16% Varroc Engineering Ltd. 0.05% Apollo Tyres Ltd. 0.04% Banks 14.01% -2.37%• HDFC Bank Ltd. 3.79% -0.45%• Kotak Mahindra Bank Ltd. 2.45% -0.37%• Axis Bank Ltd. 2.39% -0.55%• ICICI Bank Ltd. 2.35% -0.04% State Bank Of India 1.87% -0.63% Bank Of Baroda 0.57% -0.20% IndusInd Bank Ltd. 0.21% Union Bank Of India 0.16% Yes Bank Ltd. 0.13% -0.13% The Federal Bank Ltd. 0.08% Karur Vysya Bank Ltd. 0.02% Cement 1.10% -0.05% Shree Cements Ltd. 0.41% Ultratech Cement Ltd. 0.27% -0.05% ACC Ltd. 0.24% Ambuja Cements Ltd. 0.18% Chemicals 0.10% Tata Chemicals Ltd. 0.10% Construction 0.41% Brigade Enterprises Ltd. 0.16% Oberoi Realty Ltd. 0.15% The Phoenix Mills Ltd. 0.10% NBCC (India) Ltd. ^ Construction Project 2.14% -0.50% Larsen & Toubro Ltd. 2.14% -0.50% Consumer Durables 1.29% -0.56% Titan Company Ltd. 0.63% -0.56% Voltas Ltd. 0.34% Whirlpool of India Ltd. 0.16% Relaxo Footwears Ltd. 0.15% Consumer Non Durables 7.52% -0.94% ITC Ltd. 2.05% -0.20% Asian Paints Ltd. 1.30% -0.11% Britannia Industries Ltd. 1.25% -0.28% Hindustan Unilever Ltd. 1.18% United Breweries Ltd. 0.65% ^ Jubilant Foodworks Ltd. 0.21% Dabur India Ltd. 0.18% -0.16%
58
Equity
Fund Details
Debt
Style Box
Fund Managers** :
Equity : Sankaran Naren(Managing this fund since Jul, 2017 & Overall 29 years of experience)Rajat Chandak (Managing this fund since Sep, 2015 & Overall 11 years of experience)Ihab Dalwai (Managing this fund since Jan, 2018 & Overall 8 years of experience)Mr. Dharmesh Kakkad (Managing this fund since Sep, 2018 & Overall 9 years of experience)Debt : Manish Banthia (Managing this fund since Nov, 2009 & Overall 16 years of experience)
Indicative Investment Horizon:3yrs & more
Inception/Allotment date: 30-Dec-06
Monthly AAUM as on 31-Aug-19 : Rs. 27,481.17 croresClosing AUM as on 31-Aug-19 : Rs. 27,468.28 crores
NAV (As on 30-Aug-19):IPBAF Growth Option : 35.25IPBAF Dividend Option : 15.41IPBAF Direct Plan Growth Option : 37.94IPBAF Direct Plan Dividend Option : 19.94
Portfolio as on August 31, 2019
Returns of ICICI Prudential Balanced Advantage Fund - Growth Option as on August 31, 2019 - (IPBAF)
Company/Issuer Rating % to % to NAV NAV Derivatives
Colgate - Palmolive (India) Ltd. 0.18% -0.13% Godrej Agrovet Ltd. 0.15% Bajaj Consumer Care Ltd. 0.15% Glaxosmithkline Consumer Healthcare Ltd. 0.08% Procter & Gamble Hygiene and Health Care Ltd. 0.06% Marico Ltd. 0.06% -0.06% Ferrous Metals 0.48% -0.40% Tata Steel Ltd. 0.48% -0.40% Finance 7.30% -2.12%• HDFC Ltd. 4.11% -1.92% Bajaj Finserv Ltd. 1.23% Sundaram Finance Ltd. 0.49% SBI Life Insurance Company Ltd. 0.38% ICICI Securities Ltd. 0.23% Bajaj Finance Ltd. 0.21% -0.16% ICICI Lombard General Insurance Company Ltd. 0.20% HDFC Standard Life Insurance Company Ltd. 0.16% LIC Housing Finance Ltd. 0.13% ICICI Prudential Life Insurance Company Ltd. 0.05% Max Financial Services Ltd. 0.03% -0.03% Equitas Holdings Ltd. 0.02% Sundaram Finance Holdings Ltd. 0.02% Power Finance Corporation Ltd. 0.01% Mahindra & Mahindra Financial Services Ltd. 0.01% -0.01% Gas 0.25% -0.05% GAIL (India) Ltd. 0.18% Petronet LNG Ltd. 0.07% -0.05% Healthcare Services 0.14% Narayana Hrudayalaya Ltd. 0.14% Hotels, Resorts And Other Recreational Activities 0.51% The Indian Hotels Company Ltd. 0.51% Industrial Capital Goods 0.31% -0.13% Bharat Electronics Ltd. 0.31% -0.13% Industrial Products 0.02% Supreme Industries Ltd. 0.02% Media & Entertainment 1.18% -0.13% PVR Ltd. 0.85% Zee Entertainment Enterprises Ltd. 0.31% -0.13% Inox Leisure Ltd. 0.02% Minerals/Mining 0.03% Coal India Ltd. 0.03% Non - Ferrous Metals 1.04% -0.13% Hindalco Industries Ltd. 0.60% -0.06% Vedanta Ltd. 0.43% -0.08% Oil 0.74% -0.07% Oil & Natural Gas Corporation Ltd. 0.62% -0.07% Oil India Ltd. 0.11% Pesticides 0.33% PI Industries Ltd. 0.33% Petroleum Products 3.93% • Reliance Industries Ltd. 3.15% Indian Oil Corporation Ltd. 0.59% Hindustan Petroleum Corporation Ltd. 0.19%
Company/Issuer Rating % to % to NAV NAV Derivatives
ICICI Prudential Balanced Advantage Fund(An open ended dynamic asset allocation fund)
Options :Growth and Dividend (Dividend Payout***/Reinvestment available, Frequencies - Monthly)
Application Amount for freshSubscription :Rs.500 (plus in multiples of Re.1)
Min.Addl.Investment :Rs.100/- (plus in multiples of Re.1/-)
Exit load for Redemption / Switchout :- Lumpsum & SIP / STP / SWP Upto 10% of units within 1 year from the date of allotment – Nil More than 10% of units within 1 year from the date of allotment – 1% of applicable NAV After 1 year from the date of allotment – Nil
##SIP :Daily, Weekly, Fortnightly & Monthly Frequency: Rs. 100/- and in multiple of Rs. 1/-Quarterly Frequency: Rs. 5,000/- and in multiple of Rs. 1/-
&&SWP :Rs. 500/- and in multiples of Rs. 1/-
STP/ Flex STP/ Value STP * :Daily Frequency: Rs. 250/- and in multiples of Rs. 1/-Weekly, Monthly and Quarterly Frequency: Rs. 1,000/- and in multiples of Rs. 1/-
Min.Redemption Amt. :500/- or all units where amount is below 500/-
Entry load : Not Applicable
RiskometerThis Product is suitable for investors who are seeking*:
• Long term wealth creation solution
• An equity fund that aims for growth by investing in equity and derivatives.
*Investors should consult their financial advisers if in doubt about whether the product is suitable for them.
Dividend History : Refer page no. from 132 to 140
SIP Returns : Refer page no. from 128 to 130
Total Expense Ratio @@ :
IPBAF : 1.70% p. a.
IPBAF Direct Plan : 1.27% p. a.
Investment Objective : Refer page no. from 141 to 145
Notes:1. Different plans shall have different expense structure. The performance details provided herein are of ICICI Prudential Balanced Advantage Fund.2. The scheme is currently managed by Sankaran Naren, Ihab DalwaiRajat Chandak, , Dharmesh Kakkad and Manish Banthia. Mr. Sankaran Naren has been managing this fund since Jul 2017. Total Schemes managed by the Fund Manager (Equity) is 33 (33 are jointly managed). Refer annexure from page no. 38 for performance of other schemes currently managed by Sankaran Naren.Mr. has been managing this fund since . Total Schemes managed by the Fund Manager . Refer annexure from page Rajat Chandak Sep 2015 (Equity) is 9 (9 are jointly managed)no. 38 for performance of other schemes currently managed by . Rajat ChandakMr. Ihab Dalwai has been managing this fund since Jan 2018. Total Schemes managed by the Fund Manager Refer annexure from page no. 38 for is 5 (4 are jointly managed).performance of other schemes currently managed by Ihab Dalwai.Mr. Dharmesh Kakkad has been managing this fund since Sep 2018. Total Schemes managed by the Fund Manager is 8 (8 are jointly managed). Refer annexure from page no. 38 for performance of other schemes currently managed by Dharmesh Kakkad.Mr. Manish Banthia has been managing this fund since . Total Schemes managed by the Fund Manager . Refer annexure from page Nov 2009 (Debt) is 23 (17 are jointly managed)no. 38 for performance of other schemes currently managed by Manish Banthia. 3. Date of inception: 30-Dec-06.4. Past performance may or may not be sustained in future and the same may not necessarily provide the basis for comparison with other investment.5. Load is not considered for computation of returns.6. In case, the start/end date of the concerned period is a nonbusiness date (NBD), the NAV of the previous date is considered for computation of returns. The NAV per unit shown in the table is as on the start date of the said period7. The performance of the scheme is benchmarked to the Total Return variant of the Index. The benchmark of the scheme has been revised from Crisil Hybrid 35 + 65 - Aggressive Index to CRISIL Hybrid 50+50 - Moderate Index w.e.f. April 30, 2018.
Scheme
Nifty 50 TRI (Additional Benchmark)
NAV (Rs.) Per Unit (as on August 30,2019 : 35.25)
CAGR (%)
10.00
CRISIL Hybrid 50+50 - Moderate Index (Benchmark)
Since inception
CurrentValue of
Investment of Rs. 10000
CAGR (%) Current Value of
Investment of Rs. 10000
1 Year 3 Year 5 Year
CAGR (%) Current Value of
Investment of Rs. 10000
CAGR (%) Current Value of
Investment of Rs. 10000
34.35 28.79 23.19
Particulars
2.63 10262.01 6.99 12243.83 8.72 15200.52 10.45 35250.00
2.72 10271.68 8.26 12683.98 9.31 15615.94 9.47 31485.21
-4.37 9564.51 9.31 13056.17 8.09 14765.89 9.73 32448.53
High Medium Low
Low
Short
Medium
Credit Quality
Duration
Medium to Long
Long
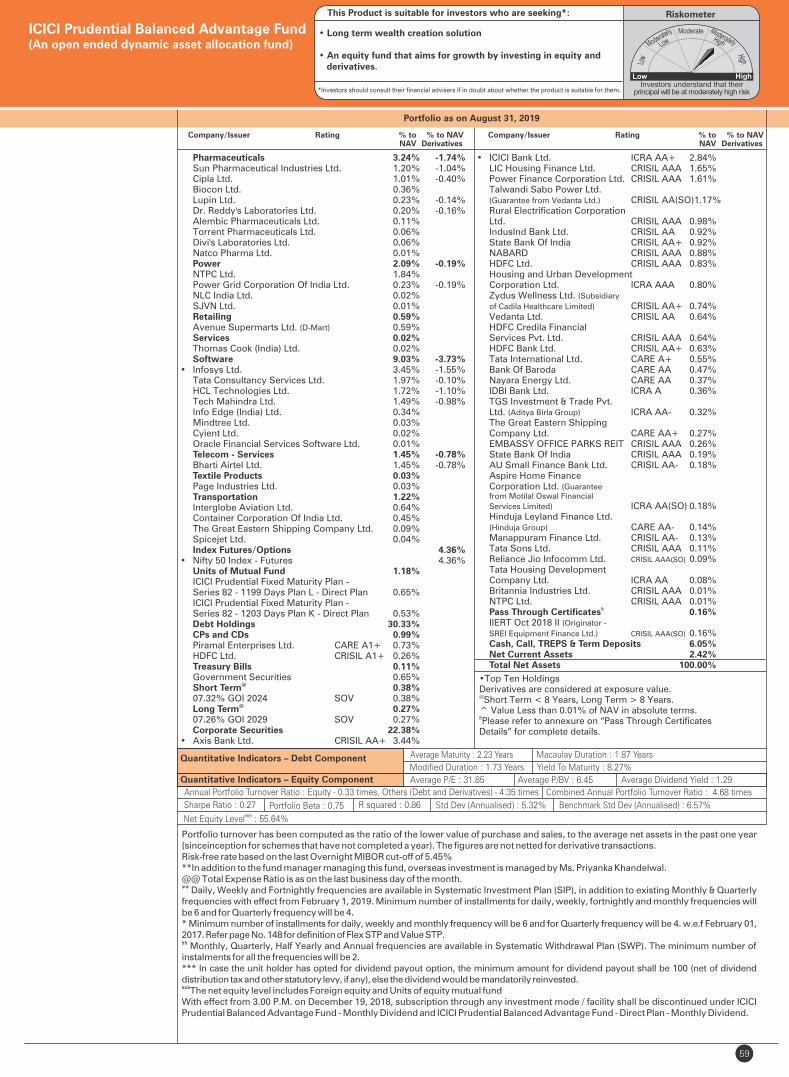
Pharmaceuticals 3.24% -1.74% Sun Pharmaceutical Industries Ltd. 1.20% -1.04% Cipla Ltd. 1.01% -0.40% Biocon Ltd. 0.36% Lupin Ltd. 0.23% -0.14% Dr. Reddy's Laboratories Ltd. 0.20% -0.16% Alembic Pharmaceuticals Ltd. 0.11% Torrent Pharmaceuticals Ltd. 0.06% Divi's Laboratories Ltd. 0.06% Natco Pharma Ltd. 0.01% Power 2.09% -0.19% NTPC Ltd. 1.84% Power Grid Corporation Of India Ltd. 0.23% -0.19% NLC India Ltd. 0.02% SJVN Ltd. 0.01% Retailing 0.59% Avenue Supermarts Ltd. (D-Mart) 0.59% Services 0.02% Thomas Cook (India) Ltd. 0.02% Software 9.03% -3.73%• Infosys Ltd. 3.45% -1.55% Tata Consultancy Services Ltd. 1.97% -0.10% HCL Technologies Ltd. 1.72% -1.10% Tech Mahindra Ltd. 1.49% -0.98% Info Edge (India) Ltd. 0.34% Mindtree Ltd. 0.03% Cyient Ltd. 0.02% Oracle Financial Services Software Ltd. 0.01% Telecom - Services 1.45% -0.78% Bharti Airtel Ltd. 1.45% -0.78% Textile Products 0.03% Page Industries Ltd. 0.03% Transportation 1.22% Interglobe Aviation Ltd. 0.64% Container Corporation Of India Ltd. 0.45% The Great Eastern Shipping Company Ltd. 0.09% Spicejet Ltd. 0.04% Index Futures/Options 4.36%• Nifty 50 Index - Futures 4.36% Units of Mutual Fund 1.18% ICICI Prudential Fixed Maturity Plan - Series 82 - 1199 Days Plan L - Direct Plan 0.65% ICICI Prudential Fixed Maturity Plan - Series 82 - 1203 Days Plan K - Direct Plan 0.53% Debt Holdings 30.33% CPs and CDs 0.99% Piramal Enterprises Ltd. CARE A1+ 0.73% HDFC Ltd. CRISIL A1+ 0.26% Treasury Bills 0.11% Government Securities 0.65%
@ Short Term 0.38% 07.32% GOI 2024 SOV 0.38%
@ Long Term 0.27% 07.26% GOI 2029 SOV 0.27% Corporate Securities 22.38% • Axis Bank Ltd. CRISIL AA+ 3.44%
59
Portfolio turnover has been computed as the ratio of the lower value of purchase and sales, to the average net assets in the past one year (sinceinception for schemes that have not completed a year). The figures are not netted for derivative transactions.Risk-free rate based on the last Overnight MIBOR cut-off of 5.45%**In addition to the fund manager managing this fund, overseas investment is managed by Ms. Priyanka Khandelwal.@@ Total Expense Ratio is as on the last business day of the month.## Daily, Weekly and Fortnightly frequencies are available in Systematic Investment Plan (SIP), in addition to existing Monthly & Quarterly frequencies with effect from February 1, 2019. Minimum number of installments for daily, weekly, fortnightly and monthly frequencies will be 6 and for Quarterly frequency will be 4.* Minimum number of installments for daily, weekly and monthly frequency will be 6 and for Quarterly frequency will be 4. w.e.f February 01, 2017. Refer page No. 148 for definition of Flex STP and Value STP.&& Monthly, Quarterly, Half Yearly and Annual frequencies are available in Systematic Withdrawal Plan (SWP). The minimum number of instalments for all the frequencies will be 2.*** In case the unit holder has opted for dividend payout option, the minimum amount for dividend payout shall be 100 (net of dividend distribution tax and other statutory levy, if any), else the dividend would be mandatorily reinvested.&&&The net equity level includes Foreign equity and Units of equity mutual fundWith effect from 3.00 P.M. on December 19, 2018, subscription through any investment mode / facility shall be discontinued under ICICI Prudential Balanced Advantage Fund - Monthly Dividend and ICICI Prudential Balanced Advantage Fund - Direct Plan - Monthly Dividend.
Sharpe Ratio : 0.27 Portfolio Beta : 0.75 R squared : 0.86
• Top Ten Holdings Derivatives are considered at exposure value.@Short Term < 8 Years, Long Term > 8 Years. ^ Value Less than 0.01% of NAV in absolute terms.Please refer to annexure on “Pass Through Certificates &
Details” for complete details.
Portfolio as on August 31, 2019
Company/Issuer Rating % to % to NAV NAV Derivatives
Quantitative Indicators – Debt Component Average Maturity : 2.23 Years Macaulay Duration : 1.87 Years
Yield To Maturity : 8.27%
Quantitative Indicators – Equity Component
Benchmark Std Dev (Annualised) : 6.57%&&&Net Equity Level : 55.64%
• ICICI Bank Ltd. ICRA AA+ 2.84% LIC Housing Finance Ltd. CRISIL AAA 1.65% Power Finance Corporation Ltd. CRISIL AAA 1.61% Talwandi Sabo Power Ltd. (Guarantee from Vedanta Ltd.) CRISIL AA(SO) 1.17% Rural Electrification Corporation Ltd. CRISIL AAA 0.98% IndusInd Bank Ltd. CRISIL AA 0.92% State Bank Of India CRISIL AA+ 0.92% NABARD CRISIL AAA 0.88% HDFC Ltd. CRISIL AAA 0.83% Housing and Urban Development Corporation Ltd. ICRA AAA 0.80% Zydus Wellness Ltd. (Subsidiary
of Cadila Healthcare Limited) CRISIL AA+ 0.74% Vedanta Ltd. CRISIL AA 0.64% HDFC Credila Financial Services Pvt. Ltd. CRISIL AAA 0.64% HDFC Bank Ltd. CRISIL AA+ 0.63% Tata International Ltd. CARE A+ 0.55% Bank Of Baroda CARE AA 0.47% Nayara Energy Ltd. CARE AA 0.37% IDBI Bank Ltd. ICRA A 0.36% TGS Investment & Trade Pvt. Ltd. (Aditya Birla Group) ICRA AA- 0.32% The Great Eastern Shipping Company Ltd. CARE AA+ 0.27% EMBASSY OFFICE PARKS REIT CRISIL AAA 0.26% State Bank Of India CRISIL AAA 0.19% AU Small Finance Bank Ltd. CRISIL AA- 0.18% Aspire Home Finance Corporation Ltd. (Guarantee from Motilal Oswal Financial
Services Limited) ICRA AA(SO) 0.18% Hinduja Leyland Finance Ltd. (Hinduja Group) CARE AA- 0.14% Manappuram Finance Ltd. CRISIL AA- 0.13% Tata Sons Ltd. CRISIL AAA 0.11% Reliance Jio Infocomm Ltd. CRISIL AAA(SO) 0.09% Tata Housing Development Company Ltd. ICRA AA 0.08% Britannia Industries Ltd. CRISIL AAA 0.01% NTPC Ltd. CRISIL AAA 0.01%
& Pass Through Certificates 0.16% IIERT Oct 2018 II (Originator -
SREI Equipment Finance Ltd.) CRISIL AAA(SO) 0.16% Cash, Call, TREPS & Term Deposits 6.05% Net Current Assets 2.42% Total Net Assets 100.00%
Company/Issuer Rating % to % to NAV NAV Derivatives
ICICI Prudential Balanced Advantage Fund(An open ended dynamic asset allocation fund)
Std Dev (Annualised) : 5.32%
RiskometerThis Product is suitable for investors who are seeking*:
• Long term wealth creation solution
• An equity fund that aims for growth by investing in equity and derivatives.
*Investors should consult their financial advisers if in doubt about whether the product is suitable for them.
Average P/E : 31.85 Average P/BV : 6.45 Average Dividend Yield : 1.29
Annual Portfolio Turnover Ratio : Equity - 0.33 times, Others (Debt and Derivatives) - 4.35 times Combined Annual Portfolio Turnover Ratio : 4.68 times
Modified Duration : 1.73 Years

Style Box
Fund Managers** :
Equity : Sankaran Naren(Managing this fund since Dec, 2014 & Overall 29 years of experience)Kayzad Eghlim (Managing this fund since Apr 2017 & Overall years of experience) 29Mr Prakash Gaurav Goel (Managing this fund since October, 2017 & Overall 16 years of experience)Mr. Dharmesh Kakkad (Managing this fund since September, 2018 & Overall 9 years of experience)Debt : Manish Banthia(Managing this fund since Dec, 2014 & Overall 16 years of experience)
Indicative Investment Horizon: 3 years and above
Inception/Allotment date: 05-Dec-14
NAV (As on 30-Aug-19):IPESF Growth Option : 13.95IPESF Direct Plan Growth Option : 14.50
Options :Cumulative, AEP Option (Appreciation and Regular) and Dividend (dividend payout*** and re-investment facility available)
Application Amount for freshSubscription :Rs.5,000 (plus in multiples of Re.1)
Min.Addl.Investment :Rs.1000/- (plus in multiples of Re.1/-)
Exit load for Redemption / Switch out :- Lumpsum & SIP / STP / SWP If units purchased or switched in from another scheme of the Fund are redeemed or switched out within 15 days from the date of allotment - 1% of applicable NAV,If units purchased or switched in fromanother scheme of the Fund are redeemedor switched out after 15 days from the dateof allotment - NIL (w.e.f.1st August 2018)
Fund Details
Company/Issuer Rating % to % to NAV NAV Derivatives
Company/Issuer Rating % to % to NAV NAV Derivatives
Equity Shares 67.87% -35.72%
Auto 3.54% -3.09%
Maruti Suzuki India Ltd. 1.39% -1.28%
Tata Motors Ltd. 0.95% -0.95%
Tata Motors Ltd. - DVR 0.85% -0.86%
TVS Motor Company Ltd. 0.34%
Auto Ancillaries 0.76%
MRF Ltd. 0.62%
Exide Industries Ltd. 0.14%
Banks 13.12% -4.83%
• Axis Bank Ltd. 3.86% -2.79%
• ICICI Bank Ltd. 3.44%
HDFC Bank Ltd. 2.62% -0.18%
State Bank Of India 2.25% -1.04%
The Federal Bank Ltd. 0.82% -0.82%
The Jammu & Kashmir Bank Ltd. 0.14%
Cement 0.20% -0.20%
ACC Ltd. 0.20% -0.20%
Chemicals 3.32% -2.04%
• Tata Chemicals Ltd. 2.89% -2.04%
Galaxy Surfactants Ltd. 0.42%
Construction Project 1.74% -0.98%
Larsen & Toubro Ltd. 1.74% -0.98%
Consumer Durables 1.40% -1.12%
Titan Company Ltd. 1.40% -1.12%
Consumer Non Durables 4.92% -1.63%
ITC Ltd. 2.24% -0.60%
Asian Paints Ltd. 1.17%
Hindustan Unilever Ltd. 0.87% -0.62%
Tata Global Beverages Ltd. 0.65% -0.41%
Ferrous Metals 0.40% -0.40%
JSW Steel Ltd. 0.40% -0.40%
Finance 4.58% -1.84%
HDFC Ltd. 2.12% -1.42%
SBI Life Insurance Company Ltd. 1.39%
LIC Housing Finance Ltd. 0.64%
Bajaj Finance Ltd. 0.42% -0.42%
Gas 0.53% -0.36%
GAIL (India) Ltd. 0.53% -0.36%
Media & Entertainment 0.82% -0.81%
Zee Entertainment Enterprises Ltd. 0.82% -0.81%
Minerals/Mining 1.78% -1.06%
Coal India Ltd. 1.44% -1.06%
Monthly AAUM as on 31-Aug-19 : Rs. 1,548.38 crores
Closing AUM as on 31-Aug-19 : Rs. 1,530.42 crores
Debt
Diversified
Equity
Gujarat Mineral Development Corporation Ltd. 0.34%
Non - Ferrous Metals 2.35% -0.75%
Hindalco Industries Ltd. 1.27% -0.75%
Vedanta Ltd. 1.08%
Oil 0.53% -0.23%
Oil & Natural Gas Corporation Ltd. 0.53% -0.23%
Petroleum Products 3.16% -3.17%
• Reliance Industries Ltd. 2.88% -2.89%
Indian Oil Corporation Ltd. 0.28% -0.28%
Pharmaceuticals 5.07% -3.63%
• Sun Pharmaceutical Industries Ltd. 3.92% -2.79%
Lupin Ltd. 0.84% -0.84%
Cipla Ltd. 0.31%
Power 7.52% -1.63%
• NTPC Ltd. 5.17% -0.77%
Tata Power Company Ltd. 1.07% -0.67%
CESC Ltd. 0.87% -0.19%
NHPC Ltd. 0.41%
Software 9.46% -6.70%
• Tata Consultancy Services Ltd. 4.88% -4.90%
Infosys Ltd. 2.73% -1.28%
Tech Mahindra Ltd. 1.12% -0.52%
Larsen & Toubro Infotech Ltd. 0.49%
Cyient Ltd. 0.24%
Telecom - Services 1.66% -1.24%
Bharti Airtel Ltd. 1.66% -1.24%
Transportation 1.02%
Gujarat Pipavav Port Ltd. 1.02%
Units of Mutual Fund 2.22%
ICICI Prudential Fixed Maturity Plan -
Series 82 - 1185 Days Plan M - Direct Plan 2.22%
Debt Holdings 27.23%
Corporate Securities 16.78%
• Axis Bank Ltd. CRISIL AA+ 4.86%
• ICICI Bank Ltd. ICRA AA+ 3.28%
• IndusInd Bank Ltd. CRISIL AA 3.15%
Writers And Publishers Pvt. Ltd. (secured by pledge of equity shares of
DBCorp Ltd.) FITCH AA-(SO) 1.50%
PVR Ltd. CRISIL AA- 1.34%
Power Finance Corporation Ltd. CRISIL AAA 1.31%
Vedanta Ltd. CRISIL AA 0.96%
Nuvoco Vistas Corporation Ltd.
ICICI Prudential Equity Savings Fund(erstwhile ICICI Prudential Equity Income Fund)(An open ended scheme investing in equity, arbitrage and debt.)
Entry load : Not Applicable
RiskometerThis Product is suitable for investors who are seeking*:
• Long term wealth creation
• An open ended scheme that seeks to generate regular income through investments in fixed income securities, arbitrage and other derivative strategies and aim for long term capital appreciation by investing in equity and equity related instruments.
*Investors should consult their financial advisers if in doubt about whether the product is suitable for them.
&&SWP :Rs. 500/- and in multiples of Rs. 1/-
Min.Redemption Amt. :500/- or all units where amount is below 500/-
##SIP :Daily, Weekly, Fortnightly & Monthly Frequency: Rs. 100/- and in multiple of Rs. 1/-Quarterly Frequency: Rs. 5,000/- and in multiple of Rs. 1/-
60
STP/ Flex STP/ Value STP * :Daily Frequency: Rs. 250/- and in multiples of Rs. 1/-Weekly, Monthly and Quarterly Frequency: Rs. 1,000/- and in multiples of Rs. 1/-
Portfolio as on August 31, 2019
Returns of ICICI Prudential Equity Savings Fund - Growth Option as on - (IPESF)August 31, 2019
Dividend History : Refer page no. from 132 to 140
SIP Returns : Refer page no. from 128 to 130
Total Expense Ratio @@ :
IPESF : 1.34% p. a.
IPESF Direct Plan : 0.74% p. a.
Investment Objective : Refer page no. from 141 to 145
Notes:1. Different plans shall have different expense structure. The performance details provided herein are of ICICI Prudential Equity Savings Fund.2. The scheme is currently managed , Kayzad Eghlim, Prakash Gaurav Goel, Dharmesh Kakkad and Manish Banthia. Mr. Sankaran Naren has been managing by Sankaran Narenthis fund since Dec 2014. Total Schemes managed by the Fund Manager 33 (33 are jointly managed). Refer annexure from page no. 109 for performance of other (Equity) is schemes currently managed by Sankaran Naren.Mr. has been managing this fund since Apr 2017. Total Schemes managed by the Fund Manager Kayzad Eghlim (Equity) is 17 (2 are jointly managed). Refer annexure from page no. 109 for performance of other schemes currently managed by Kayzad Eghlim.Mr. has been managing this fund since 2017. Prakash Gaurav Goel October Total Schemes managed by the Fund Manager is 7 (7 are jointly managed). Refer annexure from page no. 109 for performance of other schemes currently managed by Prakash Gaurav Goel.Mr. Dharmesh Kakkad has been managing this fund since Sep 2018. Total Schemes managed by the Fund Manager (Equity) is 8 (8 are jointly managed). Refer annexure from page no. 109 for performance of other schemes currently managed by Dharmesh Kakkad.Mr. Manish Banthia has been managing this fund since . Total Schemes managed by the Fund Manager . Refer annexure from page Dec 2014 (Debt) is 23 (17 are jointly managed)no. 109 for performance of other schemes currently managed by Manish Banthia. 3. Date of inception: 05-Dec-14.4. As the Scheme has completed more than 3 year but less than 5 years, the performance details of since inception,1 year and 3 years are provided herein.5. Past performance may or may not be sustained in future and the same may not necessarily provide the basis for comparison with other investment.6. Load is not considered for computation of returns.7. In case, the start/end date of the concerned period is a nonbusiness date (NBD), the NAV of the previous date is considered for computation of returns. The NAV per unit shown in the table is as on the start date of the said period8. The performance of the scheme is benchmarked to the Total Return variant of the Index. The benchmark of the scheme has been revised from 30% Nifty 50 + 40% CRISIL Liquid Fund Index + 30% CRISIL Short Term Bond Fund Index to Nifty Equity Savings TRI w.e.f. May 28, 2018.
Scheme
Nifty 50 TRI (Additional Benchmark)
NAV (Rs.) Per Unit (as on August 30,2019 : 13.95)
CAGR (%)
10.00
Nifty Equity Savings TRI (Benchmark)
Since inception
CurrentValue of
Investment of Rs. 10000
CAGR (%) Current Value of
Investment of Rs. 10000
1 Year 3 Year 5 Year
CAGR (%) Current Value of
Investment of Rs. 10000
CAGR (%) Current Value of
Investment of Rs. 10000
13.17 11.52 -
Particulars
5.94 10592.26 6.59 12109.38 - - 7.28 13950.00
3.82 10380.93 7.67 12480.99 - - 7.23 13917.22
-4.37 9564.51 9.31 13056.17 - - 6.94 13739.65High Medium Low
Low
Short
Medium
Credit Quality
Duration
Medium to Long
Long

• Top Ten Holdings Derivatives are considered at exposure value.
Company/Issuer Rating % to % to NAV NAV Derivatives
(Nirma Group) CRISIL AA 0.33%
NTPC Ltd. CRISIL AAA 0.06%
Cash, Call, TREPS & Term Deposits 10.45%
Net Current Assets 2.67%
Total Net Assets 100.00%
ICICI Prudential Equity Savings Fund(erstwhile ICICI Prudential Equity Income Fund)(An open ended scheme investing in equity, arbitrage and debt.)
Rating Profile (as % of debt component)
RiskometerThis Product is suitable for investors who are seeking*:
• Long term wealth creation
• An open ended scheme that seeks to generate regular income through investments in fixed income securities, arbitrage and other derivative strategies and aim for long term capital appreciation by investing in equity and equity related instruments.
*Investors should consult their financial advisers if in doubt about whether the product is suitable for them.
Portfolio turnover has been computed as the ratio of the lower value of purchase and sales, to the average net assets in the past one year (since inception for schemes that have not completed a year). The figures are not netted for derivative transactions.Risk-free rate based on the last Overnight MIBOR cut-off of 5.45%.**In addition to the fund manager managing this fund, overseas investment is managed by Ms. Priyanka Khandelwal.@@ Total Expense Ratio is as on the last business day of the month.## Daily, Weekly and Fortnightly frequencies are available in Systematic Investment Plan (SIP), in addition to existing Monthly & Quarterly frequencies with effect from February 1, 2019. Minimum number of installments for daily, weekly, fortnightly and monthly frequencies will be 6 and for Quarterly frequency will be 4.* Minimum number of installments for daily, weekly and monthly frequency will be 6 and for Quarterly frequency will be 4. w.e.f February 01, 2017. Refer page No. 148 for definition of Flex STP and Value STP.&& Monthly, Quarterly, Half Yearly and Annual frequencies are available in Systematic Withdrawal Plan (SWP). The minimum number of instalments for all the frequencies will be 2.*** In case the unit holder has opted for dividend payout option, the minimum amount for dividend payout shall be 100 (net of dividend distribution tax and other statutory levy, if any), else the dividend would be mandatorily reinvested.&&&The net equity level includes Foreign equity and Units of equity mutual fundPlease note that ICICI Prudential Equity Savings Fund has undergone change in fundamental attributes with effect from closure of business hours on August 28, 2019. Investors may please visit website for further details.
61
Quantitative Indicators – Equity Component Average P/E : 26.09 Average P/BV : 4.61 Average Dividend Yield : 1.80 &&&Net Equity Level : 32.16%
Quantitative Indicators – Debt ComponentAverage Maturity : 1.90 Years Macaulay Duration : 1.72 Years
Yield To Maturity : 8.97%
Annual Portfolio Turnover Ratio : Equity - 0.63 times, Others (Debt and Derivatives) - 5.84 times Combined Annual Portfolio Turnover Ratio : 6.47 times
Portfolio as on August 31, 2019
Std Dev (Annualised): 3.14% Sharpe Ratio : 0.32 Portfolio Beta : 0.53 R squared : 0.57 Benchmark Std Dev (Annualised) : 4.49%
Modified Duration : 1.58 Years
2.10%
23.48%
74.42%
0% 10% 20% 30% 40% 50% 60% 70% 80%
AAA and Equivalent
AA and Equivalent
TREPS, Term Deposits & CurrentAssets
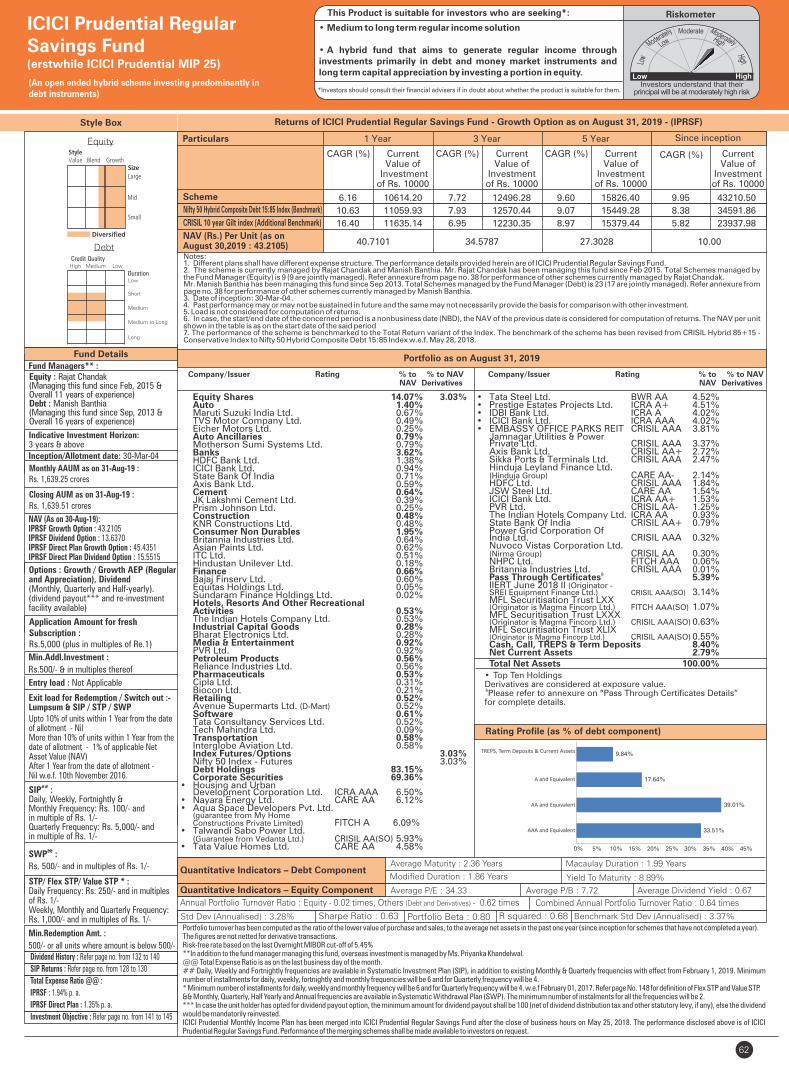
62
• Top Ten HoldingsDerivatives are considered at exposure value.&Please refer to annexure on “Pass Through Certificates Details”
for complete details.
Style Box
Fund Details
Quantitative Indicators – Debt Component
Quantitative Indicators – Equity Component
Average Maturity : 2.36 Years Macaulay Duration : 1.99 Years
Yield To Maturity : 8.89%
Average P/E : 34.33 Average P/B : 7.72 Average Dividend Yield : 0.67
Portfolio turnover has been computed as the ratio of the lower value of purchase and sales, to the average net assets in the past one year (since inception for schemes that have not completed a year). The figures are not netted for derivative transactions.Risk-free rate based on the last Overnight MIBOR cut-off of 5.45%**In addition to the fund manager managing this fund, overseas investment is managed by Ms. Priyanka Khandelwal.@@ Total Expense Ratio is as on the last business day of the month.## Daily, Weekly and Fortnightly frequencies are available in Systematic Investment Plan (SIP), in addition to existing Monthly & Quarterly frequencies with effect from February 1, 2019. Minimum number of installments for daily, weekly, fortnightly and monthly frequencies will be 6 and for Quarterly frequency will be 4.* Minimum number of installments for daily, weekly and monthly frequency will be 6 and for Quarterly frequency will be 4. w.e.f February 01, 2017. Refer page No. 148 for definition of Flex STP and Value STP.&& Monthly, Quarterly, Half Yearly and Annual frequencies are available in Systematic Withdrawal Plan (SWP). The minimum number of instalments for all the frequencies will be 2.*** In case the unit holder has opted for dividend payout option, the minimum amount for dividend payout shall be 100 (net of dividend distribution tax and other statutory levy, if any), else the dividend would be mandatorily reinvested.ICICI Prudential Monthly Income Plan has been merged into ICICI Prudential Regular Savings Fund after the close of business hours on May 25, 2018. The performance disclosed above is of ICICI Prudential Regular Savings Fund. Performance of the merging schemes shall be made available to investors on request.
Exit load for Redemption / Switch out :-Lumpsum & SIP / STP / SWP
Fund Managers** :
Indicative Investment Horizon: 3 years & above
Inception/Allotment date: 30-Mar-04
NAV (As on 30-Aug-19):IPRSF Growth Option : 43.2105IPRSF Dividend Option : 13.6370IPRSF Direct Plan Growth Option : 45.4351IPRSF Direct Plan Dividend Option : 15.5515
&&SWP :
Rs. 500/- and in multiples of Rs. 1/-
STP/ Flex STP/ Value STP * :Daily Frequency: Rs. 250/- and in multiples of Rs. 1/-Weekly, Monthly and Quarterly Frequency: Rs. 1,000/- and in multiples of Rs. 1/-
Equity : Rajat Chandak(Managing this fund since Feb, 2015 &Overall 11 years of experience)Debt : Manish Banthia (Managing this fund since Sep, 2013 & Overall 16 years of experience)
Application Amount for freshSubscription :Rs.5,000 (plus in multiples of Re.1)
Options : Growth / Growth AEP (Regularand Appreciation), Dividend (Monthly, Quarterly and Half-yearly).(dividend payout*** and re-investmentfacility available)
Min.Addl.Investment :
Rs.500/- & in multiples thereof
Upto 10% of units within 1 Year from the date of allotment - Nil More than 10% of units within 1 Year from the date of allotment - 1% of applicable Net Asset Value (NAV) After 1 Year from the date of allotment - Nil w.e.f. 10th November 2016.
##SIP :Daily, Weekly, Fortnightly & Monthly Frequency: Rs. 100/- and in multiple of Rs. 1/-Quarterly Frequency: Rs. 5,000/- and in multiple of Rs. 1/-
Min.Redemption Amt. :
500/- or all units where amount is below 500/-
Monthly AAUM as on 31-Aug-19 : Rs. 1,639.25 crores
Closing AUM as on 31-Aug-19 : Rs. 1,639.51 crores
Portfolio as on August 31, 2019
Returns of ICICI Prudential Regular Savings Fund - Growth Option as on August 31, 2019 - (IPRSF)
Equity
Debt
ICICI Prudential Regular Savings Fund(erstwhile ICICI Prudential MIP 25)
(An open ended hybrid scheme investing predominantly indebt instruments)
Entry load : Not Applicable
Std Dev (Annualised) : 3.28% Sharpe Ratio : 0.63 Portfolio Beta : 0.80 R squared : 0.68 Benchmark Std Dev (Annualised) : 3.37%
RiskometerThis Product is suitable for investors who are seeking*:
• Medium to long term regular income solution
• A hybrid fund that aims to generate regular income through investments primarily in debt and money market instruments and long term capital appreciation by investing a portion in equity.
*Investors should consult their financial advisers if in doubt about whether the product is suitable for them.
Annual Portfolio Turnover Ratio : Equity - 0.02 times, Others (Debt and Derivatives) - 0.62 times Combined Annual Portfolio Turnover Ratio : 0.64 times
Rating Profile (as % of debt component)
Dividend History : Refer page no. from 132 to 140
SIP Returns : Refer page no. from 128 to 130
Total Expense Ratio @@ :
IPRSF : 1.94% p. a.
IPRSF Direct Plan : 1.35% p. a.
Investment Objective : Refer page no. from 141 to 145
Notes:1. Different plans shall have different expense structure. The performance details provided herein are of ICICI Prudential Regular Savings Fund.2. The scheme is currently managed and Manish Banthia. Mr. has been managing this fund since Feb 2015. Total Schemes managed by by Rajat Chandak Rajat Chandakthe Fund Manager . Refer annexure from page no. 38 for performance of other schemes currently managed by .(Equity) is 9 (9 are jointly managed) Rajat ChandakMr. Manish Banthia has been managing this fund since Sep 2013. Total Schemes managed by the Fund Manager . Refer annexure from (Debt) is 23 (17 are jointly managed)page no. 38 for performance of other schemes currently managed by Manish Banthia. 3. Date of inception: 30-Mar-04 .4. Past performance may or may not be sustained in future and the same may not necessarily provide the basis for comparison with other investment.5. Load is not considered for computation of returns.6. In case, the start/end date of the concerned period is a nonbusiness date (NBD), the NAV of the previous date is considered for computation of returns. The NAV per unit shown in the table is as on the start date of the said period7. The performance of the scheme is benchmarked to the Total Return variant of the Index. The benchmark of the scheme has been revised from CRISIL Hybrid 85+15 - Conservative Index to Nifty 50 Hybrid Composite Debt 15:85 Index w.e.f. May 28, 2018.
Scheme
CRISIL 10 year Gilt index (Additional Benchmark)
NAV (Rs.) Per Unit (as on August 30,2019 : 43.2105)
CAGR (%)
10.00
Nifty 50 Hybrid Composite Debt 15:85 Index (Benchmark)
Since inception
CurrentValue of
Investment of Rs. 10000
CAGR (%) Current Value of
Investment of Rs. 10000
1 Year 3 Year 5 Year
CAGR (%) Current Value of
Investment of Rs. 10000
CAGR (%) Current Value of
Investment of Rs. 10000
40.7101 34.5787 27.3028
Particulars
6.16 10614.20 7.72 12496.28 9.60 15826.40 9.95 43210.50
10.63 11059.93 7.93 12570.44 9.07 15449.28 8.38 34591.86
16.40 11635.14 6.95 12230.35 8.97 15379.44 5.82 23937.98
High Medium Low
Low
Short
Medium
Credit Quality
Duration
Medium to Long
Long
Modified Duration : 1.86 Years
Equity Shares 14.07% 3.03% Auto 1.40% Maruti Suzuki India Ltd. 0.67% TVS Motor Company Ltd. 0.49% Eicher Motors Ltd. 0.25% Auto Ancillaries 0.79% Motherson Sumi Systems Ltd. 0.79% Banks 3.62% HDFC Bank Ltd. 1.38% ICICI Bank Ltd. 0.94% State Bank Of India 0.71% Axis Bank Ltd. 0.59% Cement 0.64% JK Lakshmi Cement Ltd. 0.39% Prism Johnson Ltd. 0.25% Construction 0.48% KNR Constructions Ltd. 0.48% Consumer Non Durables 1.95% Britannia Industries Ltd. 0.64% Asian Paints Ltd. 0.62% ITC Ltd. 0.51% Hindustan Unilever Ltd. 0.18% Finance 0.66% Bajaj Finserv Ltd. 0.60% Equitas Holdings Ltd. 0.05% Sundaram Finance Holdings Ltd. 0.02% Hotels, Resorts And Other Recreational Activities 0.53% The Indian Hotels Company Ltd. 0.53% Industrial Capital Goods 0.28% Bharat Electronics Ltd. 0.28% Media & Entertainment 0.92% PVR Ltd. 0.92% Petroleum Products 0.56% Reliance Industries Ltd. 0.56% Pharmaceuticals 0.53% Cipla Ltd. 0.31% Biocon Ltd. 0.21% Retailing 0.52% Avenue Supermarts Ltd. (D-Mart) 0.52% Software 0.61% Tata Consultancy Services Ltd. 0.52% Tech Mahindra Ltd. 0.09% Transportation 0.58% Interglobe Aviation Ltd. 0.58% Index Futures/Options 3.03% Nifty 50 Index - Futures 3.03% Debt Holdings 83.15% Corporate Securities 69.36% • Housing and Urban Development Corporation Ltd. ICRA AAA 6.50%• Nayara Energy Ltd. CARE AA 6.12% • Aqua Space Developers Pvt. Ltd. (guarantee from My Home Constructions Private Limited) FITCH A 6.09% • Talwandi Sabo Power Ltd. (Guarantee from Vedanta Ltd.) CRISIL AA(SO) 5.93% • Tata Value Homes Ltd. CARE AA 4.58%
Company/Issuer Rating % to % to NAV NAV Derivatives
• Tata Steel Ltd. BWR AA 4.52% • Prestige Estates Projects Ltd. ICRA A+ 4.51% • IDBI Bank Ltd. ICRA A 4.02% • ICICI Bank Ltd. ICRA AAA 4.02% • EMBASSY OFFICE PARKS REIT CRISIL AAA 3.81% Jamnagar Utilities & Power Private Ltd. CRISIL AAA 3.37% Axis Bank Ltd. CRISIL AA+ 2.72% Sikka Ports & Terminals Ltd. CRISIL AAA 2.47% Hinduja Leyland Finance Ltd. (Hinduja Group) CARE AA- 2.14% HDFC Ltd. CRISIL AAA 1.84% JSW Steel Ltd. CARE AA 1.54% ICICI Bank Ltd. ICRA AA+ 1.53% PVR Ltd. CRISIL AA- 1.25% The Indian Hotels Company Ltd. ICRA AA 0.93% State Bank Of India CRISIL AA+ 0.79% Power Grid Corporation Of India Ltd. CRISIL AAA 0.32% Nuvoco Vistas Corporation Ltd. (Nirma Group) CRISIL AA 0.30% NHPC Ltd. FITCH AAA 0.06% Britannia Industries Ltd. CRISIL AAA 0.01%
& Pass Through Certificates 5.39% IIERT June 2018 II (Originator - SREI Equipment Finance Ltd.) CRISIL AAA(SO) 3.14% MFL Securitisation Trust LXX (Originator is Magma Fincorp Ltd.) FITCH AAA(SO) 1.07% MFL Securitisation Trust LXXX (Originator is Magma Fincorp Ltd.) CRISIL AAA(SO) 0.63% MFL Securitisation Trust XLIX (Originator is Magma Fincorp Ltd.) CRISIL AAA(SO) 0.55% Cash, Call, TREPS & Term Deposits 8.40% Net Current Assets 2.79% Total Net Assets 100.00%
Company/Issuer Rating % to % to NAV NAV Derivatives
33.51%
39.01%
17.64%
9.84%
0% 5% 10% 15% 20% 25% 30% 35% 40% 45%
AAA and Equivalent
AA and Equivalent
A and Equivalent
TREPS, Term Deposits & Current Assets
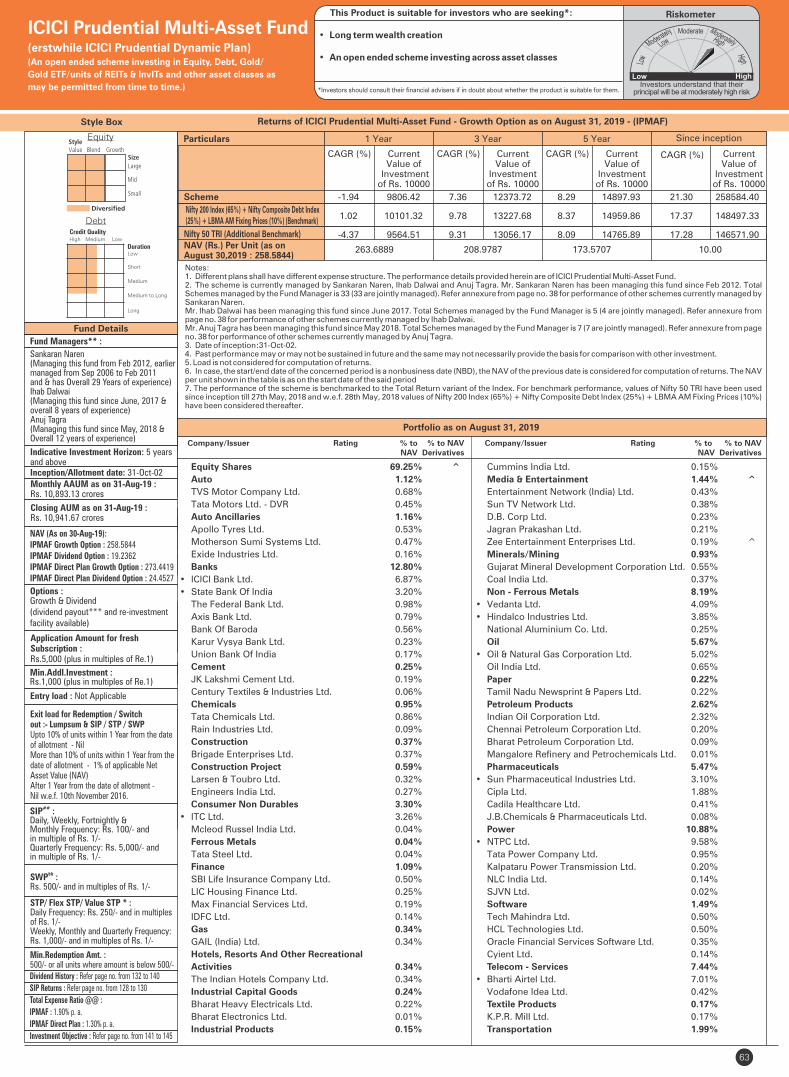
Returns of ICICI Prudential Multi-Asset Fund - Growth Option as on August 31, 2019 - (IPMAF)
Portfolio as on August 31, 2019
Fund Managers** :
Sankaran Naren (Managing this fund from Feb 2012, earlier managed from Sep 2006 to Feb 2011 and & has Overall 29 Years of experience)Ihab Dalwai(Managing this fund since June, 2017 & overall 8 years of experience)Anuj Tagra(Managing this fund since May, 2018 &Overall 12 years of experience)
Indicative Investment Horizon: 5 yearsand aboveInception/Allotment date: 31-Oct-02
NAV (As on 30-Aug-19):IPMAF Growth Option : 258.5844IPMAF Dividend Option : 19.2362IPMAF Direct Plan Growth Option : 273.4419IPMAF Direct Plan Dividend Option : 24.4527
Options :Growth & Dividend(dividend payout*** and re-investment facility available)
Application Amount for freshSubscription :Rs.5,000 (plus in multiples of Re.1)
Min.Addl.Investment :Rs.1,000 (plus in multiples of Re.1)
Exit load for Redemption / Switchout :- Lumpsum & SIP / STP / SWP Upto 10% of units within 1 Year from the date of allotment - Nil More than 10% of units within 1 Year from the date of allotment - 1% of applicable Net Asset Value (NAV) After 1 Year from the date of allotment - Nil w.e.f. 10th November 2016.
&&SWP :Rs. 500/- and in multiples of Rs. 1/-
STP/ Flex STP/ Value STP * :Daily Frequency: Rs. 250/- and in multiples of Rs. 1/-Weekly, Monthly and Quarterly Frequency: Rs. 1,000/- and in multiples of Rs. 1/-
Min.Redemption Amt. :500/- or all units where amount is below 500/-
Fund Details
63
Style Box
Monthly AAUM as on 31-Aug-19 : Rs. 10,893.13 crores
ICICI Prudential Multi-Asset Fund(erstwhile ICICI Prudential Dynamic Plan)(An open ended scheme investing in Equity, Debt, Gold/
Gold ETF/units of REITs & InvITs and other asset classes as
may be permitted from time to time.)
Closing AUM as on 31-Aug-19 : Rs. 10,941.67 crores
Entry load : Not Applicable
RiskometerThis Product is suitable for investors who are seeking*:
• Long term wealth creation • An open ended scheme investing across asset classes
*Investors should consult their financial advisers if in doubt about whether the product is suitable for them.
Dividend History : Refer page no. from 132 to 140
SIP Returns : Refer page no. from 128 to 130
Total Expense Ratio @@ :
IPMAF : 1.90% p. a.
IPMAF Direct Plan : 1.30% p. a.
Investment Objective : Refer page no. from 141 to 145
Equity Shares 69.25% ^
Auto 1.12%
TVS Motor Company Ltd. 0.68%
Tata Motors Ltd. - DVR 0.45%
Auto Ancillaries 1.16%
Apollo Tyres Ltd. 0.53%
Motherson Sumi Systems Ltd. 0.47%
Exide Industries Ltd. 0.16%
Banks 12.80%
• ICICI Bank Ltd. 6.87%
• State Bank Of India 3.20%
The Federal Bank Ltd. 0.98%
Axis Bank Ltd. 0.79%
Bank Of Baroda 0.56%
Karur Vysya Bank Ltd. 0.23%
Union Bank Of India 0.17%
Cement 0.25%
JK Lakshmi Cement Ltd. 0.19%
Century Textiles & Industries Ltd. 0.06%
Chemicals 0.95%
Tata Chemicals Ltd. 0.86%
Rain Industries Ltd. 0.09%
Construction 0.37%
Brigade Enterprises Ltd. 0.37%
Construction Project 0.59%
Larsen & Toubro Ltd. 0.32%
Engineers India Ltd. 0.27%
Consumer Non Durables 3.30%
• ITC Ltd. 3.26%
Mcleod Russel India Ltd. 0.04%
Ferrous Metals 0.04%
Tata Steel Ltd. 0.04%
Finance 1.09%
SBI Life Insurance Company Ltd. 0.50%
LIC Housing Finance Ltd. 0.25%
Max Financial Services Ltd. 0.19%
IDFC Ltd. 0.14%
Gas 0.34%
GAIL (India) Ltd. 0.34%
Hotels, Resorts And Other Recreational
Activities 0.34%
The Indian Hotels Company Ltd. 0.34%
Industrial Capital Goods 0.24%
Bharat Heavy Electricals Ltd. 0.22%
Bharat Electronics Ltd. 0.01%
Industrial Products 0.15%
Cummins India Ltd. 0.15%
Media & Entertainment 1.44% ^
Entertainment Network (India) Ltd. 0.43%
Sun TV Network Ltd. 0.38%
D.B. Corp Ltd. 0.23%
Jagran Prakashan Ltd. 0.21%
Zee Entertainment Enterprises Ltd. 0.19% ^
Minerals/Mining 0.93%
Gujarat Mineral Development Corporation Ltd. 0.55%
Coal India Ltd. 0.37%
Non - Ferrous Metals 8.19%
• Vedanta Ltd. 4.09%
• Hindalco Industries Ltd. 3.85%
National Aluminium Co. Ltd. 0.25%
Oil 5.67%
• Oil & Natural Gas Corporation Ltd. 5.02%
Oil India Ltd. 0.65%
Paper 0.22%
Tamil Nadu Newsprint & Papers Ltd. 0.22%
Petroleum Products 2.62%
Indian Oil Corporation Ltd. 2.32%
Chennai Petroleum Corporation Ltd. 0.20%
Bharat Petroleum Corporation Ltd. 0.09%
Mangalore Refinery and Petrochemicals Ltd. 0.01%
Pharmaceuticals 5.47%
• Sun Pharmaceutical Industries Ltd. 3.10%
Cipla Ltd. 1.88%
Cadila Healthcare Ltd. 0.41%
J.B.Chemicals & Pharmaceuticals Ltd. 0.08%
Power 10.88%
• NTPC Ltd. 9.58%
Tata Power Company Ltd. 0.95%
Kalpataru Power Transmission Ltd. 0.20%
NLC India Ltd. 0.14%
SJVN Ltd. 0.02%
Software 1.49%
Tech Mahindra Ltd. 0.50%
HCL Technologies Ltd. 0.50%
Oracle Financial Services Software Ltd. 0.35%
Cyient Ltd. 0.14%
Telecom - Services 7.44%
• Bharti Airtel Ltd. 7.01%
Vodafone Idea Ltd. 0.42%
Textile Products 0.17%
K.P.R. Mill Ltd. 0.17%
Transportation 1.99%
Company/Issuer Rating % to % to NAV NAV Derivatives
Company/Issuer Rating % to % to NAV NAV Derivatives
##SIP :Daily, Weekly, Fortnightly & Monthly Frequency: Rs. 100/- and in multiple of Rs. 1/-Quarterly Frequency: Rs. 5,000/- and in multiple of Rs. 1/-
Scheme
NAV (Rs.) Per Unit (as on August 30,2019 : 258.5844)
CAGR (%)
10.00
Since inception
CurrentValue of
Investment of Rs. 10000
CAGR (%) Current Value of
Investment of Rs. 10000
1 Year 3 Year 5 Year
CAGR (%) Current Value of
Investment of Rs. 10000
CAGR (%) Current Value of
Investment of Rs. 10000
263.6889 208.9787 173.5707
Particulars
-1.94 9806.42 7.36 12373.72 8.29 14897.93 21.30 258584.40
1.02 10101.32 9.78 13227.68 8.37 14959.86 17.37 148497.33
-4.37 9564.51 9.31 13056.17 8.09 14765.89 17.28 146571.90High Medium Low
Low
Short
Medium
Credit Quality
Duration
Medium to Long
Long
Equity
Debt
Nifty 50 TRI (Additional Benchmark)
Notes:1. Different plans shall have different expense structure. The performance details provided herein are of ICICI Prudential Multi-Asset Fund.2. The scheme is currently managed by and . Mr. has been managing this fund since . Total Sankaran Naren, Ihab Dalwai Anuj Tagra Sankaran Naren Feb 2012Schemes managed by the Fund Manager is 33 (33 are jointly managed). Refer annexure from page no. 38 for performance of other schemes currently managed by Sankaran Naren.Mr. Ihab Dalwai has been managing this fund since June 2017. Total Schemes managed by the Fund Manager is . Refer annexure from 5 (4 are jointly managed)page no. 38 for performance of other schemes currently managed by Ihab Dalwai.Mr. Anuj Tagra has been managing this fund since May 2018. Total Schemes managed by the Fund Manager is 7 (7 are jointly managed). Refer annexure from page no. 38 for performance of other schemes currently managed by Anuj Tagra.3. Date of inception:31-Oct-02.4. Past performance may or may not be sustained in future and the same may not necessarily provide the basis for comparison with other investment.5. Load is not considered for computation of returns.6. In case, the start/end date of the concerned period is a nonbusiness date (NBD), the NAV of the previous date is considered for computation of returns. The NAV per unit shown in the table is as on the start date of the said period7. The performance of the scheme is benchmarked to the Total Return variant of the Index. For benchmark performance, values of Nifty 50 TRI have been used since inception till 27th May, 2018 and w.e.f. 28th May, 2018 values of Nifty 200 Index (65%) + Nifty Composite Debt Index (25%) + LBMA AM Fixing Prices (10%) have been considered thereafter.
Nifty 200 Index (65%) + Nifty Composite Debt Index (25%) + LBMA AM Fixing Prices (10%) (Benchmark)
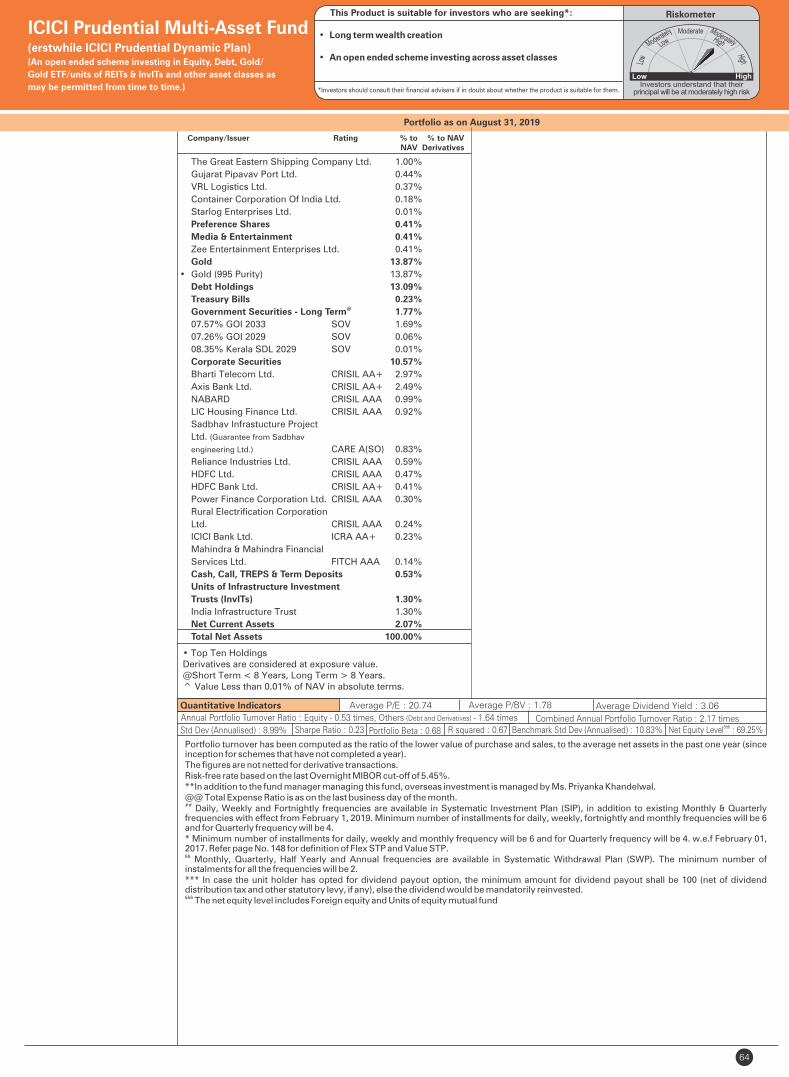
The Great Eastern Shipping Company Ltd. 1.00%
Gujarat Pipavav Port Ltd. 0.44%
VRL Logistics Ltd. 0.37%
Container Corporation Of India Ltd. 0.18%
Starlog Enterprises Ltd. 0.01%
Preference Shares 0.41%
Media & Entertainment 0.41%
Zee Entertainment Enterprises Ltd. 0.41%
Gold 13.87%
• Gold (995 Purity) 13.87%
Debt Holdings 13.09%
Treasury Bills 0.23% @ Government Securities - Long Term 1.77%
07.57% GOI 2033 SOV 1.69%
07.26% GOI 2029 SOV 0.06%
08.35% Kerala SDL 2029 SOV 0.01%
Corporate Securities 10.57%
Bharti Telecom Ltd. CRISIL AA+ 2.97%
Axis Bank Ltd. CRISIL AA+ 2.49%
NABARD CRISIL AAA 0.99%
LIC Housing Finance Ltd. CRISIL AAA 0.92%
Sadbhav Infrastucture Project
Ltd. (Guarantee from Sadbhav
engineering Ltd.) CARE A(SO) 0.83%
Reliance Industries Ltd. CRISIL AAA 0.59%
HDFC Ltd. CRISIL AAA 0.47%
HDFC Bank Ltd. CRISIL AA+ 0.41%
Power Finance Corporation Ltd. CRISIL AAA 0.30%
Rural Electrification Corporation
Ltd. CRISIL AAA 0.24%
ICICI Bank Ltd. ICRA AA+ 0.23%
Mahindra & Mahindra Financial
Services Ltd. FITCH AAA 0.14%
Cash, Call, TREPS & Term Deposits 0.53%
Units of Infrastructure Investment
Trusts (InvITs) 1.30%
India Infrastructure Trust 1.30%
Net Current Assets 2.07%
Total Net Assets 100.00%
Portfolio as on August 31, 2019
Quantitative Indicators
• Top Ten Holdings Derivatives are considered at exposure value.@Short Term < 8 Years, Long Term > 8 Years.^ Value Less than 0.01% of NAV in absolute terms.
Std Dev (Annualised) : 8.99% Sharpe Ratio : 0.23
Average P/E : 20.74 Average P/BV : 1.78 Average Dividend Yield : 3.06
Portfolio Beta : 0.68 R squared : 0.67
Portfolio turnover has been computed as the ratio of the lower value of purchase and sales, to the average net assets in the past one year (since inception for schemes that have not completed a year). The figures are not netted for derivative transactions.Risk-free rate based on the last Overnight MIBOR cut-off of 5.45%.**In addition to the fund manager managing this fund, overseas investment is managed by Ms. Priyanka Khandelwal.@@ Total Expense Ratio is as on the last business day of the month.## Daily, Weekly and Fortnightly frequencies are available in Systematic Investment Plan (SIP), in addition to existing Monthly & Quarterly frequencies with effect from February 1, 2019. Minimum number of installments for daily, weekly, fortnightly and monthly frequencies will be 6 and for Quarterly frequency will be 4.* Minimum number of installments for daily, weekly and monthly frequency will be 6 and for Quarterly frequency will be 4. w.e.f February 01, 2017. Refer page No. 148 for definition of Flex STP and Value STP.&&
Monthly, Quarterly, Half Yearly and Annual frequencies are available in Systematic Withdrawal Plan (SWP). The minimum number of instalments for all the frequencies will be 2.*** In case the unit holder has opted for dividend payout option, the minimum amount for dividend payout shall be 100 (net of dividend distribution tax and other statutory levy, if any), else the dividend would be mandatorily reinvested.&&& The net equity level includes Foreign equity and Units of equity mutual fund
64
&&&Net Equity Level : 69.25%
ICICI Prudential Multi-Asset Fund(erstwhile ICICI Prudential Dynamic Plan)(An open ended scheme investing in Equity, Debt, Gold/
Gold ETF/units of REITs & InvITs and other asset classes as
may be permitted from time to time.)
Benchmark Std Dev (Annualised) : 10.83%
RiskometerThis Product is suitable for investors who are seeking*:
• Long term wealth creation • An open ended scheme investing across asset classes
*Investors should consult their financial advisers if in doubt about whether the product is suitable for them.
Annual Portfolio Turnover Ratio : Equity - 0.53 times, Others (Debt and Derivatives) - 1.64 times Combined Annual Portfolio Turnover Ratio : 2.17 times
Company/Issuer Rating % to % to NAV NAV Derivatives
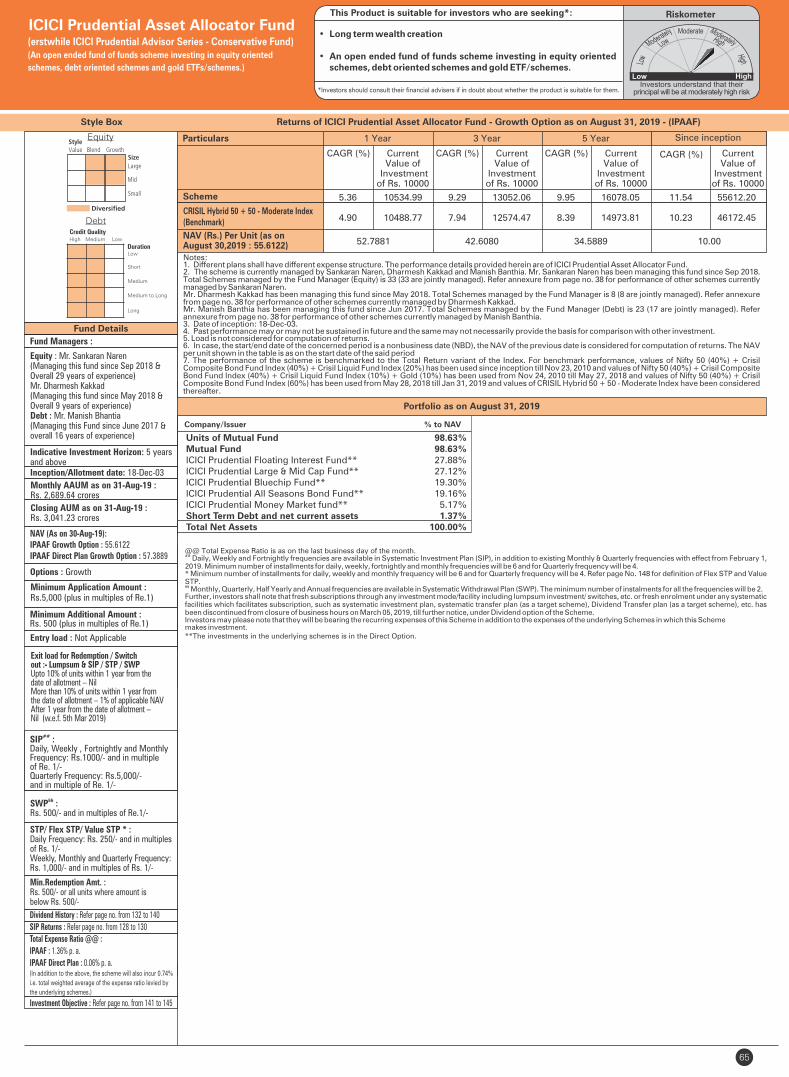
Fund Managers :
Equity : Mr. Sankaran Naren (Managing this fund since Sep 2018 & Overall 29 years of experience) Mr. Dharmesh Kakkad (Managing this fund since May 2018 & Overall 9 years of experience) Debt : Mr. Manish Bhantia (Managing this Fund since June 2017 & overall 16 years of experience)
Indicative Investment Horizon: 5 yearsand aboveInception/Allotment date: 18-Dec-03
NAV (As on 30-Aug-19):IPAAF Growth Option : 55.6122IPAAF Direct Plan Growth Option : 57.3889
Options : Growth
Minimum Application Amount :Rs.5,000 (plus in multiples of Re.1)
Minimum Additional Amount :Rs. 500 (plus in multiples of Re.1)
&&SWP :Rs. 500/- and in multiples of Re.1/-
STP/ Flex STP/ Value STP * :Daily Frequency: Rs. 250/- and in multiples of Rs. 1/-Weekly, Monthly and Quarterly Frequency: Rs. 1,000/- and in multiples of Rs. 1/-
Min.Redemption Amt. :Rs. 500/- or all units where amount is below Rs. 500/-
Fund Details
65
Style Box
Monthly AAUM as on 31-Aug-19 : Rs. 2,689.64 crores
(erstwhile ICICI Prudential Advisor Series - Conservative Fund)(An open ended fund of funds scheme investing in equity oriented
schemes, debt oriented schemes and gold ETFs/schemes.)
Closing AUM as on 31-Aug-19 : Rs. 3,041.23 crores
Entry load : Not Applicable
RiskometerThis Product is suitable for investors who are seeking*:
• Long term wealth creation
• An open ended fund of funds scheme investing in equity oriented schemes, debt oriented schemes and gold ETF/schemes.
*Investors should consult their financial advisers if in doubt about whether the product is suitable for them.
Dividend History : Refer page no. from 132 to 140
SIP Returns : Refer page no. from 128 to 130
Total Expense Ratio @@ :
IPAAF : 1.36% p. a.
IPAAF Direct Plan : 0.06% p. a.(In addition to the above, the scheme will also incur 0.74%
i.e. total weighted average of the expense ratio levied by
the underlying schemes.)
Investment Objective : Refer page no. from 141 to 145
Company/Issuer % to NAV
##SIP :Daily, Weekly , Fortnightly and Monthly Frequency: Rs.1000/- and in multiple of Re. 1/- Quarterly Frequency: Rs.5,000/- and in multiple of Re. 1/-
High Medium Low
Low
Short
Medium
Credit Quality
Duration
Medium to Long
Long
Equity
Debt
Notes:1. Different plans shall have different expense structure. The performance details provided herein are of ICICI Prudential Asset Allocator Fund.2. The scheme is currently managed by Sankaran Naren, Dharmesh Kakkad and Manish Banthia. Mr. Sankaran Naren has been managing this fund since Sep 2018. Total Schemes managed by the Fund Manager (Equity) is 33 (33 are jointly managed). Refer annexure from page no. 38 for performance of other schemes currently managed by Sankaran Naren.Mr. Dharmesh Kakkad has been managing this fund since May 2018. Total Schemes managed by the Fund Manager is 8 (8 are jointly managed). Refer annexure from page no. 38 for performance of other schemes currently managed by Dharmesh Kakkad.Mr. Manish Banthia has been managing this fund since . Total Schemes managed by the Fund Manager . Refer Jun 2017 (Debt) is 23 (17 are jointly managed)annexure from page no. 38 for performance of other schemes currently managed by Manish Banthia. 3. Date of inception: 18-Dec-03.4. Past performance may or may not be sustained in future and the same may not necessarily provide the basis for comparison with other investment.5. Load is not considered for computation of returns.6. In case, the start/end date of the concerned period is a nonbusiness date (NBD), the NAV of the previous date is considered for computation of returns. The NAV per unit shown in the table is as on the start date of the said period7. The performance of the scheme is benchmarked to the Total Return variant of the Index. For benchmark performance, values of Nifty 50 (40%) + Crisil Composite Bond Fund Index (40%) + Crisil Liquid Fund Index (20%) has been used since inception till Nov 23, 2010 and values of Nifty 50 (40%) + Crisil Composite Bond Fund Index (40%) + Crisil Liquid Fund Index (10%) + Gold (10%) has been used from Nov 24, 2010 till May 27, 2018 and values of Nifty 50 (40%) + Crisil Composite Bond Fund Index (60%) has been used from May 28, 2018 till Jan 31, 2019 and values of CRISIL Hybrid 50 + 50 - Moderate Index have been considered thereafter.
Scheme
NAV (Rs.) Per Unit (as on August 30,2019 : 55.6122)
CAGR (%)
10.00
CRISIL Hybrid 50 + 50 - Moderate Index (Benchmark)
Since inception
CurrentValue of
Investment of Rs. 10000
CAGR (%) Current Value of
Investment of Rs. 10000
1 Year 3 Year 5 Year
CAGR (%) Current Value of
Investment of Rs. 10000
CAGR (%) Current Value of
Investment of Rs. 10000
52.7881 42.6080 34.5889
Particulars
5.36 10534.99 9.29 13052.06 9.95 16078.05 11.54 55612.20
4.90 10488.77 7.94 12574.47 8.39 14973.81 10.23 46172.45
Returns of ICICI Prudential Asset Allocator Fund - Growth Option as on August 31, 2019 - (IPAAF)
Portfolio as on August 31, 2019
ICICI Prudential Asset Allocator Fund
@@ Total Expense Ratio is as on the last business day of the month.## Daily, Weekly and Fortnightly frequencies are available in Systematic Investment Plan (SIP), in addition to existing Monthly & Quarterly frequencies with effect from February 1, 2019. Minimum number of installments for daily, weekly, fortnightly and monthly frequencies will be 6 and for Quarterly frequency will be 4.* Minimum number of installments for daily, weekly and monthly frequency will be 6 and for Quarterly frequency will be 4. Refer page No. 148 for definition of Flex STP and Value STP.&& Monthly, Quarterly, Half Yearly and Annual frequencies are available in Systematic Withdrawal Plan (SWP). The minimum number of instalments for all the frequencies will be 2.Further, investors shall note that fresh subscriptions through any investment mode/facility including lumpsum investment/ switches, etc. or fresh enrolment under any systematic facilities which facilitates subscription, such as systematic investment plan, systematic transfer plan (as a target scheme), Dividend Transfer plan (as a target scheme), etc. has been discontinued from closure of business hours on March 05, 2019, till further notice, under Dividend option of the Scheme.Investors may please note that they will be bearing the recurring expenses of this Scheme in addition to the expenses of the underlying Schemes in which this Schememakes investment.**The investments in the underlying schemes is in the Direct Option.
Exit load for Redemption / Switchout :- Lumpsum & SIP / STP / SWP Upto 10% of units within 1 year from the date of allotment – Nil More than 10% of units within 1 year from the date of allotment – 1% of applicable NAV After 1 year from the date of allotment – Nil (w.e.f. 5th Mar 2019)
Units of Mutual Fund 98.63%Mutual Fund 98.63%ICICI Prudential Floating Interest Fund** 27.88%ICICI Prudential Large & Mid Cap Fund** 27.12%ICICI Prudential Bluechip Fund** 19.30%ICICI Prudential All Seasons Bond Fund** 19.16%ICICI Prudential Money Market fund** 5.17%Short Term Debt and net current assets 1.37%Total Net Assets 100.00%
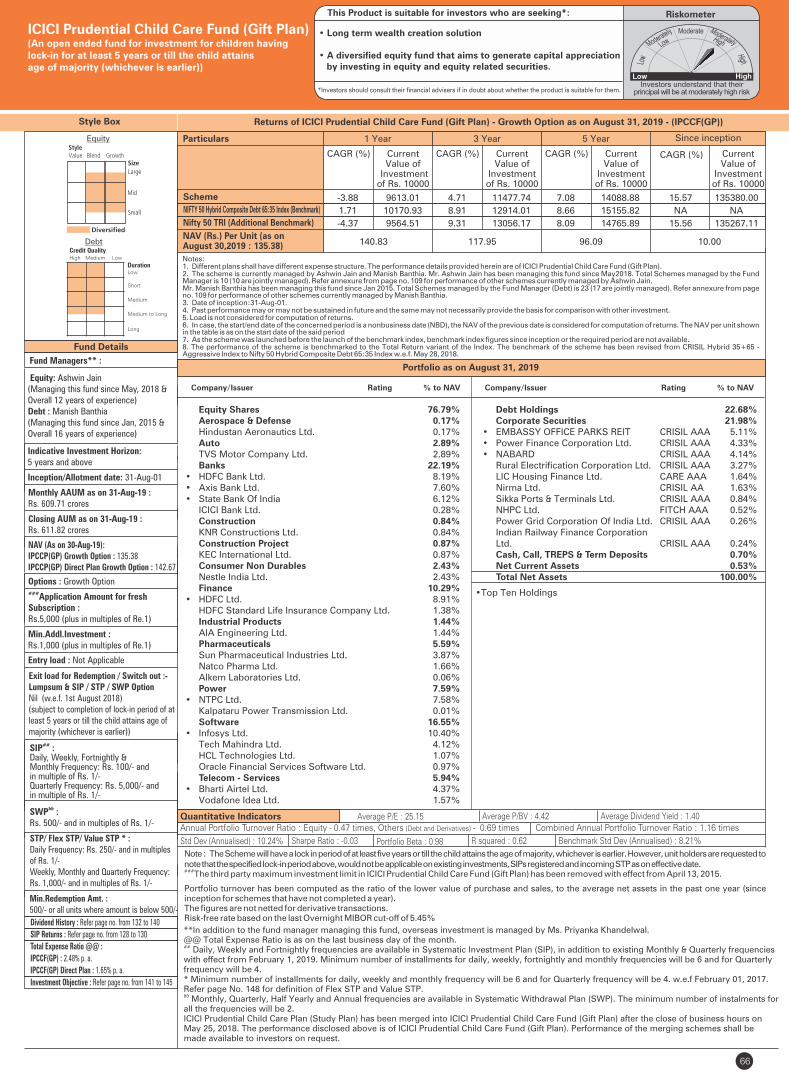
66
Fund Details
Quantitative Indicators
Style Box
Fund Managers** :
Equity: Ashwin Jain(Managing this fund since May, 2018 &Overall 12 years of experience)Debt : Manish Banthia(Managing this fund since Jan, 2015 &Overall 16 years of experience)
Indicative Investment Horizon:5 years and above
Inception/Allotment date: 31-Aug-01
Monthly AAUM as on 31-Aug-19 : Rs. 609.71 crores
Closing AUM as on 31-Aug-19 : Rs. 611.82 crores
NAV (As on 30-Aug-19):IPCCP(GP) Growth Option : 135.38IPCCP(GP) Direct Plan Growth Option : 142.67
Options : Growth Option###Application Amount for freshSubscription :Rs.5,000 (plus in multiples of Re.1)
Min.Addl.Investment :Rs.1,000 (plus in multiples of Re.1)
Exit load for Redemption / Switch out :- Lumpsum & SIP / STP / SWP OptionNil (w.e.f. 1st August 2018)(subject to completion of lock-in period of atleast 5 years or till the child attains age ofmajority (whichever is earlier))
##SIP :Daily, Weekly, Fortnightly & Monthly Frequency: Rs. 100/- and in multiple of Rs. 1/-Quarterly Frequency: Rs. 5,000/- and in multiple of Rs. 1/-
&&SWP :Rs. 500/- and in multiples of Rs. 1/-
STP/ Flex STP/ Value STP * :Daily Frequency: Rs. 250/- and in multiples of Rs. 1/-Weekly, Monthly and Quarterly Frequency: Rs. 1,000/- and in multiples of Rs. 1/-
Min.Redemption Amt. :500/- or all units where amount is below 500/-
Portfolio turnover has been computed as the ratio of the lower value of purchase and sales, to the average net assets in the past one year (since inception for schemes that have not completed a year). The figures are not netted for derivative transactions.Risk-free rate based on the last Overnight MIBOR cut-off of 5.45%
**In addition to the fund manager managing this fund, overseas investment is managed by Ms. Priyanka Khandelwal.@@ Total Expense Ratio is as on the last business day of the month.## Daily, Weekly and Fortnightly frequencies are available in Systematic Investment Plan (SIP), in addition to existing Monthly & Quarterly frequencies with effect from February 1, 2019. Minimum number of installments for daily, weekly, fortnightly and monthly frequencies will be 6 and for Quarterly frequency will be 4.* Minimum number of installments for daily, weekly and monthly frequency will be 6 and for Quarterly frequency will be 4. w.e.f February 01, 2017. Refer page No. 148 for definition of Flex STP and Value STP.&&
Monthly, Quarterly, Half Yearly and Annual frequencies are available in Systematic Withdrawal Plan (SWP). The minimum number of instalments for all the frequencies will be 2. ICICI Prudential Child Care Plan (Study Plan) has been merged into ICICI Prudential Child Care Fund (Gift Plan) after the close of business hours on May 25, 2018. The performance disclosed above is of ICICI Prudential Child Care Fund (Gift Plan). Performance of the merging schemes shall be made available to investors on request.
Std Dev (Annualised) : 10.24% Sharpe Ratio : -0.03
Average P/E : 25.15 Average P/BV : 4.42 Average Dividend Yield : 1.40
Portfolio Beta : 0.98 R squared : 0.62
Portfolio as on August 31, 2019
Returns of ICICI Prudential Child Care Fund (Gift Plan) - Growth Option as on August 31, 2019 - (IPCCF(GP))
• Top Ten Holdings
Note : The Scheme will have a lock in period of at least five years or till the child attains the age of majority, whichever is earlier. However, unit holders are requested to note that the specified lock-in period above, would not be applicable on existing investments, SIPs registered and incoming STP as on effective date.###
The third party maximum investment limit in ICICI Prudential Child Care Fund (Gift Plan) has been removed with effect from April 13, 2015.
ICICI Prudential Child Care Fund (Gift Plan)(An open ended fund for investment for children having lock-in for at least 5 years or till the child attainsage of majority (whichever is earlier))
Benchmark Std Dev (Annualised) : 8.21%
Entry load : Not Applicable
RiskometerThis Product is suitable for investors who are seeking*:
• Long term wealth creation solution
• A diversified equity fund that aims to generate capital appreciation by investing in equity and equity related securities.
*Investors should consult their financial advisers if in doubt about whether the product is suitable for them.
Annual Portfolio Turnover Ratio : Equity - 0.47 times, Others (Debt and Derivatives) - 0.69 times Combined Annual Portfolio Turnover Ratio : 1.16 times
Dividend History : Refer page no. from 132 to 140
SIP Returns : Refer page no. from 128 to 130
Total Expense Ratio @@ :
IPCCF(GP) : 2.48% p. a.
IPCCF(GP) Direct Plan : 1.65% p. a.
Investment Objective : Refer page no. from 141 to 145
Notes:1. Different plans shall have different expense structure. The performance details provided herein are of ICICI Prudential Child Care Fund (Gift Plan).2. The scheme is currently managed by Ashwin Jain and Manish Banthia. Mr. Ashwin Jain has been managing this fund since May2018. Total Schemes managed by the Fund Manager is 10 (10 are jointly managed). Refer annexure from page no. 109 for performance of other schemes currently managed by Ashwin Jain.Mr. Manish Banthia has been managing this fund since Jan 2015. Total Schemes managed by the Fund Manager . Refer annexure from page (Debt) is 23 (17 are jointly managed)no. 109 for performance of other schemes currently managed by Manish Banthia. 3. Date of inception:31-Aug-01.4. Past performance may or may not be sustained in future and the same may not necessarily provide the basis for comparison with other investment.5. Load is not considered for computation of returns.6. In case, the start/end date of the concerned period is a nonbusiness date (NBD), the NAV of the previous date is considered for computation of returns. The NAV per unit shown in the table is as on the start date of the said period7. As the scheme was launched before the launch of the benchmark index, benchmark index figures since inception or the required period are not available. 8. The performance of the scheme is benchmarked to the Total Return variant of the Index. The benchmark of the scheme has been revised from CRISIL Hybrid 35+65 - Aggressive Index to Nifty 50 Hybrid Composite Debt 65:35 Index w.e.f. May 28, 2018.
Scheme
Nifty 50 TRI (Additional Benchmark)
NAV (Rs.) Per Unit (as on August 30,2019 : 135.38)
CAGR (%)
10.00
NIFTY 50 Hybrid Composite Debt 65:35 Index (Benchmark)
Since inception
CurrentValue of
Investment of Rs. 10000
CAGR (%) Current Value of
Investment of Rs. 10000
1 Year 3 Year 5 Year
CAGR (%) Current Value of
Investment of Rs. 10000
CAGR (%) Current Value of
Investment of Rs. 10000
140.83 117.95 96.09
Particulars
-3.88 9613.01 4.71 11477.74 7.08 14088.88 15.57 135380.00
1.71 10170.93 8.91 12914.01 8.66 15155.82 NA NA
-4.37 9564.51 9.31 13056.17 8.09 14765.89 15.56 135267.11
High Medium Low
Low
Short
Medium
Credit Quality
Duration
Medium to Long
Long
Debt
Equity
Company/Issuer Rating % to NAV
Equity Shares 76.79% Aerospace & Defense 0.17% Hindustan Aeronautics Ltd. 0.17% Auto 2.89% TVS Motor Company Ltd. 2.89% Banks 22.19%• HDFC Bank Ltd. 8.19%• Axis Bank Ltd. 7.60%• State Bank Of India 6.12% ICICI Bank Ltd. 0.28% Construction 0.84% KNR Constructions Ltd. 0.84% Construction Project 0.87% KEC International Ltd. 0.87% Consumer Non Durables 2.43% Nestle India Ltd. 2.43% Finance 10.29%• HDFC Ltd. 8.91% HDFC Standard Life Insurance Company Ltd. 1.38% Industrial Products 1.44% AIA Engineering Ltd. 1.44% Pharmaceuticals 5.59% Sun Pharmaceutical Industries Ltd. 3.87% Natco Pharma Ltd. 1.66% Alkem Laboratories Ltd. 0.06% Power 7.59%• NTPC Ltd. 7.58% Kalpataru Power Transmission Ltd. 0.01% Software 16.55%• Infosys Ltd. 10.40% Tech Mahindra Ltd. 4.12% HCL Technologies Ltd. 1.07% Oracle Financial Services Software Ltd. 0.97% Telecom - Services 5.94%• Bharti Airtel Ltd. 4.37% Vodafone Idea Ltd. 1.57%
Debt Holdings 22.68% Corporate Securities 21.98%• EMBASSY OFFICE PARKS REIT CRISIL AAA 5.11%• Power Finance Corporation Ltd. CRISIL AAA 4.33%• NABARD CRISIL AAA 4.14% Rural Electrification Corporation Ltd. CRISIL AAA 3.27% LIC Housing Finance Ltd. CARE AAA 1.64% Nirma Ltd. CRISIL AA 1.63% Sikka Ports & Terminals Ltd. CRISIL AAA 0.84% NHPC Ltd. FITCH AAA 0.52% Power Grid Corporation Of India Ltd. CRISIL AAA 0.26% Indian Railway Finance Corporation Ltd. CRISIL AAA 0.24% Cash, Call, TREPS & Term Deposits 0.70% Net Current Assets 0.53% Total Net Assets 100.00%
Company/Issuer Rating % to NAV
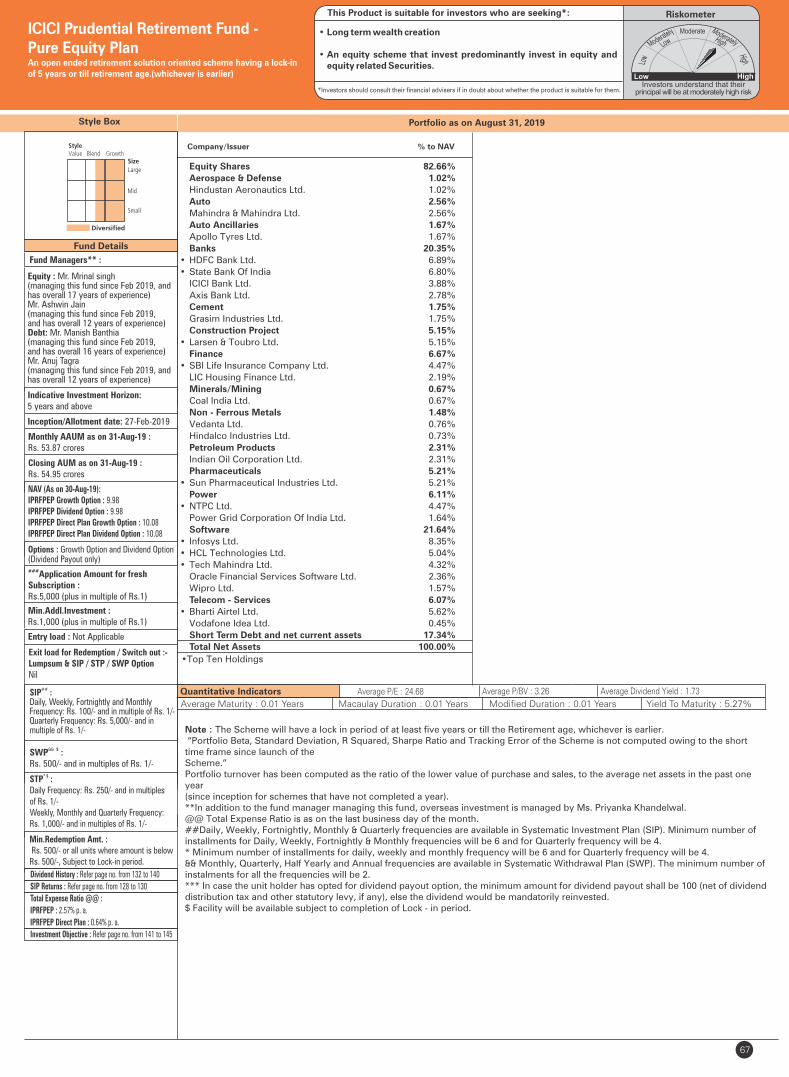
Portfolio as on August 31, 2019
67
ICICI Prudential Retirement Fund - Pure Equity PlanAn open ended retirement solution oriented scheme having a lock-in of 5 years or till retirement age.(whichever is earlier)
Company/Issuer % to NAV
Equity Shares 82.66%
Aerospace & Defense 1.02%
Hindustan Aeronautics Ltd. 1.02%
Auto 2.56%
Mahindra & Mahindra Ltd. 2.56%
Auto Ancillaries 1.67%
Apollo Tyres Ltd. 1.67%
Banks 20.35%
• HDFC Bank Ltd. 6.89%
• State Bank Of India 6.80%
ICICI Bank Ltd. 3.88%
Axis Bank Ltd. 2.78%
Cement 1.75%
Grasim Industries Ltd. 1.75%
Construction Project 5.15%
• Larsen & Toubro Ltd. 5.15%
Finance 6.67%
• SBI Life Insurance Company Ltd. 4.47%
LIC Housing Finance Ltd. 2.19%
Minerals/Mining 0.67%
Coal India Ltd. 0.67%
Non - Ferrous Metals 1.48%
Vedanta Ltd. 0.76%
Hindalco Industries Ltd. 0.73%
Petroleum Products 2.31%
Indian Oil Corporation Ltd. 2.31%
Pharmaceuticals 5.21%
• Sun Pharmaceutical Industries Ltd. 5.21%
Power 6.11%
• NTPC Ltd. 4.47%
Power Grid Corporation Of India Ltd. 1.64%
Software 21.64%
• Infosys Ltd. 8.35%
• HCL Technologies Ltd. 5.04%
• Tech Mahindra Ltd. 4.32%
Oracle Financial Services Software Ltd. 2.36%
Wipro Ltd. 1.57%
Telecom - Services 6.07%
• Bharti Airtel Ltd. 5.62%
Vodafone Idea Ltd. 0.45%
Short Term Debt and net current assets 17.34%
Total Net Assets 100.00%
Fund Details
Style Box
Fund Managers** :
Equity : Mr. Mrinal singh (managing this fund since Feb 2019, and has overall 17 years of experience)Mr. Ashwin Jain (managing this fund since Feb 2019, and has overall 12 years of experience)Debt: Mr. Manish Banthia (managing this fund since Feb 2019, and has overall 16 years of experience)Mr. Anuj Tagra (managing this fund since Feb 2019, and has overall 12 years of experience)
Indicative Investment Horizon:5 years and above
Inception/Allotment date: 27-Feb-2019
Monthly AAUM as on 31-Aug-19 : Rs. 53.87 crores
Closing AUM as on 31-Aug-19 : Rs. 54.95 crores
NAV (As on 30-Aug-19):IPRFPEP Growth Option : 9.98IPRFPEP Dividend Option : 9.98IPRFPEP Direct Plan Growth Option : 10.08IPRFPEP Direct Plan Dividend Option : 10.08
Options : Growth Option and Dividend Option (Dividend Payout only)###Application Amount for freshSubscription :Rs.5,000 (plus in multiple of Rs.1)
Min.Addl.Investment :Rs.1,000 (plus in multiple of Rs.1)
Exit load for Redemption / Switch out :- Lumpsum & SIP / STP / SWP OptionNil
SIP :##
Daily, Weekly, Fortnightly and Monthly Frequency: Rs. 100/- and in multiple of Rs. 1/-Quarterly Frequency: Rs. 5,000/- and in multiple of Rs. 1/-
$SWP :&&
Rs. 500/- and in multiples of Rs. 1/- * $STP :
Daily Frequency: Rs. 250/- and in multiplesof Rs. 1/-Weekly, Monthly and Quarterly Frequency:Rs. 1,000/- and in multiples of Rs. 1/-
Min.Redemption Amt. : Rs. 500/- or all units where amount is below Rs. 500/-, Subject to Lock-in period.
Entry load : Not Applicable
Dividend History : Refer page no. from 132 to 140
SIP Returns : Refer page no. from 128 to 130
Total Expense Ratio @@ :
IPRFPEP : 2.57% p. a.
IPRFPEP Direct Plan : 0.64% p. a.
Investment Objective : Refer page no. from 141 to 145
Note : The Scheme will have a lock in period of at least five years or till the Retirement age, whichever is earlier. “Portfolio Beta, Standard Deviation, R Squared, Sharpe Ratio and Tracking Error of the Scheme is not computed owing to the short time frame since launch of the Scheme.” Portfolio turnover has been computed as the ratio of the lower value of purchase and sales, to the average net assets in the past one year (since inception for schemes that have not completed a year). **In addition to the fund manager managing this fund, overseas investment is managed by Ms. Priyanka Khandelwal. @@ Total Expense Ratio is as on the last business day of the month. ##Daily, Weekly, Fortnightly, Monthly & Quarterly frequencies are available in Systematic Investment Plan (SIP). Minimum number of installments for Daily, Weekly, Fortnightly & Monthly frequencies will be 6 and for Quarterly frequency will be 4. * Minimum number of installments for daily, weekly and monthly frequency will be 6 and for Quarterly frequency will be 4. && Monthly, Quarterly, Half Yearly and Annual frequencies are available in Systematic Withdrawal Plan (SWP). The minimum number of instalments for all the frequencies will be 2. *** In case the unit holder has opted for dividend payout option, the minimum amount for dividend payout shall be 100 (net of dividend distribution tax and other statutory levy, if any), else the dividend would be mandatorily reinvested.$ Facility will be available subject to completion of Lock - in period.
RiskometerThis Product is suitable for investors who are seeking*:
*Investors should consult their financial advisers if in doubt about whether the product is suitable for them.
• Long term wealth creation
• An equity scheme that invest predominantly invest in equity and equity related Securities.
• Top Ten Holdings
Quantitative Indicators Average P/E : 24.68 Average P/BV : 3.26 Average Dividend Yield : 1.73
Average Maturity : 0.01 Years Macaulay Duration : 0.01 Years Yield To Maturity : 5.27%Modified Duration : 0.01 Years

Portfolio as on August 31, 2019
68
ICICI Prudential Retirement Fund - Hybrid Aggressive Plan
Company/Issuer % to NAV
Equity Shares 68.64%
Aerospace & Defense 1.11%
Hindustan Aeronautics Ltd. 1.11%
Auto 3.00%
Mahindra & Mahindra Ltd. 3.00%
Banks 20.67%
• HDFC Bank Ltd. 5.78%
• Axis Bank Ltd. 5.35%
• State Bank Of India 5.08%
• ICICI Bank Ltd. 4.46%
Cement 0.99%
Grasim Industries Ltd. 0.99%
Construction Project 5.06%
• Larsen & Toubro Ltd. 5.06%
Finance 1.16%
LIC Housing Finance Ltd. 1.16%
Non - Ferrous Metals 1.05%
Vedanta Ltd. 0.55%
Hindalco Industries Ltd. 0.50%
Petroleum Products 1.82%
Indian Oil Corporation Ltd. 1.82%
Pharmaceuticals 2.55%
Sun Pharmaceutical Industries Ltd. 2.55%
Power 7.13%
Power Grid Corporation Of India Ltd. 3.65%
NTPC Ltd. 3.48%
Software 19.61%
• Infosys Ltd. 6.83%
• Tech Mahindra Ltd. 5.04%
• HCL Technologies Ltd. 4.49%
Wipro Ltd. 1.99%
Oracle Financial Services Software Ltd. 1.25%
Telecom - Services 4.49%
• Bharti Airtel Ltd. 4.18%
Vodafone Idea Ltd. 0.31%
Debt Holdings 30.32%
Corporate Securities 21.82%
• Housing and Urban Development
Corporation Ltd. ICRA AAA 4.03%
ICICI Bank Ltd. ICRA AA+ 3.80%
Axis Bank Ltd. CRISIL AA+ 3.75%
PVR Ltd. CRISIL AA- 2.58%
Power Finance Corporation Ltd. CRISIL AAA 2.57%
Rural Electrification Corporation Ltd. CRISIL AAA 2.56%
Pipeline Infrastructure Private Limited
(Sponsored by Brookfield) CRISIL AAA 2.54%
Cash, Call, TREPS & Term Deposits 8.50%
Net Current Assets 1.04%
Total Net Assets 100.00%
Note : The Scheme will have a lock in period of at least five years or till the Retirement age, whichever is earlier. “Portfolio Beta, Standard Deviation, R Squared, Sharpe Ratio and Tracking Error of the Scheme is not computed owing to the short time frame since launch of the Scheme.” Portfolio turnover has been computed as the ratio of the lower value of purchase and sales, to the average net assets in the past one year (since inception for schemes that have not completed a year). **In addition to the fund manager managing this fund, overseas investment is managed by Ms. Priyanka Khandelwal. @@ Total Expense Ratio is as on the last business day of the month. ##Daily, Weekly, Fortnightly, Monthly & Quarterly frequencies are available in Systematic Investment Plan (SIP). Minimum number of installments for Daily, Weekly, Fortnightly & Monthly frequencies will be 6 and for Quarterly frequency will be 4. * Minimum number of installments for daily, weekly and monthly frequency will be 6 and for Quarterly frequency will be 4. && Monthly, Quarterly, Half Yearly and Annual frequencies are available in Systematic Withdrawal Plan (SWP). The minimum number of instalments for all the frequencies will be 2. *** In case the unit holder has opted for dividend payout option, the minimum amount for dividend payout shall be 100 (net of dividend distribution tax and other statutory levy, if any), else the dividend would be mandatorily reinvested.$ Facility will be available subject to completion of Lock - in period.
Fund Details
Style Box
Fund Managers** :
Equity : Mr. Mrinal singh (managing this fund since Feb 2019, and has overall 17 years of experience)Mr. Ashwin Jain (managing this fund since Feb 2019, and has overall 12 years of experience)Debt: Mr. Manish Banthia (managing this fund since Feb 2019, and has overall 16 years of experience)Mr. Anuj Tagra (managing this fund since Feb 2019, and has overall 12 years of experience)
Indicative Investment Horizon:5 years and above
Inception/Allotment date: 27-Feb-2019
Monthly AAUM as on 31-Aug-19 : Rs. 77.33 crores
Closing AUM as on 31-Aug-19 : Rs. 79.42 crores
NAV (As on 30-Aug-19):IPRFHAP Growth Option : 10.06IPRFHAP Dividend Option : 10.06IPRFHAP Direct Plan Growth Option : 10.15IPRFHAP Direct Plan Dividend Option : 10.15
Options : Growth Option and Dividend Option (Dividend Payout only)###Application Amount for freshSubscription :Rs.5,000 (plus in multiple of Rs.1)
Min.Addl.Investment :Rs.1,000 (plus in multiple of Rs.1)
Exit load for Redemption / Switch out :- Lumpsum & SIP / STP / SWP OptionNil
SIP :##
Daily, Weekly, Fortnightly and Monthly Frequency: Rs. 100/- and in multiple of Rs. 1/-Quarterly Frequency: Rs. 5,000/- and in multiple of Rs. 1/-
$SWP :&&
Rs. 500/- and in multiples of Rs. 1/- * $STP :
Daily Frequency: Rs. 250/- and in multiplesof Rs. 1/-Weekly, Monthly and Quarterly Frequency:Rs. 1,000/- and in multiples of Rs. 1/-
Min.Redemption Amt. : Rs. 500/- or all units where amount is below Rs. 500/-, Subject to Lock-in period.
Entry load : Not Applicable
Dividend History : Refer page no. from 132 to 140
SIP Returns : Refer page no. from 128 to 130
Total Expense Ratio @@ :
IPRFHAP : 2.37% p. a.
IPRFHAP Direct Plan : 0.58% p. a.
Investment Objective : Refer page no. from 141 to 145
High Medium Low
Low
Short
Medium
Credit Quality
Duration
Medium to Long
Long
Debt
Equity
RiskometerThis Product is suitable for investors who are seeking*:
*Investors should consult their financial advisers if in doubt about whether the product is suitable for them.
• Long term wealth creation
• An Hybrid scheme that predominantly invest in equity and equity related securities and shall also invest in debt and other securities.
• Top Ten Holdings
An open ended retirement solution oriented scheme having a lock-in of 5 years or till retirement age.(whichever is earlier)
Quantitative Indicators Average P/E : 24.00 Average P/BV : 2.64 Average Dividend Yield : 1.74
Average Maturity : 2.76 Years Macaulay Duration : 2.20 Years Yield To Maturity : 7.50%Modified Duration : 2.08 Years
Rating Profile
37.31%
32.28%
30.41%
0% 5% 10% 15% 20% 25% 30% 35% 40%
AAA and Equivalent
AA and Equivalent
TREPS & Current Assets
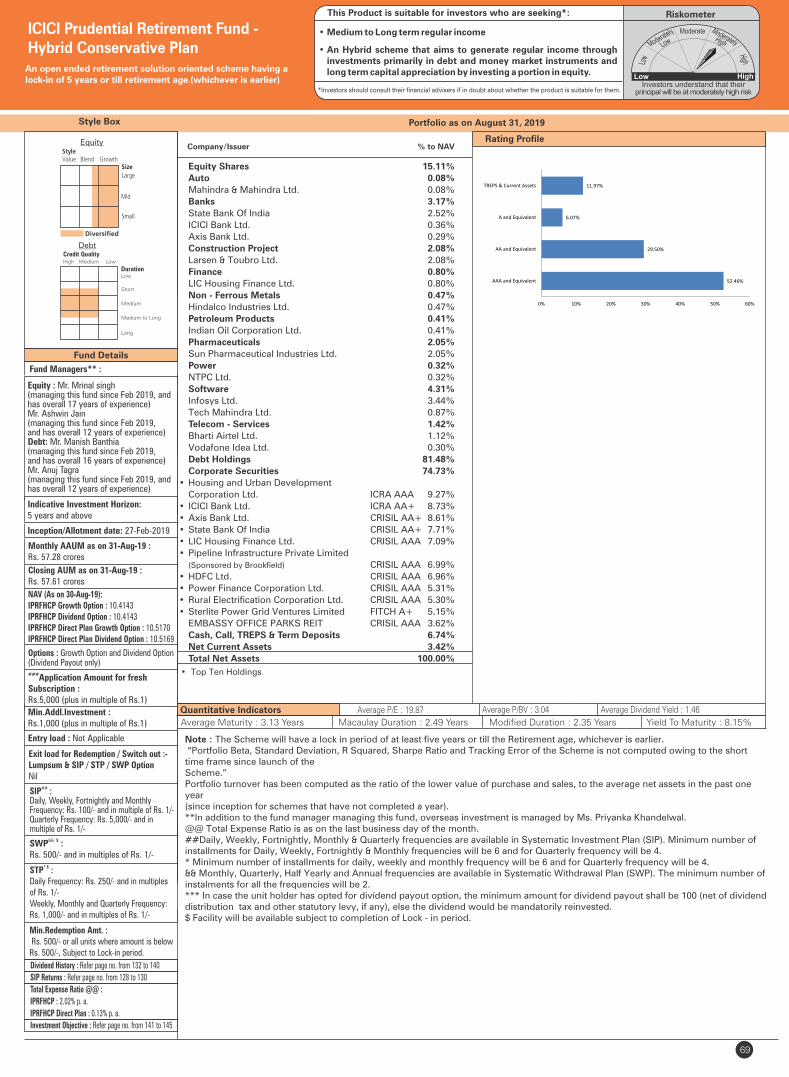
Portfolio as on August 31, 2019
69
ICICI Prudential Retirement Fund - Hybrid Conservative Plan
Company/Issuer % to NAV
Equity Shares 15.11%
Auto 0.08%
Mahindra & Mahindra Ltd. 0.08%
Banks 3.17%
State Bank Of India 2.52%
ICICI Bank Ltd. 0.36%
Axis Bank Ltd. 0.29%
Construction Project 2.08%
Larsen & Toubro Ltd. 2.08%
Finance 0.80%
LIC Housing Finance Ltd. 0.80%
Non - Ferrous Metals 0.47%
Hindalco Industries Ltd. 0.47%
Petroleum Products 0.41%
Indian Oil Corporation Ltd. 0.41%
Pharmaceuticals 2.05%
Sun Pharmaceutical Industries Ltd. 2.05%
Power 0.32%
NTPC Ltd. 0.32%
Software 4.31%
Infosys Ltd. 3.44%
Tech Mahindra Ltd. 0.87%
Telecom - Services 1.42%
Bharti Airtel Ltd. 1.12%
Vodafone Idea Ltd. 0.30%
Debt Holdings 81.48%
Corporate Securities 74.73%
• Housing and Urban Development
Corporation Ltd. ICRA AAA 9.27%
• ICICI Bank Ltd. ICRA AA+ 8.73%
• Axis Bank Ltd. CRISIL AA+ 8.61%
• State Bank Of India CRISIL AA+ 7.71%
• LIC Housing Finance Ltd. CRISIL AAA 7.09%
• Pipeline Infrastructure Private Limited
(Sponsored by Brookfield) CRISIL AAA 6.99%
• HDFC Ltd. CRISIL AAA 6.96%
• Power Finance Corporation Ltd. CRISIL AAA 5.31%
• Rural Electrification Corporation Ltd. CRISIL AAA 5.30%
• Sterlite Power Grid Ventures Limited FITCH A+ 5.15%
EMBASSY OFFICE PARKS REIT CRISIL AAA 3.62%
Cash, Call, TREPS & Term Deposits 6.74%
Net Current Assets 3.42%
Total Net Assets 100.00%
Note : The Scheme will have a lock in period of at least five years or till the Retirement age, whichever is earlier. “Portfolio Beta, Standard Deviation, R Squared, Sharpe Ratio and Tracking Error of the Scheme is not computed owing to the short time frame since launch of the Scheme.” Portfolio turnover has been computed as the ratio of the lower value of purchase and sales, to the average net assets in the past one year (since inception for schemes that have not completed a year). **In addition to the fund manager managing this fund, overseas investment is managed by Ms. Priyanka Khandelwal. @@ Total Expense Ratio is as on the last business day of the month. ##Daily, Weekly, Fortnightly, Monthly & Quarterly frequencies are available in Systematic Investment Plan (SIP). Minimum number of installments for Daily, Weekly, Fortnightly & Monthly frequencies will be 6 and for Quarterly frequency will be 4. * Minimum number of installments for daily, weekly and monthly frequency will be 6 and for Quarterly frequency will be 4. && Monthly, Quarterly, Half Yearly and Annual frequencies are available in Systematic Withdrawal Plan (SWP). The minimum number of instalments for all the frequencies will be 2. *** In case the unit holder has opted for dividend payout option, the minimum amount for dividend payout shall be 100 (net of dividend distribution tax and other statutory levy, if any), else the dividend would be mandatorily reinvested.$ Facility will be available subject to completion of Lock - in period.
Fund Details
Style Box
Fund Managers** :
Equity : Mr. Mrinal singh (managing this fund since Feb 2019, and has overall 17 years of experience)Mr. Ashwin Jain (managing this fund since Feb 2019, and has overall 12 years of experience)Debt: Mr. Manish Banthia (managing this fund since Feb 2019, and has overall 16 years of experience)Mr. Anuj Tagra (managing this fund since Feb 2019, and has overall 12 years of experience)
Indicative Investment Horizon:5 years and above
Inception/Allotment date: 27-Feb-2019
Monthly AAUM as on 31-Aug-19 : Rs. 57.28 crores
Closing AUM as on 31-Aug-19 : Rs. 57.61 crores
NAV (As on 30-Aug-19):IPRFHCP Growth Option : 10.4143IPRFHCP Dividend Option : 10.4143IPRFHCP Direct Plan Growth Option : 10.5170IPRFHCP Direct Plan Dividend Option : 10.5169
Options : Growth Option and Dividend Option (Dividend Payout only)###Application Amount for freshSubscription :Rs.5,000 (plus in multiple of Rs.1)
Min.Addl.Investment :Rs.1,000 (plus in multiple of Rs.1)
Exit load for Redemption / Switch out :- Lumpsum & SIP / STP / SWP OptionNil
SIP :##
Daily, Weekly, Fortnightly and Monthly Frequency: Rs. 100/- and in multiple of Rs. 1/-Quarterly Frequency: Rs. 5,000/- and in multiple of Rs. 1/-
$SWP :&&
Rs. 500/- and in multiples of Rs. 1/- * $STP :
Daily Frequency: Rs. 250/- and in multiplesof Rs. 1/-Weekly, Monthly and Quarterly Frequency:Rs. 1,000/- and in multiples of Rs. 1/-
Min.Redemption Amt. : Rs. 500/- or all units where amount is below Rs. 500/-, Subject to Lock-in period.
Entry load : Not Applicable
Dividend History : Refer page no. from 132 to 140
SIP Returns : Refer page no. from 128 to 130
Total Expense Ratio @@ :
IPRFHCP : 2.02% p. a.
IPRFHCP Direct Plan : 0.13% p. a.
Investment Objective : Refer page no. from 141 to 145
High Medium Low
Low
Short
Medium
Credit Quality
Duration
Medium to Long
Long
Debt
Equity
RiskometerThis Product is suitable for investors who are seeking*:
*Investors should consult their financial advisers if in doubt about whether the product is suitable for them.
• Medium to Long term regular income
• An Hybrid scheme that aims to generate regular income through investments primarily in debt and money market instruments and long term capital appreciation by investing a portion in equity.
• Top Ten Holdings
An open ended retirement solution oriented scheme having a lock-in of 5 years or till retirement age.(whichever is earlier)
Quantitative Indicators Average P/E : 19.87 Average P/BV : 3.04 Average Dividend Yield : 1.46
Average Maturity : 3.13 Years Macaulay Duration : 2.49 Years Yield To Maturity : 8.15%Modified Duration : 2.35 Years
Rating Profile
52.46%
29.50%
6.07%
11.97%
0% 10% 20% 30% 40% 50% 60%
AAA and Equivalent
AA and Equivalent
A and Equivalent
TREPS & Current Assets
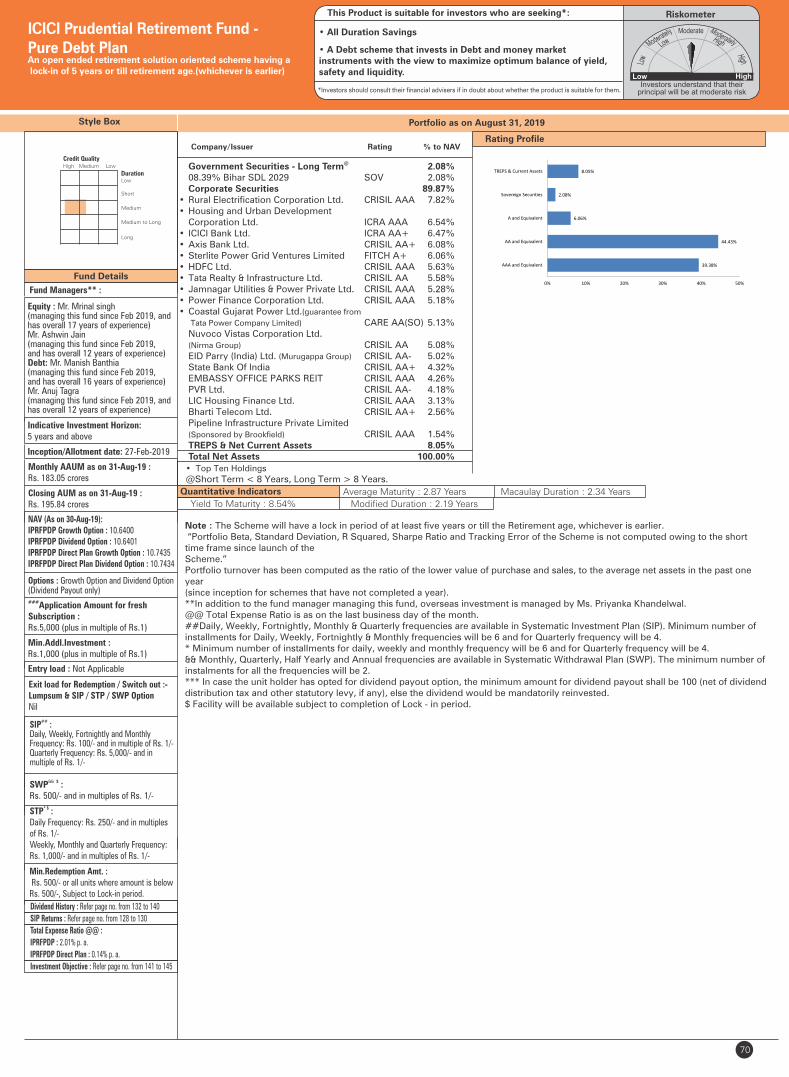
Portfolio as on August 31, 2019
70
ICICI Prudential Retirement Fund - Pure Debt Plan
@ Government Securities - Long Term 2.08% 08.39% Bihar SDL 2029 SOV 2.08% Corporate Securities 89.87%• Rural Electrification Corporation Ltd. CRISIL AAA 7.82%• Housing and Urban Development Corporation Ltd. ICRA AAA 6.54%• ICICI Bank Ltd. ICRA AA+ 6.47%• Axis Bank Ltd. CRISIL AA+ 6.08%• Sterlite Power Grid Ventures Limited FITCH A+ 6.06%• HDFC Ltd. CRISIL AAA 5.63%• Tata Realty & Infrastructure Ltd. CRISIL AA 5.58%• Jamnagar Utilities & Power Private Ltd. CRISIL AAA 5.28%• Power Finance Corporation Ltd. CRISIL AAA 5.18%• Coastal Gujarat Power Ltd.(guarantee from
Tata Power Company Limited) CARE AA(SO) 5.13% Nuvoco Vistas Corporation Ltd. (Nirma Group) CRISIL AA 5.08% EID Parry (India) Ltd. (Murugappa Group) CRISIL AA- 5.02% State Bank Of India CRISIL AA+ 4.32% EMBASSY OFFICE PARKS REIT CRISIL AAA 4.26% PVR Ltd. CRISIL AA- 4.18% LIC Housing Finance Ltd. CRISIL AAA 3.13% Bharti Telecom Ltd. CRISIL AA+ 2.56% Pipeline Infrastructure Private Limited (Sponsored by Brookfield) CRISIL AAA 1.54% TREPS & Net Current Assets 8.05% Total Net Assets 100.00%
Note : The Scheme will have a lock in period of at least five years or till the Retirement age, whichever is earlier. “Portfolio Beta, Standard Deviation, R Squared, Sharpe Ratio and Tracking Error of the Scheme is not computed owing to the short time frame since launch of the Scheme.” Portfolio turnover has been computed as the ratio of the lower value of purchase and sales, to the average net assets in the past one year (since inception for schemes that have not completed a year). **In addition to the fund manager managing this fund, overseas investment is managed by Ms. Priyanka Khandelwal. @@ Total Expense Ratio is as on the last business day of the month. ##Daily, Weekly, Fortnightly, Monthly & Quarterly frequencies are available in Systematic Investment Plan (SIP). Minimum number of installments for Daily, Weekly, Fortnightly & Monthly frequencies will be 6 and for Quarterly frequency will be 4. * Minimum number of installments for daily, weekly and monthly frequency will be 6 and for Quarterly frequency will be 4. && Monthly, Quarterly, Half Yearly and Annual frequencies are available in Systematic Withdrawal Plan (SWP). The minimum number of instalments for all the frequencies will be 2. *** In case the unit holder has opted for dividend payout option, the minimum amount for dividend payout shall be 100 (net of dividend distribution tax and other statutory levy, if any), else the dividend would be mandatorily reinvested.$ Facility will be available subject to completion of Lock - in period.
Fund Details
Style Box
Fund Managers** :
Equity : Mr. Mrinal singh (managing this fund since Feb 2019, and has overall 17 years of experience)Mr. Ashwin Jain (managing this fund since Feb 2019, and has overall 12 years of experience)Debt: Mr. Manish Banthia (managing this fund since Feb 2019, and has overall 16 years of experience)Mr. Anuj Tagra (managing this fund since Feb 2019, and has overall 12 years of experience)
Indicative Investment Horizon:5 years and above
Inception/Allotment date: 27-Feb-2019
Monthly AAUM as on 31-Aug-19 : Rs. 183.05 crores
Closing AUM as on 31-Aug-19 : Rs. 195.84 crores
NAV (As on 30-Aug-19):IPRFPDP Growth Option : 10.6400IPRFPDP Dividend Option : 10.6401IPRFPDP Direct Plan Growth Option : 10.7435IPRFPDP Direct Plan Dividend Option : 10.7434
Options : Growth Option and Dividend Option (Dividend Payout only)###Application Amount for freshSubscription :Rs.5,000 (plus in multiple of Rs.1)
Min.Addl.Investment :Rs.1,000 (plus in multiple of Rs.1)
Exit load for Redemption / Switch out :- Lumpsum & SIP / STP / SWP OptionNil
SIP :##
Daily, Weekly, Fortnightly and Monthly Frequency: Rs. 100/- and in multiple of Rs. 1/-Quarterly Frequency: Rs. 5,000/- and in multiple of Rs. 1/-
$SWP :&&
Rs. 500/- and in multiples of Rs. 1/-* $STP :
Daily Frequency: Rs. 250/- and in multiplesof Rs. 1/-Weekly, Monthly and Quarterly Frequency:Rs. 1,000/- and in multiples of Rs. 1/-
Min.Redemption Amt. : Rs. 500/- or all units where amount is below Rs. 500/-, Subject to Lock-in period.
Entry load : Not Applicable
Dividend History : Refer page no. from 132 to 140
SIP Returns : Refer page no. from 128 to 130
Total Expense Ratio @@ :
IPRFPDP : 2.01% p. a.
IPRFPDP Direct Plan : 0.14% p. a.
Investment Objective : Refer page no. from 141 to 145
High Medium Low
Low
Short
Medium
Credit Quality
Duration
Medium to Long
Long
RiskometerThis Product is suitable for investors who are seeking*:
• All Duration Savings
• A Debt scheme that invests in Debt and money market instruments with the view to maximize optimum balance of yield, safety and liquidity.
*Investors should consult their financial advisers if in doubt about whether the product is suitable for them.
Company/Issuer Rating % to NAV
• Top Ten Holdings
@Short Term < 8 Years, Long Term > 8 Years.
An open ended retirement solution oriented scheme having a lock-in of 5 years or till retirement age.(whichever is earlier)
Quantitative Indicators
Yield To Maturity : 8.54%
Average Maturity : 2.87 Years Macaulay Duration : 2.34 Years
Modified Duration : 2.19 Years
Rating Profile
39.38%
44.43%
6.06%
2.08%
8.05%
0% 10% 20% 30% 40% 50%
AAA and Equivalent
AA and Equivalent
A and Equivalent
Sovereign Securities
TREPS & Current Assets
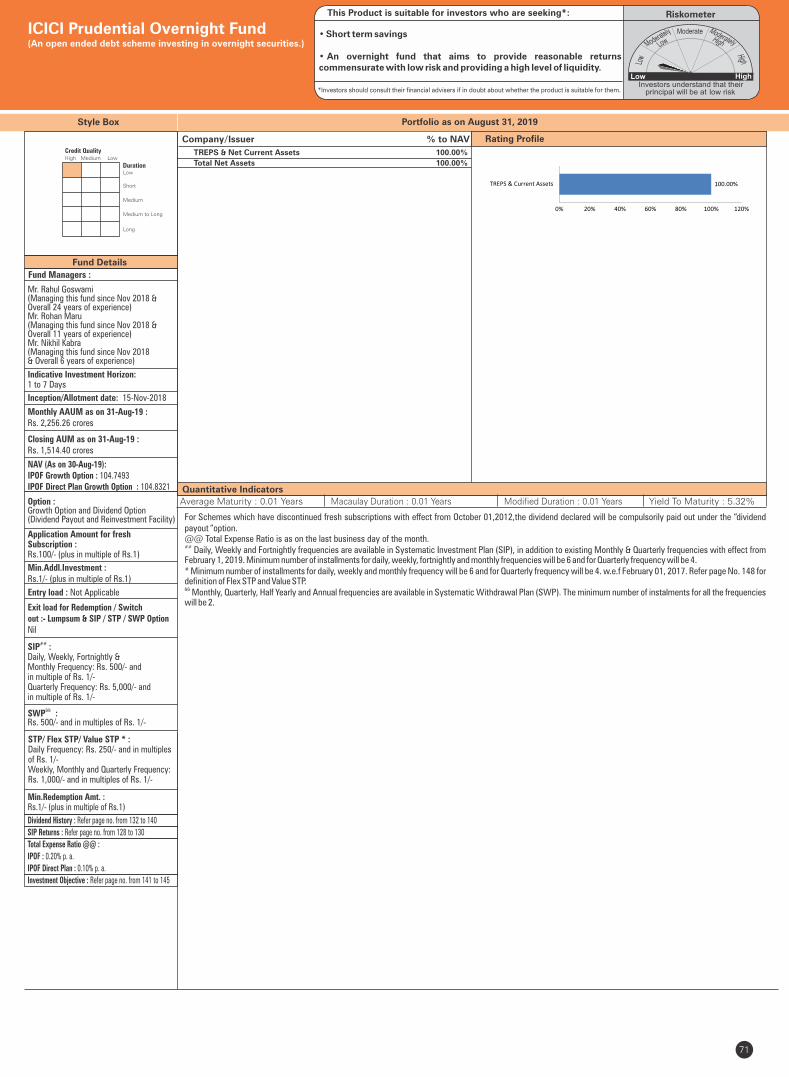
71
Style Box
Fund Details
Rating Profile
Quantitative Indicators
Company/Issuer % to NAV
For Schemes which have discontinued fresh subscriptions with effect from October 01,2012,the dividend declared will be compulsorily paid out under the “dividend payout “option.@@ Total Expense Ratio is as on the last business day of the month.## Daily, Weekly and Fortnightly frequencies are available in Systematic Investment Plan (SIP), in addition to existing Monthly & Quarterly frequencies with effect from February 1, 2019. Minimum number of installments for daily, weekly, fortnightly and monthly frequencies will be 6 and for Quarterly frequency will be 4.* Minimum number of installments for daily, weekly and monthly frequency will be 6 and for Quarterly frequency will be 4. w.e.f February 01, 2017. Refer page No. 148 for definition of Flex STP and Value STP.&& Monthly, Quarterly, Half Yearly and Annual frequencies are available in Systematic Withdrawal Plan (SWP). The minimum number of instalments for all the frequencies will be 2.
Fund Managers :
Mr. Rahul Goswami (Managing this fund since Nov 2018 & Overall 24 years of experience)Mr. Rohan Maru (Managing this fund since Nov 2018 & Overall 11 years of experience)Mr. Nikhil Kabra (Managing this fund since Nov 2018 & Overall 6 years of experience)
Indicative Investment Horizon:1 to 7 Days
Inception/Allotment date: 15-Nov-2018
Monthly AAUM as on 31-Aug-19 : Rs. 2,256.26 crores
Closing AUM as on 31-Aug-19 : Rs. 1,514.40 crores
NAV (As on 30-Aug-19):IPOF Growth Option : 104.7493IPOF Direct Plan Growth Option : 104.8321
Option :Growth Option and Dividend Option (Dividend Payout and Reinvestment Facility)
Application Amount for freshSubscription :Rs.100/- (plus in multiple of Rs.1)
Min.Addl.Investment :Rs.1/- (plus in multiple of Rs.1)
Exit load for Redemption / Switchout :- Lumpsum & SIP / STP / SWP OptionNil
Min.Redemption Amt. :Rs.1/- (plus in multiple of Rs.1)
TREPS & Net Current Assets 100.00%
Total Net Assets 100.00%
Portfolio as on August 31, 2019
Average Maturity : 0.01 Years Macaulay Duration : 0.01 Years Yield To Maturity : 5.32%
ICICI Prudential Overnight Fund(An open ended debt scheme investing in overnight securities.)
Entry load : Not Applicable
Riskometer
Dividend History : Refer page no. from 132 to 140
SIP Returns : Refer page no. from 128 to 130
Total Expense Ratio @@ :
IPOF : 0.20% p. a.
IPOF Direct Plan : 0.10% p. a.
Investment Objective : Refer page no. from 141 to 145
High Medium Low
Low
Short
Medium
Credit Quality
Duration
Medium to Long
Long
Modified Duration : 0.01 Years
This Product is suitable for investors who are seeking*:
• Short term savings
• An overnight fund that aims to provide reasonable returns commensurate with low risk and providing a high level of liquidity.
*Investors should consult their financial advisers if in doubt about whether the product is suitable for them. low risk
SIP :##
Daily, Weekly, Fortnightly & Monthly Frequency: Rs. 500/- and in multiple of Rs. 1/-Quarterly Frequency: Rs. 5,000/- and in multiple of Rs. 1/-
&&SWP :Rs. 500/- and in multiples of Rs. 1/-
STP/ Flex STP/ Value STP * :Daily Frequency: Rs. 250/- and in multiples of Rs. 1/-Weekly, Monthly and Quarterly Frequency: Rs. 1,000/- and in multiples of Rs. 1/-
100.00%
0% 20% 40% 60% 80% 100% 120%
TREPS & Current Assets
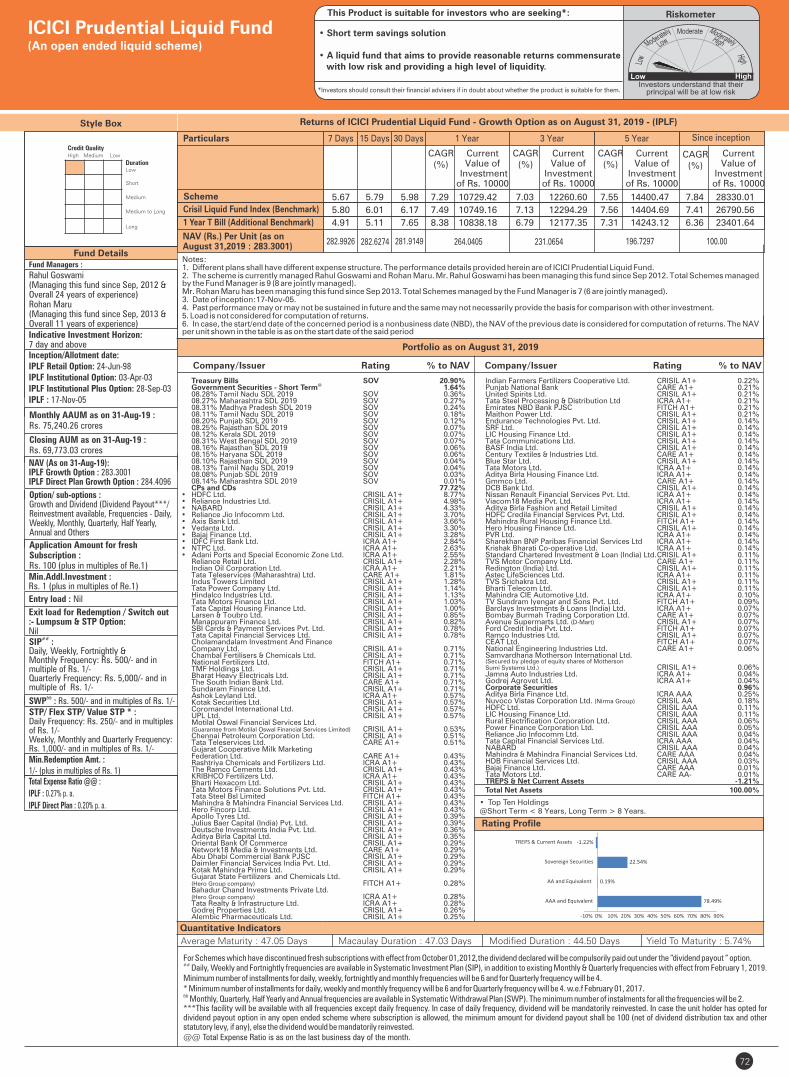
Style Box
Fund Details
Rating Profile
Quantitative Indicators
SIP : ##
Daily, Weekly, Fortnightly & Monthly Frequency: Rs. 500/- and in multiple of Rs. 1/-Quarterly Frequency: Rs. 5,000/- and in multiple of Rs. 1/-
SWP : Rs. 500/- and in multiples of Rs. 1/-&&
STP/ Flex STP/ Value STP * :Daily Frequency: Rs. 250/- and in multiples of Rs. 1/-Weekly, Monthly and Quarterly Frequency: Rs. 1,000/- and in multiples of Rs. 1/-Min.Redemption Amt. : 1/- (plus in multiples of Rs. 1)
Rahul Goswami (Managing this fund since Sep, 2012 & Overall 24 years of experience)Rohan Maru(Managing this fund since Sep, 2013 & Overall 11 years of experience)
Fund Managers :
Indicative Investment Horizon:7 day and aboveInception/Allotment date:IPLF Retail Option: 24-Jun-98IPLF Institutional Option: 03-Apr-03IPLF Institutional Plus Option: 28-Sep-03IPLF : 17-Nov-05
Monthly AAUM as on 31-Aug-19 : Rs. 75,240.26 crores
Closing AUM as on 31-Aug-19 : Rs. 69,773.03 crores
NAV (As on 31-Aug-19):IPLF Growth Option : 283.3001IPLF Direct Plan Growth Option : 284.4096
Option/ sub-options :Growth and Dividend (Dividend Payout***/Reinvestment available, Frequencies - Daily, Weekly, Monthly, Quarterly, Half Yearly, Annual and Others
Application Amount for freshSubscription :Rs. 100 (plus in multiples of Re.1)Min.Addl.Investment :Rs. 1 (plus in multiples of Re.1)
Exit load for Redemption / Switch out:- Lumpsum & STP Option:Nil
Company/Issuer Rating % to NAV
For Schemes which have discontinued fresh subscriptions with effect from October 01,2012,the dividend declared will be compulsorily paid out under the “dividend payout “ option.##
Daily, Weekly and Fortnightly frequencies are available in Systematic Investment Plan (SIP), in addition to existing Monthly & Quarterly frequencies with effect from February 1, 2019. Minimum number of installments for daily, weekly, fortnightly and monthly frequencies will be 6 and for Quarterly frequency will be 4.* Minimum number of installments for daily, weekly and monthly frequency will be 6 and for Quarterly frequency will be 4. w.e.f February 01, 2017. && Monthly, Quarterly, Half Yearly and Annual frequencies are available in Systematic Withdrawal Plan (SWP). The minimum number of instalments for all the frequencies will be 2.***This facility will be available with all frequencies except daily frequency. In case of daily frequency, dividend will be mandatorily reinvested. In case the unit holder has opted for dividend payout option in any open ended scheme where subscription is allowed, the minimum amount for dividend payout shall be 100 (net of dividend distribution tax and other statutory levy, if any), else the dividend would be mandatorily reinvested.@@ Total Expense Ratio is as on the last business day of the month.
• Top Ten Holdings @Short Term < 8 Years, Long Term > 8 Years.
Portfolio as on August 31, 2019
Returns of ICICI Prudential Liquid Fund - Growth Option as on August 31, 2019 - (IPLF)
Average Maturity : 47.05 Days Macaulay Duration : 47.03 Days Yield To Maturity : 5.74%
Company/Issuer Rating % to NAV
ICICI Prudential Liquid Fund(An open ended liquid scheme)
Entry load : Nil
RiskometerThis Product is suitable for investors who are seeking*:
• Short term savings solution
• A liquid fund that aims to provide reasonable returns commensurate with low risk and providing a high level of liquidity.
*Investors should consult their financial advisers if in doubt about whether the product is suitable for them.
Total Expense Ratio @@ :
IPLF : 0.27% p. a.
IPLF Direct Plan : 0.20% p. a.
Notes:1. Different plans shall have different expense structure. The performance details provided herein are of ICICI Prudential Liquid Fund.2. The scheme is currently managed and Rohan Maru. Mr. has been managing this fund since . Total Schemes managed Rahul Goswami Rahul Goswami Sep 2012by the Fund Manager . is 9 (8 are jointly managed)Mr. Rohan Maru has been managing this fund since . Total Schemes managed by the Fund Manager . Sep 2013 is 7 (6 are jointly managed)3. Date of inception:17-Nov-05.4. Past performance may or may not be sustained in future and the same may not necessarily provide the basis for comparison with other investment.5. Load is not considered for computation of returns.6. In case, the start/end date of the concerned period is a nonbusiness date (NBD), the NAV of the previous date is considered for computation of returns. The NAV per unit shown in the table is as on the start date of the said period
Scheme
1 Year T Bill (Additional Benchmark)
NAV (Rs.) Per Unit (as on August 31,2019 : 283.3001)
CAGR (%)
Crisil Liquid Fund Index (Benchmark)
Since inception
CurrentValue of
Investment of Rs. 10000
CAGR (%)
Current Value of
Investment of Rs. 10000
1 Year 3 Year 5 Year
CAGR (%)
Current Value of
Investment of Rs. 10000
CAGR (%)
Current Value of
Investment of Rs. 10000
282.9926
Particulars 7 Days 15 Days 30 Days
282.6274 281.9149 264.0405 231.0654 196.7297 100.00
Treasury Bills SOV 20.90%@ Government Securities - Short Term 1.64%
08.28% Tamil Nadu SDL 2019 SOV 0.36% 08.27% Maharashtra SDL 2019 SOV 0.27% 08.31% Madhya Pradesh SDL 2019 SOV 0.24% 08.11% Tamil Nadu SDL 2019 SOV 0.18% 08.20% Punjab SDL 2019 SOV 0.12% 08.25% Rajasthan SDL 2019 SOV 0.07% 08.12% Kerala SDL 2019 SOV 0.07% 08.31% West Bengal SDL 2019 SOV 0.07% 08.16% Rajasthan SDL 2019 SOV 0.06% 08.15% Haryana SDL 2019 SOV 0.06% 08.10% Rajasthan SDL 2019 SOV 0.04% 08.13% Tamil Nadu SDL 2019 SOV 0.04% 08.08% Punjab SDL 2019 SOV 0.03% 08.14% Maharashtra SDL 2019 SOV 0.01% CPs and CDs 77.72%• HDFC Ltd. CRISIL A1+ 8.77%• Reliance Industries Ltd. CRISIL A1+ 4.98%• NABARD CRISIL A1+ 4.33%• Reliance Jio Infocomm Ltd. CRISIL A1+ 3.70%• Axis Bank Ltd. CRISIL A1+ 3.66%• Vedanta Ltd. CRISIL A1+ 3.30%• Bajaj Finance Ltd. CRISIL A1+ 3.28%• IDFC First Bank Ltd. ICRA A1+ 2.84%• NTPC Ltd. ICRA A1+ 2.63%• Adani Ports and Special Economic Zone Ltd. ICRA A1+ 2.55% Reliance Retail Ltd. CRISIL A1+ 2.28% Indian Oil Corporation Ltd. ICRA A1+ 2.21% Tata Teleservices (Maharashtra) Ltd. CARE A1+ 1.81% Indus Towers Limited CRISIL A1+ 1.28% Tata Power Company Ltd. CRISIL A1+ 1.14% Hindalco Industries Ltd. CRISIL A1+ 1.13% Tata Motors Finance Ltd. CRISIL A1+ 1.03% Tata Capital Housing Finance Ltd. CRISIL A1+ 1.00% Larsen & Toubro Ltd. CRISIL A1+ 0.85% Manappuram Finance Ltd. CRISIL A1+ 0.82% SBI Cards & Payment Services Pvt. Ltd. CRISIL A1+ 0.78% Tata Capital Financial Services Ltd. CRISIL A1+ 0.78% Cholamandalam Investment And Finance Company Ltd. CRISIL A1+ 0.71% Chambal Fertilisers & Chemicals Ltd. CRISIL A1+ 0.71% National Fertilizers Ltd. FITCH A1+ 0.71% TMF Holdings Ltd. CRISIL A1+ 0.71% Bharat Heavy Electricals Ltd. CRISIL A1+ 0.71% The South Indian Bank Ltd. CARE A1+ 0.71% Sundaram Finance Ltd. CRISIL A1+ 0.71% Ashok Leyland Ltd. ICRA A1+ 0.57% Kotak Securities Ltd. CRISIL A1+ 0.57% Coromandel International Ltd. CRISIL A1+ 0.57% UPL Ltd. CRISIL A1+ 0.57% Motilal Oswal Financial Services Ltd. (Guarantee from Motilal Oswal Financial Services Limited) CRISIL A1+ 0.53% Chennai Petroleum Corporation Ltd. CRISIL A1+ 0.51% Tata Teleservices Ltd. CARE A1+ 0.51% Gujarat Cooperative Milk Marketing Federation Ltd. CARE A1+ 0.43% Rashtriya Chemicals and Fertilizers Ltd. ICRA A1+ 0.43% The Ramco Cements Ltd. CRISIL A1+ 0.43% KRIBHCO Fertilizers Ltd. ICRA A1+ 0.43% Bharti Hexacom Ltd. CRISIL A1+ 0.43% Tata Motors Finance Solutions Pvt. Ltd. CRISIL A1+ 0.43% Tata Steel Bsl Limited FITCH A1+ 0.43% Mahindra & Mahindra Financial Services Ltd. CRISIL A1+ 0.43% Hero Fincorp Ltd. CRISIL A1+ 0.43% Apollo Tyres Ltd. CRISIL A1+ 0.39% Julius Baer Capital (India) Pvt. Ltd. CRISIL A1+ 0.39% Deutsche Investments India Pvt. Ltd. CRISIL A1+ 0.36% Aditya Birla Capital Ltd. CRISIL A1+ 0.35% Oriental Bank Of Commerce CRISIL A1+ 0.29% Network18 Media & Investments Ltd. CARE A1+ 0.29% Abu Dhabi Commercial Bank PJSC CRISIL A1+ 0.29% Daimler Financial Services India Pvt. Ltd. CRISIL A1+ 0.29% Kotak Mahindra Prime Ltd. CRISIL A1+ 0.29% Gujarat State Fertilizers and Chemicals Ltd. (Hero Group company) FITCH A1+ 0.28% Bahadur Chand Investments Private Ltd. (Hero Group company) ICRA A1+ 0.28% Tata Realty & Infrastructure Ltd. ICRA A1+ 0.28% Godrej Properties Ltd. CRISIL A1+ 0.26% Alembic Pharmaceuticals Ltd. CRISIL A1+ 0.25%
Indian Farmers Fertilizers Cooperative Ltd. CRISIL A1+ 0.22% Punjab National Bank CARE A1+ 0.21% United Spirits Ltd. CRISIL A1+ 0.21% Tata Steel Processing & Distribution Ltd ICRA A1+ 0.21% Emirates NBD Bank PJSC FITCH A1+ 0.21% Maithon Power Ltd. CRISIL A1+ 0.21% Endurance Technologies Pvt. Ltd. CRISIL A1+ 0.14% SRF Ltd. CRISIL A1+ 0.14% LIC Housing Finance Ltd. CRISIL A1+ 0.14% Tata Communications Ltd. CRISIL A1+ 0.14% BASF India Ltd. CRISIL A1+ 0.14% Century Textiles & Industries Ltd. CARE A1+ 0.14% Blue Star Ltd. CRISIL A1+ 0.14% Tata Motors Ltd. ICRA A1+ 0.14% Aditya Birla Housing Finance Ltd. ICRA A1+ 0.14% Gmmco Ltd. CARE A1+ 0.14% DCB Bank Ltd. CRISIL A1+ 0.14% Nissan Renault Financial Services Pvt. Ltd. ICRA A1+ 0.14% Viacom18 Media Pvt. Ltd. ICRA A1+ 0.14% Aditya Birla Fashion and Retail Limited CRISIL A1+ 0.14% HDFC Credila Financial Services Pvt. Ltd. CRISIL A1+ 0.14% Mahindra Rural Housing Finance Ltd. FITCH A1+ 0.14% Hero Housing Finance Ltd. CRISIL A1+ 0.14% PVR Ltd. ICRA A1+ 0.14% Sharekhan BNP Paribas Financial Services Ltd ICRA A1+ 0.14% Krishak Bharati Co-operative Ltd. ICRA A1+ 0.14% Standard Chartered Investment & Loan (India) Ltd. CRISIL A1+ 0.11% TVS Motor Company Ltd. CARE A1+ 0.11% Redington (India) Ltd. CRISIL A1+ 0.11% Astec LifeSciences Ltd. ICRA A1+ 0.11% TVS Srichakra Ltd. CRISIL A1+ 0.11% Bharti Telecom Ltd. CRISIL A1+ 0.11% Mahindra CIE Automotive Ltd. ICRA A1+ 0.10% TV Sundram Iyengar and Sons Pvt. Ltd. FITCH A1+ 0.09% Barclays Investments & Loans (India) Ltd. ICRA A1+ 0.07% Bombay Burmah Trading Corporation Ltd. CARE A1+ 0.07% Avenue Supermarts Ltd. (D-Mart) CRISIL A1+ 0.07% Ford Credit India Pvt. Ltd. FITCH A1+ 0.07% Ramco Industries Ltd. CRISIL A1+ 0.07% CEAT Ltd. FITCH A1+ 0.07% National Engineering Industries Ltd. CARE A1+ 0.06% Samvardhana Motherson International Ltd. (Secured by pledge of equity shares of Motherson Sumi Systems Ltd.) CRISIL A1+ 0.06% Jamna Auto Industries Ltd. ICRA A1+ 0.04% Godrej Agrovet Ltd. ICRA A1+ 0.04% Corporate Securities 0.96% Aditya Birla Finance Ltd. ICRA AAA 0.25% Nuvoco Vistas Corporation Ltd. (Nirma Group) CRISIL AA 0.18% HDFC Ltd. CRISIL AAA 0.11% LIC Housing Finance Ltd. CRISIL AAA 0.11% Rural Electrification Corporation Ltd. CRISIL AAA 0.06% Power Finance Corporation Ltd. CRISIL AAA 0.05% Reliance Jio Infocomm Ltd. CRISIL AAA 0.04% Tata Capital Financial Services Ltd. ICRA AAA 0.04% NABARD CRISIL AAA 0.04% Mahindra & Mahindra Financial Services Ltd. CARE AAA 0.04% HDB Financial Services Ltd. CRISIL AAA 0.03% Bajaj Finance Ltd. CARE AAA 0.01% Tata Motors Ltd. CARE AA- 0.01% TREPS & Net Current Assets -1.21% Total Net Assets 100.00%
High Medium Low
Low
Short
Medium
Credit Quality
Duration
Medium to Long
Long
Modified Duration : 44.50 Days
72
5.67 5.79 5.98 7.29 10729.42 7.03 12260.60 7.55 14400.47 7.84 28330.01
5.80 6.01 6.17 7.49 10749.16 7.13 12294.29 7.56 14404.69 7.41 26790.56
4.91 5.11 7.65 8.38 10838.18 6.79 12177.35 7.31 14243.12 6.36 23401.64
78.49%
0.19%
22.54%
-1.22%
-10% 0% 10% 20% 30% 40% 50% 60% 70% 80% 90%
AAA and Equivalent
AA and Equivalent
Sovereign Securities
TREPS & Current Assets
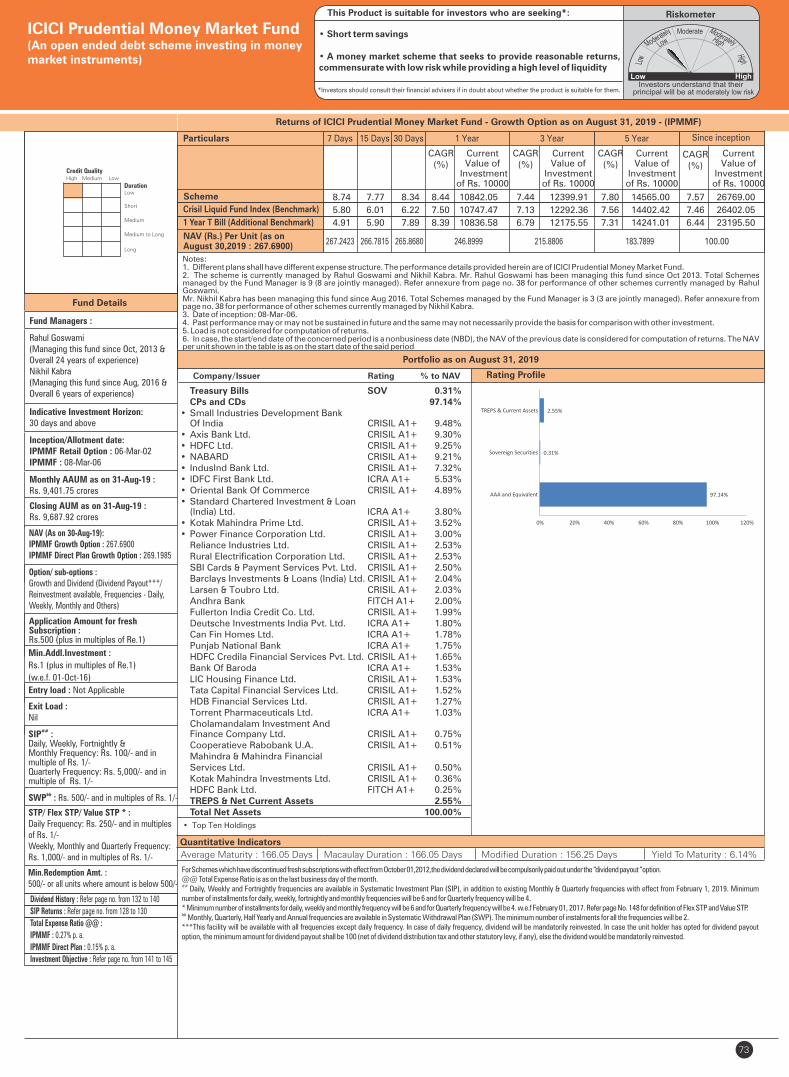
73
Quantitative Indicators
Fund Details
Company/Issuer Rating % to NAV
For Schemes which have discontinued fresh subscriptions with effect from October 01,2012,the dividend declared will be compulsorily paid out under the “dividend payout “option.@@ Total Expense Ratio is as on the last business day of the month.##
Daily, Weekly and Fortnightly frequencies are available in Systematic Investment Plan (SIP), in addition to existing Monthly & Quarterly frequencies with effect from February 1, 2019. Minimum number of installments for daily, weekly, fortnightly and monthly frequencies will be 6 and for Quarterly frequency will be 4.* Minimum number of installments for daily, weekly and monthly frequency will be 6 and for Quarterly frequency will be 4. w.e.f February 01, 2017. Refer page No. 148 for definition of Flex STP and Value STP.&&
Monthly, Quarterly, Half Yearly and Annual frequencies are available in Systematic Withdrawal Plan (SWP). The minimum number of instalments for all the frequencies will be 2.***This facility will be available with all frequencies except daily frequency. In case of daily frequency, dividend will be mandatorily reinvested. In case the unit holder has opted for dividend payout option, the minimum amount for dividend payout shall be 100 (net of dividend distribution tax and other statutory levy, if any), else the dividend would be mandatorily reinvested.
Fund Managers :
Rahul Goswami (Managing this fund since Oct, 2013 & Overall 24 years of experience)Nikhil Kabra(Managing this fund since Aug, 2016 & Overall 6 years of experience)
Indicative Investment Horizon:30 days and above
Inception/Allotment date:IPMMF Retail Option : 06-Mar-02IPMMF : 08-Mar-06
Monthly AAUM as on 31-Aug-19 : Rs. 9,401.75 crores
Closing AUM as on 31-Aug-19 : Rs. 9,687.92 crores
NAV (As on 30-Aug-19):IPMMF Growth Option : 267.6900IPMMF Direct Plan Growth Option : 269.1985
Option/ sub-options :Growth and Dividend (Dividend Payout***/Reinvestment available, Frequencies - Daily, Weekly, Monthly and Others)
Application Amount for freshSubscription :Rs.500 (plus in multiples of Re.1)
Min.Addl.Investment :
Rs.1 (plus in multiples of Re.1)
(w.e.f. 01-Oct-16)
Exit Load : Nil
##SIP :Daily, Weekly, Fortnightly & Monthly Frequency: Rs. 100/- and in multiple of Rs. 1/-Quarterly Frequency: Rs. 5,000/- and in multiple of Rs. 1/-
&&SWP : Rs. 500/- and in multiples of Rs. 1/-
STP/ Flex STP/ Value STP * :Daily Frequency: Rs. 250/- and in multiples of Rs. 1/-Weekly, Monthly and Quarterly Frequency: Rs. 1,000/- and in multiples of Rs. 1/-
Min.Redemption Amt. :500/- or all units where amount is below 500/-
Portfolio as on August 31, 2019
Returns of ICICI Prudential Money Market Fund - Growth Option as on - (IPMMF)August 31, 2019
Average Maturity : 166.05 Days Macaulay Duration : 166.05 Days Yield To Maturity : 6.14%
ICICI Prudential Money Market Fund(An open ended debt scheme investing in money market instruments)
Entry load : Not Applicable
RiskometerThis Product is suitable for investors who are seeking*:
• Short term savings
• A money market scheme that seeks to provide reasonable returns, commensurate with low risk while providing a high level of liquidity
*Investors should consult their financial advisers if in doubt about whether the product is suitable for them.
Dividend History : Refer page no. from 132 to 140
SIP Returns : Refer page no. from 128 to 130
Total Expense Ratio @@ :
IPMMF : 0.27% p. a.
IPMMF Direct Plan : 0.15% p. a.
Investment Objective : Refer page no. from 141 to 145
Rating Profile
Treasury Bills SOV 0.31% CPs and CDs 97.14%• Small Industries Development Bank Of India CRISIL A1+ 9.48%• Axis Bank Ltd. CRISIL A1+ 9.30%• HDFC Ltd. CRISIL A1+ 9.25%• NABARD CRISIL A1+ 9.21%• IndusInd Bank Ltd. CRISIL A1+ 7.32%• IDFC First Bank Ltd. ICRA A1+ 5.53%• Oriental Bank Of Commerce CRISIL A1+ 4.89%• Standard Chartered Investment & Loan (India) Ltd. ICRA A1+ 3.80%• Kotak Mahindra Prime Ltd. CRISIL A1+ 3.52%• Power Finance Corporation Ltd. CRISIL A1+ 3.00% Reliance Industries Ltd. CRISIL A1+ 2.53% Rural Electrification Corporation Ltd. CRISIL A1+ 2.53% SBI Cards & Payment Services Pvt. Ltd. CRISIL A1+ 2.50% Barclays Investments & Loans (India) Ltd. CRISIL A1+ 2.04% Larsen & Toubro Ltd. CRISIL A1+ 2.03% Andhra Bank FITCH A1+ 2.00% Fullerton India Credit Co. Ltd. CRISIL A1+ 1.99% Deutsche Investments India Pvt. Ltd. ICRA A1+ 1.80% Can Fin Homes Ltd. ICRA A1+ 1.78% Punjab National Bank ICRA A1+ 1.75% HDFC Credila Financial Services Pvt. Ltd. CRISIL A1+ 1.65% Bank Of Baroda ICRA A1+ 1.53% LIC Housing Finance Ltd. CRISIL A1+ 1.53% Tata Capital Financial Services Ltd. CRISIL A1+ 1.52% HDB Financial Services Ltd. CRISIL A1+ 1.27% Torrent Pharmaceuticals Ltd. ICRA A1+ 1.03% Cholamandalam Investment And Finance Company Ltd. CRISIL A1+ 0.75% Cooperatieve Rabobank U.A. CRISIL A1+ 0.51% Mahindra & Mahindra Financial Services Ltd. CRISIL A1+ 0.50% Kotak Mahindra Investments Ltd. CRISIL A1+ 0.36% HDFC Bank Ltd. FITCH A1+ 0.25% TREPS & Net Current Assets 2.55% Total Net Assets 100.00%
Notes:1. Different plans shall have different expense structure. The performance details provided herein are of ICICI Prudential Money Market Fund.2. The scheme is currently managed and . Mr. has been managing this fund since . Total Schemes by Rahul Goswami Nikhil Kabra Rahul Goswami Oct 2013managed by the Fund Manager . Refer annexure from page no. 38 for performance of other schemes currently managed byis 9 (8 are jointly managed) Rahul Goswami.Mr. has been managing this fund since Aug 2016. Total Schemes managed by the Fund Manager . Refer annexure from Nikhil Kabra is 3 (3 are jointly managed)page no. 38 for performance of other schemes currently managed by . Nikhil Kabra3. Date of inception: 08-Mar-06.4. Past performance may or may not be sustained in future and the same may not necessarily provide the basis for comparison with other investment.5. Load is not considered for computation of returns.6. In case, the start/end date of the concerned period is a nonbusiness date (NBD), the NAV of the previous date is considered for computation of returns. The NAV per unit shown in the table is as on the start date of the said period
Scheme
1 Year T Bill (Additional Benchmark)
CAGR (%)
Crisil Liquid Fund Index (Benchmark)
Since inception
CurrentValue of
Investment of Rs. 10000
CAGR (%)
Current Value of
Investment of Rs. 10000
1 Year 3 Year 5 Year
CAGR (%)
Current Value of
Investment of Rs. 10000
CAGR (%)
Current Value of
Investment of Rs. 10000
Particulars 7 Days 15 Days 30 Days
NAV (Rs.) Per Unit (as onAugust 30,2019 : 267.6900)
267.2423 266.7815 265.8680 246.8999 215.8806 183.7899 100.00
moderately low risk
High Medium Low
Low
Short
Medium
Credit Quality
Duration
Medium to Long
Long
Modified Duration : 156.25 Days
• Top Ten Holdings
8.74 7.77 8.34 8.44 10842.05 7.44 12399.91 7.80 14565.00 7.57 26769.00
5.80 6.01 6.22 7.50 10747.47 7.13 12292.36 7.56 14402.42 7.46 26402.05
4.91 5.90 7.89 8.39 10836.58 6.79 12175.55 7.31 14241.01 6.44 23195.50
97.14%
0.31%
2.55%
0% 20% 40% 60% 80% 100% 120%
AAA and Equivalent
Sovereign Securities
TREPS & Current Assets
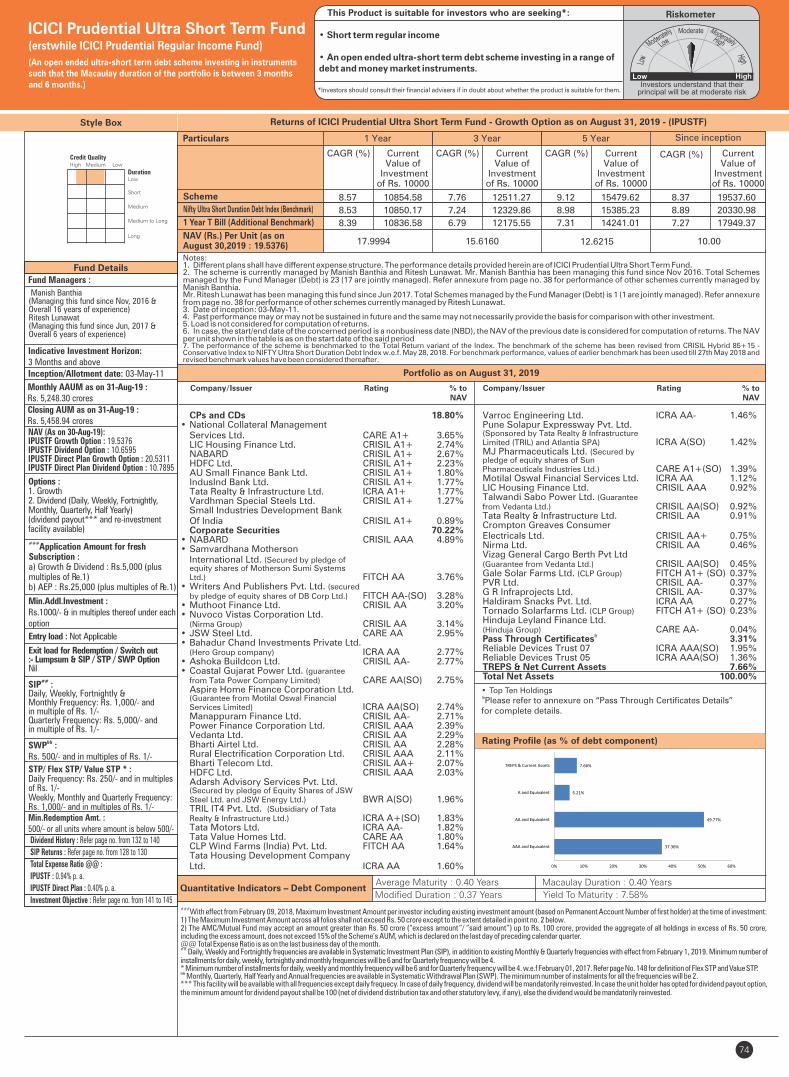
74
Fund Details
Quantitative Indicators – Debt ComponentAverage Maturity : 0.40 Years
Style Box
Fund Managers :
Indicative Investment Horizon:3 Months and aboveInception/Allotment date: 03-May-11
Monthly AAUM as on 31-Aug-19 : Rs. 5,248.30 croresClosing AUM as on 31-Aug-19 : Rs. 5,458.94 croresNAV (As on 30-Aug-19):IPUSTF Growth Option : 19.5376IPUSTF Dividend Option : 10.6595IPUSTF Direct Plan Growth Option : 20.5311IPUSTF Direct Plan Dividend Option : 10.7895
Options :1. Growth2. Dividend (Daily, Weekly, Fortnightly, Monthly, Quarterly, Half Yearly) (dividend payout*** and re-investment facility available)
###Application Amount for freshSubscription :a) Growth & Dividend : Rs.5,000 (plusmultiples of Re.1)b) AEP : Rs.25,000 (plus multiples of Re.1)
Min.Addl.Investment :Rs.1000/- & in multiples thereof under eachoption
Exit load for Redemption / Switch out:- Lumpsum & SIP / STP / SWP OptionNil
##SIP :Daily, Weekly, Fortnightly & Monthly Frequency: Rs. 1,000/- and in multiple of Rs. 1/-Quarterly Frequency: Rs. 5,000/- and in multiple of Rs. 1/-
&&SWP :Rs. 500/- and in multiples of Rs. 1/-
STP/ Flex STP/ Value STP * :Daily Frequency: Rs. 250/- and in multiples of Rs. 1/-Weekly, Monthly and Quarterly Frequency: Rs. 1,000/- and in multiples of Rs. 1/-Min.Redemption Amt. :500/- or all units where amount is below 500/-
Macaulay Duration : 0.40 Years
Yield To Maturity : 7.58%
Portfolio as on August 31, 2019
Returns of ICICI Prudential Ultra Short Term Fund - Growth Option as on August 31, 2019 - (IPUSTF)
ICICI Prudential Ultra Short Term Fund
(An open ended ultra-short term debt scheme investing in instrumentssuch that the Macaulay duration of the portfolio is between 3 monthsand 6 months.)
Entry load : Not Applicable
RiskometerThis Product is suitable for investors who are seeking*:
• Short term regular income
• An open ended ultra-short term debt scheme investing in a range of debt and money market instruments.
*Investors should consult their financial advisers if in doubt about whether the product is suitable for them.
Rating Profile (as % of debt component)
Dividend History : Refer page no. from 132 to 140
SIP Returns : Refer page no. from 128 to 130
Total Expense Ratio @@ :
IPUSTF : 0.94% p. a.
IPUSTF Direct Plan : 0.40% p. a.
Investment Objective : Refer page no. from 141 to 145
Scheme
1 Year T Bill (Additional Benchmark)
NAV (Rs.) Per Unit (as on August 30,2019 : 19.5376)
CAGR (%)
10.00
Nifty Ultra Short Duration Debt Index (Benchmark)
Since inception
CurrentValue of
Investment of Rs. 10000
CAGR (%) Current Value of
Investment of Rs. 10000
1 Year 3 Year 5 Year
CAGR (%) Current Value of
Investment of Rs. 10000
CAGR (%) Current Value of
Investment of Rs. 10000
17.9994 15.6160 12.6215
Particulars
8.57 10854.58 7.76 12511.27 9.12 15479.62 8.37 19537.60
8.53 10850.17 7.24 12329.86 8.98 15385.23 8.89 20330.98
8.39 10836.58 6.79 12175.55 7.31 14241.01 7.27 17949.37
Manish Banthia(Managing this fund since Nov, 2016 & Overall 16 years of experience)Ritesh Lunawat(Managing this fund since Jun, 2017 & Overall 6 years of experience)
Notes:1. Different plans shall have different expense structure. The performance details provided herein are of ICICI Prudential Ultra Short Term Fund.2. The scheme is currently managed by Manish Banthia and Ritesh Lunawat. Mr. Manish Banthia has been managing this fund since Nov 2016. Total Schemes managed by the Fund Manager . Refer annexure from page no. 38 for performance of other schemes currently managed by (Debt) is 23 (17 are jointly managed)Manish Banthia.Mr. has been managing this fund since . Total Schemes managed by the Fund Manager . Refer annexure Ritesh Lunawat Jun 2017 (Debt) is 1 (1 are jointly managed)from page no. 38 for performance of other schemes currently managed by . Ritesh Lunawat3. Date of inception: 03-May-11.4. Past performance may or may not be sustained in future and the same may not necessarily provide the basis for comparison with other investment.5. Load is not considered for computation of returns.6. In case, the start/end date of the concerned period is a nonbusiness date (NBD), the NAV of the previous date is considered for computation of returns. The NAV per unit shown in the table is as on the start date of the said period7. The performance of the scheme is benchmarked to the Total Return variant of the Index. The benchmark of the scheme has been revised from CRISIL Hybrid 85+15 - Conservative Index to NIFTY Ultra Short Duration Debt Index w.e.f. May 28, 2018. For benchmark performance, values of earlier benchmark has been used till 27th May 2018 and revised benchmark values have been considered thereafter.
###With effect from February 09, 2018, Maximum Investment Amount per investor including existing investment amount (based on Permanent Account Number of first holder) at the time of investment:1) The Maximum Investment Amount across all folios shall not exceed Rs. 50 crore except to the extent detailed in point no. 2 below.2) The AMC/Mutual Fund may accept an amount greater than Rs. 50 crore (“excess amount ”/ ”said amount”) up to Rs. 100 crore, provided the aggregate of all holdings in excess of Rs. 50 crore, including the excess amount, does not exceed 15% of the Scheme’s AUM, which is declared on the last day of preceding calendar quarter.@@ Total Expense Ratio is as on the last business day of the month.##
Daily, Weekly and Fortnightly frequencies are available in Systematic Investment Plan (SIP), in addition to existing Monthly & Quarterly frequencies with effect from February 1, 2019. Minimum number of installments for daily, weekly, fortnightly and monthly frequencies will be 6 and for Quarterly frequency will be 4.* Minimum number of installments for daily, weekly and monthly frequency will be 6 and for Quarterly frequency will be 4. w.e.f February 01, 2017. Refer page No. 148 for definition of Flex STP and Value STP.&& Monthly, Quarterly, Half Yearly and Annual frequencies are available in Systematic Withdrawal Plan (SWP). The minimum number of instalments for all the frequencies will be 2.*** This facility will be available with all frequencies except daily frequecy. In case of daily frequency, dividend will be mandatorily reinvested. In case the unit holder has opted for dividend payout option, the minimum amount for dividend payout shall be 100 (net of dividend distribution tax and other statutory levy, if any), else the dividend would be mandatorily reinvested.
(erstwhile ICICI Prudential Regular Income Fund)
High Medium Low
Low
Short
Medium
Credit Quality
Duration
Medium to Long
Long
Varroc Engineering Ltd. ICRA AA- 1.46% Pune Solapur Expressway Pvt. Ltd. (Sponsored by Tata Realty & Infrastructure Limited (TRIL) and Atlantia SPA) ICRA A(SO) 1.42% MJ Pharmaceuticals Ltd. (Secured by pledge of equity shares of Sun Pharmaceuticals Industries Ltd.) CARE A1+(SO) 1.39% Motilal Oswal Financial Services Ltd. ICRA AA 1.12% LIC Housing Finance Ltd. CRISIL AAA 0.92% Talwandi Sabo Power Ltd. (Guarantee from Vedanta Ltd.) CRISIL AA(SO) 0.92% Tata Realty & Infrastructure Ltd. CRISIL AA 0.91% Crompton Greaves Consumer Electricals Ltd. CRISIL AA+ 0.75% Nirma Ltd. CRISIL AA 0.46% Vizag General Cargo Berth Pvt Ltd (Guarantee from Vedanta Ltd.) CRISIL AA(SO) 0.45% Gale Solar Farms Ltd. (CLP Group) FITCH A1+ (SO) 0.37% PVR Ltd. CRISIL AA- 0.37% G R Infraprojects Ltd. CRISIL AA- 0.37% Haldiram Snacks Pvt. Ltd. ICRA AA 0.27% Tornado Solarfarms Ltd. (CLP Group) FITCH A1+ (SO) 0.23% Hinduja Leyland Finance Ltd. (Hinduja Group) CARE AA- 0.04%
& Pass Through Certificates 3.31% Reliable Devices Trust 07 ICRA AAA(SO) 1.95% Reliable Devices Trust 05 ICRA AAA(SO) 1.36% TREPS & Net Current Assets 7.66% Total Net Assets 100.00%
CPs and CDs 18.80%• National Collateral Management Services Ltd. CARE A1+ 3.65% LIC Housing Finance Ltd. CRISIL A1+ 2.74% NABARD CRISIL A1+ 2.67% HDFC Ltd. CRISIL A1+ 2.23% AU Small Finance Bank Ltd. CRISIL A1+ 1.80% IndusInd Bank Ltd. CRISIL A1+ 1.77% Tata Realty & Infrastructure Ltd. ICRA A1+ 1.77% Vardhman Special Steels Ltd. CRISIL A1+ 1.27% Small Industries Development Bank Of India CRISIL A1+ 0.89% Corporate Securities 70.22%• NABARD CRISIL AAA 4.89%• Samvardhana Motherson International Ltd. (Secured by pledge of equity shares of Motherson Sumi Systems Ltd.) FITCH AA 3.76%• Writers And Publishers Pvt. Ltd. (secured by pledge of equity shares of DB Corp Ltd.) FITCH AA-(SO) 3.28%• Muthoot Finance Ltd. CRISIL AA 3.20%• Nuvoco Vistas Corporation Ltd. (Nirma Group) CRISIL AA 3.14%• JSW Steel Ltd. CARE AA 2.95%• Bahadur Chand Investments Private Ltd. (Hero Group company) ICRA AA 2.77%• Ashoka Buildcon Ltd. CRISIL AA- 2.77%• Coastal Gujarat Power Ltd. (guarantee from Tata Power Company Limited) CARE AA(SO) 2.75% Aspire Home Finance Corporation Ltd. (Guarantee from Motilal Oswal Financial Services Limited) ICRA AA(SO) 2.74% Manappuram Finance Ltd. CRISIL AA- 2.71% Power Finance Corporation Ltd. CRISIL AAA 2.39% Vedanta Ltd. CRISIL AA 2.29% Bharti Airtel Ltd. CRISIL AA 2.28% Rural Electrification Corporation Ltd. CRISIL AAA 2.11% Bharti Telecom Ltd. CRISIL AA+ 2.07% HDFC Ltd. CRISIL AAA 2.03% Adarsh Advisory Services Pvt. Ltd. (Secured by pledge of Equity Shares of JSW Steel Ltd. and JSW Energy Ltd.) BWR A(SO) 1.96% TRIL IT4 Pvt. Ltd. (Subsidiary of Tata Realty & Infrastructure Ltd.) ICRA A+(SO) 1.83% Tata Motors Ltd. ICRA AA- 1.82% Tata Value Homes Ltd. CARE AA 1.80% CLP Wind Farms (India) Pvt. Ltd. FITCH AA 1.64% Tata Housing Development Company Ltd. ICRA AA 1.60%
Modified Duration : 0.37 Years
Company/Issuer Rating % to NAV
Company/Issuer Rating % to NAV
• Top Ten Holdings&Please refer to annexure on “Pass Through Certificates Details”for complete details.
37.36%
49.77%
5.21%
7.66%
0% 10% 20% 30% 40% 50% 60%
AAA and Equivalent
AA and Equivalent
A and Equivalent
TREPS & Current Assets
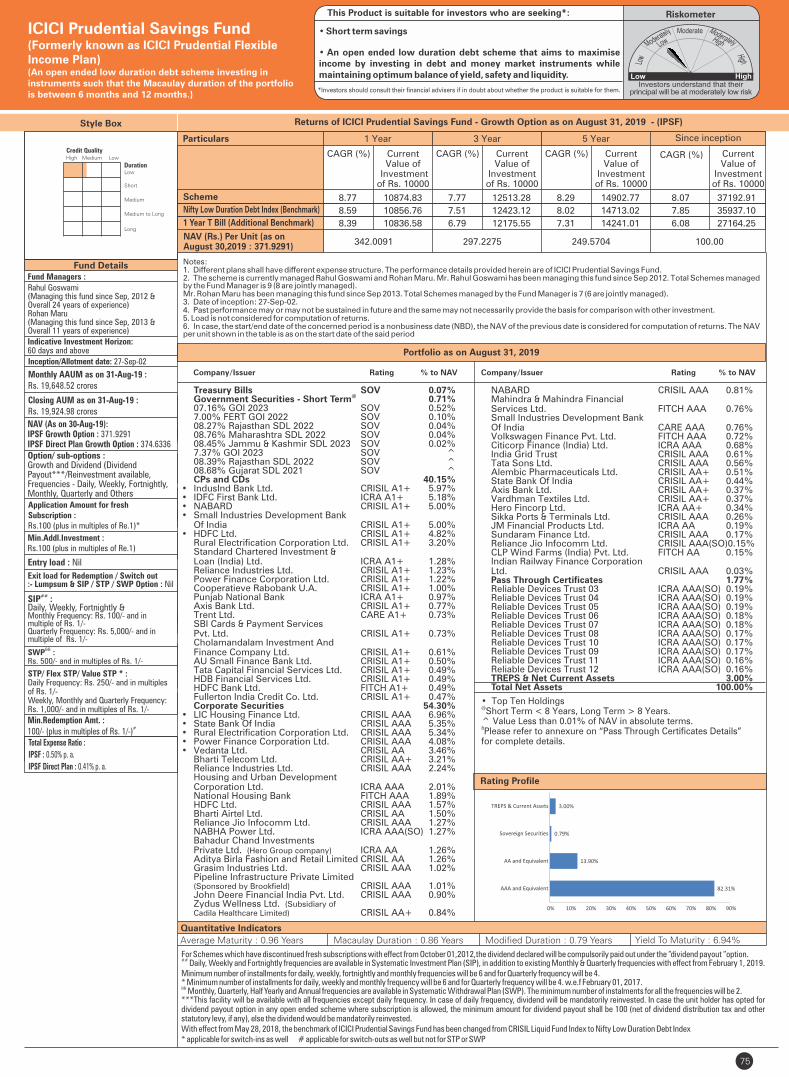
Quantitative Indicators
Fund Details
Style Box
Rating Profile
Fund Managers :
Rahul Goswami (Managing this fund since Sep, 2012 & Overall 24 years of experience)Rohan Maru (Managing this fund since Sep, 2013 & Overall 11 years of experience)
Indicative Investment Horizon:60 days and above
Inception/Allotment date: 27-Sep-02
Monthly AAUM as on 31-Aug-19 : Rs. 19,648.52 crores
Closing AUM as on 31-Aug-19 : Rs. 19,924.98 crores
NAV (As on 30-Aug-19):IPSF Growth Option : 371.9291IPSF Direct Plan Growth Option : 374.6336Option/ sub-options :Growth and Dividend (Dividend Payout***/Reinvestment available, Frequencies - Daily, Weekly, Fortnightly, Monthly, Quarterly and OthersApplication Amount for freshSubscription :Rs.100 (plus in multiples of Re.1)*
Min.Addl.Investment :Rs.100 (plus in multiples of Re.1)
Exit load for Redemption / Switch out:- Lumpsum & SIP / STP / SWP Option : Nil
SIP : ##
Daily, Weekly, Fortnightly & Monthly Frequency: Rs. 100/- and in multiple of Rs. 1/-Quarterly Frequency: Rs. 5,000/- and in multiple of Rs. 1/-
&&SWP :Rs. 500/- and in multiples of Rs. 1/-
STP/ Flex STP/ Value STP * :Daily Frequency: Rs. 250/- and in multiples of Rs. 1/-Weekly, Monthly and Quarterly Frequency: Rs. 1,000/- and in multiples of Rs. 1/-
Min.Redemption Amt. :#100/- (plus in multiples of Rs. 1/-)
Company/Issuer Rating % to NAV
For Schemes which have discontinued fresh subscriptions with effect from October 01,2012,the dividend declared will be compulsorily paid out under the “dividend payout “option.## Daily, Weekly and Fortnightly frequencies are available in Systematic Investment Plan (SIP), in addition to existing Monthly & Quarterly frequencies with effect from February 1, 2019. Minimum number of installments for daily, weekly, fortnightly and monthly frequencies will be 6 and for Quarterly frequency will be 4.* Minimum number of installments for daily, weekly and monthly frequency will be 6 and for Quarterly frequency will be 4. w.e.f February 01, 2017. && Monthly, Quarterly, Half Yearly and Annual frequencies are available in Systematic Withdrawal Plan (SWP). The minimum number of instalments for all the frequencies will be 2.***This facility will be available with all frequencies except daily frequency. In case of daily frequency, dividend will be mandatorily reinvested. In case the unit holder has opted for dividend payout option in any open ended scheme where subscription is allowed, the minimum amount for dividend payout shall be 100 (net of dividend distribution tax and other statutory levy, if any), else the dividend would be mandatorily reinvested.With effect from May 28, 2018, the benchmark of ICICI Prudential Savings Fund has been changed from CRISIL Liquid Fund Index to Nifty Low Duration Debt Index* applicable for switch-ins as well # applicable for switch-outs as well but not for STP or SWP
• Top Ten Holdings@Short Term < 8 Years, Long Term > 8 Years.^ Value Less than 0.01% of NAV in absolute terms.&Please refer to annexure on “Pass Through Certificates Details” for complete details.
Portfolio as on August 31, 2019
Returns of ICICI Prudential Savings Fund - Growth Option as on August 31, 2019 - (IPSF)
Average Maturity : 0.96 Years Macaulay Duration : 0.86 Years Yield To Maturity : 6.94%
Company/Issuer Rating % to NAV
ICICI Prudential Savings Fund(Formerly known as ICICI Prudential Flexible Income Plan)(An open ended low duration debt scheme investing ininstruments such that the Macaulay duration of the portfolio is between 6 months and 12 months.)
Entry load : Nil
RiskometerThis Product is suitable for investors who are seeking*:
• Short term savings
• An open ended low duration debt scheme that aims to maximise income by investing in debt and money market instruments while maintaining optimum balance of yield, safety and liquidity.
*Investors should consult their financial advisers if in doubt about whether the product is suitable for them.
Total Expense Ratio :
IPSF : 0.50% p. a.
IPSF Direct Plan : 0.41% p. a.
Treasury Bills SOV 0.07%@ Government Securities - Short Term 0.71%
07.16% GOI 2023 SOV 0.52% 7.00% FERT GOI 2022 SOV 0.10% 08.27% Rajasthan SDL 2022 SOV 0.04% 08.76% Maharashtra SDL 2022 SOV 0.04% 08.45% Jammu & Kashmir SDL 2023 SOV 0.02% 7.37% GOI 2023 SOV ^ 08.39% Rajasthan SDL 2022 SOV ^ 08.68% Gujarat SDL 2021 SOV ^ CPs and CDs 40.15%• IndusInd Bank Ltd. CRISIL A1+ 5.97%• IDFC First Bank Ltd. ICRA A1+ 5.18%• NABARD CRISIL A1+ 5.00%• Small Industries Development Bank Of India CRISIL A1+ 5.00%• HDFC Ltd. CRISIL A1+ 4.82% Rural Electrification Corporation Ltd. CRISIL A1+ 3.20% Standard Chartered Investment & Loan (India) Ltd. ICRA A1+ 1.28% Reliance Industries Ltd. CRISIL A1+ 1.23% Power Finance Corporation Ltd. CRISIL A1+ 1.22% Cooperatieve Rabobank U.A. CRISIL A1+ 1.00% Punjab National Bank ICRA A1+ 0.97% Axis Bank Ltd. CRISIL A1+ 0.77% Trent Ltd. CARE A1+ 0.73% SBI Cards & Payment Services Pvt. Ltd. CRISIL A1+ 0.73% Cholamandalam Investment And Finance Company Ltd. CRISIL A1+ 0.61% AU Small Finance Bank Ltd. CRISIL A1+ 0.50% Tata Capital Financial Services Ltd. CRISIL A1+ 0.49% HDB Financial Services Ltd. CRISIL A1+ 0.49% HDFC Bank Ltd. FITCH A1+ 0.49% Fullerton India Credit Co. Ltd. CRISIL A1+ 0.47% Corporate Securities 54.30%• LIC Housing Finance Ltd. CRISIL AAA 6.96%• State Bank Of India CRISIL AAA 5.35%• Rural Electrification Corporation Ltd. CRISIL AAA 5.34%• Power Finance Corporation Ltd. CRISIL AAA 4.08%• Vedanta Ltd. CRISIL AA 3.46% Bharti Telecom Ltd. CRISIL AA+ 3.21% Reliance Industries Ltd. CRISIL AAA 2.24% Housing and Urban Development Corporation Ltd. ICRA AAA 2.01% National Housing Bank FITCH AAA 1.89% HDFC Ltd. CRISIL AAA 1.57% Bharti Airtel Ltd. CRISIL AA 1.50% Reliance Jio Infocomm Ltd. CRISIL AAA 1.27% NABHA Power Ltd. ICRA AAA(SO) 1.27% Bahadur Chand Investments Private Ltd. (Hero Group company) ICRA AA 1.26% Aditya Birla Fashion and Retail Limited CRISIL AA 1.26% Grasim Industries Ltd. CRISIL AAA 1.02% Pipeline Infrastructure Private Limited (Sponsored by Brookfield) CRISIL AAA 1.01% John Deere Financial India Pvt. Ltd. CRISIL AAA 0.90% Zydus Wellness Ltd. (Subsidiary of Cadila Healthcare Limited) CRISIL AA+ 0.84%
NABARD CRISIL AAA 0.81% Mahindra & Mahindra Financial Services Ltd. FITCH AAA 0.76% Small Industries Development Bank Of India CARE AAA 0.76% Volkswagen Finance Pvt. Ltd. FITCH AAA 0.72% Citicorp Finance (India) Ltd. ICRA AAA 0.68% India Grid Trust CRISIL AAA 0.61% Tata Sons Ltd. CRISIL AAA 0.56% Alembic Pharmaceuticals Ltd. CRISIL AA+ 0.51% State Bank Of India CRISIL AA+ 0.44% Axis Bank Ltd. CRISIL AA+ 0.37% Vardhman Textiles Ltd. CRISIL AA+ 0.37% Hero Fincorp Ltd. ICRA AA+ 0.34% Sikka Ports & Terminals Ltd. CRISIL AAA 0.26% JM Financial Products Ltd. ICRA AA 0.19% Sundaram Finance Ltd. CRISIL AAA 0.17% Reliance Jio Infocomm Ltd. CRISIL AAA(SO) 0.15% CLP Wind Farms (India) Pvt. Ltd. FITCH AA 0.15% Indian Railway Finance Corporation Ltd. CRISIL AAA 0.03% Pass Through Certificates 1.77% Reliable Devices Trust 03 ICRA AAA(SO) 0.19% Reliable Devices Trust 04 ICRA AAA(SO) 0.19% Reliable Devices Trust 05 ICRA AAA(SO) 0.19% Reliable Devices Trust 06 ICRA AAA(SO) 0.18% Reliable Devices Trust 07 ICRA AAA(SO) 0.18% Reliable Devices Trust 08 ICRA AAA(SO) 0.17% Reliable Devices Trust 10 ICRA AAA(SO) 0.17% Reliable Devices Trust 09 ICRA AAA(SO) 0.17% Reliable Devices Trust 11 ICRA AAA(SO) 0.16% Reliable Devices Trust 12 ICRA AAA(SO) 0.16% TREPS & Net Current Assets 3.00% Total Net Assets 100.00%
Scheme
1 Year T Bill (Additional Benchmark)
NAV (Rs.) Per Unit (as on August 30,2019 : 371.9291)
CAGR (%)
100.00
Nifty Low Duration Debt Index (Benchmark)
Since inception
CurrentValue of
Investment of Rs. 10000
CAGR (%) Current Value of
Investment of Rs. 10000
1 Year 3 Year 5 Year
CAGR (%) Current Value of
Investment of Rs. 10000
CAGR (%) Current Value of
Investment of Rs. 10000
342.0091 297.2275 249.5704
Particulars
8.77 10874.83 7.77 12513.28 8.29 14902.77 8.07 37192.91
8.59 10856.76 7.51 12423.12 8.02 14713.02 7.85 35937.10
8.39 10836.58 6.79 12175.55 7.31 14241.01 6.08 27164.25
Notes:1. Different plans shall have different expense structure. The performance details provided herein are of ICICI Prudential Savings Fund.2. The scheme is currently managed and Rohan Maru. Mr. has been managing this fund since . Total Schemes managed Rahul Goswami Rahul Goswami Sep 2012by the Fund Manager . is 9 (8 are jointly managed)Mr. Rohan Maru has been managing this fund since . Total Schemes managed by the Fund Manager . Sep 2013 is 7 (6 are jointly managed)3. Date of inception: 27-Sep-02.4. Past performance may or may not be sustained in future and the same may not necessarily provide the basis for comparison with other investment.5. Load is not considered for computation of returns.6. In case, the start/end date of the concerned period is a nonbusiness date (NBD), the NAV of the previous date is considered for computation of returns. The NAV per unit shown in the table is as on the start date of the said period
High Medium Low
Low
Short
Medium
Credit Quality
Duration
Medium to Long
Long
Modified Duration : 0.79 Years
75
82.31%
13.90%
0.79%
3.00%
0% 10% 20% 30% 40% 50% 60% 70% 80% 90%
AAA and Equivalent
AA and Equivalent
Sovereign Securities
TREPS & Current Assets
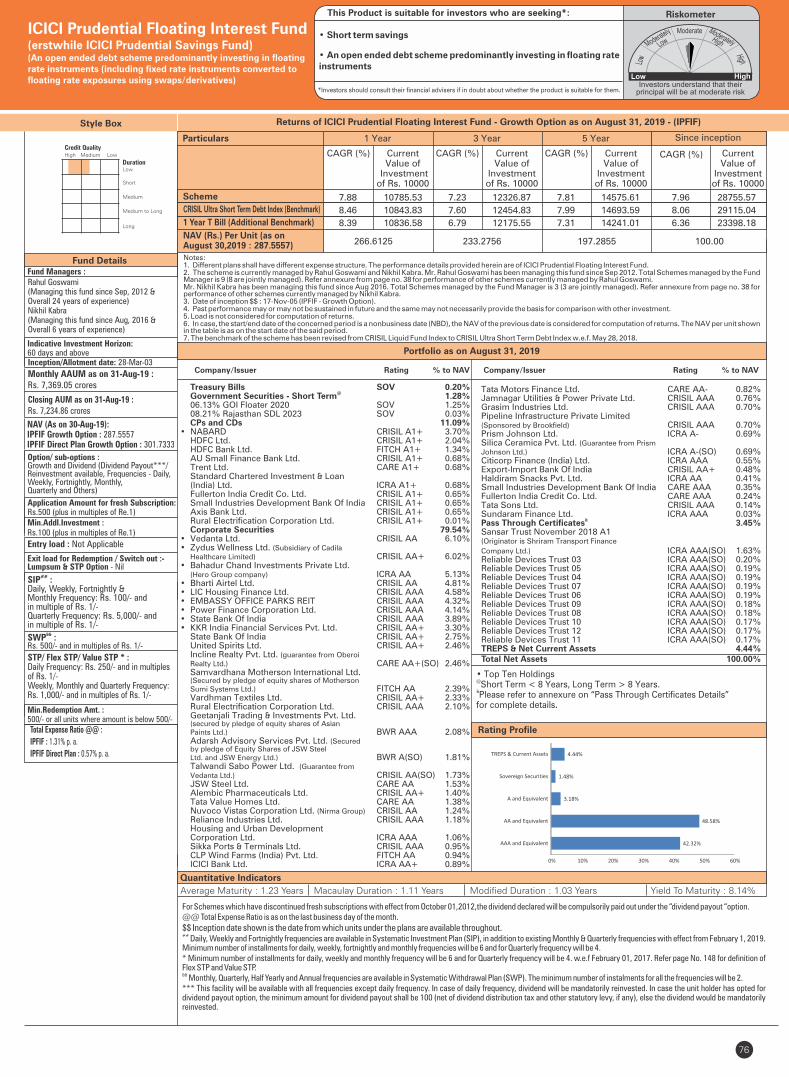
76
Rating Profile
Fund Details
Portfolio as on August 31, 2019
Quantitative Indicators
Style Box
Fund Managers :Rahul Goswami (Managing this fund since Sep, 2012 & Overall 24 years of experience)Nikhil Kabra(Managing this fund since Aug, 2016 & Overall 6 years of experience)
Indicative Investment Horizon:60 days and above
Monthly AAUM as on 31-Aug-19 : Rs. 7,369.05 crores
Closing AUM as on 31-Aug-19 : Rs. 7,234.86 crores
NAV (As on 30-Aug-19):IPFIF Growth Option : 287.5557IPFIF Direct Plan Growth Option : 301.7333
Option/ sub-options :Growth and Dividend (Dividend Payout***/Reinvestment available, Frequencies - Daily, Weekly, Fortnightly, Monthly, Quarterly and Others)
Application Amount for fresh Subscription:Rs.500 (plus in multiples of Re.1)Min.Addl.Investment :Rs.100 (plus in multiples of Re.1)
Exit load for Redemption / Switch out :-Lumpsum & STP Option - Nil
##SIP :Daily, Weekly, Fortnightly & Monthly Frequency: Rs. 100/- and in multiple of Rs. 1/-Quarterly Frequency: Rs. 5,000/- and in multiple of Rs. 1/-
&&SWP :Rs. 500/- and in multiples of Rs. 1/-
STP/ Flex STP/ Value STP * :Daily Frequency: Rs. 250/- and in multiples of Rs. 1/-Weekly, Monthly and Quarterly Frequency: Rs. 1,000/- and in multiples of Rs. 1/-
Min.Redemption Amt. :500/- or all units where amount is below 500/-
Company/Issuer Rating % to NAV
For Schemes which have discontinued fresh subscriptions with effect from October 01,2012,the dividend declared will be compulsorily paid out under the “dividend payout “option.@@ Total Expense Ratio is as on the last business day of the month.
$$ Inception date shown is the date from which units under the plans are available throughout.## Daily, Weekly and Fortnightly frequencies are available in Systematic Investment Plan (SIP), in addition to existing Monthly & Quarterly frequencies with effect from February 1, 2019. Minimum number of installments for daily, weekly, fortnightly and monthly frequencies will be 6 and for Quarterly frequency will be 4.* Minimum number of installments for daily, weekly and monthly frequency will be 6 and for Quarterly frequency will be 4. w.e.f February 01, 2017. Refer page No. 148 for definition of Flex STP and Value STP.&&
Monthly, Quarterly, Half Yearly and Annual frequencies are available in Systematic Withdrawal Plan (SWP). The minimum number of instalments for all the frequencies will be 2.*** This facility will be available with all frequencies except daily frequency. In case of daily frequency, dividend will be mandatorily reinvested. In case the unit holder has opted for dividend payout option, the minimum amount for dividend payout shall be 100 (net of dividend distribution tax and other statutory levy, if any), else the dividend would be mandatorily reinvested.
Returns of ICICI Prudential Floating Interest Fund - Growth Option as on - (IPFIF)August 31, 2019
Average Maturity : 1.23 Years Macaulay Duration : 1.11 Years Yield To Maturity : 8.14%
ICICI Prudential Floating Interest Fund(erstwhile ICICI Prudential Savings Fund)(An open ended debt scheme predominantly investing in floating rate instruments (including fixed rate instruments converted to floating rate exposures using swaps/derivatives)
Inception/Allotment date: 28-Mar-03
Entry load : Not Applicable
RiskometerThis Product is suitable for investors who are seeking*:
• Short term savings
• An open ended debt scheme predominantly investing in floating rate instruments
*Investors should consult their financial advisers if in doubt about whether the product is suitable for them.
Company/Issuer Rating % to NAV
Total Expense Ratio @@ :
IPFIF : 1.31% p. a.
IPFIF Direct Plan : 0.57% p. a.
Notes:1. Different plans shall have different expense structure. The performance details provided herein are of ICICI Prudential Floating Interest Fund.2. The scheme is currently managed by and . Mr. has been managing this fund since . Total Schemes managed by the Fund Rahul Goswami Nikhil Kabra Rahul Goswami Sep 2012Manager . Refer annexure from page no. 38 for performance of other schemes currently managed by .is 9 (8 are jointly managed) Rahul GoswamiMr. has been managing this fund since Aug 2016. Total Schemes managed by the Fund Manager . Refer annexure from page no. 38 for Nikhil Kabra is 3 (3 are jointly managed)performance of other schemes currently managed by . Nikhil Kabra3. Date of inception $$ : 17-Nov-05 (IPFIF - Growth Option).4. Past performance may or may not be sustained in future and the same may not necessarily provide the basis for comparison with other investment.5. Load is not considered for computation of returns.6. In case, the start/end date of the concerned period is a nonbusiness date (NBD), the NAV of the previous date is considered for computation of returns. The NAV per unit shown in the table is as on the start date of the said period.7. The benchmark of the scheme has been revised from CRISIL Liquid Fund Index to CRISIL Ultra Short Term Debt Index w.e.f. May 28, 2018.
Scheme
1 Year T Bill (Additional Benchmark)
NAV (Rs.) Per Unit (as on August 30,2019 : 287.5557)
CAGR (%)
100.00
CRISIL Ultra Short Term Debt Index (Benchmark)
Since inception
CurrentValue of
Investment of Rs. 10000
CAGR (%) Current Value of
Investment of Rs. 10000
1 Year 3 Year 5 Year
CAGR (%) Current Value of
Investment of Rs. 10000
CAGR (%) Current Value of
Investment of Rs. 10000
266.6125 233.2756 197.2855
Particulars
7.88 10785.53 7.23 12326.87 7.81 14575.61 7.96 28755.57
8.46 10843.83 7.60 12454.83 7.99 14693.59 8.06 29115.04
8.39 10836.58 6.79 12175.55 7.31 14241.01 6.36 23398.18
Treasury Bills SOV 0.20%@
Government Securities - Short Term 1.28% 06.13% GOI Floater 2020 SOV 1.25% 08.21% Rajasthan SDL 2023 SOV 0.03% CPs and CDs 11.09%• NABARD CRISIL A1+ 3.70% HDFC Ltd. CRISIL A1+ 2.04% HDFC Bank Ltd. FITCH A1+ 1.34% AU Small Finance Bank Ltd. CRISIL A1+ 0.68% Trent Ltd. CARE A1+ 0.68% Standard Chartered Investment & Loan (India) Ltd. ICRA A1+ 0.68% Fullerton India Credit Co. Ltd. CRISIL A1+ 0.65% Small Industries Development Bank Of India CRISIL A1+ 0.65% Axis Bank Ltd. CRISIL A1+ 0.65% Rural Electrification Corporation Ltd. CRISIL A1+ 0.01% Corporate Securities 79.54%• Vedanta Ltd. CRISIL AA 6.10%• Zydus Wellness Ltd. (Subsidiary of Cadila Healthcare Limited) CRISIL AA+ 6.02%• Bahadur Chand Investments Private Ltd. (Hero Group company) ICRA AA 5.13%• Bharti Airtel Ltd. CRISIL AA 4.81%• LIC Housing Finance Ltd. CRISIL AAA 4.58%• EMBASSY OFFICE PARKS REIT CRISIL AAA 4.32%• Power Finance Corporation Ltd. CRISIL AAA 4.14%• State Bank Of India CRISIL AAA 3.89%• KKR India Financial Services Pvt. Ltd. CRISIL AA+ 3.30% State Bank Of India CRISIL AA+ 2.75% United Spirits Ltd. CRISIL AA+ 2.46% Incline Realty Pvt. Ltd. (guarantee from Oberoi Realty Ltd.) CARE AA+(SO) 2.46% Samvardhana Motherson International Ltd. (Secured by pledge of equity shares of Motherson Sumi Systems Ltd.) FITCH AA 2.39% Vardhman Textiles Ltd. CRISIL AA+ 2.33% Rural Electrification Corporation Ltd. CRISIL AAA 2.10% Geetanjali Trading & Investments Pvt. Ltd. (secured by pledge of equity shares of Asian Paints Ltd.) BWR AAA 2.08% Adarsh Advisory Services Pvt. Ltd. (Secured by pledge of Equity Shares of JSW Steel Ltd. and JSW Energy Ltd.) BWR A(SO) 1.81% Talwandi Sabo Power Ltd. (Guarantee from Vedanta Ltd.) CRISIL AA(SO) 1.73% JSW Steel Ltd. CARE AA 1.53% Alembic Pharmaceuticals Ltd. CRISIL AA+ 1.40% Tata Value Homes Ltd. CARE AA 1.38% Nuvoco Vistas Corporation Ltd. (Nirma Group) CRISIL AA 1.24% Reliance Industries Ltd. CRISIL AAA 1.18% Housing and Urban Development Corporation Ltd. ICRA AAA 1.06% Sikka Ports & Terminals Ltd. CRISIL AAA 0.95% CLP Wind Farms (India) Pvt. Ltd. FITCH AA 0.94% ICICI Bank Ltd. ICRA AA+ 0.89%
Tata Motors Finance Ltd. CARE AA- 0.82% Jamnagar Utilities & Power Private Ltd. CRISIL AAA 0.76% Grasim Industries Ltd. CRISIL AAA 0.70% Pipeline Infrastructure Private Limited (Sponsored by Brookfield) CRISIL AAA 0.70% Prism Johnson Ltd. ICRA A- 0.69% Silica Ceramica Pvt. Ltd. (Guarantee from Prism Johnson Ltd.) ICRA A-(SO) 0.69% Citicorp Finance (India) Ltd. ICRA AAA 0.55% Export-Import Bank Of India CRISIL AA+ 0.48% Haldiram Snacks Pvt. Ltd. ICRA AA 0.41% Small Industries Development Bank Of India CARE AAA 0.35% Fullerton India Credit Co. Ltd. CARE AAA 0.24% Tata Sons Ltd. CRISIL AAA 0.14% Sundaram Finance Ltd. ICRA AAA 0.03%
& Pass Through Certificates 3.45% Sansar Trust November 2018 A1 (Originator is Shriram Transport Finance
Company Ltd.) ICRA AAA(SO) 1.63% Reliable Devices Trust 03 ICRA AAA(SO) 0.20% Reliable Devices Trust 05 ICRA AAA(SO) 0.19% Reliable Devices Trust 04 ICRA AAA(SO) 0.19% Reliable Devices Trust 07 ICRA AAA(SO) 0.19% Reliable Devices Trust 06 ICRA AAA(SO) 0.19% Reliable Devices Trust 09 ICRA AAA(SO) 0.18% Reliable Devices Trust 08 ICRA AAA(SO) 0.18% Reliable Devices Trust 10 ICRA AAA(SO) 0.17% Reliable Devices Trust 12 ICRA AAA(SO) 0.17% Reliable Devices Trust 11 ICRA AAA(SO) 0.17% TREPS & Net Current Assets 4.44% Total Net Assets 100.00%
High Medium Low
Low
Short
Medium
Credit Quality
Duration
Medium to Long
Long
Modified Duration : 1.03 Years
• Top Ten Holdings@Short Term < 8 Years, Long Term > 8 Years.Please refer to annexure on “Pass Through Certificates Details” &
for complete details.
42.32%
48.58%
3.18%
1.48%
4.44%
0% 10% 20% 30% 40% 50% 60%
AAA and Equivalent
AA and Equivalent
A and Equivalent
Sovereign Securities
TREPS & Current Assets

77
Fund Details
Portfolio as on August 31, 2019
Rating Profile
Quantitative Indicators
Style Box
Company/Issuer Rating % to NAV
Fund Managers :
Manish Banthia (Managing this fund since Nov, 2009 & Overall 16 years of experience)
Indicative Investment Horizon:6 months and aboveInception/Allotment date:IPSTP : 25-Oct-01IPSTP Institutional Option : 03-Apr-03Monthly AAUM as on 31-Aug-19 : Rs. 9,295.05 crores
Closing AUM as on 31-Aug-19 : Rs. 9,645.02 croresNAV (As on 30-Aug-19):IPSTF Growth Option : 40.2171IPSTF Direct Plan Growth Option : 42.1270Option/ sub-options : Growth Optionsand Dividend Option, (with Monthly, Fortnightly and Half Yearly frequencies)(dividend payout*** and re-investment facility available)
Application Amount for freshSubscription :Rs.5,000 (plus in multiples of Re.1)
Min.Addl.Investment :Rs.1,000 (plus in multiples of Re.1)
Entry load : Not Applicable
Exit load for Redemption / Switchout :- Lumpsum & SIP / STP OptionNil (w.e.f. 1st Jan 2019)
##SIP :Daily, Weekly, Fortnightly & Monthly Frequency: Rs. 1,000/- and in multiple of Rs. 1/-Quarterly Frequency: Rs. 5,000/- and in multiple of Rs. 1/-
&&SWP :Rs. 500/- and in multiples of Rs. 1/-
STP/ Flex STP/ Value STP * :Daily Frequency: Rs. 250/- and in multiples of Rs. 1/-Weekly, Monthly and Quarterly Frequency: Rs. 1,000/- and in multiples of Rs. 1/-
Min.Redemption Amt. :500/- or all units where amount is below 500/-
For Schemes which have discontinued fresh subscriptions with effect from October 01,2012,the dividend declared will be compulsorily paid out under the “dividend payout “option.
@@ Total Expense Ratio is as on the last business day of the month.## Daily, Weekly and Fortnightly frequencies are available in Systematic Investment Plan (SIP), in addition to existing Monthly & Quarterly frequencies with effect from February 1, 2019. Minimum number of installments for daily, weekly, fortnightly and monthly frequencies will be 6 and for Quarterly frequency will be 4.* Minimum number of installments for daily, weekly and monthly frequency will be 6 and for Quarterly frequency will be 4. w.e.f February 01, 2017. Refer page No. 148 for definition of Flex STP and Value STP.&& Monthly, Quarterly, Half Yearly and Annual frequencies are available in Systematic Withdrawal Plan (SWP). The minimum number of instalments for all the frequencies will be 2.*** In case the unit holder has opted for dividend payout option, the minimum amount for dividend payout shall be 100 (net of dividend distribution tax and other statutory levy, if any), else the dividend would be mandatorily reinvested.
• Top Ten Holdings@Short Term < 8 Years, Long Term > 8 Years.
&Please refer to annexure on “Pass Through Certificates Details”
for complete details.
Returns of ICICI Prudential Short Term Fund - Growth Option as on - (IPSTF)August 31, 2019
Average Maturity : 2.52 Years Macaulay Duration : 2.09 Years Yield To Maturity : 7.73%
Company/Issuer Rating % to NAV
Government Securities 6.97%@ Short Term 2.91%
07.27% GOI 2026 SOV 1.46% 07.32% GOI 2024 SOV 1.13% 08.92% Punjab SDL 2022 SOV 0.17% 08.27% Rajasthan SDL 2022 SOV 0.10% 08.11% Andhra Pradesh SDL 2020 SOV 0.05%
@ Long Term 4.06% 07.26% GOI 2029 SOV 2.36% 07.57% GOI 2033 SOV 1.65% 08.56% Himachal Pradesh SDL 2028 SOV 0.06% CPs and CDs 2.52% IDFC First Bank Ltd. ICRA A1+ 2.02% NABARD CRISIL A1+ 0.50% Corporate Securities 82.73%• LIC Housing Finance Ltd. CRISIL AAA 8.63%• Power Finance Corporation Ltd. CRISIL AAA 8.11%• Rural Electrification Corporation Ltd. CRISIL AAA 6.94%• HDFC Ltd. CRISIL AAA 5.66%• NABARD CRISIL AAA 5.49%• Tata Motors Finance Ltd. CARE AA- 4.89%• Jamnagar Utilities & Power Private Ltd. CRISIL AAA 4.44%• Housing and Urban Development Corporation Ltd. ICRA AAA 4.07%• State Bank Of India CRISIL AAA 3.19%• Pipeline Infrastructure Private Limited (Sponsored by Brookfield) CRISIL AAA 2.54% Bharti Airtel Ltd. CRISIL AA 2.36% Bharti Telecom Ltd. CRISIL AA+ 2.15% Sikka Ports & Terminals Ltd. CRISIL AAA 2.06% Reliance Industries Ltd. CRISIL AAA 1.91% Axis Bank Ltd. CRISIL AAA 1.89% John Deere Financial India Pvt. Ltd. CRISIL AAA 1.58% Small Industries Development Bank Of India CARE AAA 1.58% Tata Steel Ltd. BWR AA 1.57% Walwhan Renewables Energy Ltd. (guarantee from Tata Power Co. Ltd.) CARE AA(SO) 1.42% Tata Projects Ltd. FITCH AA 1.33% State Bank Of India CRISIL AA+ 1.30% India Grid Trust CRISIL AAA 1.26% Axis Bank Ltd. CRISIL AA+ 1.08% ICICI Bank Ltd. CRISIL AA+ 1.06% Zydus Wellness Ltd. (Subsidiary of
Cadila Healthcare Limited) CRISIL AA+ 1.05%
Tata Sons Ltd. CRISIL AAA 1.03% Volkswagen Finance Pvt. Ltd. FITCH AAA 1.03% Bajaj Housing Finance Ltd. CRISIL AAA 0.84% Kotak Mahindra Investments Ltd. CARE AAA 0.79% Tata Motors Ltd. CARE AA- 0.49% NTPC Ltd. CRISIL AAA 0.43% ICICI Bank Ltd. ICRA AAA 0.27% Indian Railway Finance Corporation Ltd. CRISIL AAA 0.27% Coastal Gujarat Power Ltd. (guarantee
from Tata Power Company Limited) CARE AA(SO) 0.05%& Pass Through Certificates 3.50%
Sansar Trust November 2018 A1 (Originator is Shriram Transport
Finance Company Ltd.) ICRA AAA(SO) 1.68% Reliable Devices Trust 04 ICRA AAA(SO) 0.20% Reliable Devices Trust 03 ICRA AAA(SO) 0.20% Reliable Devices Trust 06 ICRA AAA(SO) 0.19% Reliable Devices Trust 05 ICRA AAA(SO) 0.19% Reliable Devices Trust 07 ICRA AAA(SO) 0.18% Reliable Devices Trust 08 ICRA AAA(SO) 0.18% Reliable Devices Trust 09 ICRA AAA(SO) 0.17% Reliable Devices Trust 11 ICRA AAA(SO) 0.17% Reliable Devices Trust 10 ICRA AAA(SO) 0.17% Reliable Devices Trust 12 ICRA AAA(SO) 0.16% TREPS & Net Current Assets 4.28% Total Net Assets 100.00%
ICICI Prudential Short Term Fund(erstwhile ICICI Prudential Short Term Plan)(An open ended short term debt scheme investing in instruments such that the Macaulay duration of the portfolio is between 1 Year and 3 Years.)
RiskometerThis Product is suitable for investors who are seeking*:
• Short term income generation and capital appreciation solution
• A debt fund that aims to generate income by investing in a range of debt and money market instruments of various maturities.
*Investors should consult their financial advisers if in doubt about whether the product is suitable for them.
Dividend History : Refer page no. from 132 to 140
SIP Returns : Refer page no. from 128 to 130
Total Expense Ratio @@ :
1.15% p. a.IPSTF :
IPSTF Direct Plan : 0.40% p. a.
Refer page no. from 141 to 145Investment Objective :
Notes:1. Different plans shall have different expense structure. The performance details provided herein are of ICICI Prudential Short Term Fund.2. The scheme is currently managed by Manish Banthia. Mr. Manish Banthia has been managing this fund since . Total Schemes managed by the Fund Nov 2009Manager . Refer annexure from page no. 38 for performance of other schemes currently managed by Manish Banthia. is 23 (17 are jointly managed) 3. Date of inception: 25-Oct-01.4. Past performance may or may not be sustained in future and the same may not necessarily provide the basis for comparison with other investment.5. Load is not considered for computation of returns.6. In case, the start/end date of the concerned period is a nonbusiness date (NBD), the NAV of the previous date is considered for computation of returns. The NAV per unit shown in the table is as on the start date of the said period7. As the scheme was launched before the launch of the benchmark index, benchmark index figures since inception or the required period are not available.
Scheme
1 Year T Bill (Additional Benchmark)
NAV (Rs.) Per Unit (as on August 30,2019 : 40.2171)
CAGR (%)
10.00
CRISIL Short Term Bond Fund Index (Benchmark)
Since inception
CurrentValue of
Investment of Rs. 10000
CAGR (%) Current Value of
Investment of Rs. 10000
1 Year 3 Year 5 Year
CAGR (%) Current Value of
Investment of Rs. 10000
CAGR (%) Current Value of
Investment of Rs. 10000
36.7437 32.5053 26.7760
Particulars
9.48 10945.30 7.36 12372.47 8.46 15019.83 8.11 40217.10
10.05 11002.09 7.59 12451.20 8.38 14964.64 NA NA
8.39 10836.58 6.79 12175.55 7.31 14241.01 6.13 28913.78
High Medium Low
Low
Short
Medium
Credit Quality
Duration
Medium to Long
Long
Modified Duration : 1.95 Years
70.00%
18.74%
6.97%
4.29%
0% 10% 20% 30% 40% 50% 60% 70% 80%
AAA and Equivalent
AA and Equivalent
Sovereign Securities
TREPS & Current Assets

78
Fund Details
Rating Profile
Portfolio as on August 31, 2019
Quantitative Indicators
For Schemes which have discontinued fresh subscriptions with effect from October 01,2012,the dividend declared will be compulsorily paid out under the “dividend payout “option.
@@ Total Expense Ratio is as on the last business day of the month.## Daily, Weekly and Fortnightly frequencies are available in Systematic Investment Plan (SIP), in addition to existing Monthly & Quarterly frequencies with effect from February 1, 2019. Minimum number of installments for daily, weekly, fortnightly and monthly frequencies will be 6 and for Quarterly frequency will be 4.* Minimum number of installments for daily, weekly and monthly frequency will be 6 and for Quarterly frequency will be 4. w.e.f February 01, 2017. Refer page No. 148 for definition of Flex STP and Value STP.&& Monthly, Quarterly, Half Yearly and Annual frequencies are available in Systematic Withdrawal Plan (SWP). The minimum number of instalments for all the frequencies will be 2.*** In case the unit holder has opted for dividend payout option, the minimum amount for dividend payout shall be 100 (net of dividend distribution tax and other statutory levy, if any), else the dividend would be mandatorily reinvested.With effect from May 28, 2018, the benchmark of ICICI Prudential Bond Fund has been changed from CRISIL Composite Bond Fund Index to Nifty Medium to Long Duration Debt Index
Style Box
Fund Managers :
Manish Banthia(Managing this fund since Sep, 2013 & Overall16 years of experience)Indicative Investment Horizon:2 years and above
Inception/Allotment date: 18-Aug-08Monthly AAUM as on 31-Aug-19 : Rs. 3,304.16 crores
Closing AUM as on 31-Aug-19 : Rs. 3,318.48 crores
NAV (As on 30-Aug-19):IPBF Growth Option : 27.0496IPBF Direct Plan Growth Option : 27.8129
Application Amount for freshSubscription :Rs.5,000 (plus in multiples of Re.1)
Min.Addl.Investment :Rs.1,000 (plus in multiples of Re.1)
Exit load for Redemption / Switchout :- Lumpsum & SIP / STP / SWP OptionWithin 6 Months from allotment - 1% ofapplicable NAV, more than 6 Months - Nil
SIP :##
Daily, Weekly, Fortnightly & Monthly Frequency: Rs. 1,000/- and in multiple of Rs. 1/-Quarterly Frequency: Rs. 5,000/- and in multiple of Rs. 1/-
&&SWP :Rs. 500/- and in multiples of Rs. 1/-STP/ Flex STP/ Value STP * :Daily Frequency: Rs. 250/- and in multiples of Rs. 1/-Weekly, Monthly and Quarterly Frequency: Rs. 1,000/- and in multiples of Rs. 1/-
Min.Redemption Amt. :500/- or all units where amount is below 500/-
Option/ sub-options :Growth Options and Dividend (with Monthly, Quarterly and Half Yearly frequencies)(dividend payout*** and re-investment facility available)
Company/Issuer Rating % to NAV
CPs and CDs 0.74%
Small Industries Development Bank
Of India CRISIL A1+ 0.74%
Corporate Securities 93.64%
• Tata Sons Ltd. CRISIL AAA 10.87%
• Axis Bank Ltd. CRISIL AAA 8.65%
• Mahanagar Telephone Nigam Ltd. CRISIL AAA(SO) 8.51%
• Rural Electrification Corporation Ltd. CRISIL AAA 7.17%
• Housing and Urban Development
Corporation Ltd. ICRA AAA 7.10%
• ICICI Bank Ltd. ICRA AAA 7.04%
• Reliance Industries Ltd. CRISIL AAA 6.67%
• NABARD CRISIL AAA 6.40%
• Power Finance Corporation Ltd. CRISIL AAA 6.07%
• State Bank Of India CRISIL AAA 4.63%
HDFC Ltd. CRISIL AAA 3.90%
State Bank of India ICRA AAA 3.06%
Jamnagar Utilities & Power Private Ltd. CRISIL AAA 2.70%
Small Industries Development Bank
Of India ICRA AAA 2.62%
Reliance Jio Infocomm Ltd. CRISIL AAA 1.80%
NTPC Ltd. CRISIL AAA 1.69%
Power Grid Corporation Of India Ltd. CRISIL AAA 1.59%
LIC Housing Finance Ltd. CRISIL AAA 1.40%
Sikka Ports & Terminals Ltd. CRISIL AAA 0.84%
HDB Financial Services Ltd. CRISIL AAA 0.41%
NHPC Ltd. ICRA AAA 0.32%
Export-Import Bank Of India CRISIL AAA 0.08%
Nuclear Power Corporation of India
Ltd. CRISIL AAA 0.06%
Food Corporation Of India CRISIL AAA(SO) 0.05%
TREPS & Net Current Assets 5.62%
Total Net Assets 100.00%
Returns of ICICI Prudential Bond Fund - Growth Option as on - (IPBF)August 31, 2019
• Top Ten Holdings
Average Maturity : 4.07 Years Macaulay Duration : 3.26 Years Yield To Maturity : 7.40%
ICICI Prudential Bond Fund(erstwhile ICICI Prudential Income Opportunities Fund)(An open ended medium to long term debt scheme investing in instruments such that the Macaulay duration of the portfolio is between 4 Years and 7 Years. The Macaulay duration of the portfolio is 1 Year to 7 years under anticipated adverse situation.)
Entry load : Not Applicable
RiskometerThis Product is suitable for investors who are seeking*:
• Medium to Long term savings
• A debt scheme that invests in debt and money market instruments with an aim to maximise income while maintaining an optimum balance of yield, safety and liquidity.
*Investors should consult their financial advisers if in doubt about whether the product is suitable for them.
Dividend History : Refer page no. from 132 to 140
SIP Returns : Refer page no. from 128 to 130
Total Expense Ratio @@ :
IPBF : 1.08% p. a.
IPBF Direct Plan : 0.57% p. a.
Investment Objective : Refer page no. from 141 to 145
Notes:1. Different plans shall have different expense structure. The performance details provided herein are of ICICI Prudential Bond Fund.2. The scheme is currently managed by Manish Banthia. Mr. has been managing this fund since . Total Schemes managed by the Fund Manish Banthia Sep 2013Manager . Refer annexure from page no. 109 for performance of other schemes currently managed by . is 23 (17 are jointly managed) Manish Banthia3. Date of inception:18-Aug-08.4. Past performance may or may not be sustained in future and the same may not necessarily provide the basis for comparison with other investment.5. Load is not considered for computation of returns.6. In case, the start/end date of the concerned period is a nonbusiness date (NBD), the NAV of the previous date is considered for computation of returns. The NAV per unit shown in the table is as on the start date of the said period
Scheme
CRISIL 10 year Gilt index (Additional Benchmark)
NAV (Rs.) Per Unit (as on August 30,2019 : 27.0496)
CAGR (%)
10.00
Nifty Medium to Long Duration Debt Index (Benchmark)
Since inception
CurrentValue of
Investment of Rs. 10000
CAGR (%) Current Value of
Investment of Rs. 10000
1 Year 3 Year 5 Year
CAGR (%) Current Value of
Investment of Rs. 10000
CAGR (%) Current Value of
Investment of Rs. 10000
24.3596 22.1011 17.6438
Particulars
11.07 11104.29 6.97 12239.03 8.91 15330.94 9.43 27049.60
13.12 11308.10 7.34 12364.59 9.14 15496.09 9.00 25877.69
16.40 11635.14 6.95 12230.35 8.97 15379.44 7.71 22695.45
High Medium Low
Low
Short
Medium
Credit Quality
Duration
Medium to Long
Long
Modified Duration : 3.06 Years
94.38%
5.62%
0% 10% 20% 30% 40% 50% 60% 70% 80% 90% 100%
AAA and Equivalent
TREPS & Current Assets
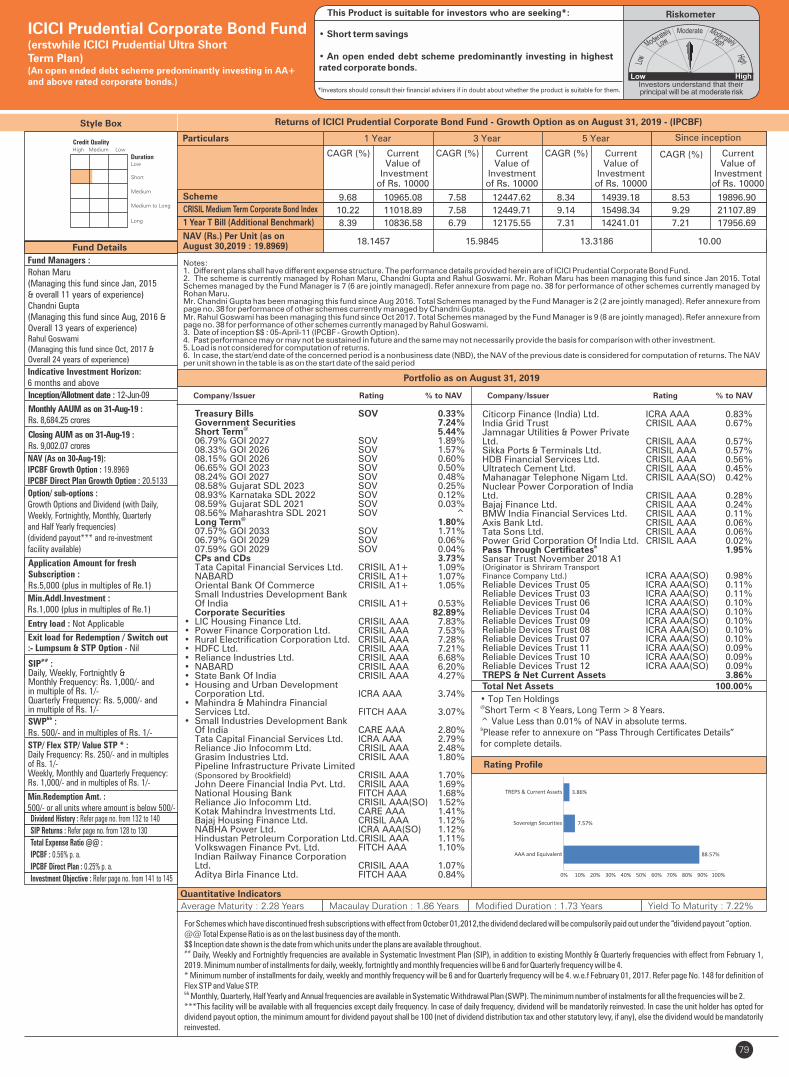
79
Portfolio as on August 31, 2019
Quantitative Indicators
Fund Details
Style Box
Company/Issuer Rating % to NAV
For Schemes which have discontinued fresh subscriptions with effect from October 01,2012,the dividend declared will be compulsorily paid out under the “dividend payout “option.@@ Total Expense Ratio is as on the last business day of the month.$$ Inception date shown is the date from which units under the plans are available throughout.## Daily, Weekly and Fortnightly frequencies are available in Systematic Investment Plan (SIP), in addition to existing Monthly & Quarterly frequencies with effect from February 1, 2019. Minimum number of installments for daily, weekly, fortnightly and monthly frequencies will be 6 and for Quarterly frequency will be 4.* Minimum number of installments for daily, weekly and monthly frequency will be 6 and for Quarterly frequency will be 4. w.e.f February 01, 2017. Refer page No. 148 for definition of Flex STP and Value STP.&&
Monthly, Quarterly, Half Yearly and Annual frequencies are available in Systematic Withdrawal Plan (SWP). The minimum number of instalments for all the frequencies will be 2.***This facility will be available with all frequencies except daily frequency. In case of daily frequency, dividend will be mandatorily reinvested. In case the unit holder has opted for dividend payout option, the minimum amount for dividend payout shall be 100 (net of dividend distribution tax and other statutory levy, if any), else the dividend would be mandatorily reinvested.
Fund Managers :
Rohan Maru(Managing this fund since Jan, 2015& overall 11 years of experience)Chandni Gupta(Managing this fund since Aug, 2016 &Overall 13 years of experience)Rahul Goswami (Managing this fund since Oct, 2017 & Overall 24 years of experience)
Indicative Investment Horizon:6 months and above
Inception/Allotment date : 12-Jun-09
Monthly AAUM as on 31-Aug-19 : Rs. 8,684.25 crores
Closing AUM as on 31-Aug-19 : Rs. 9,002.07 crores
NAV (As on 30-Aug-19):IPCBF Growth Option : 19.8969IPCBF Direct Plan Growth Option : 20.5133
Option/ sub-options :Growth Options and Dividend (with Daily, Weekly, Fortnightly, Monthly, Quarterly and Half Yearly frequencies)(dividend payout*** and re-investment facility available)
Application Amount for freshSubscription :Rs.5,000 (plus in multiples of Re.1)
Min.Addl.Investment :Rs.1,000 (plus in multiples of Re.1)
Exit load for Redemption / Switch out:- Lumpsum & STP Option - Nil
##SIP :Daily, Weekly, Fortnightly & Monthly Frequency: Rs. 1,000/- and in multiple of Rs. 1/-Quarterly Frequency: Rs. 5,000/- and in multiple of Rs. 1/-
&&SWP :Rs. 500/- and in multiples of Rs. 1/-
STP/ Flex STP/ Value STP * :Daily Frequency: Rs. 250/- and in multiples of Rs. 1/-Weekly, Monthly and Quarterly Frequency: Rs. 1,000/- and in multiples of Rs. 1/-
Min.Redemption Amt. :500/- or all units where amount is below 500/-
• Top Ten Holdings@Short Term < 8 Years, Long Term > 8 Years.^ Value Less than 0.01% of NAV in absolute terms.&Please refer to annexure on “Pass Through Certificates Details” for complete details.
Returns of ICICI Prudential Corporate Bond Fund - Growth Option as on - (IPCBF)August 31, 2019
Average Maturity : 2.28 Years Macaulay Duration : 1.86 Years Yield To Maturity : 7.22%
ICICI Prudential Corporate Bond Fund(erstwhile ICICI Prudential Ultra Short Term Plan)(An open ended debt scheme predominantly investing in AA+ and above rated corporate bonds.)
Entry load : Not Applicable
RiskometerThis Product is suitable for investors who are seeking*:
• Short term savings
• An open ended debt scheme predominantly investing in highest rated corporate bonds.
*Investors should consult their financial advisers if in doubt about whether the product is suitable for them.
Dividend History : Refer page no. from 132 to 140
SIP Returns : Refer page no. from 128 to 130
Total Expense Ratio @@ :
IPCBF : 0.56% p. a.
IPCBF Direct Plan : 0.25% p. a.
Investment Objective : Refer page no. from 141 to 145
Rating Profile
Notes:1. Different plans shall have different expense structure. The performance details provided herein are of ICICI Prudential Corporate Bond Fund.2. The scheme is currently managed Chandni Gupta and Mr. Rohan Maru has been managing this fund since Jan 2015. Total by Rohan Maru, Rahul Goswami. Schemes managed by the Fund Manager is . Refer annexure from page no. 38 for performance of other schemes currently managed by 7 (6 are jointly managed)Rohan Maru.Mr. Chandni Gupta has been managing this fund since Aug 2016. Total Schemes managed by the Fund Manager . Refer annexure from is 2 (2 are jointly managed)page no. 38 for performance of other schemes currently managed by Chandni Gupta. Mr. has been managing this fund since . Total Schemes managed by the Fund Manager Rahul Goswami Oct 2017 is 9 (8 are jointly managed). Refer annexure from page no. 38 for performance of other schemes currently managed by Rahul Goswami.3. Date of inception $$ : 05-April-11 (IPCBF - Growth Option).4. Past performance may or may not be sustained in future and the same may not necessarily provide the basis for comparison with other investment.5. Load is not considered for computation of returns.6. In case, the start/end date of the concerned period is a nonbusiness date (NBD), the NAV of the previous date is considered for computation of returns. The NAV per unit shown in the table is as on the start date of the said period
Scheme
1 Year T Bill (Additional Benchmark)
NAV (Rs.) Per Unit (as on August 30,2019 : 19.8969)
CAGR (%)
10.00
CRISIL Medium Term Corporate Bond Index
Since inception
CurrentValue of
Investment of Rs. 10000
CAGR (%) Current Value of
Investment of Rs. 10000
1 Year 3 Year 5 Year
CAGR (%) Current Value of
Investment of Rs. 10000
CAGR (%) Current Value of
Investment of Rs. 10000
18.1457 15.9845 13.3186
Particulars
9.68 10965.08 7.58 12447.62 8.34 14939.18 8.53 19896.90
10.22 11018.89 7.58 12449.71 9.14 15498.34 9.29 21107.89
8.39 10836.58 6.79 12175.55 7.31 14241.01 7.21 17956.69
Treasury Bills SOV 0.33% Government Securities 7.24%
@ Short Term 5.44% 06.79% GOI 2027 SOV 1.89% 08.33% GOI 2026 SOV 1.57% 08.15% GOI 2026 SOV 0.60% 06.65% GOI 2023 SOV 0.50% 08.24% GOI 2027 SOV 0.48% 08.58% Gujarat SDL 2023 SOV 0.25% 08.93% Karnataka SDL 2022 SOV 0.12% 08.59% Gujarat SDL 2021 SOV 0.03% 08.56% Maharashtra SDL 2021 SOV ^
@ Long Term 1.80% 07.57% GOI 2033 SOV 1.71% 06.79% GOI 2029 SOV 0.06% 07.59% GOI 2029 SOV 0.04% CPs and CDs 3.73% Tata Capital Financial Services Ltd. CRISIL A1+ 1.09% NABARD CRISIL A1+ 1.07% Oriental Bank Of Commerce CRISIL A1+ 1.05% Small Industries Development Bank Of India CRISIL A1+ 0.53% Corporate Securities 82.89%• LIC Housing Finance Ltd. CRISIL AAA 7.83%• Power Finance Corporation Ltd. CRISIL AAA 7.53%• Rural Electrification Corporation Ltd. CRISIL AAA 7.28%• HDFC Ltd. CRISIL AAA 7.21%• Reliance Industries Ltd. CRISIL AAA 6.68%• NABARD CRISIL AAA 6.20%• State Bank Of India CRISIL AAA 4.27%• Housing and Urban Development Corporation Ltd. ICRA AAA 3.74%• Mahindra & Mahindra Financial Services Ltd. FITCH AAA 3.07%• Small Industries Development Bank Of India CARE AAA 2.80% Tata Capital Financial Services Ltd. ICRA AAA 2.79% Reliance Jio Infocomm Ltd. CRISIL AAA 2.48% Grasim Industries Ltd. CRISIL AAA 1.80% Pipeline Infrastructure Private Limited (Sponsored by Brookfield) CRISIL AAA 1.70% John Deere Financial India Pvt. Ltd. CRISIL AAA 1.69% National Housing Bank FITCH AAA 1.68% Reliance Jio Infocomm Ltd. CRISIL AAA(SO) 1.52% Kotak Mahindra Investments Ltd. CARE AAA 1.41% Bajaj Housing Finance Ltd. CRISIL AAA 1.12% NABHA Power Ltd. ICRA AAA(SO) 1.12% Hindustan Petroleum Corporation Ltd. CRISIL AAA 1.11% Volkswagen Finance Pvt. Ltd. FITCH AAA 1.10% Indian Railway Finance Corporation Ltd. CRISIL AAA 1.07% Aditya Birla Finance Ltd. FITCH AAA 0.84%
High Medium Low
Low
Short
Medium
Credit Quality
Duration
Medium to Long
Long
Modified Duration : 1.73 Years
Company/Issuer Rating % to NAV
Citicorp Finance (India) Ltd. ICRA AAA 0.83% India Grid Trust CRISIL AAA 0.67% Jamnagar Utilities & Power Private Ltd. CRISIL AAA 0.57% Sikka Ports & Terminals Ltd. CRISIL AAA 0.57% HDB Financial Services Ltd. CRISIL AAA 0.56% Ultratech Cement Ltd. CRISIL AAA 0.45% Mahanagar Telephone Nigam Ltd. CRISIL AAA(SO) 0.42% Nuclear Power Corporation of India Ltd. CRISIL AAA 0.28% Bajaj Finance Ltd. CRISIL AAA 0.24% BMW India Financial Services Ltd. CRISIL AAA 0.11% Axis Bank Ltd. CRISIL AAA 0.06% Tata Sons Ltd. CRISIL AAA 0.06% Power Grid Corporation Of India Ltd. CRISIL AAA 0.02%
& Pass Through Certificates 1.95% Sansar Trust November 2018 A1 (Originator is Shriram Transport Finance Company Ltd.) ICRA AAA(SO) 0.98% Reliable Devices Trust 05 ICRA AAA(SO) 0.11% Reliable Devices Trust 03 ICRA AAA(SO) 0.11% Reliable Devices Trust 06 ICRA AAA(SO) 0.10% Reliable Devices Trust 04 ICRA AAA(SO) 0.10% Reliable Devices Trust 09 ICRA AAA(SO) 0.10% Reliable Devices Trust 08 ICRA AAA(SO) 0.10% Reliable Devices Trust 07 ICRA AAA(SO) 0.10% Reliable Devices Trust 11 ICRA AAA(SO) 0.09% Reliable Devices Trust 10 ICRA AAA(SO) 0.09% Reliable Devices Trust 12 ICRA AAA(SO) 0.09% TREPS & Net Current Assets 3.86% Total Net Assets 100.00%
88.57%
7.57%
3.86%
0% 10% 20% 30% 40% 50% 60% 70% 80% 90% 100%
AAA and Equivalent
Sovereign Securities
TREPS & Current Assets

Rating Profile
Quantitative Indicators
Fund Details
Portfolio as on August 31, 2019
Style Box
Fund Managers :
Rahul Goswami (Managing this fund since Sep, 2012 & Overall 24 years of experience)Chandni Gupta(Managing this fund since Jan, 2015 & Overall 13 years of experience)
Indicative Investment Horizon:9 months and above
Inception/Allotment date: 01-Jan-10
Monthly AAUM as on 31-Aug-19 : Rs. 6,521.27 crores
Closing AUM as on 31-Aug-19 : Rs. 6,613.59 crores
NAV (As on 30-Aug-19):IPBPDF Growth Option : 22.1856IPBPDF Direct Plan Growth Option : 22.5870
Option/ sub-options :Growth Option and Dividend Option(with Daily, Weekly, Quarterly and Half Yearly frequencies)(dividend payout*** and re-investment facility available)
Application Amount for freshSubscription :Rs.5,000 (plus in multiples of Re.1)
Min.Addl.Investment :Rs.1,000 (plus in multiples of Re.1)
Exit load for Redemption / Switch out :-Lumpsum & STP Option - Nil
SIP : ##
Daily, Weekly, Fortnightly & Monthly Frequency: Rs. 1,000/- and in multiple of Rs. 1/-Quarterly Frequency: Rs. 5,000/- and in multiple of Rs. 1/-
&&SWP :Rs. 500/- and in multiples of Rs. 1/-
STP/ Flex STP/ Value STP * :Daily Frequency: Rs. 250/- and in multiples of Rs. 1/-Weekly, Monthly and Quarterly Frequency: Rs. 1,000/- and in multiples of Rs. 1/-
Min.Redemption Amt. :500/- or all units where amount is below 500/-
Company/Issuer Rating % to NAV
For Schemes which have discontinued fresh subscriptions with effect from October 01,2012,the dividend declared will be compulsorily paid out under the “dividend payout “option.## Daily, Weekly and Fortnightly frequencies are available in Systematic Investment Plan (SIP), in addition to existing Monthly & Quarterly frequencies with effect from February 1, 2019. Minimum number of installments for daily, weekly, fortnightly and monthly frequencies will be 6 and for Quarterly frequency will be 4.* Minimum number of installments for daily, weekly and monthly frequency will be 6 and for Quarterly frequency will be 4. w.e.f February 01, 2017. &&
Monthly, Quarterly, Half Yearly and Annual frequencies are available in Systematic Withdrawal Plan (SWP). The minimum number of instalments for all the frequencies will be 2.***This facility will be available with all frequencies except daily frequency. In case of daily frequency, dividend will be mandatorily reinvested. In case the unit holder has opted for dividend payout option in any open ended scheme where subscription is allowed, the minimum amount for dividend payout shall be 100 (net of dividend distribution tax and other statutory levy, if any), else the dividend would be mandatorily reinvested.ICICI Prudential Dynamic Bond Fund has been merged into ICICI Prudential Banking & PSU Debt Fund after the close of business hours on May 25, 2018. The performance disclosed above is of ICICI Prudential Banking & PSU Debt Fund. Performance of the merging schemes shall be made available to investors on request.With effect from May 28, 2018, the benchmark of ICICI Prudential Banking & PSU Debt Fund has been changed from CRISIL Short Term Bond Fund Index to CRISIL Banking and PSU Debt Index@@ Total Expense Ratio is as on the last business day of the month.
Returns of ICICI Prudential Banking & PSU Debt Fund - Growth Option as on August 31, 2019 - (IPBPDF)
Average Maturity : 3.95 Years Macaulay Duration : 2.70 Years Yield To Maturity : 7.44%
Government Securities 7.89%@ Short Term 0.39%
7.00% FERT GOI 2022 SOV 0.23% 08.35% GOI 2024 SOV 0.16% 07.67% Tamil Nadu SDL 2023 SOV ^
@ Long Term 7.50%• 07.57% GOI 2033 SOV 6.89% 06.79% GOI 2029 SOV 0.61% CPs and CDs 14.16% IndusInd Bank Ltd. CRISIL A1+ 3.33% Small Industries Development Bank Of India CRISIL A1+ 2.79% Bank Of Baroda ICRA A1+ 2.56% IDFC First Bank Ltd. ICRA A1+ 2.23% Andhra Bank FITCH A1+ 1.10% Axis Bank Ltd. CRISIL A1+ 1.10% Punjab National Bank CARE A1+ 0.38% Rural Electrification Corporation Ltd. CARE A1+ 0.38% HDFC Bank Ltd. FITCH A1+ 0.29% Corporate Securities 73.42%• NABARD CRISIL AAA 8.34%• Power Finance Corporation Ltd. CRISIL AAA 7.08%• Housing and Urban Development Corporation Ltd. ICRA AAA 6.64%• ICICI Bank Ltd. ICRA AA+ 6.06%• Rural Electrification Corporation Ltd. CRISIL AAA 5.71%• Axis Bank Ltd. CRISIL AA+ 5.39%• State Bank Of India CRISIL AAA 4.88%• HDFC Bank Ltd. CRISIL AA+ 4.81%• State Bank Of India CRISIL AA+ 4.37% National Highways Authority of India CRISIL AAA 3.17% HDFC Ltd. CRISIL AAA 3.00% Indian Railway Finance Corporation Ltd. CRISIL AAA 2.55% Reliance Industries Ltd. CRISIL AAA 2.20% LIC Housing Finance Ltd. CRISIL AAA 1.62% National Housing Bank FITCH AAA 1.52% GAIL (India) Ltd. FITCH AAA 1.24% Export-Import Bank Of India CRISIL AA+ 1.13% Tata Sons Ltd. CRISIL AAA 1.13% Bank Of Baroda FITCH AAA 0.85% SP Jammu Udhampur Highway Ltd. (NHAI Annuity) ICRA AAA(SO) 0.48% Mahanagar Telephone Nigam Ltd. CRISIL AAA(SO) 0.47% NHPC Ltd. FITCH AAA 0.40% Small Industries Development Bank Of India CARE AAA 0.38%
• Top Ten Holding@Short Term < 8 Years, Long Term > 8 Years.^ Value Less than 0.01% of NAV in absolute terms.&Please refer to annexure on “Pass Through Certificates Details” for complete details.
ICICI Prudential Banking & PSU Debt Fund(An open ended debt scheme predominantly investing in Debt instruments of banks, Public Sector Undertakings, Public Financial Institutions and Municipal Bonds.)
Entry load : Nil
RiskometerThis Product is suitable for investors who are seeking*:
• Short term savings
• An open ended debt scheme predominantly investing in Debt instruments of banks, Public Sector Undertakings, Public Financial Institutions and Municipal Bonds
*Investors should consult their financial advisers if in doubt about whether the product is suitable for them.
Total Expense Ratio @@ :
IPBPDF : 0.82% p. a.
IPBPDF Direct Plan : 0.37% p. a.
Scheme
1 Year T Bill (Additional Benchmark)
NAV (Rs.) Per Unit (as on August 30,2019 : 22.1856)
CAGR (%)
10.0000
CRISIL Banking and PSU Debt Index (Benchmark)
Since inception
CurrentValue of
Investment of Rs. 10000
CAGR (%) Current Value of
Investment of Rs. 10000
1 Year 3 Year 5 Year
CAGR (%) Current Value of
Investment of Rs. 10000
CAGR (%) Current Value of
Investment of Rs. 10000
20.2621 17.8520 14.5996
Particulars
9.52 10949.31 7.52 12427.52 8.71 15196.03 8.59 22185.60
10.69 11065.90 8.16 12649.03 9.09 15463.70 8.75 22501.84
8.39 10836.58 6.79 12175.55 7.31 14241.01 6.74 18791.23
Notes:1. Different plans shall have different expense structure. The performance details provided herein are of ICICI Prudential Banking & PSU Debt Fund.2. The scheme is currently managed and . Mr. has been managing this fund since . Total Schemes Rahul Goswami Chandni Gupta Rahul Goswami Sep 2012managed by the Fund Manager . is 9 (8 are jointly managed)Mr. has been managing this fund since . Total Schemes managed by the Fund Manager . Chandni Gupta Jan 2015 is 2 (2 are jointly managed)3. Date of inception: 01-Jan-10.4. Past performance may or may not be sustained in future and the same may not necessarily provide the basis for comparison with other investment.5. Load is not considered for computation of returns.6. In case, the start/end date of the concerned period is a nonbusiness date (NBD), the NAV of the previous date is considered for computation of returns. The NAV per unit shown in the table is as on the start date of the said period.7. The benchmark of the scheme has been revised from CRISIL Short Term Bond Fund Index to CRISIL Banking and PSU Debt Index w.e.f. May 28, 2018.
High Medium Low
Low
Short
Medium
Credit Quality
Duration
Medium to Long
Long
Modified Duration : 2.50 Years
80
Company/Issuer Rating % to NAV
& Pass Through Certificates 1.99% Reliable Devices Trust 03 ICRA AAA(SO) 0.22% Reliable Devices Trust 05 ICRA AAA(SO) 0.21% Reliable Devices Trust 04 ICRA AAA(SO) 0.21% Reliable Devices Trust 06 ICRA AAA(SO) 0.20% Reliable Devices Trust 09 ICRA AAA(SO) 0.20% Reliable Devices Trust 08 ICRA AAA(SO) 0.20% Reliable Devices Trust 07 ICRA AAA(SO) 0.20% Reliable Devices Trust 10 ICRA AAA(SO) 0.19% Reliable Devices Trust 12 ICRA AAA(SO) 0.18% Reliable Devices Trust 11 ICRA AAA(SO) 0.18% TREPS & Net Current Assets 2.54% Total Net Assets 100.00%
67.82%
21.76%
7.89%
2.53%
0% 10% 20% 30% 40% 50% 60% 70% 80%
AAA and Equivalent
AA and Equivalent
Sovereign Securities
TREPS & Current Assets
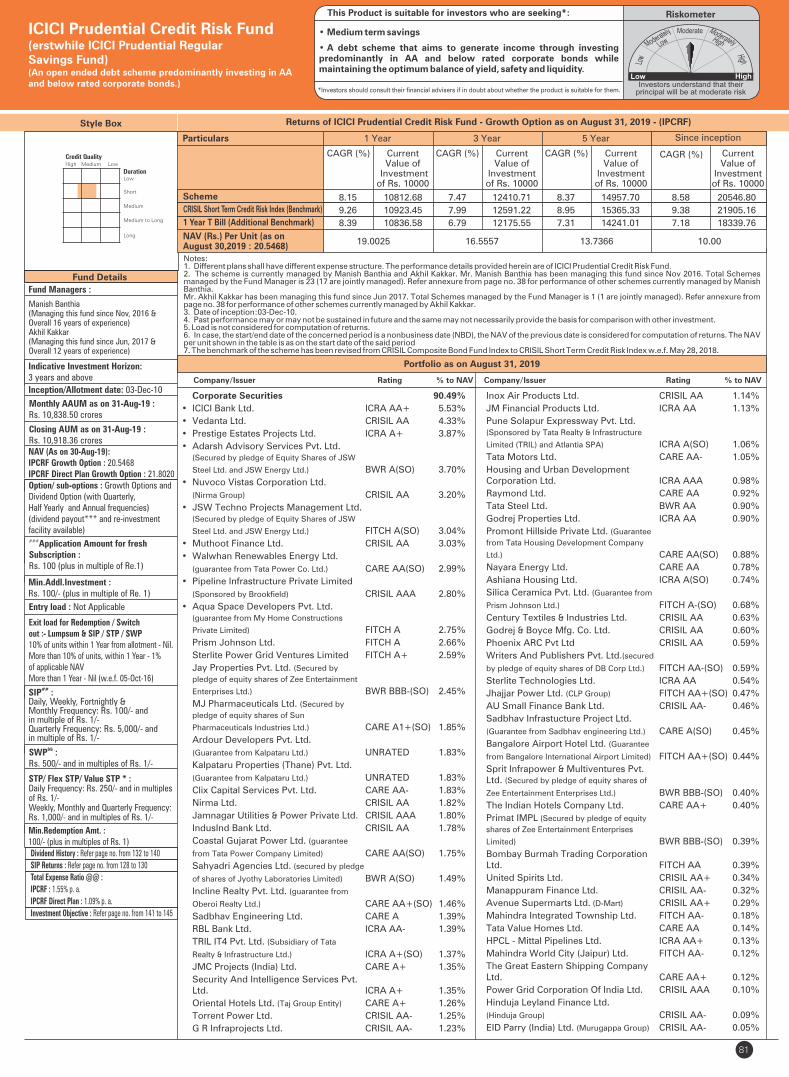
81
Fund Details
Portfolio as on August 31, 2019
Company/Issuer Rating % to NAV
Style Box
Fund Managers :
Indicative Investment Horizon:3 years and above
Inception/Allotment date: 03-Dec-10
Monthly AAUM as on 31-Aug-19 : Rs. 10,838.50 crores
Closing AUM as on 31-Aug-19 : Rs. 10,918.36 croresNAV (As on 30-Aug-19):IPCRF Growth Option : 20.5468IPCRF Direct Plan Growth Option : 21.8020Option/ sub-options : Growth Options and Dividend Option (with Quarterly, Half Yearly and Annual frequencies)(dividend payout*** and re-investment facility available)###Application Amount for freshSubscription :Rs. 100 (plus in multiple of Re.1)
Min.Addl.Investment :Rs. 100/- (plus in multiple of Re. 1)
Exit load for Redemption / Switchout :- Lumpsum & SIP / STP / SWP 10% of units within 1 Year from allotment - Nil.More than 10% of units, within 1 Year - 1% of applicable NAVMore than 1 Year - Nil (w.e.f. 05-Oct-16)
##SIP :Daily, Weekly, Fortnightly & Monthly Frequency: Rs. 100/- and in multiple of Rs. 1/-Quarterly Frequency: Rs. 5,000/- and in multiple of Rs. 1/-
&&SWP :Rs. 500/- and in multiples of Rs. 1/-
STP/ Flex STP/ Value STP * :Daily Frequency: Rs. 250/- and in multiples of Rs. 1/-Weekly, Monthly and Quarterly Frequency: Rs. 1,000/- and in multiples of Rs. 1/-
Min.Redemption Amt. :100/- (plus in multiples of Rs. 1)
Returns of ICICI Prudential Credit Risk Fund - Growth Option as on - (IPCRF) August 31, 2019
ICICI Prudential Credit Risk Fund(erstwhile ICICI Prudential Regular Savings Fund)(An open ended debt scheme predominantly investing in AA and below rated corporate bonds.)
Company/Issuer Rating % to NAV
Entry load : Not Applicable
RiskometerThis Product is suitable for investors who are seeking*:
• Medium term savings
• A debt scheme that aims to generate income through investing predominantly in AA and below rated corporate bonds while maintaining the optimum balance of yield, safety and liquidity.
*Investors should consult their financial advisers if in doubt about whether the product is suitable for them.
Dividend History : Refer page no. from 132 to 140
SIP Returns : Refer page no. from 128 to 130
Total Expense Ratio @@ :
IPCRF : 1.55% p. a.
IPCRF Direct Plan : 1.09% p. a.
Investment Objective : Refer page no. from 141 to 145
Scheme
1 Year T Bill (Additional Benchmark)
NAV (Rs.) Per Unit (as on August 30,2019 : 20.5468)
CAGR (%)
10.00
CRISIL Short Term Credit Risk Index (Benchmark)
Since inception
CurrentValue of
Investment of Rs. 10000
CAGR (%) Current Value of
Investment of Rs. 10000
1 Year 3 Year 5 Year
CAGR (%) Current Value of
Investment of Rs. 10000
CAGR (%) Current Value of
Investment of Rs. 10000
19.0025 16.5557 13.7366
Particulars
8.15 10812.68 7.47 12410.71 8.37 14957.70 8.58 20546.80
9.26 10923.45 7.99 12591.22 8.95 15365.33 9.38 21905.16
8.39 10836.58 6.79 12175.55 7.31 14241.01 7.18 18339.76
Manish Banthia(Managing this fund since Nov, 2016 & Overall 16 years of experience)Akhil Kakkar (Managing this fund since Jun, 2017 & Overall 12 years of experience)
Notes:1. Different plans shall have different expense structure. The performance details provided herein are of ICICI Prudential Credit Risk Fund.2. The scheme is currently managed by Manish Banthia and Akhil Kakkar. Mr. Manish Banthia has been managing this fund since . Total Schemes Nov 2016managed by the Fund Manager . Refer annexure from page no. 38 for performance of other schemes currently managed by Manish is 23 (17 are jointly managed) Banthia.Mr. Akhil Kakkar has been managing this fund since 7. Total Schemes managed by the Fund Manager . Refer annexure from Jun 201 is 1 (1 are jointly managed)page no. 38 for performance of other schemes currently managed by Akhil Kakkar. 3. Date of inception:03-Dec-10.4. Past performance may or may not be sustained in future and the same may not necessarily provide the basis for comparison with other investment.5. Load is not considered for computation of returns.6. In case, the start/end date of the concerned period is a nonbusiness date (NBD), the NAV of the previous date is considered for computation of returns. The NAV per unit shown in the table is as on the start date of the said period7. The benchmark of the scheme has been revised from CRISIL Composite Bond Fund Index to CRISIL Short Term Credit Risk Index w.e.f. May 28, 2018.
High Medium Low
Low
Short
Medium
Credit Quality
Duration
Medium to Long
Long
Corporate Securities 90.49%
• ICICI Bank Ltd. ICRA AA+ 5.53%
• Vedanta Ltd. CRISIL AA 4.33%
• Prestige Estates Projects Ltd. ICRA A+ 3.87%
• Adarsh Advisory Services Pvt. Ltd. (Secured by pledge of Equity Shares of JSW
Steel Ltd. and JSW Energy Ltd.) BWR A(SO) 3.70%
• Nuvoco Vistas Corporation Ltd.
(Nirma Group) CRISIL AA 3.20%
• JSW Techno Projects Management Ltd. (Secured by pledge of Equity Shares of JSW
Steel Ltd. and JSW Energy Ltd.) FITCH A(SO) 3.04%
• Muthoot Finance Ltd. CRISIL AA 3.03%
• Walwhan Renewables Energy Ltd.
(guarantee from Tata Power Co. Ltd.) CARE AA(SO) 2.99%
• Pipeline Infrastructure Private Limited
(Sponsored by Brookfield) CRISIL AAA 2.80%
• Aqua Space Developers Pvt. Ltd. (guarantee from My Home Constructions
Private Limited) FITCH A 2.75%
Prism Johnson Ltd. FITCH A 2.66%
Sterlite Power Grid Ventures Limited FITCH A+ 2.59%
Jay Properties Pvt. Ltd. (Secured by
pledge of equity shares of Zee Entertainment
Enterprises Ltd.) BWR BBB-(SO) 2.45%
MJ Pharmaceuticals Ltd. (Secured by
pledge of equity shares of Sun
Pharmaceuticals Industries Ltd.) CARE A1+(SO) 1.85%
Ardour Developers Pvt. Ltd.
(Guarantee from Kalpataru Ltd.) UNRATED 1.83%
Kalpataru Properties (Thane) Pvt. Ltd.
(Guarantee from Kalpataru Ltd.) UNRATED 1.83%
Clix Capital Services Pvt. Ltd. CARE AA- 1.83%
Nirma Ltd. CRISIL AA 1.82%
Jamnagar Utilities & Power Private Ltd. CRISIL AAA 1.80%
IndusInd Bank Ltd. CRISIL AA 1.78%
Coastal Gujarat Power Ltd. (guarantee
from Tata Power Company Limited) CARE AA(SO) 1.75%
Sahyadri Agencies Ltd. (secured by pledge
of shares of Jyothy Laboratories Limited) BWR A(SO) 1.49%
Incline Realty Pvt. Ltd. (guarantee from
Oberoi Realty Ltd.) CARE AA+(SO) 1.46%
Sadbhav Engineering Ltd. CARE A 1.39%
RBL Bank Ltd. ICRA AA- 1.39%
TRIL IT4 Pvt. Ltd. (Subsidiary of Tata
Realty & Infrastructure Ltd.) ICRA A+(SO) 1.37%
JMC Projects (India) Ltd. CARE A+ 1.35%
Security And Intelligence Services Pvt. Ltd. ICRA A+ 1.35%
Oriental Hotels Ltd. (Taj Group Entity) CARE A+ 1.26%
Torrent Power Ltd. CRISIL AA- 1.25%
G R Infraprojects Ltd. CRISIL AA- 1.23%
Inox Air Products Ltd. CRISIL AA 1.14%
JM Financial Products Ltd. ICRA AA 1.13%
Pune Solapur Expressway Pvt. Ltd. (Sponsored by Tata Realty & Infrastructure
Limited (TRIL) and Atlantia SPA) ICRA A(SO) 1.06%
Tata Motors Ltd. CARE AA- 1.05%
Housing and Urban Development Corporation Ltd. ICRA AAA 0.98%
Raymond Ltd. CARE AA 0.92%
Tata Steel Ltd. BWR AA 0.90%
Godrej Properties Ltd. ICRA AA 0.90%
Promont Hillside Private Ltd. (Guarantee
from Tata Housing Development Company
Ltd.) CARE AA(SO) 0.88%
Nayara Energy Ltd. CARE AA 0.78%
Ashiana Housing Ltd. ICRA A(SO) 0.74%
Silica Ceramica Pvt. Ltd. (Guarantee from
Prism Johnson Ltd.) FITCH A-(SO) 0.68%
Century Textiles & Industries Ltd. CRISIL AA 0.63%
Godrej & Boyce Mfg. Co. Ltd. CRISIL AA 0.60%
Phoenix ARC Pvt Ltd CRISIL AA 0.59%
Writers And Publishers Pvt. Ltd.(secured
by pledge of equity shares of DB Corp Ltd.) FITCH AA-(SO) 0.59%
Sterlite Technologies Ltd. ICRA AA 0.54%
Jhajjar Power Ltd. (CLP Group) FITCH AA+(SO) 0.47%
AU Small Finance Bank Ltd. CRISIL AA- 0.46%
Sadbhav Infrastucture Project Ltd.
(Guarantee from Sadbhav engineering Ltd.) CARE A(SO) 0.45%
Bangalore Airport Hotel Ltd. (Guarantee
from Bangalore International Airport Limited) FITCH AA+(SO) 0.44%
Sprit Infrapower & Multiventures Pvt. Ltd. (Secured by pledge of equity shares of
Zee Entertainment Enterprises Ltd.) BWR BBB-(SO) 0.40%
The Indian Hotels Company Ltd. CARE AA+ 0.40%
Primat IMPL (Secured by pledge of equity
shares of Zee Entertainment Enterprises
Limited) BWR BBB-(SO) 0.39%
Bombay Burmah Trading Corporation Ltd. FITCH AA 0.39%
United Spirits Ltd. CRISIL AA+ 0.34%
Manappuram Finance Ltd. CRISIL AA- 0.32%
Avenue Supermarts Ltd. (D-Mart) CRISIL AA+ 0.29%
Mahindra Integrated Township Ltd. FITCH AA- 0.18%
Tata Value Homes Ltd. CARE AA 0.14%
HPCL - Mittal Pipelines Ltd. ICRA AA+ 0.13%
Mahindra World City (Jaipur) Ltd. FITCH AA- 0.12%
The Great Eastern Shipping Company Ltd. CARE AA+ 0.12%
Power Grid Corporation Of India Ltd. CRISIL AAA 0.10%
Hinduja Leyland Finance Ltd.
(Hinduja Group) CRISIL AA- 0.09%
EID Parry (India) Ltd. (Murugappa Group) CRISIL AA- 0.05%

82
Quantitative Indicators
Company/Issuer Rating % to NAV
Portfolio as on August 31, 2019
Average Maturity : 1.78 Years Macaulay Duration : 1.53 Years Yield To Maturity : 10.29%
ICICI Prudential Credit Risk Fund(erstwhile ICICI Prudential Regular Savings Fund)(An open ended debt scheme predominantly investing in AA and below rated corporate bonds.)
RiskometerThis Product is suitable for investors who are seeking*:
• Medium term savings
• A debt scheme that aims to generate income through investing predominantly in AA and below rated corporate bonds while maintaining the optimum balance of yield, safety and liquidity.
*Investors should consult their financial advisers if in doubt about whether the product is suitable for them.
Rating Profile
###Maximum Investment Amount :
With effect from October 01, 2017, maximum Investment Amount per investor including existing investment amount (based on Permanent Account Number of first holder) at the time of investment:1) The Maximum Investment Amount across all folios shall not exceed Rs. 50 crore except to the extent detailed in point no. 2 below.2) The AMC/Mutual Fund may at its discretion accept an amount greater than Rs. 50 crore, subject to the below limits: a) The aggregate AUM of all the investors with more than Rs. 50 crore does not exceed 10% of the Scheme’s AUM, which is declared on the last day of preceding calendar quarter. b) Maximum investment amount per investor across all folios does not exceed 5% of the Scheme’s AUM, which is declared on the last day of preceding calendar quarter.For Schemes which have discontinued fresh subscriptions with effect from October 01,2012,the dividend declared will be compulsorily paid out under the “dividend payout “option.@@ Total Expense Ratio is as on the last business day of the month.##
Daily, Weekly and Fortnightly frequencies are available in Systematic Investment Plan (SIP), in addition to existing Monthly & Quarterly frequencies with effect from February 1, 2019. Minimum number of installments for daily, weekly, fortnightly and monthly frequencies will be 6 and for Quarterly frequency will be 4.* Minimum number of installments for daily, weekly and monthly frequency will be 6 and for Quarterly frequency will be 4. w.e.f February 01, 2017. Refer page No. 148 for definition of Flex STP and Value STP.&& Monthly, Quarterly, Half Yearly and Annual frequencies are available in Systematic Withdrawal Plan (SWP). The minimum number of instalments for all the frequencies will be 2.*** In case the unit holder has opted for dividend payout option, the minimum amount for dividend payout shall be 100 (net of dividend distribution tax and other statutory levy, if any), else the dividend would be mandatorily reinvested.
Modified Duration : 1.42 Years
• Top Ten Holdings&Please refer to annexure on “Pass Through Certificates Details” for complete details.
IDBI Bank Ltd. ICRA A 0.04%
Indian Railway Finance Corporation Ltd. CRISIL AAA 0.03%
Blue Dart Express Ltd. ICRA AA 0.02%
Aditya Birla Fashion and Retail Limited CRISIL AA 0.01%
Reliance Jio Infocomm Ltd. CRISIL AAA 0.01%& Pass Through Certificates 3.96%
MFL Securitisation Trust LXXX (Originator is Magma Fincorp Ltd.) CRISIL AAA(SO) 1.25%
IIERT June 2018 II (Originator - SREI
Equipment Finance Ltd.) CRISIL AAA(SO) 0.96%
IIERT Oct 2018 II (Originator - SREI
Equipment Finance Ltd.) CRISIL AAA(SO) 0.87%
MFL Securitisation Trust LXX (Originator is Magma Fincorp Ltd.) FITCH AAA(SO) 0.43%
MFL Securitisation Trust LXII (Originator is Magma Fincorp Ltd.) CRISIL AAA(SO) 0.17%
MFL Securitisation Trust LV (Originator
is Magma Fincorp Ltd.) ICRA AAA(SO) 0.14%
MFL Securitisation Trust XLIX
(Originator is Magma Fincorp Ltd.) CRISIL AAA(SO) 0.08%
MFL Securitisation Trust LIX (Originator
is Magma Fincorp Ltd.) FITCH AAA(SO) 0.06%
Units of Infrastructure Investment
Trusts (InvITs) 0.87%
India Infrastructure Trust 0.87%
TREPS & Net Current Assets 4.68%
Total Net Assets 100.00%
11.62%
46.62%
30.07%
3.28%
3.69%
4.72%
0% 10% 20% 30% 40% 50%
AAA and Equivalent
AA and Equivalent
A and Equivalent
BBB and Equivalent
Unrated
TREPS & Current Assets
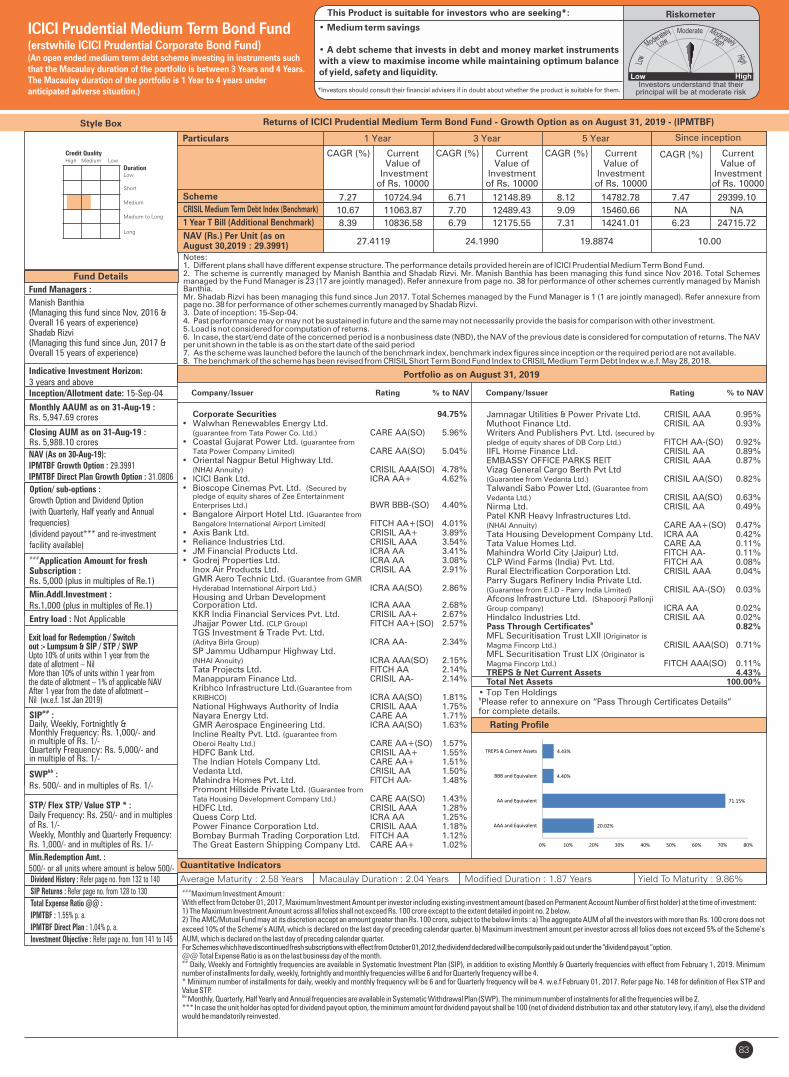
83
Fund Details
Rating Profile
Portfolio as on August 31, 2019
Quantitative Indicators
Company/Issuer Rating % to NAV
Fund Managers :
Indicative Investment Horizon:3 years and above Inception/Allotment date: 15-Sep-04
Monthly AAUM as on 31-Aug-19 : Rs. 5,947.69 crores
Closing AUM as on 31-Aug-19 : Rs. 5,988.10 crores
Option/ sub-options :Growth Option and Dividend Option (with Quarterly, Half yearly and Annual frequencies)(dividend payout*** and re-investment facility available)###Application Amount for freshSubscription :Rs. 5,000 (plus in multiples of Re.1)
##SIP :Daily, Weekly, Fortnightly & Monthly Frequency: Rs. 1,000/- and in multiple of Rs. 1/-Quarterly Frequency: Rs. 5,000/- and in multiple of Rs. 1/-
STP/ Flex STP/ Value STP * :Daily Frequency: Rs. 250/- and in multiples of Rs. 1/-Weekly, Monthly and Quarterly Frequency: Rs. 1,000/- and in multiples of Rs. 1/-
Min.Redemption Amt. :500/- or all units where amount is below 500/-
###Maximum Investment Amount :
With effect from October 01, 2017, Maximum Investment Amount per investor including existing investment amount (based on Permanent Account Number of first holder) at the time of investment:1) The Maximum Investment Amount across all folios shall not exceed Rs. 100 crore except to the extent detailed in point no. 2 below.2) The AMC/Mutual Fund may at its discretion accept an amount greater than Rs. 100 crore, subject to the below limits : a) The aggregate AUM of all the investors with more than Rs. 100 crore does not exceed 10% of the Scheme’s AUM, which is declared on the last day of preceding calendar quarter. b) Maximum investment amount per investor across all folios does not exceed 5% of the Scheme’s AUM, which is declared on the last day of preceding calendar quarter.For Schemes which have discontinued fresh subscriptions with effect from October 01,2012,the dividend declared will be compulsorily paid out under the “dividend payout “option.@@ Total Expense Ratio is as on the last business day of the month.##
Daily, Weekly and Fortnightly frequencies are available in Systematic Investment Plan (SIP), in addition to existing Monthly & Quarterly frequencies with effect from February 1, 2019. Minimum number of installments for daily, weekly, fortnightly and monthly frequencies will be 6 and for Quarterly frequency will be 4.* Minimum number of installments for daily, weekly and monthly frequency will be 6 and for Quarterly frequency will be 4. w.e.f February 01, 2017. Refer page No. 148 for definition of Flex STP and Value STP.&&
Monthly, Quarterly, Half Yearly and Annual frequencies are available in Systematic Withdrawal Plan (SWP). The minimum number of instalments for all the frequencies will be 2.*** In case the unit holder has opted for dividend payout option, the minimum amount for dividend payout shall be 100 (net of dividend distribution tax and other statutory levy, if any), else the dividend would be mandatorily reinvested.
Style Box Returns of ICICI Prudential Medium Term Bond Fund - Growth Option as on - (IPMTBF)August 31, 2019
NAV (As on 30-Aug-19):IPMTBF Growth Option : 29.3991IPMTBF Direct Plan Growth Option : 31.0806
Average Maturity : 2.58 Years Macaulay Duration : 2.04 Years Yield To Maturity : 9.86%
Min.Addl.Investment :Rs.1,000 (plus in multiples of Re.1)
ICICI Prudential Medium Term Bond Fund(erstwhile ICICI Prudential Corporate Bond Fund)(An open ended medium term debt scheme investing in instruments such that the Macaulay duration of the portfolio is between 3 Years and 4 Years.The Macaulay duration of the portfolio is 1 Year to 4 years under anticipated adverse situation.)
Entry load : Not Applicable
RiskometerThis Product is suitable for investors who are seeking*:
• Medium term savings
• A debt scheme that invests in debt and money market instruments with a view to maximise income while maintaining optimum balance of yield, safety and liquidity.
*Investors should consult their financial advisers if in doubt about whether the product is suitable for them.
Company/Issuer Rating % to NAV
Dividend History : Refer page no. from 132 to 140
SIP Returns : Refer page no. from 128 to 130
Total Expense Ratio @@ :
IPMTBF : 1.55% p. a.
IPMTBF Direct Plan : 1.04% p. a.
Investment Objective : Refer page no. from 141 to 145
&&SWP :Rs. 500/- and in multiples of Rs. 1/-
Scheme
1 Year T Bill (Additional Benchmark)
NAV (Rs.) Per Unit (as onAugust 30,2019 : 29.3991)
CAGR (%)
10.00
CRISIL Medium Term Debt Index (Benchmark)
Since inception
CurrentValue of
Investment of Rs. 10000
CAGR (%) Current Value of
Investment of Rs. 10000
1 Year 3 Year 5 Year
CAGR (%) Current Value of
Investment of Rs. 10000
CAGR (%) Current Value of
Investment of Rs. 10000
27.4119 24.1990 19.8874
Particulars
7.27 10724.94 6.71 12148.89 8.12 14782.78 7.47 29399.10
10.67 11063.87 7.70 12489.43 9.09 15460.66 NA NA
8.39 10836.58 6.79 12175.55 7.31 14241.01 6.23 24715.72
Manish Banthia(Managing this fund since Nov, 2016 & Overall 16 years of experience)Shadab Rizvi(Managing this fund since Jun, 2017 & Overall 15 years of experience)
Notes:1. Different plans shall have different expense structure. The performance details provided herein are of ICICI Prudential Medium Term Bond Fund.2. The scheme is currently managed by Manish Banthia and Shadab Rizvi. Mr. Manish Banthia has been managing this fund since . Total Schemes Nov 2016managed by the Fund Manager . Refer annexure from page no. 38 for performance of other schemes currently managed by Manish is 23 (17 are jointly managed) Banthia.Mr. Shadab Rizvi has been managing this fund since 7. Total Schemes managed by the Fund Manager . Refer annexure from Jun 201 is 1 (1 are jointly managed)page no. 38 for performance of other schemes currently managed by Shadab Rizvi. 3. Date of inception: 15-Sep-04.4. Past performance may or may not be sustained in future and the same may not necessarily provide the basis for comparison with other investment.5. Load is not considered for computation of returns.6. In case, the start/end date of the concerned period is a nonbusiness date (NBD), the NAV of the previous date is considered for computation of returns. The NAV per unit shown in the table is as on the start date of the said period7. As the scheme was launched before the launch of the benchmark index, benchmark index figures since inception or the required period are not available.8. The benchmark of the scheme has been revised from CRISIL Short Term Bond Fund Index to CRISIL Medium Term Debt Index w.e.f. May 28, 2018.
High Medium Low
Low
Short
Medium
Credit Quality
Duration
Medium to Long
Long
Corporate Securities 94.75%• Walwhan Renewables Energy Ltd. (guarantee from Tata Power Co. Ltd.) CARE AA(SO) 5.96%• Coastal Gujarat Power Ltd. (guarantee from
Tata Power Company Limited) CARE AA(SO) 5.04%• Oriental Nagpur Betul Highway Ltd. (NHAI Annuity) CRISIL AAA(SO) 4.78%• ICICI Bank Ltd. ICRA AA+ 4.62%• Bioscope Cinemas Pvt. Ltd. (Secured by pledge of equity shares of Zee Entertainment Enterprises Ltd.) BWR BBB-(SO) 4.40%• Bangalore Airport Hotel Ltd. (Guarantee from
Bangalore International Airport Limited) FITCH AA+(SO) 4.01%• Axis Bank Ltd. CRISIL AA+ 3.89%• Reliance Industries Ltd. CRISIL AAA 3.54%• JM Financial Products Ltd. ICRA AA 3.41%• Godrej Properties Ltd. ICRA AA 3.08% Inox Air Products Ltd. CRISIL AA 2.91% GMR Aero Technic Ltd. (Guarantee from GMR
Hyderabad International Airport Ltd.) ICRA AA(SO) 2.86% Housing and Urban Development Corporation Ltd. ICRA AAA 2.68% KKR India Financial Services Pvt. Ltd. CRISIL AA+ 2.67% Jhajjar Power Ltd. (CLP Group) FITCH AA+(SO) 2.57% TGS Investment & Trade Pvt. Ltd. (Aditya Birla Group) ICRA AA- 2.34% SP Jammu Udhampur Highway Ltd. (NHAI Annuity) ICRA AAA(SO) 2.15% Tata Projects Ltd. FITCH AA 2.14% Manappuram Finance Ltd. CRISIL AA- 2.14% Kribhco Infrastructure Ltd.(Guarantee from
KRIBHCO) ICRA AA(SO) 1.81% National Highways Authority of India CRISIL AAA 1.75% Nayara Energy Ltd. CARE AA 1.71% GMR Aerospace Engineering Ltd. ICRA AA(SO) 1.63% Incline Realty Pvt. Ltd. (guarantee from
Oberoi Realty Ltd.) CARE AA+(SO) 1.57% HDFC Bank Ltd. CRISIL AA+ 1.55% The Indian Hotels Company Ltd. CARE AA+ 1.51% Vedanta Ltd. CRISIL AA 1.50% Mahindra Homes Pvt. Ltd. FITCH AA- 1.48% Promont Hillside Private Ltd. (Guarantee from
Tata Housing Development Company Ltd.) CARE AA(SO) 1.43% HDFC Ltd. CRISIL AAA 1.28% Quess Corp Ltd. ICRA AA 1.25% Power Finance Corporation Ltd. CRISIL AAA 1.18% Bombay Burmah Trading Corporation Ltd. FITCH AA 1.12% The Great Eastern Shipping Company Ltd. CARE AA+ 1.02%
Jamnagar Utilities & Power Private Ltd. CRISIL AAA 0.95% Muthoot Finance Ltd. CRISIL AA 0.93% Writers And Publishers Pvt. Ltd. (secured by
pledge of equity shares of DB Corp Ltd.) FITCH AA-(SO) 0.92% IIFL Home Finance Ltd. CRISIL AA 0.89% EMBASSY OFFICE PARKS REIT CRISIL AAA 0.87% Vizag General Cargo Berth Pvt Ltd (Guarantee from Vedanta Ltd.) CRISIL AA(SO) 0.82% Talwandi Sabo Power Ltd. (Guarantee from
Vedanta Ltd.) CRISIL AA(SO) 0.63% Nirma Ltd. CRISIL AA 0.49% Patel KNR Heavy Infrastructures Ltd. (NHAI Annuity) CARE AA+(SO) 0.47% Tata Housing Development Company Ltd. ICRA AA 0.42% Tata Value Homes Ltd. CARE AA 0.11% Mahindra World City (Jaipur) Ltd. FITCH AA- 0.11% CLP Wind Farms (India) Pvt. Ltd. FITCH AA 0.08% Rural Electrification Corporation Ltd. CRISIL AAA 0.04% Parry Sugars Refinery India Private Ltd. (Guarantee from E.I.D - Parry India Limited) CRISIL AA-(SO) 0.03% Afcons Infrastructure Ltd. (Shapoorji Pallonji
Group company) ICRA AA 0.02% Hindalco Industries Ltd. CRISIL AA 0.02%
& Pass Through Certificates 0.82% MFL Securitisation Trust LXII (Originator is
Magma Fincorp Ltd.) CRISIL AAA(SO) 0.71% MFL Securitisation Trust LIX (Originator is
Magma Fincorp Ltd.) FITCH AAA(SO) 0.11% TREPS & Net Current Assets 4.43% Total Net Assets 100.00%
Modified Duration : 1.87 Years
Exit load for Redemption / Switchout :- Lumpsum & SIP / STP / SWP Upto 10% of units within 1 year from the date of allotment – Nil More than 10% of units within 1 year from the date of allotment – 1% of applicable NAV After 1 year from the date of allotment – Nil (w.e.f. 1st Jan 2019)
• Top Ten Holdings&Please refer to annexure on “Pass Through Certificates Details”
for complete details.
20.02%
71.15%
4.40%
4.43%
0% 10% 20% 30% 40% 50% 60% 70% 80%
AAA and Equivalent
AA and Equivalent
BBB and Equivalent
TREPS & Current Assets

84
Style Box
Portfolio as on August 31, 2019
Fund Details
Quantitative Indicators
Company/Issuer % to NAVRating
• Top Ten Holdings@Short Term < 8 Years, Long Term > 8 Years.
For Schemes which have discontinued fresh subscriptions with effect from October 01,2012,the dividend declared will be compulsorily paid out under the “dividend payout “option.@@ Total Expense Ratio is as on the last business day of the month.## Daily, Weekly and Fortnightly frequencies are available in Systematic Investment Plan (SIP), in addition to existing Monthly & Quarterly frequencies with effect from February 1, 2019. Minimum number of installments for daily, weekly, fortnightly and monthly frequencies will be 6 and for Quarterly frequency will be 4.* Minimum number of installments for daily, weekly and monthly frequency will be 6 and for Quarterly frequency will be 4. w.e.f February 01, 2017. Refer page No. 148 for definition of Flex STP and Value STP.&& Monthly, Quarterly, Half Yearly and Annual frequencies are available in Systematic Withdrawal Plan (SWP). The minimum number of instalments for all the frequencies will be 2.*** In case the unit holder has opted for dividend payout option, the minimum amount for dividend payout shall be 100 (net of dividend distribution tax and other statutory levy, if any), else the dividend would be mandatorily reinvested.With effect from May 28, 2018, the benchmark of ICICI Prudential Long Term Bond Fund has been changed from Crisil Composite Bond Fund Index to Nifty Long Duration Debt Index
Fund Managers :
Manish Banthia(Managing this fund since Sep, 2013 & Overall16 years of experience)Indicative Investment Horizon:3 years and above
Inception/Allotment date: 09-Jul-98
Monthly AAUM as on 31-Aug-19 : Rs. 790.24 crores
Closing AUM as on 31-Aug-19 : Rs. 798.80 crores
NAV (As on 30-Aug-19):IPLTBF Growth Option : 63.8438IPLTBF Direct Plan Growth Option : 67.6847
Option/ sub-options : Growth Options andDividend Option (with Quarterly, HalfYearly and Annual frequencies)(dividend payout*** and re-investmentfacility available)
Application Amount for freshSubscription :Rs.5,000 (plus in multiples of Re.1)
Min.Addl.Investment :Rs.1,000 (plus in multiples of Re.1)
Exit load for Redemption / Switchout :- Lumpsum & SIP / STP / SWP OptionNil
##SIP :Daily, Weekly, Fortnightly & Monthly Frequency: Rs. 1,000/- and in multiple of Rs. 1/-Quarterly Frequency: Rs. 5,000/- and in multiple of Rs. 1/-
&&SWP :Rs. 500/- and in multiples of Rs. 1/-
STP/ Flex STP/ Value STP * :Daily Frequency: Rs. 250/- and in multiples of Rs. 1/-Weekly, Monthly and Quarterly Frequency: Rs. 1,000/- and in multiples of Rs. 1/-
Min.Redemption Amt. :500/- or all units where amount is below 500/-
Government Securities 52.03%@ Short Term 0.23%
07.67% Tamil Nadu SDL 2023 SOV 0.23%@ Long Term 51.79%
• 07.57% GOI 2033 SOV 25.21%
• 07.26% GOI 2029 SOV 11.81%
• 07.61% GOI 2030 SOV 7.27%
• 07.40% GOI 2035 SOV 7.19%
06.79% GOI 2029 SOV 0.31%
Corporate Securities 42.93%
• NABARD CRISIL AAA 9.53%
• Housing and Urban Development
Corporation Ltd. ICRA AAA 8.69%
• The Great Eastern Shipping Company
Ltd. CARE AA+ 7.04%
• National Highways Authority of India CRISIL AAA 6.55%
• Rural Electrification Corporation Ltd. CRISIL AAA 6.24%
• Jamnagar Utilities & Power Private Ltd. CRISIL AAA 4.51%
Indian Railway Finance Corporation Ltd. CRISIL AAA 0.37%
TREPS & Net Current Assets 5.04%
Total Net Assets 100.00%
Returns of ICICI Prudential Long Term Bond Fund - Growth Option as on - (IPLTBF)August 31, 2019
Average Maturity : 10.78 Years Macaulay Duration : 7.17 Years Yield To Maturity : 7.38%
ICICI Prudential Long Term Bond Fund(erstwhile ICICI Prudential Income Plan)(An open ended debt scheme investing in instruments such that the Macaulay duration of the portfolio is greater than 7 Years)
Entry load : Not Applicable
RiskometerThis Product is suitable for investors who are seeking*:
• Long term wealth creation
• A debt scheme that invests in debt and money market instruments with an aim to maximise income while maintaining an optimum balance of yield, safety and liquidity.
*Investors should consult their financial advisers if in doubt about whether the product is suitable for them.
Dividend History : Refer page no. from 132 to 140
SIP Returns : Refer page no. from 128 to 130
Total Expense Ratio @@ :
IPLTBF : 1.80% p. a.
IPLTBF Direct Plan : 1.27% p. a.
Investment Objective : Refer page no. from 141 to 145
Notes:1. Different plans shall have different expense structure. The performance details provided herein are of ICICI Prudential Long Term Bond Fund.2. The scheme is currently managed by Manish Banthia. Mr. Manish Banthia has been managing this fund since . Total Schemes managed by the Fund Sep 2013Manager . Refer annexure from page no. 109 for performance of other schemes currently managed by Manish Banthia. is 23 (17 are jointly managed) 3. Date of inception: 09-Jul-98.4. Past performance may or may not be sustained in future and the same may not necessarily provide the basis for comparison with other investment.5. Load is not considered for computation of returns.6. In case, the start/end date of the concerned period is a nonbusiness date (NBD), the NAV of the previous date is considered for computation of returns. The NAV per unit shown in the table is as on the start date of the said period7. As the scheme was launched before the launch of the benchmark index, benchmark index figures since inception or the required period are not available.
Scheme
NAV (Rs.) Per Unit (as on August 30,2019 : 63.8438)
CAGR (%)
10.00
Nifty Long Duration Debt Index (Benchmark)
Since inception
CurrentValue of
Investment of Rs. 10000
CAGR (%) Current Value of
Investment of Rs. 10000
1 Year 3 Year 5 Year
CAGR (%) Current Value of
Investment of Rs. 10000
CAGR (%) Current Value of
Investment of Rs. 10000
54.4948 49.9134 39.3719
Particulars
17.21 11715.58 8.56 12790.91 10.13 16215.58 9.16 63843.80
16.25 11620.03 7.38 12379.31 9.79 15965.48 NA NA
16.40 11635.14 6.95 12230.35 8.97 15379.44 NA NA
Rating Profile
High Medium Low
Low
Short
Medium
Credit Quality
Duration
Medium to Long
Long
Modified Duration : 6.84 Years
CRISIL 10 year Gilt index (Additional Benchmark)
35.88%
7.04%
52.03%
5.05%
0% 10% 20% 30% 40% 50% 60%
AAA and Equivalent
AA and Equivalent
Sovereign Securities
TREPS & Current Assets
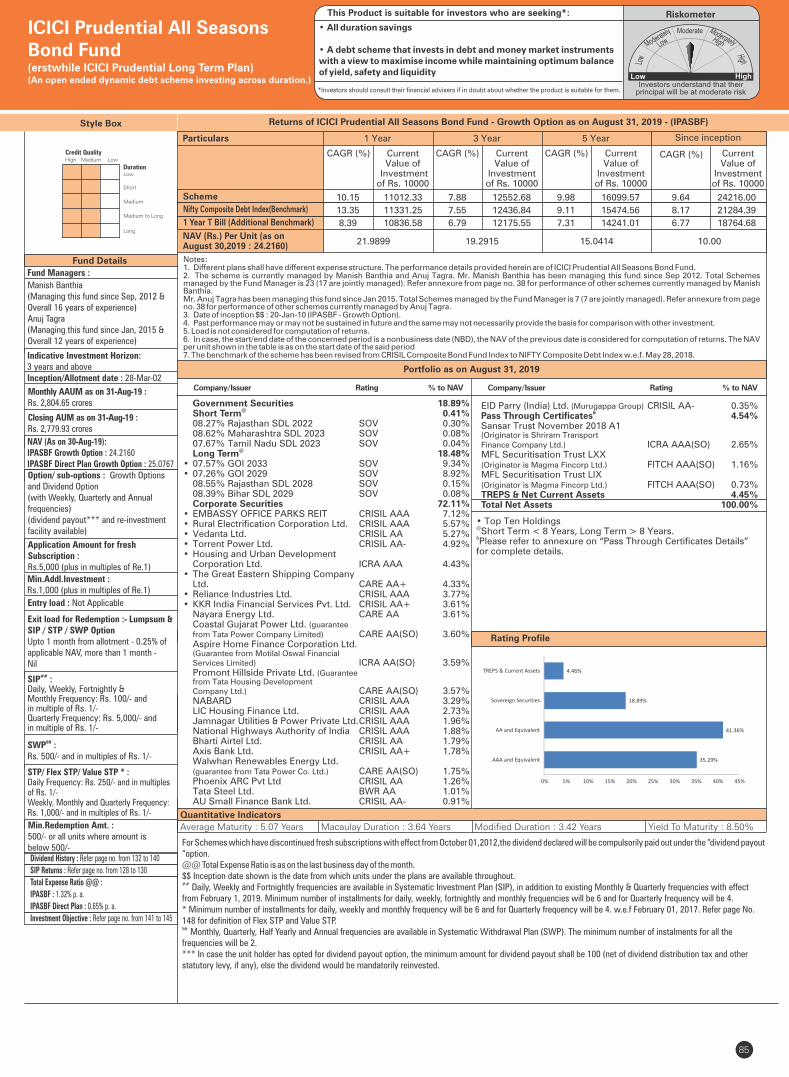
Rating Profile
Quantitative Indicators
Fund Details
Portfolio as on August 31, 2019
Style Box
Company/Issuer Rating % to NAV
Fund Managers :
Manish Banthia (Managing this fund since Sep, 2012 & Overall 16 years of experience)Anuj Tagra(Managing this fund since Jan, 2015 & Overall 12 years of experience)
Indicative Investment Horizon:3 years and above Inception/Allotment date : 28-Mar-02
Monthly AAUM as on 31-Aug-19 : Rs. 2,804.65 crores
Closing AUM as on 31-Aug-19 : Rs. 2,779.93 crores
NAV (As on 30-Aug-19):IPASBF Growth Option : 24.2160IPASBF Direct Plan Growth Option : 25.0767Option/ sub-options : Growth Options and Dividend Option (with Weekly, Quarterly and Annual frequencies)(dividend payout*** and re-investment facility available)
Application Amount for freshSubscription :Rs.5,000 (plus in multiples of Re.1)
Min.Addl.Investment :Rs.1,000 (plus in multiples of Re.1)
Exit load for Redemption :- Lumpsum &SIP / STP / SWP OptionUpto 1 month from allotment - 0.25% ofapplicable NAV, more than 1 month -Nil
##SIP :Daily, Weekly, Fortnightly & Monthly Frequency: Rs. 100/- and in multiple of Rs. 1/-Quarterly Frequency: Rs. 5,000/- and in multiple of Rs. 1/-
&&SWP :Rs. 500/- and in multiples of Rs. 1/-
STP/ Flex STP/ Value STP * :Daily Frequency: Rs. 250/- and in multiples of Rs. 1/-Weekly, Monthly and Quarterly Frequency: Rs. 1,000/- and in multiples of Rs. 1/-
Min.Redemption Amt. :500/- or all units where amount is below 500/-
85
For Schemes which have discontinued fresh subscriptions with effect from October 01,2012,the dividend declared will be compulsorily paid out under the “dividend payout “option.@@ Total Expense Ratio is as on the last business day of the month.$$ Inception date shown is the date from which units under the plans are available throughout.## Daily, Weekly and Fortnightly frequencies are available in Systematic Investment Plan (SIP), in addition to existing Monthly & Quarterly frequencies with effect from February 1, 2019. Minimum number of installments for daily, weekly, fortnightly and monthly frequencies will be 6 and for Quarterly frequency will be 4.* Minimum number of installments for daily, weekly and monthly frequency will be 6 and for Quarterly frequency will be 4. w.e.f February 01, 2017. Refer page No. 148 for definition of Flex STP and Value STP.&& Monthly, Quarterly, Half Yearly and Annual frequencies are available in Systematic Withdrawal Plan (SWP). The minimum number of instalments for all the frequencies will be 2.*** In case the unit holder has opted for dividend payout option, the minimum amount for dividend payout shall be 100 (net of dividend distribution tax and other statutory levy, if any), else the dividend would be mandatorily reinvested.
Returns of ICICI Prudential All Seasons Bond Fund - Growth Option as on - (IPASBF)August 31, 2019
Average Maturity : 5.07 Years Macaulay Duration : 3.64 Years Yield To Maturity : 8.50%
• Top Ten Holdings@Short Term < 8 Years, Long Term > 8 Years.&Please refer to annexure on “Pass Through Certificates Details” for complete details.
ICICI Prudential All Seasons Bond Fund(erstwhile ICICI Prudential Long Term Plan)(An open ended dynamic debt scheme investing across duration.)
Entry load : Not Applicable
RiskometerThis Product is suitable for investors who are seeking*:
• All duration savings
• A debt scheme that invests in debt and money market instruments with a view to maximise income while maintaining optimum balance of yield, safety and liquidity
*Investors should consult their financial advisers if in doubt about whether the product is suitable for them.
Dividend History : Refer page no. from 132 to 140
SIP Returns : Refer page no. from 128 to 130
Total Expense Ratio @@ :
IPASBF : 1.32% p. a.
IPASBF Direct Plan : 0.65% p. a.
Investment Objective : Refer page no. from 141 to 145
Notes:1. Different plans shall have different expense structure. The performance details provided herein are of ICICI Prudential All Seasons Bond Fund.2. The scheme is currently managed by Manish Banthia and . Mr. Manish Banthia has been managing this fund since 2. Total Schemes Anuj Tagra Sep 201managed by the Fund Manager . Refer annexure from page no. 38 for performance of other schemes currently managed by Manish is 23 (17 are jointly managed) Banthia.Mr. has been managing this fund since 5. Total Schemes managed by the Fund Manager . Refer annexure from page Anuj Tagra Jan 201 is 7 (7 are jointly managed)no. 38 for performance of other schemes currently managed by . Anuj Tagra3. Date of inception $$ : 20-Jan-10 (IPASBF - Growth Option).4. Past performance may or may not be sustained in future and the same may not necessarily provide the basis for comparison with other investment.5. Load is not considered for computation of returns.6. In case, the start/end date of the concerned period is a nonbusiness date (NBD), the NAV of the previous date is considered for computation of returns. The NAV per unit shown in the table is as on the start date of the said period7. The benchmark of the scheme has been revised from CRISIL Composite Bond Fund Index to NIFTY Composite Debt Index w.e.f. May 28, 2018.
Scheme
1 Year T Bill (Additional Benchmark)
NAV (Rs.) Per Unit (as on August 30,2019 : 24.2160)
CAGR (%)
10.00
Nifty Composite Debt Index(Benchmark)
Since inception
CurrentValue of
Investment of Rs. 10000
CAGR (%) Current Value of
Investment of Rs. 10000
1 Year 3 Year 5 Year
CAGR (%) Current Value of
Investment of Rs. 10000
CAGR (%) Current Value of
Investment of Rs. 10000
21.9899 19.2915 15.0414
Particulars
10.15 11012.33 7.88 12552.68 9.98 16099.57 9.64 24216.00
13.35 11331.25 7.55 12436.84 9.11 15474.56 8.17 21284.39
8.39 10836.58 6.79 12175.55 7.31 14241.01 6.77 18764.68
High Medium Low
Low
Short
Medium
Credit Quality
Duration
Medium to Long
Long
Modified Duration : 3.42 Years
Company/Issuer Rating % to NAV
Government Securities 18.89%@ Short Term 0.41%
08.27% Rajasthan SDL 2022 SOV 0.30% 08.62% Maharashtra SDL 2023 SOV 0.08% 07.67% Tamil Nadu SDL 2023 SOV 0.04%
@ Long Term 18.48%• 07.57% GOI 2033 SOV 9.34%• 07.26% GOI 2029 SOV 8.92% 08.55% Rajasthan SDL 2028 SOV 0.15% 08.39% Bihar SDL 2029 SOV 0.08% Corporate Securities 72.11%• EMBASSY OFFICE PARKS REIT CRISIL AAA 7.12%• Rural Electrification Corporation Ltd. CRISIL AAA 5.57%• Vedanta Ltd. CRISIL AA 5.27%• Torrent Power Ltd. CRISIL AA- 4.92%• Housing and Urban Development Corporation Ltd. ICRA AAA 4.43%• The Great Eastern Shipping Company Ltd. CARE AA+ 4.33%• Reliance Industries Ltd. CRISIL AAA 3.77%• KKR India Financial Services Pvt. Ltd. CRISIL AA+ 3.61% Nayara Energy Ltd. CARE AA 3.61% Coastal Gujarat Power Ltd. (guarantee from Tata Power Company Limited) CARE AA(SO) 3.60% Aspire Home Finance Corporation Ltd. (Guarantee from Motilal Oswal Financial Services Limited) ICRA AA(SO) 3.59% Promont Hillside Private Ltd. (Guarantee from Tata Housing Development Company Ltd.) CARE AA(SO) 3.57% NABARD CRISIL AAA 3.29% LIC Housing Finance Ltd. CRISIL AAA 2.73% Jamnagar Utilities & Power Private Ltd. CRISIL AAA 1.96% National Highways Authority of India CRISIL AAA 1.88% Bharti Airtel Ltd. CRISIL AA 1.79% Axis Bank Ltd. CRISIL AA+ 1.78% Walwhan Renewables Energy Ltd. (guarantee from Tata Power Co. Ltd.) CARE AA(SO) 1.75% Phoenix ARC Pvt Ltd CRISIL AA 1.26% Tata Steel Ltd. BWR AA 1.01% AU Small Finance Bank Ltd. CRISIL AA- 0.91%
EID Parry (India) Ltd. (Murugappa Group) CRISIL AA- 0.35%& Pass Through Certificates 4.54%
Sansar Trust November 2018 A1 (Originator is Shriram Transport Finance Company Ltd.) ICRA AAA(SO) 2.65% MFL Securitisation Trust LXX (Originator is Magma Fincorp Ltd.) FITCH AAA(SO) 1.16% MFL Securitisation Trust LIX (Originator is Magma Fincorp Ltd.) FITCH AAA(SO) 0.73% TREPS & Net Current Assets 4.45% Total Net Assets 100.00%
35.29%
41.36%
18.89%
4.46%
0% 5% 10% 15% 20% 25% 30% 35% 40% 45%
AAA and Equivalent
AA and Equivalent
Sovereign Securities
TREPS & Current Assets

86
Style Box
Fund Details
Rating Profile
Quantitative Indicators
Portfolio as on August 31, 2019
Company/Issuer % to NAVRating
For Schemes which have discontinued fresh subscriptions with effect from October 01,2012,the dividend declared will be compulsorily paid out under the “dividend payout “option.@@ Total Expense Ratio is as on the last business day of the month.## Daily, Weekly and Fortnightly frequencies are available in Systematic Investment Plan (SIP), in addition to existing Monthly & Quarterly frequencies with effect from February 1, 2019. Minimum number of installments for daily, weekly, fortnightly and monthly frequencies will be 6 and for Quarterly frequency will be 4.* Minimum number of installments for daily, weekly and monthly frequency will be 6 and for Quarterly frequency will be 4. w.e.f February 01, 2017. Refer page No. 148 for definition of Flex STP and Value STP.&& Monthly, Quarterly, Half Yearly and Annual frequencies are available in Systematic Withdrawal Plan (SWP). The minimum number of instalments for all the frequencies will be 2.*** In case the unit holder has opted for dividend payout option, the minimum amount for dividend payout shall be 100 (net of dividend distribution tax and other statutory levy, if any), else the dividend would be mandatorily reinvested.ICICI Prudential Gilt Fund – Investment Plan – PF Option, ICICI Prudential Gilt Fund – Treasury Plan – PF Option and ICICI Prudential Short Term Gilt Fund have been merged into ICICI Prudential Gilt Fund after the close of business hours on May 25, 2018. The performance disclosed above is the weighted average performance all these schemes. Performance of the merging schemes shall be made available to investors on request.
Fund Managers :
Rahul Goswami (Managing this fund since Sep, 2012 & Overall 24 years of experience)Anuj Tagra (Managing this fund since Oct, 2013 & Overall 12 years of experience)
Indicative Investment Horizon:1 year and above
Inception/Allotment date: 19-Aug-99
Monthly AAUM as on 31-Aug-19 : Rs. 1,081.71 crores
Closing AUM as on 31-Aug-19 : Rs. 1,137.89 crores
NAV (As on 30-Aug-19):IPGF Growth Option : 67.7622IPGF Direct Plan Growth Option : 70.7406
Option/ sub-options :Growth Options, Growth AEP (withRegular and Appreciation) and Dividend Option(dividend payout*** and re-investment facility available)
Application Amount for freshSubscription :Rs.5,000 (plus in multiples of Re.1)
Min.Addl.Investment :Rs.5,000 & in multiples thereof
Exit load for Redemption / Switchout :- Lumpsum & SIP / STP / SWP OptionNil
SIP :##
Daily, Weekly, Fortnightly & Monthly Frequency: Rs. 1,000/- and in multiple of Rs. 1/-Quarterly Frequency: Rs. 5,000/- and in multiple of Rs. 1/-
&&SWP :Rs. 500/- and in multiples of Rs. 1/-
STP/ Flex STP/ Value STP * :Daily Frequency: Rs. 250/- and in multiples of Rs. 1/-Weekly, Monthly and Quarterly Frequency: Rs. 1,000/- and in multiples of Rs. 1/-
Min.Redemption Amt. :500/- or all units where amount is below 500/-
Government Securities 94.60%@ Short Term 19.10%
• 08.15% GOI 2026 SOV 9.49%
• 07.72% GOI 2025 SOV 4.64%
• 08.24% Karnataka SDL 2024 SOV 1.40%
• 06.79% GOI 2027 SOV 1.33%
• 08.33% GOI 2026 SOV 0.96%
• 06.99% Andhra Pradesh SDL 2020 SOV 0.53%
7.89% Maharashtra SDL 2024 SOV 0.46%
08.03% GOI 2024 SOV 0.23%
08.15% GOI 2022 SOV 0.07%@ Long Term 75.50%
• 07.57% GOI 2033 SOV 59.98%
• 06.79% GOI 2029 SOV 6.95%
• 07.61% GOI 2030 SOV 4.36%
• 07.59% GOI 2029 SOV 3.29%
8.15% Maharashtra SDL 2030 SOV 0.47%
08.43% Uttar Pradesh SDL 2029 SOV 0.45%
TREPS & Net Current Assets 5.40%
Total Net Assets 100.00%
Returns of ICICI Prudential Gilt Fund - Growth Option as on - (IPGF)August 31, 2019
Average Maturity : 10.10 Years Macaulay Duration : 6.39 Years Yield To Maturity : 6.73%
@Short Term < 8 Years, Long Term >8 Years
ICICI Prudential Gilt Fund(erstwhile ICICI Prudential Long Term Gilt Fund)(An open ended debt scheme investing in government securities across maturity.)
Entry load : Not Applicable
RiskometerThis Product is suitable for investors who are seeking*:
• Long term wealth creation
• A Gilt scheme that aims to generate income through investmentin Gilts of various maturities.
*Investors should consult their financial advisers if in doubt about whether the product is suitable for them.
Dividend History : Refer page no. from 132 to 140
SIP Returns : Refer page no. from 128 to 130
Total Expense Ratio @@ :
IPGF : 1.05% p. a.
IPGF Direct Plan : 0.57% p. a.
Investment Objective : Refer page no. from 141 to 145
Notes:1. Different plans shall have different expense structure. The performance details provided herein are of ICICI Prudential Gilt Fund.2. The scheme is currently managed and . Mr. has been managing this fund since . Total Schemes managed Rahul Goswami Anuj Tagra Rahul Goswami Sep 2012by the Fund Manager . Refer annexure from page no. 109 for performance of other schemes currently managed by .is 9 (8 are jointly managed) Rahul GoswamiMr. Anuj Tagra has been managing this fund since . Total Schemes managed by the Fund Manager . Refer annexure from page Oct 2013 is 7 (7 are jointly managed)no. 109 for performance of other schemes currently managed by Anuj Tagra.3. Date of inception:19-Aug-99.4. Past performance may or may not be sustained in future and the same may not necessarily provide the basis for comparison with other investment.5. Load is not considered for computation of returns.6. In case, the start/end date of the concerned period is a nonbusiness date (NBD), the NAV of the previous date is considered for computation of returns. The NAV per unit shown in the table is as on the start date of the said period7. The benchmark of the scheme has been revised from I-SEC I-BEX to CRISIL Gilt Index w.e.f. May 28, 2018. The existing CRISIL Gilt Index has been renamed as CRISIL Dynamic Gilt Index as per communication received from CRISIL.
Scheme
CRISIL 10 year Gilt index (Additional Benchmark)
NAV (Rs.) Per Unit (as on August 30,2019 : 67.7622)
CAGR (%)
10.00
CRISIL Dynamic Gilt Index (Benchmark)
Since inception
CurrentValue of
Investment of Rs. 10000
CAGR (%) Current Value of
Investment of Rs. 10000
1 Year 3 Year 5 Year
CAGR (%) Current Value of
Investment of Rs. 10000
CAGR (%) Current Value of
Investment of Rs. 10000
60.4628 54.7536 41.9380
Particulars
12.11 11207.25 7.61 12458.58 10.03 16137.04 9.80 65167.61
15.05 11500.31 7.49 12415.61 9.50 15751.29 9.22 58549.26
16.40 11635.14 6.95 12230.35 8.97 15379.44 NA NA
High Medium Low
Low
Short
Medium
Credit Quality
Duration
Medium to Long
Long
Modified Duration : 6.14 Years
94.60%
5.40%
0% 10% 20% 30% 40% 50% 60% 70% 80% 90% 100%
Sovereign Securities
TREPS & Current Assets
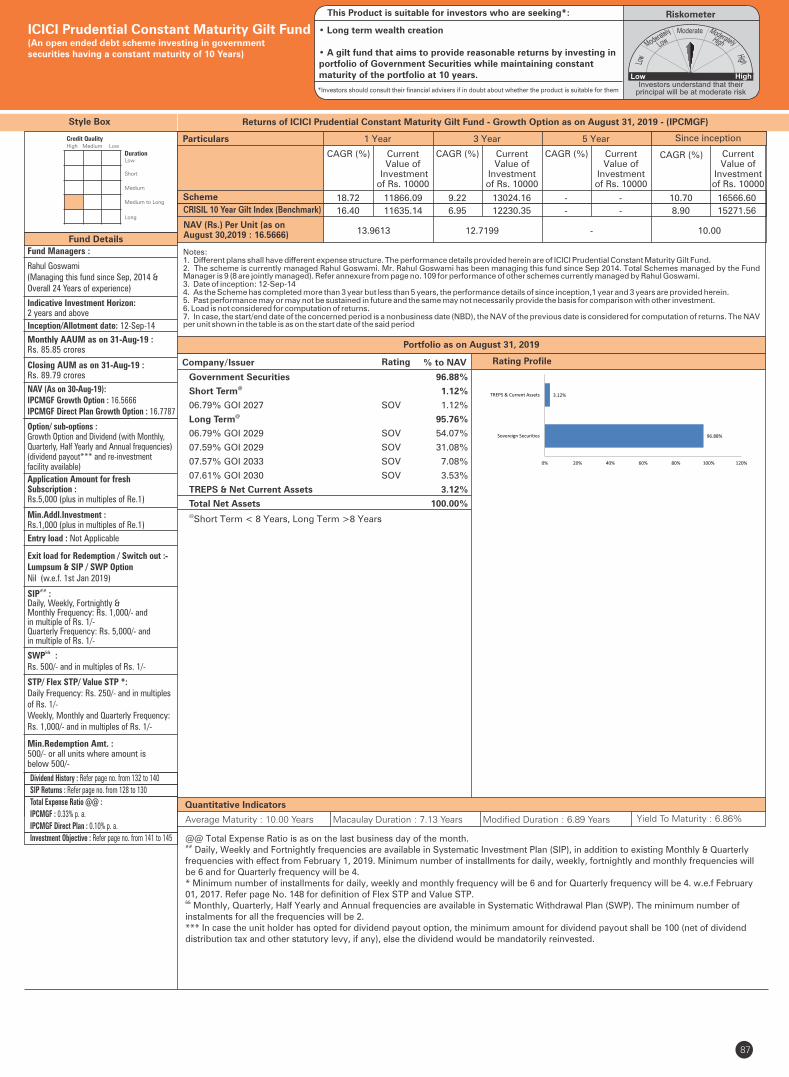
Style Box
Fund Managers :
Rahul Goswami(Managing this fund since Sep, 2014 &Overall 24 Years of experience)
Indicative Investment Horizon: 2 years and above
Inception/Allotment date: 12-Sep-14
&&SWP :Rs. 500/- and in multiples of Rs. 1/-
SIP :##
Daily, Weekly, Fortnightly & Monthly Frequency: Rs. 1,000/- and in multiple of Rs. 1/-Quarterly Frequency: Rs. 5,000/- and in multiple of Rs. 1/-
NAV (As on 30-Aug-19):IPCMGF Growth Option : 16.5666IPCMGF Direct Plan Growth Option : 16.7787
Option/ sub-options :Growth Option and Dividend (with Monthly, Quarterly, Half Yearly and Annual frequencies)(dividend payout*** and re-investment facility available)
Application Amount for freshSubscription :Rs.5,000 (plus in multiples of Re.1)
Min.Addl.Investment :Rs.1,000 (plus in multiples of Re.1)
Exit load for Redemption / Switch out :- Lumpsum & SIP / SWP OptionNil (w.e.f. 1st Jan 2019)
87
Fund Details
Returns of ICICI Prudential Constant Maturity Gilt Fund - Growth Option as on - (IPCMGF)August 31, 2019
Quantitative Indicators
Average Maturity : 10.00 Years Macaulay Duration : 7.13 Years Yield To Maturity : 6.86%
Monthly AAUM as on 31-Aug-19 : Rs. 85.85 crores
Closing AUM as on 31-Aug-19 : Rs. 89.79 crores
ICICI Prudential Constant Maturity Gilt Fund(An open ended debt scheme investing in governmentsecurities having a constant maturity of 10 Years)
Company/Issuer % to NAVRating Rating Profile
Government Securities 96.88%@Short Term 1.12%
06.79% GOI 2027 SOV 1.12%@ Long Term 95.76%
06.79% GOI 2029 SOV 54.07%
07.59% GOI 2029 SOV 31.08%
07.57% GOI 2033 SOV 7.08%
07.61% GOI 2030 SOV 3.53%
TREPS & Net Current Assets 3.12%
Total Net Assets 100.00%@Short Term < 8 Years, Long Term >8 Years
Portfolio as on August 31, 2019
Entry load : Not Applicable
RiskometerThis Product is suitable for investors who are seeking*:
• Long term wealth creation
• A gilt fund that aims to provide reasonable returns by investing in portfolio of Government Securities while maintaining constant maturity of the portfolio at 10 years.
*Investors should consult their financial advisers if in doubt about whether the product is suitable for them
Min.Redemption Amt. :500/- or all units where amount isbelow 500/-
Dividend History : Refer page no. from 132 to 140
SIP Returns : Refer page no. from 128 to 130
Total Expense Ratio @@ :
IPCMGF : 0.33% p. a.
IPCMGF Direct Plan : 0.10% p. a.
Investment Objective : Refer page no. from 141 to 145 @@ Total Expense Ratio is as on the last business day of the month.## Daily, Weekly and Fortnightly frequencies are available in Systematic Investment Plan (SIP), in addition to existing Monthly & Quarterly frequencies with effect from February 1, 2019. Minimum number of installments for daily, weekly, fortnightly and monthly frequencies will be 6 and for Quarterly frequency will be 4.* Minimum number of installments for daily, weekly and monthly frequency will be 6 and for Quarterly frequency will be 4. w.e.f February 01, 2017. Refer page No. 148 for definition of Flex STP and Value STP.&& Monthly, Quarterly, Half Yearly and Annual frequencies are available in Systematic Withdrawal Plan (SWP). The minimum number of instalments for all the frequencies will be 2.*** In case the unit holder has opted for dividend payout option, the minimum amount for dividend payout shall be 100 (net of dividend distribution tax and other statutory levy, if any), else the dividend would be mandatorily reinvested.
STP/ Flex STP/ Value STP *:Daily Frequency: Rs. 250/- and in multiples of Rs. 1/-Weekly, Monthly and Quarterly Frequency: Rs. 1,000/- and in multiples of Rs. 1/-
Notes:1. Different plans shall have different expense structure. The performance details provided herein are of ICICI Prudential Constant Maturity Gilt Fund.2. The scheme is currently managed . Mr. has been managing this fund since 4. Total Schemes managed by the Fund Rahul Goswami Rahul Goswami Sep 201Manager . Refer annexure from page no. 109 for performance of other schemes currently managed by .is 9 (8 are jointly managed) Rahul Goswami3. Date of inception: 12-Sep-144. As the Scheme has completed more than 3 year but less than 5 years, the performance details of since inception,1 year and 3 years are provided herein.5. Past performance may or may not be sustained in future and the same may not necessarily provide the basis for comparison with other investment.6. Load is not considered for computation of returns.7. In case, the start/end date of the concerned period is a nonbusiness date (NBD), the NAV of the previous date is considered for computation of returns. The NAV per unit shown in the table is as on the start date of the said period
Scheme
NAV (Rs.) Per Unit (as on August 30,2019 : 16.5666)
CAGR (%)
10.00
CRISIL 10 Year Gilt Index (Benchmark)
Since inception
CurrentValue of
Investment of Rs. 10000
CAGR (%) Current Value of
Investment of Rs. 10000
1 Year 3 Year 5 Year
CAGR (%) Current Value of
Investment of Rs. 10000
CAGR (%) Current Value of
Investment of Rs. 10000
13.9613 12.7199 -
Particulars
18.72 11866.09 9.22 13024.16 - - 10.70 16566.60
16.40 11635.14 6.95 12230.35 - - 8.90 15271.56
High Medium Low
Low
Short
Medium
Credit Quality
Duration
Medium to Long
Long
Modified Duration : 6.89 Years
96.88%
3.12%
0% 20% 40% 60% 80% 100% 120%
Sovereign Securities
TREPS & Current Assets
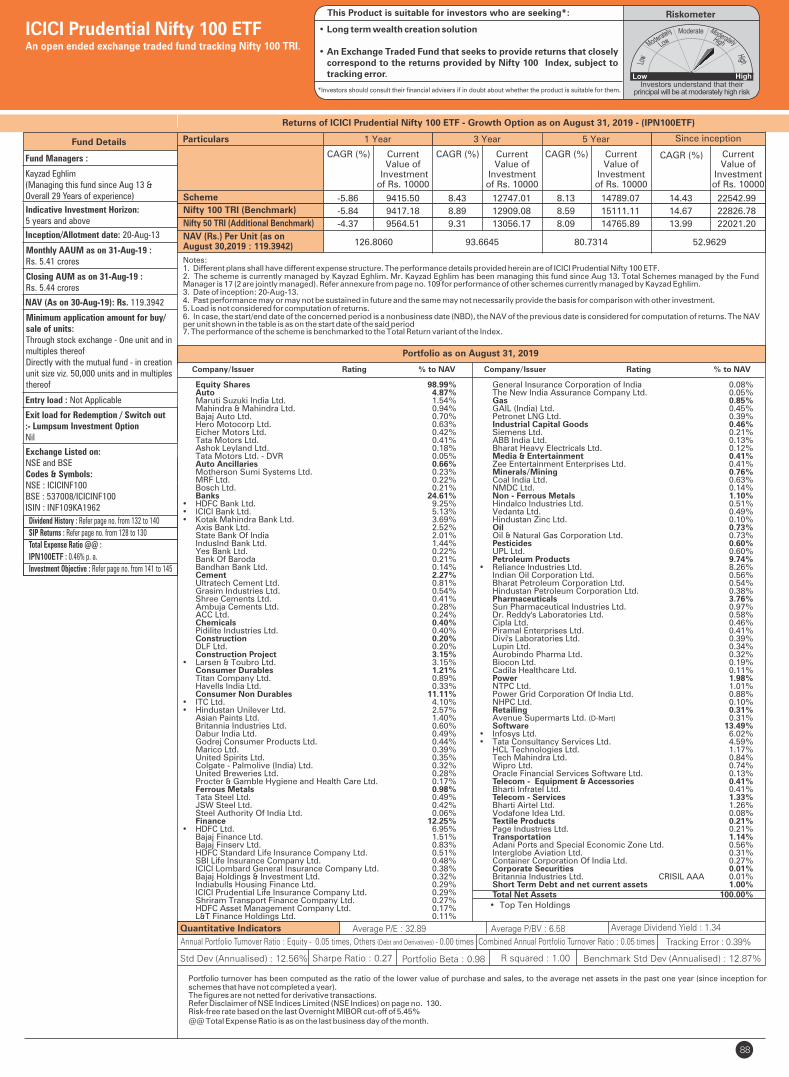
88
Fund Details
Quantitative Indicators
Company/Issuer Rating % to NAV
Fund Managers :
Kayzad Eghlim(Managing this fund since Aug 13 &Overall 29 Years of experience)
Indicative Investment Horizon: 5 years and above
Inception/Allotment date: 20-Aug-13
Monthly AAUM as on 31-Aug-19 : Rs. 5.41 crores
Closing AUM as on 31-Aug-19 : Rs. 5.44 crores
NAV (As on 30-Aug-19): Rs. 119.3942
Minimum application amount for buy/sale of units:Through stock exchange - One unit and inmultiples thereofDirectly with the mutual fund - in creationunit size viz. 50,000 units and in multiplesthereof
Exit load for Redemption / Switch out:- Lumpsum Investment OptionNil
Exchange Listed on:NSE and BSECodes & Symbols:NSE : ICICINF100BSE : 537008/ICICINF100ISIN : INF109KA1962
Average P/E : 32.89 Average P/BV : 6.58 Average Dividend Yield : 1.34
Portfolio turnover has been computed as the ratio of the lower value of purchase and sales, to the average net assets in the past one year (since inception for schemes that have not completed a year). The figures are not netted for derivative transactions.Refer Disclaimer of NSE Indices Limited (NSE Indices) on page no. 130.Risk-free rate based on the last Overnight MIBOR cut-off of 5.45%@@ Total Expense Ratio is as on the last business day of the month.
Company/Issuer Rating % to NAV
Portfolio as on August 31, 2019
• Top Ten Holdings
Equity Shares 98.99% Auto 4.87% Maruti Suzuki India Ltd. 1.54% Mahindra & Mahindra Ltd. 0.94% Bajaj Auto Ltd. 0.70% Hero Motocorp Ltd. 0.63% Eicher Motors Ltd. 0.42% Tata Motors Ltd. 0.41% Ashok Leyland Ltd. 0.18% Tata Motors Ltd. - DVR 0.05% Auto Ancillaries 0.66% Motherson Sumi Systems Ltd. 0.23% MRF Ltd. 0.22% Bosch Ltd. 0.21% Banks 24.61%• HDFC Bank Ltd. 9.25%• ICICI Bank Ltd. 5.13%• Kotak Mahindra Bank Ltd. 3.69% Axis Bank Ltd. 2.52% State Bank Of India 2.01% IndusInd Bank Ltd. 1.44% Yes Bank Ltd. 0.22% Bank Of Baroda 0.21% Bandhan Bank Ltd. 0.14% Cement 2.27% Ultratech Cement Ltd. 0.81% Grasim Industries Ltd. 0.54% Shree Cements Ltd. 0.41% Ambuja Cements Ltd. 0.28% ACC Ltd. 0.24% Chemicals 0.40% Pidilite Industries Ltd. 0.40% Construction 0.20% DLF Ltd. 0.20% Construction Project 3.15%• Larsen & Toubro Ltd. 3.15% Consumer Durables 1.21% Titan Company Ltd. 0.89% Havells India Ltd. 0.33% Consumer Non Durables 11.11%• ITC Ltd. 4.10%• Hindustan Unilever Ltd. 2.57% Asian Paints Ltd. 1.40% Britannia Industries Ltd. 0.60% Dabur India Ltd. 0.49% Godrej Consumer Products Ltd. 0.44% Marico Ltd. 0.39% United Spirits Ltd. 0.35% Colgate - Palmolive (India) Ltd. 0.32% United Breweries Ltd. 0.28% Procter & Gamble Hygiene and Health Care Ltd. 0.17% Ferrous Metals 0.98% Tata Steel Ltd. 0.49% JSW Steel Ltd. 0.42% Steel Authority Of India Ltd. 0.06% Finance 12.25%• HDFC Ltd. 6.95% Bajaj Finance Ltd. 1.51% Bajaj Finserv Ltd. 0.83% HDFC Standard Life Insurance Company Ltd. 0.51% SBI Life Insurance Company Ltd. 0.48% ICICI Lombard General Insurance Company Ltd. 0.38% Bajaj Holdings & Investment Ltd. 0.32% Indiabulls Housing Finance Ltd. 0.29% ICICI Prudential Life Insurance Company Ltd. 0.29% Shriram Transport Finance Company Ltd. 0.27% HDFC Asset Management Company Ltd. 0.17% L&T Finance Holdings Ltd. 0.11%
General Insurance Corporation of India 0.08% The New India Assurance Company Ltd. 0.05% Gas 0.85% GAIL (India) Ltd. 0.45% Petronet LNG Ltd. 0.39% Industrial Capital Goods 0.46% Siemens Ltd. 0.21% ABB India Ltd. 0.13% Bharat Heavy Electricals Ltd. 0.12% Media & Entertainment 0.41% Zee Entertainment Enterprises Ltd. 0.41% Minerals/Mining 0.76% Coal India Ltd. 0.63% NMDC Ltd. 0.14% Non - Ferrous Metals 1.10% Hindalco Industries Ltd. 0.51% Vedanta Ltd. 0.49% Hindustan Zinc Ltd. 0.10% Oil 0.73% Oil & Natural Gas Corporation Ltd. 0.73% Pesticides 0.60% UPL Ltd. 0.60% Petroleum Products 9.74%• Reliance Industries Ltd. 8.26% Indian Oil Corporation Ltd. 0.56% Bharat Petroleum Corporation Ltd. 0.54% Hindustan Petroleum Corporation Ltd. 0.38% Pharmaceuticals 3.76% Sun Pharmaceutical Industries Ltd. 0.97% Dr. Reddy's Laboratories Ltd. 0.58% Cipla Ltd. 0.46% Piramal Enterprises Ltd. 0.41% Divi's Laboratories Ltd. 0.39% Lupin Ltd. 0.34% Aurobindo Pharma Ltd. 0.32% Biocon Ltd. 0.19% Cadila Healthcare Ltd. 0.11% Power 1.98% NTPC Ltd. 1.01% Power Grid Corporation Of India Ltd. 0.88% NHPC Ltd. 0.10% Retailing 0.31% Avenue Supermarts Ltd. (D-Mart) 0.31% Software 13.49%• Infosys Ltd. 6.02%• Tata Consultancy Services Ltd. 4.59% HCL Technologies Ltd. 1.17% Tech Mahindra Ltd. 0.84% Wipro Ltd. 0.74% Oracle Financial Services Software Ltd. 0.13% Telecom - Equipment & Accessories 0.41% Bharti Infratel Ltd. 0.41% Telecom - Services 1.33% Bharti Airtel Ltd. 1.26% Vodafone Idea Ltd. 0.08% Textile Products 0.21% Page Industries Ltd. 0.21% Transportation 1.14% Adani Ports and Special Economic Zone Ltd. 0.56% Interglobe Aviation Ltd. 0.31% Container Corporation Of India Ltd. 0.27% Corporate Securities 0.01% Britannia Industries Ltd. CRISIL AAA 0.01% Short Term Debt and net current assets 1.00% Total Net Assets 100.00%
Returns of ICICI Prudential Nifty 100 ETF - Growth Option as on - (IPN100ETF)August 31, 2019
ICICI Prudential Nifty 100 ETFAn open ended exchange traded fund tracking Nifty 100 TRI.
Entry load : Not Applicable
RiskometerThis Product is suitable for investors who are seeking*:
• Long term wealth creation solution
• An Exchange Traded Fund that seeks to provide returns that closely correspond to the returns provided by Nifty 100 Index, subject to tracking error.
*Investors should consult their financial advisers if in doubt about whether the product is suitable for them.
Annual Portfolio Turnover Ratio : Equity - 0.05 times, Others (Debt and Derivatives) - 0.00 times Combined Annual Portfolio Turnover Ratio : 0.05 times
Dividend History : Refer page no. from 132 to 140
SIP Returns : Refer page no. from 128 to 130
Total Expense Ratio @@ :
: 0.46% p. a.IPN100ETF
Investment Objective : Refer page no. from 141 to 145
Std Dev (Annualised) : 12.56% Sharpe Ratio : 0.27 Portfolio Beta : 0.98 R squared : 1.00 Benchmark Std Dev (Annualised) : 12.87%
Tracking Error : 0.39%
Notes:1. Different plans shall have different expense structure. The performance details provided herein are of ICICI Prudential Nifty 100 ETF.2. The scheme is currently managed by Kayzad Eghlim. Mr. Kayzad Eghlim has been managing this fund since Aug 13. Total Schemes managed by the Fund Manager is 17 (2 are jointly managed). Refer annexure from page no. 109 for performance of other schemes currently managed by Kayzad Eghlim.3. Date of inception: 20-Aug-13.4. Past performance may or may not be sustained in future and the same may not necessarily provide the basis for comparison with other investment.5. Load is not considered for computation of returns.6. In case, the start/end date of the concerned period is a nonbusiness date (NBD), the NAV of the previous date is considered for computation of returns. The NAV per unit shown in the table is as on the start date of the said period7. The performance of the scheme is benchmarked to the Total Return variant of the Index.
Scheme
Nifty 50 TRI (Additional Benchmark)
NAV (Rs.) Per Unit (as on August 30,2019 : 119.3942)
CAGR (%)
52.9629
Nifty 100 TRI (Benchmark)
Since inception
CurrentValue of
Investment of Rs. 10000
CAGR (%) Current Value of
Investment of Rs. 10000
1 Year 3 Year 5 Year
CAGR (%) Current Value of
Investment of Rs. 10000
CAGR (%) Current Value of
Investment of Rs. 10000
126.8060 93.6645 80.7314
Particulars
-5.86 9415.50 8.43 12747.01 8.13 14789.07 14.43 22542.99
-5.84 9417.18 8.89 12909.08 8.59 15111.11 14.67 22826.78
-4.37 9564.51 9.31 13056.17 8.09 14765.89 13.99 22021.20
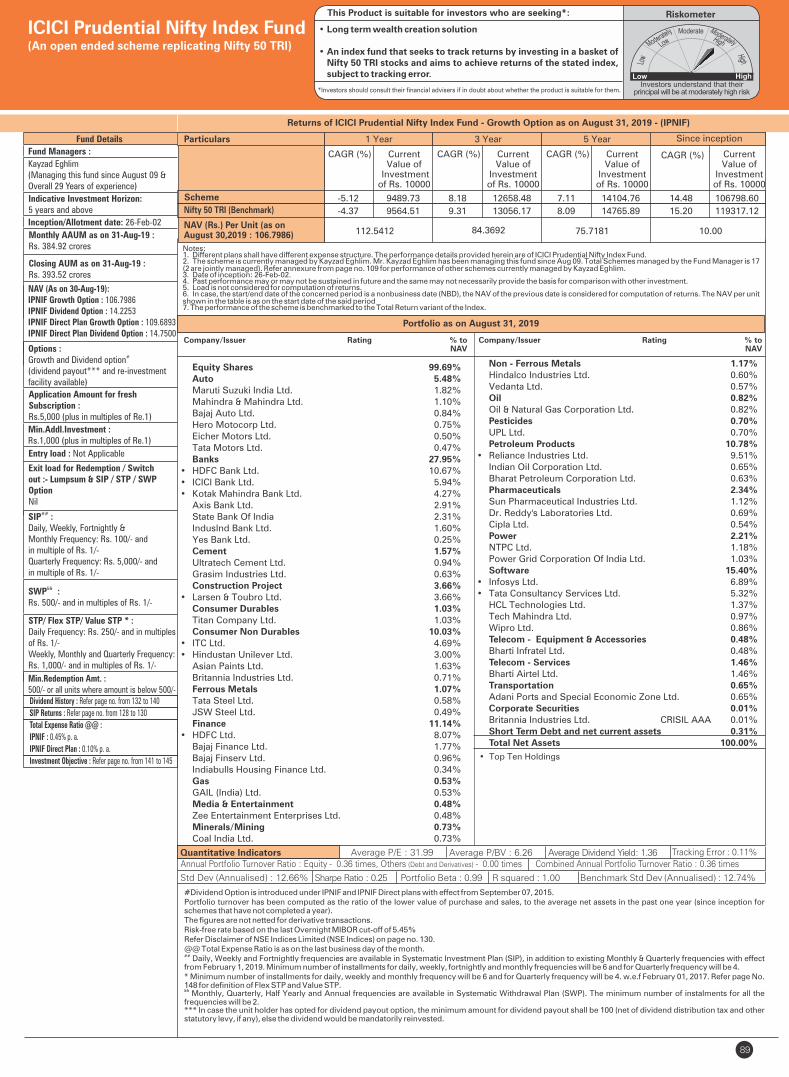
Quantitative Indicators
Fund Managers :
Kayzad Eghlim(Managing this fund since August 09 &Overall 29 Years of experience)
Indicative Investment Horizon: 5 years and above
Inception/Allotment date: 26-Feb-02
Monthly AAUM as on 31-Aug-19 : Rs. 384.92 crores
Closing AUM as on 31-Aug-19 : Rs. 393.52 crores
NAV (As on 30-Aug-19):IPNIF Growth Option : 106.7986IPNIF Dividend Option : 14.2253IPNIF Direct Plan Growth Option : 109.6893IPNIF Direct Plan Dividend Option : 14.7500
Options :#Growth and Dividend option
(dividend payout*** and re-investment facility available)
Application Amount for freshSubscription :Rs.5,000 (plus in multiples of Re.1)
Min.Addl.Investment :Rs.1,000 (plus in multiples of Re.1)
Exit load for Redemption / Switchout :- Lumpsum & SIP / STP / SWPOptionNil
SIP :##
Daily, Weekly, Fortnightly & Monthly Frequency: Rs. 100/- and in multiple of Rs. 1/-Quarterly Frequency: Rs. 5,000/- and in multiple of Rs. 1/-
&&SWP :Rs. 500/- and in multiples of Rs. 1/-
STP/ Flex STP/ Value STP * :Daily Frequency: Rs. 250/- and in multiples of Rs. 1/-Weekly, Monthly and Quarterly Frequency: Rs. 1,000/- and in multiples of Rs. 1/-
Min.Redemption Amt. :500/- or all units where amount is below 500/-
Std Dev (Annualised) : 12.66%
Average P/E : 31.99 Average P/BV : 6.26 Average Dividend Yield: 1.36
Sharpe Ratio : 0.25 Portfolio Beta : 0.99
Tracking Error : 0.11%
R squared : 1.00
#Dividend Option is introduced under IPNIF and IPNIF Direct plans with effect from September 07, 2015.Portfolio turnover has been computed as the ratio of the lower value of purchase and sales, to the average net assets in the past one year (since inception for schemes that have not completed a year). The figures are not netted for derivative transactions.Risk-free rate based on the last Overnight MIBOR cut-off of 5.45%Refer Disclaimer of NSE Indices Limited (NSE Indices) on page no. 130.@@ Total Expense Ratio is as on the last business day of the month.## Daily, Weekly and Fortnightly frequencies are available in Systematic Investment Plan (SIP), in addition to existing Monthly & Quarterly frequencies with effect from February 1, 2019. Minimum number of installments for daily, weekly, fortnightly and monthly frequencies will be 6 and for Quarterly frequency will be 4.* Minimum number of installments for daily, weekly and monthly frequency will be 6 and for Quarterly frequency will be 4. w.e.f February 01, 2017. Refer page No. 148 for definition of Flex STP and Value STP.&&
Monthly, Quarterly, Half Yearly and Annual frequencies are available in Systematic Withdrawal Plan (SWP). The minimum number of instalments for all the frequencies will be 2.*** In case the unit holder has opted for dividend payout option, the minimum amount for dividend payout shall be 100 (net of dividend distribution tax and other statutory levy, if any), else the dividend would be mandatorily reinvested.
89
Fund Details
Portfolio as on August 31, 2019
Returns of ICICI Prudential Nifty Index Fund - Growth Option as on - (IPNIF)August 31, 2019
• Top Ten Holdings
Equity Shares 99.69% Auto 5.48% Maruti Suzuki India Ltd. 1.82% Mahindra & Mahindra Ltd. 1.10% Bajaj Auto Ltd. 0.84% Hero Motocorp Ltd. 0.75% Eicher Motors Ltd. 0.50% Tata Motors Ltd. 0.47% Banks 27.95%• HDFC Bank Ltd. 10.67%• ICICI Bank Ltd. 5.94%• Kotak Mahindra Bank Ltd. 4.27% Axis Bank Ltd. 2.91% State Bank Of India 2.31% IndusInd Bank Ltd. 1.60% Yes Bank Ltd. 0.25% Cement 1.57% Ultratech Cement Ltd. 0.94% Grasim Industries Ltd. 0.63% Construction Project 3.66%• Larsen & Toubro Ltd. 3.66% Consumer Durables 1.03% Titan Company Ltd. 1.03% Consumer Non Durables 10.03%• ITC Ltd. 4.69%• Hindustan Unilever Ltd. 3.00% Asian Paints Ltd. 1.63% Britannia Industries Ltd. 0.71% Ferrous Metals 1.07% Tata Steel Ltd. 0.58% JSW Steel Ltd. 0.49% Finance 11.14%• HDFC Ltd. 8.07% Bajaj Finance Ltd. 1.77% Bajaj Finserv Ltd. 0.96% Indiabulls Housing Finance Ltd. 0.34% Gas 0.53% GAIL (India) Ltd. 0.53% Media & Entertainment 0.48% Zee Entertainment Enterprises Ltd. 0.48% Minerals/Mining 0.73% Coal India Ltd. 0.73%
Non - Ferrous Metals 1.17% Hindalco Industries Ltd. 0.60% Vedanta Ltd. 0.57% Oil 0.82% Oil & Natural Gas Corporation Ltd. 0.82% Pesticides 0.70% UPL Ltd. 0.70% Petroleum Products 10.78%• Reliance Industries Ltd. 9.51% Indian Oil Corporation Ltd. 0.65% Bharat Petroleum Corporation Ltd. 0.63% Pharmaceuticals 2.34% Sun Pharmaceutical Industries Ltd. 1.12% Dr. Reddy's Laboratories Ltd. 0.69% Cipla Ltd. 0.54% Power 2.21% NTPC Ltd. 1.18% Power Grid Corporation Of India Ltd. 1.03% Software 15.40%• Infosys Ltd. 6.89%• Tata Consultancy Services Ltd. 5.32% HCL Technologies Ltd. 1.37% Tech Mahindra Ltd. 0.97% Wipro Ltd. 0.86% Telecom - Equipment & Accessories 0.48% Bharti Infratel Ltd. 0.48% Telecom - Services 1.46% Bharti Airtel Ltd. 1.46% Transportation 0.65% Adani Ports and Special Economic Zone Ltd. 0.65% Corporate Securities 0.01% Britannia Industries Ltd. CRISIL AAA 0.01% Short Term Debt and net current assets 0.31% Total Net Assets 100.00%
ICICI Prudential Nifty Index Fund (An open ended scheme replicating Nifty 50 TRI)
Benchmark Std Dev (Annualised) : 12.74%
Entry load : Not Applicable
RiskometerThis Product is suitable for investors who are seeking*:
• Long term wealth creation solution
• An index fund that seeks to track returns by investing in a basket of Nifty 50 TRI stocks and aims to achieve returns of the stated index, subject to tracking error.
*Investors should consult their financial advisers if in doubt about whether the product is suitable for them.
Annual Portfolio Turnover Ratio : Equity - 0.36 times, Others (Debt and Derivatives) - 0.00 times Combined Annual Portfolio Turnover Ratio : 0.36 times
Dividend History : Refer page no. from 132 to 140
SIP Returns : Refer page no. from 128 to 130
Total Expense Ratio @@ :
IPNIF : 0.45% p. a.
IPNIF Direct Plan : 0.10% p. a.
Investment Objective : Refer page no. from 141 to 145
Notes:1. Different plans shall have different expense structure. The performance details provided herein are of ICICI Prudential Nifty Index Fund.2. The scheme is currently managed by Kayzad Eghlim. Mr. Kayzad Eghlim has been managing this fund since Aug 09. Total Schemes managed by the Fund Manager is 17 (2 are jointly managed). Refer annexure from page no. 109 for performance of other schemes currently managed by Kayzad Eghlim.3. Date of inception: 26-Feb-02.4. Past performance may or may not be sustained in future and the same may not necessarily provide the basis for comparison with other investment.5. Load is not considered for computation of returns.6. In case, the start/end date of the concerned period is a nonbusiness date (NBD), the NAV of the previous date is considered for computation of returns. The NAV per unit shown in the table is as on the start date of the said period7. The performance of the scheme is benchmarked to the Total Return variant of the Index.
Scheme
NAV (Rs.) Per Unit (as on August 30,2019 : 106.7986)
CAGR (%)
10.00
Nifty 50 TRI (Benchmark)
Since inception
CurrentValue of
Investment of Rs. 10000
CAGR (%) Current Value of
Investment of Rs. 10000
1 Year 3 Year 5 Year
CAGR (%) Current Value of
Investment of Rs. 10000
CAGR (%) Current Value of
Investment of Rs. 10000
112.5412 84.3692 75.7181
Particulars
-5.12 9489.73 8.18 12658.48 7.11 14104.76 14.48 106798.60
-4.37 9564.51 9.31 13056.17 8.09 14765.89 15.20 119317.12
Company/Issuer Rating % to NAV
Company/Issuer Rating % to NAV
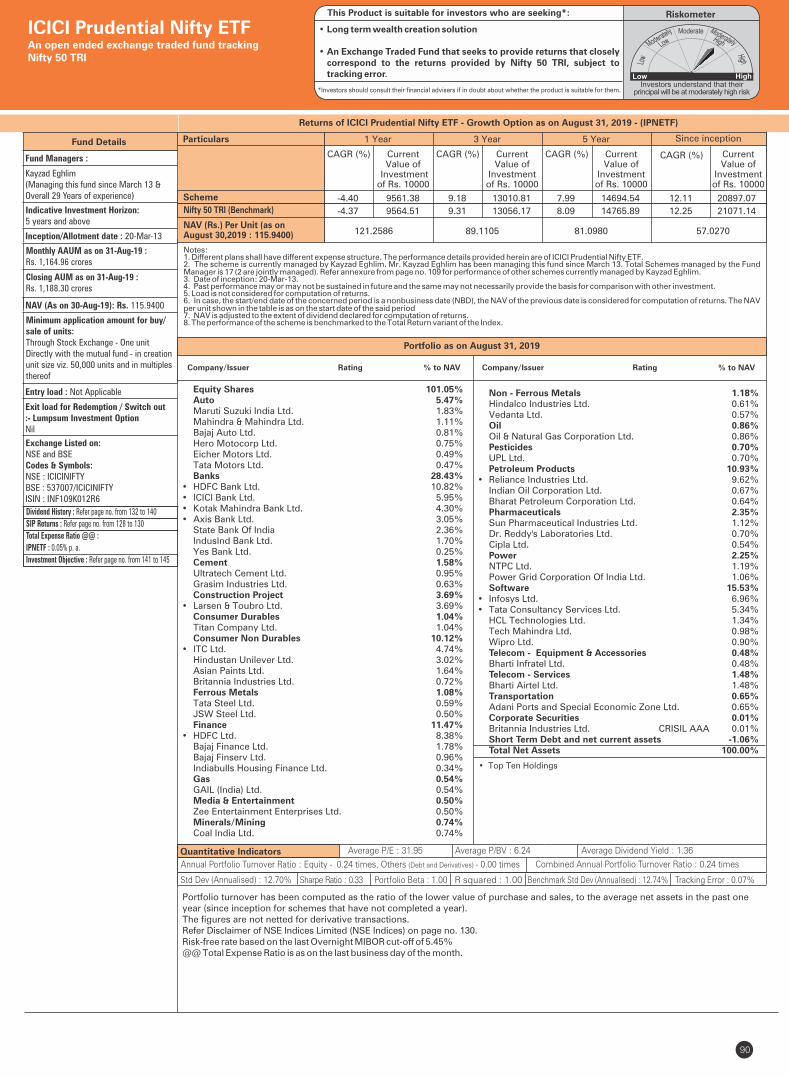
Quantitative Indicators
Fund Details
Fund Managers :
Kayzad Eghlim(Managing this fund since March 13 &Overall 29 Years of experience)
Indicative Investment Horizon: 5 years and above
Inception/Allotment date : 20-Mar-13
Monthly AAUM as on 31-Aug-19 : Rs. 1,164.96 crores
Closing AUM as on 31-Aug-19 : Rs. 1,188.30 crores
Minimum application amount for buy/sale of units:Through Stock Exchange - One unitDirectly with the mutual fund - in creationunit size viz. 50,000 units and in multiplesthereof
Exit load for Redemption / Switch out:- Lumpsum Investment OptionNil
Exchange Listed on:NSE and BSECodes & Symbols:NSE : ICICINIFTYBSE : 537007/ICICINIFTYISIN : INF109K012R6
NAV (As on 30-Aug-19): Rs. 115.9400
Average P/E : 31.95 Average P/BV : 6.24 Average Dividend Yield : 1.36
Portfolio turnover has been computed as the ratio of the lower value of purchase and sales, to the average net assets in the past one year (since inception for schemes that have not completed a year). The figures are not netted for derivative transactions.Refer Disclaimer of NSE Indices Limited (NSE Indices) on page no. 130.Risk-free rate based on the last Overnight MIBOR cut-off of 5.45%@@ Total Expense Ratio is as on the last business day of the month.
90
• Top Ten Holdings
Returns of ICICI Prudential Nifty ETF - Growth Option as on - (IPNETF)August 31, 2019
Portfolio as on August 31, 2019
Equity Shares 101.05% Auto 5.47% Maruti Suzuki India Ltd. 1.83% Mahindra & Mahindra Ltd. 1.11% Bajaj Auto Ltd. 0.81% Hero Motocorp Ltd. 0.75% Eicher Motors Ltd. 0.49% Tata Motors Ltd. 0.47% Banks 28.43%• HDFC Bank Ltd. 10.82%• ICICI Bank Ltd. 5.95%• Kotak Mahindra Bank Ltd. 4.30%• Axis Bank Ltd. 3.05% State Bank Of India 2.36% IndusInd Bank Ltd. 1.70% Yes Bank Ltd. 0.25% Cement 1.58% Ultratech Cement Ltd. 0.95% Grasim Industries Ltd. 0.63% Construction Project 3.69%• Larsen & Toubro Ltd. 3.69% Consumer Durables 1.04% Titan Company Ltd. 1.04% Consumer Non Durables 10.12%• ITC Ltd. 4.74% Hindustan Unilever Ltd. 3.02% Asian Paints Ltd. 1.64% Britannia Industries Ltd. 0.72% Ferrous Metals 1.08% Tata Steel Ltd. 0.59% JSW Steel Ltd. 0.50% Finance 11.47%• HDFC Ltd. 8.38% Bajaj Finance Ltd. 1.78% Bajaj Finserv Ltd. 0.96% Indiabulls Housing Finance Ltd. 0.34% Gas 0.54% GAIL (India) Ltd. 0.54% Media & Entertainment 0.50% Zee Entertainment Enterprises Ltd. 0.50% Minerals/Mining 0.74% Coal India Ltd. 0.74%
Non - Ferrous Metals 1.18% Hindalco Industries Ltd. 0.61% Vedanta Ltd. 0.57% Oil 0.86% Oil & Natural Gas Corporation Ltd. 0.86% Pesticides 0.70% UPL Ltd. 0.70% Petroleum Products 10.93%• Reliance Industries Ltd. 9.62% Indian Oil Corporation Ltd. 0.67% Bharat Petroleum Corporation Ltd. 0.64% Pharmaceuticals 2.35% Sun Pharmaceutical Industries Ltd. 1.12% Dr. Reddy's Laboratories Ltd. 0.70% Cipla Ltd. 0.54% Power 2.25% NTPC Ltd. 1.19% Power Grid Corporation Of India Ltd. 1.06% Software 15.53%• Infosys Ltd. 6.96%• Tata Consultancy Services Ltd. 5.34% HCL Technologies Ltd. 1.34% Tech Mahindra Ltd. 0.98% Wipro Ltd. 0.90% Telecom - Equipment & Accessories 0.48% Bharti Infratel Ltd. 0.48% Telecom - Services 1.48% Bharti Airtel Ltd. 1.48% Transportation 0.65% Adani Ports and Special Economic Zone Ltd. 0.65% Corporate Securities 0.01% Britannia Industries Ltd. CRISIL AAA 0.01% Short Term Debt and net current assets -1.06% Total Net Assets 100.00%
ICICI Prudential Nifty ETFAn open ended exchange traded fund tracking Nifty 50 TRI
Entry load : Not Applicable
RiskometerThis Product is suitable for investors who are seeking*:
• Long term wealth creation solution
• An Exchange Traded Fund that seeks to provide returns that closely correspond to the returns provided by Nifty 50 TRI, subject to tracking error.
*Investors should consult their financial advisers if in doubt about whether the product is suitable for them.
Annual Portfolio Turnover Ratio : Equity - 0.24 times, Others (Debt and Derivatives) - 0.00 times Combined Annual Portfolio Turnover Ratio : 0.24 times
Std Dev (Annualised) : 12.70% Sharpe Ratio : 0.33 Portfolio Beta : 1.00 R squared : 1.00 Benchmark Std Dev (Annualised) : 12.74% Tracking Error : 0.07%
Company/Issuer Rating % to NAV Company/Issuer Rating % to NAV
Dividend History : Refer page no. from 132 to 140
SIP Returns : Refer page no. from 128 to 130
Total Expense Ratio @@ :
IPNETF : 0.05% p. a.
Investment Objective : Refer page no. from 141 to 145
Notes:1. Different plans shall have different expense structure. The performance details provided herein are of ICICI Prudential Nifty ETF.2. The scheme is currently managed by Kayzad Eghlim. Mr. Kayzad Eghlim has been managing this fund since March 13. Total Schemes managed by the Fund Manager 17 (2 are jointly managed) Refer annexure from page no. 109 for performance of other schemes currently managed by Kayzad Eghlim. is .3. Date of inception: 20-Mar-13.4. Past performance may or may not be sustained in future and the same may not necessarily provide the basis for comparison with other investment.5. Load is not considered for computation of returns.6. In case, the start/end date of the concerned period is a nonbusiness date (NBD), the NAV of the previous date is considered for computation of returns. The NAV per unit shown in the table is as on the start date of the said period7. NAV is adjusted to the extent of dividend declared for computation of returns.8. The performance of the scheme is benchmarked to the Total Return variant of the Index.
Scheme
NAV (Rs.) Per Unit (as onAugust 30,2019 : 115.9400)
CAGR (%)
57.0270
Nifty 50 TRI (Benchmark)
Since inception
CurrentValue of
Investment of Rs. 10000
CAGR (%) Current Value of
Investment of Rs. 10000
1 Year 3 Year 5 Year
CAGR (%) Current Value of
Investment of Rs. 10000
CAGR (%) Current Value of
Investment of Rs. 10000
121.2586 89.1105 81.0980
Particulars
-4.40 9561.38 9.18 13010.81 7.99 14694.54 12.11 20897.07
-4.37 9564.51 9.31 13056.17 8.09 14765.89 12.25 21071.14
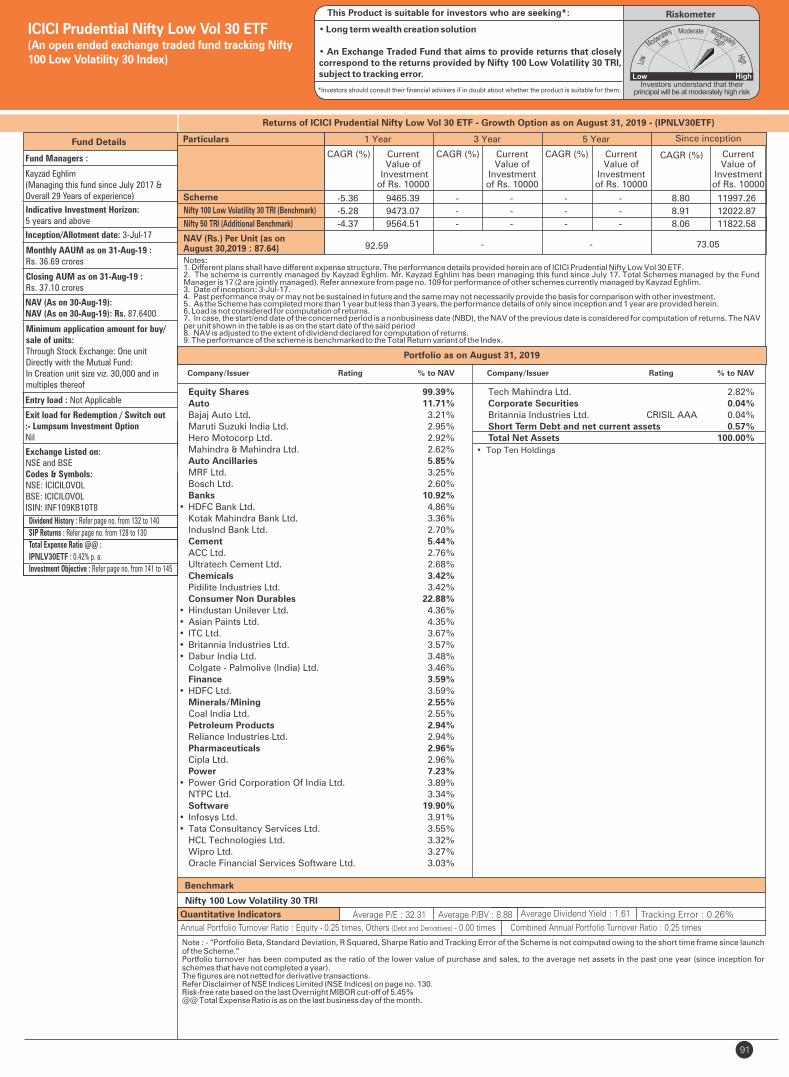
Tracking Error : 0.26%
91
ICICI Prudential Nifty Low Vol 30 ETF(An open ended exchange traded fund tracking Nifty 100 Low Volatility 30 Index)
RiskometerThis Product is suitable for investors who are seeking*:
• Long term wealth creation solution
• An Exchange Traded Fund that aims to provide returns that closely correspond to the returns provided by Nifty 100 Low Volatility 30 TRI, subject to tracking error.
*Investors should consult their financial advisers if in doubt about whether the product is suitable for them.
Company/Issuer Rating % to NAV
Equity Shares 99.39% Auto 11.71% Bajaj Auto Ltd. 3.21% Maruti Suzuki India Ltd. 2.95% Hero Motocorp Ltd. 2.92% Mahindra & Mahindra Ltd. 2.62% Auto Ancillaries 5.85% MRF Ltd. 3.25% Bosch Ltd. 2.60% Banks 10.92%• HDFC Bank Ltd. 4.86% Kotak Mahindra Bank Ltd. 3.36% IndusInd Bank Ltd. 2.70% Cement 5.44% ACC Ltd. 2.76% Ultratech Cement Ltd. 2.68% Chemicals 3.42% Pidilite Industries Ltd. 3.42% Consumer Non Durables 22.88%• Hindustan Unilever Ltd. 4.36%• Asian Paints Ltd. 4.35%• ITC Ltd. 3.67%• Britannia Industries Ltd. 3.57%• Dabur India Ltd. 3.48% Colgate - Palmolive (India) Ltd. 3.46% Finance 3.59%• HDFC Ltd. 3.59% Minerals/Mining 2.55% Coal India Ltd. 2.55% Petroleum Products 2.94% Reliance Industries Ltd. 2.94% Pharmaceuticals 2.96% Cipla Ltd. 2.96% Power 7.23%• Power Grid Corporation Of India Ltd. 3.89% NTPC Ltd. 3.34% Software 19.90%• Infosys Ltd. 3.91%• Tata Consultancy Services Ltd. 3.55% HCL Technologies Ltd. 3.32% Wipro Ltd. 3.27% Oracle Financial Services Software Ltd. 3.03%
Benchmark
Nifty 100 Low Volatility 30 TRI
Fund Details
Fund Managers :
Kayzad Eghlim(Managing this fund since July 2017 &Overall 29 Years of experience)
Indicative Investment Horizon: 5 years and above
Inception/Allotment date: 3-Jul-17
Monthly AAUM as on 31-Aug-19 : Rs. 36.69 crores
Closing AUM as on 31-Aug-19 : Rs. 37.10 crores
NAV (As on 30-Aug-19):NAV (As on 30-Aug-19): Rs. 87.6400
Minimum application amount for buy/sale of units:Through Stock Exchange: One unitDirectly with the Mutual Fund: In Creation unit size viz. 30,000 and in multiples thereof
Exit load for Redemption / Switch out:- Lumpsum Investment OptionNil
Exchange Listed on:NSE and BSECodes & Symbols:NSE: ICICILOVOLBSE: ICICILOVOLISIN: INF109KB10T8
Entry load : Not Applicable
Dividend History : Refer page no. from 132 to 140
SIP Returns : Refer page no. from 128 to 130
Total Expense Ratio @@ :
: 0.42% p. a.IPNLV30ETF
Investment Objective : Refer page no. from 141 to 145
Quantitative Indicators Average P/E : 32.31 Average P/BV : 8.88 Average Dividend Yield : 1.61
Note : - “Portfolio Beta, Standard Deviation, R Squared, Sharpe Ratio and Tracking Error of the Scheme is not computed owing to the short time frame since launch of the Scheme.”Portfolio turnover has been computed as the ratio of the lower value of purchase and sales, to the average net assets in the past one year (since inception for schemes that have not completed a year). The figures are not netted for derivative transactions.Refer Disclaimer of NSE Indices Limited (NSE Indices) on page no. 130.Risk-free rate based on the last Overnight MIBOR cut-off of 5.45%@@ Total Expense Ratio is as on the last business day of the month.
Annual Portfolio Turnover Ratio : Equity - 0.25 times, Others (Debt and Derivatives) - 0.00 times Combined Annual Portfolio Turnover Ratio : 0.25 times
• Top Ten Holdings
Portfolio as on August 31, 2019
Company/Issuer Rating % to NAV
Tech Mahindra Ltd. 2.82% Corporate Securities 0.04% Britannia Industries Ltd. CRISIL AAA 0.04% Short Term Debt and net current assets 0.57% Total Net Assets 100.00%
Returns of ICICI Prudential Nifty Low Vol 30 ETF - Growth Option as on August 31, 2019 - (IPNLV30ETF)
Notes:1. Different plans shall have different expense structure. The performance details provided herein are of ICICI Prudential Nifty Low Vol 30 ETF.2. The scheme is currently managed by Kayzad Eghlim. Mr. Kayzad Eghlim has been managing this fund since July 17. Total Schemes managed by the Fund Manager 17 (2 are jointly managed) Refer annexure from page no. 109 for performance of other schemes currently managed by Kayzad Eghlim. is .3. Date of inception: 3-Jul-17.4. Past performance may or may not be sustained in future and the same may not necessarily provide the basis for comparison with other investment.5. As the Scheme has completed more than 1 year but less than 3 years, the performance details of only since inception and 1 year are provided herein.6. Load is not considered for computation of returns.7. In case, the start/end date of the concerned period is a nonbusiness date (NBD), the NAV of the previous date is considered for computation of returns. The NAV per unit shown in the table is as on the start date of the said period8. NAV is adjusted to the extent of dividend declared for computation of returns.9. The performance of the scheme is benchmarked to the Total Return variant of the Index.
Scheme
NAV (Rs.) Per Unit (as on August 30,2019 : 87.64)
CAGR (%)
73.05
Nifty 100 Low Volatility 30 TRI (Benchmark)
Since inception
CurrentValue of
Investment of Rs. 10000
CAGR (%) Current Value of
Investment of Rs. 10000
1 Year 3 Year 5 Year
CAGR (%) Current Value of
Investment of Rs. 10000
CAGR (%) Current Value of
Investment of Rs. 10000
92.59 - -
Particulars
-5.36 9465.39 - - - - 8.80 11997.26
-5.28 9473.07 - - - - 8.91 12022.87
-4.37 9564.51 - - - - 8.06 11822.58Nifty 50 TRI (Additional Benchmark)
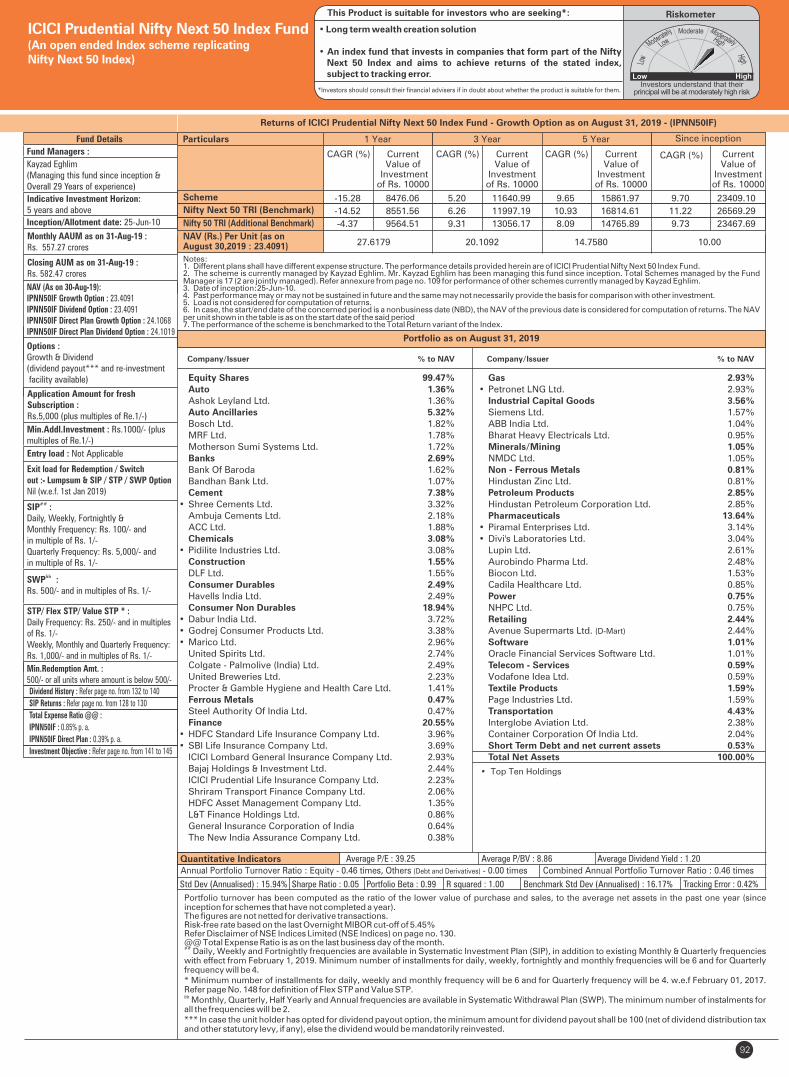
Fund Details
Quantitative Indicators
Portfolio turnover has been computed as the ratio of the lower value of purchase and sales, to the average net assets in the past one year (since inception for schemes that have not completed a year). The figures are not netted for derivative transactions.Risk-free rate based on the last Overnight MIBOR cut-off of 5.45%Refer Disclaimer of NSE Indices Limited (NSE Indices) on page no. 130.@@ Total Expense Ratio is as on the last business day of the month.##
Daily, Weekly and Fortnightly frequencies are available in Systematic Investment Plan (SIP), in addition to existing Monthly & Quarterly frequencies with effect from February 1, 2019. Minimum number of installments for daily, weekly, fortnightly and monthly frequencies will be 6 and for Quarterly frequency will be 4.* Minimum number of installments for daily, weekly and monthly frequency will be 6 and for Quarterly frequency will be 4. w.e.f February 01, 2017. Refer page No. 148 for definition of Flex STP and Value STP.&&
Monthly, Quarterly, Half Yearly and Annual frequencies are available in Systematic Withdrawal Plan (SWP). The minimum number of instalments for all the frequencies will be 2.*** In case the unit holder has opted for dividend payout option, the minimum amount for dividend payout shall be 100 (net of dividend distribution tax and other statutory levy, if any), else the dividend would be mandatorily reinvested.
Fund Managers :
Kayzad Eghlim(Managing this fund since inception &Overall 29 Years of experience)
Indicative Investment Horizon: 5 years and above
Inception/Allotment date: 25-Jun-10
Monthly AAUM as on 31-Aug-19 : Rs. 557.27 crores
Closing AUM as on 31-Aug-19 : Rs. 582.47 crores
NAV (As on 30-Aug-19):IPNN50IF Growth Option : 23.4091IPNN50IF Dividend Option : 23.4091IPNN50IF Direct Plan Growth Option : 24.1068IPNN50IF Direct Plan Dividend Option : 24.1019
Options :Growth & Dividend(dividend payout*** and re-investment facility available)
Application Amount for freshSubscription :Rs.5,000 (plus multiples of Re.1/-)
Min.Addl.Investment : Rs.1000/- (plusmultiples of Re.1/-)
Exit load for Redemption / Switchout :- Lumpsum & SIP / STP / SWP OptionNil (w.e.f. 1st Jan 2019)
SIP :##
Daily, Weekly, Fortnightly & Monthly Frequency: Rs. 100/- and in multiple of Rs. 1/-Quarterly Frequency: Rs. 5,000/- and in multiple of Rs. 1/-
&&SWP :Rs. 500/- and in multiples of Rs. 1/-
STP/ Flex STP/ Value STP * :Daily Frequency: Rs. 250/- and in multiples of Rs. 1/-Weekly, Monthly and Quarterly Frequency: Rs. 1,000/- and in multiples of Rs. 1/-
Min.Redemption Amt. :500/- or all units where amount is below 500/-
Std Dev (Annualised) : 15.94% Sharpe Ratio : 0.05
Average P/E : 39.25 Average P/BV : 8.86 Average Dividend Yield : 1.20
Portfolio Beta : 0.99 R squared : 1.00
Portfolio as on August 31, 2019
Returns of ICICI Prudential Nifty Next 50 Index Fund - Growth Option as on - (IPNN50IF)August 31, 2019
• Top Ten Holdings
92
Tracking Error : 0.42%
ICICI Prudential Nifty Next 50 Index Fund(An open ended Index scheme replicatingNifty Next 50 Index)
Benchmark Std Dev (Annualised) : 16.17%
Entry load : Not Applicable
RiskometerThis Product is suitable for investors who are seeking*:
• Long term wealth creation solution
• An index fund that invests in companies that form part of the Nifty Next 50 Index and aims to achieve returns of the stated index, subject to tracking error.
*Investors should consult their financial advisers if in doubt about whether the product is suitable for them.
Annual Portfolio Turnover Ratio : Equity - 0.46 times, Others (Debt and Derivatives) - 0.00 times Combined Annual Portfolio Turnover Ratio : 0.46 times
Dividend History : Refer page no. from 132 to 140
SIP Returns : Refer page no. from 128 to 130
Total Expense Ratio @@ :
IPNN50IF : 0.85% p. a.
IPNN50IF Direct Plan : 0.39% p. a.
Investment Objective : Refer page no. from 141 to 145
Notes:1. Different plans shall have different expense structure. The performance details provided herein are of ICICI Prudential Nifty Next 50 Index Fund.2. The scheme is currently managed by Kayzad Eghlim. Mr. Kayzad Eghlim has been managing this fund since inception. Total Schemes managed by the Fund Manager 17 (2 are jointly managed) Refer annexure from page no. 109 for performance of other schemes currently managed by Kayzad Eghlim. is .3. Date of inception:25-Jun-10.4. Past performance may or may not be sustained in future and the same may not necessarily provide the basis for comparison with other investment.5. Load is not considered for computation of returns.6. In case, the start/end date of the concerned period is a nonbusiness date (NBD), the NAV of the previous date is considered for computation of returns. The NAV per unit shown in the table is as on the start date of the said period7. The performance of the scheme is benchmarked to the Total Return variant of the Index.
Scheme
Nifty 50 TRI (Additional Benchmark)
NAV (Rs.) Per Unit (as onAugust 30,2019 : 23.4091)
CAGR (%)
10.00
Nifty Next 50 TRI (Benchmark)
Since inception
CurrentValue of
Investment of Rs. 10000
CAGR (%) Current Value of
Investment of Rs. 10000
1 Year 3 Year 5 Year
CAGR (%) Current Value of
Investment of Rs. 10000
CAGR (%) Current Value of
Investment of Rs. 10000
27.6179 20.1092 14.7580
Particulars
-15.28 8476.06 5.20 11640.99 9.65 15861.97 9.70 23409.10
-14.52 8551.56 6.26 11997.19 10.93 16814.61 11.22 26569.29
-4.37 9564.51 9.31 13056.17 8.09 14765.89 9.73 23467.69
Company/Issuer % to NAV
Equity Shares 99.47% Auto 1.36% Ashok Leyland Ltd. 1.36% Auto Ancillaries 5.32% Bosch Ltd. 1.82% MRF Ltd. 1.78% Motherson Sumi Systems Ltd. 1.72% Banks 2.69% Bank Of Baroda 1.62% Bandhan Bank Ltd. 1.07% Cement 7.38%• Shree Cements Ltd. 3.32% Ambuja Cements Ltd. 2.18% ACC Ltd. 1.88% Chemicals 3.08%• Pidilite Industries Ltd. 3.08% Construction 1.55% DLF Ltd. 1.55% Consumer Durables 2.49% Havells India Ltd. 2.49% Consumer Non Durables 18.94%• Dabur India Ltd. 3.72%• Godrej Consumer Products Ltd. 3.38%• Marico Ltd. 2.96% United Spirits Ltd. 2.74% Colgate - Palmolive (India) Ltd. 2.49% United Breweries Ltd. 2.23% Procter & Gamble Hygiene and Health Care Ltd. 1.41% Ferrous Metals 0.47% Steel Authority Of India Ltd. 0.47% Finance 20.55%• HDFC Standard Life Insurance Company Ltd. 3.96%• SBI Life Insurance Company Ltd. 3.69% ICICI Lombard General Insurance Company Ltd. 2.93% Bajaj Holdings & Investment Ltd. 2.44% ICICI Prudential Life Insurance Company Ltd. 2.23% Shriram Transport Finance Company Ltd. 2.06% HDFC Asset Management Company Ltd. 1.35% L&T Finance Holdings Ltd. 0.86% General Insurance Corporation of India 0.64% The New India Assurance Company Ltd. 0.38%
Company/Issuer % to NAV
Gas 2.93%• Petronet LNG Ltd. 2.93% Industrial Capital Goods 3.56% Siemens Ltd. 1.57% ABB India Ltd. 1.04% Bharat Heavy Electricals Ltd. 0.95% Minerals/Mining 1.05% NMDC Ltd. 1.05% Non - Ferrous Metals 0.81% Hindustan Zinc Ltd. 0.81% Petroleum Products 2.85% Hindustan Petroleum Corporation Ltd. 2.85% Pharmaceuticals 13.64%• Piramal Enterprises Ltd. 3.14%• Divi's Laboratories Ltd. 3.04% Lupin Ltd. 2.61% Aurobindo Pharma Ltd. 2.48% Biocon Ltd. 1.53% Cadila Healthcare Ltd. 0.85% Power 0.75% NHPC Ltd. 0.75% Retailing 2.44% Avenue Supermarts Ltd. (D-Mart) 2.44% Software 1.01% Oracle Financial Services Software Ltd. 1.01% Telecom - Services 0.59% Vodafone Idea Ltd. 0.59% Textile Products 1.59% Page Industries Ltd. 1.59% Transportation 4.43% Interglobe Aviation Ltd. 2.38% Container Corporation Of India Ltd. 2.04% Short Term Debt and net current assets 0.53% Total Net Assets 100.00%

93
Note : - “Portfolio Beta, Standard Deviation, R Squared, Sharpe Ratio and Tracking Error of the Scheme is not computed owing to the short time frame since launch of the Scheme.”Portfolio turnover has been computed as the ratio of the lower value of purchase and sales, to the average net assets in the past one year (since inception for schemes that have not completed a year). The figures are not netted for derivative transactions.Refer Disclaimer of Asia Index Private Limited (AIPL) on page no. 130.@@ Total Expense Ratio is as on the last business day of the month.## Daily, Weekly and Fortnightly frequencies are available in Systematic Investment Plan (SIP), in addition to existing Monthly & Quarterly frequencies with effect from February 1, 2019. Minimum number of installments for daily, weekly, fortnightly and monthly frequencies will be 6 and for Quarterly frequency will be 4.* Minimum number of installments for daily, weekly and monthly frequency will be 6 and for Quarterly frequency will be 4. w.e.f February 01, 2017. Refer page No. 148 for definition of Flex STP and Value STP.&& Monthly, Quarterly, Half Yearly and Annual frequencies are available in Systematic Withdrawal Plan (SWP). The minimum number of instalments for all the frequencies will be 2.*** In case the unit holder has opted for dividend payout option, the minimum amount for dividend payout shall be 100 (net of dividend distribution tax and other statutory levy, if any), else the dividend would be mandatorily reinvested.
Average P/E : 32.63 Average P/BV : 6.22 Average Dividend Yield : 1.26
Style Box
• Top Ten Holdings
ICICI Prudential Sensex Index FundAn open ended Index scheme replicating S&PBSE Sensex Index
RiskometerThis Product is suitable for investors who are seeking*:
• Long term wealth creation solution
• An index fund that seeks to track returns by investing in a basket of S&P BSE SENSEX TRI Index stocks and aims to achieve returns of the stated index, subject to tracking error.
*Investors should consult their financial advisers if in doubt about whether the product is suitable for them.
Annual Portfolio Turnover Ratio : Equity - 0.61 times, Others (Debt and Derivatives) - 0.00 times Combined Annual Portfolio Turnover Ratio : 0.61 times
Company/Issuer % to NAV
Equity Shares 99.24% Auto 5.90% Maruti Suzuki India Ltd. 2.12% Mahindra & Mahindra Ltd. 1.29% Bajaj Auto Ltd. 1.00% Hero Motocorp Ltd. 0.87% Tata Motors Ltd. 0.56% Tata Motors Ltd. - DVR 0.07% Banks 31.67%• HDFC Bank Ltd. 12.48%• ICICI Bank Ltd. 6.89%• Kotak Mahindra Bank Ltd. 4.42% Axis Bank Ltd. 3.07% State Bank Of India 2.68% IndusInd Bank Ltd. 1.83% Yes Bank Ltd. 0.29% Construction Project 4.23%• Larsen & Toubro Ltd. 4.23% Consumer Non Durables 10.90%• ITC Ltd. 5.48%• Hindustan Unilever Ltd. 3.52% Asian Paints Ltd. 1.91% Ferrous Metals 0.69% Tata Steel Ltd. 0.69% Finance 11.77%• HDFC Ltd. 9.71% Bajaj Finance Ltd. 2.06% Non - Ferrous Metals 0.68% Vedanta Ltd. 0.68% Oil 0.88% Oil & Natural Gas Corporation Ltd. 0.88% Petroleum Products 10.31%• Reliance Industries Ltd. 10.31% Pharmaceuticals 1.27% Sun Pharmaceutical Industries Ltd. 1.27% Power 2.41% Power Grid Corporation Of India Ltd. 1.21%
Fund Managers :
Indicative Investment Horizon: 5 yearsand above
Inception/Allotment date: 21-Sep-2017
Application Amount for freshSubscription :Rs.5,000 (plus in multiples of Re.1)
Min.Addl.Investment :Rs.1,000 (plus in multiples of Re.1)
Exit load for Redemption / Switchout :- Lumpsum & SIP / STP / SWP OptionNot Applicable
SIP :##
Daily, Weekly, Fortnightly & Monthly Frequency : Rs. 100/-(plus in multiple of Re. 1/-) Minimum installments: 6 Quarterly Frequency : Rs. 5,000/- (plus in multiple of Re. 1/-) Minimum installments - 4
&&SWP :Rs. 500/- (plus in multiples of Re. 1/-)
STP/ Flex STP/ Value STP * :Daily Frequency: Rs. 250/- and in multiples of Rs. 1/-Weekly, Monthly and Quarterly Frequency: Rs. 1,000/- and in multiples of Rs. 1/-
Min.Redemption Amt. :Rs. 500/- or all units where amount is below Rs. 500/-
Monthly AAUM as on 31-Aug-19 : Rs. 26.57 crores
Closing AUM as on 31-Aug-19 : Rs. 28.49 crores
Entry load : Not Applicable
Options :Growth & Dividend(dividend payout*** and re-investment facility available)
Dividend History : Refer page no. from 132 to 140
SIP Returns : Refer page no. from 128 to 130
Total Expense Ratio @@ :
IPSIF : 0.30% p. a.
IPSIF Direct Plan : 0.10% p. a.
Investment Objective : Refer page no. from 141 to 145
Kayzad Eghlim (Managing this fund since Sept 2017 & Overall 29 Years of experience)
NAV (As on 30-Aug-19):IPSIF Growth Option : 11.6284IPSIF Dividend Option : 11.6284IPSIF Direct Plan Growth Option : 11.6843IPSIF Direct Plan Dividend Option : 11.6843
Portfolio as on August 31, 2019
NTPC Ltd. 1.20% Software 16.99%• Infosys Ltd. 8.10%• Tata Consultancy Services Ltd. 6.21% HCL Technologies Ltd. 1.56% Tech Mahindra Ltd. 1.12% Telecom - Services 1.54% Bharti Airtel Ltd. 1.54% Short Term Debt and net current assets 0.76% Total Net Assets 100.00%
Company/Issuer % to NAV
Returns of ICICI Prudential Sensex Index Fund - Growth Option as on August 31, 2019 - ( )IPSIF
Notes:1. Different plans shall have different expense structure. The performance details provided herein are of . ICICI Prudential Sensex Index Fund2. The scheme is currently managed by Kayzad Eghlim. Mr. Kayzad Eghlim has been managing this fund since inception. Total Schemes managed by the Fund Manager 17 (2 are jointly managed) Refer annexure from page no. 109 for performance of other schemes currently managed by Kayzad Eghlim. is .3. Date of inception:21-Sep-17.4. As the Scheme has completed more than 1 year but less than 3 years, the performance details of only since inception and 1 year are provided herein.5. Past performance may or may not be sustained in future and the same may not necessarily provide the basis for comparison with other investment.6. Load is not considered for computation of returns.7. In case, the start/end date of the concerned period is a nonbusiness date (NBD), the NAV of the previous date is considered for computation of returns. The NAV per unit shown in the table is as on the start date of the said period8. The performance of the scheme is benchmarked to the Total Return variant of the Index.
Scheme
Nifty 50 TRI (Additional Benchmark)
NAV (Rs.) Per Unit (as onAugust 30,2019 : 11.6284)
CAGR (%)
10.00
S&P BSE SENSEX TRI (Benchmark)
Since inception
CurrentValue of
Investment of Rs. 10000
CAGR (%) Current Value of
Investment of Rs. 10000
1 Year 3 Year 5 Year
CAGR (%) Current Value of
Investment of Rs. 10000
CAGR (%) Current Value of
Investment of Rs. 10000
11.9618 - -
Particulars
-2.79 9721.28 - - - - 8.09 11628.40
-2.14 9786.66 - - - - 8.96 11811.35
-4.37 9564.51 - - - - 5.94 11183.40
Tracking Error : 0.39%
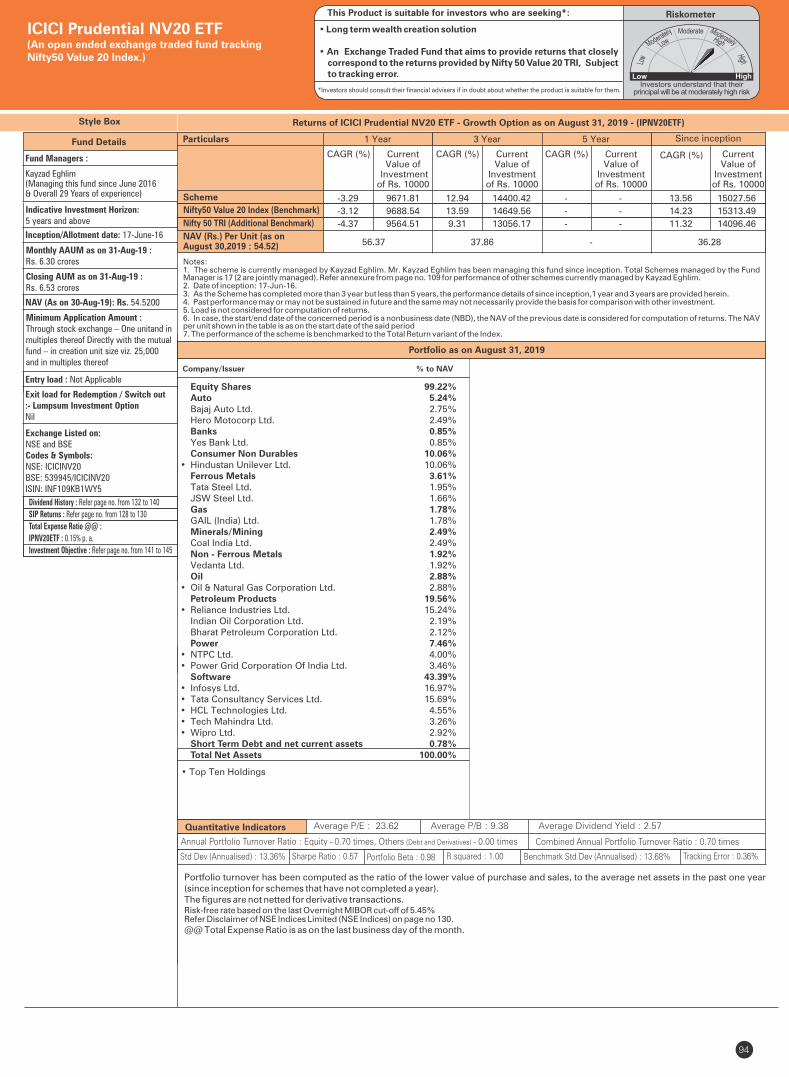
94
Style Box
RiskometerThis Product is suitable for investors who are seeking*:
• Long term wealth creation solution
• An Exchange Traded Fund that aims to provide returns that closely correspond to the returns provided by Nifty 50 Value 20 TRI, Subject to tracking error.
*Investors should consult their financial advisers if in doubt about whether the product is suitable for them.
Portfolio turnover has been computed as the ratio of the lower value of purchase and sales, to the average net assets in the past one year (since inception for schemes that have not completed a year). The figures are not netted for derivative transactions.Risk-free rate based on the last Overnight MIBOR cut-off of 5.45%Refer Disclaimer of NSE Indices Limited (NSE Indices) on page no 130.
@@ Total Expense Ratio is as on the last business day of the month.
Quantitative Indicators Average P/E : 23.62 Average P/B : 9.38 Average Dividend Yield : 2.57
• Top Ten Holdings
Annual Portfolio Turnover Ratio : Equity - 0.70 times, Others (Debt and Derivatives) - 0.00 times Combined Annual Portfolio Turnover Ratio : 0.70 times
ICICI Prudential NV20 ETF(An open ended exchange traded fund tracking Nifty50 Value 20 Index.)
Company/Issuer % to NAV
Equity Shares 99.22% Auto 5.24% Bajaj Auto Ltd. 2.75% Hero Motocorp Ltd. 2.49% Banks 0.85% Yes Bank Ltd. 0.85% Consumer Non Durables 10.06%• Hindustan Unilever Ltd. 10.06% Ferrous Metals 3.61% Tata Steel Ltd. 1.95% JSW Steel Ltd. 1.66% Gas 1.78% GAIL (India) Ltd. 1.78% Minerals/Mining 2.49% Coal India Ltd. 2.49% Non - Ferrous Metals 1.92% Vedanta Ltd. 1.92% Oil 2.88%• Oil & Natural Gas Corporation Ltd. 2.88% Petroleum Products 19.56%• Reliance Industries Ltd. 15.24% Indian Oil Corporation Ltd. 2.19% Bharat Petroleum Corporation Ltd. 2.12% Power 7.46%• NTPC Ltd. 4.00%• Power Grid Corporation Of India Ltd. 3.46% Software 43.39%• Infosys Ltd. 16.97%• Tata Consultancy Services Ltd. 15.69%• HCL Technologies Ltd. 4.55%• Tech Mahindra Ltd. 3.26%• Wipro Ltd. 2.92% Short Term Debt and net current assets 0.78% Total Net Assets 100.00%
Fund Details
Fund Managers :
Kayzad Eghlim (Managing this fund since June 2016 & Overall 29 Years of experience)
Indicative Investment Horizon: 5 years and above
Inception/Allotment date: 17-June-16
Monthly AAUM as on 31-Aug-19 : Rs. 6.30 crores
Closing AUM as on 31-Aug-19 : Rs. 6.53 crores
NAV (As on 30-Aug-19): Rs. 54.5200
Minimum Application Amount :Through stock exchange – One unitand in multiples thereof Directly with the mutual fund – in creation unit size viz. 25,000 and in multiples thereof
Exit load for Redemption / Switch out:- Lumpsum Investment OptionNil
Exchange Listed on:NSE and BSECodes & Symbols:NSE: ICICINV20BSE: 539945/ICICINV20ISIN: INF109KB1WY5
Entry load : Not Applicable
Dividend History : Refer page no. from 132 to 140
SIP Returns : Refer page no. from 128 to 130
Total Expense Ratio @@ :
IPNV20ETF : 0.15% p. a.
Investment Objective : Refer page no. from 141 to 145
Notes:1. The scheme is currently managed by Kayzad Eghlim. Mr. Kayzad Eghlim has been managing this fund since inception. Total Schemes managed by the Fund Manager is 17 (2 are jointly managed). Refer annexure from page no. 109 for performance of other schemes currently managed by Kayzad Eghlim.2. Date of inception: 17-Jun-16.3. As the Scheme has completed more than 3 year but less than 5 years, the performance details of since inception,1 year and 3 years are provided herein.4. Past performance may or may not be sustained in future and the same may not necessarily provide the basis for comparison with other investment.5. Load is not considered for computation of returns.6. In case, the start/end date of the concerned period is a nonbusiness date (NBD), the NAV of the previous date is considered for computation of returns. The NAV per unit shown in the table is as on the start date of the said period7. The performance of the scheme is benchmarked to the Total Return variant of the Index.
Scheme
Nifty 50 TRI (Additional Benchmark)
NAV (Rs.) Per Unit (as on August 30,2019 : 54.52)
CAGR (%)
36.28
Nifty50 Value 20 Index (Benchmark)
Since inception
CurrentValue of
Investment of Rs. 10000
CAGR (%) Current Value of
Investment of Rs. 10000
1 Year 3 Year 5 Year
CAGR (%) Current Value of
Investment of Rs. 10000
CAGR (%) Current Value of
Investment of Rs. 10000
56.37 37.86 -
Particulars
-3.29 9671.81 12.94 14400.42 - - 13.56 15027.56
-3.12 9688.54 13.59 14649.56 - - 14.23 15313.49
-4.37 9564.51 9.31 13056.17 - - 11.32 14096.46
Portfolio as on August 31, 2019
Returns of ICICI Prudential NV20 ETF - Growth Option as on August 31, 2019 - ( )IPNV20ETF
Std Dev (Annualised) : 13.36% Sharpe Ratio : 0.57 Portfolio Beta : 0.98 R squared : 1.00 Tracking Error : 0.36%Benchmark Std Dev (Annualised) : 13.68%

95
Fund Details
Quantitative Indicators
Fund Managers :
Kayzad Eghlim(Managing this fund since August 09 &Overall 29 Years of experience)
Indicative Investment Horizon: 5 years and above
Inception/Allotment date: 10-Jan-03
Monthly AAUM as on 31-Aug-19 : Rs. 21.98 crores
Closing AUM as on 31-Aug-19 : Rs. 23.06 crores
NAV (As on 30-Aug-19): Rs. 397.1416
Minimum application amount for buy/sale of units:Through Stock Exchange - One unitDirectly with the mutual fund - in creationunit size viz. 10,000 units and in multiplesthereof
*Exit load for Redemption / Switch out:- Lumpsum Investment OptionNil
Exchange Listed on:NSE and BSECodes & Symbols:NSE : ICICISENSXBSE : 555555/ICICISENSXISIN : INF346A01034
Portfolio turnover has been computed as the ratio of the lower value of purchase and sales, to the average net assets in the past one year (since inception for schemes that have not completed a year). The figures are not netted for derivative transactions.Risk-free rate based on the last Overnight MIBOR cut-off of 5.45%Refer Disclaimer of NSE and BSE on page no. 130.
Refer Disclaimer of Asia Index Private Limited (AIPL) on page no. 130.@@ Total Expense Ratio is as on the last business day of the month.
Std Dev (Annualised) : 12.53% Sharpe Ratio : 0.44
Average P/E : 32.60 Average P/BV : 6.20 Average Dividend Yield : 1.26
Portfolio Beta : 0.98 R squared : 1.00
• Top Ten Holdings
Portfolio as on August 31, 2019
Returns of ICICI Prudential Sensex ETF - Growth Option as on - (IPSETF)August 31, 2019
Equity Shares 98.10%
Auto 5.81%
Maruti Suzuki India Ltd. 2.08%
Mahindra & Mahindra Ltd. 1.27%
Bajaj Auto Ltd. 0.98%
Hero Motocorp Ltd. 0.86%
Tata Motors Ltd. 0.55%
Tata Motors Ltd. - DVR 0.07%
Banks 31.25%
• HDFC Bank Ltd. 12.34%
• ICICI Bank Ltd. 6.79%
• Kotak Mahindra Bank Ltd. 4.36%
Axis Bank Ltd. 3.03%
State Bank Of India 2.65%
IndusInd Bank Ltd. 1.81%
Yes Bank Ltd. 0.28%
Construction Project 4.17%
• Larsen & Toubro Ltd. 4.17%
Consumer Non Durables 10.74%
• ITC Ltd. 5.40%
• Hindustan Unilever Ltd. 3.46%
Asian Paints Ltd. 1.88%
Ferrous Metals 0.68%
Tata Steel Ltd. 0.68%
Finance 11.62%
• HDFC Ltd. 9.60%
Bajaj Finance Ltd. 2.03%
Non - Ferrous Metals 0.67%
Vedanta Ltd. 0.67%
Oil 0.87%
Oil & Natural Gas Corporation Ltd. 0.87%
Petroleum Products 10.40%
• Reliance Industries Ltd. 10.40%
Pharmaceuticals 1.25%
Sun Pharmaceutical Industries Ltd. 1.25%
Power 2.37%
Power Grid Corporation Of India Ltd. 1.19%
NTPC Ltd. 1.18%
Software 16.75%
• Infosys Ltd. 7.99%
• Tata Consultancy Services Ltd. 6.12%
HCL Technologies Ltd. 1.54%
Tech Mahindra Ltd. 1.11%
Telecom - Services 1.52%
Bharti Airtel Ltd. 1.52%
Short Term Debt and net current assets 1.90%
Total Net Assets 100.00%
Tracking error : 0.15%
* Exit Load : Investors, other than Authorised Participants, can sell units in less than Creation Unit Size of the Scheme directly to the Mutual Fund in the following cases:• if the traded price of the ETF units is at a discount of more than 3% to the NAV for continuous 30 days; or • if discount of bid price to applicable NAV is more than 3% over a period of 7 consecutive trading days; or• if no quotes are available on exchange for 3 consecutive trading days; or• when the total bid size on the exchange(s) is less than half of creation unit size daily, averaged over a period of 7 consecutive trading days.Under these circumstances, investors, as specified above, can redeem units of the Scheme directly with the fund house without any payment of exit load.
ICICI Prudential Sensex ETFAn open ended Exchange Traded Fund tracking S&P BSESensex Index.
Tracking Error : 0.15%Benchmark Std Dev (Annualised) : 12.79%
Entry load : Not Applicable
RiskometerThis Product is suitable for investors who are seeking*:
• Long term wealth creation solution
• An Exchange Traded Fund that aims to provide returns that closely correspond to the returns of the securities represented by S&P BSE SENSEX TRI, subject to tracking error.
*Investors should consult their financial advisers if in doubt about whether the product is suitable for them.
Annual Portfolio Turnover Ratio : Equity - 0.34 times, Others (Debt and Derivatives) - 0.00 times Combined Annual Portfolio Turnover Ratio : 0.34 times
Company/Issuer % to NAV Company/Issuer % to NAV
Dividend History : Refer page no. from 132 to 140
SIP Returns : Refer page no. from 128 to 130
Total Expense Ratio @@ :
IPSETF : 0.08% p. a.
Investment Objective : Refer page no. from 141 to 145
Notes:1. The scheme is currently managed by Kayzad Eghlim. Mr. Kayzad Eghlim has been managing this fund since Aug 09. Total Schemes managed by the Fund Manager is 17 (2 are jointly managed). Refer annexure from page no. 109 for performance of other schemes currently managed by Kayzad Eghlim.2. Date of inception:10-Jan-03.3. Past performance may or may not be sustained in future and the same may not necessarily provide the basis for comparison with other investment.4. Load is not considered for computation of returns.5. In case, the start/end date of the concerned period is a nonbusiness date (NBD), the NAV of the previous date is considered for computation of returns. The NAV per unit shown in the table is as on the start date of the said period6. The performance of the scheme is benchmarked to the Total Return variant of the Index.
Scheme
Nifty 50 TRI (Additional Benchmark)
NAV (Rs.) Per Unit (as on August 30,2019 : 397.1416)
CAGR (%)
33.59
S&P BSE SENSEX TRI (Benchmark)
Since inception
CurrentValue of
Investment of Rs. 10000
CAGR (%) Current Value of
Investment of Rs. 10000
1 Year 3 Year 5 Year
CAGR (%) Current Value of
Investment of Rs. 10000
CAGR (%) Current Value of
Investment of Rs. 10000
293.0027 267.7590
Particulars
-2.06 9794.83 10.68 13554.20 8.19 14832.05 16.68 130412.81
-2.14 9786.66 10.86 13621.43 8.39 14968.17 17.35 143355.08
-4.37 9564.51 9.31 13056.17 8.09 14765.89 16.60 128997.38
405.4606

96
Style Box
RiskometerThis Product is suitable for investors who are seeking*:
• Long term wealth creation solution
• An Exchange Traded Fund that seeks to provide returns that closely correspond to the returns provided by S&P BSE Midcap Select TRI, Subject to tracking error.
*Investors should consult their financial advisers if in doubt about whether the product is suitable for them.
Portfolio turnover has been computed as the ratio of the lower value of purchase and sales, to the average net assets in the past one year (since inception for schemes that have not completed a year). The figures are not netted for derivative transactions.Risk-free rate based on the last Overnight MIBOR cut-off of 5.45%
Refer Disclaimer of Asia Index Private Limited (AIPL) on page no. 130.Refer Disclaimer of NSE and BSE on page no. 130.
@@ Total Expense Ratio is as on the last business day of the month.
Quantitative Indicators Average P/E : 29.92 Average P/BV : 5.63 Average Dividend Yield : 1.15
• Top Ten Holdings
Annual Portfolio Turnover Ratio : Equity - 0.28 times, Others (Debt and Derivatives) - 0.00 times Combined Annual Portfolio Turnover Ratio : 0.28 times
ICICI Prudential Midcap Select ETF(An open ended exchange traded fund tracking S&P BSEMidcap Select Index.)
Equity Shares 99.50% Auto 2.12% TVS Motor Company Ltd. 2.12% Auto Ancillaries 7.76% MRF Ltd. 3.48% Exide Industries Ltd. 2.47% Balkrishna Industries Ltd. 1.81% Banks 8.06%• The Federal Bank Ltd. 4.95% RBL Bank Ltd. 3.11% Cement 2.75% The Ramco Cements Ltd. 2.75% Chemicals 3.09% Tata Chemicals Ltd. 3.09% Consumer Durables 15.21%• Havells India Ltd. 5.09%• Voltas Ltd. 4.37% Rajesh Exports Ltd. 2.88% Crompton Greaves Consumer Electricals Ltd. 2.87% Consumer Non Durables 8.53%• Colgate - Palmolive (India) Ltd. 5.07% Tata Global Beverages Ltd. 3.45% Finance 15.73%• Shriram Transport Finance Company Ltd. 4.23%• LIC Housing Finance Ltd. 3.85% Cholamandalam Investment And Finance Company Ltd. 2.99% Mahindra & Mahindra Financial Services Ltd. 2.88% Edelweiss Financial Services Ltd. 1.79% Gas 3.51%• Indraprastha Gas Ltd. 3.51% Healthcare Services 4.06%• Apollo Hospitals Enterprise Ltd. 4.06% Industrial Products 5.25% Bharat Forge Ltd. 2.91% Cummins India Ltd. 2.34% Pharmaceuticals 10.92%• Divi's Laboratories Ltd. 6.22% Biocon Ltd. 2.97%
Fund Details
Fund Managers :
Kayzad Eghlim (Managing this fund since July 2016 & Overall 29 Years of experience)
Indicative Investment Horizon: 5 years and above
Inception/Allotment date: 04-July-16
Monthly AAUM as on 31-Aug-19 : Rs. 32.35 crores
Closing AUM as on 31-Aug-19 : Rs. 33.12 crores
NAV (As on 30-Aug-19): Rs. 59.3100
Minimum Application Amount :Through stock exchange – One unit and in multiples thereof Directly with the mutual fund – in creation unit size viz. 50,000 andin multiples thereof
Exit load for Redemption / Switch out:- Lumpsum Investment OptionNil
Exchange Listed on:NSE and BSECodes & Symbols:NSE: ICICIMCAPBSE: 539980/ICICIMCAPISIN: INF109KB1XT3
Entry load : Not Applicable
Dividend History : Refer page no. from 132 to 140
SIP Returns : Refer page no. from 128 to 130
Total Expense Ratio @@ :
IPMSETF : 0.47% p. a.
Investment Objective : Refer page no. from 141 to 145
Portfolio as on August 31, 2019
Company/Issuer % to NAV Company/Issuer % to NAV
Glenmark Pharmaceuticals Ltd. 1.73% Power 3.11% Tata Power Company Ltd. 3.11% Software 2.01% Oracle Financial Services Software Ltd. 2.01% Textile Products 3.18% Page Industries Ltd. 3.18% Transportation 4.21%• Container Corporation Of India Ltd. 4.21% Short Term Debt and net current assets 0.50% Total Net Assets 100.00%
Returns of ICICI Prudential Midcap Select ETF - Growth Option as on August 31, 2019 - ( )IPMSETF
Notes:1. The scheme is currently managed by Kayzad Eghlim. Mr. Kayzad Eghlim has been managing this fund since Jul 2016. Total Schemes managed by the Fund Manager is 17 (2 are jointly managed). Refer annexure from page no. 109 for performance of other schemes currently managed by Kayzad Eghlim.2. Date of inception:04-Jul-16.3. As the Scheme has completed more than 3 year but less than 5 years, the performance details of since inception,1 year and 3 years are provided herein.4. Past performance may or may not be sustained in future and the same may not necessarily provide the basis for comparison with other investment.5. Load is not considered for computation of returns.6. In case, the start/end date of the concerned period is a nonbusiness date (NBD), the NAV of the previous date is considered for computation of returns. The NAV per unit shown in the table is as on the start date of the said period7. The performance of the scheme is benchmarked to the Total Return variant of the Index.
Scheme
Nifty 50 TRI (Additional Benchmark)
NAV (Rs.) Per Unit (as on August 30,2019 : 59.31)
CAGR (%)
50.58
S&P BSE Midcap Select TRI (Benchmark)
Since inception
CurrentValue of
Investment of Rs. 10000
CAGR (%) Current Value of
Investment of Rs. 10000
1 Year 3 Year 5 Year
CAGR (%) Current Value of
Investment of Rs. 10000
CAGR (%) Current Value of
Investment of Rs. 10000
72.42 57.05 -
Particulars
-18.15 8189.73 1.30 10396.14 - - 5.17 11725.98
-17.98 8206.40 1.92 10587.30 - - 5.86 11969.29
-4.37 9564.51 9.31 13056.17 - - 10.61 13745.52
Tracking Error : 0.36%
Std Dev (Annualised) : 16.67% Sharpe Ratio : -0.17 Portfolio Beta : 0.99 R squared : 1.00 Benchmark Std Dev (Annualised) : 16.82%
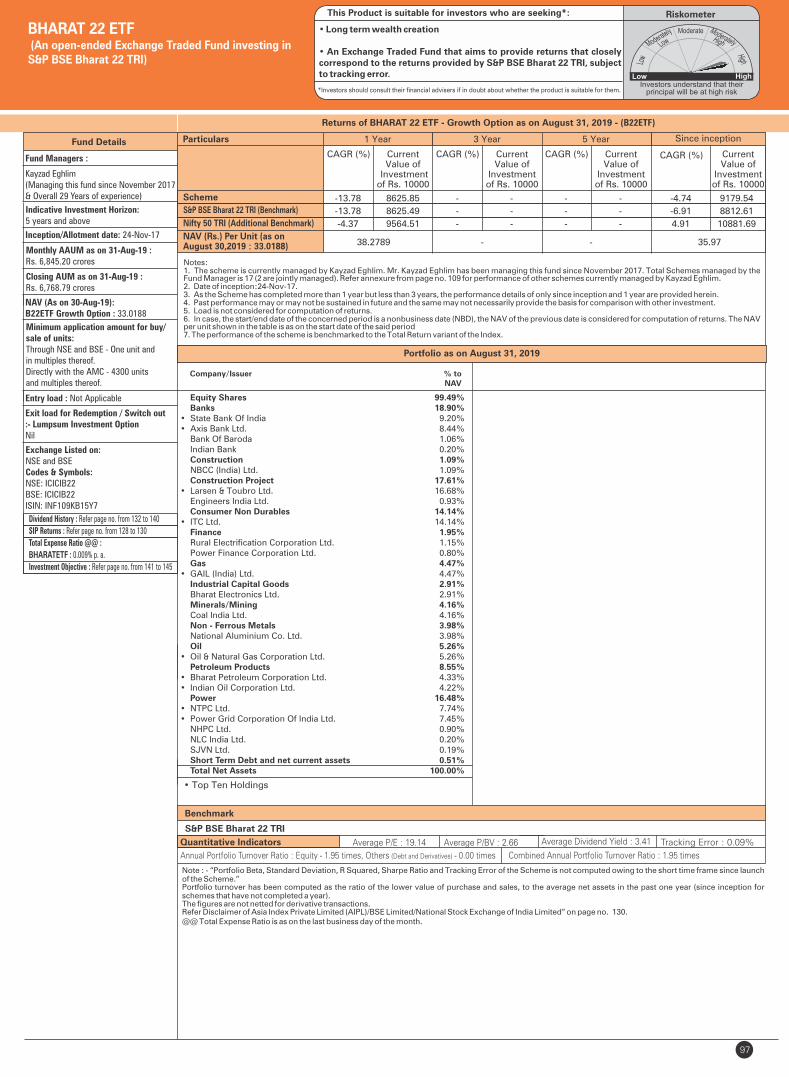
97
BHARAT 22 ETF (An open-ended Exchange Traded Fund investing in S&P BSE Bharat 22 TRI)
RiskometerThis Product is suitable for investors who are seeking*:
• Long term wealth creation
• An Exchange Traded Fund that aims to provide returns that closely correspond to the returns provided by S&P BSE Bharat 22 TRI, subject to tracking error.
*Investors should consult their financial advisers if in doubt about whether the product is suitable for them.
Benchmark
S&P BSE Bharat 22 TRI
Fund Details
Fund Managers :
Kayzad Eghlim (Managing this fund since November 2017 & Overall 29 Years of experience)
Indicative Investment Horizon: 5 years and above
Inception/Allotment date: 24-Nov-17
Monthly AAUM as on 31-Aug-19 : Rs. 6,845.20 crores
Closing AUM as on 31-Aug-19 : Rs. 6,768.79 crores
NAV (As on 30-Aug-19):B22ETF Growth Option : 33.0188
Minimum application amount for buy/sale of units:Through NSE and BSE - One unit and in multiples thereof.Directly with the AMC - 4300 units and multiples thereof.
Exit load for Redemption / Switch out:- Lumpsum Investment OptionNil
Exchange Listed on:NSE and BSECodes & Symbols:NSE: ICICIB22BSE: ICICIB22 ISIN: INF109KB15Y7
Entry load : Not Applicable
Dividend History : Refer page no. from 132 to 140
SIP Returns : Refer page no. from 128 to 130
Total Expense Ratio @@ :
: 0.009% p. a.BHARATETF
Investment Objective : Refer page no. from 141 to 145
Quantitative Indicators Average P/E : 19.14 Average P/BV : 2.66 Average Dividend Yield : 3.41
Note : - “Portfolio Beta, Standard Deviation, R Squared, Sharpe Ratio and Tracking Error of the Scheme is not computed owing to the short time frame since launch of the Scheme.”Portfolio turnover has been computed as the ratio of the lower value of purchase and sales, to the average net assets in the past one year (since inception for schemes that have not completed a year). The figures are not netted for derivative transactions.Refer Disclaimer of Asia Index Private Limited (AIPL)/BSE Limited/National Stock Exchange of India Limited” on page no. 130.@@ Total Expense Ratio is as on the last business day of the month.
Annual Portfolio Turnover Ratio : Equity - 1.95 times, Others (Debt and Derivatives) - 0.00 times Combined Annual Portfolio Turnover Ratio : 1.95 times
• Top Ten Holdings
Equity Shares 99.49% Banks 18.90%• State Bank Of India 9.20%• Axis Bank Ltd. 8.44% Bank Of Baroda 1.06% Indian Bank 0.20% Construction 1.09% NBCC (India) Ltd. 1.09% Construction Project 17.61%• Larsen & Toubro Ltd. 16.68% Engineers India Ltd. 0.93% Consumer Non Durables 14.14%• ITC Ltd. 14.14% Finance 1.95% Rural Electrification Corporation Ltd. 1.15% Power Finance Corporation Ltd. 0.80% Gas 4.47%• GAIL (India) Ltd. 4.47% Industrial Capital Goods 2.91% Bharat Electronics Ltd. 2.91% Minerals/Mining 4.16% Coal India Ltd. 4.16% Non - Ferrous Metals 3.98% National Aluminium Co. Ltd. 3.98% Oil 5.26%• Oil & Natural Gas Corporation Ltd. 5.26% Petroleum Products 8.55%• Bharat Petroleum Corporation Ltd. 4.33%• Indian Oil Corporation Ltd. 4.22% Power 16.48%• NTPC Ltd. 7.74%• Power Grid Corporation Of India Ltd. 7.45% NHPC Ltd. 0.90% NLC India Ltd. 0.20% SJVN Ltd. 0.19% Short Term Debt and net current assets 0.51% Total Net Assets 100.00%
Company/Issuer % to NAV
Returns of BHARAT 22 ETF - Growth Option as on August 31, 2019 - ( )B22ETF
Notes:1. The scheme is currently managed by Kayzad Eghlim. Mr. Kayzad Eghlim has been managing this fund since November 2017. Total Schemes managed by the Fund Manager is 17 (2 are jointly managed). Refer annexure from page no. 109 for performance of other schemes currently managed by Kayzad Eghlim.2. Date of inception:24-Nov-17.3. As the Scheme has completed more than 1 year but less than 3 years, the performance details of only since inception and 1 year are provided herein.4. Past performance may or may not be sustained in future and the same may not necessarily provide the basis for comparison with other investment.5. Load is not considered for computation of returns.6. In case, the start/end date of the concerned period is a nonbusiness date (NBD), the NAV of the previous date is considered for computation of returns. The NAV per unit shown in the table is as on the start date of the said period7. The performance of the scheme is benchmarked to the Total Return variant of the Index.
Scheme
Nifty 50 TRI (Additional Benchmark)
NAV (Rs.) Per Unit (as onAugust 30,2019 : 33.0188)
CAGR (%)
35.97
S&P BSE Bharat 22 TRI (Benchmark)
Since inception
CurrentValue of
Investment of Rs. 10000
CAGR (%) Current Value of
Investment of Rs. 10000
1 Year 3 Year 5 Year
CAGR (%) Current Value of
Investment of Rs. 10000
CAGR (%) Current Value of
Investment of Rs. 10000
38.2789 - -
Particulars
-13.78 8625.85 - - - - -4.74 9179.54
-13.78 8625.49 - - - - -6.91 8812.61
-4.37 9564.51 - - - - 4.91 10881.69
Portfolio as on August 31, 2019
Tracking Error : 0.09%
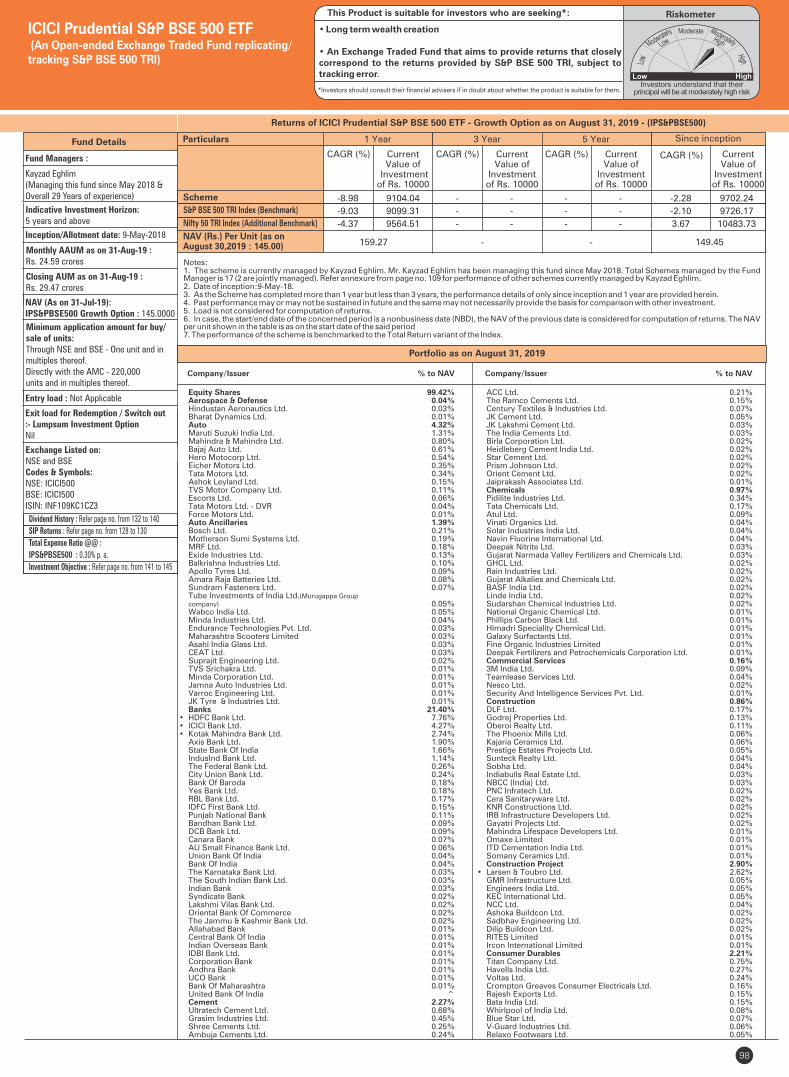
ICICI Prudential S&P BSE 500 ETF (An Open-ended Exchange Traded Fund replicating/ tracking S&P BSE 500 TRI)
RiskometerThis Product is suitable for investors who are seeking*:
• Long term wealth creation
• An Exchange Traded Fund that aims to provide returns that closely correspond to the returns provided by S&P BSE 500 TRI, subject to tracking error.
*Investors should consult their financial advisers if in doubt about whether the product is suitable for them.
Company/Issuer % to NAV
Fund Details
Fund Managers :
Kayzad Eghlim (Managing this fund since May 2018 & Overall 29 Years of experience)
Indicative Investment Horizon: 5 years and above
Inception/Allotment date: 9-May-2018
Monthly AAUM as on 31-Aug-19 : Rs. 24.59 crores
Closing AUM as on 31-Aug-19 : Rs. 29.47 crores
NAV (As on 31-Jul-19):IPS&PBSE500 Growth Option : 145.0000
Minimum application amount for buy/sale of units:Through NSE and BSE - One unit and in multiples thereof.Directly with the AMC - 220,000 units and in multiples thereof.
Exit load for Redemption / Switch out:- Lumpsum Investment OptionNil
Exchange Listed on:NSE and BSECodes & Symbols:NSE: ICICI500BSE: ICICI500ISIN: INF109KC1CZ3
Entry load : Not Applicable
Dividend History : Refer page no. from 132 to 140
SIP Returns : Refer page no. from 128 to 130
Total Expense Ratio @@ :
IPS&PBSE500 : 0.30% p. a.
Investment Objective : Refer page no. from 141 to 145
Equity Shares 99.42% Aerospace & Defense 0.04% Hindustan Aeronautics Ltd. 0.03% Bharat Dynamics Ltd. 0.01% Auto 4.32% Maruti Suzuki India Ltd. 1.31% Mahindra & Mahindra Ltd. 0.80% Bajaj Auto Ltd. 0.61% Hero Motocorp Ltd. 0.54% Eicher Motors Ltd. 0.35% Tata Motors Ltd. 0.34% Ashok Leyland Ltd. 0.15% TVS Motor Company Ltd. 0.11% Escorts Ltd. 0.06% Tata Motors Ltd. - DVR 0.04% Force Motors Ltd. 0.01% Auto Ancillaries 1.39% Bosch Ltd. 0.21% Motherson Sumi Systems Ltd. 0.19% MRF Ltd. 0.18% Exide Industries Ltd. 0.13% Balkrishna Industries Ltd. 0.10% Apollo Tyres Ltd. 0.09% Amara Raja Batteries Ltd. 0.08% Sundram Fasteners Ltd. 0.07% Tube Investments of India Ltd.(Murugappa Group company) 0.05% Wabco India Ltd. 0.05% Minda Industries Ltd. 0.04% Endurance Technologies Pvt. Ltd. 0.03% Maharashtra Scooters Limited 0.03% Asahi India Glass Ltd. 0.03% CEAT Ltd. 0.03% Suprajit Engineering Ltd. 0.02% TVS Srichakra Ltd. 0.01% Minda Corporation Ltd. 0.01% Jamna Auto Industries Ltd. 0.01% Varroc Engineering Ltd. 0.01% JK Tyre & Industries Ltd. 0.01% Banks 21.40%• HDFC Bank Ltd. 7.76%• ICICI Bank Ltd. 4.27%• Kotak Mahindra Bank Ltd. 2.74% Axis Bank Ltd. 1.90% State Bank Of India 1.66% IndusInd Bank Ltd. 1.14% The Federal Bank Ltd. 0.26% City Union Bank Ltd. 0.24% Bank Of Baroda 0.18% Yes Bank Ltd. 0.18% RBL Bank Ltd. 0.17% IDFC First Bank Ltd. 0.15% Punjab National Bank 0.11% Bandhan Bank Ltd. 0.09% DCB Bank Ltd. 0.09% Canara Bank 0.07% AU Small Finance Bank Ltd. 0.06% Union Bank Of India 0.04% Bank Of India 0.04% The Karnataka Bank Ltd. 0.03% The South Indian Bank Ltd. 0.03% Indian Bank 0.03% Syndicate Bank 0.02% Lakshmi Vilas Bank Ltd. 0.02% Oriental Bank Of Commerce 0.02% The Jammu & Kashmir Bank Ltd. 0.02% Allahabad Bank 0.01% Central Bank Of India 0.01% Indian Overseas Bank 0.01% IDBI Bank Ltd. 0.01% Corporation Bank 0.01% Andhra Bank 0.01% UCO Bank 0.01% Bank Of Maharashtra 0.01% United Bank Of India ^ Cement 2.27% Ultratech Cement Ltd. 0.68% Grasim Industries Ltd. 0.45% Shree Cements Ltd. 0.25% Ambuja Cements Ltd. 0.24%
ACC Ltd. 0.21% The Ramco Cements Ltd. 0.15% Century Textiles & Industries Ltd. 0.07% JK Cement Ltd. 0.05% JK Lakshmi Cement Ltd. 0.03% The India Cements Ltd. 0.03% Birla Corporation Ltd. 0.02% Heidleberg Cement India Ltd. 0.02% Star Cement Ltd. 0.02% Prism Johnson Ltd. 0.02% Orient Cement Ltd. 0.02% Jaiprakash Associates Ltd. 0.01% Chemicals 0.97% Pidilite Industries Ltd. 0.34% Tata Chemicals Ltd. 0.17% Atul Ltd. 0.09% Vinati Organics Ltd. 0.04% Solar Industries India Ltd. 0.04% Navin Fluorine International Ltd. 0.04% Deepak Nitrite Ltd. 0.03% Gujarat Narmada Valley Fertilizers and Chemicals Ltd. 0.03% GHCL Ltd. 0.02% Rain Industries Ltd. 0.02% Gujarat Alkalies and Chemicals Ltd. 0.02% BASF India Ltd. 0.02% Linde India Ltd. 0.02% Sudarshan Chemical Industries Ltd. 0.02% National Organic Chemical Ltd. 0.01% Phillips Carbon Black Ltd. 0.01% Himadri Speciality Chemical Ltd. 0.01% Galaxy Surfactants Ltd. 0.01% Fine Organic Industries Limited 0.01% Deepak Fertilizers and Petrochemicals Corporation Ltd. 0.01% Commercial Services 0.16% 3M India Ltd. 0.09% Teamlease Services Ltd. 0.04% Nesco Ltd. 0.02% Security And Intelligence Services Pvt. Ltd. 0.01% Construction 0.86% DLF Ltd. 0.17% Godrej Properties Ltd. 0.13% Oberoi Realty Ltd. 0.11% The Phoenix Mills Ltd. 0.06% Kajaria Ceramics Ltd. 0.06% Prestige Estates Projects Ltd. 0.05% Sunteck Realty Ltd. 0.04% Sobha Ltd. 0.04% Indiabulls Real Estate Ltd. 0.03% NBCC (India) Ltd. 0.03% PNC Infratech Ltd. 0.02% Cera Sanitaryware Ltd. 0.02% KNR Constructions Ltd. 0.02% IRB Infrastructure Developers Ltd. 0.02% Gayatri Projects Ltd. 0.02% Mahindra Lifespace Developers Ltd. 0.01% Omaxe Limited 0.01% ITD Cementation India Ltd. 0.01% Somany Ceramics Ltd. 0.01% Construction Project 2.90%• Larsen & Toubro Ltd. 2.62% GMR Infrastructure Ltd. 0.05% Engineers India Ltd. 0.05% KEC International Ltd. 0.05% NCC Ltd. 0.04% Ashoka Buildcon Ltd. 0.02% Sadbhav Engineering Ltd. 0.02% Dilip Buildcon Ltd. 0.02% RITES Limited 0.01% Ircon International Limited 0.01% Consumer Durables 2.21% Titan Company Ltd. 0.75% Havells India Ltd. 0.27% Voltas Ltd. 0.24% Crompton Greaves Consumer Electricals Ltd. 0.16% Rajesh Exports Ltd. 0.15% Bata India Ltd. 0.15% Whirlpool of India Ltd. 0.08% Blue Star Ltd. 0.07% V-Guard Industries Ltd. 0.06% Relaxo Footwears Ltd. 0.05%
Company/Issuer % to NAV
98
Portfolio as on August 31, 2019
Returns of ICICI Prudential S&P BSE 500 ETF - Growth Option as on August 31, 2019 - ( )IPS&PBSE500
Notes:1. The scheme is currently managed by Kayzad Eghlim. Mr. Kayzad Eghlim has been managing this fund since May 2018. Total Schemes managed by the Fund Manager is 17 (2 are jointly managed). Refer annexure from page no. 109 for performance of other schemes currently managed by Kayzad Eghlim.2. Date of inception:9-May-18.3. As the Scheme has completed more than 1 year but less than 3 years, the performance details of only since inception and 1 year are provided herein.4. Past performance may or may not be sustained in future and the same may not necessarily provide the basis for comparison with other investment.5. Load is not considered for computation of returns.6. In case, the start/end date of the concerned period is a nonbusiness date (NBD), the NAV of the previous date is considered for computation of returns. The NAV per unit shown in the table is as on the start date of the said period7. The performance of the scheme is benchmarked to the Total Return variant of the Index.
Scheme
Nifty 50 TRI Index (Additional Benchmark)
NAV (Rs.) Per Unit (as on August 30,2019 : 145.00)
CAGR (%)
149.45
S&P BSE 500 TRI Index (Benchmark)
Since inception
CurrentValue of
Investment of Rs. 10000
CAGR (%) Current Value of
Investment of Rs. 10000
1 Year 3 Year 5 Year
CAGR (%) Current Value of
Investment of Rs. 10000
CAGR (%) Current Value of
Investment of Rs. 10000
159.27 - -
Particulars
-8.98 9104.04 - - - - -2.28 9702.24
-9.03 9099.31 - - - - -2.10 9726.17
-4.37 9564.51 - - - - 3.67 10483.73

Portfolio as on August 31, 2019
ICICI Prudential S&P BSE 500 ETF (An Open-ended Exchange Traded Fund replicating/ tracking S&P BSE 500 TRI)
RiskometerThis Product is suitable for investors who are seeking*:
• Long term wealth creation
• An Exchange Traded Fund that aims to provide returns that closely correspond to the returns provided by S&P BSE 500 TRI, subject to tracking error.
*Investors should consult their financial advisers if in doubt about whether the product is suitable for them.
Company/Issuer % to NAV
V.I.P. Industries Ltd. 0.05% TTK Prestige Ltd. 0.04% Symphony Ltd 0.03% Orient Electric Ltd. 0.03% Bajaj Electricals Ltd. 0.02% Johnson Controls -Hitachi Air Conditioning India Ltd. 0.02% Century Plyboards (India) Ltd. 0.01% Sheela Foam Ltd. 0.01% La Opala RG Ltd. 0.01% IFB Industries Ltd. 0.01% PC Jeweller Ltd. 0.01% Consumer Non Durables 11.08%• ITC Ltd. 3.39%• Hindustan Unilever Ltd. 2.17% Asian Paints Ltd. 1.18% Nestle India Ltd. 0.73% Britannia Industries Ltd. 0.51% Dabur India Ltd. 0.41% Godrej Consumer Products Ltd. 0.37% Marico Ltd. 0.33% Colgate - Palmolive (India) Ltd. 0.27% Tata Global Beverages Ltd. 0.19% Glaxosmithkline Consumer Healthcare Ltd. 0.15% United Breweries Ltd. 0.15% Procter & Gamble Hygiene and Health Care Ltd. 0.15% Berger Paints India Ltd. 0.14% Jubilant Foodworks Ltd. 0.14% Kansai Nerolac Paints Ltd. 0.10% Gillette India Ltd. 0.07% Varun Beverages Ltd. 0.07% Emami Ltd. 0.06% Godrej Industries Ltd. 0.06% Hatsun Agro Product Ltd. 0.04% Radico Khaitan Ltd. 0.04% DCM Shriram Ltd. 0.03% Akzo Nobel India Ltd. 0.03% Zydus Wellness Ltd.(Subsidiary of Cadila Healthcare Limited) 0.03% Jyothy Laboratories Ltd. 0.03% CCL Products (India) Ltd. 0.03% Bombay Burmah Trading Corporation Ltd. 0.03% Godfrey Phillips India Ltd. 0.02% Godrej Agrovet Ltd. 0.02% KRBL Ltd. 0.02% Avanti Feeds Ltd. 0.02% Bajaj Consumer Care Ltd. 0.02% Venkys (India) Ltd. 0.01% Heritage Foods (India) Ltd. 0.01% Coffee Day Enterprises Pvt. Ltd. (Secured by pledge of equity shares of Mindtree Ltd.) 0.01% Parag Milk Foods Ltd. 0.01% SH Kelkar & Co. Ltd. 0.01% Tata Coffee Ltd. 0.01% Advanced Enzyme Technologies Ltd. 0.01% Eveready Industries (India) Ltd. 0.01% Engineering Services 0.02% VA Tech Wabag Ltd. 0.02% Ferrous Metals 1.04% Tata Steel Ltd. 0.43% JSW Steel Ltd. 0.36% Jindal Steel & Power Ltd. 0.06% Steel Authority Of India Ltd. 0.05% APL Apollo Tubes Ltd. 0.03% Ratnamani Metals & Tubes Ltd. 0.02% Welspun Corp Ltd. 0.02% Maharashtra Seamless Limited 0.01% Jindal Saw Ltd. 0.01% Tata Metaliks Ltd. 0.01% Jindal Stainless (Hisar) Ltd. 0.01% Jindal Stainless Ltd. 0.01% Shankara Building Products Ltd ^ Fertilisers 0.17% Coromandel International Ltd. 0.07% Chambal Fertilisers & Chemicals Ltd. 0.04% Gujarat State Fertilizers and Chemicals Ltd. 0.03% EID Parry (India) Ltd. (Murugappa Group) 0.02% Rashtriya Chemicals and Fertilizers Ltd. 0.01% Finance 12.30%• HDFC Ltd. 6.03% Bajaj Finance Ltd. 1.27% Bajaj Finserv Ltd. 0.69% HDFC Standard Life Insurance Company Ltd. 0.29% Bajaj Holdings & Investment Ltd. 0.29% Indiabulls Housing Finance Ltd. 0.24% Shriram Transport Finance Company Ltd. 0.23% LIC Housing Finance Ltd. 0.21% ICICI Prudential Life Insurance Company Ltd. 0.21% Rural Electrification Corporation Ltd. 0.19% ICICI Lombard General Insurance Company Ltd. 0.18% SBI Life Insurance Company Ltd. 0.16% Cholamandalam Investment And Finance Company Ltd. 0.16% Mahindra & Mahindra Financial Services Ltd. 0.15% Power Finance Corporation Ltd. 0.15% Gruh Finance Ltd. 0.13% Max Financial Services Ltd. 0.11% HDFC Asset Management Company Ltd. 0.11% Muthoot Finance Ltd. 0.10% Edelweiss Financial Services Ltd. 0.10% L&T Finance Holdings Ltd. 0.09% Manappuram Finance Ltd. 0.09% Aditya Birla Capital Ltd. 0.08% General Insurance Corporation of India 0.07% Ti Financial Holdings Ltd. 0.07% IDFC Ltd. 0.07% Multi Commodity Exchange Of India Ltd. 0.07% Can Fin Homes Ltd. 0.06% Indiabulls Ventures Ltd. 0.06% Equitas Holdings Ltd. 0.05%
CRISIL Ltd. 0.05% Shriram City Union Finance Ltd. 0.05% Ujjivan Financial Services Ltd. 0.05% PNB Housing Finance Ltd. 0.04% Jm Financial Ltd. 0.04% The New India Assurance Company Ltd. 0.04% Aavas Financiers Ltd. 0.03% Motilal Oswal Financial Services Ltd. 0.03% Reliance Nippon Life Asset Management Ltd. 0.03% Credit Analysis And Research Ltd. 0.03% ICICI Securities Ltd. 0.02% Repco Home Finance Ltd. 0.02% JSW Holdings Ltd. 0.02% CreditAccess Grameen Ltd. 0.02% Indian Energy Exchange Ltd. 0.02% Magma Fincorp Ltd. 0.02% Tata Investment Corporation Ltd. 0.02% Dewan Housing Finance Corporation Ltd. 0.01% Indostar Capital Finance Ltd. 0.01% Housing & Urban Development Corporation Ltd. 0.01% MAS Financial Services Ltd. 0.01% GIC Housing Finance Ltd. 0.01% IFCI Ltd. 0.01% Centrum Capital Ltd. 0.01% Reliance Capital Ltd. 0.01% SREI Infrastructure Finance Ltd. ^ Gas 1.17% GAIL (India) Ltd. 0.37% Petronet LNG Ltd. 0.32% Indraprastha Gas Ltd. 0.19% Gujarat State Petronet Ltd. 0.10% Adani Gas Limited 0.06% Gujarat Gas Ltd. 0.04% Mahanagar Gas Ltd. 0.04% Aegis Logistics Ltd. 0.04% Healthcare Services 0.44% Apollo Hospitals Enterprise Ltd. 0.22% Fortis Healthcare Ltd. 0.09% Dr Lal Pathlabs Ltd. 0.07% Narayana Hrudayalaya Ltd. 0.02% Aster DM Healthcare Ltd. 0.02% Max India Ltd. 0.01% Thyrocare Technologies Ltd. 0.01% Hotels, Resorts And Other Recreational Activities 0.31% The Indian Hotels Company Ltd. 0.16% EIH Ltd. 0.05% Delta Corp Ltd. 0.05% Westlife Development Ltd. 0.03% Lemon Tree Hotels Ltd. 0.02% Mahindra Holidays and Resorts India Ltd. 0.01% India Tourism Development Corp. Ltd. ^ Industrial Capital Goods 0.87% Siemens Ltd. 0.17% Bharat Electronics Ltd. 0.14% ABB India Ltd. 0.11% Bharat Heavy Electricals Ltd. 0.11% Honeywell Automation India Ltd. 0.08% Thermax Ltd. 0.06% Lakshmi Machine Works Ltd. 0.04% Alstom India Ltd. 0.03% BEML Ltd. 0.02% Suzlon Energy Ltd. 0.02% Cochin Shipyard Ltd. 0.02% Triveni Turbine Ltd. 0.02% Alstom T&D India Ltd. 0.02% Apar Industries Ltd. 0.01% CG Power and Industrial Solutions Ltd. 0.01% Schneider Electric Infrastructure Ltd. 0.01% Inox Wind Ltd. ^ Industrial Products 1.16% Bharat Forge Ltd. 0.16% Cummins India Ltd. 0.13% Supreme Industries Ltd. 0.11% Astral Poly Technik Ltd. 0.10% AIA Engineering Ltd. 0.09% SKF India Ltd. 0.07% Schaeffler India Ltd. 0.05% Carborundum Universal Ltd. 0.05% Finolex Industries Ltd. 0.05% Finolex Cables Ltd. 0.04% Elgi Equipments Ltd. 0.04% Grindwell Norton Ltd. 0.04% KEI Industries Ltd. 0.03% Graphite India Ltd. 0.03% Timken India Ltd. 0.03% Mahindra CIE Automotive Ltd. 0.03% Greaves Cotton Ltd. 0.02% HEG Ltd. 0.02% Essel Propack Ltd. 0.02% Uflex Ltd. 0.01% Time Technoplast Ltd. 0.01% Jain Irrigation Systems Ltd. 0.01% Nilkamal Ltd. 0.01% Jai Corp Ltd. 0.01% Media & Entertainment 0.60% Zee Entertainment Enterprises Ltd. 0.34% PVR Ltd. 0.08% Sun TV Network Ltd. 0.06% Dish TV India Ltd. 0.03% TV18 Broadcast Ltd. 0.02% Inox Leisure Ltd. 0.02% Hathway Cable & Datacom Ltd. 0.02% TV Today Network Ltd. 0.01% Jagran Prakashan Ltd. 0.01% D.B. Corp Ltd. 0.01% Network18 Media & Investments Ltd. 0.01% Minerals/Mining 0.55%
Company/Issuer % to NAV
99

100
Benchmark
S&P BSE 500 TRI
Quantitative Indicators Average P/E : 31.99 Average P/BV : 6.34 Average Dividend Yield : 1.31
Note : - “Portfolio Beta, Standard Deviation, R Squared, Sharpe Ratio and Tracking Error of the Scheme is not computed owing to the short time frame since launch of the Scheme.”Portfolio turnover has been computed as the ratio of the lower value of purchase and sales, to the average net assets in the past one year (since inception for schemes that have not completed a year). The figures are not netted for derivative transactions.Refer Disclaimer of Asia Index Private Limited (AIPL)/BSE Limited/National Stock Exchange of India Limited” on page no. 130.@@ Total Expense Ratio is as on the last business day of the month.
Annual Portfolio Turnover Ratio : Equity - 0.03 times, Others (Debt and Derivatives) - 0.00 times Combined Annual Portfolio Turnover Ratio : 0.03 times
Portfolio as on August 31, 2019
ICICI Prudential S&P BSE 500 ETF (An Open-ended Exchange Traded Fund replicating/ tracking S&P BSE 500 TRI)
RiskometerThis Product is suitable for investors who are seeking*:
• Long term wealth creation
• An Exchange Traded Fund that aims to provide returns that closely correspond to the returns provided by S&P BSE 500 TRI, subject to tracking error.
*Investors should consult their financial advisers if in doubt about whether the product is suitable for them.
Company/Issuer % to NAV
• Top Ten Holdings^ Value Less than 0.01% of NAV in absolute terms.
Coal India Ltd. 0.41% NMDC Ltd. 0.11% MOIL Ltd. 0.02% Gujarat Mineral Development Corporation Ltd. 0.01% Non - Ferrous Metals 1.00% Hindalco Industries Ltd. 0.44% Vedanta Ltd. 0.42% Hindustan Zinc Ltd. 0.07% National Aluminium Co. Ltd. 0.06% Hindustan Copper Ltd. 0.01% Oil 0.61% Oil & Natural Gas Corporation Ltd. 0.55% Oil India Ltd. 0.06% Paper 0.01% Tamil Nadu Newsprint & Papers Ltd. 0.01% Pesticides 0.73% UPL Ltd. 0.50% PI Industries Ltd. 0.12% Bayer Cropscience Ltd. 0.05% Rallis India Ltd. 0.02% Monsanto India Ltd. 0.01% Meghmani Organics Ltd. 0.01% Dhanuka Agritech Ltd. 0.01% Petroleum Products 7.86%• Reliance Industries Ltd. 6.54% Bharat Petroleum Corporation Ltd. 0.45% Indian Oil Corporation Ltd. 0.41% Hindustan Petroleum Corporation Ltd. 0.31% Castrol India Ltd. 0.10% Gulf Oil Lubricants India Ltd. 0.02% Chennai Petroleum Corporation Ltd. 0.02% Mangalore Refinery and Petrochemicals Ltd. 0.01% Pharmaceuticals 4.46% Sun Pharmaceutical Industries Ltd. 0.79% Dr. Reddy's Laboratories Ltd. 0.50% Cipla Ltd. 0.39% Piramal Enterprises Ltd. 0.34% Divi's Laboratories Ltd. 0.33% Lupin Ltd. 0.29% Aurobindo Pharma Ltd. 0.27% Biocon Ltd. 0.16% Torrent Pharmaceuticals Ltd. 0.13% IPCA Laboratories Ltd. 0.10% Cadila Healthcare Ltd. 0.09% Glenmark Pharmaceuticals Ltd. 0.09% Sanofi India Ltd. 0.09% Natco Pharma Ltd. 0.08% Glaxosmithkline Pharmaceuticals Ltd. 0.08% Abbott India Ltd. 0.08% Alkem Laboratories Ltd. 0.07% Pfizer Ltd. 0.07% Syngene International Ltd. 0.05% Merck Ltd. 0.05% Jubilant Life Sciences Ltd. 0.05% Ajanta Pharma Ltd. 0.04% Alembic Pharmaceuticals Ltd. 0.04% Strides Shasun Ltd. 0.04% Laurus Labs Ltd. 0.03% J.B.Chemicals & Pharmaceuticals Ltd. 0.02% Suven Life Sciences Ltd. 0.02% Granules India Ltd. 0.02% Astrazeneca Pharma India Ltd. 0.02% Sun Pharma Advanced Research Co. Ltd 0.02% Dishman Carbogen Amcis Ltd. 0.02% Eris Lifesciences Ltd. 0.02% Caplin Point Laboratories Ltd. 0.02% FDC Ltd. 0.01% Wockhardt Ltd. 0.01% Shilpa Medicare Ltd. 0.01% Bliss GVS Pharma Ltd. 0.01% Power 2.17% Power Grid Corporation Of India Ltd. 0.75% NTPC Ltd. 0.74% Tata Power Company Ltd. 0.17% Adani Transmission Ltd. 0.10% NHPC Ltd. 0.08% Torrent Power Ltd. 0.08% Adani Power Ltd. 0.07% Kalpataru Power Transmission Ltd. 0.04% JSW Energy Ltd 0.04% PTC India Ltd. 0.02% NLC India Ltd. 0.01% SJVN Ltd. 0.01% Nava Bharat Ventures Ltd. 0.01% Adani Green Energy Ltd. 0.01% Reliance Infrastructure Ltd. 0.01% Reliance Power Ltd. ^ Retailing 0.77%
Avenue Supermarts Ltd. (D-Mart) 0.27% Trent Ltd. 0.17% Future Retail Ltd. 0.13% Aditya Birla Fashion and Retail Ltd. 0.10% Future Lifestyle Fashions Ltd. 0.04% Future Consumer Ltd. 0.03% V-Mart Retail Ltd. 0.03% Shoppers Stop Ltd. 0.02% Services 0.06% Quess Corp Ltd. 0.03% Thomas Cook (India) Ltd. 0.03% Software 12.32%• Infosys Ltd. 5.00%• Tata Consultancy Services Ltd. 3.84% HCL Technologies Ltd. 0.98% Tech Mahindra Ltd. 0.70% Wipro Ltd. 0.62% Info Edge (India) Ltd. 0.22% Mphasis Ltd. 0.14% Mindtree Ltd. 0.12% Oracle Financial Services Software Ltd. 0.11% NIIT Technologies Ltd. 0.10% Larsen & Toubro Infotech Ltd. 0.08% Cyient Ltd. 0.06% Hexaware Technologies Ltd. 0.05% Persistent Systems Ltd. 0.05% Just Dial Ltd. 0.04% L&T Technology Services Ltd. 0.04% Tata Elxsi Ltd. 0.03% Intellect Design Arena Ltd. 0.03% Sonata Software Ltd. 0.03% Firstsource Solutions Ltd. 0.02% Zensar Technologies Ltd. 0.02% Infibeam Incorporation Ltd. 0.02% Eclerx Services Ltd. 0.01% Take Solutions Ltd. 0.01% Indiabulls Integrated Services Ltd. ^ Telecom - Equipment & Accessories 0.41% Bharti Infratel Ltd. 0.34% Sterlite Technologies Ltd. 0.03% Himachal Futuristic Communications Ltd. 0.02% Tejas Networks Ltd. 0.01% ITI Ltd. ^ Telecom - Services 1.06% Bharti Airtel Ltd. 0.96% Vodafone Idea Ltd. 0.05% Tata Communications Ltd. 0.05% Reliance Communications Ltd. ^ Textile Products 0.43% Page Industries Ltd. 0.17% SRF Ltd. 0.12% Raymond Ltd. 0.03% Welspun India Ltd. 0.03% K.P.R. Mill Ltd. 0.02% Swan Energy Ltd. 0.02% Abhishek Industries Ltd. 0.01% TCNS Clothing Co. Limited 0.01% Lux Industries Ltd. 0.01% Himatsingka Seide Ltd. 0.01% Textiles - Cotton 0.03% Vardhman Textiles Ltd. 0.03% Textiles - Synthetic 0.01% The Bombay Dyeing and Manufacturing Co. Ltd. 0.01% Trading 0.07% Adani Enterprises Ltd. 0.06% MMTC Ltd. ^ Transportation 1.20% Adani Ports and Special Economic Zone Ltd. 0.47% Interglobe Aviation Ltd. 0.26% Container Corporation Of India Ltd. 0.22% Spicejet Ltd. 0.05% Redington (India) Ltd. 0.05% The Great Eastern Shipping Company Ltd. 0.04% Gujarat Pipavav Port Ltd. 0.03% Blue Dart Express Ltd. 0.02% Balmer Lawrie & Company Ltd. 0.01% Gateway Distriparks Ltd. 0.01% Allcargo Logistics Ltd. 0.01% Mahindra Logistics Ltd. 0.01% The Shipping Corporation Of India Ltd. 0.01% JET Airways (India) Ltd. ^ Corporate Securities 0.01% Britannia Industries Ltd. CRISIL AAA 0.01% Short Term Debt and net current assets 0.58% Total Net Assets 100.00%
Company/Issuer % to NAV
Tracking Error : 0.45%
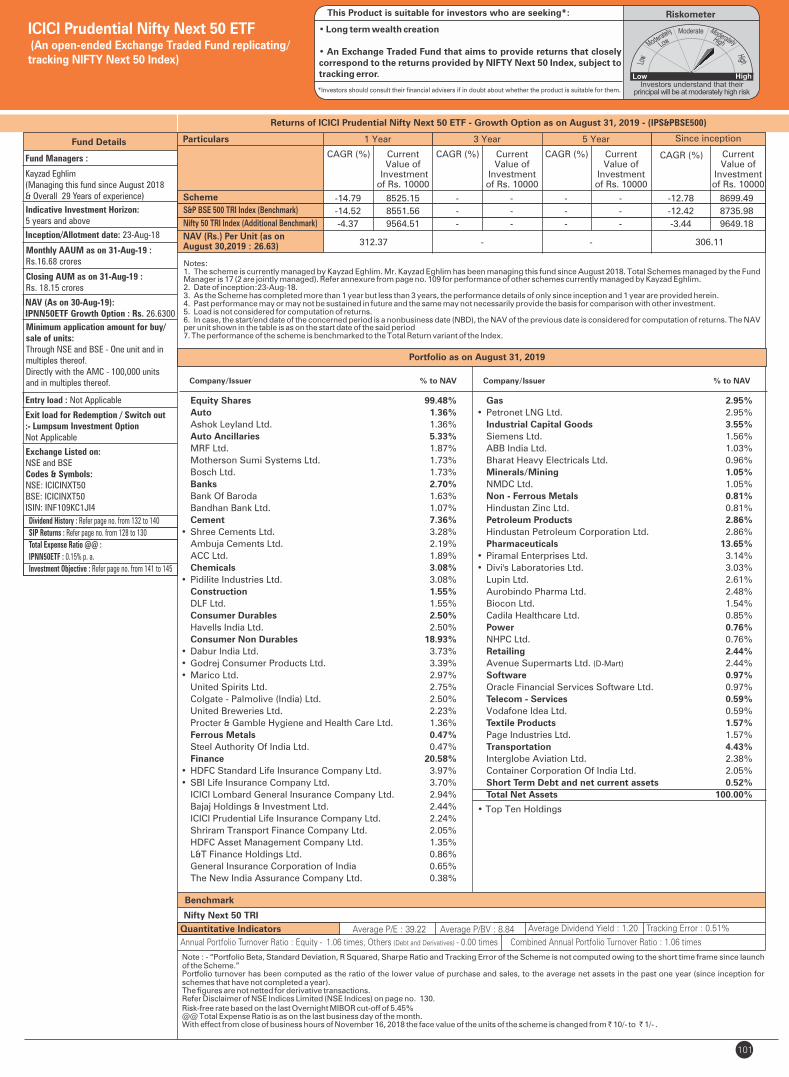
101
ICICI Prudential Nifty Next 50 ETF (An open-ended Exchange Traded Fund replicating/tracking NIFTY Next 50 Index)
RiskometerThis Product is suitable for investors who are seeking*:
• Long term wealth creation
• An Exchange Traded Fund that aims to provide returns that closely correspond to the returns provided by NIFTY Next 50 Index, subject to tracking error.
*Investors should consult their financial advisers if in doubt about whether the product is suitable for them.
Company/Issuer % to NAV
Equity Shares 99.48%
Auto 1.36%
Ashok Leyland Ltd. 1.36%
Auto Ancillaries 5.33%
MRF Ltd. 1.87%
Motherson Sumi Systems Ltd. 1.73%
Bosch Ltd. 1.73%
Banks 2.70%
Bank Of Baroda 1.63%
Bandhan Bank Ltd. 1.07%
Cement 7.36%
• Shree Cements Ltd. 3.28%
Ambuja Cements Ltd. 2.19%
ACC Ltd. 1.89%
Chemicals 3.08%
• Pidilite Industries Ltd. 3.08%
Construction 1.55%
DLF Ltd. 1.55%
Consumer Durables 2.50%
Havells India Ltd. 2.50%
Consumer Non Durables 18.93%
• Dabur India Ltd. 3.73%
• Godrej Consumer Products Ltd. 3.39%
• Marico Ltd. 2.97%
United Spirits Ltd. 2.75%
Colgate - Palmolive (India) Ltd. 2.50%
United Breweries Ltd. 2.23%
Procter & Gamble Hygiene and Health Care Ltd. 1.36%
Ferrous Metals 0.47%
Steel Authority Of India Ltd. 0.47%
Finance 20.58%
• HDFC Standard Life Insurance Company Ltd. 3.97%
• SBI Life Insurance Company Ltd. 3.70%
ICICI Lombard General Insurance Company Ltd. 2.94%
Bajaj Holdings & Investment Ltd. 2.44%
ICICI Prudential Life Insurance Company Ltd. 2.24%
Shriram Transport Finance Company Ltd. 2.05%
HDFC Asset Management Company Ltd. 1.35%
L&T Finance Holdings Ltd. 0.86%
General Insurance Corporation of India 0.65%
The New India Assurance Company Ltd. 0.38%
Benchmark
Nifty Next 50 TRI
Fund Details
Fund Managers :
Kayzad Eghlim (Managing this fund since August 2018& Overall 29 Years of experience)
Indicative Investment Horizon: 5 years and above
Inception/Allotment date: 23-Aug-18
Monthly AAUM as on 31-Aug-19 : Rs.16.68 crores
Closing AUM as on 31-Aug-19 : Rs. 18.15 crores
NAV (As on 30-Aug-19):IPNN50ETF Growth Option : Rs. 26.6300
Minimum application amount for buy/sale of units:Through NSE and BSE - One unit and inmultiples thereof.Directly with the AMC - 100,000 unitsand in multiples thereof.
Exit load for Redemption / Switch out:- Lumpsum Investment OptionNot Applicable
Exchange Listed on:NSE and BSECodes & Symbols:NSE: ICICINXT50BSE: ICICINXT50ISIN: INF109KC1JI4
Entry load : Not Applicable
Dividend History : Refer page no. from 132 to 140
SIP Returns : Refer page no. from 128 to 130
Total Expense Ratio @@ :
IPNN50ETF : 0.15% p. a.
Investment Objective : Refer page no. from 141 to 145
Quantitative Indicators Average P/E : 39.22 Average P/BV : 8.84 Average Dividend Yield : 1.20
Note : - “Portfolio Beta, Standard Deviation, R Squared, Sharpe Ratio and Tracking Error of the Scheme is not computed owing to the short time frame since launch of the Scheme.”Portfolio turnover has been computed as the ratio of the lower value of purchase and sales, to the average net assets in the past one year (since inception for schemes that have not completed a year). The figures are not netted for derivative transactions.Refer Disclaimer of NSE Indices Limited (NSE Indices) on page no. 130.Risk-free rate based on the last Overnight MIBOR cut-off of 5.45%@@ Total Expense Ratio is as on the last business day of the month.With effect from close of business hours of November 16, 2018 the face value of the units of the scheme is changed from ̀ 10/- to ̀ 1/- .
Annual Portfolio Turnover Ratio : Equity - 1.06 times, Others (Debt and Derivatives) - 0.00 times Combined Annual Portfolio Turnover Ratio : 1.06 times
• Top Ten Holdings
Company/Issuer % to NAV
Gas 2.95%
• Petronet LNG Ltd. 2.95%
Industrial Capital Goods 3.55%
Siemens Ltd. 1.56%
ABB India Ltd. 1.03%
Bharat Heavy Electricals Ltd. 0.96%
Minerals/Mining 1.05%
NMDC Ltd. 1.05%
Non - Ferrous Metals 0.81%
Hindustan Zinc Ltd. 0.81%
Petroleum Products 2.86%
Hindustan Petroleum Corporation Ltd. 2.86%
Pharmaceuticals 13.65%
• Piramal Enterprises Ltd. 3.14%
• Divi's Laboratories Ltd. 3.03%
Lupin Ltd. 2.61%
Aurobindo Pharma Ltd. 2.48%
Biocon Ltd. 1.54%
Cadila Healthcare Ltd. 0.85%
Power 0.76%
NHPC Ltd. 0.76%
Retailing 2.44%
Avenue Supermarts Ltd. (D-Mart) 2.44%
Software 0.97%
Oracle Financial Services Software Ltd. 0.97%
Telecom - Services 0.59%
Vodafone Idea Ltd. 0.59%
Textile Products 1.57%
Page Industries Ltd. 1.57%
Transportation 4.43%
Interglobe Aviation Ltd. 2.38%
Container Corporation Of India Ltd. 2.05%
Short Term Debt and net current assets 0.52%
Total Net Assets 100.00%
Portfolio as on August 31, 2019
Returns of ICICI Prudential Nifty Next 50 ETF - Growth Option as on August 31, 2019 - ( )IPS&PBSE500
Notes:1. The scheme is currently managed by Kayzad Eghlim. Mr. Kayzad Eghlim has been managing this fund since August 2018. Total Schemes managed by the Fund Manager is 17 (2 are jointly managed). Refer annexure from page no. 109 for performance of other schemes currently managed by Kayzad Eghlim.2. Date of inception:23-Aug-18.3. As the Scheme has completed more than 1 year but less than 3 years, the performance details of only since inception and 1 year are provided herein.4. Past performance may or may not be sustained in future and the same may not necessarily provide the basis for comparison with other investment.5. Load is not considered for computation of returns.6. In case, the start/end date of the concerned period is a nonbusiness date (NBD), the NAV of the previous date is considered for computation of returns. The NAV per unit shown in the table is as on the start date of the said period7. The performance of the scheme is benchmarked to the Total Return variant of the Index.
Scheme
Nifty 50 TRI Index (Additional Benchmark)
NAV (Rs.) Per Unit (as on August 30,2019 : 26.63)
CAGR (%)
306.11
S&P BSE 500 TRI Index (Benchmark)
Since inception
CurrentValue of
Investment of Rs. 10000
CAGR (%) Current Value of
Investment of Rs. 10000
1 Year 3 Year 5 Year
CAGR (%) Current Value of
Investment of Rs. 10000
CAGR (%) Current Value of
Investment of Rs. 10000
312.37 - -
Particulars
-14.79 8525.15 - - - - -12.78 8699.49
-14.52 8551.56 - - - - -12.42 8735.98
-4.37 9564.51 - - - - -3.44 9649.18
Tracking Error : 0.51%

Portfolio as on August 31, 2019
102
ICICI Prudential Bank ETF (An open-ended Exchange Traded Fund tracking Nifty Bank Index)
Company/Issuer % to NAV
Equity Shares 100.40%
Banks 100.40%
• HDFC Bank Ltd. 32.99%
• ICICI Bank Ltd. 19.38%
• Kotak Mahindra Bank Ltd. 14.03%
• Axis Bank Ltd. 12.03%
• State Bank Of India 9.32%
• IndusInd Bank Ltd. 6.69%
• The Federal Bank Ltd. 1.46%
• RBL Bank Ltd. 1.20%
• Yes Bank Ltd. 0.99%
• Bank Of Baroda 0.98%
IDFC First Bank Ltd. 0.72%
Punjab National Bank 0.61%
Short Term Debt and net current assets -0.40%
Total Net Assets 100.00%
Fund Details
Fund Managers :
Mr. Kayzad Eghlim (Managing this fund since July 2019 & Overall 29 Years of experience)
Indicative Investment Horizon: 5 Years and above
Inception/Allotment date: 10-Jul-19
Monthly AAUM as on 31-Aug-19 : Rs. 193.99 crores
Closing AUM as on 31-Aug-19 : Rs. 243.63 crores
NAV (As on 30-Aug-19): Rs. 274.8600
Minimum application amount for buy/sale of units:Through NSE and BSE - One unit and in multiples thereof. Directly with the AMC - Units are to be purchased in creation unit size i.e.,10,000 units and in multiples thereof.
Exit load for Redemption / Switch out:- Lumpsum Investment OptionNot Applicable
Exchange Listed on:NSE and BSECodes & Symbols:NSE: ICICIBANKN BSE: ICICIBANKN ISIN: INF109KC1E27
Entry load : Not Applicable
Dividend History : Refer page no. from 132 to 140
SIP Returns : Refer page no. from 128 to 130
Total Expense Ratio @@ :
IPBETF : 0.16% p. a.
Investment Objective : Refer page no. from 141 to 145
@@ Total Expense Ratio is as on the last business day of the month.Refer Disclaimer of Asia Index Private Limited (AIPL)/BSE Limited/National Stock Exchange of India Limited” on page no. 130.Tracking error of the Scheme is not computed owing to the short time frame since launch of the Scheme.
Average Maturity : -21.95 Days Macaulay Duration : -21.95 Days Yield To Maturity : 5.27%Modified Duration : -20.86 Days
RiskometerThis Product is suitable for investors who are seeking*:
• Long term wealth creation
• An exchange traded fund that aims to provide returns that closely correspond to the returns provided by Nifty Bank Index, subject to tracking error.
*Investors should consult their financial advisers if in doubt about whether the product is suitable for them.
• Top Ten Holdings
Quantitative Indicators: Average P/E : 42.16 Average P/BV : 3.38 Average Dividend Yield: 0.44

Portfolio as on August 31, 2019
103
ICICI Prudential Private Banks ETF (An open-ended Exchange Traded Fund replicating / tracking NIFTY Private Bank Index)
Company/Issuer % to NAV
Equity Shares 99.12%
Banks 99.12%
• HDFC Bank Ltd. 29.35%
• ICICI Bank Ltd. 20.63%
• Kotak Mahindra Bank Ltd. 14.93%
• Axis Bank Ltd. 13.93%
• IndusInd Bank Ltd. 11.75%
• The Federal Bank Ltd. 2.57%
• RBL Bank Ltd. 2.11%
• Yes Bank Ltd. 1.73%
• IDFC First Bank Ltd. 1.27%
• DCB Bank Ltd. 0.85%
Short Term Debt and net current assets 0.88%
Total Net Assets 100.00%
Fund Details
Fund Managers :
Mr. Kayzad Eghlim(Managing this fund since August 2019 & Overall 29 Years of experience)
Indicative Investment Horizon: 5 Years and above
Inception/Allotment date: 09-Aug-2019
Monthly AAUM as on 31-Aug-19 : Rs. 17.08 crores
Closing AUM as on 31-Aug-19 : Rs. 24.93 crores
NAV (As on 30-Aug-19): Rs. 153.5000
Minimum application amount for buy/sale of units:Through NSE and BSE - One unit and in multiples thereof. Directly with the AMC - Units are to be purchased in creation unit size i.e. 15,000 units and in multiples thereof.
Exit load for Redemption / Switch out:- Lumpsum Investment OptionNot Applicable
Exchange Listed on:NSE and BSECodes & Symbols:NSE: ICICIBANKP BSE: ICICIBANKP ISIN: INF109KC1E35
Entry load : Not Applicable
Dividend History : Refer page no. from 132 to 140
Refer page no. from 128 to 130SIP Returns :
Total Expense Ratio @@ :
IPPBETF : 0.16% p. a.
Investment Objective : Refer page no. from 141 to 145
@@ Total Expense Ratio is as on the last business day of the month.Refer Disclaimer of Asia Index Private Limited (AIPL)/BSE Limited/National Stock Exchange of India Limited” on page no. 130.Tracking error of the Scheme is not computed owing to the short time frame since launch of the Scheme.
Average Maturity : 1.54 Days Macaulay Duration : 1.54 Days Yield To Maturity : 5.27%Modified Duration : 1.47 Days
RiskometerThis Product is suitable for investors who are seeking*:
• Long term wealth creation
• An exchange traded fund that aims to provide returns that closely correspond to the returns provided by NIFTY Private Bank Index, subject to tracking error.
*Investors should consult their financial advisers if in doubt about whether the product is suitable for them.
• Top Ten Holdings
Quantitative Indicators: Average P/E : 42.27 Average P/BV : 3.52 Average Dividend Yield: 0.55
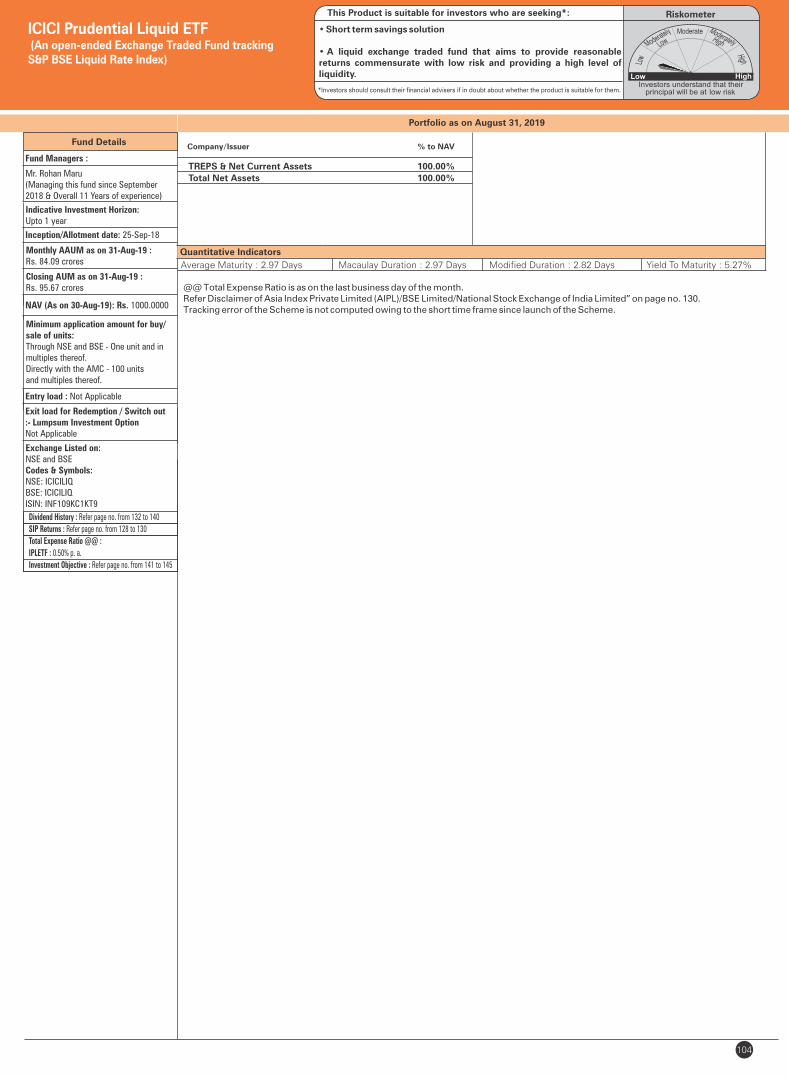
Portfolio as on August 31, 2019
104
ICICI Prudential Liquid ETF (An open-ended Exchange Traded Fund tracking S&P BSE Liquid Rate Index)
RiskometerThis Product is suitable for investors who are seeking*:
• Short term savings solution
• A liquid exchange traded fund that aims to provide reasonable returns commensurate with low risk and providing a high level of liquidity.
*Investors should consult their financial advisers if in doubt about whether the product is suitable for them.
Company/Issuer % to NAV
TREPS & Net Current Assets 100.00%
Total Net Assets 100.00%
Fund Details
Fund Managers :
Mr. Rohan Maru (Managing this fund since September 2018 & Overall 11 Years of experience)
Indicative Investment Horizon: Upto 1 year
Inception/Allotment date: 25-Sep-18
Monthly AAUM as on 31-Aug-19 : Rs. 84.09 crores
Closing AUM as on 31-Aug-19 : Rs. 95.67 crores
NAV (As on 30-Aug-19): Rs. 1000.0000
Minimum application amount for buy/sale of units:Through NSE and BSE - One unit and in multiples thereof.Directly with the AMC - 100 units and multiples thereof.
Exit load for Redemption / Switch out:- Lumpsum Investment OptionNot Applicable
Exchange Listed on:NSE and BSECodes & Symbols:NSE: ICICILIQBSE: ICICILIQISIN: INF109KC1KT9
Entry load : Not Applicable
Dividend History : Refer page no. from 132 to 140
SIP Returns : Refer page no. from 128 to 130
Total Expense Ratio @@ :
IPLETF : 0.50% p. a.
Investment Objective : Refer page no. from 141 to 145
low risk
@@ Total Expense Ratio is as on the last business day of the month.Refer Disclaimer of Asia Index Private Limited (AIPL)/BSE Limited/National Stock Exchange of India Limited” on page no. 130.Tracking error of the Scheme is not computed owing to the short time frame since launch of the Scheme.
Quantitative Indicators
Average Maturity : 2.97 Days Macaulay Duration : 2.97 Days Yield To Maturity : 5.27%Modified Duration : 2.82 Days
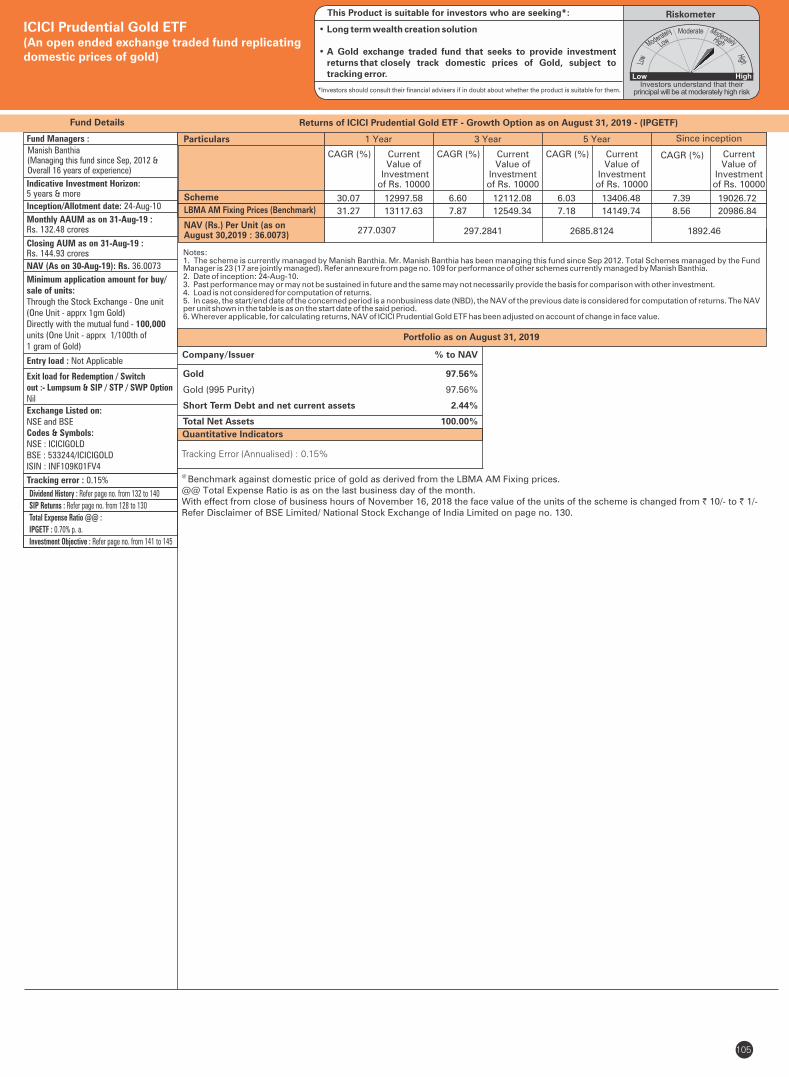
Fund Managers :
Fund Details
Portfolio as on August 31, 2019
Company/Issuer % to NAV
Quantitative Indicators
@ Benchmark against domestic price of gold as derived from the LBMA AM Fixing prices.
@@ Total Expense Ratio is as on the last business day of the month.With effect from close of business hours of November 16, 2018 the face value of the units of the scheme is changed from ` 10/- to ` 1/-Refer Disclaimer of BSE Limited/ National Stock Exchange of India Limited on page no. 130.
Manish Banthia (Managing this fund since Sep, 2012 & Overall 16 years of experience)
Indicative Investment Horizon:5 years & more
Inception/Allotment date: 24-Aug-10
Monthly AAUM as on 31-Aug-19 : Rs. 132.48 crores
Closing AUM as on 31-Aug-19 : Rs. 144.93 crores
NAV (As on 30-Aug-19): Rs. 36.0073
Minimum application amount for buy/sale of units:Through the Stock Exchange - One unit(One Unit - apprx 1gm Gold)Directly with the mutual fund - 100,000units (One Unit - apprx 1/100th of 1 gram of Gold)
Exit load for Redemption / Switchout :- Lumpsum & SIP / STP / SWP OptionNil
Exchange Listed on:NSE and BSECodes & Symbols:NSE : ICICIGOLDBSE : 533244/ICICIGOLDISIN : INF109K01FV4
105
Returns of ICICI Prudential Gold ETF - Growth Option as on August 31, 2019 - (IPGETF)
Tracking Error (Annualised) : 0.15%
Tracking error : 0.15%
Gold 97.56%
Gold (995 Purity) 97.56%
Short Term Debt and net current assets 2.44%
Total Net Assets 100.00%
ICICI Prudential Gold ETF(An open ended exchange traded fund replicating domestic prices of gold)
Entry load : Not Applicable
RiskometerThis Product is suitable for investors who are seeking*:
• Long term wealth creation solution
• A Gold exchange traded fund that seeks to provide investment returns that closely track domestic prices of Gold, subject to tracking error.
*Investors should consult their financial advisers if in doubt about whether the product is suitable for them.
Dividend History : Refer page no. from 132 to 140
SIP Returns : Refer page no. from 128 to 130
Total Expense Ratio @@ :
IPGETF : 0.70% p. a.
Investment Objective : Refer page no. from 141 to 145
Notes:1. The scheme is currently managed by Manish Banthia. Mr. has been managing this fund since . Total Schemes managed by the Fund Manish Banthia Sep 2012Manager . Refer annexure from page no. 109 for performance of other schemes currently managed by . is 23 (17 are jointly managed) Manish Banthia2. Date of inception: 24-Aug-10.3. Past performance may or may not be sustained in future and the same may not necessarily provide the basis for comparison with other investment.4. Load is not considered for computation of returns.5. In case, the start/end date of the concerned period is a nonbusiness date (NBD), the NAV of the previous date is considered for computation of returns. The NAV per unit shown in the table is as on the start date of the said period.6. Wherever applicable, for calculating returns, NAV of ICICI Prudential Gold ETF has been adjusted on account of change in face value.
Scheme
NAV (Rs.) Per Unit (as on August 30,2019 : 36.0073)
CAGR (%)
1892.46
LBMA AM Fixing Prices (Benchmark)
Since inception
CurrentValue of
Investment of Rs. 10000
CAGR (%) Current Value of
Investment of Rs. 10000
1 Year 3 Year 5 Year
CAGR (%) Current Value of
Investment of Rs. 10000
CAGR (%) Current Value of
Investment of Rs. 10000
277.0307 297.2841 2685.8124
Particulars
30.07 12997.58 6.60 12112.08 6.03 13406.48 7.39 19026.72
31.27 13117.63 7.87 12549.34 7.18 14149.74 8.56 20986.84
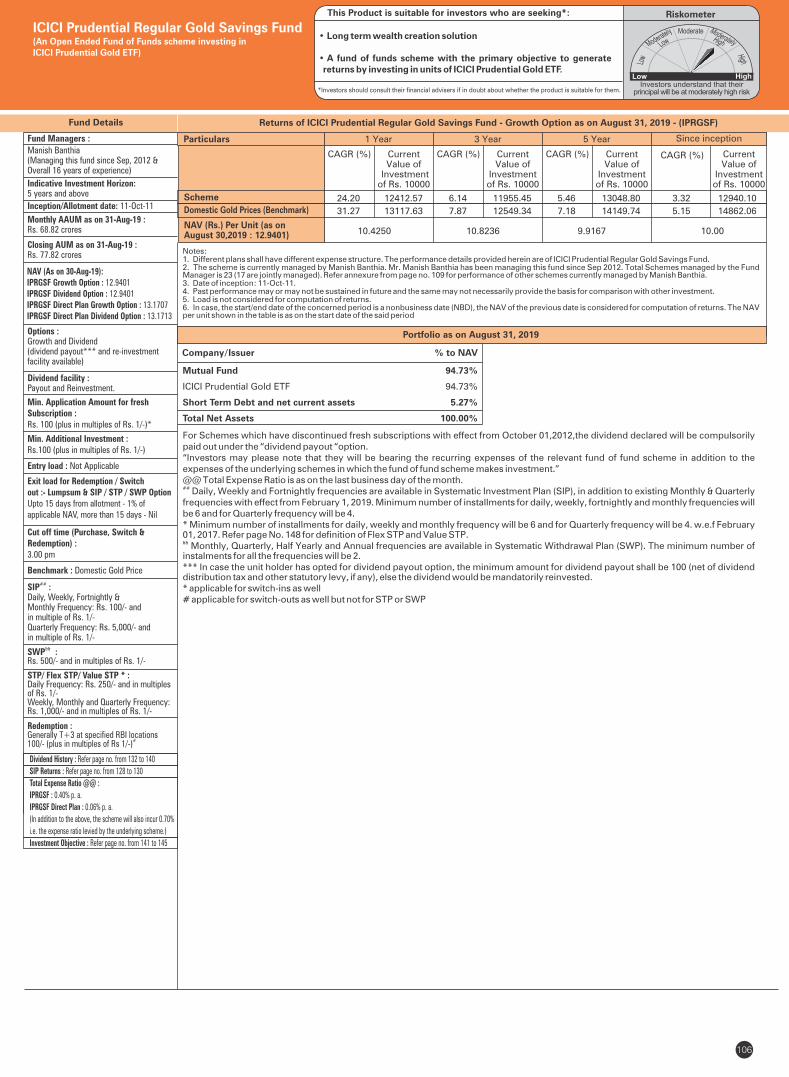
Fund Details
Portfolio as on August 31, 2019
For Schemes which have discontinued fresh subscriptions with effect from October 01,2012,the dividend declared will be compulsorily paid out under the “dividend payout “option.“Investors may please note that they will be bearing the recurring expenses of the relevant fund of fund scheme in addition to the expenses of the underlying schemes in which the fund of fund scheme makes investment.”@@ Total Expense Ratio is as on the last business day of the month.## Daily, Weekly and Fortnightly frequencies are available in Systematic Investment Plan (SIP), in addition to existing Monthly & Quarterly frequencies with effect from February 1, 2019. Minimum number of installments for daily, weekly, fortnightly and monthly frequencies will be 6 and for Quarterly frequency will be 4.* Minimum number of installments for daily, weekly and monthly frequency will be 6 and for Quarterly frequency will be 4. w.e.f February 01, 2017. Refer page No. 148 for definition of Flex STP and Value STP.&& Monthly, Quarterly, Half Yearly and Annual frequencies are available in Systematic Withdrawal Plan (SWP). The minimum number of instalments for all the frequencies will be 2.*** In case the unit holder has opted for dividend payout option, the minimum amount for dividend payout shall be 100 (net of dividend distribution tax and other statutory levy, if any), else the dividend would be mandatorily reinvested.* applicable for switch-ins as well# applicable for switch-outs as well but not for STP or SWP
Fund Managers :
Manish Banthia (Managing this fund since Sep, 2012 & Overall 16 years of experience)
Indicative Investment Horizon:5 years and above
Inception/Allotment date: 11-Oct-11
Monthly AAUM as on 31-Aug-19 : Rs. 68.82 crores
Closing AUM as on 31-Aug-19 : Rs. 77.82 crores
Options :Growth and Dividend(dividend payout*** and re-investment facility available)
Dividend facility :Payout and Reinvestment.
Min. Application Amount for freshSubscription :Rs. 100 (plus in multiples of Rs. 1/-)*
Min. Additional Investment :Rs.100 (plus in multiples of Rs. 1/-)
Exit load for Redemption / Switchout :- Lumpsum & SIP / STP / SWP OptionUpto 15 days from allotment - 1% of applicable NAV, more than 15 days - Nil
Cut off time (Purchase, Switch &Redemption) :3.00 pm
Benchmark : Domestic Gold Price
SIP :##
Daily, Weekly, Fortnightly & Monthly Frequency: Rs. 100/- and in multiple of Rs. 1/-Quarterly Frequency: Rs. 5,000/- and in multiple of Rs. 1/-
&&SWP :Rs. 500/- and in multiples of Rs. 1/-
STP/ Flex STP/ Value STP * :Daily Frequency: Rs. 250/- and in multiples of Rs. 1/-Weekly, Monthly and Quarterly Frequency: Rs. 1,000/- and in multiples of Rs. 1/-
Redemption :Generally T+3 at specified RBI locations
#100/- (plus in multiples of Rs 1/-)
106
Returns of ICICI Prudential Regular Gold Savings Fund - Growth Option as on August 31, 2019 - (IPRGSF)
NAV (As on 30-Aug-19):IPRGSF Growth Option : 12.9401IPRGSF Dividend Option : 12.9401IPRGSF Direct Plan Growth Option : 13.1707IPRGSF Direct Plan Dividend Option : 13.1713
ICICI Prudential Regular Gold Savings Fund(An Open Ended Fund of Funds scheme investing in ICICI Prudential Gold ETF)
Company/Issuer % to NAV
Mutual Fund 94.73%
ICICI Prudential Gold ETF 94.73%
Short Term Debt and net current assets 5.27%
Total Net Assets 100.00%
Entry load : Not Applicable
RiskometerThis Product is suitable for investors who are seeking*:
• Long term wealth creation solution • A fund of funds scheme with the primary objective to generate returns by investing in units of ICICI Prudential Gold ETF.
*Investors should consult their financial advisers if in doubt about whether the product is suitable for them.
Dividend History : Refer page no. from 132 to 140
SIP Returns : Refer page no. from 128 to 130
Total Expense Ratio @@ :
IPRGSF : 0.40% p. a.
IPRGSF Direct Plan : 0.06% p. a.
(In addition to the above, the scheme will also incur 0.70%
i.e. the expense ratio levied by the underlying scheme.)
Investment Objective : Refer page no. from 141 to 145
Notes:1. Different plans shall have different expense structure. The performance details provided herein are of ICICI Prudential Regular Gold Savings Fund.2. The scheme is currently managed by Manish Banthia. Mr. has been managing this fund since . Total Schemes managed by the Fund Manish Banthia Sep 2012Manager . Refer annexure from page no. 109 for performance of other schemes currently managed by . is 23 (17 are jointly managed) Manish Banthia3. Date of inception: 11-Oct-11.4. Past performance may or may not be sustained in future and the same may not necessarily provide the basis for comparison with other investment.5. Load is not considered for computation of returns.6. In case, the start/end date of the concerned period is a nonbusiness date (NBD), the NAV of the previous date is considered for computation of returns. The NAV per unit shown in the table is as on the start date of the said period
Scheme
NAV (Rs.) Per Unit (as on August 30,2019 : 12.9401)
CAGR (%)
10.00
Domestic Gold Prices (Benchmark)
Since inception
CurrentValue of
Investment of Rs. 10000
CAGR (%) Current Value of
Investment of Rs. 10000
1 Year 3 Year 5 Year
CAGR (%) Current Value of
Investment of Rs. 10000
CAGR (%) Current Value of
Investment of Rs. 10000
10.4250 10.8236 9.9167
Particulars
24.20 12412.57 6.14 11955.45 5.46 13048.80 3.32 12940.10
31.27 13117.63 7.87 12549.34 7.18 14149.74 5.15 14862.06
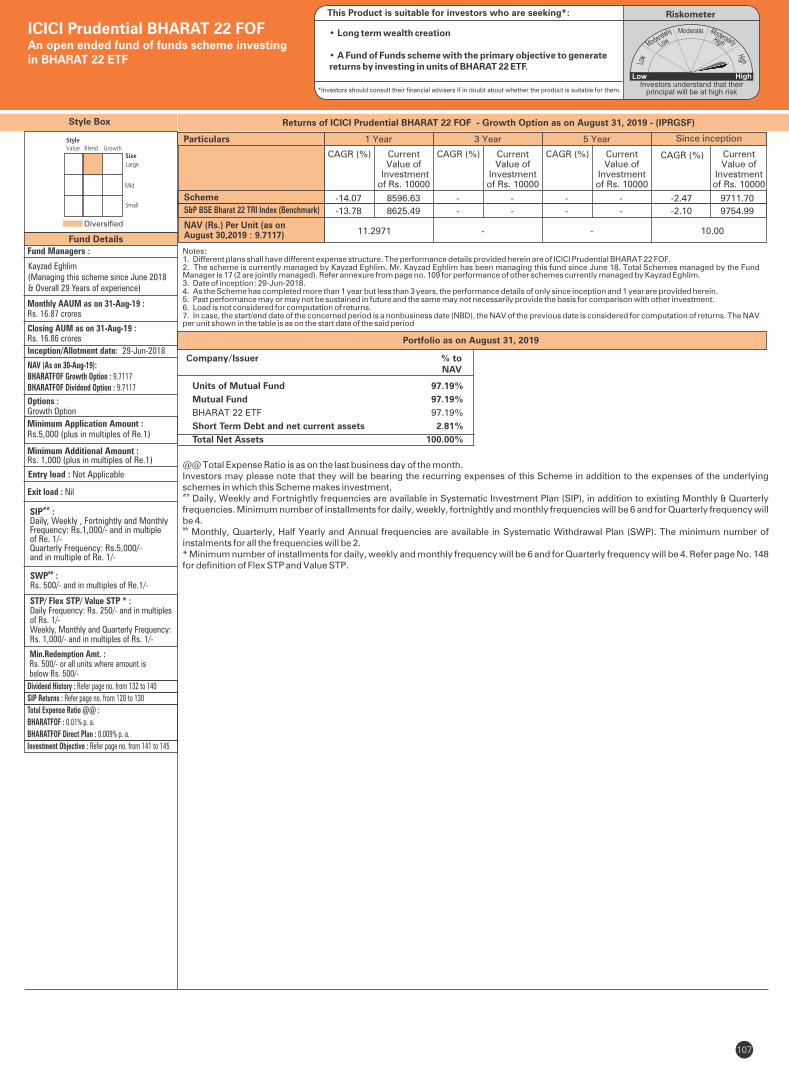
Style Box
Fund Managers :
Inception/Allotment date: 29-Jun-2018
NAV (As on 30-Aug-19):BHARATFOF Growth Option : 9.7117BHARATFOF Dividend Option : 9.7117
Options : Growth Option
Exit load : Nil
107
Fund Details
Diversified
ICICI Prudential BHARAT 22 FOF An open ended fund of funds scheme investing in BHARAT 22 ETF
Monthly AAUM as on 31-Aug-19 : Rs. 16.87 crores
Closing AUM as on 31-Aug-19 : Rs. 16.86 crores
Entry load : Not Applicable
Dividend History : Refer page no. from 132 to 140
SIP Returns : Refer page no. from 128 to 130
Total Expense Ratio @@ :
BHARATFOF : 0.01% p. a.
BHARATFOF Direct Plan : 0.009% p. a.
Investment Objective : Refer page no. from 141 to 145
@@ Total Expense Ratio is as on the last business day of the month. Investors may please note that they will be bearing the recurring expenses of this Scheme in addition to the expenses of the underlying schemes in which this Scheme makes investment.## Daily, Weekly and Fortnightly frequencies are available in Systematic Investment Plan (SIP), in addition to existing Monthly & Quarterly frequencies. Minimum number of installments for daily, weekly, fortnightly and monthly frequencies will be 6 and for Quarterly frequency will be 4.&& Monthly, Quarterly, Half Yearly and Annual frequencies are available in Systematic Withdrawal Plan (SWP). The minimum number of instalments for all the frequencies will be 2.* Minimum number of installments for daily, weekly and monthly frequency will be 6 and for Quarterly frequency will be 4. Refer page No. 148 for definition of Flex STP and Value STP.
Kayzad Eghlim (Managing this scheme since June 2018 & Overall 29 Years of experience)
Units of Mutual Fund 97.19%
Mutual Fund 97.19%
BHARAT 22 ETF 97.19%
Short Term Debt and net current assets 2.81%
Total Net Assets 100.00%
Company/Issuer % to NAV
RiskometerThis Product is suitable for investors who are seeking*:
• Long term wealth creation
• A Fund of Funds scheme with the primary objective to generate returns by investing in units of BHARAT 22 ETF.
*Investors should consult their financial advisers if in doubt about whether the product is suitable for them.
&&SWP :Rs. 500/- and in multiples of Re.1/-
STP/ Flex STP/ Value STP * :Daily Frequency: Rs. 250/- and in multiples of Rs. 1/-Weekly, Monthly and Quarterly Frequency: Rs. 1,000/- and in multiples of Rs. 1/-
##SIP :Daily, Weekly , Fortnightly and Monthly Frequency: Rs.1,000/- and in multiple of Re. 1/- Quarterly Frequency: Rs.5,000/- and in multiple of Re. 1/-
Min.Redemption Amt. :Rs. 500/- or all units where amount is below Rs. 500/-
Minimum Application Amount :Rs.5,000 (plus in multiples of Re.1)
Minimum Additional Amount :Rs. 1,000 (plus in multiples of Re.1)
Notes:1. Different plans shall have different expense structure. The performance details provided herein are of ICICI Prudential BHARAT 22 FOF.2. The scheme is currently managed by Kayzad Eghlim. Mr. Kayzad Eghlim has been managing this fund since June 18. Total Schemes managed by the Fund Manager is 17 (2 are jointly managed). Refer annexure from page no. 109 for performance of other schemes currently managed by Kayzad Eghlim.3. Date of inception: 29-Jun-2018.4. As the Scheme has completed more than 1 year but less than 3 years, the performance details of only since inception and 1 year are provided herein.5. Past performance may or may not be sustained in future and the same may not necessarily provide the basis for comparison with other investment.6. Load is not considered for computation of returns.7. In case, the start/end date of the concerned period is a nonbusiness date (NBD), the NAV of the previous date is considered for computation of returns. The NAV per unit shown in the table is as on the start date of the said period
Scheme
NAV (Rs.) Per Unit (as on August 30,2019 : 9.7117)
CAGR (%)
10.00
S&P BSE Bharat 22 TRI Index (Benchmark)
Since inception
CurrentValue of
Investment of Rs. 10000
CAGR (%) Current Value of
Investment of Rs. 10000
1 Year 3 Year 5 Year
CAGR (%) Current Value of
Investment of Rs. 10000
CAGR (%) Current Value of
Investment of Rs. 10000
11.2971 - -
Particulars
-14.07 8596.63 - - - - -2.47 9711.70
-13.78 8625.49 - - - - -2.10 9754.99
Returns of ICICI Prudential BHARAT 22 FOF - Growth Option as on August 31, 2019 - (IPRGSF)
Portfolio as on August 31, 2019
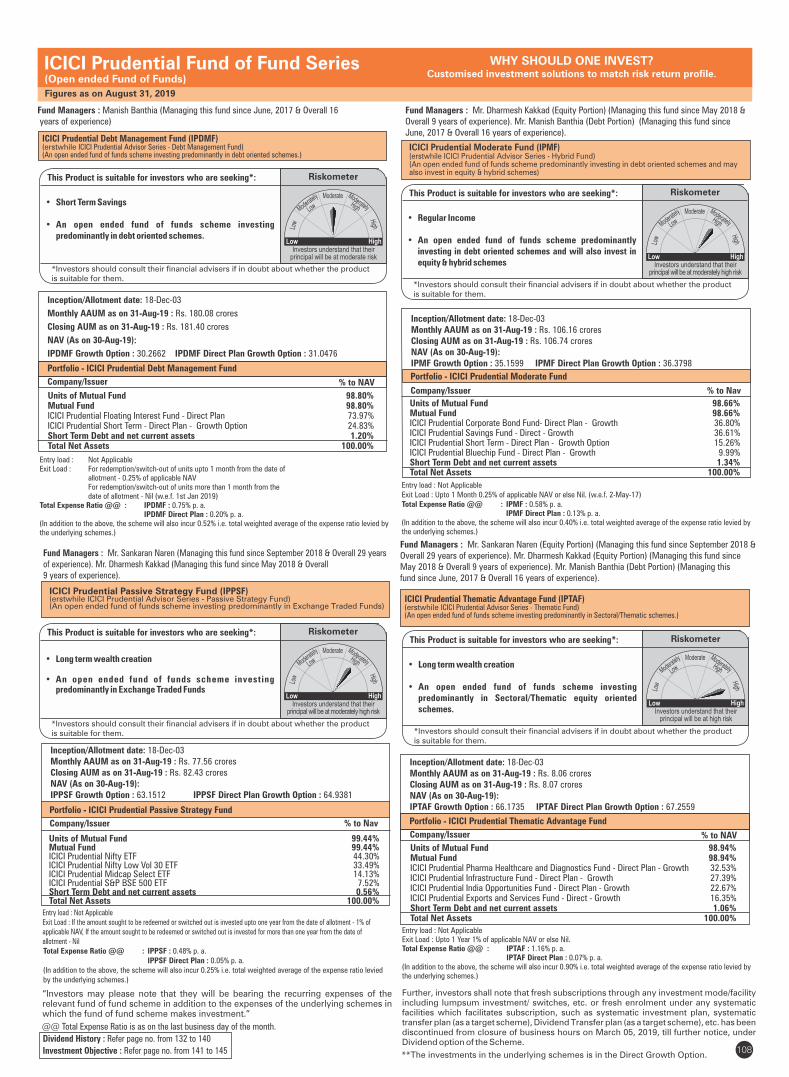
Fund Managers : Manish Banthia (Managing this fund since June, 2017 & Overall 16 years of experience)
ICICI Prudential Debt Management Fund (IPDMF)( ICICI Prudential Advisor Series - Debt Management Fund)erstwhile (An open ended fund of funds scheme investing predominantly in debt oriented schemes.)
Inception/Allotment date: 18-Dec-03
Monthly AAUM as on 31-Aug-19 : Rs. 180.08 crores
Closing AUM as on 31-Aug-19 : Rs. 181.40 crores
NAV (As on 30-Aug-19):
IPDMF Growth Option : 30.2662 IPDMF Direct Plan Growth Option : 31.0476
Portfolio - ICICI Prudential Debt Management Fund
Company/Issuer % to NAV
Entry load : Not ApplicableExit Load : For redemption/switch-out of units upto 1 month from the date of allotment - 0.25% of applicable NAV For redemption/switch-out of units more than 1 month from the date of allotment - Nil (w.e.f. 1st Jan 2019) Total Expense Ratio @@ : IPDMF : 0.75% p. a. IPDMF Direct Plan : 0.20% p. a.(In addition to the above, the scheme will also incur 0.52% i.e. total weighted average of the expense ratio levied by the underlying schemes.)
ICICI Prudential Fund of Fund Series(Open ended Fund of Funds)
WHY SHOULD ONE INVEST?Customised investment solutions to match risk return profile.
Figures as on August 31, 2019
Units of Mutual Fund 98.80%Mutual Fund 98.80%ICICI Prudential Floating Interest Fund - Direct Plan 73.97%ICICI Prudential Short Term - Direct Plan - Growth Option 24.83%Short Term Debt and net current assets 1.20%Total Net Assets 100.00%
108
This Product is suitable for investors who are seeking*:
• Short Term Savings
• An open ended fund of funds scheme investing predominantly in debt oriented schemes.
*Investors should consult their financial advisers if in doubt about whether the productis suitable for them.
Riskometer
ICICI Prudential Moderate Fund (IPMF)(erstwhile ICICI Prudential Advisor Series - Hybrid Fund)(An open ended fund of funds scheme predominantly investing in debt oriented schemes and may also invest in equity & hybrid schemes)
Inception/Allotment date: 18-Dec-03 Monthly AAUM as on 31-Aug-19 : Rs. 106.16 croresClosing AUM as on 31-Aug-19 : Rs. 106.74 croresNAV (As on 30-Aug-19):IPMF Growth Option : 35.1599 IPMF Direct Plan Growth Option : 36.3798
Portfolio - ICICI Prudential Moderate Fund
Company/Issuer % to Nav
Entry load : Not ApplicableExit Load : Upto 1 Month 0.25% of applicable NAV or else Nil. (w.e.f. 2-May-17) Total Expense Ratio @@ : : 0.58% p. a.IPMF IPMF Direct Plan : 0.13% p. a.(In addition to the above, the scheme will also incur 0.40% i.e. total weighted average of the expense ratio levied by the underlying schemes.)
Units of Mutual Fund 98.66%Mutual Fund 98.66%ICICI Prudential Corporate Bond Fund- Direct Plan - Growth 36.80%ICICI Prudential Savings Fund - Direct - Growth 36.61%ICICI Prudential Short Term - Direct Plan - Growth Option 15.26%ICICI Prudential Bluechip Fund - Direct Plan - Growth 9.99%Short Term Debt and net current assets 1.34%Total Net Assets 100.00%
This Product is suitable for investors who are seeking*:
• Regular Income
• An open ended fund of funds scheme predominantly investing in debt oriented schemes and will also invest in equity & hybrid schemes
Riskometer
*Investors should consult their financial advisers if in doubt about whether the productis suitable for them.
Dividend History : Refer page no. from 132 to 140
Investment Objective : Refer page no. from 141 to 145
Fund Managers : Mr. Dharmesh Kakkad (Equity Portion) (Managing this fund since May 2018 & Overall 9 years of experience). Mr. Manish Banthia (Debt Portion) (Managing this fund since June, 2017 & Overall 16 years of experience).
Entry load : Not ApplicableExit Load : If the amount sought to be redeemed or switched out is invested upto one year from the date of allotment - 1% of applicable NAV, If the amount sought to be redeemed or switched out is invested for more than one year from the date of allotment - Nil
“Investors may please note that they will be bearing the recurring expenses of the relevant fund of fund scheme in addition to the expenses of the underlying schemes inwhich the fund of fund scheme makes investment.”
ICICI Prudential Passive Strategy Fund (IPPSF)(erstwhile ICICI Prudential Advisor Series - Passive Strategy Fund)(An open ended fund of funds scheme investing predominantly in Exchange Traded Funds)
Inception/Allotment date: 18-Dec-03 Monthly AAUM as on 31-Aug-19 : Rs. 77.56 croresClosing AUM as on 31-Aug-19 : Rs. 82.43 croresNAV (As on 30-Aug-19):IPPSF Growth Option : 63.1512 IPPSF Direct Plan Growth Option : 64.9381
Company/Issuer % to Nav
Portfolio - ICICI Prudential Passive Strategy Fund
Units of Mutual Fund 99.44%Mutual Fund 99.44%ICICI Prudential Nifty ETF 44.30%ICICI Prudential Nifty Low Vol 30 ETF 33.49%ICICI Prudential Midcap Select ETF 14.13%ICICI Prudential S&P BSE 500 ETF 7.52%Short Term Debt and net current assets 0.56%Total Net Assets 100.00%
This Product is suitable for investors who are seeking*:
• Long term wealth creation
• An open ended fund of funds scheme investing predominantly in Exchange Traded Funds
Riskometer
*Investors should consult their financial advisers if in doubt about whether the productis suitable for them.
Total Expense Ratio @@ : : 0.48% p. a.IPPSF IPPSF Direct Plan : 0.05% p. a.(In addition to the above, the scheme will also incur 0.25% i.e. total weighted average of the expense ratio levied by the underlying schemes.)
@@ Total Expense Ratio is as on the last business day of the month.
Fund Manager : s Mr. Sankaran Naren (Managing this fund since September 2018 & Overall 29 years of experience). Mr. Dharmesh Kakkad (Managing this fund since May 2018 & Overall 9 years of experience).
ICICI Prudential Thematic Advantage Fund (IPTAF)( ICICI Prudential Advisor Series - Thematic Fund)erstwhile (An open ended fund of funds scheme investing predominantly in Sectoral/Thematic schemes.)
Inception/Allotment date: 18-Dec-03 Monthly AAUM as on 31-Aug-19 : Rs. 8.06 croresClosing AUM as on 31-Aug-19 : Rs. 8.07 croresNAV (As on 30-Aug-19):IPTAF Growth Option : 66.1735 IPTAF Direct Plan Growth Option : 67.2559
Portfolio - ICICI Prudential Thematic Advantage Fund
Company/Issuer % to NAV
Entry load : Not ApplicableExit Load : Upto 1 Year 1% of applicable NAV or else Nil. Total Expense Ratio @@ : IPTAF : 1.16% p. a. IPTAF Direct Plan : 0.07% p. a.(In addition to the above, the scheme will also incur 0.90% i.e. total weighted average of the expense ratio levied by the underlying schemes.)
Units of Mutual Fund 98.94%Mutual Fund 98.94%ICICI Prudential Pharma Healthcare and Diagnostics Fund - Direct Plan - Growth 32.53%ICICI Prudential Infrastructure Fund - Direct Plan - Growth 27.39%ICICI Prudential India Opportunities Fund - Direct Plan - Growth 22.67%ICICI Prudential Exports and Services Fund - Direct - Growth 16.35%Short Term Debt and net current assets 1.06%Total Net Assets 100.00%
This Product is suitable for investors who are seeking*:
• Long term wealth creation
• An open ended fund of funds scheme investing predominantly in Sectoral/Thematic equity oriented schemes.
*Investors should consult their financial advisers if in doubt about whether the productis suitable for them.
Riskometer
Fund Managers : (Equity Portion)Mr. Sankaran Naren (Managing this fund since September 2018 & Overall 29 years of experience). Mr. Dharmesh Kakkad (Equity Portion) (Managing this fund since May 2018 & Overall 9 years of experience). Mr. Manish Banthia (Debt Portion) (Managing this fund since June, 2017 & Overall 16 years of experience).
Further, investors shall note that fresh subscriptions through any investment mode/facility including lumpsum investment/ switches, etc. or fresh enrolment under any systematic facilities which facilitates subscription, such as systematic investment plan, systematic transfer plan (as a target scheme), Dividend Transfer plan (as a target scheme), etc. has been discontinued from closure of business hours on March 05, 2019, till further notice, under Dividend option of the Scheme.
**The investments in the underlying schemes is in the Direct Growth Option.
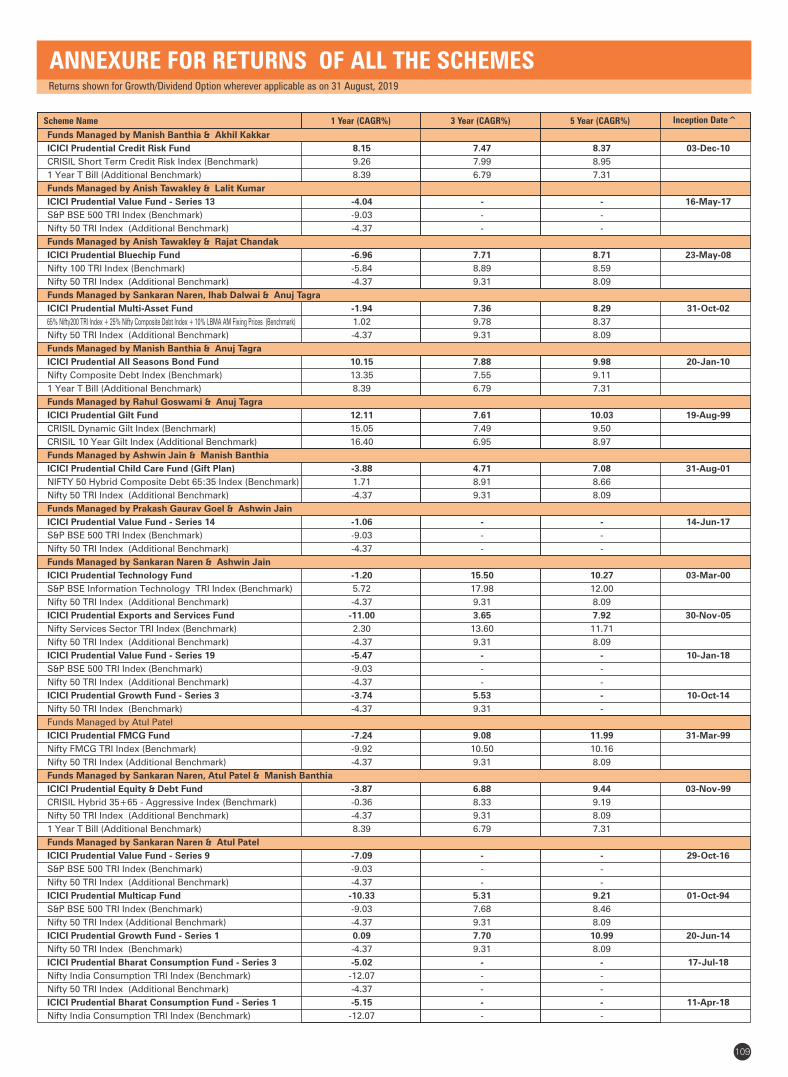
ANNEXURE FOR RETURNS OF ALL THE SCHEMESReturns shown for Growth/Dividend Option wherever applicable as on 31 August, 2019
Scheme Name Inception Date^
109
1 Year (CAGR%) 3 Year (CAGR%) 5 Year (CAGR%)
65% Nifty200 TRI Index + 25% Nifty Composite Debt Index + 10% LBMA AM Fixing Prices (Benchmark)
Funds Managed by Manish Banthia & Akhil Kakkar
ICICI Prudential Credit Risk Fund 8.15 7.47 8.37 03-Dec-10
CRISIL Short Term Credit Risk Index (Benchmark) 9.26 7.99 8.95
1 Year T Bill (Additional Benchmark) 8.39 6.79 7.31
Funds Managed by Anish Tawakley & Lalit Kumar
ICICI Prudential Value Fund - Series 13 -4.04 - - 16-May-17
S&P BSE 500 TRI Index (Benchmark) -9.03 - -
Nifty 50 TRI Index (Additional Benchmark) -4.37 - -
Funds Managed by Anish Tawakley & Rajat Chandak
ICICI Prudential Bluechip Fund -6.96 7.71 8.71 23-May-08
Nifty 100 TRI Index (Benchmark) -5.84 8.89 8.59
Nifty 50 TRI Index (Additional Benchmark) -4.37 9.31 8.09
Funds Managed by Sankaran Naren, Ihab Dalwai & Anuj Tagra
ICICI Prudential Multi-Asset Fund -1.94 7.36 8.29 31-Oct-02
1.02 9.78 8.37
Nifty 50 TRI Index (Additional Benchmark) -4.37 9.31 8.09
Funds Managed by Manish Banthia & Anuj Tagra
ICICI Prudential All Seasons Bond Fund 10.15 7.88 9.98 20-Jan-10
Nifty Composite Debt Index (Benchmark) 13.35 7.55 9.11
1 Year T Bill (Additional Benchmark) 8.39 6.79 7.31
Funds Managed by Rahul Goswami & Anuj Tagra
ICICI Prudential Gilt Fund 12.11 7.61 10.03 19-Aug-99
CRISIL Dynamic Gilt Index (Benchmark) 15.05 7.49 9.50
CRISIL 10 Year Gilt Index (Additional Benchmark) 16.40 6.95 8.97
Funds Managed by Ashwin Jain & Manish Banthia
ICICI Prudential Child Care Fund (Gift Plan) -3.88 4.71 7.08 31-Aug-01
NIFTY 50 Hybrid Composite Debt 65:35 Index (Benchmark) 1.71 8.91 8.66
Nifty 50 TRI Index (Additional Benchmark) -4.37 9.31 8.09
Funds Managed by Prakash Gaurav Goel & Ashwin Jain
ICICI Prudential Value Fund - Series 14 -1.06 - - 14-Jun-17
S&P BSE 500 TRI Index (Benchmark) -9.03 - -
Nifty 50 TRI Index (Additional Benchmark) -4.37 - -
Funds Managed by Sankaran Naren & Ashwin Jain
ICICI Prudential Technology Fund -1.20 15.50 10.27 03-Mar-00
S&P BSE Information Technology TRI Index (Benchmark) 5.72 17.98 12.00
Nifty 50 TRI Index (Additional Benchmark) -4.37 9.31 8.09
ICICI Prudential Exports and Services Fund -11.00 3.65 7.92 30-Nov-05
Nifty Services Sector TRI Index (Benchmark) 2.30 13.60 11.71
Nifty 50 TRI Index (Additional Benchmark) -4.37 9.31 8.09
ICICI Prudential Value Fund - Series 19 -5.47 - - 10-Jan-18
S&P BSE 500 TRI Index (Benchmark) -9.03 - -
Nifty 50 TRI Index (Additional Benchmark) -4.37 - -
ICICI Prudential Growth Fund - Series 3 -3.74 5.53 - 10-Oct-14
Nifty 50 TRI Index (Benchmark) -4.37 9.31 -
Funds Managed by Atul Patel
ICICI Prudential FMCG Fund -7.24 9.08 11.99 31-Mar-99
Nifty FMCG TRI Index (Benchmark) -9.92 10.50 10.16
Nifty 50 TRI Index (Additional Benchmark) -4.37 9.31 8.09
Funds Managed by Sankaran Naren, Atul Patel & Manish Banthia
ICICI Prudential Equity & Debt Fund -3.87 6.88 9.44 03-Nov-99
CRISIL Hybrid 35+65 - Aggressive Index (Benchmark) -0.36 8.33 9.19
Nifty 50 TRI Index (Additional Benchmark) -4.37 9.31 8.09
1 Year T Bill (Additional Benchmark) 8.39 6.79 7.31
Funds Managed by Sankaran Naren & Atul Patel
ICICI Prudential Value Fund - Series 9 -7.09 - - 29-Oct-16
S&P BSE 500 TRI Index (Benchmark) -9.03 - -
Nifty 50 TRI Index (Additional Benchmark) -4.37 - -
ICICI Prudential Multicap Fund -10.33 5.31 9.21 01-Oct-94
S&P BSE 500 TRI Index (Benchmark) -9.03 7.68 8.46
Nifty 50 TRI Index (Additional Benchmark) -4.37 9.31 8.09
ICICI Prudential Growth Fund - Series 1 0.09 7.70 10.99 20-Jun-14
Nifty 50 TRI Index (Benchmark) -4.37 9.31 8.09
ICICI Prudential Bharat Consumption Fund - Series 3 -5.02 - - 17-Jul-18
Nifty India Consumption TRI Index (Benchmark) -12.07 - -
Nifty 50 TRI Index (Additional Benchmark) -4.37 - -
ICICI Prudential Bharat Consumption Fund - Series 1 -5.15 - - 11-Apr-18
Nifty India Consumption TRI Index (Benchmark) -12.07 - -
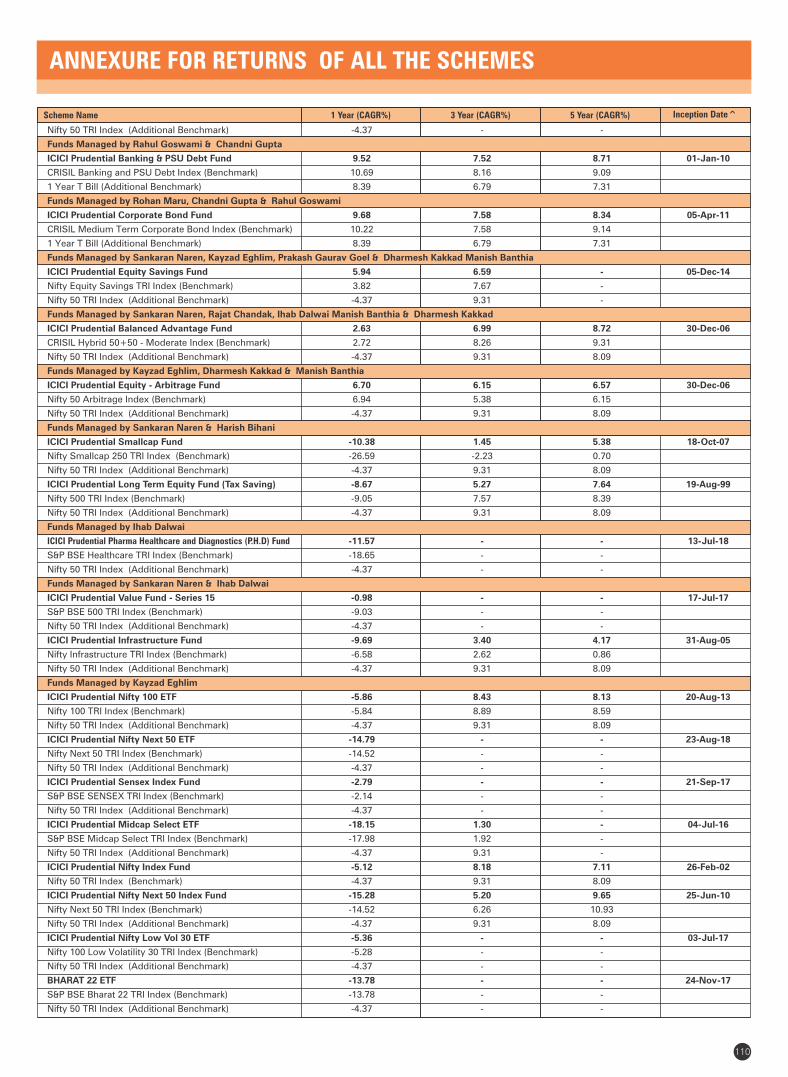
ANNEXURE FOR RETURNS OF ALL THE SCHEMES
Scheme Name Inception Date^
110
1 Year (CAGR%) 3 Year (CAGR%) 5 Year (CAGR%)
Nifty 50 TRI Index (Additional Benchmark) -4.37 - -
Funds Managed by Rahul Goswami & Chandni Gupta
ICICI Prudential Banking & PSU Debt Fund 9.52 7.52 8.71 01-Jan-10
CRISIL Banking and PSU Debt Index (Benchmark) 10.69 8.16 9.09
1 Year T Bill (Additional Benchmark) 8.39 6.79 7.31
Funds Managed by Rohan Maru, Chandni Gupta & Rahul Goswami
ICICI Prudential Corporate Bond Fund 9.68 7.58 8.34 05-Apr-11
CRISIL Medium Term Corporate Bond Index (Benchmark) 10.22 7.58 9.14
1 Year T Bill (Additional Benchmark) 8.39 6.79 7.31
Funds Managed by Sankaran Naren, Kayzad Eghlim, Prakash Gaurav Goel & Dharmesh Kakkad Manish Banthia
ICICI Prudential Equity Savings Fund 5.94 6.59 - 05-Dec-14
Nifty Equity Savings TRI Index (Benchmark) 3.82 7.67 -
Nifty 50 TRI Index (Additional Benchmark) -4.37 9.31 -
Funds Managed by Sankaran Naren, Rajat Chandak, Ihab Dalwai Manish Banthia & Dharmesh Kakkad
ICICI Prudential Balanced Advantage Fund 2.63 6.99 8.72 30-Dec-06
CRISIL Hybrid 50+50 - Moderate Index (Benchmark) 2.72 8.26 9.31
Nifty 50 TRI Index (Additional Benchmark) -4.37 9.31 8.09
Funds Managed by Kayzad Eghlim, Dharmesh Kakkad & Manish Banthia
ICICI Prudential Equity - Arbitrage Fund 6.70 6.15 6.57 30-Dec-06
Nifty 50 Arbitrage Index (Benchmark) 6.94 5.38 6.15
Nifty 50 TRI Index (Additional Benchmark) -4.37 9.31 8.09
Funds Managed by Sankaran Naren & Harish Bihani
ICICI Prudential Smallcap Fund -10.38 1.45 5.38 18-Oct-07
Nifty Smallcap 250 TRI Index (Benchmark) -26.59 -2.23 0.70
Nifty 50 TRI Index (Additional Benchmark) -4.37 9.31 8.09
ICICI Prudential Long Term Equity Fund (Tax Saving) -8.67 5.27 7.64 19-Aug-99
Nifty 500 TRI Index (Benchmark) -9.05 7.57 8.39
Nifty 50 TRI Index (Additional Benchmark) -4.37 9.31 8.09
Funds Managed by Ihab Dalwai
ICICI Prudential Pharma Healthcare and Diagnostics (P.H.D) Fund -11.57 - - 13-Jul-18
S&P BSE Healthcare TRI Index (Benchmark) -18.65 - -
Nifty 50 TRI Index (Additional Benchmark) -4.37 - -
Funds Managed by Sankaran Naren & Ihab Dalwai
ICICI Prudential Value Fund - Series 15 -0.98 - - 17-Jul-17
S&P BSE 500 TRI Index (Benchmark) -9.03 - -
Nifty 50 TRI Index (Additional Benchmark) -4.37 - -
ICICI Prudential Infrastructure Fund -9.69 3.40 4.17 31-Aug-05
Nifty Infrastructure TRI Index (Benchmark) -6.58 2.62 0.86
Nifty 50 TRI Index (Additional Benchmark) -4.37 9.31 8.09
Funds Managed by Kayzad Eghlim
ICICI Prudential Nifty 100 ETF -5.86 8.43 8.13 20-Aug-13
Nifty 100 TRI Index (Benchmark) -5.84 8.89 8.59
Nifty 50 TRI Index (Additional Benchmark) -4.37 9.31 8.09
ICICI Prudential Nifty Next 50 ETF -14.79 - - 23-Aug-18
Nifty Next 50 TRI Index (Benchmark) -14.52 - -
Nifty 50 TRI Index (Additional Benchmark) -4.37 - -
ICICI Prudential Sensex Index Fund -2.79 - - 21-Sep-17
S&P BSE SENSEX TRI Index (Benchmark) -2.14 - -
Nifty 50 TRI Index (Additional Benchmark) -4.37 - -
ICICI Prudential Midcap Select ETF -18.15 1.30 - 04-Jul-16
S&P BSE Midcap Select TRI Index (Benchmark) -17.98 1.92 -
Nifty 50 TRI Index (Additional Benchmark) -4.37 9.31 -
ICICI Prudential Nifty Index Fund -5.12 8.18 7.11 26-Feb-02
Nifty 50 TRI Index (Benchmark) -4.37 9.31 8.09
ICICI Prudential Nifty Next 50 Index Fund -15.28 5.20 9.65 25-Jun-10
Nifty Next 50 TRI Index (Benchmark) -14.52 6.26 10.93
Nifty 50 TRI Index (Additional Benchmark) -4.37 9.31 8.09
ICICI Prudential Nifty Low Vol 30 ETF -5.36 - - 03-Jul-17
Nifty 100 Low Volatility 30 TRI Index (Benchmark) -5.28 - -
Nifty 50 TRI Index (Additional Benchmark) -4.37 - -
BHARAT 22 ETF -13.78 - - 24-Nov-17
S&P BSE Bharat 22 TRI Index (Benchmark) -13.78 - -
Nifty 50 TRI Index (Additional Benchmark) -4.37 - -
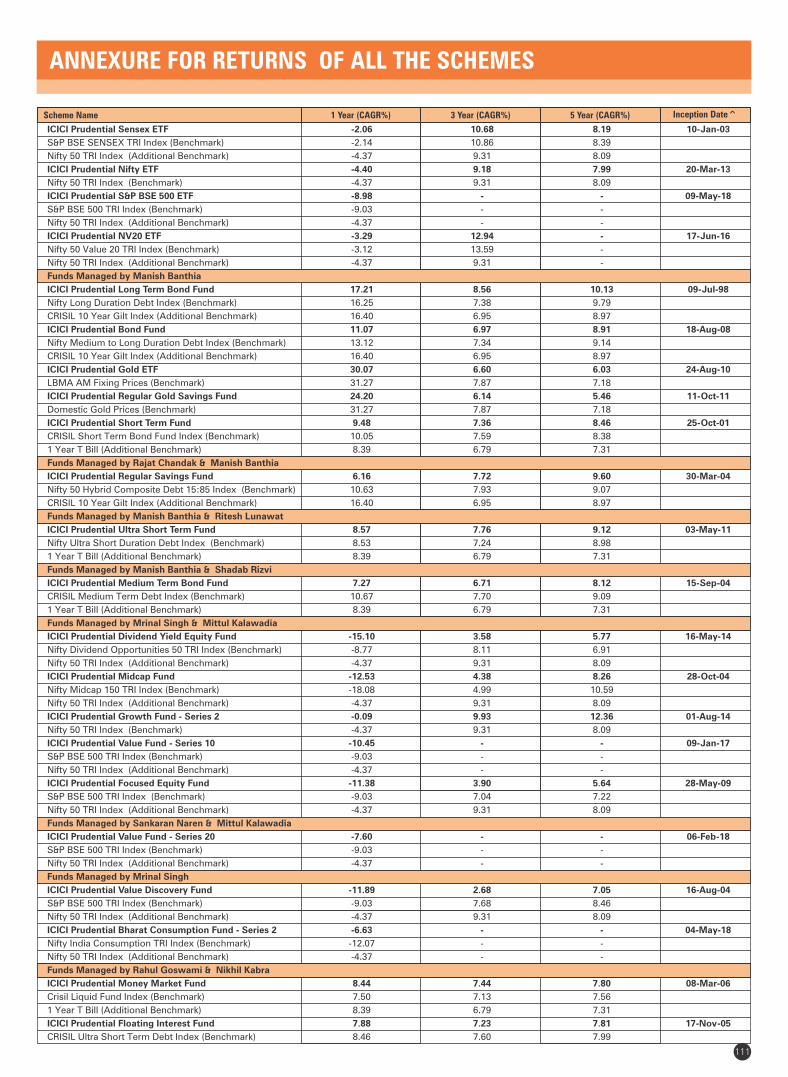
ANNEXURE FOR RETURNS OF ALL THE SCHEMES
Scheme Name Inception Date^
111
1 Year (CAGR%) 3 Year (CAGR%) 5 Year (CAGR%)
ICICI Prudential Sensex ETF -2.06 10.68 8.19 10-Jan-03
S&P BSE SENSEX TRI Index (Benchmark) -2.14 10.86 8.39
Nifty 50 TRI Index (Additional Benchmark) -4.37 9.31 8.09
ICICI Prudential Nifty ETF -4.40 9.18 7.99 20-Mar-13
Nifty 50 TRI Index (Benchmark) -4.37 9.31 8.09
ICICI Prudential S&P BSE 500 ETF -8.98 - - 09-May-18
S&P BSE 500 TRI Index (Benchmark) -9.03 - -
Nifty 50 TRI Index (Additional Benchmark) -4.37 - -
ICICI Prudential NV20 ETF -3.29 12.94 - 17-Jun-16
Nifty 50 Value 20 TRI Index (Benchmark) -3.12 13.59 -
Nifty 50 TRI Index (Additional Benchmark) -4.37 9.31 -
Funds Managed by Manish Banthia
ICICI Prudential Long Term Bond Fund 17.21 8.56 10.13 09-Jul-98
Nifty Long Duration Debt Index (Benchmark) 16.25 7.38 9.79
CRISIL 10 Year Gilt Index (Additional Benchmark) 16.40 6.95 8.97
ICICI Prudential Bond Fund 11.07 6.97 8.91 18-Aug-08
Nifty Medium to Long Duration Debt Index (Benchmark) 13.12 7.34 9.14
CRISIL 10 Year Gilt Index (Additional Benchmark) 16.40 6.95 8.97
ICICI Prudential Gold ETF 30.07 6.60 6.03 24-Aug-10
LBMA AM Fixing Prices (Benchmark) 31.27 7.87 7.18
ICICI Prudential Regular Gold Savings Fund 24.20 6.14 5.46 11-Oct-11
Domestic Gold Prices (Benchmark) 31.27 7.87 7.18
ICICI Prudential Short Term Fund 9.48 7.36 8.46 25-Oct-01
CRISIL Short Term Bond Fund Index (Benchmark) 10.05 7.59 8.38
1 Year T Bill (Additional Benchmark) 8.39 6.79 7.31
Funds Managed by Rajat Chandak & Manish Banthia
ICICI Prudential Regular Savings Fund 6.16 7.72 9.60 30-Mar-04
Nifty 50 Hybrid Composite Debt 15:85 Index (Benchmark) 10.63 7.93 9.07
CRISIL 10 Year Gilt Index (Additional Benchmark) 16.40 6.95 8.97
Funds Managed by Manish Banthia & Ritesh Lunawat
ICICI Prudential Ultra Short Term Fund 8.57 7.76 9.12 03-May-11
Nifty Ultra Short Duration Debt Index (Benchmark) 8.53 7.24 8.98
1 Year T Bill (Additional Benchmark) 8.39 6.79 7.31
Funds Managed by Manish Banthia & Shadab Rizvi
ICICI Prudential Medium Term Bond Fund 7.27 6.71 8.12 15-Sep-04
CRISIL Medium Term Debt Index (Benchmark) 10.67 7.70 9.09
1 Year T Bill (Additional Benchmark) 8.39 6.79 7.31
Funds Managed by Mrinal Singh & Mittul Kalawadia
ICICI Prudential Dividend Yield Equity Fund -15.10 3.58 5.77 16-May-14
Nifty Dividend Opportunities 50 TRI Index (Benchmark) -8.77 8.11 6.91
Nifty 50 TRI Index (Additional Benchmark) -4.37 9.31 8.09
ICICI Prudential Midcap Fund -12.53 4.38 8.26 28-Oct-04
Nifty Midcap 150 TRI Index (Benchmark) -18.08 4.99 10.59
Nifty 50 TRI Index (Additional Benchmark) -4.37 9.31 8.09
ICICI Prudential Growth Fund - Series 2 -0.09 9.93 12.36 01-Aug-14
Nifty 50 TRI Index (Benchmark) -4.37 9.31 8.09
ICICI Prudential Value Fund - Series 10 -10.45 - - 09-Jan-17
S&P BSE 500 TRI Index (Benchmark) -9.03 - -
Nifty 50 TRI Index (Additional Benchmark) -4.37 - -
ICICI Prudential Focused Equity Fund -11.38 3.90 5.64 28-May-09
S&P BSE 500 TRI Index (Benchmark) -9.03 7.04 7.22
Nifty 50 TRI Index (Additional Benchmark) -4.37 9.31 8.09
Funds Managed by Sankaran Naren & Mittul Kalawadia
ICICI Prudential Value Fund - Series 20 -7.60 - - 06-Feb-18
S&P BSE 500 TRI Index (Benchmark) -9.03 - -
Nifty 50 TRI Index (Additional Benchmark) -4.37 - -
Funds Managed by Mrinal Singh
ICICI Prudential Value Discovery Fund -11.89 2.68 7.05 16-Aug-04
S&P BSE 500 TRI Index (Benchmark) -9.03 7.68 8.46
Nifty 50 TRI Index (Additional Benchmark) -4.37 9.31 8.09
ICICI Prudential Bharat Consumption Fund - Series 2 -6.63 - - 04-May-18
Nifty India Consumption TRI Index (Benchmark) -12.07 - -
Nifty 50 TRI Index (Additional Benchmark) -4.37 - -
Funds Managed by Rahul Goswami & Nikhil Kabra
ICICI Prudential Money Market Fund 8.44 7.44 7.80 08-Mar-06
Crisil Liquid Fund Index (Benchmark) 7.50 7.13 7.56
1 Year T Bill (Additional Benchmark) 8.39 6.79 7.31
ICICI Prudential Floating Interest Fund 7.88 7.23 7.81 17-Nov-05
CRISIL Ultra Short Term Debt Index (Benchmark) 8.46 7.60 7.99

ANNEXURE FOR RETURNS OF ALL THE SCHEMES
1. Different plans shall have different expense structure. The performance provided are of plans mentioned above.
2. Past performance may or may not be sustained in future and the same may not necessarily provide the basis for comparison with other investment.
3. Performance for Schemes not having Growth/Cumulative Options have been calculated considering the Dividend Option, post adjustment of the Dividend Factor. Performance of dividend option would be Net of Dividend distribution tax, if any
4. Load is not considered for computation of returns.
5. In case, the start/end date of the concerned period is a nonbusiness date (NBD), the NAV of the previous date is considered for computation of returns.
6. Since respective schemes/ options have not completed relevant period (1yr, 3yr or 5yr) after allotment or units were not available throughout the respective period, no returns are available.^ Inception date shown is the date from which units under the plans are available throughout.
7. Please Refer page no. 124 for Fund Manager details.
8. The performance of the scheme is benchmarked to the Total Return variant of the Index
Scheme count for the total schemes managed by the Fund Managers does not include Capital Protection Oriented Funds, Multiple Yield Funds, Fixed Maturity Plans and Fund of Funds.
112
Scheme Name Inception Date^1 Year (CAGR%) 3 Year (CAGR%) 5 Year (CAGR%)
1 Year T Bill (Additional Benchmark) 8.39 6.79 7.31
Funds Managed by Sankaran Naren & Prakash Gaurav Goel
ICICI Prudential Value Fund - Series 17 0.69 - - 18-Sep-17
S&P BSE 500 TRI Index (Benchmark) -9.03 - -
Nifty 50 TRI Index (Additional Benchmark) -4.37 - -
ICICI Prudential Large & Mid Cap Fund -8.52 4.31 6.37 09-Jul-98
Nifty LargeMidcap 250 TRI Index (Benchmark) -12.21 5.52 5.84
Nifty 50 TRI Index (Additional Benchmark) -4.37 9.31 8.09
ICICI Prudential Value Fund - Series 16 -1.11 - - 11-Aug-17
S&P BSE 500 TRI Index (Benchmark) -9.03 - -
Nifty 50 TRI Index (Additional Benchmark) -4.37 - -
ICICI Prudential Value Fund - Series 12 2.23 - - 17-Apr-17
S&P BSE 500 TRI Index (Benchmark) -9.03 - -
Nifty 50 TRI Index (Additional Benchmark) -4.37 - -
ICICI Prudential Value Fund - Series 18 5.05 - - 25-Oct-17
S&P BSE 500 TRI Index (Benchmark) -9.03 - -
Nifty 50 TRI Index (Additional Benchmark) -4.37 - -
Funds Managed by Priyanka Khandelwal & Rohan Maru
ICICI Prudential Global Stable Equity Fund 1.03 5.94 7.53 13-Sep-13
MSCI World - Net Return Index (Benchmark) 1.44 12.19 9.88
Nifty 50 TRI Index (Additional Benchmark) -4.37 9.31 8.09
ICICI Prudential US Bluechip Equity Fund 4.77 13.00 10.65 06-Jul-12
S&P Index (Benchmark) 4.14 15.34 14.00
Nifty 50 TRI Index (Additional Benchmark) -4.37 9.31 8.09
Funds Managed by Rahul Goswami
ICICI Prudential Constant Maturity Gilt Fund 18.72 9.22 - 12-Sep-14
CRISIL 10 Year Gilt Index (Benchmark) 16.40 6.95 -
Funds Managed by Rahul Goswami & Rohan Maru
ICICI Prudential Liquid Fund 7.29 7.03 7.55 17-Nov-05
Crisil Liquid Fund Index (Benchmark) 7.49 7.13 7.56
1 Year T Bill (Additional Benchmark) 8.38 6.79 7.31
ICICI Prudential Savings Fund 8.77 7.77 8.29 27-Sep-02
Nifty Low Duration Debt Index (Benchmark) 8.59 7.51 8.02
1 Year T Bill (Additional Benchmark) 8.39 6.79 7.31
Funds Managed by Sankaran Naren & Rajat Chandak
ICICI Prudential R.I.G.H.T -13.56 6.79 9.73 26-Sep-09
Nifty 50 TRI Index (Benchmark) -4.37 9.31 8.09
ICICI Prudential Bharat Consumption Fund - Series 4 -6.48 - - 20-Aug-18
Nifty India Consumption TRI Index (Benchmark) -12.07 - -
Nifty 50 TRI Index (Additional Benchmark) -4.37 - -
ICICI Prudential Value Fund - Series 11 -5.78 - - 25-Jan-17
S&P BSE 500 TRI Index (Benchmark) -9.03 - -
Nifty 50 TRI Index (Additional Benchmark) -4.37 - -
ICICI Prudential Long Term Wealth Enhancement Fund -7.97 - - 22-Mar-18
Nifty LargeMidcap 250 TRI Index (Benchmark) -12.21 - -
Nifty 50 TRI Index (Additional Benchmark) -4.37 - -
Funds Managed by Roshan Chutkey
ICICI Prudential Banking & Financial Services Fund -4.64 9.85 14.15 22-Aug-08
Nifty Financial Services TRI Index (Benchmark) 6.62 15.94 14.84
Nifty 50 TRI Index (Additional Benchmark) -4.37 9.31 8.09
Funds Managed by Sankaran Naren & Roshan Chutkey
ICICI Prudential Value Fund - Series 8 -11.47 2.81 - 06-Aug-15
S&P BSE 500 TRI Index (Benchmark) -9.03 7.68 -
Nifty 50 TRI Index (Additional Benchmark) -4.37 9.31 -

ANNEXURE FOR RETURNS OF ALL THE SCHEMES
113
As TRI data is not available since inception of the ICICI Prudential Technology Fund, benchmark performance is calculated using composite CAGR of S&P BSE Information Technology PRI values from 03-Mar-00 to 23-Aug-2004 and TRI values since 23-Aug-2004.
As TRI data is not available since inception of the ICICI Prudential FMCG Fund, benchmark performance is calculated using composite CAGR of Nifty 50 TRI PRI values from 31-Mar-99 to 30-Jun-99 and TRI values since 30-Jun-99.
As TRI data is not available since inception of the ICICI Prudential Large & Mid Cap Fund, benchmark performance is calculated using composite CAGR of Nifty 50 TRI PRI values from 09-Jul-98 to 30-Jun-99 and TRI values since 30-Jun-99.
As TRI data is not available since inception of the ICICI Prudential Multicap Fund, the additional benchmark performance is calculated using composite CAGR of Nifty 50 TRI PRI values from 01-Oct-94 to 30-Jun-99 and TRI values since 30-Jun-99. The benchmark of the scheme has been revised from S&P BSE 200 Index to S&P BSE 500 TRI w.e.f. May 28, 2018.
As TRI data is not available since inception of the ICICI Prudential Value Discovery Fund, benchmark performance is calculated using composite CAGR of S&P BSE 500 TRI PRI values from 16-Aug-04 to 01-Aug-06 and TRI values since 01-Aug-06.
Investors are requested to note that with effect from after the close of business hours on May 25, 2018 ICICI Prudential Dynamic Bond Fund has been merged with ICICI Prudential Banking & PSU Debt Fund. For further information please refer to the addendum No. 018/04/2018 dated April 17, 2018 available on our website.
Investors are requested to note that with effect from after the close of business hours on May 25, 2018 ICICI Prudential Child Care Plan (Study Plan) has been merged with ICICI Prudential Child Care Fund (Gift Plan). For further information please refer to the addendum No. 019/04/2018 dated April 17, 2018 available on our website.
Investors are requested to note that with effect from after the close of business hours on May 25, 2018 Merger of ICICI Prudential Gilt Fund - Investment Plan - PF Option, ICICI Prudential Gilt Fund - Treasury Plan - PF Option, ICICI Prudential Short Term Gilt Fund has been merged with ICICI Prudential Gilt Fund. For further information please refer to the addendum No. 020/04/2018 dated April 17, 2018 available on our website.
Investors are requested to note that with effect from after the close of business hours on May 25, 2018 Monthly Income Plan has been merged with ICICI Prudential Regular Savings Fund. For further information please refer to the addendum No. 021/04/2018 dated April 17, 2018 available on our website.
With effect from November 05, 2018, Triparty Repo has replaced CBLOs for all schemes with provisions to invest in CBLO.
• ICICI Prudential Regular Savings Fund the Equity Portion is managed by Rajat Chandak and Debt Portion by Manish Banthia.• ICICI Prudential Child Care Fund (Gift Plan) the Equity Portion is managed by Ashwin Jain and Debt Portion by Manish Banthia.• ICICI Prudential US Bluechip Equity Fund the US Portion is managed by Priyanka Khandelwal & India Debt Portion is managed by Rohan Maru.
Note :-• ICICI Prudential Balanced Advantage Fund the Equity Portion is managed by Sankaran Naren, Rajat Chandak Ihab Dalwai and Dharmesh Kakkad and Debt Portion by Manish Banthia.• ICICI Prudential Equity - Arbitrage Fund the Equity Portion is managed by Kayzad Eghlim, Dharmesh Kakkad and Debt Portion by Manish Banthia.• ICICI Prudential Equity & Debt Fund the Equity Portion is managed by Sankaran Naren and Atul Patel and Debt Portion by Manish Banthia.• ICICI Prudential Equity Savings Fund the Equity Portion is managed by Sankaran Naren, , Mr Prakash Gaurav Goel and Dharmesh Kakkad Kayzad Eghlim (w.e.f. 5th September 2018) and Debt Portion by Manish Banthia.• ICICI Prudential Multicap Fund is managed by Sankaran Naren and Atul Patel.
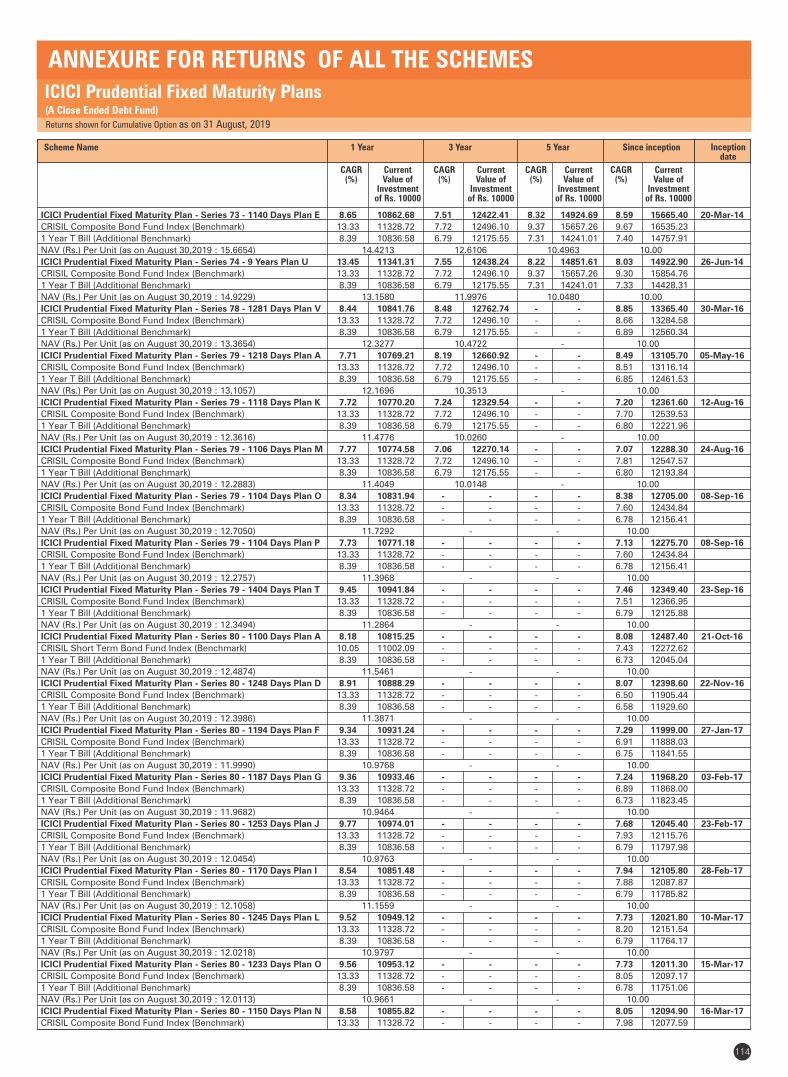
1 Year
CAGR (%)
Current Value of
Investment of Rs. 10000
Scheme Name 3 Year
CAGR (%)
Current Value of
Investment of Rs. 10000
5 Year
CAGR (%)
Current Value of
Investment of Rs. 10000
Since inception
CAGR (%)
Current Value of
Investment of Rs. 10000
Inception date
114
ICICI Prudential Fixed Maturity Plans
Returns shown for Cumulative Option as on 31 August, 2019
(A Close Ended Debt Fund)
ANNEXURE FOR RETURNS OF ALL THE SCHEMES
ICICI Prudential Fixed Maturity Plan - Series 73 - 1140 Days Plan E 8.65 10862.68 7.51 12422.41 8.32 14924.69 8.59 15665.40 20-Mar-14
CRISIL Composite Bond Fund Index (Benchmark) 13.33 11328.72 7.72 12496.10 9.37 15657.26 9.67 16535.23
1 Year T Bill (Additional Benchmark) 8.39 10836.58 6.79 12175.55 7.31 14241.01 7.40 14757.91
NAV (Rs.) Per Unit (as on August 30,2019 : 15.6654) 14.4213 12.6106 10.4963 10.00
ICICI Prudential Fixed Maturity Plan - Series 74 - 9 Years Plan U 13.45 11341.31 7.55 12438.24 8.22 14851.61 8.03 14922.90 26-Jun-14
CRISIL Composite Bond Fund Index (Benchmark) 13.33 11328.72 7.72 12496.10 9.37 15657.26 9.30 15854.76
1 Year T Bill (Additional Benchmark) 8.39 10836.58 6.79 12175.55 7.31 14241.01 7.33 14428.31
NAV (Rs.) Per Unit (as on August 30,2019 : 14.9229) 13.1580 11.9976 10.0480 10.00
ICICI Prudential Fixed Maturity Plan - Series 78 - 1281 Days Plan V 8.44 10841.76 8.48 12762.74 - - 8.85 13365.40 30-Mar-16
CRISIL Composite Bond Fund Index (Benchmark) 13.33 11328.72 7.72 12496.10 - - 8.66 13284.58
1 Year T Bill (Additional Benchmark) 8.39 10836.58 6.79 12175.55 - - 6.89 12560.34
NAV (Rs.) Per Unit (as on August 30,2019 : 13.3654) 12.3277 10.4722 - 10.00
ICICI Prudential Fixed Maturity Plan - Series 79 - 1218 Days Plan A 7.71 10769.21 8.19 12660.92 - - 8.49 13105.70 05-May-16
CRISIL Composite Bond Fund Index (Benchmark) 13.33 11328.72 7.72 12496.10 - - 8.51 13116.14
1 Year T Bill (Additional Benchmark) 8.39 10836.58 6.79 12175.55 - - 6.85 12461.53
NAV (Rs.) Per Unit (as on August 30,2019 : 13.1057) 12.1696 10.3513 - 10.00
ICICI Prudential Fixed Maturity Plan - Series 79 - 1118 Days Plan K 7.72 10770.20 7.24 12329.54 - - 7.20 12361.60 12-Aug-16
CRISIL Composite Bond Fund Index (Benchmark) 13.33 11328.72 7.72 12496.10 - - 7.70 12539.53
1 Year T Bill (Additional Benchmark) 8.39 10836.58 6.79 12175.55 - - 6.80 12221.96
NAV (Rs.) Per Unit (as on August 30,2019 : 12.3616) 11.4776 10.0260 - 10.00
ICICI Prudential Fixed Maturity Plan - Series 79 - 1106 Days Plan M 7.77 10774.58 7.06 12270.14 - - 7.07 12288.30 24-Aug-16
CRISIL Composite Bond Fund Index (Benchmark) 13.33 11328.72 7.72 12496.10 - - 7.81 12547.57
1 Year T Bill (Additional Benchmark) 8.39 10836.58 6.79 12175.55 - - 6.80 12193.84
NAV (Rs.) Per Unit (as on August 30,2019 : 12.2883) 11.4049 10.0148 - 10.00
ICICI Prudential Fixed Maturity Plan - Series 79 - 1104 Days Plan O 8.34 10831.94 - - - - 8.38 12705.00 08-Sep-16
CRISIL Composite Bond Fund Index (Benchmark) 13.33 11328.72 - - - - 7.60 12434.84
1 Year T Bill (Additional Benchmark) 8.39 10836.58 - - - - 6.78 12156.41
NAV (Rs.) Per Unit (as on August 30,2019 : 12.7050) 11.7292 - - 10.00
ICICI Prudential Fixed Maturity Plan - Series 79 - 1104 Days Plan P 7.73 10771.18 - - - - 7.13 12275.70 08-Sep-16
CRISIL Composite Bond Fund Index (Benchmark) 13.33 11328.72 - - - - 7.60 12434.84
1 Year T Bill (Additional Benchmark) 8.39 10836.58 - - - - 6.78 12156.41
NAV (Rs.) Per Unit (as on August 30,2019 : 12.2757) 11.3968 - - 10.00
ICICI Prudential Fixed Maturity Plan - Series 79 - 1404 Days Plan T 9.45 10941.84 - - - - 7.46 12349.40 23-Sep-16
CRISIL Composite Bond Fund Index (Benchmark) 13.33 11328.72 - - - - 7.51 12366.95
1 Year T Bill (Additional Benchmark) 8.39 10836.58 - - - - 6.79 12125.88
NAV (Rs.) Per Unit (as on August 30,2019 : 12.3494) 11.2864 - - 10.00
ICICI Prudential Fixed Maturity Plan - Series 80 - 1100 Days Plan A 8.18 10815.25 - - - - 8.08 12487.40 21-Oct-16
CRISIL Short Term Bond Fund Index (Benchmark) 10.05 11002.09 - - - - 7.43 12272.62
1 Year T Bill (Additional Benchmark) 8.39 10836.58 - - - - 6.73 12045.04
NAV (Rs.) Per Unit (as on August 30,2019 : 12.4874) 11.5461 - - 10.00
ICICI Prudential Fixed Maturity Plan - Series 80 - 1248 Days Plan D 8.91 10888.29 - - - - 8.07 12398.60 22-Nov-16
CRISIL Composite Bond Fund Index (Benchmark) 13.33 11328.72 - - - - 6.50 11905.44
1 Year T Bill (Additional Benchmark) 8.39 10836.58 - - - - 6.58 11929.60
NAV (Rs.) Per Unit (as on August 30,2019 : 12.3986) 11.3871 - - 10.00
ICICI Prudential Fixed Maturity Plan - Series 80 - 1194 Days Plan F 9.34 10931.24 - - - - 7.29 11999.00 27-Jan-17
CRISIL Composite Bond Fund Index (Benchmark) 13.33 11328.72 - - - - 6.91 11888.03
1 Year T Bill (Additional Benchmark) 8.39 10836.58 - - - - 6.75 11841.55
NAV (Rs.) Per Unit (as on August 30,2019 : 11.9990) 10.9768 - - 10.00
ICICI Prudential Fixed Maturity Plan - Series 80 - 1187 Days Plan G 9.36 10933.46 - - - - 7.24 11968.20 03-Feb-17
CRISIL Composite Bond Fund Index (Benchmark) 13.33 11328.72 - - - - 6.89 11868.00
1 Year T Bill (Additional Benchmark) 8.39 10836.58 - - - - 6.73 11823.45
NAV (Rs.) Per Unit (as on August 30,2019 : 11.9682) 10.9464 - - 10.00
ICICI Prudential Fixed Maturity Plan - Series 80 - 1253 Days Plan J 9.77 10974.01 - - - - 7.68 12045.40 23-Feb-17
CRISIL Composite Bond Fund Index (Benchmark) 13.33 11328.72 - - - - 7.93 12115.76
1 Year T Bill (Additional Benchmark) 8.39 10836.58 - - - - 6.79 11797.98
NAV (Rs.) Per Unit (as on August 30,2019 : 12.0454) 10.9763 - - 10.00
ICICI Prudential Fixed Maturity Plan - Series 80 - 1170 Days Plan I 8.54 10851.48 - - - - 7.94 12105.80 28-Feb-17
CRISIL Composite Bond Fund Index (Benchmark) 13.33 11328.72 - - - - 7.88 12087.87
1 Year T Bill (Additional Benchmark) 8.39 10836.58 - - - - 6.79 11785.82
NAV (Rs.) Per Unit (as on August 30,2019 : 12.1058) 11.1559 - - 10.00
ICICI Prudential Fixed Maturity Plan - Series 80 - 1245 Days Plan L 9.52 10949.12 - - - - 7.73 12021.80 10-Mar-17
CRISIL Composite Bond Fund Index (Benchmark) 13.33 11328.72 - - - - 8.20 12151.54
1 Year T Bill (Additional Benchmark) 8.39 10836.58 - - - - 6.79 11764.17
NAV (Rs.) Per Unit (as on August 30,2019 : 12.0218) 10.9797 - - 10.00
ICICI Prudential Fixed Maturity Plan - Series 80 - 1233 Days Plan O 9.56 10953.12 - - - - 7.73 12011.30 15-Mar-17
CRISIL Composite Bond Fund Index (Benchmark) 13.33 11328.72 - - - - 8.05 12097.17
1 Year T Bill (Additional Benchmark) 8.39 10836.58 - - - - 6.78 11751.06
NAV (Rs.) Per Unit (as on August 30,2019 : 12.0113) 10.9661 - - 10.00
ICICI Prudential Fixed Maturity Plan - Series 80 - 1150 Days Plan N 8.58 10855.82 - - - - 8.05 12094.90 16-Mar-17
CRISIL Composite Bond Fund Index (Benchmark) 13.33 11328.72 - - - - 7.98 12077.59

1 Year
CAGR (%)
Current Value of
Investment of Rs. 10000
Scheme Name 3 Year
CAGR (%)
Current Value of
Investment of Rs. 10000
5 Year
CAGR (%)
Current Value of
Investment of Rs. 10000
Since inception
CAGR (%)
Current Value of
Investment of Rs. 10000
Inception date
115
ICICI Prudential Fixed Maturity Plans(A Close Ended Debt Fund)
Returns shown for Cumulative Option as on 31 August, 2019
ANNEXURE FOR RETURNS OF ALL THE SCHEMES
1 Year T Bill (Additional Benchmark) 8.39 10836.58 - - - - 6.78 11749.21
NAV (Rs.) Per Unit (as on August 30,2019 : 12.0949) 11.1414 - - 10.00
ICICI Prudential Fixed Maturity Plan - Series 80 - 1231 Days Plan P 9.65 10962.61 - - - - 7.68 11993.10 17-Mar-17
CRISIL Composite Bond Fund Index (Benchmark) 13.33 11328.72 - - - - 8.00 12078.59
1 Year T Bill (Additional Benchmark) 8.39 10836.58 - - - - 6.78 11747.29
NAV (Rs.) Per Unit (as on August 30,2019 : 11.9931) 10.9400 - - 10.00
ICICI Prudential Fixed Maturity Plan - Series 80 - 1227 Days Plan Q 9.60 10956.99 - - - - 7.71 11989.90 21-Mar-17
CRISIL Composite Bond Fund Index (Benchmark) 13.33 11328.72 - - - - 8.00 12068.80
1 Year T Bill (Additional Benchmark) 8.39 10836.58 - - - - 6.78 11738.21
NAV (Rs.) Per Unit (as on August 30,2019 : 11.9899) 10.9427 - - 10.00
ICICI Prudential Fixed Maturity Plan - Series 80 - 1138 Days Plan R 8.33 10830.51 - - - - 8.00 12049.70 29-Mar-17
CRISIL Composite Bond Fund Index (Benchmark) 13.33 11328.72 - - - - 7.67 11958.86
1 Year T Bill (Additional Benchmark) 8.39 10836.58 - - - - 6.78 11722.56
NAV (Rs.) Per Unit (as on August 30,2019 : 12.0497) 11.1257 - - 10.00
ICICI Prudential Fixed Maturity Plan - Series 80 - 1225 Days Plan T 9.58 10955.12 - - - - 7.61 11943.60 29-Mar-17
CRISIL Composite Bond Fund Index (Benchmark) 13.33 11328.72 - - - - 7.67 11958.86
1 Year T Bill (Additional Benchmark) 8.39 10836.58 - - - - 6.78 11722.56
NAV (Rs.) Per Unit (as on August 30,2019 : 11.9436) 10.9023 - - 10.00
ICICI Prudential Fixed Maturity Plan - Series 80 - 1125 Days Plan S 8.34 10831.18 - - - - 7.99 12044.70 30-Mar-17
CRISIL Composite Bond Fund Index (Benchmark) 13.33 11328.72 - - - - 7.61 11941.26
1 Year T Bill (Additional Benchmark) 8.39 10836.58 - - - - 6.78 11720.72
NAV (Rs.) Per Unit (as on August 30,2019 : 12.0447) 11.1204 - - 10.00
ICICI Prudential Fixed Maturity Plan - Series 80 - 1216 Days Plan U 9.60 10957.34 - - - - 7.53 11920.60 30-Mar-17
CRISIL Composite Bond Fund Index (Benchmark) 13.33 11328.72 - - - - 7.61 11941.26
1 Year T Bill (Additional Benchmark) 8.39 10836.58 - - - - 6.78 11720.72
NAV (Rs.) Per Unit (as on August 30,2019 : 11.9206) 10.8791 - - 10.00
ICICI Prudential Fixed Maturity Plan - Series 81 - 1211 Days Plan A 9.51 10948.02 - - - - 7.46 11856.60 18-Apr-17
CRISIL Composite Bond Fund Index (Benchmark) 13.33 11328.72 - - - - 7.70 11918.55
1 Year T Bill (Additional Benchmark) 8.39 10836.58 - - - - 6.88 11706.53
NAV (Rs.) Per Unit (as on August 30,2019 : 11.8566) 10.8299 - - 10.00
ICICI Prudential Fixed Maturity Plan - Series 81 - 1205 Days Plan B 9.41 10937.89 - - - - 7.41 11826.70 25-Apr-17
CRISIL Composite Bond Fund Index (Benchmark) 13.33 11328.72 - - - - 7.76 11919.39
1 Year T Bill (Additional Benchmark) 8.39 10836.58 - - - - 6.92 11700.58
NAV (Rs.) Per Unit (as on August 30,2019 : 11.8267) 10.8126 - - 10.00
ICICI Prudential Fixed Maturity Plan - Series 81 - 1101 Days Plan C 8.25 10822.83 - - - - 7.20 11765.50 28-Apr-17
CRISIL Composite Bond Fund Index (Benchmark) 13.33 11328.72 - - - - 7.83 11929.66
1 Year T Bill (Additional Benchmark) 8.39 10836.58 - - - - 6.93 11698.50
NAV (Rs.) Per Unit (as on August 30,2019 : 11.7655) 10.8710 - - 10.00
ICICI Prudential Fixed Maturity Plan - Series 81 - 1195 Days Plan D 9.51 10948.35 - - - - 7.32 11798.60 28-Apr-17
CRISIL Composite Bond Fund Index (Benchmark) 13.33 11328.72 - - - - 7.83 11929.66
1 Year T Bill (Additional Benchmark) 8.39 10836.58 - - - - 6.93 11698.50
NAV (Rs.) Per Unit (as on August 30,2019 : 11.7986) 10.7766 - - 10.00
ICICI Prudential Fixed Maturity Plan - Series 81 - 1190 Days Plan F 9.47 10944.67 - - - - 7.33 11783.80 05-May-17
CRISIL Composite Bond Fund Index (Benchmark) 13.33 11328.72 - - - - 7.86 11918.25
1 Year T Bill (Additional Benchmark) 8.39 10836.58 - - - - 6.94 11686.01
NAV (Rs.) Per Unit (as on August 30,2019 : 11.7838) 10.7667 - - 10.00
ICICI Prudential Fixed Maturity Plan - Series 81 - 1116 Days Plan I 8.38 10835.12 - - - - 7.51 11817.00 11-May-17
CRISIL Composite Bond Fund Index (Benchmark) 13.33 11328.72 - - - - 7.85 11900.89
1 Year T Bill (Additional Benchmark) 8.39 10836.58 - - - - 6.96 11676.49
NAV (Rs.) Per Unit (as on August 30,2019 : 11.8170) 10.9062 - - 10.00
ICICI Prudential Fixed Maturity Plan - Series 81 - 1185 Days Plan G 9.52 10949.38 - - - - 7.32 11765.00 12-May-17
CRISIL Composite Bond Fund Index (Benchmark) 13.33 11328.72 - - - - 7.79 11884.97
1 Year T Bill (Additional Benchmark) 8.39 10836.58 - - - - 6.96 11674.98
NAV (Rs.) Per Unit (as on August 30,2019 : 11.7650) 10.7449 - - 10.00
ICICI Prudential Fixed Maturity Plan - Series 81 - 1101 Days Plan E 8.43 10841.04 - - - - 7.26 11750.60 12-May-17
CRISIL Composite Bond Fund Index (Benchmark) 13.33 11328.72 - - - - 7.79 11884.97
1 Year T Bill (Additional Benchmark) 8.39 10836.58 - - - - 6.96 11674.98
NAV (Rs.) Per Unit (as on August 30,2019 : 11.7506) 10.8390 - - 10.00
ICICI Prudential Fixed Maturity Plan - Series 81 - 1178 Days Plan H 9.58 10955.10 - - - - 7.39 11758.00 23-May-17
CRISIL Composite Bond Fund Index (Benchmark) 13.33 11328.72 - - - - 7.56 11800.18
1 Year T Bill (Additional Benchmark) 8.39 10836.58 - - - - 6.97 11652.79
NAV (Rs.) Per Unit (as on August 30,2019 : 11.7580) 10.7329 - - 10.00
ICICI Prudential Fixed Maturity Plan - Series 81 - 1154 Days Plan J 9.29 10926.33 - - - - 7.11 11651.40 09-Jun-17
CRISIL Composite Bond Fund Index (Benchmark) 13.33 11328.72 - - - - 7.00 11623.50
1 Year T Bill (Additional Benchmark) 8.39 10836.58 - - - - 6.97 11617.42
NAV (Rs.) Per Unit (as on August 30,2019 : 11.6514) 10.6636 - - 10.00
ICICI Prudential Fixed Maturity Plan - Series 81 - 1150 Days Plan K 9.54 10951.03 - - - - 7.22 11651.90 21-Jun-17
CRISIL Composite Bond Fund Index (Benchmark) 13.33 11328.72 - - - - 6.96 11588.24
1 Year T Bill (Additional Benchmark) 8.39 10836.58 - - - - 6.98 11594.53
NAV (Rs.) Per Unit (as on August 30,2019 : 11.6519) 10.6400 - - 10.00
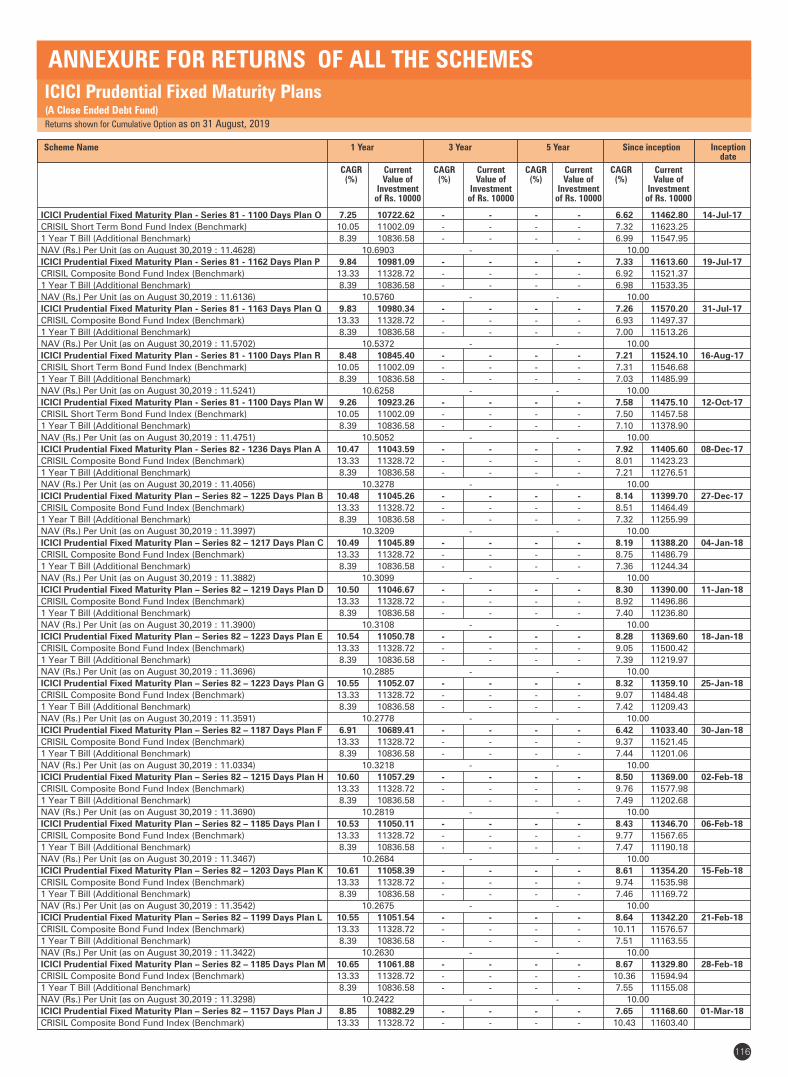
1 Year
CAGR (%)
Current Value of
Investment of Rs. 10000
Scheme Name 3 Year
CAGR (%)
Current Value of
Investment of Rs. 10000
5 Year
CAGR (%)
Current Value of
Investment of Rs. 10000
Since inception
CAGR (%)
Current Value of
Investment of Rs. 10000
Inception date
116
ICICI Prudential Fixed Maturity Plans(A Close Ended Debt Fund)
Returns shown for Cumulative Option as on 31 August, 2019
ANNEXURE FOR RETURNS OF ALL THE SCHEMES
ICICI Prudential Fixed Maturity Plan - Series 81 - 1100 Days Plan O 7.25 10722.62 - - - - 6.62 11462.80 14-Jul-17
CRISIL Short Term Bond Fund Index (Benchmark) 10.05 11002.09 - - - - 7.32 11623.25
1 Year T Bill (Additional Benchmark) 8.39 10836.58 - - - - 6.99 11547.95
NAV (Rs.) Per Unit (as on August 30,2019 : 11.4628) 10.6903 - - 10.00
ICICI Prudential Fixed Maturity Plan - Series 81 - 1162 Days Plan P 9.84 10981.09 - - - - 7.33 11613.60 19-Jul-17
CRISIL Composite Bond Fund Index (Benchmark) 13.33 11328.72 - - - - 6.92 11521.37
1 Year T Bill (Additional Benchmark) 8.39 10836.58 - - - - 6.98 11533.35
NAV (Rs.) Per Unit (as on August 30,2019 : 11.6136) 10.5760 - - 10.00
ICICI Prudential Fixed Maturity Plan - Series 81 - 1163 Days Plan Q 9.83 10980.34 - - - - 7.26 11570.20 31-Jul-17
CRISIL Composite Bond Fund Index (Benchmark) 13.33 11328.72 - - - - 6.93 11497.37
1 Year T Bill (Additional Benchmark) 8.39 10836.58 - - - - 7.00 11513.26
NAV (Rs.) Per Unit (as on August 30,2019 : 11.5702) 10.5372 - - 10.00
ICICI Prudential Fixed Maturity Plan - Series 81 - 1100 Days Plan R 8.48 10845.40 - - - - 7.21 11524.10 16-Aug-17
CRISIL Short Term Bond Fund Index (Benchmark) 10.05 11002.09 - - - - 7.31 11546.68
1 Year T Bill (Additional Benchmark) 8.39 10836.58 - - - - 7.03 11485.99
NAV (Rs.) Per Unit (as on August 30,2019 : 11.5241) 10.6258 - - 10.00
ICICI Prudential Fixed Maturity Plan - Series 81 - 1100 Days Plan W 9.26 10923.26 - - - - 7.58 11475.10 12-Oct-17
CRISIL Short Term Bond Fund Index (Benchmark) 10.05 11002.09 - - - - 7.50 11457.58
1 Year T Bill (Additional Benchmark) 8.39 10836.58 - - - - 7.10 11378.90
NAV (Rs.) Per Unit (as on August 30,2019 : 11.4751) 10.5052 - - 10.00
ICICI Prudential Fixed Maturity Plan - Series 82 - 1236 Days Plan A 10.47 11043.59 - - - - 7.92 11405.60 08-Dec-17
CRISIL Composite Bond Fund Index (Benchmark) 13.33 11328.72 - - - - 8.01 11423.23
1 Year T Bill (Additional Benchmark) 8.39 10836.58 - - - - 7.21 11276.51
NAV (Rs.) Per Unit (as on August 30,2019 : 11.4056) 10.3278 - - 10.00
ICICI Prudential Fixed Maturity Plan – Series 82 – 1225 Days Plan B 10.48 11045.26 - - - - 8.14 11399.70 27-Dec-17
CRISIL Composite Bond Fund Index (Benchmark) 13.33 11328.72 - - - - 8.51 11464.49
1 Year T Bill (Additional Benchmark) 8.39 10836.58 - - - - 7.32 11255.99
NAV (Rs.) Per Unit (as on August 30,2019 : 11.3997) 10.3209 - - 10.00
ICICI Prudential Fixed Maturity Plan – Series 82 – 1217 Days Plan C 10.49 11045.89 - - - - 8.19 11388.20 04-Jan-18
CRISIL Composite Bond Fund Index (Benchmark) 13.33 11328.72 - - - - 8.75 11486.79
1 Year T Bill (Additional Benchmark) 8.39 10836.58 - - - - 7.36 11244.34
NAV (Rs.) Per Unit (as on August 30,2019 : 11.3882) 10.3099 - - 10.00
ICICI Prudential Fixed Maturity Plan – Series 82 – 1219 Days Plan D 10.50 11046.67 - - - - 8.30 11390.00 11-Jan-18
CRISIL Composite Bond Fund Index (Benchmark) 13.33 11328.72 - - - - 8.92 11496.86
1 Year T Bill (Additional Benchmark) 8.39 10836.58 - - - - 7.40 11236.80
NAV (Rs.) Per Unit (as on August 30,2019 : 11.3900) 10.3108 - - 10.00
ICICI Prudential Fixed Maturity Plan – Series 82 – 1223 Days Plan E 10.54 11050.78 - - - - 8.28 11369.60 18-Jan-18
CRISIL Composite Bond Fund Index (Benchmark) 13.33 11328.72 - - - - 9.05 11500.42
1 Year T Bill (Additional Benchmark) 8.39 10836.58 - - - - 7.39 11219.97
NAV (Rs.) Per Unit (as on August 30,2019 : 11.3696) 10.2885 - - 10.00
ICICI Prudential Fixed Maturity Plan – Series 82 – 1223 Days Plan G 10.55 11052.07 - - - - 8.32 11359.10 25-Jan-18
CRISIL Composite Bond Fund Index (Benchmark) 13.33 11328.72 - - - - 9.07 11484.48
1 Year T Bill (Additional Benchmark) 8.39 10836.58 - - - - 7.42 11209.43
NAV (Rs.) Per Unit (as on August 30,2019 : 11.3591) 10.2778 - - 10.00
ICICI Prudential Fixed Maturity Plan – Series 82 – 1187 Days Plan F 6.91 10689.41 - - - - 6.42 11033.40 30-Jan-18
CRISIL Composite Bond Fund Index (Benchmark) 13.33 11328.72 - - - - 9.37 11521.45
1 Year T Bill (Additional Benchmark) 8.39 10836.58 - - - - 7.44 11201.06
NAV (Rs.) Per Unit (as on August 30,2019 : 11.0334) 10.3218 - - 10.00
ICICI Prudential Fixed Maturity Plan – Series 82 – 1215 Days Plan H 10.60 11057.29 - - - - 8.50 11369.00 02-Feb-18
CRISIL Composite Bond Fund Index (Benchmark) 13.33 11328.72 - - - - 9.76 11577.98
1 Year T Bill (Additional Benchmark) 8.39 10836.58 - - - - 7.49 11202.68
NAV (Rs.) Per Unit (as on August 30,2019 : 11.3690) 10.2819 - - 10.00
ICICI Prudential Fixed Maturity Plan – Series 82 – 1185 Days Plan I 10.53 11050.11 - - - - 8.43 11346.70 06-Feb-18
CRISIL Composite Bond Fund Index (Benchmark) 13.33 11328.72 - - - - 9.77 11567.65
1 Year T Bill (Additional Benchmark) 8.39 10836.58 - - - - 7.47 11190.18
NAV (Rs.) Per Unit (as on August 30,2019 : 11.3467) 10.2684 - - 10.00
ICICI Prudential Fixed Maturity Plan – Series 82 – 1203 Days Plan K 10.61 11058.39 - - - - 8.61 11354.20 15-Feb-18
CRISIL Composite Bond Fund Index (Benchmark) 13.33 11328.72 - - - - 9.74 11535.98
1 Year T Bill (Additional Benchmark) 8.39 10836.58 - - - - 7.46 11169.72
NAV (Rs.) Per Unit (as on August 30,2019 : 11.3542) 10.2675 - - 10.00
ICICI Prudential Fixed Maturity Plan – Series 82 – 1199 Days Plan L 10.55 11051.54 - - - - 8.64 11342.20 21-Feb-18
CRISIL Composite Bond Fund Index (Benchmark) 13.33 11328.72 - - - - 10.11 11576.57
1 Year T Bill (Additional Benchmark) 8.39 10836.58 - - - - 7.51 11163.55
NAV (Rs.) Per Unit (as on August 30,2019 : 11.3422) 10.2630 - - 10.00
ICICI Prudential Fixed Maturity Plan – Series 82 – 1185 Days Plan M 10.65 11061.88 - - - - 8.67 11329.80 28-Feb-18
CRISIL Composite Bond Fund Index (Benchmark) 13.33 11328.72 - - - - 10.36 11594.94
1 Year T Bill (Additional Benchmark) 8.39 10836.58 - - - - 7.55 11155.08
NAV (Rs.) Per Unit (as on August 30,2019 : 11.3298) 10.2422 - - 10.00
ICICI Prudential Fixed Maturity Plan – Series 82 – 1157 Days Plan J 8.85 10882.29 - - - - 7.65 11168.60 01-Mar-18
CRISIL Composite Bond Fund Index (Benchmark) 13.33 11328.72 - - - - 10.43 11603.40
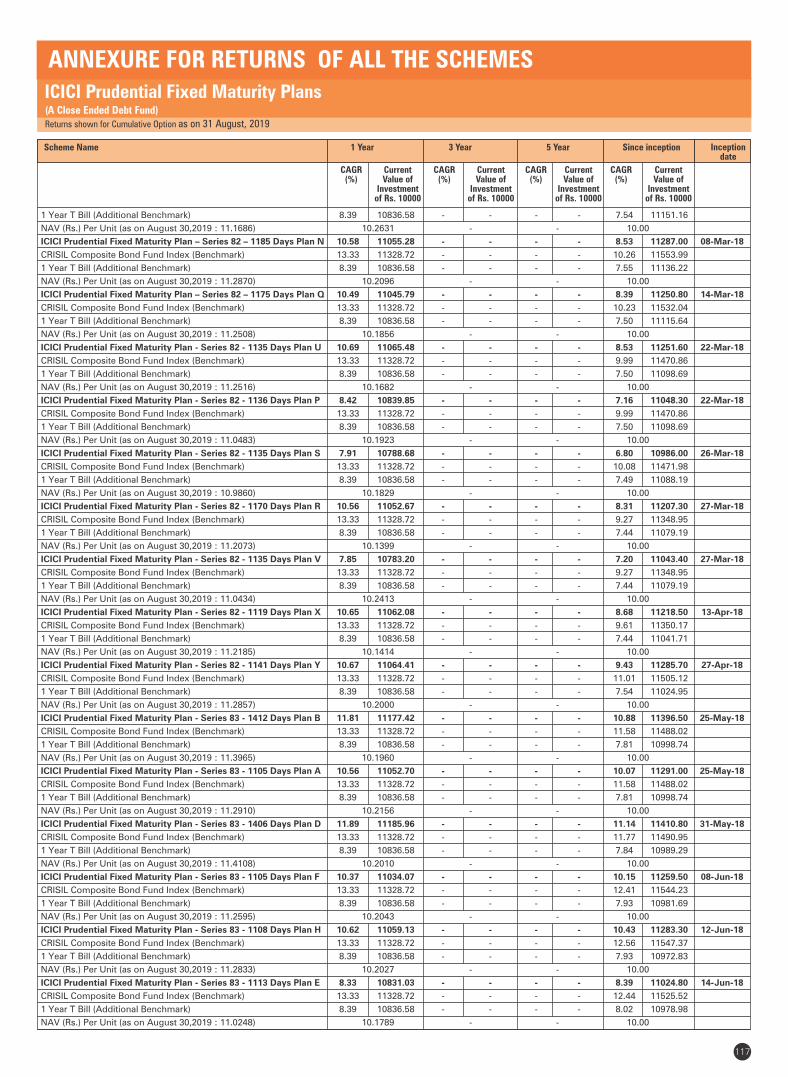
ICICI Prudential Fixed Maturity Plans(A Close Ended Debt Fund)
Returns shown for Cumulative Option as on 31 August, 2019
ANNEXURE FOR RETURNS OF ALL THE SCHEMES
117
1 Year
CAGR (%)
Current Value of
Investment of Rs. 10000
Scheme Name 3 Year
CAGR (%)
Current Value of
Investment of Rs. 10000
5 Year
CAGR (%)
Current Value of
Investment of Rs. 10000
Since inception
CAGR (%)
Current Value of
Investment of Rs. 10000
Inception date
1 Year T Bill (Additional Benchmark) 8.39 10836.58 - - - - 7.54 11151.16
NAV (Rs.) Per Unit (as on August 30,2019 : 11.1686) 10.2631 - - 10.00
ICICI Prudential Fixed Maturity Plan – Series 82 – 1185 Days Plan N 10.58 11055.28 - - - - 8.53 11287.00 08-Mar-18
CRISIL Composite Bond Fund Index (Benchmark) 13.33 11328.72 - - - - 10.26 11553.99
1 Year T Bill (Additional Benchmark) 8.39 10836.58 - - - - 7.55 11136.22
NAV (Rs.) Per Unit (as on August 30,2019 : 11.2870) 10.2096 - - 10.00
ICICI Prudential Fixed Maturity Plan – Series 82 – 1175 Days Plan Q 10.49 11045.79 - - - - 8.39 11250.80 14-Mar-18
CRISIL Composite Bond Fund Index (Benchmark) 13.33 11328.72 - - - - 10.23 11532.04
1 Year T Bill (Additional Benchmark) 8.39 10836.58 - - - - 7.50 11115.64
NAV (Rs.) Per Unit (as on August 30,2019 : 11.2508) 10.1856 - - 10.00
ICICI Prudential Fixed Maturity Plan - Series 82 - 1135 Days Plan U 10.69 11065.48 - - - - 8.53 11251.60 22-Mar-18
CRISIL Composite Bond Fund Index (Benchmark) 13.33 11328.72 - - - - 9.99 11470.86
1 Year T Bill (Additional Benchmark) 8.39 10836.58 - - - - 7.50 11098.69
NAV (Rs.) Per Unit (as on August 30,2019 : 11.2516) 10.1682 - - 10.00
ICICI Prudential Fixed Maturity Plan - Series 82 - 1136 Days Plan P 8.42 10839.85 - - - - 7.16 11048.30 22-Mar-18
CRISIL Composite Bond Fund Index (Benchmark) 13.33 11328.72 - - - - 9.99 11470.86
1 Year T Bill (Additional Benchmark) 8.39 10836.58 - - - - 7.50 11098.69
NAV (Rs.) Per Unit (as on August 30,2019 : 11.0483) 10.1923 - - 10.00
ICICI Prudential Fixed Maturity Plan - Series 82 - 1135 Days Plan S 7.91 10788.68 - - - - 6.80 10986.00 26-Mar-18
CRISIL Composite Bond Fund Index (Benchmark) 13.33 11328.72 - - - - 10.08 11471.98
1 Year T Bill (Additional Benchmark) 8.39 10836.58 - - - - 7.49 11088.19
NAV (Rs.) Per Unit (as on August 30,2019 : 10.9860) 10.1829 - - 10.00
ICICI Prudential Fixed Maturity Plan - Series 82 - 1170 Days Plan R 10.56 11052.67 - - - - 8.31 11207.30 27-Mar-18
CRISIL Composite Bond Fund Index (Benchmark) 13.33 11328.72 - - - - 9.27 11348.95
1 Year T Bill (Additional Benchmark) 8.39 10836.58 - - - - 7.44 11079.19
NAV (Rs.) Per Unit (as on August 30,2019 : 11.2073) 10.1399 - - 10.00
ICICI Prudential Fixed Maturity Plan - Series 82 - 1135 Days Plan V 7.85 10783.20 - - - - 7.20 11043.40 27-Mar-18
CRISIL Composite Bond Fund Index (Benchmark) 13.33 11328.72 - - - - 9.27 11348.95
1 Year T Bill (Additional Benchmark) 8.39 10836.58 - - - - 7.44 11079.19
NAV (Rs.) Per Unit (as on August 30,2019 : 11.0434) 10.2413 - - 10.00
ICICI Prudential Fixed Maturity Plan - Series 82 - 1119 Days Plan X 10.65 11062.08 - - - - 8.68 11218.50 13-Apr-18
CRISIL Composite Bond Fund Index (Benchmark) 13.33 11328.72 - - - - 9.61 11350.17
1 Year T Bill (Additional Benchmark) 8.39 10836.58 - - - - 7.44 11041.71
NAV (Rs.) Per Unit (as on August 30,2019 : 11.2185) 10.1414 - - 10.00
ICICI Prudential Fixed Maturity Plan - Series 82 - 1141 Days Plan Y 10.67 11064.41 - - - - 9.43 11285.70 27-Apr-18
CRISIL Composite Bond Fund Index (Benchmark) 13.33 11328.72 - - - - 11.01 11505.12
1 Year T Bill (Additional Benchmark) 8.39 10836.58 - - - - 7.54 11024.95
NAV (Rs.) Per Unit (as on August 30,2019 : 11.2857) 10.2000 - - 10.00
ICICI Prudential Fixed Maturity Plan - Series 83 - 1412 Days Plan B 11.81 11177.42 - - - - 10.88 11396.50 25-May-18
CRISIL Composite Bond Fund Index (Benchmark) 13.33 11328.72 - - - - 11.58 11488.02
1 Year T Bill (Additional Benchmark) 8.39 10836.58 - - - - 7.81 10998.74
NAV (Rs.) Per Unit (as on August 30,2019 : 11.3965) 10.1960 - - 10.00
ICICI Prudential Fixed Maturity Plan - Series 83 - 1105 Days Plan A 10.56 11052.70 - - - - 10.07 11291.00 25-May-18
CRISIL Composite Bond Fund Index (Benchmark) 13.33 11328.72 - - - - 11.58 11488.02
1 Year T Bill (Additional Benchmark) 8.39 10836.58 - - - - 7.81 10998.74
NAV (Rs.) Per Unit (as on August 30,2019 : 11.2910) 10.2156 - - 10.00
ICICI Prudential Fixed Maturity Plan - Series 83 - 1406 Days Plan D 11.89 11185.96 - - - - 11.14 11410.80 31-May-18
CRISIL Composite Bond Fund Index (Benchmark) 13.33 11328.72 - - - - 11.77 11490.95
1 Year T Bill (Additional Benchmark) 8.39 10836.58 - - - - 7.84 10989.29
NAV (Rs.) Per Unit (as on August 30,2019 : 11.4108) 10.2010 - - 10.00
ICICI Prudential Fixed Maturity Plan - Series 83 - 1105 Days Plan F 10.37 11034.07 - - - - 10.15 11259.50 08-Jun-18
CRISIL Composite Bond Fund Index (Benchmark) 13.33 11328.72 - - - - 12.41 11544.23
1 Year T Bill (Additional Benchmark) 8.39 10836.58 - - - - 7.93 10981.69
NAV (Rs.) Per Unit (as on August 30,2019 : 11.2595) 10.2043 - - 10.00
ICICI Prudential Fixed Maturity Plan - Series 83 - 1108 Days Plan H 10.62 11059.13 - - - - 10.43 11283.30 12-Jun-18
CRISIL Composite Bond Fund Index (Benchmark) 13.33 11328.72 - - - - 12.56 11547.37
1 Year T Bill (Additional Benchmark) 8.39 10836.58 - - - - 7.93 10972.83
NAV (Rs.) Per Unit (as on August 30,2019 : 11.2833) 10.2027 - - 10.00
ICICI Prudential Fixed Maturity Plan - Series 83 - 1113 Days Plan E 8.33 10831.03 - - - - 8.39 11024.80 14-Jun-18
CRISIL Composite Bond Fund Index (Benchmark) 13.33 11328.72 - - - - 12.44 11525.52
1 Year T Bill (Additional Benchmark) 8.39 10836.58 - - - - 8.02 10978.98
NAV (Rs.) Per Unit (as on August 30,2019 : 11.0248) 10.1789 - - 10.00
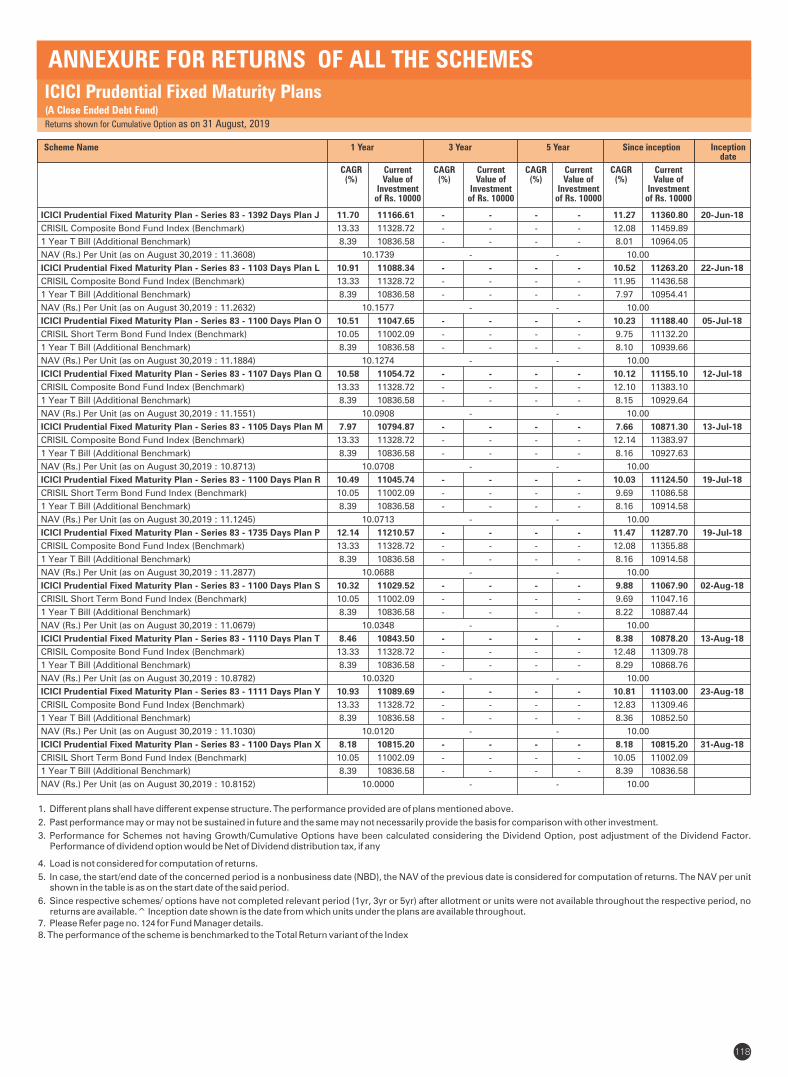
ICICI Prudential Fixed Maturity Plans(A Close Ended Debt Fund)
Returns shown for Cumulative Option as on 31 August, 2019
ANNEXURE FOR RETURNS OF ALL THE SCHEMES
118
1. Different plans shall have different expense structure. The performance provided are of plans mentioned above.
2. Past performance may or may not be sustained in future and the same may not necessarily provide the basis for comparison with other investment.
3. Performance for Schemes not having Growth/Cumulative Options have been calculated considering the Dividend Option, post adjustment of the Dividend Factor. Performance of dividend option would be Net of Dividend distribution tax, if any
4. Load is not considered for computation of returns.
5. In case, the start/end date of the concerned period is a nonbusiness date (NBD), the NAV of the previous date is considered for computation of returns. The NAV per unit shown in the table is as on the start date of the said period.
6. Since respective schemes/ options have not completed relevant period (1yr, 3yr or 5yr) after allotment or units were not available throughout the respective period, no returns are available.^ Inception date shown is the date from which units under the plans are available throughout.
7. Please Refer page no. 124 for Fund Manager details.
8. The performance of the scheme is benchmarked to the Total Return variant of the Index
1 Year
CAGR (%)
Current Value of
Investment of Rs. 10000
Scheme Name 3 Year
CAGR (%)
Current Value of
Investment of Rs. 10000
5 Year
CAGR (%)
Current Value of
Investment of Rs. 10000
Since inception
CAGR (%)
Current Value of
Investment of Rs. 10000
Inception date
ICICI Prudential Fixed Maturity Plan - Series 83 - 1392 Days Plan J 11.70 11166.61 - - - - 11.27 11360.80 20-Jun-18
CRISIL Composite Bond Fund Index (Benchmark) 13.33 11328.72 - - - - 12.08 11459.89
1 Year T Bill (Additional Benchmark) 8.39 10836.58 - - - - 8.01 10964.05
NAV (Rs.) Per Unit (as on August 30,2019 : 11.3608) 10.1739 - - 10.00
ICICI Prudential Fixed Maturity Plan - Series 83 - 1103 Days Plan L 10.91 11088.34 - - - - 10.52 11263.20 22-Jun-18
CRISIL Composite Bond Fund Index (Benchmark) 13.33 11328.72 - - - - 11.95 11436.58
1 Year T Bill (Additional Benchmark) 8.39 10836.58 - - - - 7.97 10954.41
NAV (Rs.) Per Unit (as on August 30,2019 : 11.2632) 10.1577 - - 10.00
ICICI Prudential Fixed Maturity Plan - Series 83 - 1100 Days Plan O 10.51 11047.65 - - - - 10.23 11188.40 05-Jul-18
CRISIL Short Term Bond Fund Index (Benchmark) 10.05 11002.09 - - - - 9.75 11132.20
1 Year T Bill (Additional Benchmark) 8.39 10836.58 - - - - 8.10 10939.66
NAV (Rs.) Per Unit (as on August 30,2019 : 11.1884) 10.1274 - - 10.00
ICICI Prudential Fixed Maturity Plan - Series 83 - 1107 Days Plan Q 10.58 11054.72 - - - - 10.12 11155.10 12-Jul-18
CRISIL Composite Bond Fund Index (Benchmark) 13.33 11328.72 - - - - 12.10 11383.10
1 Year T Bill (Additional Benchmark) 8.39 10836.58 - - - - 8.15 10929.64
NAV (Rs.) Per Unit (as on August 30,2019 : 11.1551) 10.0908 - - 10.00
ICICI Prudential Fixed Maturity Plan - Series 83 - 1105 Days Plan M 7.97 10794.87 - - - - 7.66 10871.30 13-Jul-18
CRISIL Composite Bond Fund Index (Benchmark) 13.33 11328.72 - - - - 12.14 11383.97
1 Year T Bill (Additional Benchmark) 8.39 10836.58 - - - - 8.16 10927.63
NAV (Rs.) Per Unit (as on August 30,2019 : 10.8713) 10.0708 - - 10.00
ICICI Prudential Fixed Maturity Plan - Series 83 - 1100 Days Plan R 10.49 11045.74 - - - - 10.03 11124.50 19-Jul-18
CRISIL Short Term Bond Fund Index (Benchmark) 10.05 11002.09 - - - - 9.69 11086.58
1 Year T Bill (Additional Benchmark) 8.39 10836.58 - - - - 8.16 10914.58
NAV (Rs.) Per Unit (as on August 30,2019 : 11.1245) 10.0713 - - 10.00
ICICI Prudential Fixed Maturity Plan - Series 83 - 1735 Days Plan P 12.14 11210.57 - - - - 11.47 11287.70 19-Jul-18
CRISIL Composite Bond Fund Index (Benchmark) 13.33 11328.72 - - - - 12.08 11355.88
1 Year T Bill (Additional Benchmark) 8.39 10836.58 - - - - 8.16 10914.58
NAV (Rs.) Per Unit (as on August 30,2019 : 11.2877) 10.0688 - - 10.00
ICICI Prudential Fixed Maturity Plan - Series 83 - 1100 Days Plan S 10.32 11029.52 - - - - 9.88 11067.90 02-Aug-18
CRISIL Short Term Bond Fund Index (Benchmark) 10.05 11002.09 - - - - 9.69 11047.16
1 Year T Bill (Additional Benchmark) 8.39 10836.58 - - - - 8.22 10887.44
NAV (Rs.) Per Unit (as on August 30,2019 : 11.0679) 10.0348 - - 10.00
ICICI Prudential Fixed Maturity Plan - Series 83 - 1110 Days Plan T 8.46 10843.50 - - - - 8.38 10878.20 13-Aug-18
CRISIL Composite Bond Fund Index (Benchmark) 13.33 11328.72 - - - - 12.48 11309.78
1 Year T Bill (Additional Benchmark) 8.39 10836.58 - - - - 8.29 10868.76
NAV (Rs.) Per Unit (as on August 30,2019 : 10.8782) 10.0320 - - 10.00
ICICI Prudential Fixed Maturity Plan - Series 83 - 1111 Days Plan Y 10.93 11089.69 - - - - 10.81 11103.00 23-Aug-18
CRISIL Composite Bond Fund Index (Benchmark) 13.33 11328.72 - - - - 12.83 11309.46
1 Year T Bill (Additional Benchmark) 8.39 10836.58 - - - - 8.36 10852.50
NAV (Rs.) Per Unit (as on August 30,2019 : 11.1030) 10.0120 - - 10.00
ICICI Prudential Fixed Maturity Plan - Series 83 - 1100 Days Plan X 8.18 10815.20 - - - - 8.18 10815.20 31-Aug-18
CRISIL Short Term Bond Fund Index (Benchmark) 10.05 11002.09 - - - - 10.05 11002.09
1 Year T Bill (Additional Benchmark) 8.39 10836.58 - - - - 8.39 10836.58
NAV (Rs.) Per Unit (as on August 30,2019 : 10.8152) 10.0000 - - 10.00
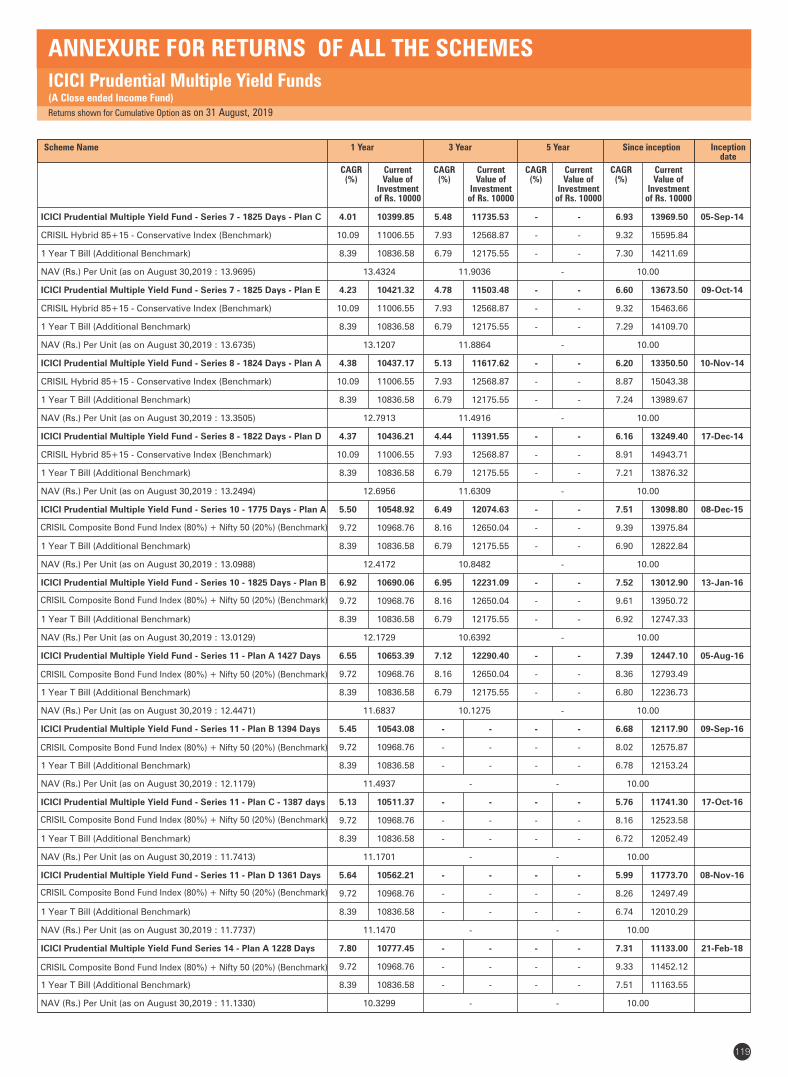
119
Returns shown for Cumulative Option as on 31 August, 2019
ICICI Prudential Multiple Yield Funds(A Close ended Income Fund)
ANNEXURE FOR RETURNS OF ALL THE SCHEMES
1 Year
CAGR (%)
Current Value of
Investment of Rs. 10000
Scheme Name 3 Year
CAGR (%)
Current Value of
Investment of Rs. 10000
5 Year
CAGR (%)
Current Value of
Investment of Rs. 10000
Since inception
CAGR (%)
Current Value of
Investment of Rs. 10000
Inception date
ICICI Prudential Multiple Yield Fund - Series 7 - 1825 Days - Plan C 4.01 10399.85 5.48 11735.53 - - 6.93 13969.50 05-Sep-14
CRISIL Hybrid 85+15 - Conservative Index (Benchmark) 10.09 11006.55 7.93 12568.87 - - 9.32 15595.84
1 Year T Bill (Additional Benchmark) 8.39 10836.58 6.79 12175.55 - - 7.30 14211.69
NAV (Rs.) Per Unit (as on August 30,2019 : 13.9695) 13.4324 11.9036 - 10.00
ICICI Prudential Multiple Yield Fund - Series 7 - 1825 Days - Plan E 4.23 10421.32 4.78 11503.48 - - 6.60 13673.50 09-Oct-14
CRISIL Hybrid 85+15 - Conservative Index (Benchmark) 10.09 11006.55 7.93 12568.87 - - 9.32 15463.66
1 Year T Bill (Additional Benchmark) 8.39 10836.58 6.79 12175.55 - - 7.29 14109.70
NAV (Rs.) Per Unit (as on August 30,2019 : 13.6735) 13.1207 11.8864 - 10.00
ICICI Prudential Multiple Yield Fund - Series 8 - 1824 Days - Plan A 4.38 10437.17 5.13 11617.62 - - 6.20 13350.50 10-Nov-14
CRISIL Hybrid 85+15 - Conservative Index (Benchmark) 10.09 11006.55 7.93 12568.87 - - 8.87 15043.38
1 Year T Bill (Additional Benchmark) 8.39 10836.58 6.79 12175.55 - - 7.24 13989.67
NAV (Rs.) Per Unit (as on August 30,2019 : 13.3505) 12.7913 11.4916 - 10.00
ICICI Prudential Multiple Yield Fund - Series 8 - 1822 Days - Plan D 4.37 10436.21 4.44 11391.55 - - 6.16 13249.40 17-Dec-14
CRISIL Hybrid 85+15 - Conservative Index (Benchmark) 10.09 11006.55 7.93 12568.87 - - 8.91 14943.71
1 Year T Bill (Additional Benchmark) 8.39 10836.58 6.79 12175.55 - - 7.21 13876.32
NAV (Rs.) Per Unit (as on August 30,2019 : 13.2494) 12.6956 11.6309 - 10.00
ICICI Prudential Multiple Yield Fund - Series 10 - 1775 Days - Plan A 5.50 10548.92 6.49 12074.63 - - 7.51 13098.80 08-Dec-15
9.72 10968.76 8.16 12650.04 - - 9.39 13975.84
1 Year T Bill (Additional Benchmark) 8.39 10836.58 6.79 12175.55 - - 6.90 12822.84
NAV (Rs.) Per Unit (as on August 30,2019 : 13.0988) 12.4172 10.8482 - 10.00
ICICI Prudential Multiple Yield Fund - Series 10 - 1825 Days - Plan B 6.92 10690.06 6.95 12231.09 - - 7.52 13012.90 13-Jan-16
9.72 10968.76 8.16 12650.04 - - 9.61 13950.72
1 Year T Bill (Additional Benchmark) 8.39 10836.58 6.79 12175.55 - - 6.92 12747.33
NAV (Rs.) Per Unit (as on August 30,2019 : 13.0129) 12.1729 10.6392 - 10.00
ICICI Prudential Multiple Yield Fund - Series 11 - Plan A 1427 Days 6.55 10653.39 7.12 12290.40 - - 7.39 12447.10 05-Aug-16
9.72 10968.76 8.16 12650.04 - - 8.36 12793.49
1 Year T Bill (Additional Benchmark) 8.39 10836.58 6.79 12175.55 - - 6.80 12236.73
NAV (Rs.) Per Unit (as on August 30,2019 : 12.4471) 11.6837 10.1275 - 10.00
ICICI Prudential Multiple Yield Fund - Series 11 - Plan B 1394 Days 5.45 10543.08 - - - - 6.68 12117.90 09-Sep-16
9.72 10968.76 - - - - 8.02 12575.87
1 Year T Bill (Additional Benchmark) 8.39 10836.58 - - - - 6.78 12153.24
NAV (Rs.) Per Unit (as on August 30,2019 : 12.1179) 11.4937 - - 10.00
ICICI Prudential Multiple Yield Fund - Series 11 - Plan C - 1387 days 5.13 10511.37 - - - - 5.76 11741.30 17-Oct-16
9.72 10968.76 - - - - 8.16 12523.58
1 Year T Bill (Additional Benchmark) 8.39 10836.58 - - - - 6.72 12052.49
NAV (Rs.) Per Unit (as on August 30,2019 : 11.7413) 11.1701 - - 10.00
ICICI Prudential Multiple Yield Fund - Series 11 - Plan D 1361 Days 5.64 10562.21 - - - - 5.99 11773.70 08-Nov-16
9.72 10968.76 - - - - 8.26 12497.49
1 Year T Bill (Additional Benchmark) 8.39 10836.58 - - - - 6.74 12010.29
NAV (Rs.) Per Unit (as on August 30,2019 : 11.7737) 11.1470 - - 10.00
ICICI Prudential Multiple Yield Fund Series 14 - Plan A 1228 Days 7.80 10777.45 - - - - 7.31 11133.00 21-Feb-18
9.72 10968.76 - - - - 9.33 11452.12
1 Year T Bill (Additional Benchmark) 8.39 10836.58 - - - - 7.51 11163.55
NAV (Rs.) Per Unit (as on August 30,2019 : 11.1330) 10.3299 - - 10.00
CRISIL Composite Bond Fund Index (80%) + Nifty 50 (20%) (Benchmark)
CRISIL Composite Bond Fund Index (80%) + Nifty 50 (20%) (Benchmark)
CRISIL Composite Bond Fund Index (80%) + Nifty 50 (20%) (Benchmark)
CRISIL Composite Bond Fund Index (80%) + Nifty 50 (20%) (Benchmark)
CRISIL Composite Bond Fund Index (80%) + Nifty 50 (20%) (Benchmark)
CRISIL Composite Bond Fund Index (80%) + Nifty 50 (20%) (Benchmark)
CRISIL Composite Bond Fund Index (80%) + Nifty 50 (20%) (Benchmark)

120
ICICI Prudential Multiple Yield Funds(A Close ended Income Fund)
Returns shown for Cumulative Option as on 31 August, 2019
ANNEXURE FOR RETURNS OF ALL THE SCHEMES
1. Different plans shall have different expense structure. The performance provided are of plans mentioned above.
2. Past performance may or may not be sustained in future and the same may not necessarily provide the basis for comparison with other investment.
3. Performance for Schemes not having Growth/Cumulative Options have been calculated considering the Dividend Option, post adjustment of the Dividend Factor. Performance of dividend option would be Net of Dividend distribution tax, if any
4. Load is not considered for computation of returns.
5. In case, the start/end date of the concerned period is a nonbusiness date (NBD), the NAV of the previous date is considered for computation of returns. The NAV per unit shown in the table is as on the start date of the said period.
6. Since respective schemes/ options have not completed relevant period (1yr, 3yr or 5yr) after allotment or units were not available throughout the respective period, no returns are available.^ Inception date shown is the date from which units under the plans are available throughout.
7. Please Refer page no. 124 for Fund Manager details.
8. The performance of the scheme is benchmarked to the Total Return variant of the Index
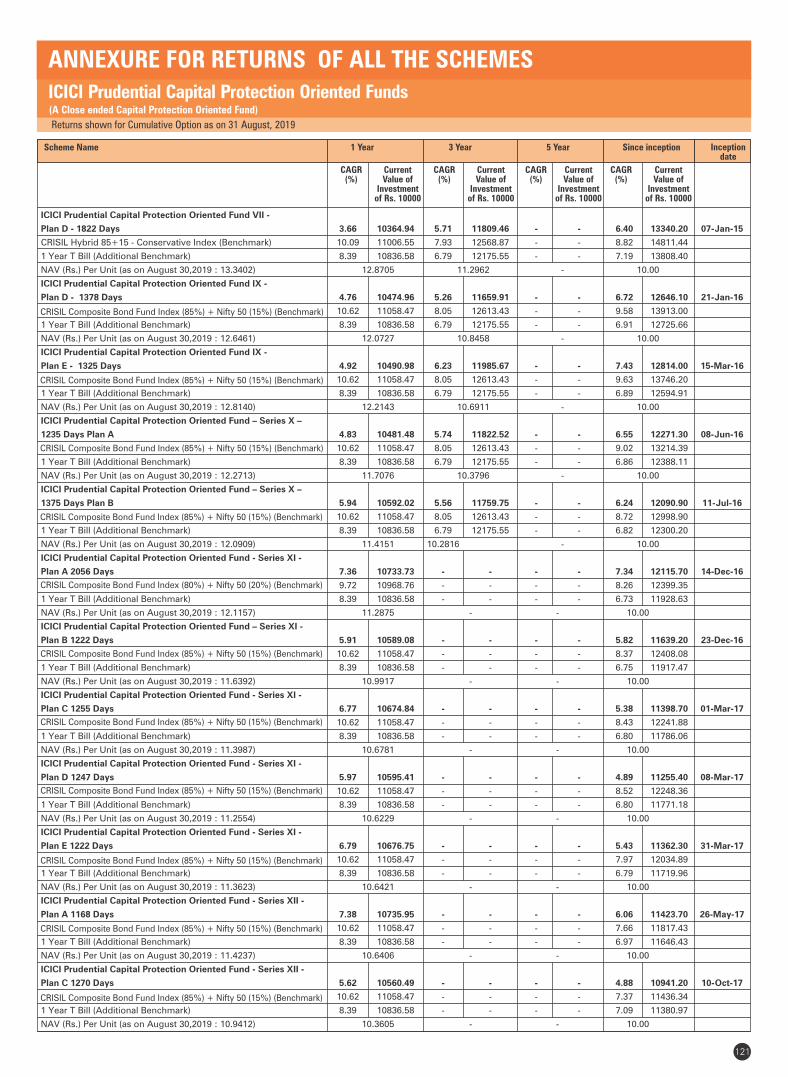
121
ICICI Prudential Capital Protection Oriented Funds(A Close ended Capital Protection Oriented Fund)
Returns shown for Cumulative Option as on 31 August, 2019
ANNEXURE FOR RETURNS OF ALL THE SCHEMES
1 Year
CAGR (%)
Current Value of
Investment of Rs. 10000
Scheme Name 3 Year
CAGR (%)
Current Value of
Investment of Rs. 10000
5 Year
CAGR (%)
Current Value of
Investment of Rs. 10000
Since inception
CAGR (%)
Current Value of
Investment of Rs. 10000
Inception date
ICICI Prudential Capital Protection Oriented Fund VII -
Plan D - 1822 Days 3.66 10364.94 5.71 11809.46 - - 6.40 13340.20 07-Jan-15
CRISIL Hybrid 85+15 - Conservative Index (Benchmark) 10.09 11006.55 7.93 12568.87 - - 8.82 14811.44
1 Year T Bill (Additional Benchmark) 8.39 10836.58 6.79 12175.55 - - 7.19 13808.40
NAV (Rs.) Per Unit (as on August 30,2019 : 13.3402) 12.8705 11.2962 - 10.00
ICICI Prudential Capital Protection Oriented Fund IX -
Plan D - 1378 Days 4.76 10474.96 5.26 11659.91 - - 6.72 12646.10 21-Jan-16
10.62 11058.47 8.05 12613.43 - - 9.58 13913.00
1 Year T Bill (Additional Benchmark) 8.39 10836.58 6.79 12175.55 - - 6.91 12725.66
NAV (Rs.) Per Unit (as on August 30,2019 : 12.6461) 12.0727 10.8458 - 10.00
ICICI Prudential Capital Protection Oriented Fund IX -
Plan E - 1325 Days 4.92 10490.98 6.23 11985.67 - - 7.43 12814.00 15-Mar-16
10.62 11058.47 8.05 12613.43 - - 9.63 13746.20
1 Year T Bill (Additional Benchmark) 8.39 10836.58 6.79 12175.55 - - 6.89 12594.91
NAV (Rs.) Per Unit (as on August 30,2019 : 12.8140) 12.2143 10.6911 - 10.00
ICICI Prudential Capital Protection Oriented Fund – Series X –
1235 Days Plan A 4.83 10481.48 5.74 11822.52 - - 6.55 12271.30 08-Jun-16
10.62 11058.47 8.05 12613.43 - - 9.02 13214.39
1 Year T Bill (Additional Benchmark) 8.39 10836.58 6.79 12175.55 - - 6.86 12388.11
NAV (Rs.) Per Unit (as on August 30,2019 : 12.2713) 11.7076 10.3796 - 10.00
ICICI Prudential Capital Protection Oriented Fund – Series X –
1375 Days Plan B 5.94 10592.02 5.56 11759.75 - - 6.24 12090.90 11-Jul-16
10.62 11058.47 8.05 12613.43 - - 8.72 12998.90
1 Year T Bill (Additional Benchmark) 8.39 10836.58 6.79 12175.55 - - 6.82 12300.20
NAV (Rs.) Per Unit (as on August 30,2019 : 12.0909) 11.4151 10.2816 - 10.00
ICICI Prudential Capital Protection Oriented Fund - Series XI -
Plan A 2056 Days 7.36 10733.73 - - - - 7.34 12115.70 14-Dec-16
9.72 10968.76 - - - - 8.26 12399.35
1 Year T Bill (Additional Benchmark) 8.39 10836.58 - - - - 6.73 11928.63
NAV (Rs.) Per Unit (as on August 30,2019 : 12.1157) 11.2875 - - 10.00
ICICI Prudential Capital Protection Oriented Fund – Series XI -
Plan B 1222 Days 5.91 10589.08 - - - - 5.82 11639.20 23-Dec-16
10.62 11058.47 - - - - 8.37 12408.08
1 Year T Bill (Additional Benchmark) 8.39 10836.58 - - - - 6.75 11917.47
NAV (Rs.) Per Unit (as on August 30,2019 : 11.6392) 10.9917 - - 10.00
ICICI Prudential Capital Protection Oriented Fund - Series XI -
Plan C 1255 Days 6.77 10674.84 - - - - 5.38 11398.70 01-Mar-17
10.62 11058.47 - - - - 8.43 12241.88
1 Year T Bill (Additional Benchmark) 8.39 10836.58 - - - - 6.80 11786.06
NAV (Rs.) Per Unit (as on August 30,2019 : 11.3987) 10.6781 - - 10.00
ICICI Prudential Capital Protection Oriented Fund - Series XI -
Plan D 1247 Days 5.97 10595.41 - - - - 4.89 11255.40 08-Mar-17
10.62 11058.47 - - - - 8.52 12248.36
1 Year T Bill (Additional Benchmark) 8.39 10836.58 - - - - 6.80 11771.18
NAV (Rs.) Per Unit (as on August 30,2019 : 11.2554) 10.6229 - - 10.00
ICICI Prudential Capital Protection Oriented Fund - Series XI -
Plan E 1222 Days 6.79 10676.75 - - - - 5.43 11362.30 31-Mar-17
10.62 11058.47 - - - - 7.97 12034.89
1 Year T Bill (Additional Benchmark) 8.39 10836.58 - - - - 6.79 11719.96
NAV (Rs.) Per Unit (as on August 30,2019 : 11.3623) 10.6421 - - 10.00
ICICI Prudential Capital Protection Oriented Fund - Series XII -
Plan A 1168 Days 7.38 10735.95 - - - - 6.06 11423.70 26-May-17
10.62 11058.47 - - - - 7.66 11817.43
1 Year T Bill (Additional Benchmark) 8.39 10836.58 - - - - 6.97 11646.43
NAV (Rs.) Per Unit (as on August 30,2019 : 11.4237) 10.6406 - - 10.00
ICICI Prudential Capital Protection Oriented Fund - Series XII -
Plan C 1270 Days 5.62 10560.49 - - - - 4.88 10941.20 10-Oct-17
10.62 11058.47 - - - - 7.37 11436.34
1 Year T Bill (Additional Benchmark) 8.39 10836.58 - - - - 7.09 11380.97
NAV (Rs.) Per Unit (as on August 30,2019 : 10.9412) 10.3605 - - 10.00
CRISIL Composite Bond Fund Index (85%) + Nifty 50 (15%) (Benchmark)
CRISIL Composite Bond Fund Index (85%) + Nifty 50 (15%) (Benchmark)
CRISIL Composite Bond Fund Index (85%) + Nifty 50 (15%) (Benchmark)
CRISIL Composite Bond Fund Index (85%) + Nifty 50 (15%) (Benchmark)
CRISIL Composite Bond Fund Index (85%) + Nifty 50 (15%) (Benchmark)
CRISIL Composite Bond Fund Index (85%) + Nifty 50 (15%) (Benchmark)
CRISIL Composite Bond Fund Index (80%) + Nifty 50 (20%) (Benchmark)
CRISIL Composite Bond Fund Index (85%) + Nifty 50 (15%) (Benchmark)
CRISIL Composite Bond Fund Index (85%) + Nifty 50 (15%) (Benchmark)
CRISIL Composite Bond Fund Index (85%) + Nifty 50 (15%) (Benchmark)
CRISIL Composite Bond Fund Index (85%) + Nifty 50 (15%) (Benchmark)

122
ICICI Prudential Capital Protection Oriented Funds (A Close ended Capital Protection Oriented Fund)
Returns shown for Cumulative Option as on 31 August, 2019
ANNEXURE FOR RETURNS OF ALL THE SCHEMES
1. Different plans shall have different expense structure. The performance provided are of plans mentioned above.
2. Past performance may or may not be sustained in future and the same may not necessarily provide the basis for comparison with other investment.
3. Performance for Schemes not having Growth/Cumulative Options have been calculated considering the Dividend Option, post adjustment of the Dividend Factor. Performance of dividend option would be Net of Dividend distribution tax, if any
4. Load is not considered for computation of returns.
5. In case, the start/end date of the concerned period is a nonbusiness date (NBD), the NAV of the previous date is considered for computation of returns. The NAV per unit shown in the table is as on the start date of the said period.
6. Since respective schemes/ options have not completed relevant period (1yr, 3yr or 5yr) after allotment or units were not available throughout the respective period, no returns are available.^ Inception date shown is the date from which units under the plans are available throughout.
7. Please Refer page no. 124 for Fund Manager details.
8. The performance of the scheme is benchmarked to the Total Return variant of the Index
“The Scheme offered is “oriented towards protection of capital” and “not with guaranteed returns”.The orientation towards protection of the capital originates from the portfolio structure of the Scheme and not from any bank guarantee, insurance cover etc. The ability of the portfolio to meet capital protection on maturity to the investors can be impacted in certain circumstances including changes in government policies, interest rate movements in the market, credit defaults by bonds, expenses, reinvestment risk and risk associated with trading volumes, liquidity and settlement systems in equity and debt markets. Accordingly, investors may lose part or all of their investment (including original amount invested) in the Scheme. No guarantee or assurance, express or implied, is given that investors will receive the capital protected value at maturity or any other returns. Investors in the Scheme are not being offered any guaranteed / assured returns.”

Returns shown for Cumulative Option as on 31 August, 2019
ICICI Prudential Fund of Fund Series(Open ended fund of funds scheme investing in Domestic Mutual Fund schemes)
WHY SHOULD ONE INVEST?Customised investment solutions to match risk return profile.
ANNEXURE FOR RETURNS OF ALL THE SCHEMES
123
1 Year
CAGR (%)
Current Value of
Investment of Rs. 10000
Scheme Name 3 Year
CAGR (%)
Current Value of
Investment of Rs. 10000
5 Year
CAGR (%)
Current Value of
Investment of Rs. 10000
Since inception
CAGR (%)
Current Value of
Investment of Rs. 10000
Inception date
ICICI Prudential Moderate Fund 7.49 10747.10 6.83 12189.63 7.23 14186.59 8.33 35159.90 18-Dec-03
9.48 10944.95 7.77 12515.15 8.69 15181.17 8.22 34598.16
NAV (Rs.) Per Unit (as on August 30,2019 : 35.1599) 32.7157 28.8441 24.7839 10.00
ICICI Prudential Thematic Advantage Fund -12.71 8732.51 4.59 11441.02 7.61 14437.42 12.78 66173.50 18-Dec-03
Nifty 200 TRI Index (Benchmark) -5.66 9435.04 7.40 12384.66 7.26 14204.51 13.21 70232.36
NAV (Rs.) Per Unit (as on August 30,2019 : 66.1735) 75.7783 57.8388 45.8347 10.00 10.00
ICICI Prudential Debt Management Fund 8.12 10809.63 7.30 12350.43 9.22 15556.87 7.30 30266.20 18-Dec-03
CRISIL Composite Bond Fund Index (Benchmark) 13.33 11328.72 8.05 12610.82 9.13 15487.07 7.18 29733.75
NAV (Rs.) Per Unit (as on August 30,2019 : 30.2662) 27.9993 24.5062 19.4552 10.00
ICICI Prudential Passive Strategy Fund -7.63 9239.06 6.61 12114.36 7.89 14625.17 12.45 63151.20 18-Dec-03
Nifty 200 TRI Index (Benchmark) -5.66 9435.04 6.32 12016.09 7.18 14153.10 11.88 58306.62
NAV (Rs.) Per Unit (as on August 30,2019 : 63.1512) 68.3524 52.1292 43.1798 10.00
ICICI Prudential Asset Allocator Fund 5.36 10534.99 9.29 13052.06 9.95 16078.05 11.54 55612.20 18-Dec-03
CRISIL Hybrid 50 + 50 - Moderate Index (Benchmark) 4.90 10488.77 7.94 12574.47 8.39 14973.81 10.23 46172.45
NAV (Rs.) Per Unit (as on August 30,2019 : 55.6122) 52.7881 42.6080 34.5889 10.00
ICICI Prudential BHARAT 22 FOF -14.07 8596.63 - - - - -2.47 9711.70 29-Jun-18
S&P BSE Bharat 22 TRI Index (Benchmark) -13.78 8625.49 - - - - -2.10 9754.99
NAV (Rs.) Per Unit (as on August 30,2019 : 9.7117) 11.2971 - - 10.00
1. Different plans shall have different expense structure. The performance provided are of plans mentioned above.
2. Past performance may or may not be sustained in future and the same may not necessarily provide the basis for comparison with other investment.
3. Performance for Schemes not having Growth/Cumulative Options have been calculated considering the Dividend Option, post adjustment of the Dividend Factor. Performance of dividend option would be Net of Dividend distribution tax, if any
4. Load is not considered for computation of returns.
5. In case, the start/end date of the concerned period is a nonbusiness date (NBD), the NAV of the previous date is considered for computation of returns. The NAV per unit shown in the table is as on the start date of the said period.
6. Since respective schemes/ options have not completed relevant period (1yr, 3yr or 5yr) after allotment or units were not available throughout the respective period, no returns are available.^ Inception date shown is the date from which units under the plans are available throughout.
7. Please Refer page no. 124 for Fund Manager details.
8. The performance of the scheme is benchmarked to the Total Return variant of the Index
Investors may please note that they will be bearing the recurring expenses of this Scheme in addition to the expenses of the underlying Schemes in which this Scheme makes investment.
NIFTY 50 TRI Index (35%) + CRISIL Composite Bond Fund Index (65%) (Benchmark)
Scheme Name Benchmark Name Effective date
Nifty 50 (40%) + Crisil Composite Bond Fund Index (40%) + Crisil Liquid Fund Index (20%) since inception to November 23, 2010
Nifty 50 (40%) + Crisil Composite Bond Fund Index (40%) + Crisil Liquid Fund Index (10%) + Gold (10%) November 24, 2010 to May 27, 2018
Nifty 50 (40%) + Crisil Composite Bond Fund Index (60%)
Nifty 50 (15%) + Crisil Composite Bond Fund Index (70%) + Crisil Liquid Fund Index (15%) since inception to November 23, 2010
Nifty 50 (20%) + Crisil Composite Bond Fund Index (60%) + Crisil Liquid Fund Index (10%) + Gold (10%) November 24, 2010 to May 27, 2018
NIFTY 50 Hybrid Composite Debt 15:85 Index
Nifty 50 TRI (35%) + CRISIL Composite Bond Fund Index (65%)
Crisil Liquid Fund Index (70%) + Crisil Composite Bond Fund Index (30%) since inception to November 23, 2010
Crisil Composite Bond Fund Index (70%) + Crisil Liquid Fund Index (30%) November 24, 2010 to May 27, 2018
Crisil Composite Bond Fund Index w.e.f. May 28, 2018 onwards
Nifty 50 (70%) + Crisil Composite Bond Fund Index (25%) + Crisil Liquid Fund Index (5%) since inception to November 23, 2010
Nifty 50 (50%) + Crisil Composite Bond Fund Index (30%) + Crisil Liquid Fund Index (5%) + Gold (15%) November 24, 2010 to May 27, 2018
Nifty 50 TRI
Nifty 200 TRI
May 28, 2018 to January 31, 2019
w.e.f. Feb 01, 2019 onwards
Nifty 50 (90%) + Crisil Liquid Fund Index (10%) since inception to November 23, 2010
Nifty 50 (75%) + CRISIL Composite Bond Fund Index (5%) + CRISIL Liquid Fund Index (5%) + Gold (15%) November 24, 2010 to May 27, 2018
Nifty 50 TRI
Nifty 200 TRI w.e.f. Feb 01, 2019 onwards
S&P BSE 100 Index since inception to May 27, 2018
S&P BSE 500 TRI w.e.f. May 28, 2018 onwards
Nifty 50 TRI since inception to May 27, 2018
Nifty LargeMidcap 250 TRI w.e.f. May 28, 2018 onwards
Nifty 50 TRI since inception to May 27, 2018
Nifty 200 Index (65%) + Nifty Composite Debt Index (25%) + LBMA AM Fixing Prices (10%) w.e.f. May 28, 2018 onwards
65% Nifty 50 + 35% MSCI Asia ex-Japan Index since inception to May 27, 2018
Nifty Smallcap 250 TRI w.e.f. May 28, 2018 onwards
CRISIL Hybrid 85+15 - Conservative Index since inception to May 27, 2018
NIFTY Ultra Short Duration Debt Index w.e.f. May 28, 2018 onwards
ICICI Prudential Asset Allocator Fund
(Erstwhile ICICI Prudential Advisor Series - Conservative Fund)
ICICI Prudential Moderate Fund
(Erstwhile ICICI Prudential Advisor Series - Hybrid Fund)
ICICI Prudential Debt Management Fund
(Erstwhile ICICI Prudential Advisor Series - Debt Management Fund)
ICICI Prudential Passive Strategy Fund
(Erstwhile ICICI Prudential Advisor Series - Passive Strategy Fund)
ICICI Prudential Thematic Advantage Fund
(Erstwhile ICICI Prudential Advisor Series - Thematic Fund)
ICICI Prudential Smallcap Fund
(Erstwhile ICICI Prudential Indo Asia Equity Fund )
ICICI Prudential Ultra Short Term Fund
(Erstwhile ICICI Prudential Regular Income Fund)
ICICI Prudential Large & Mid Cap Fund
(Erstwhile ICICI Prudential Top 100 Fund )
ICICI Prudential Multi-Asset Fund
(Erstwhile ICICI Prudential Dynamic Plan)
ICICI Prudential Focused Equity Fund
(Erstwhile ICICI Prudential Select Large Cap Fund )
May 28, 2018 to January 31, 2019
w.e.f. Feb 01, 2019 onwards
CRISIL Hybrid 50 + 50 - Moderate Index w.e.f. Feb 01, 2019 onwards
May 28, 2018 to January 31, 2019
May 28, 2018 to January 31, 2019
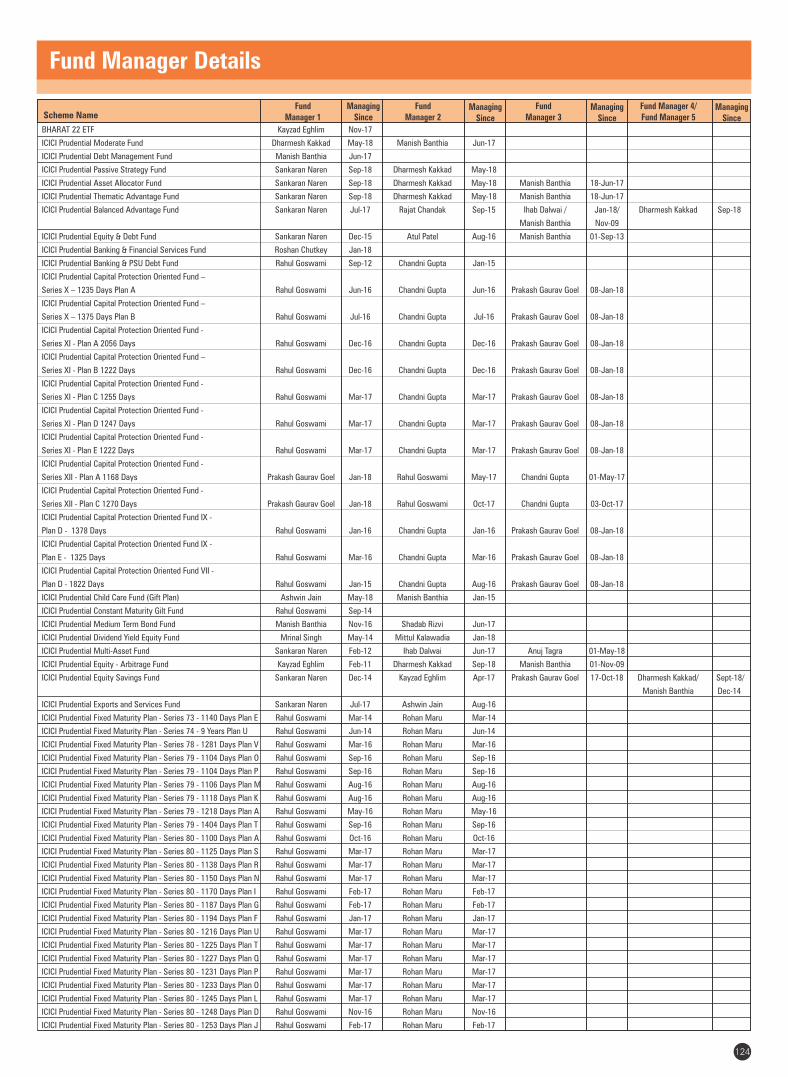
Fund Manager Details
124
Scheme NameFund
Manager 1Managing
SinceFund
Manager 2Managing
Since
Fund Manager 3
Managing Since
Fund Manager 4/Fund Manager 5
Managing Since
BHARAT 22 ETF Kayzad Eghlim Nov-17
ICICI Prudential Moderate Fund Dharmesh Kakkad May-18 Manish Banthia Jun-17
ICICI Prudential Debt Management Fund Manish Banthia Jun-17
ICICI Prudential Passive Strategy Fund Sankaran Naren Sep-18 Dharmesh Kakkad May-18
ICICI Prudential Asset Allocator Fund Sankaran Naren Sep-18 Dharmesh Kakkad May-18 Manish Banthia 18-Jun-17
ICICI Prudential Thematic Advantage Fund Sankaran Naren Sep-18 Dharmesh Kakkad May-18 Manish Banthia 18-Jun-17
ICICI Prudential Balanced Advantage Fund Sankaran Naren Jul-17 Rajat Chandak Sep-15 Ihab Dalwai / Jan-18/ Dharmesh Kakkad Sep-18
Manish Banthia Nov-09
ICICI Prudential Equity & Debt Fund Sankaran Naren Dec-15 Atul Patel Aug-16 Manish Banthia 01-Sep-13
ICICI Prudential Banking & Financial Services Fund Roshan Chutkey Jan-18
ICICI Prudential Banking & PSU Debt Fund Rahul Goswami Sep-12 Chandni Gupta Jan-15
ICICI Prudential Capital Protection Oriented Fund –
Series X – 1235 Days Plan A Rahul Goswami Jun-16 Chandni Gupta Jun-16 Prakash Gaurav Goel 08-Jan-18
ICICI Prudential Capital Protection Oriented Fund –
Series X – 1375 Days Plan B Rahul Goswami Jul-16 Chandni Gupta Jul-16 Prakash Gaurav Goel 08-Jan-18
ICICI Prudential Capital Protection Oriented Fund -
Series XI - Plan A 2056 Days Rahul Goswami Dec-16 Chandni Gupta Dec-16 Prakash Gaurav Goel 08-Jan-18
ICICI Prudential Capital Protection Oriented Fund –
Series XI - Plan B 1222 Days Rahul Goswami Dec-16 Chandni Gupta Dec-16 Prakash Gaurav Goel 08-Jan-18
ICICI Prudential Capital Protection Oriented Fund -
Series XI - Plan C 1255 Days Rahul Goswami Mar-17 Chandni Gupta Mar-17 Prakash Gaurav Goel 08-Jan-18
ICICI Prudential Capital Protection Oriented Fund -
Series XI - Plan D 1247 Days Rahul Goswami Mar-17 Chandni Gupta Mar-17 Prakash Gaurav Goel 08-Jan-18
ICICI Prudential Capital Protection Oriented Fund -
Series XI - Plan E 1222 Days Rahul Goswami Mar-17 Chandni Gupta Mar-17 Prakash Gaurav Goel 08-Jan-18
ICICI Prudential Capital Protection Oriented Fund -
Series XII - Plan A 1168 Days Prakash Gaurav Goel Jan-18 Rahul Goswami May-17 Chandni Gupta 01-May-17
ICICI Prudential Capital Protection Oriented Fund -
Series XII - Plan C 1270 Days Prakash Gaurav Goel Jan-18 Rahul Goswami Oct-17 Chandni Gupta 03-Oct-17
ICICI Prudential Capital Protection Oriented Fund IX -
Plan D - 1378 Days Rahul Goswami Jan-16 Chandni Gupta Jan-16 Prakash Gaurav Goel 08-Jan-18
ICICI Prudential Capital Protection Oriented Fund IX -
Plan E - 1325 Days Rahul Goswami Mar-16 Chandni Gupta Mar-16 Prakash Gaurav Goel 08-Jan-18
ICICI Prudential Capital Protection Oriented Fund VII -
Plan D - 1822 Days Rahul Goswami Jan-15 Chandni Gupta Aug-16 Prakash Gaurav Goel 08-Jan-18
ICICI Prudential Child Care Fund (Gift Plan) Ashwin Jain May-18 Manish Banthia Jan-15
ICICI Prudential Constant Maturity Gilt Fund Rahul Goswami Sep-14
ICICI Prudential Medium Term Bond Fund Manish Banthia Nov-16 Shadab Rizvi Jun-17
ICICI Prudential Dividend Yield Equity Fund Mrinal Singh May-14 Mittul Kalawadia Jan-18
ICICI Prudential Multi-Asset Fund Sankaran Naren Feb-12 Ihab Dalwai Jun-17 Anuj Tagra 01-May-18
ICICI Prudential Equity - Arbitrage Fund Kayzad Eghlim Feb-11 Dharmesh Kakkad Sep-18 Manish Banthia 01-Nov-09
ICICI Prudential Equity Savings Fund Sankaran Naren Dec-14 Kayzad Eghlim Apr-17 Prakash Gaurav Goel 17-Oct-18 Dharmesh Kakkad/ Sept-18/
Manish Banthia Dec-14
ICICI Prudential Exports and Services Fund Sankaran Naren Jul-17 Ashwin Jain Aug-16
ICICI Prudential Fixed Maturity Plan - Series 73 - 1140 Days Plan E Rahul Goswami Mar-14 Rohan Maru Mar-14
ICICI Prudential Fixed Maturity Plan - Series 74 - 9 Years Plan U Rahul Goswami Jun-14 Rohan Maru Jun-14
ICICI Prudential Fixed Maturity Plan - Series 78 - 1281 Days Plan V Rahul Goswami Mar-16 Rohan Maru Mar-16
ICICI Prudential Fixed Maturity Plan - Series 79 - 1104 Days Plan O Rahul Goswami Sep-16 Rohan Maru Sep-16
ICICI Prudential Fixed Maturity Plan - Series 79 - 1104 Days Plan P Rahul Goswami Sep-16 Rohan Maru Sep-16
ICICI Prudential Fixed Maturity Plan - Series 79 - 1106 Days Plan M Rahul Goswami Aug-16 Rohan Maru Aug-16
ICICI Prudential Fixed Maturity Plan - Series 79 - 1118 Days Plan K Rahul Goswami Aug-16 Rohan Maru Aug-16
ICICI Prudential Fixed Maturity Plan - Series 79 - 1218 Days Plan A Rahul Goswami May-16 Rohan Maru May-16
ICICI Prudential Fixed Maturity Plan - Series 79 - 1404 Days Plan T Rahul Goswami Sep-16 Rohan Maru Sep-16
ICICI Prudential Fixed Maturity Plan - Series 80 - 1100 Days Plan A Rahul Goswami Oct-16 Rohan Maru Oct-16
ICICI Prudential Fixed Maturity Plan - Series 80 - 1125 Days Plan S Rahul Goswami Mar-17 Rohan Maru Mar-17
ICICI Prudential Fixed Maturity Plan - Series 80 - 1138 Days Plan R Rahul Goswami Mar-17 Rohan Maru Mar-17
ICICI Prudential Fixed Maturity Plan - Series 80 - 1150 Days Plan N Rahul Goswami Mar-17 Rohan Maru Mar-17
ICICI Prudential Fixed Maturity Plan - Series 80 - 1170 Days Plan I Rahul Goswami Feb-17 Rohan Maru Feb-17
ICICI Prudential Fixed Maturity Plan - Series 80 - 1187 Days Plan G Rahul Goswami Feb-17 Rohan Maru Feb-17
ICICI Prudential Fixed Maturity Plan - Series 80 - 1194 Days Plan F Rahul Goswami Jan-17 Rohan Maru Jan-17
ICICI Prudential Fixed Maturity Plan - Series 80 - 1216 Days Plan U Rahul Goswami Mar-17 Rohan Maru Mar-17
ICICI Prudential Fixed Maturity Plan - Series 80 - 1225 Days Plan T Rahul Goswami Mar-17 Rohan Maru Mar-17
ICICI Prudential Fixed Maturity Plan - Series 80 - 1227 Days Plan Q Rahul Goswami Mar-17 Rohan Maru Mar-17
ICICI Prudential Fixed Maturity Plan - Series 80 - 1231 Days Plan P Rahul Goswami Mar-17 Rohan Maru Mar-17
ICICI Prudential Fixed Maturity Plan - Series 80 - 1233 Days Plan O Rahul Goswami Mar-17 Rohan Maru Mar-17
ICICI Prudential Fixed Maturity Plan - Series 80 - 1245 Days Plan L Rahul Goswami Mar-17 Rohan Maru Mar-17
ICICI Prudential Fixed Maturity Plan - Series 80 - 1248 Days Plan D Rahul Goswami Nov-16 Rohan Maru Nov-16
ICICI Prudential Fixed Maturity Plan - Series 80 - 1253 Days Plan J Rahul Goswami Feb-17 Rohan Maru Feb-17

Scheme NameFund
Manager 1Managing
SinceFund
Manager 2Managing
Since
Fund Manager 3 / 4
Managing Since
Fund Manager 5/Fund Manager 6
Managing Since
ICICI Prudential Fixed Maturity Plan - Series 81 - 1100 Days Plan O Rahul Goswami Jul-17 Rohan Maru Jul-17
ICICI Prudential Fixed Maturity Plan - Series 81 - 1100 Days Plan R Rahul Goswami Aug-17 Rohan Maru Aug-17
ICICI Prudential Fixed Maturity Plan - Series 81 - 1100 Days Plan W Rahul Goswami Oct-17 Rohan Maru Oct-17
ICICI Prudential Fixed Maturity Plan - Series 81 - 1101 Days Plan C Rahul Goswami Apr-17 Rohan Maru Apr-17
ICICI Prudential Fixed Maturity Plan - Series 81 - 1101 Days Plan E Rahul Goswami May-17 Rohan Maru May-17
ICICI Prudential Fixed Maturity Plan - Series 81 - 1116 Days Plan I Rahul Goswami May-17 Rohan Maru May-17
ICICI Prudential Fixed Maturity Plan - Series 81 - 1150 Days Plan K Rahul Goswami Jun-17 Rohan Maru Jun-17
ICICI Prudential Fixed Maturity Plan - Series 81 - 1154 Days Plan J Rahul Goswami Jun-17 Rohan Maru Jun-17
ICICI Prudential Fixed Maturity Plan - Series 81 - 1162 Days Plan P Rahul Goswami Jul-17 Rohan Maru Jul-17
ICICI Prudential Fixed Maturity Plan - Series 81 - 1163 Days Plan Q Rahul Goswami Jul-17 Rohan Maru Jul-17
ICICI Prudential Fixed Maturity Plan - Series 81 - 1178 Days Plan H Rahul Goswami May-17 Rohan Maru May-17
ICICI Prudential Fixed Maturity Plan - Series 81 - 1185 Days Plan G Rahul Goswami May-17 Rohan Maru May-17
ICICI Prudential Fixed Maturity Plan - Series 81 - 1190 Days Plan F Rahul Goswami May-17 Rohan Maru May-17
ICICI Prudential Fixed Maturity Plan - Series 81 - 1195 Days Plan D Rahul Goswami Apr-17 Rohan Maru Apr-17
ICICI Prudential Fixed Maturity Plan - Series 81 - 1205 Days Plan B Rahul Goswami Apr-17 Rohan Maru Apr-17
ICICI Prudential Fixed Maturity Plan - Series 81 - 1211 Days Plan A Rahul Goswami Apr-17 Rohan Maru Apr-17
ICICI Prudential Fixed Maturity Plan – Series 82 – 1185 Days Plan I Rahul Goswami Feb-18 Rohan Maru Feb-18
ICICI Prudential Fixed Maturity Plan – Series 82 – 1185 Days Plan M Rahul Goswami Feb-18 Rohan Maru Feb-18
ICICI Prudential Fixed Maturity Plan – Series 82 – 1187 Days Plan F Rahul Goswami Jan-18 Rohan Maru Jan-18
ICICI Prudential Fixed Maturity Plan – Series 82 – 1199 Days Plan L Rahul Goswami Feb-18 Rohan Maru Feb-18
ICICI Prudential Fixed Maturity Plan – Series 82 – 1203 Days Plan K Rahul Goswami Feb-18 Rohan Maru Feb-18
ICICI Prudential Fixed Maturity Plan – Series 82 – 1215 Days Plan H Rahul Goswami Feb-18 Rohan Maru Feb-18
ICICI Prudential Fixed Maturity Plan – Series 82 – 1217 Days Plan C Rahul Goswami Jan-18 Rohan Maru Jan-18
ICICI Prudential Fixed Maturity Plan – Series 82 – 1219 Days Plan D Rahul Goswami Jan-18 Rohan Maru Jan-18
ICICI Prudential Fixed Maturity Plan – Series 82 – 1223 Days Plan E Rahul Goswami Jan-18 Rohan Maru Jan-18
ICICI Prudential Fixed Maturity Plan – Series 82 – 1223 Days Plan G Rahul Goswami Jan-18 Rohan Maru Jan-18
ICICI Prudential Fixed Maturity Plan – Series 82 – 1225 Days Plan B Rahul Goswami Dec-17 Rohan Maru Dec-17
ICICI Prudential Fixed Maturity Plan - Series 82 - 1236 Days Plan A Rahul Goswami Dec-17 Rohan Maru Dec-17
ICICI Prudential Savings Fund Rahul Goswami Sep-12 Rohan Maru Sep-13
ICICI Prudential FMCG Fund Atul Patel Jan-18
ICICI Prudential Bluechip Fund Anish Tawakley Sep-18 Rajat Chandak Jul-17
ICICI Prudential Global Stable Equity Fund Priyanka Khandelwal Jun-17 Rohan Maru Sep-13
ICICI Prudential Gold ETF Manish Banthia Sep-12
ICICI Prudential Growth Fund - Series 1 Sankaran Naren Jul-17 Atul Patel Feb-15
ICICI Prudential Growth Fund - Series 2 Mittul Kalawadia Jan-18 Mrinal Singh Aug-16
ICICI Prudential Growth Fund - Series 3 Sankaran Naren Jul-17 Ashwin Jain Oct-14
ICICI Prudential Bond Fund Manish Banthia Sep-13
ICICI Prudential Long Term Bond Fund Manish Banthia Sep-13
ICICI Prudential Smallcap Fund Sankaran Naren Feb-15 Harish Bihani Nov-18
ICICI Prudential Infrastructure Fund Sankaran Naren Dec-15 Ihab Dalwai Jun-17
ICICI Prudential Liquid Fund Rahul Goswami Sep-12 Rohan Maru Sep-13
ICICI Prudential Long Term Equity Fund (Tax Saving) Sankaran Naren Nov-18 Harish Bihani Nov-18
ICICI Prudential Gilt Fund Rahul Goswami Sep-12 Anuj Tagra Oct-13
ICICI Prudential All Seasons Bond Fund Manish Banthia Sep-12 Anuj Tagra Jan-15
ICICI Prudential Midcap Fund Mrinal Singh May-11 Mittul Kalawadia Apr-16
ICICI Prudential Midcap Select ETF Kayzad Eghlim Jul-16
ICICI Prudential Regular Savings Fund Rajat Chandak Feb-15 Manish Banthia Sep-13
ICICI Prudential Money Market Fund Rahul Goswami Oct-13 Nikhil Kabra Aug-16
ICICI Prudential Multicap Fund Sankaran Naren Oct-18 Atul Patel Aug-16
ICICI Prudential Multiple Yield Fund - Series 10 - 1775 Days - Plan A Rahul Goswami Dec-15 Chandni Gupta Dec-15 Prakash Gaurav Goel 01-Jan-18
ICICI Prudential Multiple Yield Fund - Series 10 - 1825 Days - Plan B Rahul Goswami Jan-16 Chandni Gupta Jan-16 Prakash Gaurav Goel 01-Jan-18
ICICI Prudential Multiple Yield Fund - Series 11 - Plan A 1427 Days Rahul Goswami Aug-16 Chandni Gupta Aug-16 Prakash Gaurav Goel 01-Jan-18
ICICI Prudential Multiple Yield Fund - Series 11 - Plan B 1394 Days Rahul Goswami Sep-16 Chandni Gupta Sep-16 Prakash Gaurav Goel 01-Jan-18
ICICI Prudential Multiple Yield Fund - Series 11 - Plan C - 1387 days Rahul Goswami Oct-16 Chandni Gupta Oct-16 Prakash Gaurav Goel 01-Jan-18
ICICI Prudential Multiple Yield Fund - Series 11 - Plan D 1361 Days Prakash Gaurav Goel Jan-18 Rahul Goswami Nov-16 Chandni Gupta 08-Nov-16
ICICI Prudential Multiple Yield Fund - Series 7 - 1825 Days - Plan C Rahul Goswami Sep-14 Chandni Gupta Aug-16 Prakash Gaurav Goel 01-Jan-18
ICICI Prudential Multiple Yield Fund - Series 7 - 1825 Days - Plan E Rahul Goswami Oct-14 Chandni Gupta Aug-16 Prakash Gaurav Goel 01-Jan-18
ICICI Prudential Multiple Yield Fund - Series 8 - 1822 Days - Plan D Rahul Goswami Dec-14 Chandni Gupta Aug-16 Prakash Gaurav Goel 01-Jan-18
ICICI Prudential Multiple Yield Fund - Series 8 - 1824 Days - Plan A Rahul Goswami Nov-14 Chandni Gupta Aug-16 Prakash Gaurav Goel 01-Jan-18
ICICI Prudential Nifty 100 ETF Kayzad Eghlim Aug-13
ICICI Prudential Nifty Index Fund Kayzad Eghlim Aug-09
ICICI Prudential Nifty ETF Kayzad Eghlim Mar-13
ICICI Prudential Nifty Low Vol 30 ETF Kayzad Eghlim Jul-17
ICICI Prudential Nifty Next 50 Index Fund Kayzad Eghlim Jun-10
ICICI Prudential NV20 ETF Kayzad Eghlim Jun-16
ICICI Prudential R.I.G.H.T Sankaran Naren Jul-17 Rajat Chandak Apr-14
ICICI Prudential Regular Gold Savings Fund Manish Banthia Sep-12
ICICI Prudential Ultra Short Term Fund Manish Banthia Nov-16 Ritesh Lunawat Jun-17
ICICI Prudential Credit Risk Fund Manish Banthia Nov-16 Akhil Kakkar Jun-17
Fund Manager Details
125
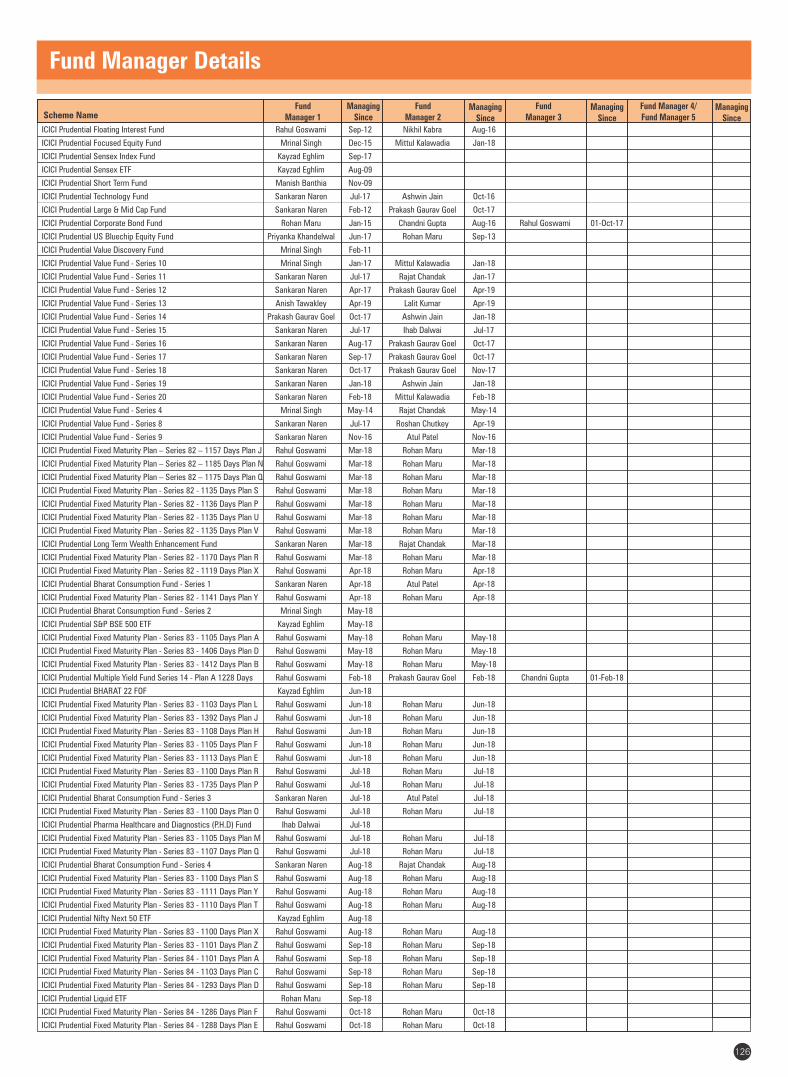
Scheme NameFund
Manager 1Managing
SinceFund
Manager 2Managing
Since
Fund Manager 3
Managing Since
Fund Manager 4/Fund Manager 5
Managing Since
Fund Manager Details
126
ICICI Prudential Floating Interest Fund Rahul Goswami Sep-12 Nikhil Kabra Aug-16
ICICI Prudential Focused Equity Fund Mrinal Singh Dec-15 Mittul Kalawadia Jan-18
ICICI Prudential Sensex Index Fund Kayzad Eghlim Sep-17
ICICI Prudential Sensex ETF Kayzad Eghlim Aug-09
ICICI Prudential Short Term Fund Manish Banthia Nov-09
ICICI Prudential Technology Fund Sankaran Naren Jul-17 Ashwin Jain Oct-16
ICICI Prudential Large & Mid Cap Fund Sankaran Naren Feb-12 Prakash Gaurav Goel Oct-17
ICICI Prudential Corporate Bond Fund Rohan Maru Jan-15 Chandni Gupta Aug-16 Rahul Goswami 01-Oct-17
ICICI Prudential US Bluechip Equity Fund Priyanka Khandelwal Jun-17 Rohan Maru Sep-13
ICICI Prudential Value Discovery Fund Mrinal Singh Feb-11
ICICI Prudential Value Fund - Series 10 Mrinal Singh Jan-17 Mittul Kalawadia Jan-18
ICICI Prudential Value Fund - Series 11 Sankaran Naren Jul-17 Rajat Chandak Jan-17
ICICI Prudential Value Fund - Series 12 Sankaran Naren Apr-17 Prakash Gaurav Goel Apr-19
ICICI Prudential Value Fund - Series 13 Anish Tawakley Apr-19 Lalit Kumar Apr-19
ICICI Prudential Value Fund - Series 14 Prakash Gaurav Goel Oct-17 Ashwin Jain Jan-18
ICICI Prudential Value Fund - Series 15 Sankaran Naren Jul-17 Ihab Dalwai Jul-17
ICICI Prudential Value Fund - Series 16 Sankaran Naren Aug-17 Prakash Gaurav Goel Oct-17
ICICI Prudential Value Fund - Series 17 Sankaran Naren Sep-17 Prakash Gaurav Goel Oct-17
ICICI Prudential Value Fund - Series 18 Sankaran Naren Oct-17 Prakash Gaurav Goel Nov-17
ICICI Prudential Value Fund - Series 19 Sankaran Naren Jan-18 Ashwin Jain Jan-18
ICICI Prudential Value Fund - Series 20 Sankaran Naren Feb-18 Mittul Kalawadia Feb-18
ICICI Prudential Value Fund - Series 4 Mrinal Singh May-14 Rajat Chandak May-14
ICICI Prudential Value Fund - Series 8 Sankaran Naren Jul-17 Roshan Chutkey Apr-19
ICICI Prudential Value Fund - Series 9 Sankaran Naren Nov-16 Atul Patel Nov-16
ICICI Prudential Fixed Maturity Plan – Series 82 – 1157 Days Plan J Rahul Goswami Mar-18 Rohan Maru Mar-18
ICICI Prudential Fixed Maturity Plan – Series 82 – 1185 Days Plan N Rahul Goswami Mar-18 Rohan Maru Mar-18
ICICI Prudential Fixed Maturity Plan – Series 82 – 1175 Days Plan Q Rahul Goswami Mar-18 Rohan Maru Mar-18
ICICI Prudential Fixed Maturity Plan - Series 82 - 1135 Days Plan S Rahul Goswami Mar-18 Rohan Maru Mar-18
ICICI Prudential Fixed Maturity Plan - Series 82 - 1136 Days Plan P Rahul Goswami Mar-18 Rohan Maru Mar-18
ICICI Prudential Fixed Maturity Plan - Series 82 - 1135 Days Plan U Rahul Goswami Mar-18 Rohan Maru Mar-18
ICICI Prudential Fixed Maturity Plan - Series 82 - 1135 Days Plan V Rahul Goswami Mar-18 Rohan Maru Mar-18
ICICI Prudential Long Term Wealth Enhancement Fund Sankaran Naren Mar-18 Rajat Chandak Mar-18
ICICI Prudential Fixed Maturity Plan - Series 82 - 1170 Days Plan R Rahul Goswami Mar-18 Rohan Maru Mar-18
ICICI Prudential Fixed Maturity Plan - Series 82 - 1119 Days Plan X Rahul Goswami Apr-18 Rohan Maru Apr-18
ICICI Prudential Bharat Consumption Fund - Series 1 Sankaran Naren Apr-18 Atul Patel Apr-18
ICICI Prudential Fixed Maturity Plan - Series 82 - 1141 Days Plan Y Rahul Goswami Apr-18 Rohan Maru Apr-18
ICICI Prudential Bharat Consumption Fund - Series 2 Mrinal Singh May-18
ICICI Prudential S&P BSE 500 ETF Kayzad Eghlim May-18
ICICI Prudential Fixed Maturity Plan - Series 83 - 1105 Days Plan A Rahul Goswami May-18 Rohan Maru May-18
ICICI Prudential Fixed Maturity Plan - Series 83 - 1406 Days Plan D Rahul Goswami May-18 Rohan Maru May-18
ICICI Prudential Fixed Maturity Plan - Series 83 - 1412 Days Plan B Rahul Goswami May-18 Rohan Maru May-18
ICICI Prudential Multiple Yield Fund Series 14 - Plan A 1228 Days Rahul Goswami Feb-18 Prakash Gaurav Goel Feb-18 Chandni Gupta 01-Feb-18
ICICI Prudential BHARAT 22 FOF Kayzad Eghlim Jun-18
ICICI Prudential Fixed Maturity Plan - Series 83 - 1103 Days Plan L Rahul Goswami Jun-18 Rohan Maru Jun-18
ICICI Prudential Fixed Maturity Plan - Series 83 - 1392 Days Plan J Rahul Goswami Jun-18 Rohan Maru Jun-18
ICICI Prudential Fixed Maturity Plan - Series 83 - 1108 Days Plan H Rahul Goswami Jun-18 Rohan Maru Jun-18
ICICI Prudential Fixed Maturity Plan - Series 83 - 1105 Days Plan F Rahul Goswami Jun-18 Rohan Maru Jun-18
ICICI Prudential Fixed Maturity Plan - Series 83 - 1113 Days Plan E Rahul Goswami Jun-18 Rohan Maru Jun-18
ICICI Prudential Fixed Maturity Plan - Series 83 - 1100 Days Plan R Rahul Goswami Jul-18 Rohan Maru Jul-18
ICICI Prudential Fixed Maturity Plan - Series 83 - 1735 Days Plan P Rahul Goswami Jul-18 Rohan Maru Jul-18
ICICI Prudential Bharat Consumption Fund - Series 3 Sankaran Naren Jul-18 Atul Patel Jul-18
ICICI Prudential Fixed Maturity Plan - Series 83 - 1100 Days Plan O Rahul Goswami Jul-18 Rohan Maru Jul-18
ICICI Prudential Pharma Healthcare and Diagnostics (P.H.D) Fund Ihab Dalwai Jul-18
ICICI Prudential Fixed Maturity Plan - Series 83 - 1105 Days Plan M Rahul Goswami Jul-18 Rohan Maru Jul-18
ICICI Prudential Fixed Maturity Plan - Series 83 - 1107 Days Plan Q Rahul Goswami Jul-18 Rohan Maru Jul-18
ICICI Prudential Bharat Consumption Fund - Series 4 Sankaran Naren Aug-18 Rajat Chandak Aug-18
ICICI Prudential Fixed Maturity Plan - Series 83 - 1100 Days Plan S Rahul Goswami Aug-18 Rohan Maru Aug-18
ICICI Prudential Fixed Maturity Plan - Series 83 - 1111 Days Plan Y Rahul Goswami Aug-18 Rohan Maru Aug-18
ICICI Prudential Fixed Maturity Plan - Series 83 - 1110 Days Plan T Rahul Goswami Aug-18 Rohan Maru Aug-18
ICICI Prudential Nifty Next 50 ETF Kayzad Eghlim Aug-18
ICICI Prudential Fixed Maturity Plan - Series 83 - 1100 Days Plan X Rahul Goswami Aug-18 Rohan Maru Aug-18
ICICI Prudential Fixed Maturity Plan - Series 83 - 1101 Days Plan Z Rahul Goswami Sep-18 Rohan Maru Sep-18
ICICI Prudential Fixed Maturity Plan - Series 84 - 1101 Days Plan A Rahul Goswami Sep-18 Rohan Maru Sep-18
ICICI Prudential Fixed Maturity Plan - Series 84 - 1103 Days Plan C Rahul Goswami Sep-18 Rohan Maru Sep-18
ICICI Prudential Fixed Maturity Plan - Series 84 - 1293 Days Plan D Rahul Goswami Sep-18 Rohan Maru Sep-18
ICICI Prudential Liquid ETF Rohan Maru Sep-18
ICICI Prudential Fixed Maturity Plan - Series 84 - 1286 Days Plan F Rahul Goswami Oct-18 Rohan Maru Oct-18
ICICI Prudential Fixed Maturity Plan - Series 84 - 1288 Days Plan E Rahul Goswami Oct-18 Rohan Maru Oct-18
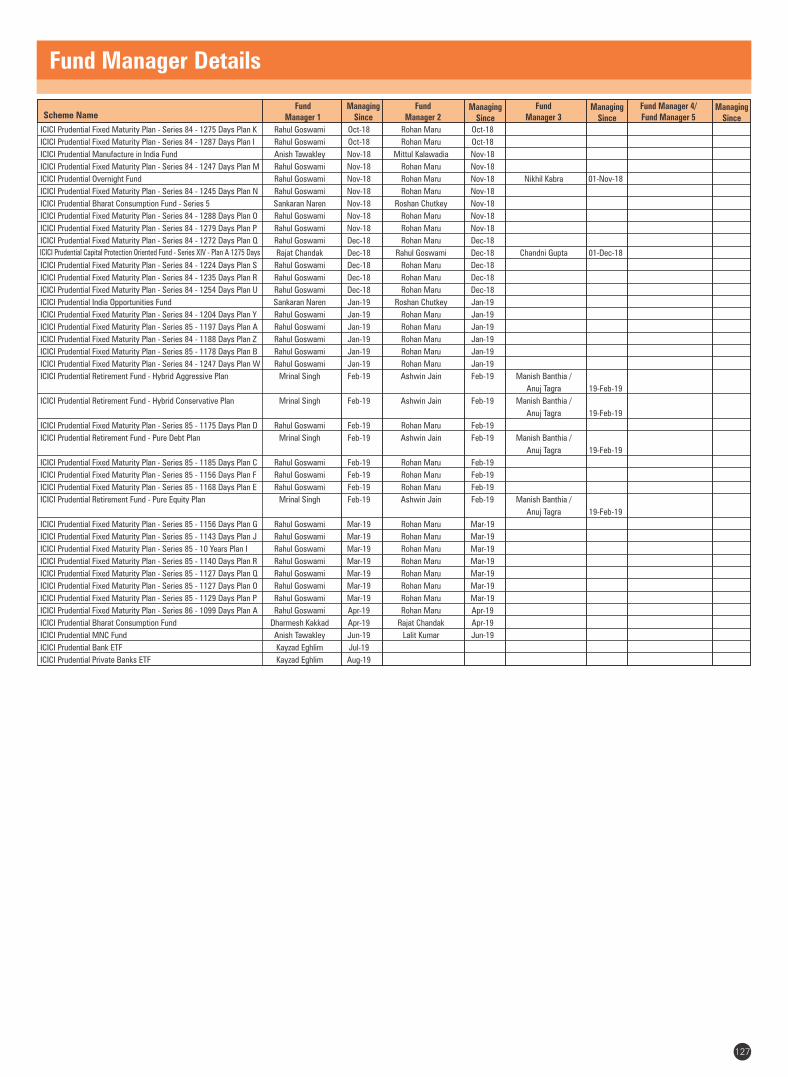
Fund Manager Details
127
Scheme NameFund
Manager 1Managing
SinceFund
Manager 2Managing
Since
Fund Manager 3
Managing Since
Fund Manager 4/Fund Manager 5
Managing Since
ICICI Prudential Capital Protection Oriented Fund - Series XIV - Plan A 1275 Days
ICICI Prudential Fixed Maturity Plan - Series 84 - 1275 Days Plan K Rahul Goswami Oct-18 Rohan Maru Oct-18
ICICI Prudential Fixed Maturity Plan - Series 84 - 1287 Days Plan I Rahul Goswami Oct-18 Rohan Maru Oct-18
ICICI Prudential Manufacture in India Fund Anish Tawakley Nov-18 Mittul Kalawadia Nov-18
ICICI Prudential Fixed Maturity Plan - Series 84 - 1247 Days Plan M Rahul Goswami Nov-18 Rohan Maru Nov-18
ICICI Prudential Overnight Fund Rahul Goswami Nov-18 Rohan Maru Nov-18 Nikhil Kabra 01-Nov-18
ICICI Prudential Fixed Maturity Plan - Series 84 - 1245 Days Plan N Rahul Goswami Nov-18 Rohan Maru Nov-18
ICICI Prudential Bharat Consumption Fund - Series 5 Sankaran Naren Nov-18 Roshan Chutkey Nov-18
ICICI Prudential Fixed Maturity Plan - Series 84 - 1288 Days Plan O Rahul Goswami Nov-18 Rohan Maru Nov-18
ICICI Prudential Fixed Maturity Plan - Series 84 - 1279 Days Plan P Rahul Goswami Nov-18 Rohan Maru Nov-18
ICICI Prudential Fixed Maturity Plan - Series 84 - 1272 Days Plan Q Rahul Goswami Dec-18 Rohan Maru Dec-18
Rajat Chandak Dec-18 Rahul Goswami Dec-18 Chandni Gupta 01-Dec-18
ICICI Prudential Fixed Maturity Plan - Series 84 - 1224 Days Plan S Rahul Goswami Dec-18 Rohan Maru Dec-18
ICICI Prudential Fixed Maturity Plan - Series 84 - 1235 Days Plan R Rahul Goswami Dec-18 Rohan Maru Dec-18
ICICI Prudential Fixed Maturity Plan - Series 84 - 1254 Days Plan U Rahul Goswami Dec-18 Rohan Maru Dec-18
ICICI Prudential India Opportunities Fund Sankaran Naren Jan-19 Roshan Chutkey Jan-19
ICICI Prudential Fixed Maturity Plan - Series 84 - 1204 Days Plan Y Rahul Goswami Jan-19 Rohan Maru Jan-19
ICICI Prudential Fixed Maturity Plan - Series 85 - 1197 Days Plan A Rahul Goswami Jan-19 Rohan Maru Jan-19
ICICI Prudential Fixed Maturity Plan - Series 84 - 1188 Days Plan Z Rahul Goswami Jan-19 Rohan Maru Jan-19
ICICI Prudential Fixed Maturity Plan - Series 85 - 1178 Days Plan B Rahul Goswami Jan-19 Rohan Maru Jan-19
ICICI Prudential Fixed Maturity Plan - Series 84 - 1247 Days Plan W Rahul Goswami Jan-19 Rohan Maru Jan-19
ICICI Prudential Retirement Fund - Hybrid Aggressive Plan Mrinal Singh Feb-19 Ashwin Jain Feb-19 Manish Banthia /
Anuj Tagra 19-Feb-19
ICICI Prudential Retirement Fund - Hybrid Conservative Plan Mrinal Singh Feb-19 Ashwin Jain Feb-19 Manish Banthia /
Anuj Tagra 19-Feb-19
ICICI Prudential Fixed Maturity Plan - Series 85 - 1175 Days Plan D Rahul Goswami Feb-19 Rohan Maru Feb-19
ICICI Prudential Retirement Fund - Pure Debt Plan Mrinal Singh Feb-19 Ashwin Jain Feb-19 Manish Banthia /
Anuj Tagra 19-Feb-19
ICICI Prudential Fixed Maturity Plan - Series 85 - 1185 Days Plan C Rahul Goswami Feb-19 Rohan Maru Feb-19
ICICI Prudential Fixed Maturity Plan - Series 85 - 1156 Days Plan F Rahul Goswami Feb-19 Rohan Maru Feb-19
ICICI Prudential Fixed Maturity Plan - Series 85 - 1168 Days Plan E Rahul Goswami Feb-19 Rohan Maru Feb-19
ICICI Prudential Retirement Fund - Pure Equity Plan Mrinal Singh Feb-19 Ashwin Jain Feb-19 Manish Banthia /
Anuj Tagra 19-Feb-19
ICICI Prudential Fixed Maturity Plan - Series 85 - 1156 Days Plan G Rahul Goswami Mar-19 Rohan Maru Mar-19
ICICI Prudential Fixed Maturity Plan - Series 85 - 1143 Days Plan J Rahul Goswami Mar-19 Rohan Maru Mar-19
ICICI Prudential Fixed Maturity Plan - Series 85 - 10 Years Plan I Rahul Goswami Mar-19 Rohan Maru Mar-19
ICICI Prudential Fixed Maturity Plan - Series 85 - 1140 Days Plan R Rahul Goswami Mar-19 Rohan Maru Mar-19
ICICI Prudential Fixed Maturity Plan - Series 85 - 1127 Days Plan Q Rahul Goswami Mar-19 Rohan Maru Mar-19
ICICI Prudential Fixed Maturity Plan - Series 85 - 1127 Days Plan O Rahul Goswami Mar-19 Rohan Maru Mar-19
ICICI Prudential Fixed Maturity Plan - Series 85 - 1129 Days Plan P Rahul Goswami Mar-19 Rohan Maru Mar-19
ICICI Prudential Fixed Maturity Plan - Series 86 - 1099 Days Plan A Rahul Goswami Apr-19 Rohan Maru Apr-19
ICICI Prudential Bharat Consumption Fund Dharmesh Kakkad Apr-19 Rajat Chandak Apr-19
ICICI Prudential MNC Fund Anish Tawakley Jun-19 Lalit Kumar Jun-19
ICICI Prudential Bank ETF Kayzad Eghlim Jul-19
ICICI Prudential Private Banks ETF Kayzad Eghlim Aug-19
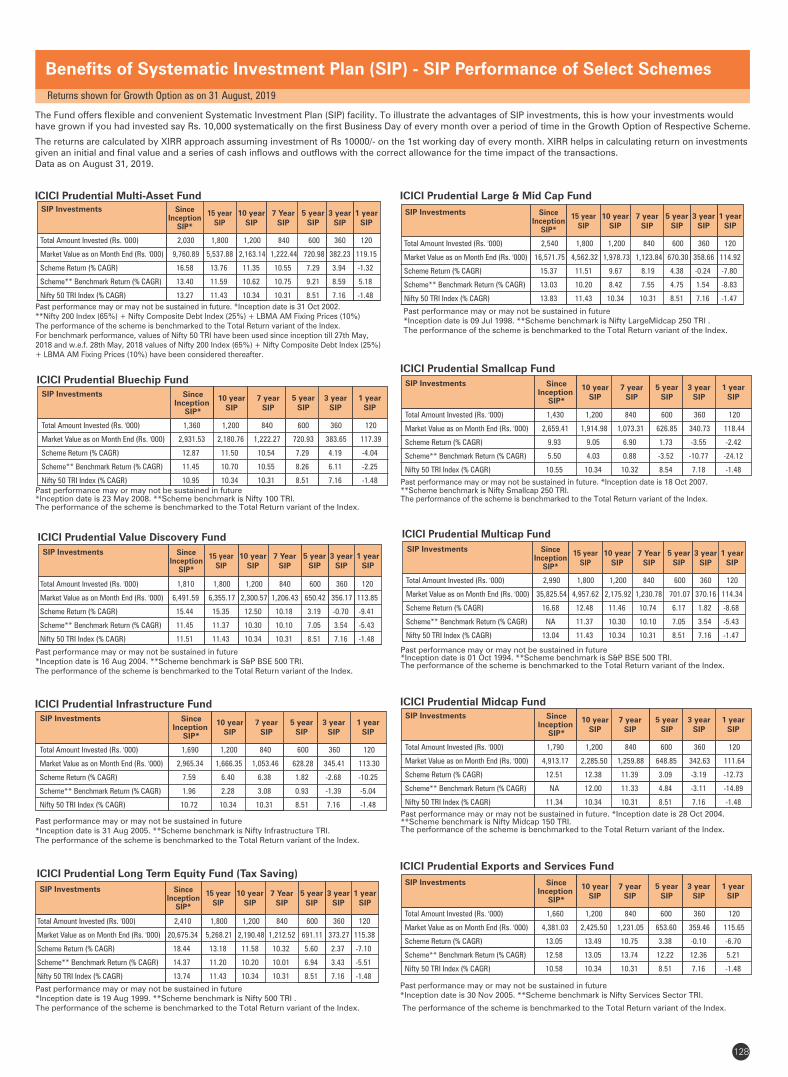
ICICI Prudential Multicap Fund
Past performance may or may not be sustained in future*Inception date is 01 Oct 1994. **Scheme benchmark is S&P BSE 500 TRI.The performance of the scheme is benchmarked to the Total Return variant of the Index.
10 year SIP
5 year SIP
3 year SIP
1 year SIP
Since Inception
SIP*
SIP Investments15 year
SIP7 Year
SIP
Total Amount Invested (Rs. '000) 2,990 1,800 1,200 840 600 360 120
Market Value as on Month End (Rs. '000) 35,825.54 4,957.62 2,175.92 1,230.78 701.07 370.16 114.34
Scheme Return (% CAGR) 16.68 12.48 11.46 10.74 6.17 1.82 -8.68
Scheme** Benchmark Return (% CAGR) NA 11.37 10.30 10.10 7.05 3.54 -5.43
Nifty 50 TRI Index (% CAGR) 13.04 11.43 10.34 10.31 8.51 7.16 -1.47
Past performance may or may not be sustained in future. *Inception date is 28 Oct 2004. **Scheme benchmark is Nifty Midcap 150 TRI.The performance of the scheme is benchmarked to the Total Return variant of the Index.
ICICI Prudential Midcap Fund
10 year SIP
5 year SIP
3 year SIP
1 year SIP
SIP Investments Since Inception
SIP*
7 yearSIP
Total Amount Invested (Rs. '000) 1,790 1,200 840 600 360 120
Market Value as on Month End (Rs. '000) 4,913.17 2,285.50 1,259.88 648.85 342.63 111.64
Scheme Return (% CAGR) 12.51 12.38 11.39 3.09 -3.19 -12.73
Scheme** Benchmark Return (% CAGR) NA 12.00 11.33 4.84 -3.11 -14.89
Nifty 50 TRI Index (% CAGR) 11.34 10.34 10.31 8.51 7.16 -1.48
ICICI Prudential Large & Mid Cap Fund
Past performance may or may not be sustained in future*Inception date is 09 Jul 1998. **Scheme benchmark is Nifty LargeMidcap 250 TRI .The performance of the scheme is benchmarked to the Total Return variant of the Index.
10 year SIP
5 year SIP
3 year SIP
1 year SIP
Since Inception
SIP*
SIP Investments15 year
SIP7 year
SIP
Total Amount Invested (Rs. '000) 2,540 1,800 1,200 840 600 360 120
Market Value as on Month End (Rs. '000) 16,571.75 4,562.32 1,978.73 1,123.84 670.30 358.66 114.92
Scheme Return (% CAGR) 15.37 11.51 9.67 8.19 4.38 -0.24 -7.80
Scheme** Benchmark Return (% CAGR) 13.03 10.20 8.42 7.55 4.75 1.54 -8.83
Nifty 50 TRI Index (% CAGR) 13.83 11.43 10.34 10.31 8.51 7.16 -1.47
ICICI Prudential Long Term Equity Fund (Tax Saving)
Past performance may or may not be sustained in future*Inception date is 19 Aug 1999. **Scheme benchmark is Nifty 500 TRI .The performance of the scheme is benchmarked to the Total Return variant of the Index.
10 year SIP
5 year SIP
3 year SIP
1 year SIP
Since Inception
SIP*
SIP Investments15 year
SIP7 Year
SIP
Total Amount Invested (Rs. '000) 2,410 1,800 1,200 840 600 360 120
Market Value as on Month End (Rs. '000) 20,675.34 5,268.21 2,190.48 1,212.52 691.11 373.27 115.38
Scheme Return (% CAGR) 18.44 13.18 11.58 10.32 5.60 2.37 -7.10
Scheme** Benchmark Return (% CAGR) 14.37 11.20 10.20 10.01 6.94 3.43 -5.51
Nifty 50 TRI Index (% CAGR) 13.74 11.43 10.34 10.31 8.51 7.16 -1.48
ICICI Prudential Value Discovery Fund
Past performance may or may not be sustained in future*Inception date is 16 Aug 2004. **Scheme benchmark is S&P BSE 500 TRI.The performance of the scheme is benchmarked to the Total Return variant of the Index.
ICICI Prudential Bluechip Fund
Past performance may or may not be sustained in future*Inception date is 23 May 2008. **Scheme benchmark is Nifty 100 TRI.The performance of the scheme is benchmarked to the Total Return variant of the Index.
10 year SIP
5 year SIP
3 year SIP
1 year SIP
SIP Investments Since Inception
SIP*
7 yearSIP
Total Amount Invested (Rs. '000) 1,360 1,200 840 600 360 120
Market Value as on Month End (Rs. '000) 2,931.53 2,180.76 1,222.27 720.93 383.65 117.39
Scheme Return (% CAGR) 12.87 11.50 10.54 7.29 4.19 -4.04
Scheme** Benchmark Return (% CAGR) 11.45 10.70 10.55 8.26 6.11 -2.25
Nifty 50 TRI Index (% CAGR) 10.95 10.34 10.31 8.51 7.16 -1.48
Past performance may or may not be sustained in future. *Inception date is 31 Oct 2002. **Nifty 200 Index (65%) + Nifty Composite Debt Index (25%) + LBMA AM Fixing Prices (10%)The performance of the scheme is benchmarked to the Total Return variant of the Index. For benchmark performance, values of Nifty 50 TRI have been used since inception till 27th May, 2018 and w.e.f. 28th May, 2018 values of Nifty 200 Index (65%) + Nifty Composite Debt Index (25%) + LBMA AM Fixing Prices (10%) have been considered thereafter.
ICICI Prudential Multi-Asset Fund
10 year SIP
5 year SIP
3 year SIP
1 year SIP
Since Inception
SIP*
SIP Investments15 year
SIP7 Year
SIP
Total Amount Invested (Rs. '000) 2,030 1,800 1,200 840 600 360 120
Market Value as on Month End (Rs. '000) 9,760.89 5,537.88 2,163.14 1,222.44 720.98 382.23 119.15
Scheme Return (% CAGR) 16.58 13.76 11.35 10.55 7.29 3.94 -1.32
Scheme** Benchmark Return (% CAGR) 13.40 11.59 10.62 10.75 9.21 8.59 5.18
Nifty 50 TRI Index (% CAGR) 13.27 11.43 10.34 10.31 8.51 7.16 -1.48
128
Benefits of Systematic Investment Plan (SIP) - SIP Performance of Select Schemes
The Fund offers flexible and convenient Systematic Investment Plan (SIP) facility. To illustrate the advantages of SIP investments, this is how your investments wouldhave grown if you had invested say Rs. 10,000 systematically on the first Business Day of every month over a period of time in the Growth Option of Respective Scheme.
The returns are calculated by XIRR approach assuming investment of Rs 10000/- on the 1st working day of every month. XIRR helps in calculating return on investmentsgiven an initial and final value and a series of cash inflows and outflows with the correct allowance for the time impact of the transactions.Data as on August 31, 2019.
Returns shown for Growth Option as on 31 August, 2019
Past performance may or may not be sustained in future*Inception date is 30 Nov 2005. **Scheme benchmark is Nifty Services Sector TRI.
ICICI Prudential Exports and Services Fund
10 year SIP
5 year SIP
3 year SIP
1 year SIP
SIP Investments Since Inception
SIP*
7 yearSIP
Total Amount Invested (Rs. '000) 1,660 1,200 840 600 360 120
Market Value as on Month End (Rs. '000) 4,381.03 2,425.50 1,231.05 653.60 359.46 115.65
Scheme Return (% CAGR) 13.05 13.49 10.75 3.38 -0.10 -6.70
Scheme** Benchmark Return (% CAGR) 12.58 13.05 13.74 12.22 12.36 5.21
Nifty 50 TRI Index (% CAGR) 10.58 10.34 10.31 8.51 7.16 -1.48
The performance of the scheme is benchmarked to the Total Return variant of the Index.
Past performance may or may not be sustained in future*Inception date is 31 Aug 2005. **Scheme benchmark is Nifty Infrastructure TRI.The performance of the scheme is benchmarked to the Total Return variant of the Index.
ICICI Prudential Infrastructure Fund
10 year SIP
5 year SIP
3 year SIP
1 year SIP
SIP Investments Since Inception
SIP*
7 yearSIP
Total Amount Invested (Rs. '000) 1,690 1,200 840 600 360 120
Market Value as on Month End (Rs. '000) 2,965.34 1,666.35 1,053.46 628.28 345.41 113.30
Scheme Return (% CAGR) 7.59 6.40 6.38 1.82 -2.68 -10.25
Scheme** Benchmark Return (% CAGR) 1.96 2.28 3.08 0.93 -1.39 -5.04
Nifty 50 TRI Index (% CAGR) 10.72 10.34 10.31 8.51 7.16 -1.48
Past performance may or may not be sustained in future. *Inception date is 18 Oct 2007. **Scheme benchmark is Nifty Smallcap 250 TRI.The performance of the scheme is benchmarked to the Total Return variant of the Index.
ICICI Prudential Smallcap Fund
10 year SIP
5 year SIP
3 year SIP
1 year SIP
SIP Investments Since Inception
SIP*
7 yearSIP
Total Amount Invested (Rs. '000) 1,430 1,200 840 600 360 120
Market Value as on Month End (Rs. '000) 2,659.41 1,914.98 1,073.31 626.85 340.73 118.44
Scheme Return (% CAGR) 9.93 9.05 6.90 1.73 -3.55 -2.42
Scheme** Benchmark Return (% CAGR) 5.50 4.03 0.88 -3.52 -10.77 -24.12
Nifty 50 TRI Index (% CAGR) 10.55 10.34 10.32 8.54 7.18 -1.48
10 year SIP
5 year SIP
3 year SIP
1 year SIP
Since Inception
SIP*
SIP Investments15 year
SIP7 Year
SIP
Total Amount Invested (Rs. '000) 1,810 1,800 1,200 840 600 360 120
Market Value as on Month End (Rs. '000) 6,491.59 6,355.17 2,300.57 1,206.43 650.42 356.17 113.85
Scheme Return (% CAGR) 15.44 15.35 12.50 10.18 3.19 -0.70 -9.41
Scheme** Benchmark Return (% CAGR) 11.45 11.37 10.30 10.10 7.05 3.54 -5.43
Nifty 50 TRI Index (% CAGR) 11.51 11.43 10.34 10.31 8.51 7.16 -1.48
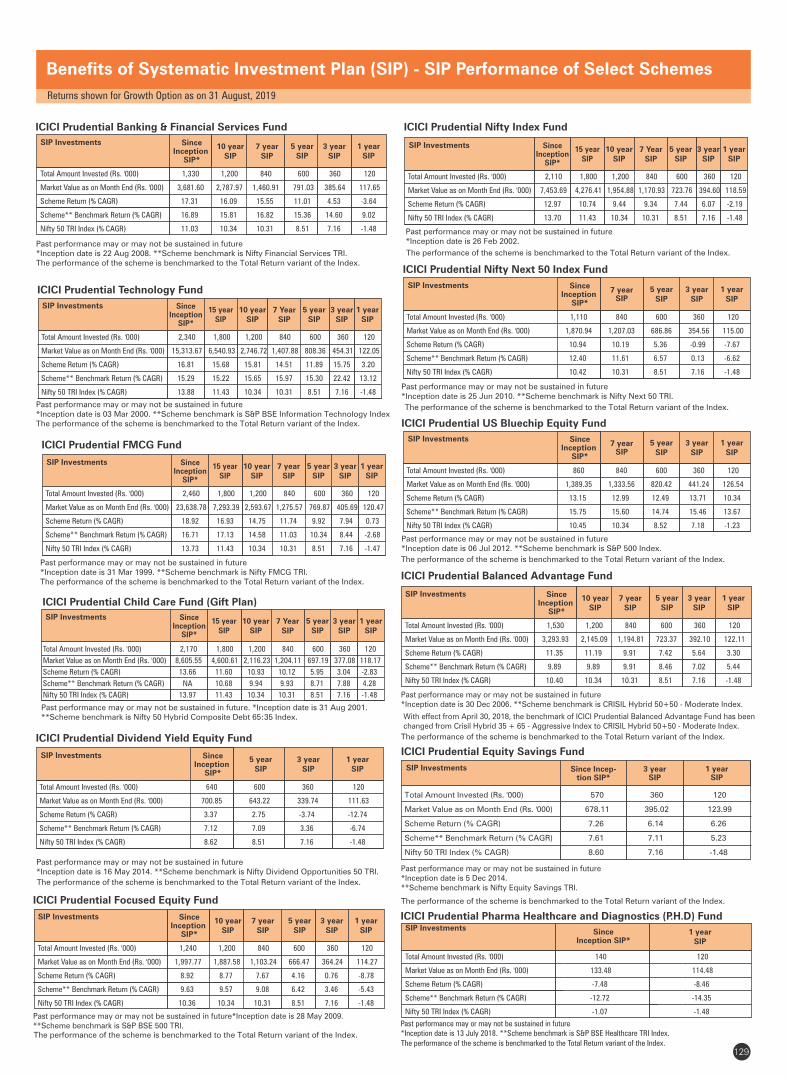
ICICI Prudential Balanced Advantage Fund
Past performance may or may not be sustained in future*Inception date is 30 Dec 2006. **Scheme benchmark is CRISIL Hybrid 50+50 - Moderate Index.
10 year SIP
5 year SIP
3 year SIP
1 year SIP
SIP Investments Since Inception
SIP*
7 yearSIP
Total Amount Invested (Rs. '000) 1,530 1,200 840 600 360 120
Market Value as on Month End (Rs. '000) 3,293.93 2,145.09 1,194.81 723.37 392.10 122.11
Scheme Return (% CAGR) 11.35 11.19 9.91 7.42 5.64 3.30
Scheme** Benchmark Return (% CAGR) 9.89 9.89 9.91 8.46 7.02 5.44
Nifty 50 TRI Index (% CAGR) 10.40 10.34 10.31 8.51 7.16 -1.48
The performance of the scheme is benchmarked to the Total Return variant of the Index.
With effect from April 30, 2018, the benchmark of ICICI Prudential Balanced Advantage Fund has been changed from Crisil Hybrid 35 + 65 - Aggressive Index to CRISIL Hybrid 50+50 - Moderate Index.
129
Benefits of Systematic Investment Plan (SIP) - SIP Performance of Select Schemes
ICICI Prudential Technology Fund
Past performance may or may not be sustained in future*Inception date is 03 Mar 2000. **Scheme benchmark is S&P BSE Information Technology IndexThe performance of the scheme is benchmarked to the Total Return variant of the Index.
10 year SIP
5 year SIP
3 year SIP
1 year SIP
Since Inception
SIP*
SIP Investments15 year
SIP7 Year
SIP
Total Amount Invested (Rs. '000) 2,340 1,800 1,200 840 600 360 120
Market Value as on Month End (Rs. '000) 15,313.67 6,540.93 2,746.72 1,407.88 808.36 454.31 122.05
Scheme Return (% CAGR) 16.81 15.68 15.81 14.51 11.89 15.75 3.20
Scheme** Benchmark Return (% CAGR) 15.29 15.22 15.65 15.97 15.30 22.42 13.12
Nifty 50 TRI Index (% CAGR) 13.88 11.43 10.34 10.31 8.51 7.16 -1.48
Returns shown for Growth Option as on 31 August, 2019
Past performance may or may not be sustained in future*Inception date is 26 Feb 2002.
ICICI Prudential Nifty Index Fund
10 year SIP
5 year SIP
3 year SIP
1 year SIP
Since Inception
SIP*
SIP Investments15 year
SIP7 Year
SIP
Total Amount Invested (Rs. '000) 2,110 1,800 1,200 840 600 360 120
Market Value as on Month End (Rs. '000) 7,453.69 4,276.41 1,954.88 1,170.93 723.76 394.60 118.59
Scheme Return (% CAGR) 12.97 10.74 9.44 9.34 7.44 6.07 -2.19
Nifty 50 TRI Index (% CAGR) 13.70 11.43 10.34 10.31 8.51 7.16 -1.48
The performance of the scheme is benchmarked to the Total Return variant of the Index.
ICICI Prudential Dividend Yield Equity Fund
Past performance may or may not be sustained in future*Inception date is 16 May 2014. **Scheme benchmark is Nifty Dividend Opportunities 50 TRI.
The performance of the scheme is benchmarked to the Total Return variant of the Index.
ICICI Prudential Nifty Next 50 Index Fund
Past performance may or may not be sustained in future*Inception date is 25 Jun 2010. **Scheme benchmark is Nifty Next 50 TRI.
7 year SIP
SIP Investments5 year
SIP3 year
SIP1 year
SIP
Since Inception
SIP*
Total Amount Invested (Rs. '000) 1,110 840 600 360 120
Market Value as on Month End (Rs. '000) 1,870.94 1,207.03 686.86 354.56 115.00
Scheme Return (% CAGR) 10.94 10.19 5.36 -0.99 -7.67
Scheme** Benchmark Return (% CAGR) 12.40 11.61 6.57 0.13 -6.62
Nifty 50 TRI Index (% CAGR) 10.42 10.31 8.51 7.16 -1.48
The performance of the scheme is benchmarked to the Total Return variant of the Index.
ICICI Prudential US Bluechip Equity Fund
Past performance may or may not be sustained in future*Inception date is 06 Jul 2012. **Scheme benchmark is S&P 500 Index.
The performance of the scheme is benchmarked to the Total Return variant of the Index.
ICICI Prudential FMCG Fund
Past performance may or may not be sustained in future*Inception date is 31 Mar 1999. **Scheme benchmark is Nifty FMCG TRI.The performance of the scheme is benchmarked to the Total Return variant of the Index.
10 year SIP
5 year SIP
3 year SIP
1 year SIP
Since Inception
SIP*
SIP Investments15 year
SIP7 year
SIP
Total Amount Invested (Rs. '000) 2,460 1,800 1,200 840 600 360 120
Market Value as on Month End (Rs. '000) 23,638.78 7,293.39 2,593.67 1,275.57 769.87 405.69 120.47
Scheme Return (% CAGR) 18.92 16.93 14.75 11.74 9.92 7.94 0.73
Scheme** Benchmark Return (% CAGR) 16.71 17.13 14.58 11.03 10.34 8.44 -2.68
Nifty 50 TRI Index (% CAGR) 13.73 11.43 10.34 10.31 8.51 7.16 -1.47
ICICI Prudential Child Care Fund (Gift Plan)
Past performance may or may not be sustained in future. *Inception date is 31 Aug 2001. **Scheme benchmark is Nifty 50 Hybrid Composite Debt 65:35 Index.
10 year SIP
5 year SIP
3 year SIP
1 year SIP
Since Inception
SIP*
SIP Investments15 year
SIP7 Year
SIP
Total Amount Invested (Rs. '000) 2,170 1,800 1,200 840 600 360 120
Market Value as on Month End (Rs. '000) 8,605.55 4,600.61 2,116.23 1,204.11 697.19 377.08 118.17
Scheme Return (% CAGR) 13.66 11.60 10.93 10.12 5.95 3.04 -2.83
Scheme** Benchmark Return (% CAGR) NA 10.68 9.94 9.93 8.71 7.88 4.28
Nifty 50 TRI Index (% CAGR) 13.97 11.43 10.34 10.31 8.51 7.16 -1.48
ICICI Prudential Equity Savings Fund
Past performance may or may not be sustained in future*Inception date is 5 Dec 2014. **Scheme benchmark is Nifty Equity Savings TRI.
The performance of the scheme is benchmarked to the Total Return variant of the Index.
SIP Investments Since Incep-tion SIP*
3 yearSIP
1 yearSIP
Total Amount Invested (Rs. '000) 570 360 120
Market Value as on Month End (Rs. '000) 678.11 395.02 123.99
Scheme Return (% CAGR) 7.26 6.14 6.26
Scheme** Benchmark Return (% CAGR) 7.61 7.11 5.23
Nifty 50 TRI Index (% CAGR) 8.60 7.16 -1.48
ICICI Prudential Banking & Financial Services Fund
Past performance may or may not be sustained in future*Inception date is 22 Aug 2008. **Scheme benchmark is Nifty Financial Services TRI.The performance of the scheme is benchmarked to the Total Return variant of the Index.
10 year SIP
5 year SIP
3 year SIP
1 year SIP
SIP Investments Since Inception
SIP*
7 yearSIP
Total Amount Invested (Rs. '000) 1,330 1,200 840 600 360 120
Market Value as on Month End (Rs. '000) 3,681.60 2,787.97 1,460.91 791.03 385.64 117.65
Scheme Return (% CAGR) 17.31 16.09 15.55 11.01 4.53 -3.64
Scheme** Benchmark Return (% CAGR) 16.89 15.81 16.82 15.36 14.60 9.02
Nifty 50 TRI Index (% CAGR) 11.03 10.34 10.31 8.51 7.16 -1.48
Past performance may or may not be sustained in future*Inception date is 28 May 2009. **Scheme benchmark is S&P BSE 500 TRI.
ICICI Prudential Focused Equity Fund
The performance of the scheme is benchmarked to the Total Return variant of the Index.
10 year SIP
5 year SIP
3 year SIP
1 year SIP
SIP Investments Since Inception
SIP*
7 yearSIP
Total Amount Invested (Rs. '000) 1,240 1,200 840 600 360 120
Market Value as on Month End (Rs. '000) 1,997.77 1,887.58 1,103.24 666.47 364.24 114.27
Scheme Return (% CAGR) 8.92 8.77 7.67 4.16 0.76 -8.78
Scheme** Benchmark Return (% CAGR) 9.63 9.57 9.08 6.42 3.46 -5.43
Nifty 50 TRI Index (% CAGR) 10.36 10.34 10.31 8.51 7.16 -1.48
SIP Investments5 year
SIP3 year
SIP1 year
SIP
Since Inception
SIP*
Total Amount Invested (Rs. '000) 640 600 360 120
Market Value as on Month End (Rs. '000) 700.85 643.22 339.74 111.63
Scheme Return (% CAGR) 3.37 2.75 -3.74 -12.74
Scheme** Benchmark Return (% CAGR) 7.12 7.09 3.36 -6.74
Nifty 50 TRI Index (% CAGR) 8.62 8.51 7.16 -1.48
7 year SIP
SIP Investments5 year
SIP3 year
SIP1 year
SIP
Since Inception
SIP*
Total Amount Invested (Rs. '000) 860 840 600 360 120
Market Value as on Month End (Rs. '000) 1,389.35 1,333.56 820.42 441.24 126.54
Scheme Return (% CAGR) 13.15 12.99 12.49 13.71 10.34
Scheme** Benchmark Return (% CAGR) 15.75 15.60 14.74 15.46 13.67
Nifty 50 TRI Index (% CAGR) 10.45 10.34 8.52 7.18 -1.23
1 year SIP
SIP Investments Since Inception SIP*
Total Amount Invested (Rs. '000) 140 120
Market Value as on Month End (Rs. '000) 133.48 114.48
Scheme Return (% CAGR) -7.48 -8.46
Scheme** Benchmark Return (% CAGR) -12.72 -14.35
Nifty 50 TRI Index (% CAGR) -1.07 -1.48
Past performance may or may not be sustained in future*Inception date is 13 July 2018. **Scheme benchmark is S&P BSE Healthcare TRI Index.
ICICI Prudential Pharma Healthcare and Diagnostics (P.H.D) Fund
The performance of the scheme is benchmarked to the Total Return variant of the Index.

130
Benefits of Systematic Investment Plan (SIP) - SIP Performance of Select Schemes
Returns shown for Growth Option as on 31 August, 2019
Disclaimer of NSE Indices Limited: The “ICICI Prudential Nifty Index Fund/ICICI Prudential Nifty ETF/ICICI Prudential Nifty Next 50 Index Fund/ICICI Prudential Midcap Fund /ICICI Prudential Nifty 100 ETF/ICICI Prudential NV20 ETF/ICICI Prudential Nifty Low Vol 30 ETF/ICICI Prudential Nifty Next 50 ETF” offered by “ICICI Prudential Mutual Fund/ICICI Prudential Asset Management Company Limited” or its affiliates is not sponsored, endorsed, sold or promoted by NSE Indices Limited (NSE Indices) and its affiliates. NSE Indices and its affiliates do not make any representation or warranty, express or implied (including warranties of merchantability or fitness for particular purpose or use) to the owners of “ICICI Prudential Nifty Index Fund/ICICI Prudential Nifty ETF/ICICI Prudential Nifty Next 50 Index Fund/ICICI Prudential Midcap Fund /ICICI Prudential Nifty 100 ETF/ICICI Prudential NV20 ETF/ICICI Prudential Nifty Low Vol 30 ETF/ICICI Prudential Nifty Next 50 ETF” or any member of the public regarding the advisability of investing in securities generally or in the ”ICICI Prudential Nifty Index Fund/ICICI Prudential Nifty ETF/ICICI Prudential Nifty Next 50 Index Fund/ICICI Prudential Midcap Fund /ICICI Prudential Nifty 100 ETF/ICICI Prudential NV20 ETF/ICICI Prudential Nifty Low Vol 30 ETF/ICICI Prudential Nifty Next 50 ETF” linked to Nifty 50 TRI/Nifty Next 50 TRI/Nifty Midcap 100 Index/Nifty 100 TRI/Nifty50 Value 20 Index/Nifty100 Low Volatility 30 Index or particularly in the ability of the Nifty 50 TRI/Nifty Next 50 TRI/Nifty Midcap 100 Index/ Nifty 100 TRI/Nifty50 Value 20 Index/Nifty100 Low Volitility 30 Index to track general stock market performance in India. Please read the full Disclaimers in relation to the Nifty 50 TRI/Nifty Next 50 TRI/Nifty Midcap 100 Index/Nifty 100 TRI/Nifty 50 Value 20 TRI/Nifty 100 Low Volitility 30 Index in the respective Scheme Information Document.
Disclaimer by the National Stock Exchange of India Limited : It is to be distinctly understood that the permission given by National Stock Exchange of India Limited (NSE) should not in any way be deemed or construed that the Scheme Information Document has been cleared or approved by NSE nor does it certify the correctness or completeness of any of the contents of the Scheme Information Document. The investors are advised to refer to the Scheme Information Document for the full text of the ‘Disclaimer Clause of NSE’.
Disclaimer by the BSE Limited: It is to be distinctly understood that the permission given by BSE Limited should not in any way be deemed or construed that the SID has been cleared or approved by BSE Limited nor does it certify the correctness or completeness of any of the contents of the SID. The investors are advised to refer to the SID for the full text of the Disclaimer Clause of the BSE Limited.
Disclaimer by AIPL for ICICI Prudential Sensex ETF, ICICI Prudential Sensex Index Fund, ICICI Prudential Midcap Select ETF, BHARAT 22 ETF, ICICI Prudential S&P BSE 500 ETF and ICICI Prudential Liquid ETF :“The "S&P BSE Sensex, S&P BSE Midcap Select TRI, S&P BSE Bharat 22 TRI, S&P BSE 500 TRI and S&P BSE Liquid Rate Index" is a product of AIPL, a joint venture among affiliates of S&P Dow Jones Indices LLC (“SPDJI”) and BSE Limited (“BSE”), and has been licensed for use by ICICI Prudential Asset Management Company Limited. Standard & Poor's® and S&P® are registered trademarks of Standard & Poor's Financial Services LLC (“S&P”); BSE® and SENSEX® are registered trademarks of BSE Limited; Dow Jones® is a registered trademark of Dow Jones Trademark Holdings LLC (“Dow Jones”); and these trademarks have been licensed for use by AIPL and sublicensed for certain purposes by ICICI Prudential Asset Management Company Limited. ICICI Prudential Sensex ETF, ICICI Prudential Sensex Index Fund, ICICI Prudential Midcap Select ETF, BHARAT 22 ETF, ICICI Prudential S&P BSE 500 ETF and ICICI Prudential Liquid ETF is not sponsored, endorsed, sold or promoted by SPDJI, BSE, Dow Jones, S&P or their respective affiliates and none of such parties make any representation regarding the advisability of investing in such product(s) nor do they have any liability for any errors, omissions, or interruptions of the SENSEX.”
“The "S&P BSE Sensex, S&P BSE Midcap Select TRI, S&P BSE Bharat 22 TRI, S&P BSE 500 TRI and S&P BSE Liquid Rate Index" (the “Index”) is published by Asia Index Private Limited (“AIPL”), which is a joint venture among affiliates of S&P Dow Jones Indices LLC (“SPDJI”) and BSE Limited (“BSE”), and has been licensed for use by ICICI Prudential Asset Management Company Limited (“Licensee”). Standard & Poor's® and S&P® are registered trademarks of Standard & Poor's Financial Services LLC (“S&P”) and Dow Jones® is a registered trademark of Dow Jones Trademark Holdings LLC (“Dow Jones”). BSE® and SENSEX® are registered trademarks of BSE. The trademarks have been licensed to AIPL and have been sublicensed for use for certain purposes by Licensee. Licensee's ICICI Prudential Sensex ETF, ICICI Prudential Sensex Index Fund, ICICI Prudential Midcap Select ETF, BHARAT 22 ETF, ICICI Prudential S&P BSE 500 ETF and ICICI Prudential Liquid ETF” (the “Product”) is/are not sponsored, endorsed, sold or promoted by AIPL, SPDJI, Dow Jones, S&P, any of their respective affiliates (collectively, “S&P Dow Jones Indices”) or BSE. None of AIPL, S&P Dow Jones Indices or BSE makes any representation or warranty, express or implied, to the owners of the Product or any member of the public regarding the advisability of investing in securities generally or in the Product particularly or the ability of the Index to track general market performance. AIPL's, S&P Dow Jones Indices' and BSE's only relationship to Licensee with respect to the Index is the licensing of the Index and certain trademarks, service marks and/or trade names of AIPL, S&P Dow Jones Indices, BSE and/or their licensors. The "S&P BSE Sensex, S&P BSE Midcap Select TRI, S&P BSE Bharat 22 TRI, S&P BSE 500 TRI and S&P BSE Liquid Rate Index" is determined, composed and calculated by AIPL or its agent without regard to Licensee or the Product. None of AIPL, S&P Dow Jones Indices or BSE are responsible for and have not participated in the determination of the prices, and amount of the Product or the timing of the issuance or sale of the Product or in the determination or calculation of the equation by which the Product is to be converted into cash, surrendered or redeemed, as the case may be. AIPL, S&P Dow Jones Indices and BSE have no obligation or liability in connection with the administration, marketing or trading of the Product. There is no assurance that investment products based on the Index will accurately track index performance or provide positive investment returns. AIPL and S&P Dow Jones Indices LLC are not investment advisors. Inclusion of a security within an index is not a recommendation by AIPL, S&P Dow Jones Indices or BSE to buy, sell, or hold such security, nor is it considered to be investment advice.
AIPL, S&P DOW JONES INDICES, BSE AND THEIR THIRD PARTY LICENSORS DO NOT GUARANTEE THE ADEQUACY, ACCURACY, TIMELINESS AND/OR THE COMPLETENESS OF THE INDEX OR ANY DATA RELATED THERETO. AIPL, S&P DOW JONES INDICES, BSE AND THEIR THIRD PARTY LICENSORS SHALL NOT BE SUBJECT TO ANY DAMAGES OR LIABILITY FOR ANY ERRORS, OMISSIONS, OR DELAYS THEREIN. AIPL, S&P DOW JONES INDICES, BSE AND THEIR THIRD PARTY LICENSORS MAKE NO EXPRESS OR IMPLIED WARRANTIES, AND EXPRESSLY DISCLAIM ALL WARRANTIES, OF MERCHANTABILITY OR FITNESS FOR A PARTICULAR PURPOSE OR USE OR AS TO RESULTS TO BE OBTAINED BY LICENSEE, OWNERS OF THE PRODUCT, OR ANY OTHER PERSON OR ENTITY FROM THE USE OF THE INDEX OR WITH RESPECT TO ANY DATA RELATED THERETO. WITHOUT LIMITING ANY OF THE FOREGOING, IN NO EVENT WHATSOEVER SHALL AIPL, S&P DOW JONES INDICES, BSE OR THEIR THIRD PARTY LICENSORS BE LIABLE FOR ANY INDIRECT, SPECIAL, INCIDENTAL, PUNITIVE, OR CONSEQUENTIAL DAMAGES INCLUDING BUT NOT LIMITED TO, LOSS OF PROFITS, TRADING LOSSES, LOST TIME OR GOODWILL, EVEN IF THEY HAVE BEEN ADVISED OF THE POSSIBLITY OF SUCH DAMAGES, WHETHER IN CONTRACT, TORT, STRICT LIABILITY, OR OTHERWISE. THERE ARE NO THIRD PARTY BENEFICIARIES OF ANY AGREEMENTS OR ARRANGEMENTS BETWEEN AIPL AND LICENSEE, OTHER THAN THE LICENSORS OF AIPL (INCLUDING S&P DOW JONES INDICES AND/OR BSE).”
Single plan structure for the schemes of the Fund:W.e.f. October 1, 2012 fresh subscriptions/switch-ins are accepted only under a single plan for all the schemes. Fresh subscriptions / switch-ins in other plans of the schemes shall not be accepted w.e.f. October 1, 2012. However, such plans will continue till the existing investors remain invested in the plan.
Note Pertaining to Direct Plan ,which was introduced w.e.f. 1st Jan 2013 :Direct Plan is only for investors who purchase /subscribe Units in a Scheme directly with the Fund. Direct Plan shall be the default Plan. Thus, if the Purchase/ Switch application does not specifically state the details of the plan then the same shall be processed under the Direct Plan if no distributor code is mentioned in the application. Otherwise it shall be processed under the Other than Direct plan.
India Index Services & Products Limited (IISL) has changed its name to NSE Indices Limited, as per communication received from IISL.
1 year SIP
SIP Investments Since Inception SIP*
Total Amount Invested (Rs. '000) 240 120
Market Value as on Month End (Rs. '000) 252.76 120.53
Scheme Return (% CAGR) 5.10 0.83
Scheme** Benchmark Return (% CAGR) 5.98 1.56
Nifty 50 TRI Index (% CAGR) 3.21 -1.48
Past performance may or may not be sustained in future*Inception date is 21 Sep 2017. **Scheme benchmark is S&P BSE Sensex.
ICICI Prudential Sensex Index Fund
The performance of the scheme is benchmarked to the Total Return variant of the Index.
Past performance may or may not be sustained in future*Inception date is 22 Mar 2018. **Scheme benchmark is Nifty LargeMidcap 250 TRI.The performance of the scheme is benchmarked to the Total Return variant of the Index.
ICICI Prudential Long Term Wealth Enhancement Fund
1 year SIP
SIP Investments Since Inception SIP*
Total Amount Invested (Rs. '000) 180 120
Market Value as on Month End (Rs. '000) 174.55 116.48
Scheme Return (% CAGR) -3.87 -5.43
Scheme** Benchmark Return (% CAGR) -6.18 -8.83
Nifty 50 TRI Index (% CAGR) 1.85 -1.48
ICICI Prudential Equity & Debt Fund
Past performance may or may not be sustained in future*Inception date is 03 Nov 1999. **Scheme benchmark is CRISIL Hybrid 35+65 - Aggressive Index start date - 31-Mar-02.
10 year SIP
5 year SIP
3 year SIP
1 year SIP
Since Inception
SIP*
SIP Investments15 year
SIP7 year
SIP
Total Amount Invested (Rs. '000) 2,380 1,800 1,200 840 600 360 120
Market Value as on Month End (Rs. '000) 12,177.38 5,021.27 2,281.80 1,236.97 714.54 376.76 117.52
Scheme Return (% CAGR) 14.50 12.63 12.35 10.88 6.93 2.98 -3.83
Scheme** Benchmark Return (% CAGR) NA 10.71 10.16 10.12 8.30 6.44 2.64
Nifty 50 TRI Index (% CAGR) 13.79 11.43 10.34 10.31 8.51 7.16 -1.48
1 Year T Bill (% CAGR) 6.44 6.68 7.12 7.19 7.08 7.16 8.21
The performance of the scheme is benchmarked to the Total Return variant of the Index.
* The existing Crisil Balanced Fund -Aggressive Index has been renamed as Crisil Hybrid 35 + 65 - Aggressive Index as per communication received from CRISIL.
Past performance may or may not be sustained in future*Inception date is 30 Mar 2004. **Scheme benchmark is Nifty 50 Hybrid Composite Debt 15:85 Index.
ICICI Prudential Regular Savings Fund
* The existing Crisil MIP Blended Index have been renamed as Crisil Hybrid 85 + 15 - Conservative Index as per communication received from CRISIL.
The performance of the scheme is benchmarked to the Total Return variant of the Index.
10 year SIP
5 year SIP
3 year SIP
1 year SIP
Since Inception
SIP*
SIP Investments15 year
SIP7 Year
SIP
Total Amount Invested (Rs. '000) 1,860 1,800 1,200 840 600 360 120
Market Value as on Month End (Rs. '000) 4,183.39 3,920.43 1,987.14 1,177.86 736.88 398.93 124.13
Scheme Return (% CAGR) 9.76 9.71 9.75 9.51 8.17 6.80 6.48
Scheme** Benchmark Return (% CAGR) 8.86 8.89 8.96 9.03 8.62 8.58 12.61
CRISIL 10 Year Gilt Index (% CAGR) 7.04 7.13 7.67 8.13 8.22 8.57 17.58

6979131
ANNEXURE -I
% of exposure to Total Debt AUMIssuer Name
Details of exposure across all Debt Funds of ICICI Prudential Mutual Fund as on 31-Aug-2019 i.e as a % of total debt holdings
Manappuram Finance Ltd. 0.49%MFL Securitisation Trust LIX (Originator is Magma Fincorp Ltd.) 0.02%MFL Securitisation Trust LV (Originator is Magma Fincorp Ltd.) 0.01%MFL Securitisation Trust LXII (Originator is Magma Fincorp Ltd.) 0.03%MFL Securitisation Trust LXXX (Originator is Magma Fincorp Ltd.) 0.08%MFL Securitisation Trust XLIX (Originator is Magma Fincorp Ltd.) 0.01%MFL Securitisation Trust LXX (Originator is Magma Fincorp Ltd.) 0.05%MJ Pharmaceuticals Ltd. (Secured by pledge of equity shares of Sun Pharmaceuticals Industries Ltd.) 0.15%Motilal Oswal Securities Ltd. 0.23%Aspire Home Finance Corporation Ltd.(Guarantee from Motilal Oswal Financial Services Limited) 0.13%Muthoot Finance Ltd. 0.35%NABHA Power Ltd. 0.23%NABARD 4.44%National Collateral Management Services Ltd. 0.11%National Engineering Industries Ltd. 0.02%National Fertilizers Ltd. 0.26%National Highways Authority of India 0.24%National Housing Bank 0.33%Nayara Energy Ltd. 0.21%Network18 Media & Investments Ltd. 0.11%NHPC Ltd. 0.04%Nirma Ltd. 0.15%Nissan Renault Financial Services Pvt. Ltd. 0.05%NTPC Ltd. 1.07%Nuclear Power Corporation of India Ltd. 0.02%Nuvoco Vistas Corporation Ltd. 0.41%Oriental Bank Of Commerce 0.41%Oriental Hotels Ltd. 0.07%Oriental Nagpur Betul Highway Ltd.(NHAI Annuity) 0.17%Parry Sugars Refinery India Private Ltd. 0.05%Patel KNR Heavy Infrastructures Ltd.(NHAI Annuity) 0.02%Phoenix ARC Pvt Ltd 0.05%PIPELINE INFRASTRUCTURE PRIVATE LIMITED(Sponsored by Brookfield) 0.51%Power Finance Corporation Ltd. 2.58%Power Grid Corporation Of India Ltd. 0.14%Prestige Estates Projects Ltd. 0.26%Primat IMPL(Secured by pledge of equity shares of Zee Entertainment Enterprises Limited) 0.06%Prism Johnson Ltd. 0.20%Promont Hillside Private Ltd. 0.16%Pune Solapur Expressway Pvt. Ltd.(Sponsored by Tata Realty & Infrastructure Limited (TRIL) and Atlantia SPA ) 0.10%Punjab National Bank 0.31%PVR Ltd. 0.08%Quess Corp Ltd. 0.04%The Ramco Cements Ltd. 0.16%Ramco Industries Ltd. 0.03%Rashtriya Chemicals and Fertilizers Ltd. 0.16%Raymond Ltd. 0.05%RBL Bank Ltd. 0.09%Redington (India) Ltd. 0.04%Reliable Devices Trust 07 0.56%Reliance Industries Ltd. 3.18%Reliance Jio Infocomm Ltd. 1.78%Reliance Retail Ltd. 0.84%Rural Electrification Corporation Ltd. 2.96%Sadbhav Engineering Ltd. 0.08%Sadbhav Infrastucture Project Ltd. 0.03%Sahyadri Agencies Ltd. 0.09%Samvardhana Motherson International Ltd.(Secured by pledge of equity shares of Motherson Sumi Systems Ltd.) 0.22%Sansar Trust November 2018 A1 (Originator is Shriram Transport Finance Company Ltd.) 0.23%SBI Cards & Payment Services Pvt. Ltd. 0.49%Security And Intelligence Services Pvt. Ltd. 0.08%Sharekhan BNP Paribas Financial Services Ltd 0.05%Sikka Ports & Terminals Ltd. 0.24%Silica Ceramica Pvt. Ltd. 0.07%Small Industries Development Bank Of India 1.77%SP Jammu Udhampur Highway Ltd. 0.12%Sprit Infrapower & Multiventures Pvt. Ltd. 0.04%SRF Ltd. 0.05%Standard Chartered Investment & Loan (India) Ltd. 0.40%State Bank Of India 1.77%Government Securities 4.34%Sterlite Power Grid Ventures Limited 0.16%Sterlite Technologies Ltd. 0.08%Sundaram BNP Paribas Home Finance Ltd. 0.03%Sundaram Finance Ltd. 0.46%Talwandi Sabo Power Ltd.(Guarantee from Vedanta Ltd.) 0.18%Tata Capital Financial Services Ltd. 0.66%Tata Capital Housing Finance Ltd. 0.39%Tata Communications Ltd. 0.05%Tata Housing Development Company Ltd. 0.09%Tata Motors Finance Ltd. 0.66%Tata Motors Finance Solutions Pvt. Ltd. 0.16%Tata Motors Ltd. 0.21%Tata Power Company Ltd. 0.42%Tata Projects Ltd. 0.14%Tata Realty & Infrastructure Ltd. 0.22%Tata Sons Ltd. 0.66%Tata Steel Bsl Limited 0.16%Tata Steel Ltd. 0.24%Tata Steel Processing & Distribution Ltd 0.08%Tata Teleservices (Maharashtra) Ltd. 0.67%Tata Teleservices Ltd. 0.19%Tata Value Homes Ltd. 0.21%TGS Investment & Trade Pvt. Ltd.(Aditya Birla Group) 0.09%The Great Eastern Shipping Company Ltd. 0.14%The Indian Hotels Company Ltd. 0.08%The South Indian Bank Ltd. 0.26%TMF Holdings Ltd. 0.26%Tornado Solarfarms Ltd.(CLP Group) 0.01%Torrent Pharmaceuticals Ltd. 0.05%Torrent Power Ltd. 0.15%Trent Ltd. 0.11%TRIL IT4 Pvt. Ltd. 0.15%TV Sundram Iyengar and Sons Pvt. Ltd. 0.03%TVS Motor Company Ltd. 0.04%TVS Srichakra Ltd. 0.04%Ultratech Cement Ltd. 0.02%United Spirits Ltd. 0.20%UPL Ltd. 0.21%Vardhman Special Steels Ltd. 0.04%Vardhman Textiles Ltd. 0.13%Varroc Engineering Ltd. 0.04%Vedanta Ltd. 2.29%Viacom18 Media Pvt. Ltd. 0.05%Vizag General Cargo Berth Pvt Ltd(Guarantee from Vedanta Ltd.) 0.04%Volkswagen Finance Pvt. Ltd. 0.19%Walwhan Renewables Energy Ltd. 0.47%Writers And Publishers Pvt. Ltd. 0.16%Zydus Wellness Ltd.(Subsidiary of Cadila Healthcare Limited) 0.38%
INDUSTRY/SECTOR % of exposure to Total Debt AUM
Abu Dhabi Commercial Bank PJSC 0.11%Adani Ports and Special Economic Zone Ltd. 0.94%Adarsh Advisory Services Pvt. Ltd. 0.34%Aditya Birla Capital Ltd. 0.13%Aditya Birla Fashion and Retail Limited 0.20%Aditya Birla Finance Ltd. 0.16%Aditya Birla Housing Finance Ltd. 0.05%Afcons Infrastructure Ltd.(Shapoorji Pallonji Group company) 0.03%Alembic Pharmaceuticals Ltd. 0.20%Andhra Bank 0.14%Apollo Tyres Ltd. 0.15%Aqua Space Developers Pvt. Ltd. 0.21%Ardour Developers Pvt. Ltd. 0.11%Ashiana Housing Ltd. 0.04%Ashok Leyland Ltd. 0.21%Ashoka Buildcon Ltd. 0.08%Astec LifeSciences Ltd. 0.04%AU Small Finance Bank Ltd. 0.20%Avenue Supermarts Ltd.(D-Mart) 0.05%Axis Bank Ltd. 2.72%Axis Finance Ltd. 0.05%Bahadur Chand Investments Private Ltd.(Hero Group company) 0.51%Bajaj Finance Ltd. 1.54%Bajaj Housing Finance Ltd. 0.47%Bangalore Airport Hotel Ltd.(Guarantee from Bangalore International Airport Limited) 0.15%Bank Of Baroda 0.22%Barclays Investments & Loans (India) Ltd. 0.13%BASF India Ltd. 0.05%Bharat Heavy Electricals Ltd. 0.26%Bharti Airtel Ltd. 0.61%Bharti Hexacom Ltd. 0.16%Bharti Telecom Ltd. 0.55%Bioscope Cinemas Pvt. Ltd.(Secured by pledge of equity shares of Zee Entertainment Enterprises Ltd.) 0.14%Blue Dart Express Ltd. 0.01%Blue Star Ltd. 0.05%BMW India Financial Services Ltd. 0.01%Bombay Burmah Trading Corporation Ltd. 0.11%Britannia Industries Ltd. 0.00%Can Fin Homes Ltd. 0.10%Reverse Repo 0.79%CBLO 3.61%CEAT Ltd. 0.03%Century Textiles & Industries Ltd. 0.11%Chambal Fertilisers & Chemicals Ltd. 0.26%Chennai Petroleum Corporation Ltd. 0.19%Cholamandalam Investment And Finance Company Ltd. 0.37%Citicorp Finance (India) Ltd. 0.13%Clix Capital Services Pvt. Ltd. 0.11%CLP Wind Farms (India) Pvt. Ltd. 0.15%Coastal Gujarat Power Ltd.(guarantee from Tata Power Company Limited) 0.40%Cooperatieve Rabobank U.A. 0.13%Coromandel International Ltd. 0.21%Crompton Greaves Consumer Electricals Ltd. 0.04%Daimler Financial Services India Pvt. Ltd. 0.11%DCB Bank Ltd. 0.05%Deutsche Investments India Pvt. Ltd. 0.22%EID Parry (India) Ltd.(Murugappa Group) 0.02%EMBASSY OFFICE PARKS REIT 0.34%Emirates NBD Bank PJSC 0.08%Endurance Technologies Pvt. Ltd. 0.05%Export-Import Bank Of India 0.11%Food Corporation Of India 0.03%Ford Credit India Pvt. Ltd. 0.03%Fullerton India Credit Co. Ltd. 0.21%GAIL (India) Ltd. 0.04%Gale Solar Farms Ltd. 0.01%Geetanjali Trading & Investments Pvt. Ltd.(secured by pledge of equity shares of Asian Paints Ltd.) 0.08%Gmmco Ltd. 0.05%GMR Aero Technic Ltd.(Guarantee from GMR Hyderabad International Airport Ltd.) 0.09%GMR Aerospace Engineering Ltd. 0.05%Godrej & Boyce Mfg. Co. Ltd. 0.11%Godrej Agrovet Ltd. 0.01%Godrej Properties Ltd. 0.25%Government Securities 9.96%G R Infraprojects Ltd. 0.09%Grasim Industries Ltd. 0.22%Gruh Finance Ltd. 0.05%Gujarat Cooperative Milk Marketing Federation Ltd. 0.16%Gujarat State Fertilizers and Chemicals Ltd. 0.11%Haldiram Snacks Pvt. Ltd. 0.02%HDB Financial Services Ltd. 0.35%HDFC Bank Ltd. 0.34%HDFC Credila Financial Services Pvt. Ltd. 0.14%Hero Fincorp Ltd. 0.19%Hero Housing Finance Ltd. 0.05%Hindalco Industries Ltd. 0.43%Hinduja Leyland Finance Ltd.(Hinduja Group) 0.09%Hindustan Petroleum Corporation Ltd. 0.05%Housing and Urban Development Corporation Ltd. 1.46%HDFC Ltd. 5.79%HPCL - Mittal Pipelines Ltd. 0.02%ICICI Bank Ltd. 0.96%ICICI Home Finance Company Ltd. 0.06%IDBI Bank Ltd. 0.04%IDFC First Bank Ltd. 2.06%IIERT June 2018 II (Originator - SREI Equipment Finance Ltd.) 0.08%IIERT Oct 2018 II (Originator - SREI Equipment Finance Ltd.) 0.05%IIFL Home Finance Ltd. 0.03%Incline Realty Pvt. Ltd. 0.24%India Grid Trust 0.16%Indiabulls Housing Finance Ltd. 0.07%Indian Farmers Fertilizers Cooperative Ltd. 0.08%Indian Oil Corporation Ltd. 0.82%Indian Railway Finance Corporation Ltd. 0.25%Indus Towers Limited 0.47%IndusInd Bank Ltd. 1.33%Inox Air Products Ltd. 0.18%Jamna Auto Industries Ltd. 0.01%Jamnagar Utilities & Power Private Ltd. 0.55%Jay Properties Pvt. Ltd. 0.14%Jhajjar Power Ltd.(CLP Group) 0.11%JM Financial Products Ltd. 0.29%JMC Projects (India) Ltd. 0.08%John Deere Financial India Pvt. Ltd. 0.27%JSW Steel Ltd. 0.20%JSW Techno Projects Management Ltd.(Secured by pledge of Equity Shares of JSW Steel Ltd. and JSW Energy Ltd.) 0.18%Julius Baer Capital (India) Pvt. Ltd. 0.14%Kalpataru Properties (Thane) Pvt. Ltd. 0.11%KKR India Financial Services Pvt. Ltd. 0.30%Kotak Mahindra Investments Ltd. 0.16%Kotak Mahindra Prime Ltd. 0.68%Kotak Securities Ltd. 0.21%KRIBHCO Fertilizers Ltd. 0.16%Kribhco Infrastructure Ltd.(Guarantee from KRIBHCO) 0.07%Krishak Bharati Co-operative Ltd. 0.05%Larsen & Toubro Ltd. 0.42%LIC Housing Finance Ltd. 2.71%Mahanagar Telephone Nigam Ltd. 0.19%Mahindra & Mahindra Financial Services Ltd. 0.47%Mahindra CIE Automotive Ltd. 0.04%Mahindra Homes Pvt. Ltd. 0.05%Mahindra Integrated Township Ltd. 0.01%Mahindra Rural Housing Finance Ltd. 0.10%Mahindra World City (Jaipur) Ltd. 0.02%Maithon Power Ltd. 0.08%
Issuer Name% of exposure to Total Debt AUM
BANKS 16.10%CASH (CBLO & REVERSE REPO) 4.41%CORPORATES 29.63%FINANCIAL SERVICES 18.51%GOI & TBILLS 14.30%NBFC 15.10%REAL ESTATE 1.96%

Dividend History
ANNEXURE -IIPass Through Certificates (PTC) Details
Pool PTC Details
Originator Trust Details Existing MF Rating Type of Pool
L&T Finance Ltd. Seagull Trust I FITCH AA+(SO) Car, CV & CE SREI Equipment Finance Pvt. Ltd. IIERT June 2018 II CRISIL AAA(SO) Car, CV & CE SREI Equipment Finance Pvt. Ltd. IIERT Oct 2018 II CRISIL AAA(SO) Car, CV & CE Magma Fincorp Ltd. MFL Securitisation Trust LIX FITCH AAA(SO) Car, CV & CE Magma Fincorp Ltd. MFL Securitisation Trust LV ICRA AAA(SO) Car, CV & CE Magma Fincorp Ltd. MFL Securitisation Trust LXII CRISIL AAA(SO) Car, CV & CE Magma Fincorp Ltd. MFL Securitisation Trust LXX FITCH AAA(SO) Car, CV & CE Magma Fincorp Ltd. MFL Securitisation Trust XLII ICRA AAA(SO) Car, CV & CE Magma Fincorp Ltd. MFL Securitisation Trust XLIX CRISIL AAA(SO) Car, CV & CE Reliable Devices Trust Reliable Devices Trust ICRA AAA(SO) Car, CV & CE Shriram Transport Finance Company Ltd. Sansar Trust November 2018 A1 ICRA AAA(SO) Car, CV & CE Magma Fincorp Ltd. MFL Securitisation Trust LXXX CRISIL AAA(SO) Car, CV & CE
132
ICICI Prudential Technology Fund - Dividend
Record Date Face Value (Rs) NAV (Rs) Dividend (Rs.)/Unit
23-Feb-17 10.00 29.78 2.7020-Feb-18 10.00 34.15 4.1020-Feb-19 10.00 35.79 3.50
ICICI Prudential Multi-Asset Fund - Dividend Option
Record Date Face Value (Rs) NAV (Rs) Dividend (Rs.)/Unit
12-Jun-19 10.0000 20.8207 0.230010-Jul-19 10.0000 20.3577 0.230008-Aug-19 10.0000 19.6490 0.2300
ICICI Prudential Multi-Asset Fund - Direct Plan - Dividend
Record Date Face Value (Rs) NAV (Rs) Dividend (Rs.)/Unit
12-Jun-19 10.0000 26.1519 0.200010-Jul-19 10.0000 25.6701 0.200008-Aug-19 10.0000 24.8758 0.2000
ICICI Prudential Infrastructure Fund - Dividend Option
Record Date Face Value (Rs) NAV (Rs) Dividend (Rs.)/Unit
09-Mar-18 10.00 14.13 0.7516-Aug-18 10.00 12.71 0.6508-Aug-19 10.00 11.67 0.60
ICICI Prudential Infrastructure Fund - Direct Plan - Dividend Option
Record Date Face Value (Rs) NAV (Rs) Dividend (Rs.)/Unit
09-Mar-18 10.00 18.42 0.7516-Aug-18 10.00 16.85 0.6508-Aug-19 10.00 15.79 0.60
ICICI Prudential Technology Fund - Direct Plan - Dividend
Record Date Face Value (Rs) NAV (Rs) Dividend (Rs.)/Unit
23-Feb-17 10.00 41.52 2.7020-Feb-18 10.00 49.33 3.4020-Feb-19 10.00 55.20 3.50
ICICI Prudential Focused Equity Fund - Direct Plan - Dividend
Record Date Face Value (Rs) NAV (Rs) Dividend (Rs.)/Unit
23-Jun-17 10.00 27.05 2.3009-Mar-18 10.00 26.38 1.8519-Jun-19 10.00 26.26 2.05
ICICI Prudential Multicap Fund -Direct Plan - Dividend Option
Record Date Face Value (Rs) NAV (Rs) Dividend (Rs.)/Unit
15-Dec-17 10.00 34.38 3.0016-Mar-18 10.00 30.88 1.2017-Dec-18 10.00 31.10 1.10
Record Date Face Value (Rs) NAV (Rs) Dividend (Rs.)/Unit
ICICI Prudential Multicap Fund - Dividend Option
15-Dec-17 10.00 26.73 3.0016-Mar-18 10.00 23.29 1.2017-Dec-18 10.00 22.98 1.10
ICICI Prudential Bluechip Fund - Dividend
Record Date Face Value (Rs) NAV (Rs) Dividend (Rs.)/Unit
20-Jan-17 10.00 21.87 2.0019-Jan-18 10.00 26.22 3.1521-Jan-19 10.00 22.32 2.00
ICICI Prudential Bluechip Fund - Direct Plan - Dividend
Record Date Face Value (Rs) NAV (Rs) Dividend (Rs.)/Unit
20-Jan-17 10.00 28.75 1.2019-Jan-18 10.00 36.69 3.1521-Jan-19 10.00 32.78 2.00
ICICI Prudential Midcap Fund - Dividend Option
Record Date Face Value (Rs) NAV (Rs) Dividend (Rs.)/Unit
17-Nov-17 10.00 29.95 3.6516-Mar-18 10.00 26.26 1.3526-Nov-18 10.00 23.05 1.00
ICICI Prudential Midcap Fund - Direct Plan - Dividend
Record Date Face Value (Rs) NAV (Rs) Dividend (Rs.)/Unit
17-Nov-17 10.00 35.76 3.6516-Mar-18 10.00 32.19 1.3526-Nov-18 10.00 28.77 1.00
ICICI Prudential Large & Mid Cap Fund - Dividend Option
Record Date Face Value (Rs) NAV (Rs) Dividend (Rs.)/Unit
21-Apr-17 10.00 19.56 1.8009-Mar-18 10.00 18.95 2.0016-Apr-19 10.00 17.90 1.60
ICICI Prudential Large & Mid Cap Fund - Direct Plan - Dividend
Record Date Face Value (Rs) NAV (Rs) Dividend (Rs.)/Unit
21-Apr-17 10.00 24.77 1.8009-Mar-18 10.00 24.79 2.0016-Apr-19 10.00 24.35 1.60
ICICI Prudential Smallcap Fund - Dividend
Record Date Face Value (Rs) NAV (Rs) Dividend (Rs.)/Unit
30-Oct-15 10.00 17.02 1.4021-Oct-16 10.00 17.82 1.6009-Mar-18 10.00 19.83 2.10
ICICI Prudential Smallcap Fund - Direct Plan - Dividend
Record Date Face Value (Rs) NAV (Rs) Dividend (Rs.)/Unit
09-Mar-18 10.00 28.99 2.10
ICICI Prudential Long Term Equity Fund (Tax Saving) - Dividend
Record Date Face Value (Rs) NAV (Rs) Dividend (Rs.)/Unit
13-Dec-18 10.00 21.64 0.7018-Mar-19 10.00 21.79 0.7012-Jun-19 10.00 21.95 0.70
Record Date Face Value (Rs) NAV (Rs) Dividend (Rs.)/Unit
ICICI Prudential Long Term Equity Fund (Tax Saving) - Direct Plan - Dividend
13-Dec-18 10.00 29.47 0.7018-Mar-19 10.00 30.01 0.7012-Jun-19 10.00 30.54 0.70
ICICI Prudential Value Discovery Fund - Dividend Option
Record Date Face Value (Rs) NAV (Rs) Dividend (Rs.)/Unit24-Mar-17 10.00 34.03 3.1016-Mar-18 10.00 33.17 4.1520-Mar-19 10.00 29.97 3.75
ICICI Prudential Value Discovery Fund - Direct Plan - Dividend
Record Date Face Value (Rs) NAV (Rs) Dividend (Rs.)/Unit
23-Mar-16 10.00 41.56 1.0016-Mar-18 10.00 53.67 4.1520-Mar-19 10.00 51.60 3.75
ICICI Prudential Focused Equity Fund - Dividend
Record Date Face Value (Rs) NAV (Rs) Dividend (Rs.)/Unit
23-Jun-17 10.00 19.04 2.3009-Mar-18 10.00 17.70 1.8519-Jun-19 10.00 16.75 2.05

Dividend History
ICICI Prudential Growth Fund- Series 1 - Dividend
Record Date Face Value (Rs) NAV (Rs) Dividend (Rs.)/Unit
28-Jul-17 10.00 11.98 0.7516-Jan-18 10.00 12.89 0.7520-Mar-18 10.00 11.24 1.00
133
ICICI Prudential FMCG Fund - Dividend
Record Date Face Value (Rs) NAV (Rs) Dividend (Rs.)/Unit
30-Dec-16 10.00 63.69 5.0020-Feb-18 10.00 77.66 9.4520-Feb-19 10.00 72.11 6.50
ICICI Prudential R.I.G.H.T. Fund - Dividend
Record Date Face Value (Rs) NAV (Rs) Dividend (Rs.)/Unit
31-Jul-15 10.00 26.37 2.1529-Jul-16 10.00 24.34 2.0009-Mar-18 10.00 28.88 5.00
ICICI Prudential Sensex ETF
Record Date Face Value (Rs) NAV (Rs) Dividend (Rs.)/Unit
25-Jul-14 10.0000 289.0755 27.0000
ICICI Prudential Nifty ETF
Record Date Face Value (Rs) NAV (Rs) Dividend (Rs.)/Unit
29-Apr-16 10.0000 81.1747 2.2000
ICICI Prudential FMCG Fund - Direct Plan - Dividend
Record Date Face Value (Rs) NAV (Rs) Dividend (Rs.)/Unit30-Dec-16 10.00 83.43 4.4320-Feb-18 10.00 105.31 4.5020-Feb-19 10.00 107.61 6.50
ICICI Prudential Exports and Services Fund - Direct Plan - Dividend
Record Date Face Value (Rs) NAV (Rs) Dividend (Rs.)/Unit
26-May-17 10.00 38.35 3.5009-Mar-18 10.00 39.39 2.8015-May-19 10.00 34.25 1.90
ICICI Prudential Exports and Services Fund - Dividend Option
Record Date Face Value (Rs) NAV (Rs) Dividend (Rs.)/Unit26-May-17 10.00 27.70 3.5009-Mar-18 10.00 27.12 2.8015-May-19 10.00 22.50 1.90
ICICI Prudential Dividend Yield Equity Fund - Direct Plan - Dividend Option
Record Date Face Value (Rs) NAV (Rs) Dividend (Rs.)/Unit
09-Mar-18 10.00 14.71 0.7527-Jul-18 10.00 13.70 0.6510-Jul-19 10.00 12.29 0.94
ICICI Prudential Dividend Yield Equity Fund - Dividend Option
Record Date Face Value (Rs) NAV (Rs) Dividend (Rs.)/Unit
09-Mar-18 10.00 14.28 0.7527-Jul-18 10.00 13.23 0.6510-Jul-19 10.00 11.75 1.10
ICICI Prudential Balanced Advantage Fund - Dividend Option
Record Date Face Value (Rs) NAV (Rs) Dividend (Rs.)/Unit06-Oct-17 10.00 17.11 1.7016-Mar-18 10.00 15.84 0.8030-Oct-18 10.00 14.94 0.60
ICICI Prudential Banking and Financial Services Fund - Dividend
Record Date Face Value (Rs) NAV (Rs) Dividend (Rs.)/Unit
23-Feb-17 10.00 35.98 3.2016-Feb-18 10.00 39.17 4.8020-Feb-19 10.00 33.19 3.00
ICICI Prudential Banking and Financial Services Fund - Direct Plan - Dividend
Record Date Face Value (Rs) NAV (Rs) Dividend (Rs.)/Unit23-Feb-17 10.00 49.10 3.2016-Feb-18 10.00 55.57 4.8020-Feb-19 10.00 49.60 3.00
ICICI Prudential Balanced Advantage Fund - Direct Plan - Dividend
Record Date Face Value (Rs) NAV (Rs) Dividend (Rs.)/Unit
06-Oct-17 10.00 20.51 1.5316-Mar-18 10.00 19.62 0.6430-Oct-18 10.00 18.99 0.55
ICICI Prudential Balanced Advantage Fund - Monthly Dividend
Record Date Face Value (Rs) NAV (Rs) Dividend (Rs.)/Unit
03-Jun-19 10.00 14.57 0.0702-Jul-19 10.00 14.50 0.0701-Aug-19 10.00 13.94 0.07
ICICI Prudential Balanced Advantage Fund - Direct Plan - Monthly Dividend
Record Date Face Value (Rs) NAV (Rs) Dividend (Rs.)/Unit
12-Jun-19 10.00 15.99 0.0710-Jul-19 10.00 15.76 0.0708-Aug-19 10.00 15.45 0.07
ICICI Prudential Balanced Advantage Fund - Direct Plan - Quarterly Dividend
Record Date Face Value (Rs) NAV (Rs) Dividend (Rs.)/Unit
24-Mar-17 10.00 12.37 0.2002-Jun-17 10.00 12.56 0.2520-Feb-18 10.00 13.28 0.75
ICICI Prudential Balanced Advantage Fund - Quarterly Dividend
Record Date Face Value (Rs) NAV (Rs) Dividend (Rs.)/Unit
24-Mar-17 10.00 11.90 0.2002-Jun-17 10.00 12.04 0.2520-Feb-18 10.00 12.60 0.75
ICICI Prudential Equity Savings Fund - Monthly Dividend
Record Date Face Value (Rs) NAV (Rs) Dividend (Rs.)/Unit03-Jun-19 10.00 11.17 0.0502-Jul-19 10.00 11.23 0.0501-Aug-19 10.00 10.99 0.05
ICICI Prudential Equity Savings Fund - Direct Plan - Monthly Dividend
Record Date Face Value (Rs) NAV (Rs) Dividend (Rs.)/Unit03-Jun-19 10.00 12.60 0.0502-Jul-19 10.00 12.68 0.0501-Aug-19 10.00 12.43 0.05
ICICI Prudential Equity Savings Fund - Quarterly Dividend
Record Date Face Value (Rs) NAV (Rs) Dividend (Rs.)/Unit
20-Dec-18 10.00 11.40 0.1805-Mar-19 10.00 11.33 0.1806-Jun-19 10.00 11.58 0.18
ICICI Prudential Equity Savings Fund - Direct Plan - Quarterly Dividend
Record Date Face Value (Rs) NAV (Rs) Dividend (Rs.)/Unit
20-Dec-18 10.00 12.30 0.1805-Mar-19 10.00 12.26 0.1806-Jun-19 10.00 12.56 0.18
ICICI Prudential Equity Savings Fund - Half Yearly Dividend
Record Date Face Value (Rs) NAV (Rs) Dividend (Rs.)/Unit
20-Dec-17 10.00 12.28 0.2420-Dec-18 10.00 12.50 0.2420-Jun-19 10.00 12.88 0.24
ICICI Prudential Equity Savings Fund - Direct Plan - Half Yearly Dividend
Record Date Face Value (Rs) NAV (Rs) Dividend (Rs.)/Unit
20-Jun-16 10.00 10.73 0.2420-Dec-18 10.00 13.17 0.2420-Jun-19 10.00 13.62 0.24
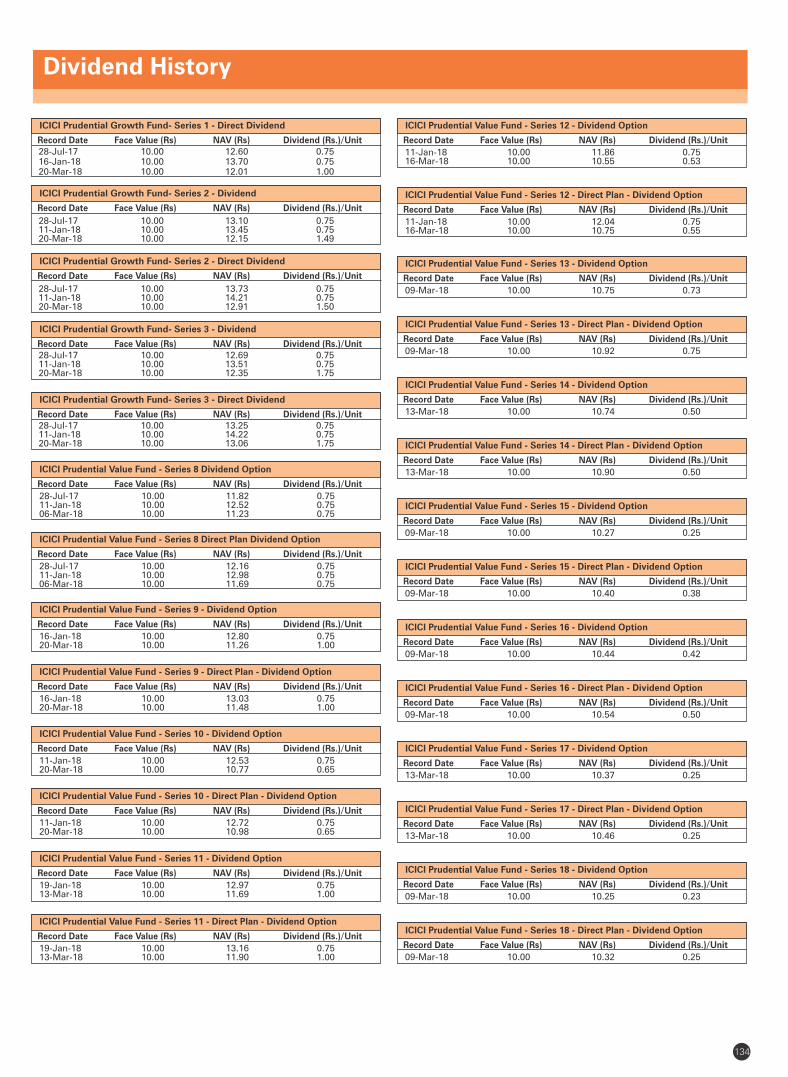
Dividend History
134
ICICI Prudential Value Fund - Series 8 Direct Plan Dividend Option
Record Date Face Value (Rs) NAV (Rs) Dividend (Rs.)/Unit
28-Jul-17 10.00 12.16 0.7511-Jan-18 10.00 12.98 0.7506-Mar-18 10.00 11.69 0.75
ICICI Prudential Value Fund - Series 8 Dividend Option
Record Date Face Value (Rs) NAV (Rs) Dividend (Rs.)/Unit
28-Jul-17 10.00 11.82 0.7511-Jan-18 10.00 12.52 0.7506-Mar-18 10.00 11.23 0.75
ICICI Prudential Value Fund - Series 9 - Dividend Option
Record Date Face Value (Rs) NAV (Rs) Dividend (Rs.)/Unit
16-Jan-18 10.00 12.80 0.7520-Mar-18 10.00 11.26 1.00
ICICI Prudential Value Fund - Series 9 - Direct Plan - Dividend Option
Record Date Face Value (Rs) NAV (Rs) Dividend (Rs.)/Unit
16-Jan-18 10.00 13.03 0.7520-Mar-18 10.00 11.48 1.00
ICICI Prudential Value Fund - Series 10 - Dividend Option
Record Date Face Value (Rs) NAV (Rs) Dividend (Rs.)/Unit
11-Jan-18 10.00 12.53 0.7520-Mar-18 10.00 10.77 0.65
ICICI Prudential Value Fund - Series 10 - Direct Plan - Dividend Option
Record Date Face Value (Rs) NAV (Rs) Dividend (Rs.)/Unit
11-Jan-18 10.00 12.72 0.7520-Mar-18 10.00 10.98 0.65
ICICI Prudential Value Fund - Series 11 - Dividend Option
Record Date Face Value (Rs) NAV (Rs) Dividend (Rs.)/Unit
19-Jan-18 10.00 12.97 0.7513-Mar-18 10.00 11.69 1.00
ICICI Prudential Value Fund - Series 11 - Direct Plan - Dividend Option
Record Date Face Value (Rs) NAV (Rs) Dividend (Rs.)/Unit
19-Jan-18 10.00 13.16 0.7513-Mar-18 10.00 11.90 1.00
ICICI Prudential Growth Fund- Series 1 - Direct Dividend
Record Date Face Value (Rs) NAV (Rs) Dividend (Rs.)/Unit28-Jul-17 10.00 12.60 0.7516-Jan-18 10.00 13.70 0.7520-Mar-18 10.00 12.01 1.00
ICICI Prudential Growth Fund- Series 2 - Dividend
Record Date Face Value (Rs) NAV (Rs) Dividend (Rs.)/Unit
28-Jul-17 10.00 13.10 0.7511-Jan-18 10.00 13.45 0.7520-Mar-18 10.00 12.15 1.49
ICICI Prudential Growth Fund- Series 2 - Direct Dividend
Record Date Face Value (Rs) NAV (Rs) Dividend (Rs.)/Unit
28-Jul-17 10.00 13.73 0.7511-Jan-18 10.00 14.21 0.7520-Mar-18 10.00 12.91 1.50
ICICI Prudential Growth Fund- Series 3 - Dividend
Record Date Face Value (Rs) NAV (Rs) Dividend (Rs.)/Unit28-Jul-17 10.00 12.69 0.7511-Jan-18 10.00 13.51 0.7520-Mar-18 10.00 12.35 1.75
ICICI Prudential Growth Fund- Series 3 - Direct Dividend
Record Date Face Value (Rs) NAV (Rs) Dividend (Rs.)/Unit28-Jul-17 10.00 13.25 0.7511-Jan-18 10.00 14.22 0.7520-Mar-18 10.00 13.06 1.75
ICICI Prudential Value Fund - Series 12 - Dividend Option
Record Date Face Value (Rs) NAV (Rs) Dividend (Rs.)/Unit
11-Jan-18 10.00 11.86 0.7516-Mar-18 10.00 10.55 0.53
ICICI Prudential Value Fund - Series 12 - Direct Plan - Dividend Option
Record Date Face Value (Rs) NAV (Rs) Dividend (Rs.)/Unit
11-Jan-18 10.00 12.04 0.7516-Mar-18 10.00 10.75 0.55
ICICI Prudential Value Fund - Series 13 - Dividend Option
Record Date Face Value (Rs) NAV (Rs) Dividend (Rs.)/Unit
09-Mar-18 10.00 10.75 0.73
ICICI Prudential Value Fund - Series 13 - Direct Plan - Dividend Option
Record Date Face Value (Rs) NAV (Rs) Dividend (Rs.)/Unit
09-Mar-18 10.00 10.92 0.75
ICICI Prudential Value Fund - Series 14 - Dividend Option
Record Date Face Value (Rs) NAV (Rs) Dividend (Rs.)/Unit
13-Mar-18 10.00 10.74 0.50
ICICI Prudential Value Fund - Series 14 - Direct Plan - Dividend Option
Record Date Face Value (Rs) NAV (Rs) Dividend (Rs.)/Unit
13-Mar-18 10.00 10.90 0.50
ICICI Prudential Value Fund - Series 15 - Dividend Option
Record Date Face Value (Rs) NAV (Rs) Dividend (Rs.)/Unit
09-Mar-18 10.00 10.27 0.25
ICICI Prudential Value Fund - Series 15 - Direct Plan - Dividend Option
Record Date Face Value (Rs) NAV (Rs) Dividend (Rs.)/Unit
09-Mar-18 10.00 10.40 0.38
ICICI Prudential Value Fund - Series 16 - Dividend Option
Record Date Face Value (Rs) NAV (Rs) Dividend (Rs.)/Unit
09-Mar-18 10.00 10.44 0.42
ICICI Prudential Value Fund - Series 16 - Direct Plan - Dividend Option
Record Date Face Value (Rs) NAV (Rs) Dividend (Rs.)/Unit
09-Mar-18 10.00 10.54 0.50
ICICI Prudential Value Fund - Series 17 - Dividend Option
Record Date Face Value (Rs) NAV (Rs) Dividend (Rs.)/Unit
13-Mar-18 10.00 10.37 0.25
ICICI Prudential Value Fund - Series 18 - Direct Plan - Dividend Option
Record Date Face Value (Rs) NAV (Rs) Dividend (Rs.)/Unit
09-Mar-18 10.00 10.32 0.25
ICICI Prudential Value Fund - Series 17 - Direct Plan - Dividend Option
Record Date Face Value (Rs) NAV (Rs) Dividend (Rs.)/Unit
13-Mar-18 10.00 10.46 0.25
ICICI Prudential Value Fund - Series 18 - Dividend Option
Record Date Face Value (Rs) NAV (Rs) Dividend (Rs.)/Unit
09-Mar-18 10.00 10.25 0.23
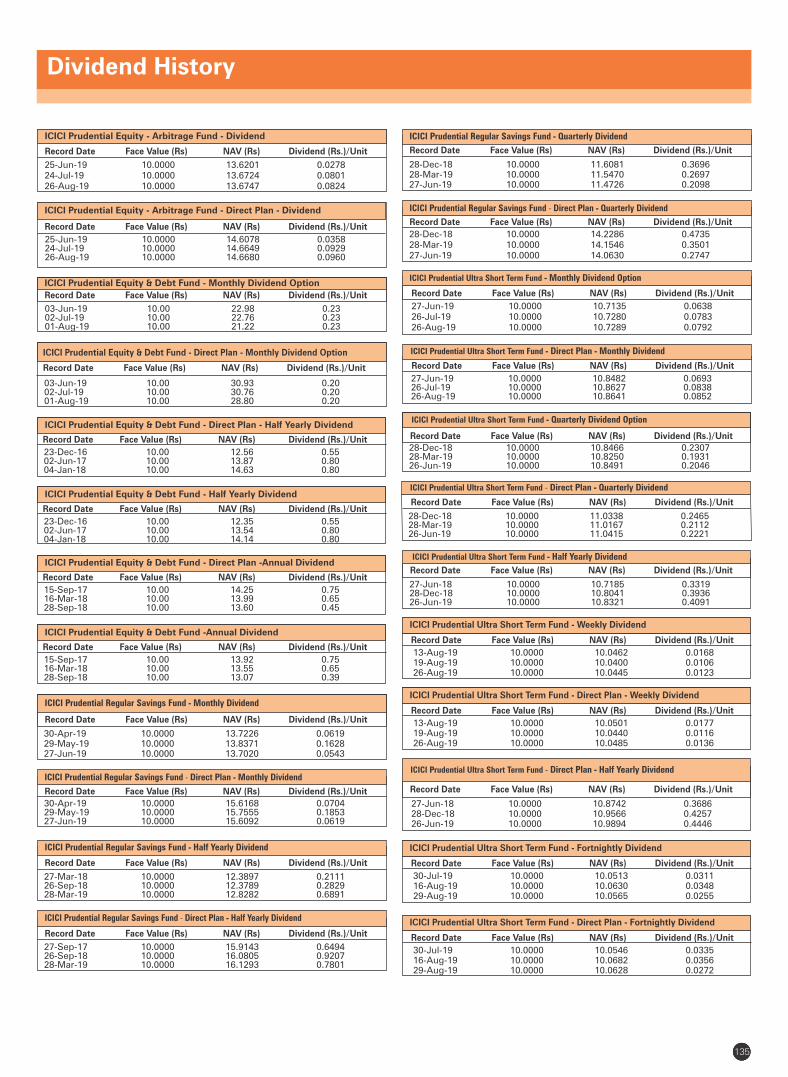
Dividend History
6979135
ICICI Prudential Regular Savings Fund - Half Yearly Dividend
Record Date Face Value (Rs) NAV (Rs) Dividend (Rs.)/Unit
27-Mar-18 10.0000 12.3897 0.211126-Sep-18 10.0000 12.3789 0.282928-Mar-19 10.0000 12.8282 0.6891
ICICI Prudential Equity & Debt Fund -Annual Dividend
Record Date Face Value (Rs) NAV (Rs) Dividend (Rs.)/Unit
15-Sep-17 10.00 13.92 0.7516-Mar-18 10.00 13.55 0.6528-Sep-18 10.00 13.07 0.39
ICICI Prudential Equity - Arbitrage Fund - Direct Plan - Dividend
Record Date Face Value (Rs) NAV (Rs) Dividend (Rs.)/Unit
25-Jun-19 10.0000 14.6078 0.035824-Jul-19 10.0000 14.6649 0.092926-Aug-19 10.0000 14.6680 0.0960
ICICI Prudential Equity - Arbitrage Fund - Dividend
Record Date Face Value (Rs) NAV (Rs) Dividend (Rs.)/Unit
25-Jun-19 10.0000 13.6201 0.027824-Jul-19 10.0000 13.6724 0.080126-Aug-19 10.0000 13.6747 0.0824
ICICI Prudential Equity & Debt Fund - Monthly Dividend Option
Record Date Face Value (Rs) NAV (Rs) Dividend (Rs.)/Unit
03-Jun-19 10.00 22.98 0.2302-Jul-19 10.00 22.76 0.2301-Aug-19 10.00 21.22 0.23
ICICI Prudential Equity & Debt Fund - Direct Plan - Monthly Dividend Option
Record Date Face Value (Rs) NAV (Rs) Dividend (Rs.)/Unit
03-Jun-19 10.00 30.93 0.2002-Jul-19 10.00 30.76 0.2001-Aug-19 10.00 28.80 0.20
ICICI Prudential Equity & Debt Fund - Direct Plan - Half Yearly Dividend
Record Date Face Value (Rs) NAV (Rs) Dividend (Rs.)/Unit
23-Dec-16 10.00 12.56 0.5502-Jun-17 10.00 13.87 0.8004-Jan-18 10.00 14.63 0.80
ICICI Prudential Equity & Debt Fund - Half Yearly Dividend
Record Date Face Value (Rs) NAV (Rs) Dividend (Rs.)/Unit
23-Dec-16 10.00 12.35 0.5502-Jun-17 10.00 13.54 0.8004-Jan-18 10.00 14.14 0.80
ICICI Prudential Equity & Debt Fund - Direct Plan -Annual Dividend
Record Date Face Value (Rs) NAV (Rs) Dividend (Rs.)/Unit
15-Sep-17 10.00 14.25 0.7516-Mar-18 10.00 13.99 0.6528-Sep-18 10.00 13.60 0.45
ICICI Prudential Regular Savings Fund - Direct Plan - Monthly Dividend
Record Date Face Value (Rs) NAV (Rs) Dividend (Rs.)/Unit
30-Apr-19 10.0000 15.6168 0.070429-May-19 10.0000 15.7555 0.185327-Jun-19 10.0000 15.6092 0.0619
ICICI Prudential Regular Savings Fund - Monthly Dividend
Record Date Face Value (Rs) NAV (Rs) Dividend (Rs.)/Unit
30-Apr-19 10.0000 13.7226 0.061929-May-19 10.0000 13.8371 0.162827-Jun-19 10.0000 13.7020 0.0543
ICICI Prudential Regular Savings Fund - Direct Plan - Half Yearly Dividend
Record Date Face Value (Rs) NAV (Rs) Dividend (Rs.)/Unit
27-Sep-17 10.0000 15.9143 0.649426-Sep-18 10.0000 16.0805 0.920728-Mar-19 10.0000 16.1293 0.7801
ICICI Prudential Regular Savings Fund - Quarterly Dividend
Record Date Face Value (Rs) NAV (Rs) Dividend (Rs.)/Unit
28-Dec-18 10.0000 11.6081 0.369628-Mar-19 10.0000 11.5470 0.269727-Jun-19 10.0000 11.4726 0.2098
ICICI Prudential Regular Savings Fund - Direct Plan - Quarterly Dividend
Record Date Face Value (Rs) NAV (Rs) Dividend (Rs.)/Unit
28-Dec-18 10.0000 14.2286 0.473528-Mar-19 10.0000 14.1546 0.350127-Jun-19 10.0000 14.0630 0.2747
ICICI Prudential Ultra Short Term Fund - Direct Plan - Monthly Dividend
Record Date Face Value (Rs) NAV (Rs) Dividend (Rs.)/Unit
27-Jun-19 10.0000 10.8482 0.069326-Jul-19 10.0000 10.8627 0.083826-Aug-19 10.0000 10.8641 0.0852
ICICI Prudential Ultra Short Term Fund - Monthly Dividend Option
Record Date Face Value (Rs) NAV (Rs) Dividend (Rs.)/Unit
27-Jun-19 10.0000 10.7135 0.063826-Jul-19 10.0000 10.7280 0.078326-Aug-19 10.0000 10.7289 0.0792
ICICI Prudential Ultra Short Term Fund - Quarterly Dividend Option
Record Date Face Value (Rs) NAV (Rs) Dividend (Rs.)/Unit
28-Dec-18 10.0000 10.8466 0.230728-Mar-19 10.0000 10.8250 0.193126-Jun-19 10.0000 10.8491 0.2046
ICICI Prudential Ultra Short Term Fund - Direct Plan - Quarterly Dividend
Record Date Face Value (Rs) NAV (Rs) Dividend (Rs.)/Unit
28-Dec-18 10.0000 11.0338 0.246528-Mar-19 10.0000 11.0167 0.211226-Jun-19 10.0000 11.0415 0.2221
Record Date Face Value (Rs) NAV (Rs) Dividend (Rs.)/Unit
ICICI Prudential Ultra Short Term Fund - Direct Plan - Half Yearly Dividend
27-Jun-18 10.0000 10.8742 0.368628-Dec-18 10.0000 10.9566 0.425726-Jun-19 10.0000 10.9894 0.4446
Record Date Face Value (Rs) NAV (Rs) Dividend (Rs.)/Unit
ICICI Prudential Ultra Short Term Fund - Weekly Dividend
13-Aug-19 10.0000 10.0462 0.016819-Aug-19 10.0000 10.0400 0.010626-Aug-19 10.0000 10.0445 0.0123
Record Date Face Value (Rs) NAV (Rs) Dividend (Rs.)/Unit
ICICI Prudential Ultra Short Term Fund - Half Yearly Dividend
27-Jun-18 10.0000 10.7185 0.331928-Dec-18 10.0000 10.8041 0.393626-Jun-19 10.0000 10.8321 0.4091
Record Date Face Value (Rs) NAV (Rs) Dividend (Rs.)/Unit
ICICI Prudential Ultra Short Term Fund - Direct Plan - Weekly Dividend
13-Aug-19 10.0000 10.0501 0.017719-Aug-19 10.0000 10.0440 0.011626-Aug-19 10.0000 10.0485 0.0136
Record Date Face Value (Rs) NAV (Rs) Dividend (Rs.)/Unit
ICICI Prudential Ultra Short Term Fund - Fortnightly Dividend
30-Jul-19 10.0000 10.0513 0.031116-Aug-19 10.0000 10.0630 0.034829-Aug-19 10.0000 10.0565 0.0255
Record Date Face Value (Rs) NAV (Rs) Dividend (Rs.)/Unit
ICICI Prudential Ultra Short Term Fund - Direct Plan - Fortnightly Dividend
30-Jul-19 10.0000 10.0546 0.033516-Aug-19 10.0000 10.0682 0.035629-Aug-19 10.0000 10.0628 0.0272
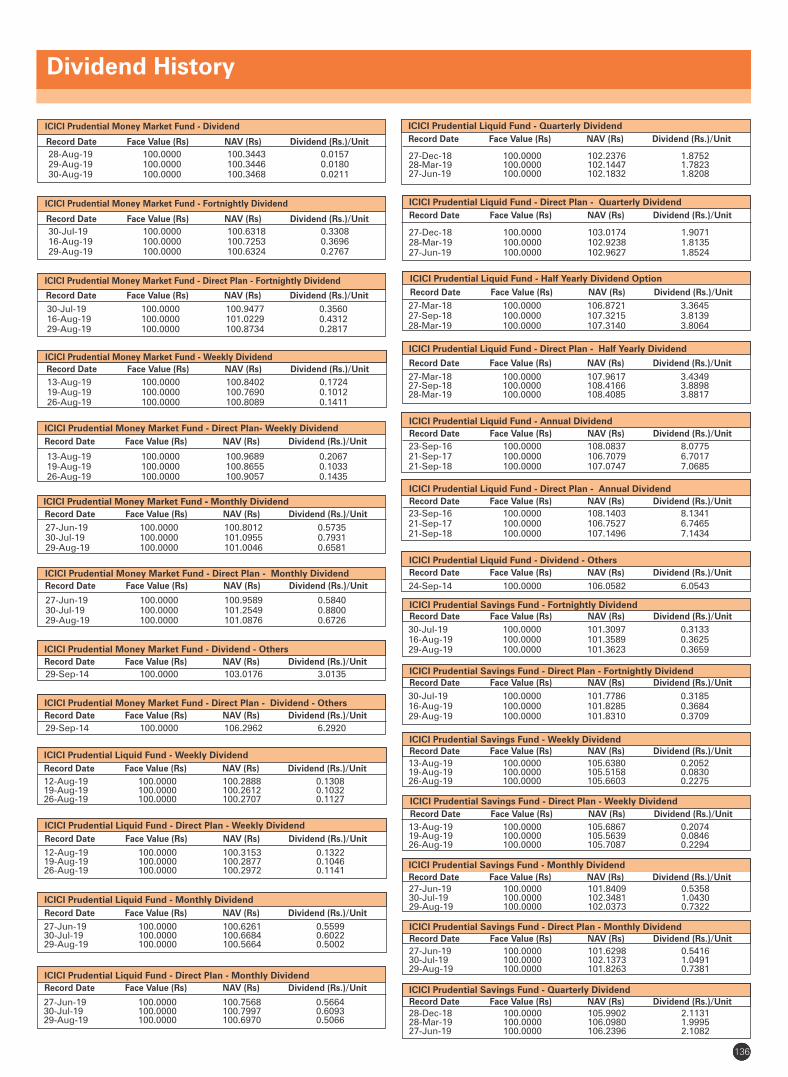
Dividend History
6979
ICICI Prudential Money Market Fund - Direct Plan - Dividend - Others
Record Date Face Value (Rs) NAV (Rs) Dividend (Rs.)/Unit
29-Sep-14 100.0000 106.2962 6.2920
ICICI Prudential Money Market Fund - Dividend - Others
Record Date Face Value (Rs) NAV (Rs) Dividend (Rs.)/Unit
29-Sep-14 100.0000 103.0176 3.0135
ICICI Prudential Liquid Fund - Direct Plan - Monthly Dividend
Record Date Face Value (Rs) NAV (Rs) Dividend (Rs.)/Unit
27-Jun-19 100.0000 100.7568 0.566430-Jul-19 100.0000 100.7997 0.609329-Aug-19 100.0000 100.6970 0.5066
ICICI Prudential Liquid Fund - Half Yearly Dividend Option
Record Date Face Value (Rs) NAV (Rs) Dividend (Rs.)/Unit
27-Mar-18 100.0000 106.8721 3.364527-Sep-18 100.0000 107.3215 3.813928-Mar-19 100.0000 107.3140 3.8064
ICICI Prudential Liquid Fund - Quarterly Dividend
Record Date Face Value (Rs) NAV (Rs) Dividend (Rs.)/Unit
27-Dec-18 100.0000 102.2376 1.875228-Mar-19 100.0000 102.1447 1.782327-Jun-19 100.0000 102.1832 1.8208
ICICI Prudential Liquid Fund - Direct Plan - Quarterly Dividend
Record Date Face Value (Rs) NAV (Rs) Dividend (Rs.)/Unit
27-Dec-18 100.0000 103.0174 1.907128-Mar-19 100.0000 102.9238 1.813527-Jun-19 100.0000 102.9627 1.8524
ICICI Prudential Liquid Fund - Direct Plan - Half Yearly Dividend
Record Date Face Value (Rs) NAV (Rs) Dividend (Rs.)/Unit
27-Mar-18 100.0000 107.9617 3.434927-Sep-18 100.0000 108.4166 3.889828-Mar-19 100.0000 108.4085 3.8817
ICICI Prudential Liquid Fund - Dividend - Others
Record Date Face Value (Rs) NAV (Rs) Dividend (Rs.)/Unit
24-Sep-14 100.0000 106.0582 6.0543
ICICI Prudential Liquid Fund - Direct Plan - Annual Dividend
Record Date Face Value (Rs) NAV (Rs) Dividend (Rs.)/Unit
23-Sep-16 100.0000 108.1403 8.134121-Sep-17 100.0000 106.7527 6.746521-Sep-18 100.0000 107.1496 7.1434
ICICI Prudential Liquid Fund - Annual Dividend
Record Date Face Value (Rs) NAV (Rs) Dividend (Rs.)/Unit
23-Sep-16 100.0000 108.0837 8.077521-Sep-17 100.0000 106.7079 6.701721-Sep-18 100.0000 107.0747 7.0685
ICICI Prudential Liquid Fund - Weekly Dividend
Record Date Face Value (Rs) NAV (Rs) Dividend (Rs.)/Unit
12-Aug-19 100.0000 100.2888 0.130819-Aug-19 100.0000 100.2612 0.103226-Aug-19 100.0000 100.2707 0.1127
ICICI Prudential Liquid Fund - Direct Plan - Weekly Dividend
Record Date Face Value (Rs) NAV (Rs) Dividend (Rs.)/Unit
12-Aug-19 100.0000 100.3153 0.132219-Aug-19 100.0000 100.2877 0.104626-Aug-19 100.0000 100.2972 0.1141
ICICI Prudential Liquid Fund - Monthly Dividend
Record Date Face Value (Rs) NAV (Rs) Dividend (Rs.)/Unit
27-Jun-19 100.0000 100.6261 0.559930-Jul-19 100.0000 100.6684 0.602229-Aug-19 100.0000 100.5664 0.5002
ICICI Prudential Money Market Fund - Monthly Dividend -
Record Date Face Value (Rs) NAV (Rs) Dividend (Rs.)/Unit
27-Jun-19 100.0000 100.8012 0.573530-Jul-19 100.0000 101.0955 0.793129-Aug-19 100.0000 101.0046 0.6581
ICICI Prudential Money Market Fund - Direct Plan - Monthly Dividend
Record Date Face Value (Rs) NAV (Rs) Dividend (Rs.)/Unit
27-Jun-19 100.0000 100.9589 0.584030-Jul-19 100.0000 101.2549 0.880029-Aug-19 100.0000 101.0876 0.6726
Record Date Face Value (Rs) NAV (Rs) Dividend (Rs.)/Unit
ICICI Prudential Money Market Fund - Fortnightly Dividend
30-Jul-19 100.0000 100.6318 0.330816-Aug-19 100.0000 100.7253 0.369629-Aug-19 100.0000 100.6324 0.2767
Record Date Face Value (Rs) NAV (Rs) Dividend (Rs.)/Unit
ICICI Prudential Money Market Fund - Direct Plan - Fortnightly Dividend
30-Jul-19 100.0000 100.9477 0.356016-Aug-19 100.0000 101.0229 0.431229-Aug-19 100.0000 100.8734 0.2817
Record Date Face Value (Rs) NAV (Rs) Dividend (Rs.)/Unit
ICICI Prudential Money Market Fund - Weekly Dividend
13-Aug-19 100.0000 100.8402 0.172419-Aug-19 100.0000 100.7690 0.101226-Aug-19 100.0000 100.8089 0.1411
ICICI Prudential Money Market Fund - Direct Plan- Weekly Dividend
Record Date Face Value (Rs) NAV (Rs) Dividend (Rs.)/Unit
13-Aug-19 100.0000 100.9689 0.206719-Aug-19 100.0000 100.8655 0.103326-Aug-19 100.0000 100.9057 0.1435
Record Date Face Value (Rs) NAV (Rs) Dividend (Rs.)/Unit
ICICI Prudential Money Market Fund - Dividend
28-Aug-19 100.0000 100.3443 0.015729-Aug-19 100.0000 100.3446 0.018030-Aug-19 100.0000 100.3468 0.0211
ICICI Prudential Savings Fund - Fortnightly DividendRecord Date Face Value (Rs) NAV (Rs) Dividend (Rs.)/Unit
30-Jul-19 100.0000 101.3097 0.313316-Aug-19 100.0000 101.3589 0.362529-Aug-19 100.0000 101.3623 0.3659
ICICI Prudential Savings Fund - Direct Plan - Weekly Dividend
Record Date Face Value (Rs) NAV (Rs) Dividend (Rs.)/Unit
13-Aug-19 100.0000 105.6867 0.207419-Aug-19 100.0000 105.5639 0.084626-Aug-19 100.0000 105.7087 0.2294
ICICI Prudential Savings Fund - Weekly DividendRecord Date Face Value (Rs) NAV (Rs) Dividend (Rs.)/Unit
13-Aug-19 100.0000 105.6380 0.205219-Aug-19 100.0000 105.5158 0.083026-Aug-19 100.0000 105.6603 0.2275
ICICI Prudential Savings Fund - Direct Plan - Fortnightly DividendRecord Date Face Value (Rs) NAV (Rs) Dividend (Rs.)/Unit
30-Jul-19 100.0000 101.7786 0.318516-Aug-19 100.0000 101.8285 0.368429-Aug-19 100.0000 101.8310 0.3709
ICICI Prudential Savings Fund - Monthly Dividend
Record Date Face Value (Rs) NAV (Rs) Dividend (Rs.)/Unit
27-Jun-19 100.0000 101.8409 0.535830-Jul-19 100.0000 102.3481 1.043029-Aug-19 100.0000 102.0373 0.7322
ICICI Prudential Savings Fund - Direct Plan - Monthly Dividend
Record Date Face Value (Rs) NAV (Rs) Dividend (Rs.)/Unit
27-Jun-19 100.0000 101.6298 0.541630-Jul-19 100.0000 102.1373 1.049129-Aug-19 100.0000 101.8263 0.7381
ICICI Prudential Savings Fund - Quarterly Dividend
Record Date Face Value (Rs) NAV (Rs) Dividend (Rs.)/Unit
28-Dec-18 100.0000 105.9902 2.113128-Mar-19 100.0000 106.0980 1.999527-Jun-19 100.0000 106.2396 2.1082
136

ICICI Prudential Corporate Bond Fund - Weekly Dividend
Record Date Face Value (Rs) NAV (Rs) Dividend (Rs.)/Unit
13-Aug-19 10.0000 10.3250 0.020719-Aug-19 10.0000 10.3070 0.002726-Aug-19 10.0000 10.3431 0.0388
ICICI Prudential Corporate Bond Fund - Direct Plan - Weekly Dividend
Record Date Face Value (Rs) NAV (Rs) Dividend (Rs.)/Unit
13-Aug-19 10.0000 10.2407 0.021219-Aug-19 10.0000 10.2227 0.003226-Aug-19 10.0000 10.2587 0.0392
ICICI Prudential Corporate Bond Fund - Fortnightly Dividend
Record Date Face Value (Rs) NAV (Rs) Dividend (Rs.)/Unit
30-Jul-19 10.0000 10.2548 0.030516-Aug-19 10.0000 10.2621 0.037829-Aug-19 10.0000 10.2704 0.0461
ICICI Prudential Corporate Bond Fund - Direct Plan - Fortnightly Dividend
Record Date Face Value (Rs) NAV (Rs) Dividend (Rs.)/Unit
30-Jul-19 10.0000 12.0980 0.037516-Aug-19 10.0000 12.1068 0.046329-Aug-19 10.0000 12.1162 0.0552
ICICI Prudential Corporate Bond Fund - Monthly Dividend
Record Date Face Value (Rs) NAV (Rs) Dividend (Rs.)/Unit
27-Jun-19 10.0000 10.3365 0.055530-Jul-19 10.0000 10.4175 0.136529-Aug-19 10.0000 10.3656 0.0846
ICICI Prudential Corporate Bond Fund - Direct Plan - Monthly Dividend
Record Date Face Value (Rs) NAV (Rs) Dividend (Rs.)/Unit
27-Jun-19 10.0000 10.2788 0.057830-Jul-19 10.0000 10.3590 0.138029-Aug-19 10.0000 10.3077 0.0867
ICICI Prudential Savings Fund - Dividend - Others
Record Date Face Value (Rs) NAV (Rs) Dividend (Rs.)/Unit24-Sep-14 100.0000 103.4526 3.0836
ICICI Prudential Savings Fund - Direct Plan - Dividend - Others
Record Date Face Value (Rs) NAV (Rs) Dividend (Rs.)/Unit
24-Sep-14 100.0000 107.5628 6.9119
ICICI Prudential Savings Fund - Direct Plan - Quarterly Dividend
Record Date Face Value (Rs) NAV (Rs) Dividend (Rs.)/Unit
28-Dec-18 100.0000 106.1584 2.152228-Mar-19 100.0000 106.2692 2.037727-Jun-19 100.0000 106.4098 2.1435
Dividend History
6979137
ICICI Prudential Floating Interest Fund - Fortnightly Dividend
Record Date Face Value (Rs) NAV (Rs) Dividend (Rs.)/Unit
30-Jul-19 100.0000 101.5289 0.269816-Aug-19 100.0000 101.5663 0.307229-Aug-19 100.0000 101.6329 0.3738
ICICI Prudential Floating Interest Fund - Direct Plan - Fortnightly Dividend
Record Date Face Value (Rs) NAV (Rs) Dividend (Rs.)/Unit
30-Jul-19 100.0000 101.5606 0.301116-Aug-19 100.0000 101.6020 0.342529-Aug-19 100.0000 101.6602 0.4007
ICICI Prudential Floating Interest Fund - Weekly Dividend
Record Date Face Value (Rs) NAV (Rs) Dividend (Rs.)/Unit
13-Aug-19 100.0000 101.5144 0.176919-Aug-19 100.0000 101.4053 0.067826-Aug-19 100.0000 101.5679 0.2304
ICICI Prudential Floating Interest Fund - Direct Plan - Weekly Dividend
Record Date Face Value (Rs) NAV (Rs) Dividend (Rs.)/Unit
13-Aug-19 100.0000 101.4388 0.193419-Aug-19 100.0000 101.3256 0.080226-Aug-19 100.0000 101.4900 0.2446
ICICI Prudential Floating Interest Fund - Monthly Dividend
Record Date Face Value (Rs) NAV (Rs) Dividend (Rs.)/Unit
27-Jun-19 100.0000 102.9038 0.463830-Jul-19 100.0000 103.4161 0.976129-Aug-19 100.0000 103.1302 0.6902
ICICI Prudential Floating Interest Fund - Quarterly Dividend
Record Date Face Value (Rs) NAV (Rs) Dividend (Rs.)/Unit
28-Dec-18 100.0000 105.0759 1.854428-Mar-19 100.0000 105.2480 1.847227-Jun-19 100.0000 105.3168 1.8847
ICICI Prudential Floating Interest Fund - Direct Plan - Monthly Dividend
Record Date Face Value (Rs) NAV (Rs) Dividend (Rs.)/Unit
27-Jun-19 100.0000 101.8526 0.517230-Jul-19 100.0000 102.3702 1.034829-Aug-19 100.0000 102.0807 0.7453
ICICI Prudential Floating Interest Fund - Direct Plan - Quarterly Dividend
Record Date Face Value (Rs) NAV (Rs) Dividend (Rs.)/Unit
28-Dec-18 100.0000 106.2847 2.055328-Mar-19 100.0000 106.4931 2.061327-Jun-19 100.0000 106.5779 2.0992
ICICI Prudential Floating Interest Fund - Dividend - Others
Record Date Face Value (Rs) NAV (Rs) Dividend (Rs.)/Unit
29-Sep-14 100.0000 117.9792 17.6159
ICICI Prudential Corporate Bond Fund - Half Yearly Dividend Option
Record Date Face Value (Rs) NAV (Rs) Dividend (Rs.)/Unit
16-Aug-18 10.0000 12.4707 0.000518-Feb-19 10.0000 12.9342 0.459219-Aug-19 10.0000 13.1592 0.6783
ICICI Prudential Corporate Bond Fund - Quarterly Dividend
Record Date Face Value (Rs) NAV (Rs) Dividend (Rs.)/Unit
24-Dec-18 10.0000 10.9014 0.228022-Mar-19 10.0000 10.9345 0.229624-Jun-19 10.0000 10.9675 0.2415
ICICI Prudential Corporate Bond Fund - Direct Plan - Half Yearly Dividend Option
Record Date Face Value (Rs) NAV (Rs) Dividend (Rs.)/Unit
16-Aug-18 10.0000 12.6841 0.000518-Feb-19 10.0000 13.1759 0.486619-Aug-19 10.0000 13.4060 0.7096
ICICI Prudential Medium Term Bond Fund - Half Yearly Dividend
Record Date Face Value (Rs) NAV (Rs) Dividend (Rs.)/Unit
20-Mar-18 10.0000 10.7044 0.133921-Sep-18 10.0000 10.7737 0.192922-Mar-19 10.0000 10.9504 0.3467
ICICI Prudential Medium Term Bond Fund - Direct Plan - Half Yearly Dividend
Record Date Face Value (Rs) NAV (Rs) Dividend (Rs.)/Unit
20-Mar-18 10.0000 11.1753 0.184521-Sep-18 10.0000 11.2466 0.243722-Mar-19 10.0000 11.4313 0.4026
ICICI Prudential Medium Term Bond Fund - Quarterly Dividend
Record Date Face Value (Rs) NAV (Rs) Dividend (Rs.)/Unit
29-Jan-19 10.0000 10.7420 0.197730-Apr-19 10.0000 10.6937 0.160129-Jul-19 10.0000 10.8194 0.2804
ICICI Prudential Medium Term Bond Fund - Monthly Dividend Option
Record Date Face Value (Rs) NAV (Rs) Dividend (Rs.)/Unit
25-Jan-12 10.0000 10.3582 0.060815-Feb-12 10.0000 10.3402 0.0428
ICICI Prudential Medium Term Bond Fund - Direct Plan - Quarterly Dividend
Record Date Face Value (Rs) NAV (Rs) Dividend (Rs.)/Unit
29-Jan-19 10.0000 11.2979 0.230130-Apr-19 10.0000 11.2480 0.187629-Jul-19 10.0000 11.3795 0.3119
ICICI Prudential Corporate Bond Fund - Direct Plan - Quarterly Dividend
Record Date Face Value (Rs) NAV (Rs) Dividend (Rs.)/Unit
24-Dec-19 10.0000 13.3201 0.000522-Mar-19 10.0000 13.6552 0.000524-Jun-19 10.0000 14.0009 0.0005
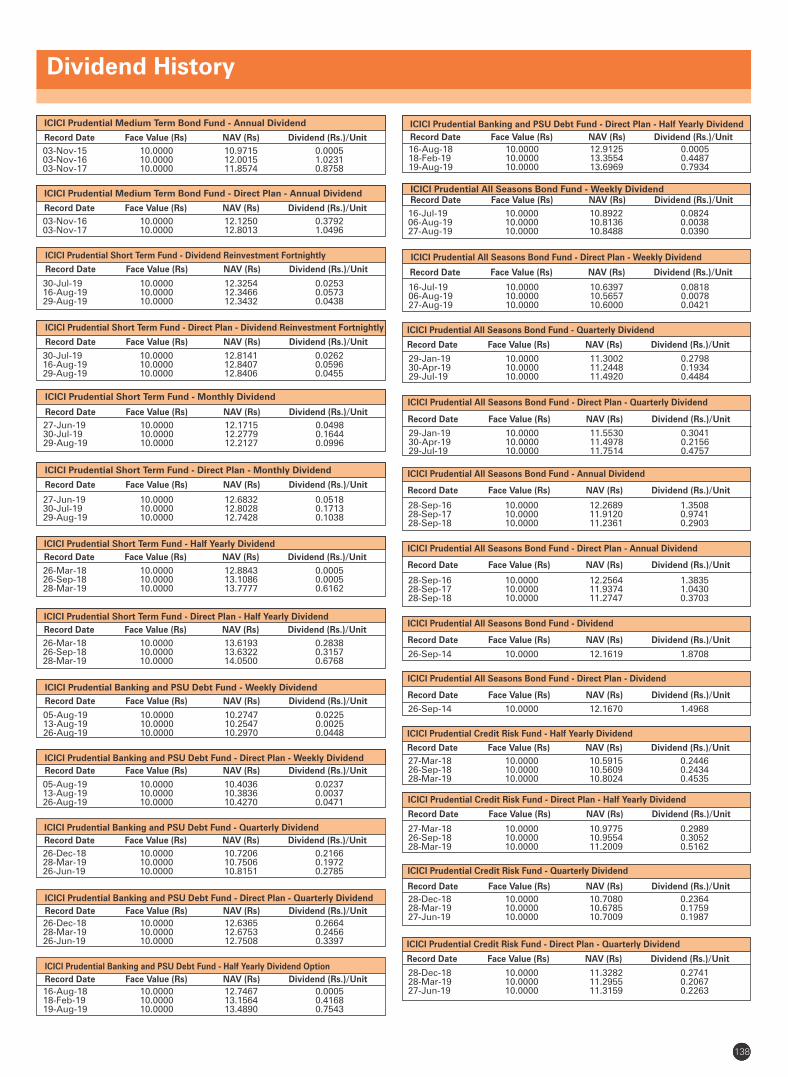
Dividend History
6979138
ICICI Prudential Short Term Fund - Monthly Dividend
Record Date Face Value (Rs) NAV (Rs) Dividend (Rs.)/Unit
27-Jun-19 10.0000 12.1715 0.049830-Jul-19 10.0000 12.2779 0.164429-Aug-19 10.0000 12.2127 0.0996
ICICI Prudential Short Term Fund - Direct Plan - Monthly Dividend
Record Date Face Value (Rs) NAV (Rs) Dividend (Rs.)/Unit
27-Jun-19 10.0000 12.6832 0.051830-Jul-19 10.0000 12.8028 0.171329-Aug-19 10.0000 12.7428 0.1038
ICICI Prudential Short Term Fund - Half Yearly Dividend
Record Date Face Value (Rs) NAV (Rs) Dividend (Rs.)/Unit
26-Mar-18 10.0000 12.8843 0.000526-Sep-18 10.0000 13.1086 0.000528-Mar-19 10.0000 13.7777 0.6162
ICICI Prudential Short Term Fund - Direct Plan - Dividend Reinvestment Fortnightly
Record Date Face Value (Rs) NAV (Rs) Dividend (Rs.)/Unit
30-Jul-19 10.0000 12.8141 0.026216-Aug-19 10.0000 12.8407 0.059629-Aug-19 10.0000 12.8406 0.0455
ICICI Prudential Short Term Fund - Dividend Reinvestment Fortnightly
Record Date Face Value (Rs) NAV (Rs) Dividend (Rs.)/Unit
30-Jul-19 10.0000 12.3254 0.025316-Aug-19 10.0000 12.3466 0.057329-Aug-19 10.0000 12.3432 0.0438
ICICI Prudential Medium Term Bond Fund - Annual Dividend
Record Date Face Value (Rs) NAV (Rs) Dividend (Rs.)/Unit
03-Nov-15 10.0000 10.9715 0.000503-Nov-16 10.0000 12.0015 1.023103-Nov-17 10.0000 11.8574 0.8758
ICICI Prudential Medium Term Bond Fund - Direct Plan - Annual Dividend
Record Date Face Value (Rs) NAV (Rs) Dividend (Rs.)/Unit
03-Nov-16 10.0000 12.1250 0.379203-Nov-17 10.0000 12.8013 1.0496
ICICI Prudential Banking and PSU Debt Fund - Direct Plan - Quarterly Dividend
Record Date Face Value (Rs) NAV (Rs) Dividend (Rs.)/Unit
26-Dec-18 10.0000 12.6365 0.266428-Mar-19 10.0000 12.6753 0.245626-Jun-19 10.0000 12.7508 0.3397
ICICI Prudential Banking and PSU Debt Fund - Half Yearly Dividend Option
Record Date Face Value (Rs) NAV (Rs) Dividend (Rs.)/Unit
16-Aug-18 10.0000 12.7467 0.000518-Feb-19 10.0000 13.1564 0.416819-Aug-19 10.0000 13.4890 0.7543
ICICI Prudential Short Term Fund - Direct Plan - Half Yearly Dividend
Record Date Face Value (Rs) NAV (Rs) Dividend (Rs.)/Unit
26-Mar-18 10.0000 13.6193 0.283826-Sep-18 10.0000 13.6322 0.315728-Mar-19 10.0000 14.0500 0.6768
ICICI Prudential Banking and PSU Debt Fund - Weekly Dividend
Record Date Face Value (Rs) NAV (Rs) Dividend (Rs.)/Unit
05-Aug-19 10.0000 10.2747 0.022513-Aug-19 10.0000 10.2547 0.002526-Aug-19 10.0000 10.2970 0.0448
ICICI Prudential Banking and PSU Debt Fund - Direct Plan - Weekly Dividend
Record Date Face Value (Rs) NAV (Rs) Dividend (Rs.)/Unit
05-Aug-19 10.0000 10.4036 0.023713-Aug-19 10.0000 10.3836 0.003726-Aug-19 10.0000 10.4270 0.0471
ICICI Prudential Banking and PSU Debt Fund - Quarterly Dividend
Record Date Face Value (Rs) NAV (Rs) Dividend (Rs.)/Unit
26-Dec-18 10.0000 10.7206 0.216628-Mar-19 10.0000 10.7506 0.197226-Jun-19 10.0000 10.8151 0.2785
ICICI Prudential Banking and PSU Debt Fund - Direct Plan - Half Yearly Dividend
Record Date Face Value (Rs) NAV (Rs) Dividend (Rs.)/Unit
16-Aug-18 10.0000 12.9125 0.000518-Feb-19 10.0000 13.3554 0.448719-Aug-19 10.0000 13.6969 0.7934
ICICI Prudential All Seasons Bond Fund - Weekly DividendRecord Date Face Value (Rs) NAV (Rs) Dividend (Rs.)/Unit
16-Jul-19 10.0000 10.8922 0.082406-Aug-19 10.0000 10.8136 0.003827-Aug-19 10.0000 10.8488 0.0390
ICICI Prudential All Seasons Bond Fund - Direct Plan - Weekly Dividend
Record Date Face Value (Rs) NAV (Rs) Dividend (Rs.)/Unit
16-Jul-19 10.0000 10.6397 0.081806-Aug-19 10.0000 10.5657 0.007827-Aug-19 10.0000 10.6000 0.0421
ICICI Prudential All Seasons Bond Fund - Quarterly Dividend
Record Date Face Value (Rs) NAV (Rs) Dividend (Rs.)/Unit
29-Jan-19 10.0000 11.3002 0.279830-Apr-19 10.0000 11.2448 0.193429-Jul-19 10.0000 11.4920 0.4484
ICICI Prudential All Season - Direct Plan - Annual Dividends Bond Fund
Record Date Face Value (Rs) NAV (Rs) Dividend (Rs.)/Unit
28-Sep-16 10.0000 12.2564 1.383528-Sep-17 10.0000 11.9374 1.043028-Sep-18 10.0000 11.2747 0.3703
ICICI Prudential All Season - Annual Dividends Bond Fund
Record Date Face Value (Rs) NAV (Rs) Dividend (Rs.)/Unit
28-Sep-16 10.0000 12.2689 1.350828-Sep-17 10.0000 11.9120 0.974128-Sep-18 10.0000 11.2361 0.2903
ICICI Prudential All Seasons Bond Fund - Direct Plan - Quarterly Dividend
Record Date Face Value (Rs) NAV (Rs) Dividend (Rs.)/Unit
29-Jan-19 10.0000 11.5530 0.304130-Apr-19 10.0000 11.4978 0.215629-Jul-19 10.0000 11.7514 0.4757
ICICI Prudential All Season - Dividends Bond Fund
Record Date Face Value (Rs) NAV (Rs) Dividend (Rs.)/Unit
26-Sep-14 10.0000 12.1619 1.8708
ICICI Prudential All Season - Direct Plan - Dividends Bond Fund
Record Date Face Value (Rs) NAV (Rs) Dividend (Rs.)/Unit
26-Sep-14 10.0000 12.1670 1.4968
Record Date Face Value (Rs) NAV (Rs) Dividend (Rs.)/Unit
ICICI Prudential Credit Risk Fund - Half Yearly Dividend
27-Mar-18 10.0000 10.5915 0.244626-Sep-18 10.0000 10.5609 0.243428-Mar-19 10.0000 10.8024 0.4535
Record Date Face Value (Rs) NAV (Rs) Dividend (Rs.)/Unit
ICICI Prudential Credit Risk Fund - Direct Plan - Half Yearly Dividend
27-Mar-18 10.0000 10.9775 0.298926-Sep-18 10.0000 10.9554 0.305228-Mar-19 10.0000 11.2009 0.5162
Record Date Face Value (Rs) NAV (Rs) Dividend (Rs.)/Unit
ICICI Prudential Credit Risk Fund - Quarterly Dividend
28-Dec-18 10.0000 10.7080 0.236428-Mar-19 10.0000 10.6785 0.175927-Jun-19 10.0000 10.7009 0.1987
Record Date Face Value (Rs) NAV (Rs) Dividend (Rs.)/Unit
ICICI Prudential Credit Risk Fund - Direct Plan - Quarterly Dividend
28-Dec-18 10.0000 11.3282 0.274128-Mar-19 10.0000 11.2955 0.206727-Jun-19 10.0000 11.3159 0.2263

Dividend History
6979139
Record Date Face Value (Rs) NAV (Rs) Dividend (Rs.)/Unit
ICICI Prudential Bond Fund - Monthly Dividend
27-Jun-19 10.0000 11.4791 0.093730-Jul-19 10.0000 11.5804 0.205929-Aug-19 10.0000 11.4825 0.0935
ICICI Prudential Bond Fund - Direct Plan - Monthly Dividend
Record Date Face Value (Rs) NAV (Rs) Dividend (Rs.)/Unit
27-Jun-19 10.0000 11.6237 0.094930-Jul-19 10.0000 11.7320 0.208529-Aug-19 10.0000 11.6380 0.0947
ICICI Prudential Credit Risk Fund - Direct Plan - Annual Dividend
Record Date Face Value (Rs) NAV (Rs) Dividend (Rs.)/Unit
23-Mar-17 10.0000 11.4312 1.130620-Mar-18 10.0000 11.0926 0.763820-Mar-19 10.0000 11.1500 0.7903
ICICI Prudential Credit Risk Fund - Annual Dividend
Record Date Face Value (Rs) NAV (Rs) Dividend (Rs.)/Unit
23-Mar-17 10.0000 11.0912 1.008120-Mar-18 10.0000 10.7621 0.653720-Mar-19 10.0000 10.8078 0.6712
ICICI Prudential Long Term Bond Fund - Direct Plan - Half Yearly Dividend
Record Date Face Value (Rs) NAV (Rs) Dividend (Rs.)/Unit
27-Sep-17 10.0000 12.2149 0.640028-Sep-18 10.0000 11.6523 0.011528-Mar-19 10.0000 12.6016 0.8358
ICICI Prudential Bond Fund - Direct Plan - Half Yearly Dividend
Record Date Face Value (Rs) NAV (Rs) Dividend (Rs.)/Unit
26-Mar-18 10.0000 10.5887 0.064326-Sep-18 10.0000 10.6234 0.125728-Mar-19 10.0000 11.1771 0.6137
ICICI Prudential Long Term Bond Fund - Half Yearly Dividend
Record Date Face Value (Rs) NAV (Rs) Dividend (Rs.)/Unit
31-Mar-17 10.0000 11.2123 0.243227-Sep-17 10.0000 11.4753 0.552028-Mar-19 10.0000 11.7912 0.7523
ICICI Prudential Long Term Bond Fund - Direct Plan - Quarterly Dividend
Record Date Face Value (Rs) NAV (Rs) Dividend (Rs.)/Unit
31-Dec-18 10.0000 12.8808 0.799828-Mar-19 10.0000 12.3459 0.142527-Jun-19 10.0000 12.8207 0.7094
ICICI Prudential Long Term Bond Fund - Quarterly Dividend Option
Record Date Face Value (Rs) NAV (Rs) Dividend (Rs.)/Unit
31-Dec-18 10.0000 12.4492 0.678828-Mar-19 10.0000 12.0130 0.125027-Jun-19 10.0000 12.4723 0.6752
Record Date Face Value (Rs) NAV (Rs) Dividend (Rs.)/Unit
ICICI Prudential Bond Fund - Quarterly Dividend
15-Feb-19 10.0000 11.1559 0.254616-May-19 10.0000 11.1290 0.198716-Aug-19 10.0000 11.3912 0.4903
Record Date Face Value (Rs) NAV (Rs) Dividend (Rs.)/Unit
ICICI Prudential Bond Fund - Direct Plan - Quarterly Dividend
15-Feb-19 10.0000 11.5082 0.277916-May-19 10.0000 11.4816 0.220116-Aug-19 10.0000 11.7524 0.5199
ICICI Prudential Bond Fund - Half Yearly Dividend
Record Date Face Value (Rs) NAV (Rs) Dividend (Rs.)/Unit
26-Mar-18 10.0000 10.9021 0.035526-Sep-18 10.0000 10.9360 0.098128-Mar-19 10.0000 11.5051 0.6011
ICICI Prudential Long Term Bond Fund - Annual Dividend
Record Date Face Value (Rs) NAV (Rs) Dividend (Rs.)/Unit
09-Oct-15 10.0000 10.4033 0.033410-Oct-16 10.0000 11.6463 1.156710-Oct-17 10.0000 11.2025 0.7724
ICICI Prudential Constant Maturity Gilt Fund - Monthly Dividend
Record Date Face Value (Rs) NAV (Rs) Dividend (Rs.)/Unit
12-Jun-19 10.0000 11.6037 0.342512-Jul-19 10.0000 11.7434 0.482213-Aug-19 10.0000 11.3063 0.0451
ICICI Prudential Constant Maturity Gilt Fund - Direct Plan - Monthly Dividend
Record Date Face Value (Rs) NAV (Rs) Dividend (Rs.)/Unit
12-Jun-19 10.0000 11.7987 0.350412-Jul-19 10.0000 11.9408 0.492513-Aug-19 10.0000 11.4965 0.0482
ICICI Prudential Long Term Bond Fund - Direct Plan - Annual Dividend Record Date Face Value (Rs) NAV (Rs) Dividend (Rs.)/Unit
10-Oct-16 10.0000 12.9589 1.468310-Oct-17 10.0000 12.3870 0.960910-Oct-18 10.0000 11.5404 0.0633
ICICI Prudential Constant Maturity Gilt Fund - Quarterly Dividend
Record Date Face Value (Rs) NAV (Rs) Dividend (Rs.)/Unit
12-Dec-18 10.0000 11.5686 0.697112-Mar-19 10.0000 11.0360 0.127712-Jun-19 10.0000 11.4402 0.5067
ICICI Prudential Constant Maturity Gilt Fund - Direct Plan - Half Yearly Dividend
Record Date Face Value (Rs) NAV (Rs) Dividend (Rs.)/Unit
12-Sep-17 10.0000 11.5411 0.770212-Sep-18 10.0000 10.7863 0.037612-Mar-19 10.0000 11.6634 0.8753
ICICI Prudential Constant Maturity Gilt Fund - Half Yearly Dividend
Record Date Face Value (Rs) NAV (Rs) Dividend (Rs.)/Unit
12-Sep-17 10.0000 11.2432 0.741312-Sep-18 10.0000 10.4946 0.014812-Mar-19 10.0000 11.3588 0.8411
ICICI Prudential Constant Maturity Gilt Fund - Direct Plan - Quarterly Dividend
Record Date Face Value (Rs) NAV (Rs) Dividend (Rs.)/Unit
12-Dec-18 10.0000 11.8246 0.718212-Mar-19 10.0000 11.2808 0.136312-Jun-19 10.0000 11.6946 0.5237
ICICI Prudential Constant Maturity Gilt Fund - Annual Dividend
Record Date Face Value (Rs) NAV (Rs) Dividend (Rs.)/Unit
12-Sep-16 10.0000 11.5387 0.977312-Sep-17 10.0000 11.4866 0.931812-Sep-18 10.0000 10.5473 0.0147
ICICI Prudential Constant Maturity Gilt Fund - Direct Plan - Annual Dividend
Record Date Face Value (Rs) NAV (Rs) Dividend (Rs.)/Unit
12-Sep-16 10.0000 11.6382 0.891012-Sep-17 10.0000 11.7070 0.965912-Sep-18 10.0000 10.7562 0.0373
ICICI Prudential Gilt Fund - Dividend
Record Date Face Value (Rs) NAV (Rs) Dividend (Rs.)/Unit
28-Nov-16 10.0000 14.0596 1.704829-Nov-17 10.0000 12.4157 0.075217-May-18 10.0000 12.3453 0.1173
ICICI Prudential Gilt Fund - Direct Plan - Dividend
Record Date Face Value (Rs) NAV (Rs) Dividend (Rs.)/Unit
28-Nov-16 10.0000 14.3442 1.775429-Nov-17 10.0000 12.7055 0.149817-May-18 10.0000 12.5916 0.1495
ICICI Prudential Overnight Fund - Quarterly Dividend
Record Date Face Value (Rs) NAV (Rs) Dividend (Rs.)/Unit
13-May-19 100.0000 100.9833 0.983113-Aug-19 100.0000 101.4094 1.4092
ICICI Prudential Overnight Fund - Monthly Dividend
Record Date Face Value (Rs) NAV (Rs) Dividend (Rs.)/Unit
27-Jun-19 100.0000 100.4418 0.441629-Jul-19 100.0000 100.4857 0.485529-Aug-19 100.0000 100.4412 0.4410

Dividend History
140
ICICI Prudential Overnight Fund - Direct Plan - Monthly Dividend
Record Date Face Value (Rs) NAV (Rs) Dividend (Rs.)/Unit
27-Jun-19 100.0000 100.4497 0.449529-Jul-19 100.0000 100.4944 0.494229-Aug-19 100.0000 100.4496 0.4494
ICICI Prudential Overnight Fund - Direct Plan - Fortnightly Dividend
Record Date Face Value (Rs) NAV (Rs) Dividend (Rs.)/Unit
30-Jul-19 100.0000 100.2294 0.229213-Aug-19 100.0000 100.2075 0.207329-Aug-19 100.0000 100.2267 0.2265
Dividend is gross dividend. To arrive at the net dividend payable for corporate and non-corporate investors applicable dividend distribution tax, if any, needs to be adjusted respectively. Past performance may or may not be sustained in future. After payment of dividend the NAV has fallen to the extent of payout and distribution taxes if applicable. For complete dividend history details please refer to our website www.icicipruamc.com, Download section-NAV and Dividend history section.
ICICI Prudential Overnight Fund - Direct Plan - Weekly Dividend
Record Date Face Value (Rs) NAV (Rs) Dividend (Rs.)/Unit
12-Aug-19 100.0000 100.1028 0.102619-Aug-19 100.0000 100.1006 0.100426-Aug-19 100.0000 100.0980 0.0978
ICICI Prudential Overnight Fund - Weekly Dividend
Record Date Face Value (Rs) NAV (Rs) Dividend (Rs.)/Unit
12-Aug-19 100.0000 100.1010 0.100819-Aug-19 100.0000 100.0986 0.098426-Aug-19 100.0000 100.0964 0.0962
Distribution of dividend is subject to availability of distributable surplus and approval of Trustees.

ICICI Prudential Growth Fund - Series 3
The investment objective of the Scheme is to provide capital appreciation by investing in a well diversified portfolio of equity and equity related securities.However, there can be no assurance that the investment objective of the Scheme will be realized.
Investment Objective of all the schemes
ICICI Prudential Bluechip Fund
To generate long term capital appreciation and income distribution to investors from a portfolio that is predominantly invested in equity and equity related securities of large cap companies. However, there can be no assurance or guarantee that the investment objective of the Scheme would be achieved.
ICICI Prudential Focused Equity Fund
To generate capital appreciation by investing in a concentrated portfolio of equity and equity related securities of up to 30 companies across market capitalization i.e. focus on multicap.However, there can be no assurance or guarantee that the investment objective of the Scheme would be achieved.
ICICI Prudential Large & Mid Cap Fund
To generate long-term capital appreciation from a portfolio that is invested predominantly in equity and equity related securities of large-cap and mid-cap companies.However, there can be no assurance or guarantee that the investment objective of the Scheme would be achieved.
ICICI Prudential Multicap Fund
To generate capital appreciation through investments in equity & equity related instrument across large cap, mid cap and small cap stocks of various industries.However, there can be no assurance or guarantee that the investment objective of the Scheme would be achieved
ICICI Prudential Dividend Yield Equity Fund
The investment objective of ICICI Prudential Dividend Yield Equity Fund is to provide medium to long term capital gains and/or dividend distribution by predominantly investing in a well diversified portfolio of equity and equity related instruments of dividend yielding companies. However, there can be no assurance or guarantee that the investment objective of the Scheme would be achieved.
ICICI Prudential Value Discovery Fund
To generate returns through a combination of dividend income and capital appreciation by investing primarily in a well-diversified portfolio of value stocks.However, there can be no assurance or guarantee that the investment objective of the Scheme would be achieved.
ICICI Prudential Midcap Fund
The primary objective of the Scheme is to seek to generate capital appreciation by actively investing in diversified mid cap stocks. However, there can be no assurance or guarantee that the investment objective of the Scheme would be achieved.
ICICI Prudential Infrastructure Fund
To generate capital appreciation and income distribution to unit holders by investing predominantly in equity/equity related securities of the companies belonging to the infrastructure theme.However, there can be no assurance or guarantee that theinvestment objective of the Scheme would be achieved
ICICI Prudential Technology Fund
To generate long-term capital appreciation by creating a portfolio that is invested in equity and equity related securities of technology and technology dependent companies. However there can be no assurance or garuntee that the investment objective of the Scheme would be achieved.
ICICI Prudential FMCG Fund
To generate long term capital appreciation through investments made primarily in equity & equity related securities forming part of FMCG sector. However, there is no assurance or guarantee that the investment objective of the Scheme would be achieved.
Equity Funds
141
ICICI Prudential Long Term Equity Fund (Tax Saving)
To generate long-term capital appreciation through investments made primarily in equity and equity related securities of companies. However, there is no assurance or guarantee that the investment objective of the Scheme would be achieved.
ICICI Prudential US Bluechip Equity Fund
The investment objective of ICICI Prudential US Bluechip Equity Fund is to provide long term capital appreciation to investors by primarily investing in equity and equity related securities of companies listed on recognized stock exchanges in the United States of America. The Scheme shall also invest in ADRs/GDRs issued by Indian and foreign companies.However, there can be no assurance or guarantee that the investment objective of the Scheme would be achieved.
ICICI Prudential Exports and Services Fund
To generate capital appreciation and income distribution to unit holders by investing predominantly in equity/equity related securities of the companies belonging to Exports & Services industry. However, there can be no assurance or guarantee that the investment objective of the Scheme would be achieved
ICICI Prudential Smallcap Fund
The primary objective of the Scheme is to seek to generate capital appreciation by predominantly investing in equity and equity related securities of small cap stocks.However, there can be no assurance or guarantee that the investment objective of the Scheme would be achieved.
ICICI Prudential Growth Fund - Series 1
The investment objective of the Scheme is to provide capital appreciation by investing in a well diversified portfolio of equity and equity related securities.However, there can be no assurance that the investment objective of the Scheme will be realized.
ICICI Prudential Growth Fund - Series 2
The investment objective of the Scheme is to provide capital appreciation by investing in a well diversified portfolio of equity and equity related securities.However, there can be no assurance that the investment objective of the Scheme will be realized.
ICICI Prudential Pharma Healthcare and Diagnostics (P.H.D) Fund
To generate long-term capital appreciation by creating a portfolio that is invested in Equity and Equity related securities of pharma, healthcare, hospitals, diagnostics, wellness and allied companies. However there can be no assurance or guarantee that the investment objectives of the scheme would be achieved.
ICICI Prudential Manufacture in India Fund
The investment objective of the scheme is to generate long term capital appreciation by creating a portfolio that is invested predominantly in equity and equity related securities of companies engaged in manufacturing theme. However there can be no assurance or guarantee that the investment objective of the scheme would be achieved.
ICICI Prudential India Opportunities Fund
To generate long-term capital appreciation by investing in opportunities presented by special situations such as corporate restructuring, Government policy and/or regulatory changes, companies going through temporary unique challenges and other similar instances. However there can be no assurance or guarantee that the investment objective of the scheme would be achieved.
ICICI Prudential Value Fund - Series 8
The investment objective of the Scheme is to provide capital appreciation by investing in a well diversified portfolio of stocks through fundamental analysis.However, there can be no assurance that the investment objectives of the Scheme will be realized.
ICICI Prudential Banking & Financial Services Fund
To generate long-term capital appreciation to unit holders from a portfolio that is invested predominantly in equity and equity related securities of companies engaged in banking and financial services. However, there is no assurance or guarantee that the investment objective of the Scheme would be achieved.
ICICI Prudential Bharat Consumption Fund
To generate long-term capital appreciation by investing primarily in Equity and Equity related securities of companies engaged in consumption and consumption related activities or allied sectors. However, there can be no assurance or guarantee that the investment objective of the Scheme would be achieved.

Investment Objective of all the schemes
142
ICICI Prudential Value Fund - Series 9
The investment objective of the Scheme is to provide capital appreciation by investing in a well diversified portfolio of stocks through fundamental analysis.However, there can be no assurance that the investment objective of the Scheme will be realized.
ICICI Prudential Value Fund - Series 10
The investment objective of the Scheme is to provide capital appreciation by investing in a well diversified portfolio of stocks through fundamental analysis.However, there can be no assurance that the investment objectives of the Scheme will be realized.
ICICI Prudential Value Fund - Series 11
The investment objective of the Scheme is to provide capital appreciation by investing in a well diversified portfolio of stocks through fundamental analysis.However, there can be no assurance that the investment objectives of the Scheme will be realized.
ICICI Prudential Value Fund - Series 12
The investment objective of the Scheme is to provide capital appreciation by investing in a well-diversified portfolio of stocks through fundamental analysis.However, there can be no assurance that the investment objective of the Scheme will be realized.
ICICI Prudential Value Fund - Series 13
The investment objective of the Scheme is to provide capital appreciation by investing in a well-diversified portfolio of equity and equity related securities through fundamental analysis.However, there can be no assurance that the investment objective of the Scheme will be realized.
ICICI Prudential Value Fund - Series 14
The investment objective of the Scheme is to provide capital appreciation by investing in a well-diversified portfolio of stocks through fundamental analysis.However, there can be no assurance that the investment objective of the scheme will be realized.
ICICI Prudential Value Fund - Series 15
The investment objective of the Scheme is to provide capital appreciation by investing in a well-diversified portfolio of stocks through fundamental analysis.However, there can be no assurance that the investment objective of the scheme will be realized.
ICICI Prudential Value Fund - Series 16
The investment objective of the Scheme is to provide capital appreciation by investing in a well-diversified portfolio of stocks through fundamental analysis.However, there can be no assurance that the investment objective of the scheme will be realized.
ICICI Prudential Value Fund - Series 17
The investment objective of the Scheme is to provide capital appreciation by investing in a well-diversified portfolio of stocks through fundamental analysis.However, there can be no assurance that the investment objectives of the Scheme will be realized.
ICICI Prudential Value Fund - Series 18
The investment objective of the Scheme is to provide capital appreciation by investing in a well-diversified portfolio of stocks through fundamental analysis. However, there can be no assurance that the investment objective of the scheme will be realized.
ICICI Prudential Value Fund - Series 19
The investment objective of the Scheme is to provide capital appreciation by investing in a well-diversified portfolio of stocks through fundamental analysis.However, there can be no assurance that the investment objectives of the Scheme will be realized.
ICICI Prudential Value Fund - Series 20
The investment objective of the Scheme is to provide capital appreciation by investing in a well-diversified portfolio of stocks through fundamental analysis.However, there can be no assurance that the investment objectives of the Scheme will be realized.
ICICI Prudential Bharat Consumption Fund – Series 1
The investment objective of the Scheme is to provide capital appreciation by investing predominantly in equity and equity related instruments of sectors that could benefit from growth in consumption and related activities. However, there can be no assurance or guarantee that the investment objective of the Scheme would be achieved.
ICICI Prudential Bharat Consumption Fund – Series 2
The investment objective of the Scheme is to provide capital appreciation by investing predominantly in equity and equity related instruments of sectors that could benefit from growth in consumption and related activities. However, there can be no assurance or guarantee that the investment objective of the Scheme would be achieved.
ICICI Prudential Bharat Consumption Fund – Series 3
The investment objective of the Scheme is to provide capital appreciation by investing predominantly in equity and equity related instruments of sectors that could benefit from growth in consumption and related activities. However, there can be no assurance or guarantee that the investment objective of the Scheme would be achieved.
ICICI Prudential Bharat Consumption Fund – Series 4
The investment objective of the Scheme is to provide capital appreciation by investing predominantly in equity and equity related instruments of sectors that could benefit from growth in consumption and related activities. However, there can be no assurance or guarantee that the investment objective of the Scheme would be achieved
ICICI Prudential Bharat Consumption Fund - Series 5
The investment objective of the Scheme is to provide capital appreciation by investing predominantly in equity and equity related instruments of sectors that could benefit from growth in consumption and related activities. However, there can be no assurance or guarantee that the investment objective of the Scheme would be achieved
ICICI Prudential Long Term Wealth Enhancement Fund
The Scheme is a ten year close ended equity linked savings scheme that seeks to generate long-term capital appreciation to unit-holders from a portfolio that is invested predominantly in equity and equity related securities of large capitalization companies and emerging mid cap companies along with income tax benefit. However, there can be no assurance that the investment objectives of the Scheme will be realized.
ICICI Prudential R.I.G.H.T (Rewards of investing & generation of healthy tax savings) Fund
ICICI Prudential R.I.G.H.T. Fund (Rewards of Investing and Generation of Healthy Tax Savings) is a ten year close-ended equity linked savings scheme that seeks to generate long-term capital appreciation to unit-holders from a portfolio that is invested predominantly in equity and equity related securities of large capitalization companies and emerging mid cap companies along with income tax benefit. The investment policies shall be framed in accordance with SEBI (Mutual Funds) Regulations, 1996 and rules and guidelines for Equity Linked savings Scheme (ELSS), 2005 (and modifications to them).However, there can be no assurance that the investment objective of the Scheme will be realized.
ICICI Prudential MNC Fund
The primary objective of the scheme is to generate long term capital appreciation by investing predominantly in equity and equity related securities within MNC space.However, there can be no assurance or guarantee that the investment objective of the Scheme would be achieved.
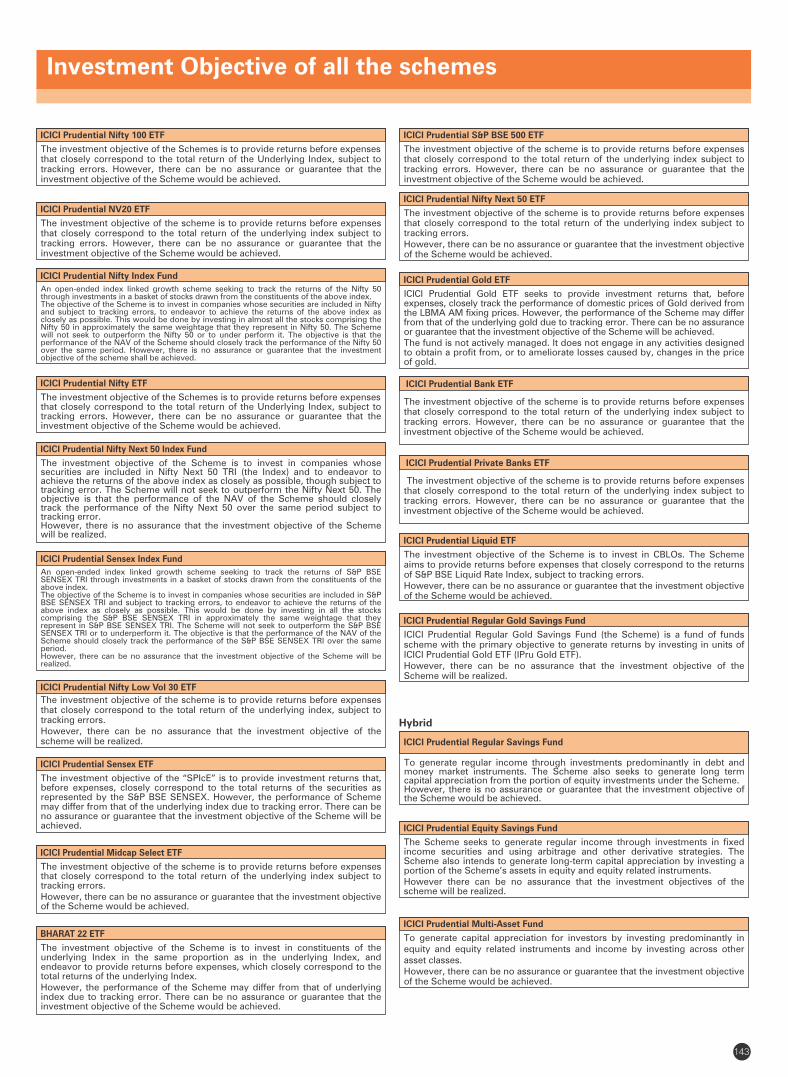
143
Investment Objective of all the schemes
ICICI Prudential Nifty Low Vol 30 ETF
The investment objective of the scheme is to provide returns before expenses that closely correspond to the total return of the underlying index, subject to tracking errors.However, there can be no assurance that the investment objective of the scheme will be realized.
ICICI Prudential Nifty ETF
The investment objective of the Schemes is to provide returns before expenses that closely correspond to the total return of the Underlying Index, subject to tracking errors. However, there can be no assurance or guarantee that the investment objective of the Scheme would be achieved.
ICICI Prudential Nifty Next 50 Index Fund
The investment objective of the Scheme is to invest in companies whose securities are included in Nifty Next 50 TRI (the Index) and to endeavor to achieve the returns of the above index as closely as possible, though subject to tracking error. The Scheme will not seek to outperform the Nifty Next 50. The objective is that the performance of the NAV of the Scheme should closely track the performance of the Nifty Next 50 over the same period subject to tracking error. However, there is no assurance that the investment objective of the Scheme will be realized.
ICICI Prudential Sensex Index Fund
An open-ended index linked growth scheme seeking to track the returns of S&P BSE SENSEX TRI through investments in a basket of stocks drawn from the constituents of the above index.The objective of the Scheme is to invest in companies whose securities are included in S&P BSE SENSEX TRI and subject to tracking errors, to endeavor to achieve the returns of the above index as closely as possible. This would be done by investing in all the stocks comprising the S&P BSE SENSEX TRI in approximately the same weightage that they represent in S&P BSE SENSEX TRI. The Scheme will not seek to outperform the S&P BSE SENSEX TRI or to underperform it. The objective is that the performance of the NAV of the Scheme should closely track the performance of the S&P BSE SENSEX TRI over the same period. However, there can be no assurance that the investment objective of the Scheme will be realized.
ICICI Prudential NV20 ETF
The investment objective of the scheme is to provide returns before expenses that closely correspond to the total return of the underlying index subject to tracking errors. However, there can be no assurance or guarantee that the investment objective of the Scheme would be achieved.
ICICI Prudential Nifty 100 ETF
The investment objective of the Schemes is to provide returns before expenses that closely correspond to the total return of the Underlying Index, subject to tracking errors. However, there can be no assurance or guarantee that the investment objective of the Scheme would be achieved.
ICICI Prudential Nifty Index Fund
An open-ended index linked growth scheme seeking to track the returns of the Nifty 50 through investments in a basket of stocks drawn from the constituents of the above index.The objective of the Scheme is to invest in companies whose securities are included in Nifty and subject to tracking errors, to endeavor to achieve the returns of the above index as closely as possible. This would be done by investing in almost all the stocks comprising the Nifty 50 in approximately the same weightage that they represent in Nifty 50. The Scheme will not seek to outperform the Nifty 50 or to under perform it. The objective is that the performance of the NAV of the Scheme should closely track the performance of the Nifty 50 over the same period. However, there is no assurance or guarantee that the investment objective of the scheme shall be achieved.
ICICI Prudential Sensex ETF
The investment objective of the “SPIcE” is to provide investment returns that, before expenses, closely correspond to the total returns of the securities as represented by the S&P BSE SENSEX. However, the performance of Scheme may differ from that of the underlying index due to tracking error. There can be no assurance or guarantee that the investment objective of the Scheme will be achieved.
ICICI Prudential Midcap Select ETF
The investment objective of the scheme is to provide returns before expenses that closely correspond to the total return of the underlying index subject to tracking errors.However, there can be no assurance or guarantee that the investment objective of the Scheme would be achieved.
ICICI Prudential Gold ETF
ICICI Prudential Gold ETF seeks to provide investment returns that, before expenses, closely track the performance of domestic prices of Gold derived from the LBMA AM fixing prices. However, the performance of the Scheme may differ from that of the underlying gold due to tracking error. There can be no assurance or guarantee that the investment objective of the Scheme will be achieved. The fund is not actively managed. It does not engage in any activities designed to obtain a profit from, or to ameliorate losses caused by, changes in the price of gold.
BHARAT 22 ETF
The investment objective of the Scheme is to invest in constituents of the underlying Index in the same proportion as in the underlying Index, and endeavor to provide returns before expenses, which closely correspond to the total returns of the underlying Index.However, the performance of the Scheme may differ from that of underlying index due to tracking error. There can be no assurance or guarantee that the investment objective of the Scheme would be achieved.
ICICI Prudential S&P BSE 500 ETF
The investment objective of the scheme is to provide returns before expenses that closely correspond to the total return of the underlying index subject to tracking errors. However, there can be no assurance or guarantee that the investment objective of the Scheme would be achieved.
ICICI Prudential Nifty Next 50 ETF
The investment objective of the scheme is to provide returns before expenses that closely correspond to the total return of the underlying index subject to tracking errors. However, there can be no assurance or guarantee that the investment objective of the Scheme would be achieved.
ICICI Prudential Liquid ETF
The investment objective of the Scheme is to invest in CBLOs. The Scheme aims to provide returns before expenses that closely correspond to the returns of S&P BSE Liquid Rate Index, subject to tracking errors.However, there can be no assurance or guarantee that the investment objective of the Scheme would be achieved.
ICICI Prudential Regular Gold Savings Fund
ICICI Prudential Regular Gold Savings Fund (the Scheme) is a fund of funds scheme with the primary objective to generate returns by investing in units of ICICI Prudential Gold ETF (IPru Gold ETF). However, there can be no assurance that the investment objective of the Scheme will be realized.
ICICI Prudential Regular Savings Fund
To generate regular income through investments predominantly in debt and money market instruments. The Scheme also seeks to generate long term capital appreciation from the portion of equity investments under the Scheme.However, there is no assurance or guarantee that the investment objective of the Scheme would be achieved.
Hybrid
ICICI Prudential Equity Savings Fund
The Scheme seeks to generate regular income through investments in fixed income securities and using arbitrage and other derivative strategies. The Scheme also intends to generate long-term capital appreciation by investing a portion of the Scheme’s assets in equity and equity related instruments. However there can be no assurance that the investment objectives of the scheme will be realized.
ICICI Prudential Multi-Asset Fund
To generate capital appreciation for investors by investing predominantly in equity and equity related instruments and income by investing across other asset classes.However, there can be no assurance or guarantee that the investment objective of the Scheme would be achieved.
ICICI Prudential Bank ETF
The investment objective of the scheme is to provide returns before expenses that closely correspond to the total return of the underlying index subject to tracking errors. However, there can be no assurance or guarantee that the investment objective of the Scheme would be achieved.
ICICI Prudential Private Banks ETF
The investment objective of the scheme is to provide returns before expenses that closely correspond to the total return of the underlying index subject to tracking errors. However, there can be no assurance or guarantee that the investment objective of the Scheme would be achieved.
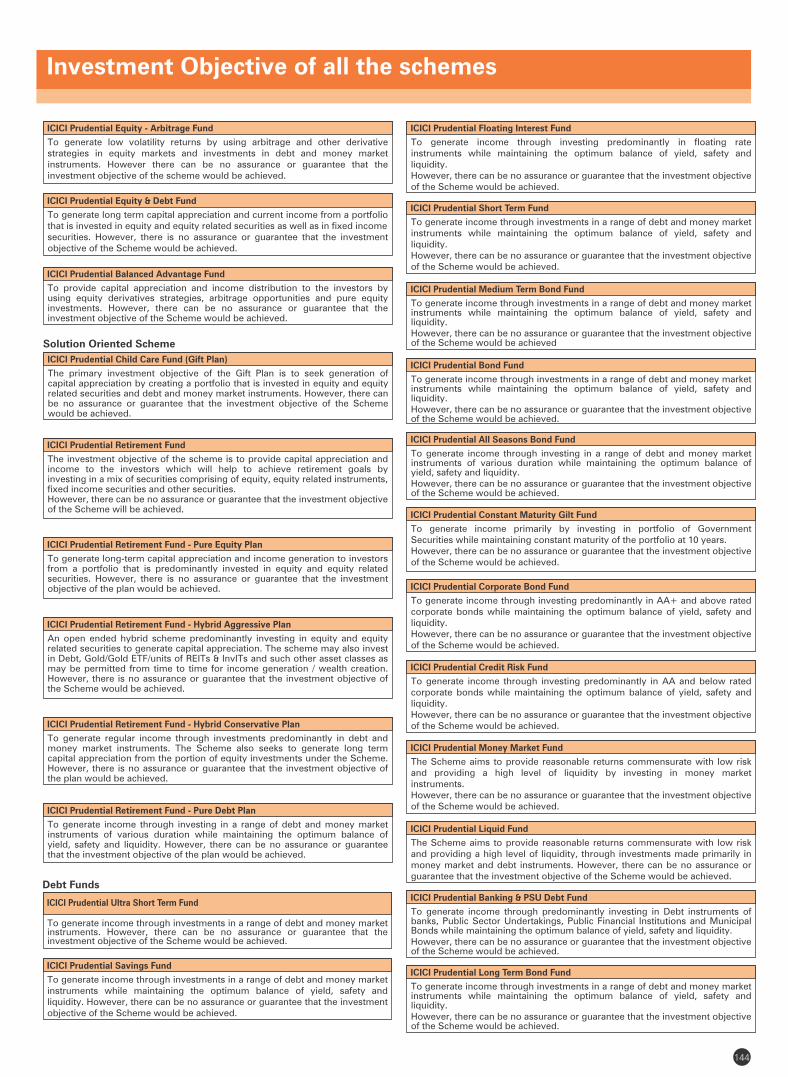
Investment Objective of all the schemes
144
ICICI Prudential Ultra Short Term Fund
To generate income through investments in a range of debt and money market instruments. However, there can be no assurance or guarantee that the investment objective of the Scheme would be achieved.
Debt Funds
ICICI Prudential Short Term Fund
To generate income through investments in a range of debt and money market instruments while maintaining the optimum balance of yield, safety and liquidity.However, there can be no assurance or guarantee that the investment objective of the Scheme would be achieved.
ICICI Prudential Child Care Fund (Gift Plan)
The primary investment objective of the Gift Plan is to seek generation of capital appreciation by creating a portfolio that is invested in equity and equity related securities and debt and money market instruments. However, there can be no assurance or guarantee that the investment objective of the Scheme would be achieved.
Solution Oriented Scheme
ICICI Prudential Equity & Debt Fund
To generate long term capital appreciation and current income from a portfolio that is invested in equity and equity related securities as well as in fixed income securities. However, there is no assurance or guarantee that the investment objective of the Scheme would be achieved.
ICICI Prudential Equity - Arbitrage Fund
To generate low volatility returns by using arbitrage and other derivative strategies in equity markets and investments in debt and money market instruments. However there can be no assurance or guarantee that the investment objective of the scheme would be achieved.
ICICI Prudential Long Term Bond Fund
To generate income through investments in a range of debt and money market instruments while maintaining the optimum balance of yield, safety and liquidity.However, there can be no assurance or guarantee that the investment objective of the Scheme would be achieved.
ICICI Prudential Money Market Fund
The Scheme aims to provide reasonable returns commensurate with low risk and providing a high level of liquidity by investing in money market instruments.However, there can be no assurance or guarantee that the investment objective of the Scheme would be achieved.
ICICI Prudential Banking & PSU Debt Fund
To generate income through predominantly investing in Debt instruments of banks, Public Sector Undertakings, Public Financial Institutions and Municipal Bonds while maintaining the optimum balance of yield, safety and liquidity.However, there can be no assurance or guarantee that the investment objective of the Scheme would be achieved.
ICICI Prudential Corporate Bond Fund
To generate income through investing predominantly in AA+ and above rated corporate bonds while maintaining the optimum balance of yield, safety and liquidity.However, there can be no assurance or guarantee that the investment objective of the Scheme would be achieved.
ICICI Prudential Constant Maturity Gilt Fund
To generate income primarily by investing in portfolio of Government Securities while maintaining constant maturity of the portfolio at 10 years.However, there can be no assurance or guarantee that the investment objective of the Scheme would be achieved.
ICICI Prudential All Seasons Bond Fund
To generate income through investing in a range of debt and money market instruments of various duration while maintaining the optimum balance of yield, safety and liquidity. However, there can be no assurance or guarantee that the investment objective of the Scheme would be achieved.
ICICI Prudential Bond Fund
To generate income through investments in a range of debt and money market instruments while maintaining the optimum balance of yield, safety and liquidity.However, there can be no assurance or guarantee that the investment objective of the Scheme would be achieved.
ICICI Prudential Medium Term Bond Fund
To generate income through investments in a range of debt and money market instruments while maintaining the optimum balance of yield, safety and liquidity.However, there can be no assurance or guarantee that the investment objective of the Scheme would be achieved
ICICI Prudential Credit Risk Fund
To generate income through investing predominantly in AA and below rated corporate bonds while maintaining the optimum balance of yield, safety and liquidity.However, there can be no assurance or guarantee that the investment objective of the Scheme would be achieved.
ICICI Prudential Liquid Fund
The Scheme aims to provide reasonable returns commensurate with low risk and providing a high level of liquidity, through investments made primarily in money market and debt instruments. However, there can be no assurance or guarantee that the investment objective of the Scheme would be achieved.
ICICI Prudential Retirement Fund
The investment objective of the scheme is to provide capital appreciation and income to the investors which will help to achieve retirement goals by investing in a mix of securities comprising of equity, equity related instruments, fixed income securities and other securities.However, there can be no assurance or guarantee that the investment objective of the Scheme will be achieved.
ICICI Prudential Retirement Fund - Pure Equity Plan
To generate long-term capital appreciation and income generation to investors from a portfolio that is predominantly invested in equity and equity related securities. However, there is no assurance or guarantee that the investment objective of the plan would be achieved.
ICICI Prudential Retirement Fund - Hybrid Aggressive Plan
An open ended hybrid scheme predominantly investing in equity and equity related securities to generate capital appreciation. The scheme may also invest in Debt, Gold/Gold ETF/units of REITs & InvITs and such other asset classes as may be permitted from time to time for income generation / wealth creation. However, there is no assurance or guarantee that the investment objective of the Scheme would be achieved.
ICICI Prudential Retirement Fund - Hybrid Conservative Plan
To generate regular income through investments predominantly in debt and money market instruments. The Scheme also seeks to generate long term capital appreciation from the portion of equity investments under the Scheme. However, there is no assurance or guarantee that the investment objective of the plan would be achieved.
ICICI Prudential Retirement Fund - Pure Debt Plan
To generate income through investing in a range of debt and money market instruments of various duration while maintaining the optimum balance of yield, safety and liquidity. However, there can be no assurance or guarantee that the investment objective of the plan would be achieved.
ICICI Prudential Balanced Advantage Fund
To provide capital appreciation and income distribution to the investors by using equity derivatives strategies, arbitrage opportunities and pure equity investments. However, there can be no assurance or guarantee that the investment objective of the Scheme would be achieved.
ICICI Prudential Savings Fund
To generate income through investments in a range of debt and money market instruments while maintaining the optimum balance of yield, safety and liquidity. However, there can be no assurance or guarantee that the investment objective of the Scheme would be achieved.
ICICI Prudential Floating Interest Fund
To generate income through investing predominantly in floating rate instruments while maintaining the optimum balance of yield, safety and liquidity.However, there can be no assurance or guarantee that the investment objective of the Scheme would be achieved.
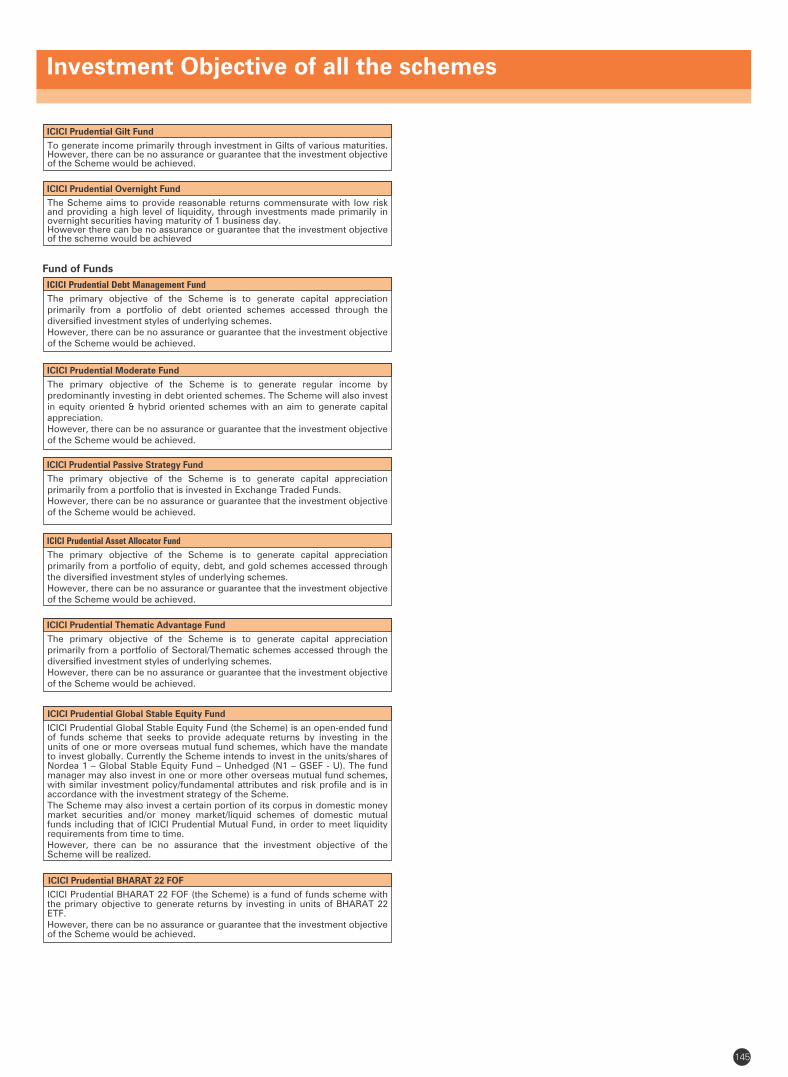
Investment Objective of all the schemes
145
ICICI Prudential Global Stable Equity Fund
ICICI Prudential Global Stable Equity Fund (the Scheme) is an open-ended fund of funds scheme that seeks to provide adequate returns by investing in the units of one or more overseas mutual fund schemes, which have the mandate to invest globally. Currently the Scheme intends to invest in the units/shares of Nordea 1 – Global Stable Equity Fund – Unhedged (N1 – GSEF - U). The fund manager may also invest in one or more other overseas mutual fund schemes, with similar investment policy/fundamental attributes and risk profile and is in accordance with the investment strategy of the Scheme. The Scheme may also invest a certain portion of its corpus in domestic money market securities and/or money market/liquid schemes of domestic mutual funds including that of ICICI Prudential Mutual Fund, in order to meet liquidity requirements from time to time. However, there can be no assurance that the investment objective of the Scheme will be realized.
ICICI Prudential Thematic Advantage Fund
The primary objective of the Scheme is to generate capital appreciation primarily from a portfolio of Sectoral/Thematic schemes accessed through the diversified investment styles of underlying schemes.However, there can be no assurance or guarantee that the investment objective of the Scheme would be achieved.
ICICI Prudential BHARAT 22 FOF
ICICI Prudential BHARAT 22 FOF (the Scheme) is a fund of funds scheme with the primary objective to generate returns by investing in units of BHARAT 22 ETF. However, there can be no assurance or guarantee that the investment objective of the Scheme would be achieved.
ICICI Prudential Asset Allocator Fund
The primary objective of the Scheme is to generate capital appreciation primarily from a portfolio of equity, debt, and gold schemes accessed through the diversified investment styles of underlying schemes.However, there can be no assurance or guarantee that the investment objective of the Scheme would be achieved.
ICICI Prudential Passive Strategy Fund
The primary objective of the Scheme is to generate capital appreciation primarily from a portfolio that is invested in Exchange Traded Funds.However, there can be no assurance or guarantee that the investment objective of the Scheme would be achieved.
ICICI Prudential Moderate Fund
Fund of Funds
ICICI Prudential Debt Management Fund
The primary objective of the Scheme is to generate capital appreciation primarily from a portfolio of debt oriented schemes accessed through the diversified investment styles of underlying schemes.However, there can be no assurance or guarantee that the investment objective of the Scheme would be achieved.
The primary objective of the Scheme is to generate regular income by predominantly investing in debt oriented schemes. The Scheme will also invest in equity oriented & hybrid oriented schemes with an aim to generate capital appreciation.However, there can be no assurance or guarantee that the investment objective of the Scheme would be achieved.
ICICI Prudential Gilt Fund
To generate income primarily through investment in Gilts of various maturities. However, there can be no assurance or guarantee that the investment objective of the Scheme would be achieved.
ICICI Prudential Overnight Fund
The Scheme aims to provide reasonable returns commensurate with low risk and providing a high level of liquidity, through investments made primarily in overnight securities having maturity of 1 business day.However there can be no assurance or guarantee that the investment objective of the scheme would be achieved
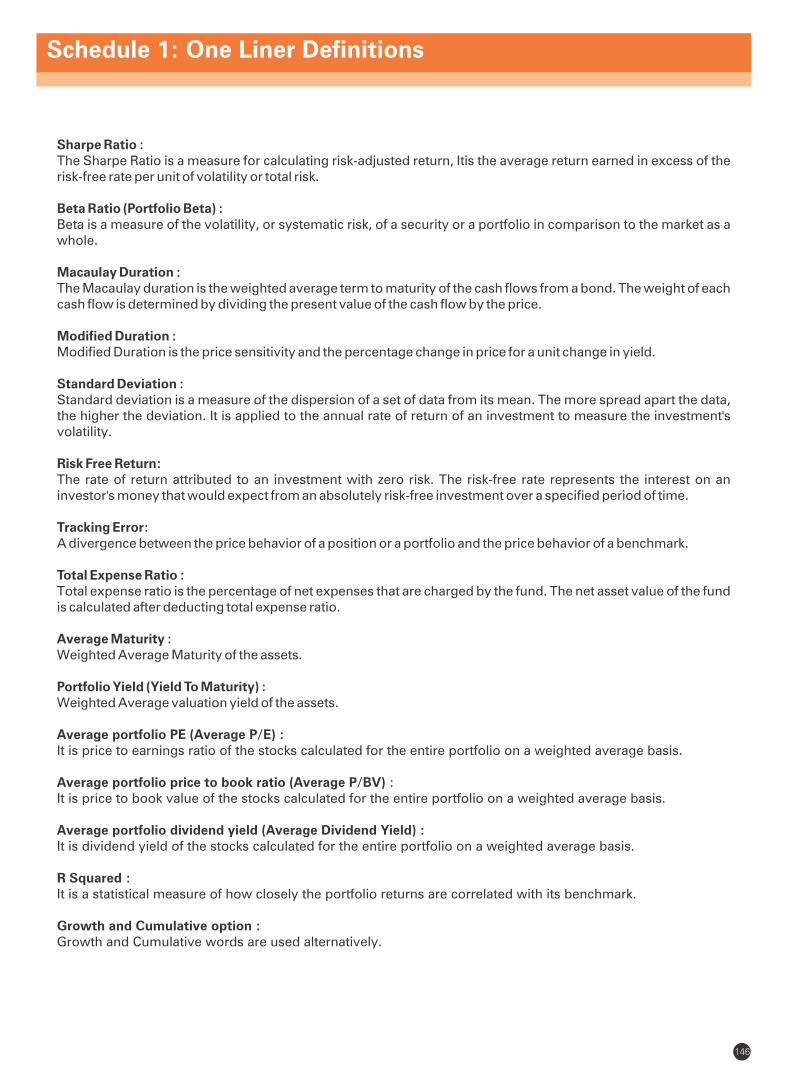
146
Schedule 1: One Liner Definitions
Sharpe Ratio :The Sharpe Ratio is a measure for calculating risk-adjusted return, Itis the average return earned in excess of the risk-free rate per unit of volatility or total risk.
Beta Ratio (Portfolio Beta) :Beta is a measure of the volatility, or systematic risk, of a security or a portfolio in comparison to the market as a whole.
Macaulay Duration :The Macaulay duration is the weighted average term to maturity of the cash flows from a bond. The weight of each cash flow is determined by dividing the present value of the cash flow by the price.
Modified Duration :Modified Duration is the price sensitivity and the percentage change in price for a unit change in yield.
Standard Deviation :Standard deviation is a measure of the dispersion of a set of data from its mean. The more spread apart the data, the higher the deviation. It is applied to the annual rate of return of an investment to measure the investment's volatility.
Risk Free Return:The rate of return attributed to an investment with zero risk. The risk-free rate represents the interest on an investor's money that would expect from an absolutely risk-free investment over a specified period of time.
Tracking Error:A divergence between the price behavior of a position or a portfolio and the price behavior of a benchmark.
Total Expense Ratio : Total expense ratio is the percentage of net expenses that are charged by the fund. The net asset value of the fund is calculated after deducting total expense ratio.
Average Maturity : Weighted Average Maturity of the assets.
Portfolio Yield (Yield To Maturity) : Weighted Average valuation yield of the assets.
Average portfolio PE (Average P/E) :It is price to earnings ratio of the stocks calculated for the entire portfolio on a weighted average basis.
Average portfolio price to book ratio (Average P/BV) : It is price to book value of the stocks calculated for the entire portfolio on a weighted average basis.
Average portfolio dividend yield (Average Dividend Yield) :It is dividend yield of the stocks calculated for the entire portfolio on a weighted average basis.
R Squared : It is a statistical measure of how closely the portfolio returns are correlated with its benchmark.
Growth and Cumulative option :Growth and Cumulative words are used alternatively.
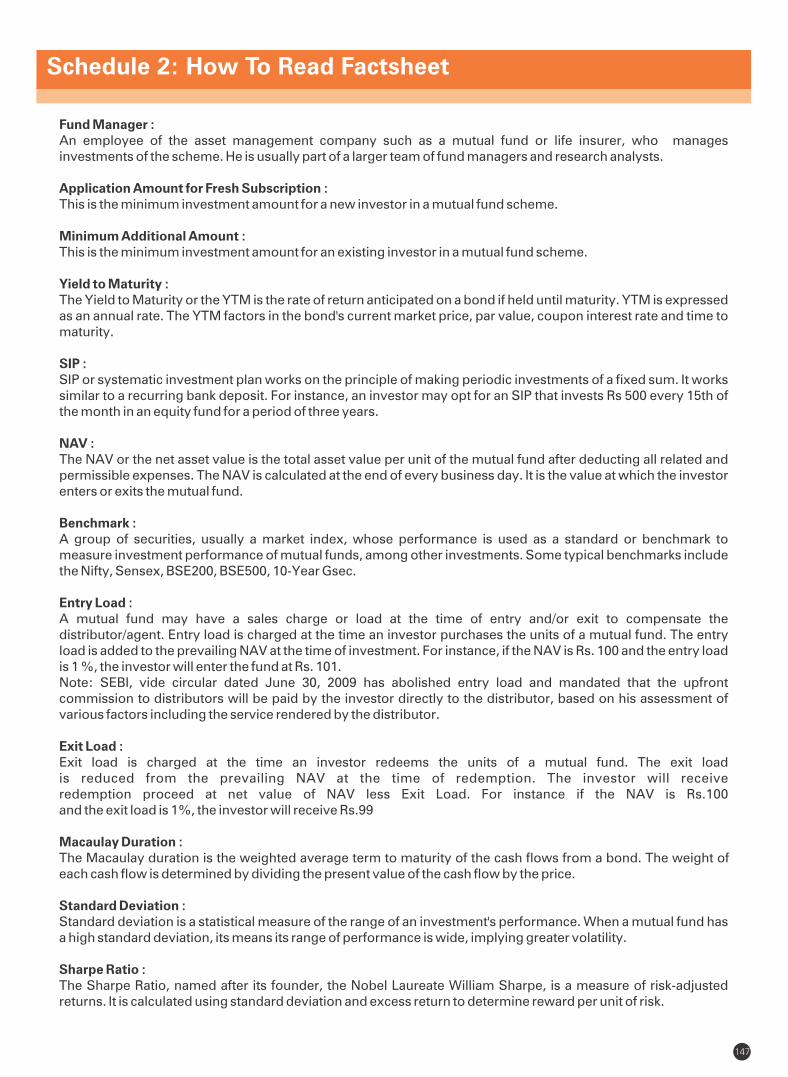
Schedule 2: How To Read Factsheet
Fund Manager :An employee of the asset management company such as a mutual fund or life insurer, who manages investments of the scheme. He is usually part of a larger team of fund managers and research analysts.
Application Amount for Fresh Subscription :This is the minimum investment amount for a new investor in a mutual fund scheme.
Minimum Additional Amount :This is the minimum investment amount for an existing investor in a mutual fund scheme.
Yield to Maturity :The Yield to Maturity or the YTM is the rate of return anticipated on a bond if held until maturity. YTM is expressed as an annual rate. The YTM factors in the bond's current market price, par value, coupon interest rate and time to maturity.
SIP :SIP or systematic investment plan works on the principle of making periodic investments of a fixed sum. It works similar to a recurring bank deposit. For instance, an investor may opt for an SIP that invests Rs 500 every 15th of the month in an equity fund for a period of three years.
NAV :The NAV or the net asset value is the total asset value per unit of the mutual fund after deducting all related and permissible expenses. The NAV is calculated at the end of every business day. It is the value at which the investor enters or exits the mutual fund.
Benchmark :A group of securities, usually a market index, whose performance is used as a standard or benchmark to measure investment performance of mutual funds, among other investments. Some typical benchmarks include the Nifty, Sensex, BSE200, BSE500, 10-Year Gsec.
Entry Load :A mutual fund may have a sales charge or load at the time of entry and/or exit to compensate the distributor/agent. Entry load is charged at the time an investor purchases the units of a mutual fund. The entry load is added to the prevailing NAV at the time of investment. For instance, if the NAV is Rs. 100 and the entry load is 1 %, the investor will enter the fund at Rs. 101. Note: SEBI, vide circular dated June 30, 2009 has abolished entry load and mandated that the upfront commission to distributors will be paid by the investor directly to the distributor, based on his assessment of various factors including the service rendered by the distributor.
Exit Load :Exit load is charged at the time an investor redeems the units of a mutual fund. The exit loadis reduced from the prevailing NAV at the time of redemption. The investor will receiveredemption proceed at net value of NAV less Exit Load. For instance if the NAV is Rs.100and the exit load is 1%, the investor will receive Rs.99
Macaulay Duration :The Macaulay duration is the weighted average term to maturity of the cash flows from a bond. The weight of each cash flow is determined by dividing the present value of the cash flow by the price.
Standard Deviation :Standard deviation is a statistical measure of the range of an investment's performance. When a mutual fund has a high standard deviation, its means its range of performance is wide, implying greater volatility.
Sharpe Ratio :The Sharpe Ratio, named after its founder, the Nobel Laureate William Sharpe, is a measure of risk-adjusted returns. It is calculated using standard deviation and excess return to determine reward per unit of risk.
147
Beta Ratio (Portfolio Beta) :Beta is a measure of an investment's volatility vis-a-vis the market. Beta of less than 1 means that the security will be less volatile than the market. A beta of greater than 1 implies that the security's price will be more volatile than the market.
Average portfolio PE (Average P/E) :It is price to earnings ratio of the stocks calculated for the entire portfolio on a weighted average basis.
Average portfolio price to book ratio (Average P/BV) : It is price to book value of the stocks calculated for the entire portfolio on a weighted average basis.
Average portfolio dividend yield (Average Dividend Yield) :It is dividend yield of the stocks calculated for the entire portfolio on a weighted average basis.
Net Equity : Net equity level is the net equity exposure percentage adjusted for any derivative positions in stocks or index for hedging or rebalancing purpose.
R Squared : It is a statistical measure of how closely the portfolio returns are correlated with its benchmark.
AUM :AUM or assets under management refers to the recent / updated cumulative market value of investments managed by a mutual fund or any investment firm.
Holdings :The holdings or the portfolio is a mutual fund's latest or updated reported statement of investments/securities. These are usually displayed in terms of percentage to net assets or the rupee value or both. The objective is to give investors an idea of where their money is being invested by the fund manager.
Nature of Scheme :The investment objective and underlying investments determine the nature of the mutual fund scheme. For instance, a mutual fund that aims at generating capital appreciation by investing in stock markets is an equity fund or growth fund. Likewise, a mutual fund that aims at capital preservation by investing in debt markets is a debt fund or income fund. Each of these categories may have sub-categories.
Rating Profile :Mutual funds invest in securities after evaluating their creditworthiness as disclosed by the ratings. A depiction of the mutual fund in various investments based on their ratings becomes the rating profile of the fund. Typically, this is a feature of debt funds.
Value STP : The ICICI Prudential Value STP is an innovation over the regular STP that enables you to take advantage of market fluctuations; you buy more units when the Net Asset Value (NAV) of your selected scheme falls and lesser units when the NAV rises. The Value STP helps you reach your targeted value for every transfer date, by adding or removing funds from your selected scheme.
Flex STP :ICICI Prudential Transfer Plan (“Flex STP”) is a facility wherein unit holder(s) of designated open-ended Scheme(s) of ICICI Prudential Mutual Fund can opt to transfer variable amount(s) linked to value of investments under Flex STP on the date of transfer at pre-determined intervals from designated open ended Scheme(s) of ICICI Prudential Mutual Fund [hereinafter referred to as “Transferor Scheme”] to the growth option of designated open-ended Scheme(s) of ICICI Prudential Mutual Fund [hereinafter referred to as “Transferee Scheme”].
148

ICICI Prudential Mutual Fund Corporate Office
ONE BKC, A - Wing, 13th Floor, Bandra-Kurla Complex, Mumbai 400 051, India.
Tel: 022 - 26525000 Fax: 022 - 26528100, website: www.icicipruamc.com, email id: [email protected]
Statutory Details & Risk Factors
Mutual Fund investments are subject to market risks, read all scheme related documents carefully.
Disclaimer: In the preparation of the material contained in this document, the Asset Management Company (AMC) has used information that is publicly available, including information developed in-house. Some of the material used in the document may have been obtained from members/persons other than the AMC and/or its affiliates and which may have been made available to the AMC and/or to its affiliates. Information gathered and material used in this document is believed to be from reliable sources. The AMC however does not warrant the accuracy, reasonableness and / or completeness of any information. We have included statements / opinions / recommendations in this document, which contain words, or phrases such as “will”, “expect”, “should”, “believe” and similar expressions or variations of such expressions that are “forward looking statements”. Actual results may differ materially from those suggested by the forward looking statements due to risk or uncertainties associated with our expectations with respect to, but not limited to, exposure to market risks, general economic and political conditions in India and other countries globally, which have an impact on our services and / or investments, the monetary and interest policies of India, inflation, deflation, unanticipated turbulence in interest rates, foreign exchange rates, equity prices or other rates or prices etc.
The AMC (including its affiliates), the Mutual Fund, the trust and any of its officers, directors, personnel and employees, shall not be liable for any loss, damage of any nature, including but not limited to direct, indirect, punitive, special, exemplary, consequential, as also any loss of profit in any way arising from the use of this material in any manner. The recipient alone shall be fully responsible/are liable for any decision taken on this material.
149
