eom-06_quantitative techniques for planning and decision making
TRANSCRIPT

7/30/2019 EOM-06_Quantitative Techniques for Planning and Decision Making
http://slidepdf.com/reader/full/eom-06quantitative-techniques-for-planning-and-decision-making 1/26
CHAPTER 4
Quantitative Techniques forPlanning and Decision Making
7/30/2019 EOM-06_Quantitative Techniques for Planning and Decision Making
http://slidepdf.com/reader/full/eom-06quantitative-techniques-for-planning-and-decision-making 2/26
4-2
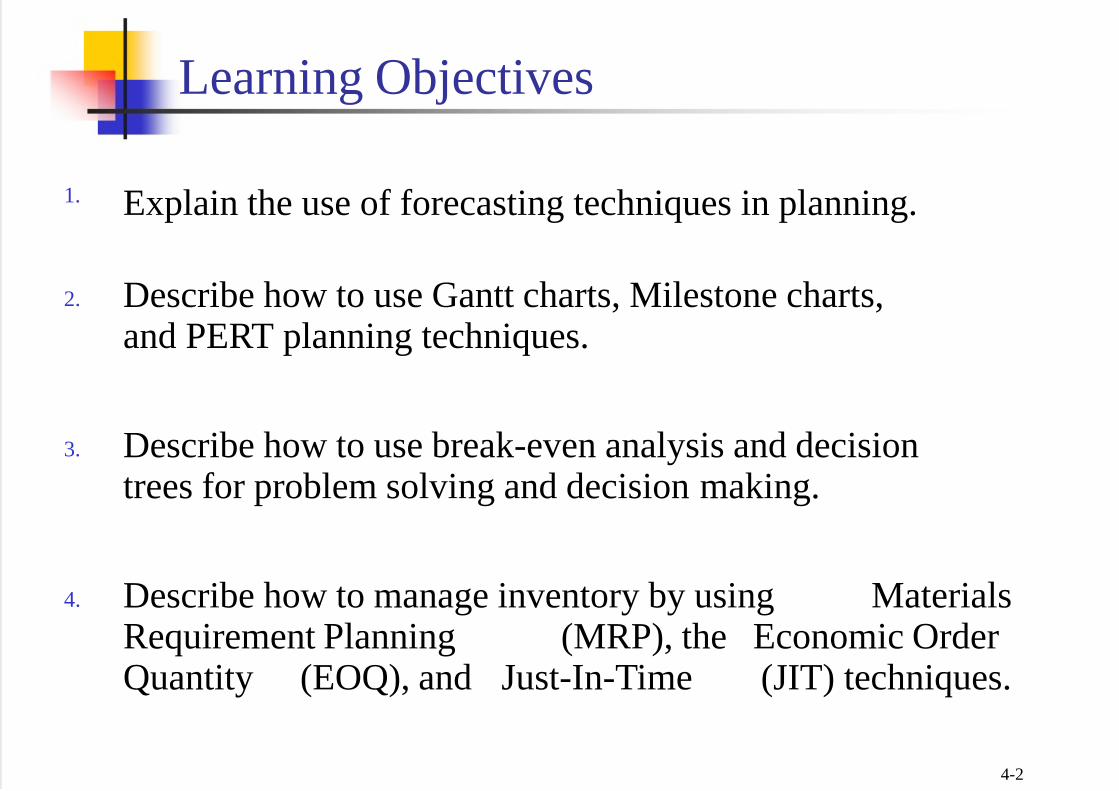
Learning Objectives
1. Explain the use of forecasting techniques in planning.
2. Describe how to use Gantt charts, Milestone charts,and PERT planning techniques.
3. Describe how to use break-even analysis and decisiontrees for problem solving and decision making.
4. Describe how to manage inventory by using MaterialsRequirement Planning (MRP), the Economic OrderQuantity (EOQ), and Just-In-Time (JIT) techniques.

7/30/2019 EOM-06_Quantitative Techniques for Planning and Decision Making
http://slidepdf.com/reader/full/eom-06quantitative-techniques-for-planning-and-decision-making 3/26
4-3
1. Data-based Decision Making
Data-driven management refers to the idea thatdecisions are based on facts rather thanimpressions or guesses
Many managers want to see the data before accepting a
suggestion from a subordinate.Data-driven management is more of an attitudeand approach than a specific technique, and it ishardly new.
Although data-driven management is preferable inmost situations, intuition and judgment stillcontribute to making major decisions
7/30/2019 EOM-06_Quantitative Techniques for Planning and Decision Making
http://slidepdf.com/reader/full/eom-06quantitative-techniques-for-planning-and-decision-making 4/26
4-4
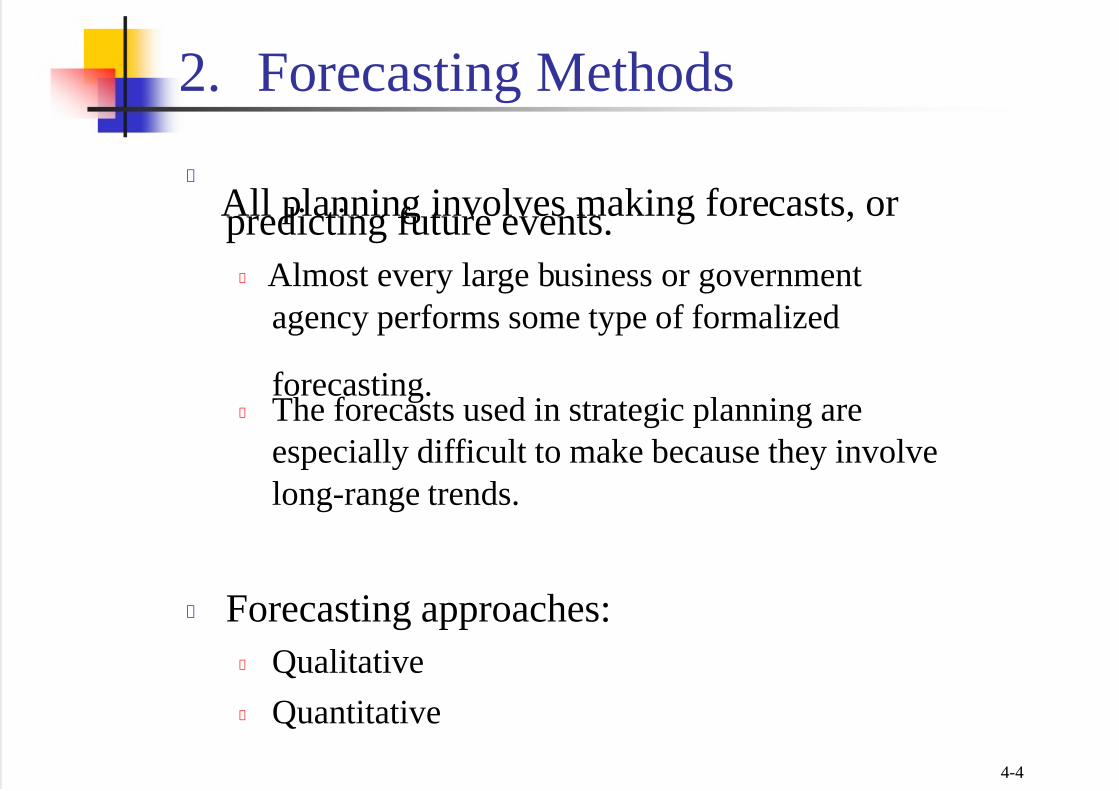
2. Forecasting Methods
All planning involves making forecasts, orpredicting future events. Almost every large business or governmentagency performs some type of formalized
forecasting.The forecasts used in strategic planning areespecially difficult to make because they involvelong-range trends.
Forecasting approaches:QualitativeQuantitative

7/30/2019 EOM-06_Quantitative Techniques for Planning and Decision Making
http://slidepdf.com/reader/full/eom-06quantitative-techniques-for-planning-and-decision-making 5/26
Quantitative Approaches A prediction based on historical data or models, such as atime-series analysis.
0
100
75
50
25
1990 1992 1994 1996 1998 2000 2002 2004 2006
% of people taking vacationsduring summer months
Qualitative Approaches A prediction based on a collection of subjective hunches.

7/30/2019 EOM-06_Quantitative Techniques for Planning and Decision Making
http://slidepdf.com/reader/full/eom-06quantitative-techniques-for-planning-and-decision-making 6/26
4-6
a. Types of Forecasts
Economic ForecastingStrategic planners in large organizations rely often oneconomic forecasts made by specialists they hire.Planners in smaller firms are more likely to rely on
government forecasts or speak to other business people.Sales Forecasting
Usually the primary planning document for a businessFeedback from the field sales force often provides usefulinput for forecasts
Technological ForecastingPredict what types of technological changes will take place.
Allow a firm to adapt to new technologies and thus staycompetitive
7/30/2019 EOM-06_Quantitative Techniques for Planning and Decision Making
http://slidepdf.com/reader/full/eom-06quantitative-techniques-for-planning-and-decision-making 7/264-7
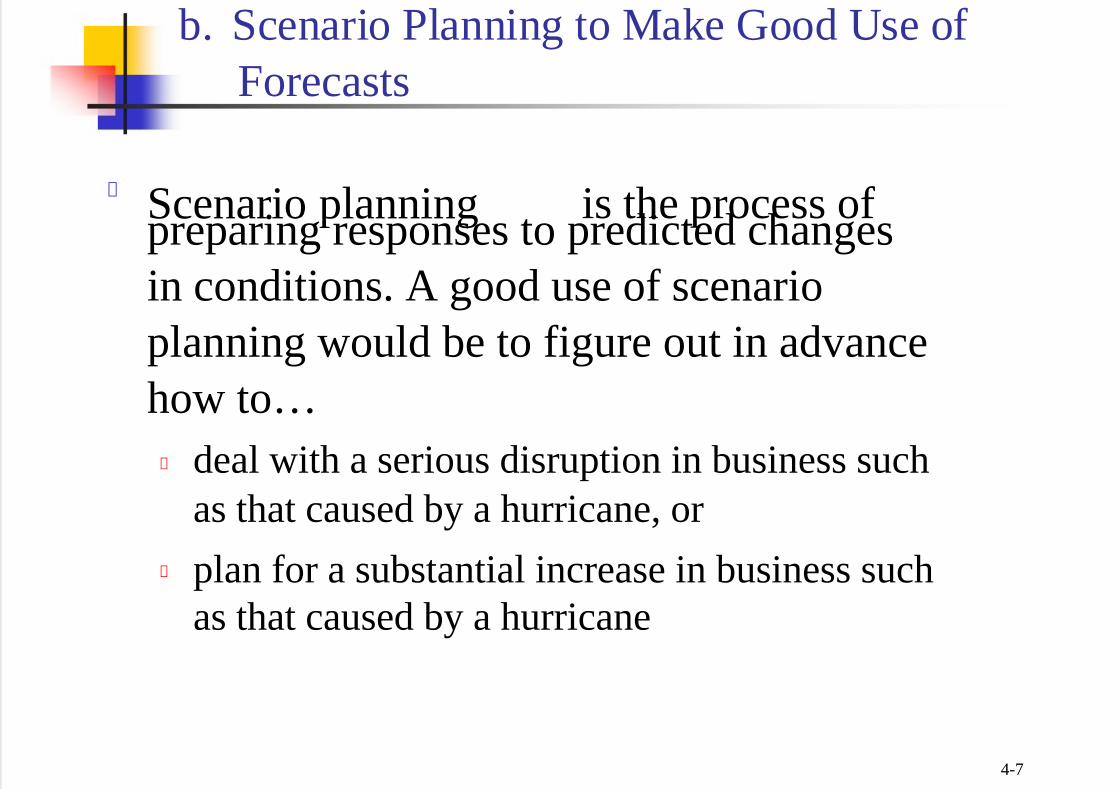
b. Scenario Planning to Make Good Use of Forecasts
Scenario planning is the process of preparing responses to predicted changesin conditions. A good use of scenarioplanning would be to figure out in advancehow to…
deal with a serious disruption in business suchas that caused by a hurricane, orplan for a substantial increase in business suchas that caused by a hurricane
7/30/2019 EOM-06_Quantitative Techniques for Planning and Decision Making
http://slidepdf.com/reader/full/eom-06quantitative-techniques-for-planning-and-decision-making 8/264-8
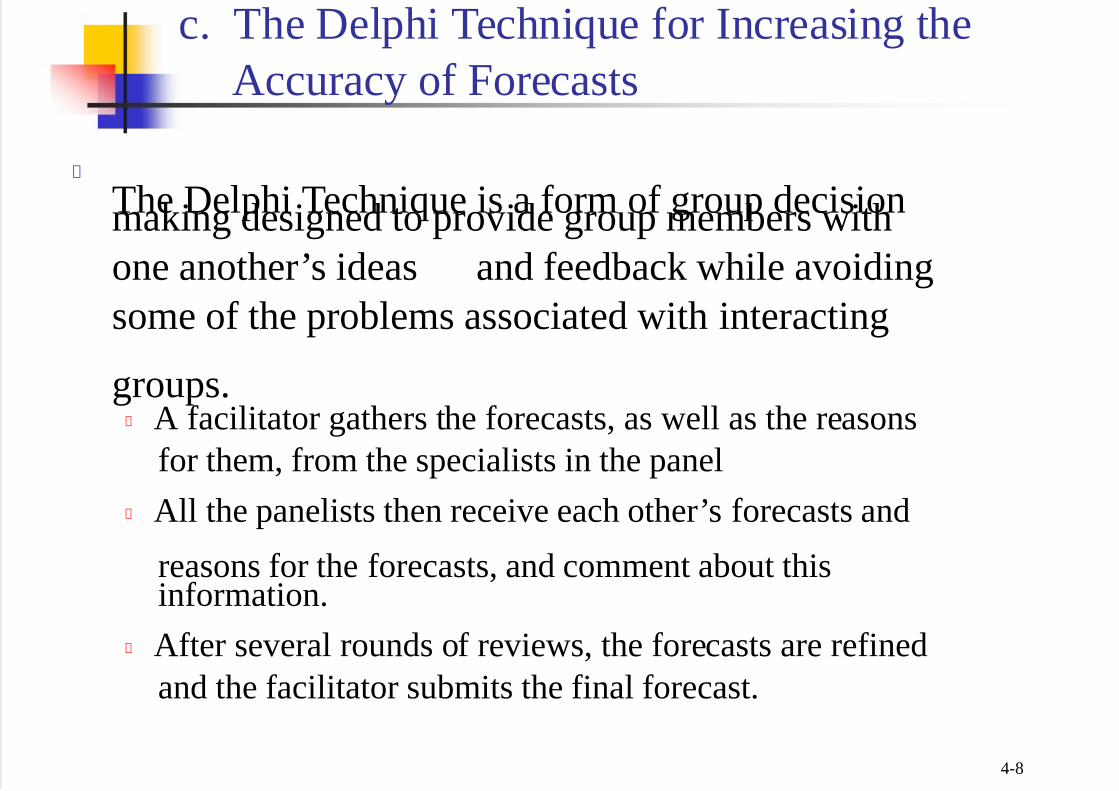
c. The Delphi Technique for Increasing the Accuracy of Forecasts
The Delphi Technique is a form of group decisionmaking designed to provide group members withone another’s ideas and feedback while avoidingsome of the problems associated with interacting
groups. A facilitator gathers the forecasts, as well as the reasonsfor them, from the specialists in the panel
All the panelists then receive each other’s forecasts and
reasons for the forecasts, and comment about thisinformation.
After several rounds of reviews, the forecasts are refinedand the facilitator submits the final forecast.

7/30/2019 EOM-06_Quantitative Techniques for Planning and Decision Making
http://slidepdf.com/reader/full/eom-06quantitative-techniques-for-planning-and-decision-making 9/264-9
3. Planning Techniques
a. Gantt Charts
b. Milestone Charts
c. PERT Network
7/30/2019 EOM-06_Quantitative Techniques for Planning and Decision Making
http://slidepdf.com/reader/full/eom-06quantitative-techniques-for-planning-and-decision-making 10/26
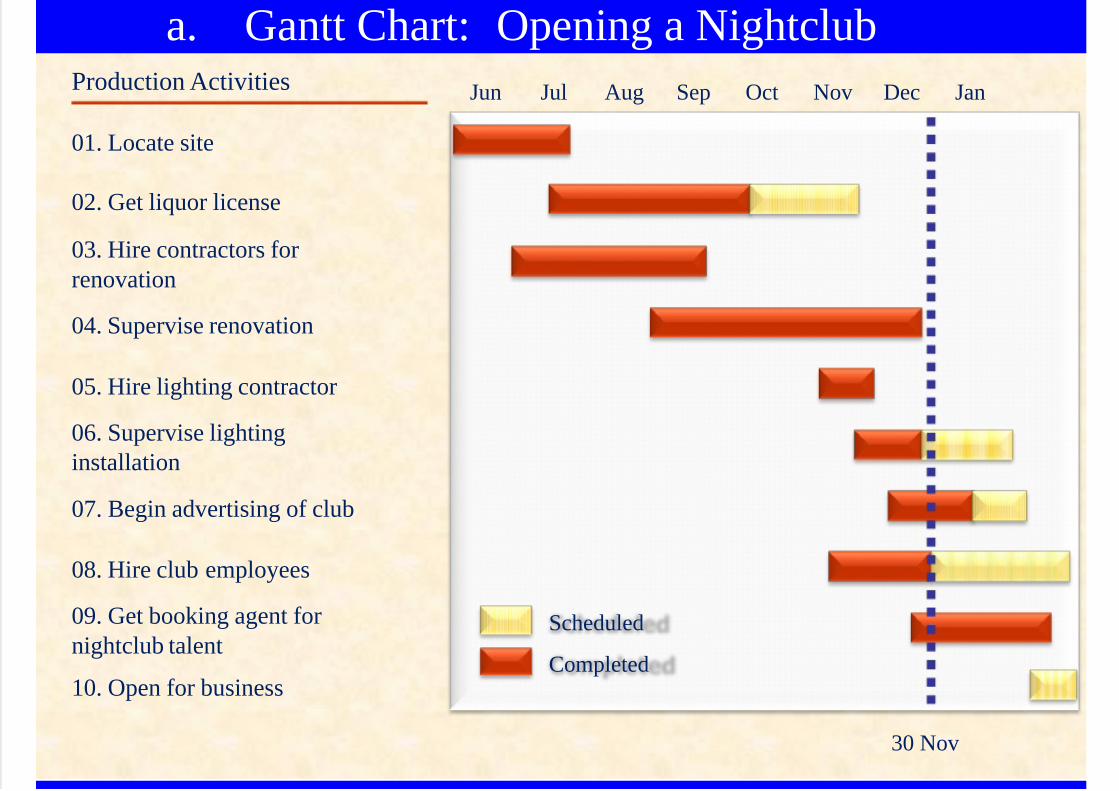
a. Gantt Chart: Opening a NightclubProduction Activities
01. Locate site
02. Get liquor license
03. Hire contractors forrenovation
04. Supervise renovation
05. Hire lighting contractor
06. Supervise lightinginstallation
07. Begin advertising of club
08. Hire club employees
09. Get booking agent fornightclub talent
10. Open for business
Jun Jul Aug Sep Oct Nov Dec Jan
Scheduled
Completed
30 Nov

7/30/2019 EOM-06_Quantitative Techniques for Planning and Decision Making
http://slidepdf.com/reader/full/eom-06quantitative-techniques-for-planning-and-decision-making 11/26
b. Milestone Chart: Opening a NightclubProduction Activities
01. Locate site
02. Get liquor license03. Hire contractors for renovation
04. Supervise renovation
05. Hire lighting contractor
06. Supervise lighting installation
07. Begin advertising of club08. Hire club employees09. Get booking agent for
nightclub talent10. Open for business
Jun Jul Aug Sep Oct Nov Dec Jan1 2 3
4 4 5 6 7 8 9 1011 12 13
14 15 16 17 18 19
20 21
22 23 24
25 2627 28 29 30
31 32
33
Milestones to be Accomplished
27. Speak to friends and acquaintances about job openings
28. Put ad in local newspapers
29. Conduct interviews with applicants and check references of best candidates
30. Make job offers to best candidates
33. Have grand-opening celebration 5 January
7/30/2019 EOM-06_Quantitative Techniques for Planning and Decision Making
http://slidepdf.com/reader/full/eom-06quantitative-techniques-for-planning-and-decision-making 12/26
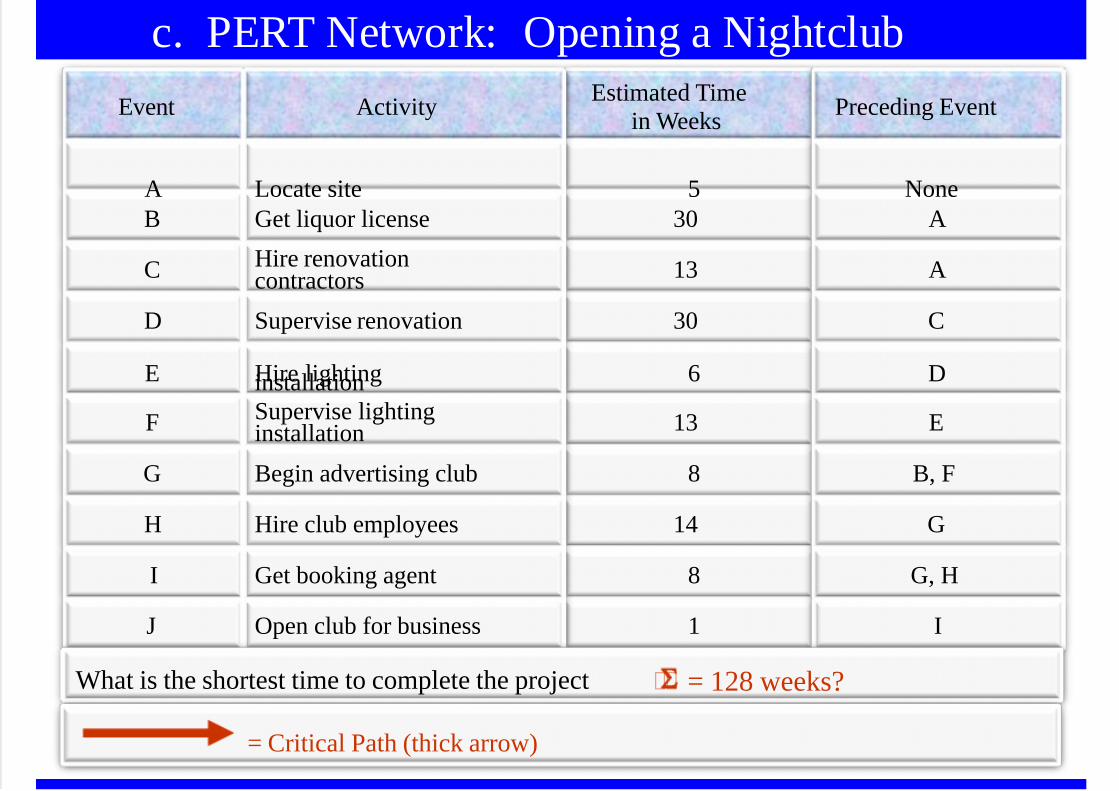
c. PERT Network: Opening a NightclubEstimated Time
in Weeks
530
13
30
6
13
8
14
8
1
Preceding Event
NoneA
A
C
D
E
B, F
G
G, H
I
Event
AB
C
D
E
F
G
H
I
J
Activity
Locate siteGet liquor licenseHire renovationcontractors
Supervise renovation
Hire lightinginstallationSupervise lightinginstallation
Begin advertising club
Hire club employees
Get booking agent
Open club for business
What is the shortest time to complete the project = 128 weeks?
= Critical Path (thick arrow)
7/30/2019 EOM-06_Quantitative Techniques for Planning and Decision Making
http://slidepdf.com/reader/full/eom-06quantitative-techniques-for-planning-and-decision-making 13/26
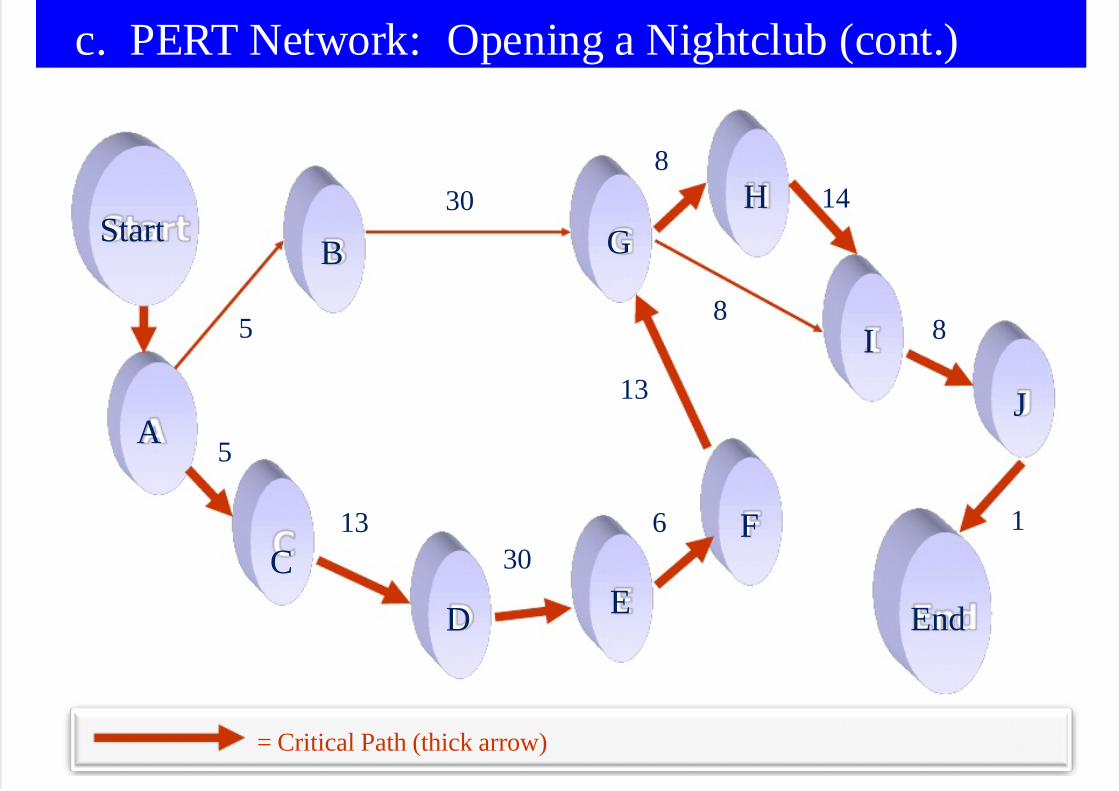
c. PERT Network: Opening a Nightclub (cont.)
A
StartB G
H
C
D E
F
I
J
End
5
308
14
8
13
6
5
1330
8
1
= Critical Path (thick arrow)
7/30/2019 EOM-06_Quantitative Techniques for Planning and Decision Making
http://slidepdf.com/reader/full/eom-06quantitative-techniques-for-planning-and-decision-making 14/264-14
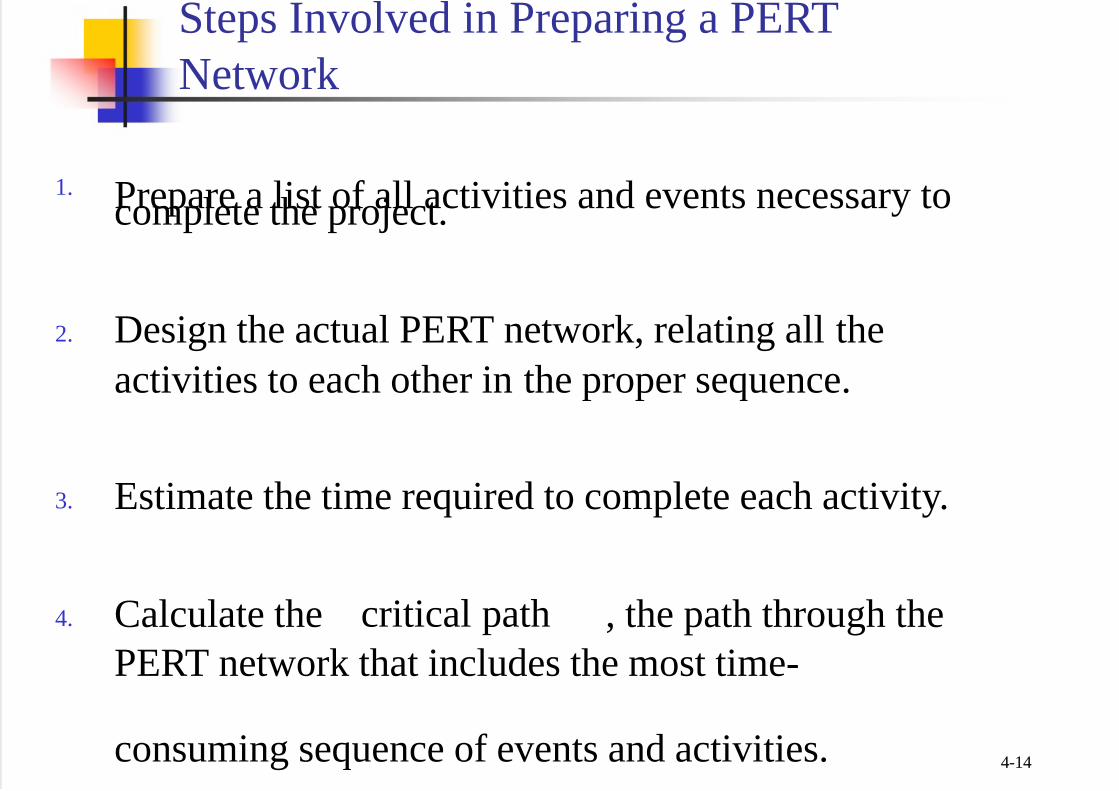
Steps Involved in Preparing a PERTNetwork
1. Prepare a list of all activities and events necessary tocomplete the project.
2. Design the actual PERT network, relating all theactivities to each other in the proper sequence.
3. Estimate the time required to complete each activity.
4. Calculate the critical path , the path through thePERT network that includes the most time-
consuming sequence of events and activities.

7/30/2019 EOM-06_Quantitative Techniques for Planning and Decision Making
http://slidepdf.com/reader/full/eom-06quantitative-techniques-for-planning-and-decision-making 15/264-15
4. Decision Making Tools
a. Break-Even Analysis A method of determining the relationshipbetween total costs and total revenues atvarious levels of production or salesactivity.
b. Decision Tree A graphic illustration of the alternativesolutions available to solve a problem

7/30/2019 EOM-06_Quantitative Techniques for Planning and Decision Making
http://slidepdf.com/reader/full/eom-06quantitative-techniques-for-planning-and-decision-making 16/264-16
The break-even point (Q BE) is the situation in whichtotal revenues equal fixed costs plus variable costs. Break-Even Formula
= −
whereP = selling price per unit
VC = variable cost per unit, the cost that varies with theamount producedFC = fixed cost, the cost that remains constant no matterhow many units are produced
a. Break-Even Analysis

7/30/2019 EOM-06_Quantitative Techniques for Planning and Decision Making
http://slidepdf.com/reader/full/eom-06quantitative-techniques-for-planning-and-decision-making 17/264-17
Break-Even Chart: Adding a New Product
800700
600
500
400
300
200
100
10 2 3 4 5 6 7 8 9 10
Revenues and costs($ in thousands)
Sales (unitsin hundreds)
Total Revenues
TotalCosts
Profit
Loss
Fixed Costs
VariableCosts
Break-EvenPoint

7/30/2019 EOM-06_Quantitative Techniques for Planning and Decision Making
http://slidepdf.com/reader/full/eom-06quantitative-techniques-for-planning-and-decision-making 18/264-18
Decision trees are designed to estimatethe outcome of a series of decisions.
As the sequences of the major decisionare drawn, the resulting diagramresembles a tree with branches.
Expected value:The average return on a particular decision
being made a large number of times.
b. Decision Tree

7/30/2019 EOM-06_Quantitative Techniques for Planning and Decision Making
http://slidepdf.com/reader/full/eom-06quantitative-techniques-for-planning-and-decision-making 19/264-19
Example: First-Year Decision Tree for NightclubOwner
Possible Alternatives States of NatureConditional
ValuesExpected
Values
D e c
i s i o n
P o
i n t
$100,000
-$10,000
$150,000
-$30,000
$56,000
$78,000

7/30/2019 EOM-06_Quantitative Techniques for Planning and Decision Making
http://slidepdf.com/reader/full/eom-06quantitative-techniques-for-planning-and-decision-making 20/264-20
5. Inventory Control Techniques
Just-in-Time (JIT) LIFO Versus FIFO
Economic-OrderQuantity (EOQ)

7/30/2019 EOM-06_Quantitative Techniques for Planning and Decision Making
http://slidepdf.com/reader/full/eom-06quantitative-techniques-for-planning-and-decision-making 21/264-21
a. Economic Order Quantity
The economic order quantity(EOQ) is the inventory level thatminimizes both administrativecosts and carrying costs.
Administrative costs are the fixedcost of placing and receiving anorder
Carrying costs include:the cost of loans,the interest foregone because moneyis tied up in inventory, and
the cost of handling the inventory.

7/30/2019 EOM-06_Quantitative Techniques for Planning and Decision Making
http://slidepdf.com/reader/full/eom-06quantitative-techniques-for-planning-and-decision-making 22/264-22
Graphical Illustration

7/30/2019 EOM-06_Quantitative Techniques for Planning and Decision Making
http://slidepdf.com/reader/full/eom-06quantitative-techniques-for-planning-and-decision-making 23/264-23
b. Just-in-Time System(JIT)
A system designed to minimize inventoryand move it into the plant exactly whenneeded.
Advantages of the JIT Inventory System:The expenses associated with maintaining a largeinventory can be dramatically reduced.Lead to organizational commitment to quality indesign, materials, parts, employee – management
and supplier – user relations, and finished goods.With minimum levels of inventory on hand,finished products are more visible and defectsare more readily detected.

7/30/2019 EOM-06_Quantitative Techniques for Planning and Decision Making
http://slidepdf.com/reader/full/eom-06quantitative-techniques-for-planning-and-decision-making 24/26
4-24
b. JIT (cont.)
Disadvantages of the JIT Inventory System:a JIT system must be placed in a supportive orcompatible environment.
Product demand must be predictable with a minimum of surges in demand.Reliable suppliers are needed
Small companies with short runs of a variety of products often suffer financial losses from JITpractices.The savings from JIT management can be deceptive.
Suppliers might simply build up inventories in their ownplants and add that cost to their prices.JIT inventory practices leave a company vulnerable to work
stoppages, such as a strike.

7/30/2019 EOM-06_Quantitative Techniques for Planning and Decision Making
http://slidepdf.com/reader/full/eom-06quantitative-techniques-for-planning-and-decision-making 25/26
4-25
c. LIFO versus FIFO
Last In, First Out (LIFO)Selling an item first that was received last in inventory. Therationale here is that the newest is probably the mostexpensive.
First In, First Out (FIFO)Selling an item first that has been in inventory the longest.
In choosing between LIFO and FIFO, you have bothphysical and financial considerations:
Getting rid of older inventory first can be a good ideabecause… If the company has borrowed money to purchase inventory,you want to move the inventory you have been paying forthe longest.

7/30/2019 EOM-06_Quantitative Techniques for Planning and Decision Making
http://slidepdf.com/reader/full/eom-06quantitative-techniques-for-planning-and-decision-making 26/26
Homework for group presentation
Prepare for a 15 minute grouppresentation on Case Problem 6-A: “Retro Is Our Future ”, page 222:
Describe shortly the case problem Answer all questions in the caseproblemEmail your files to the lecturer