environment impacts of energy sector (non-renewable)
TRANSCRIPT

ENVIRONMENT IMPACTS OF ENERGY
SECTOR (NON-RENEWABLE)
Suresh Jain, Ph.D. Professor and Head
Department of Natural Resources
TERI University, New Delhi-110070
Email: [email protected]; [email protected]
National Training Programme on Environmental Audit of
Infrastructure Projects” from 22nd February to 26th February, 2016

Non-renewable energy sources
Non-renewable energy is energy from fossil fuels
such as coal, crude oil, natural gas and uranium.
Fossil fuels are mainly made up of Carbon.

Usage of non-renewable energy resources
Source: November 15, 2014: www.globalpost.com

Usage of non-renewable energy resources

Usage of non-renewable energy resources


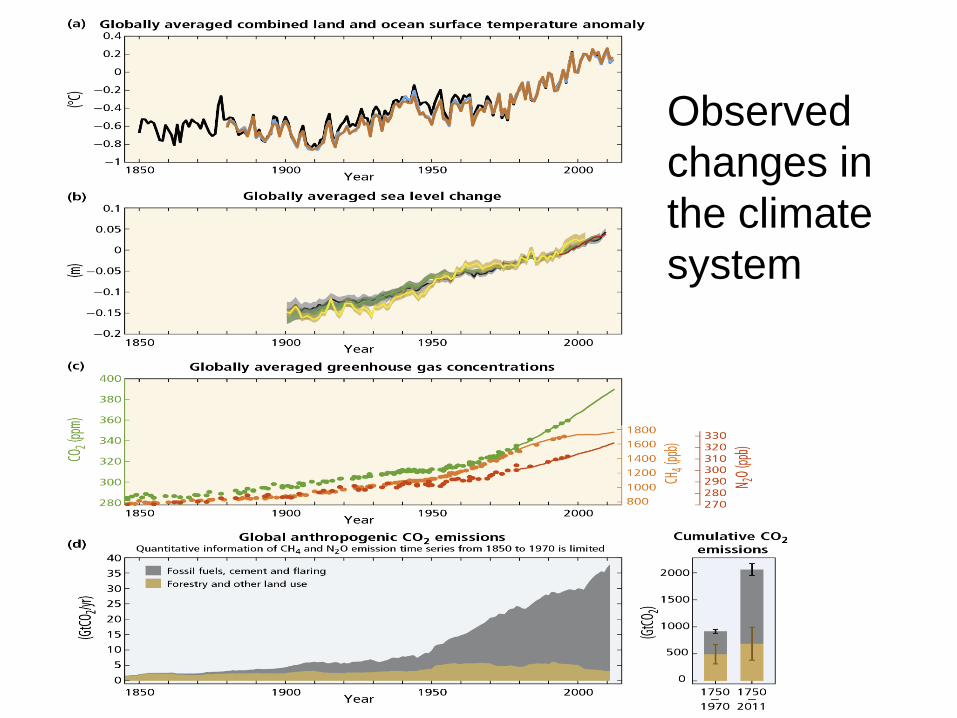
Observed
changes in
the climate
system
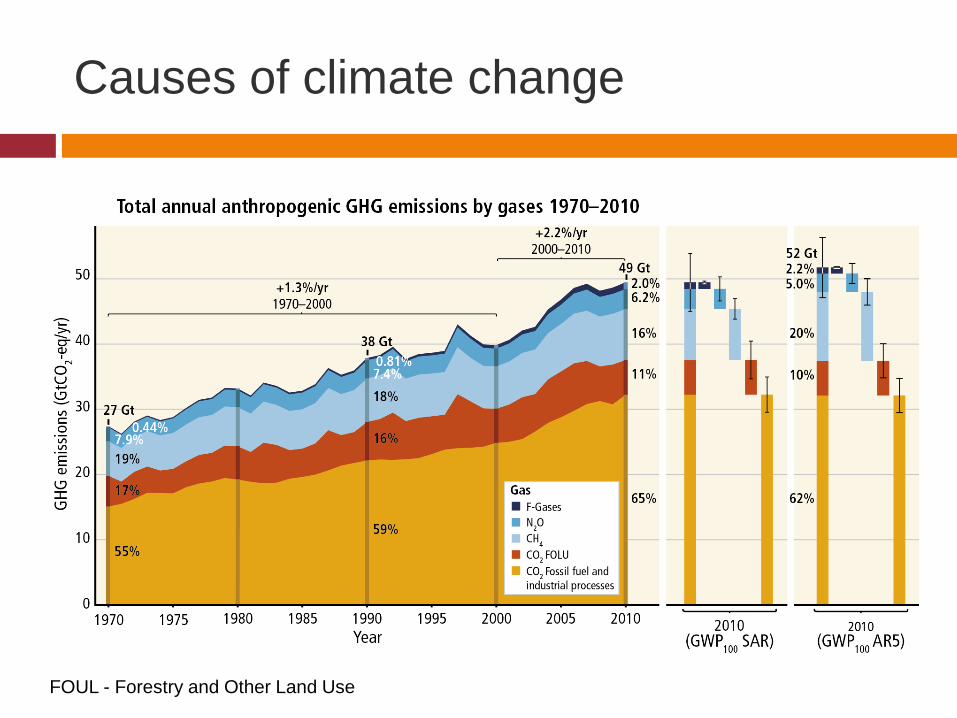
Causes of climate change
FOUL - Forestry and Other Land Use
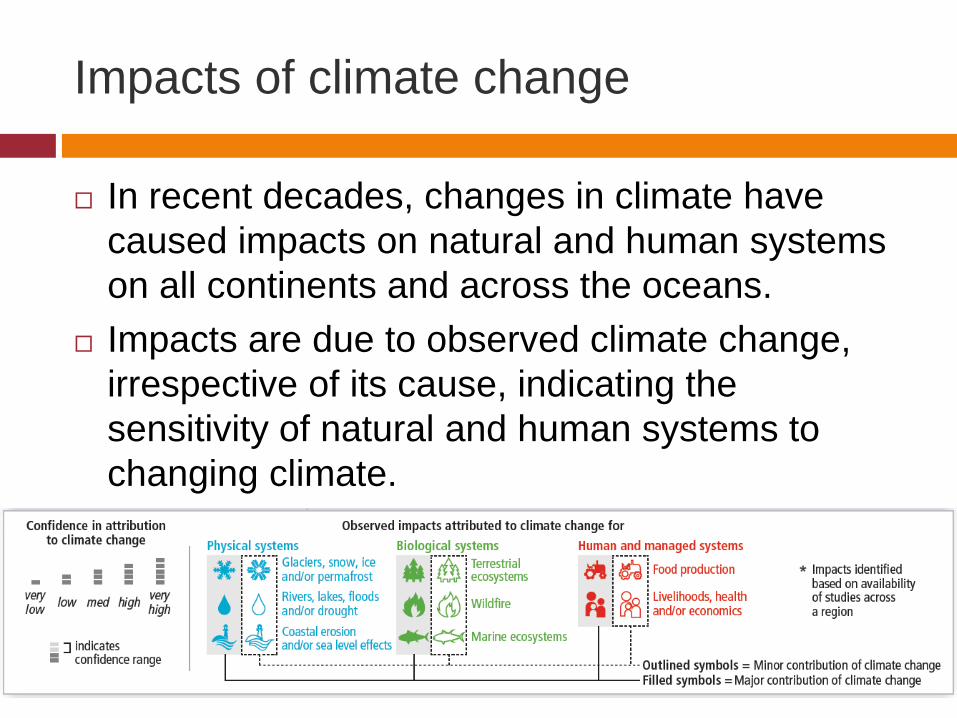
Impacts of climate change
In recent decades, changes in climate have
caused impacts on natural and human systems
on all continents and across the oceans.
Impacts are due to observed climate change,
irrespective of its cause, indicating the
sensitivity of natural and human systems to
changing climate.

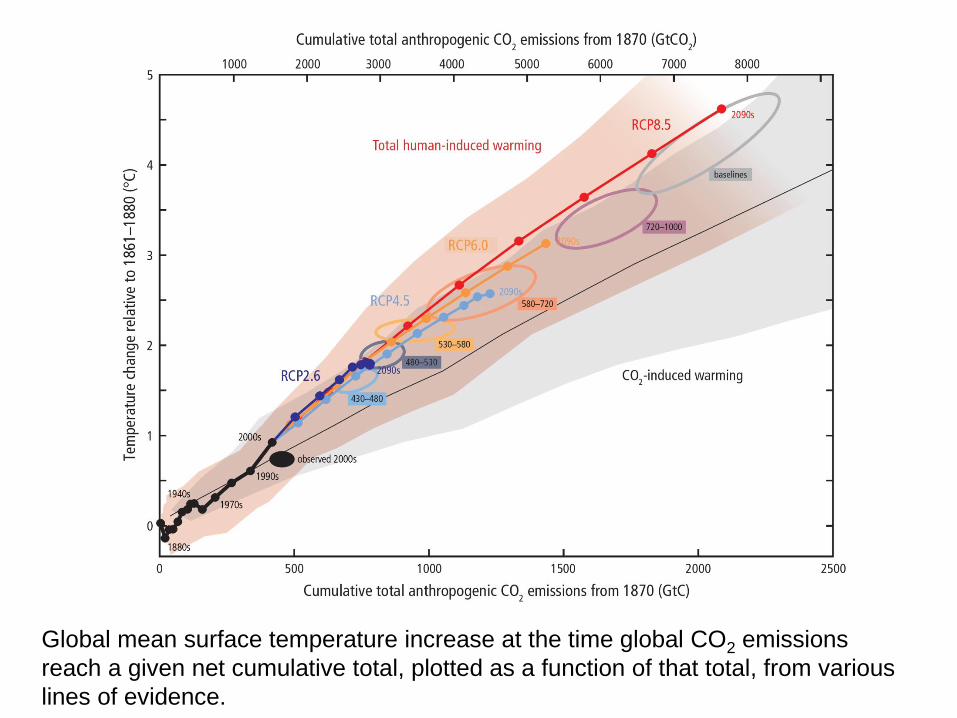
Global mean surface temperature increase at the time global CO2 emissions
reach a given net cumulative total, plotted as a function of that total, from various
lines of evidence.
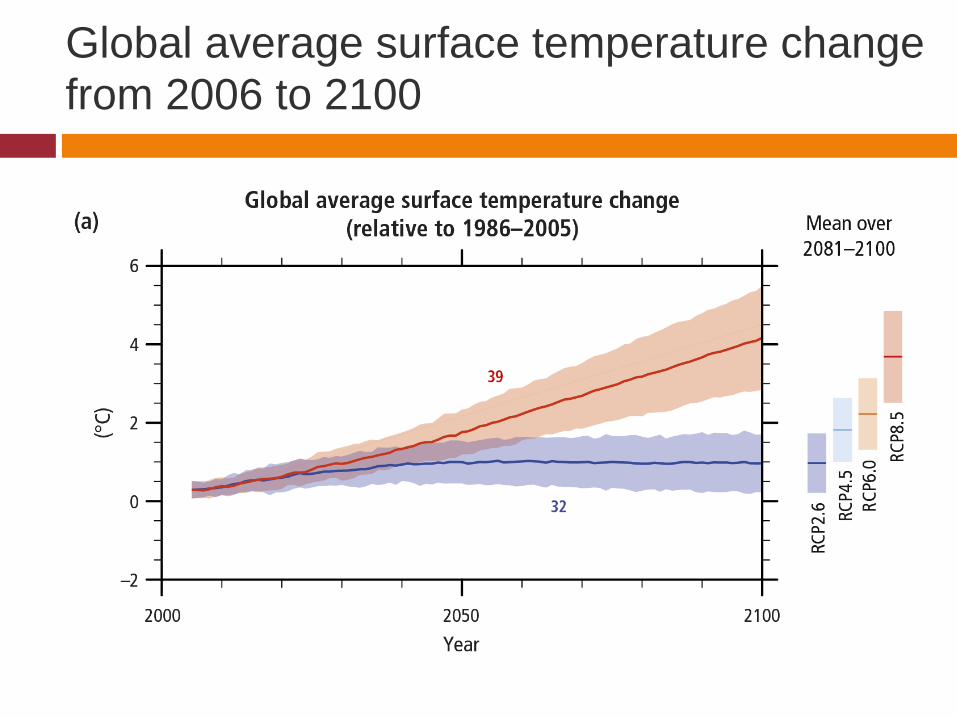
Global average surface temperature change
from 2006 to 2100

Global mean sea level rise from 2006 to 2100

Projected changes in the climate system

Future risks and impacts caused by a
changing climate
Risk of climate-related impacts results from the
interaction of climate-related hazards (including
hazardous events and trends) with the vulnerability and
exposure of human and natural systems, including their
ability to adapt.
Rising rates and magnitudes of warming and other
changes in the climate system, accompanied by ocean
acidification, increase the risk of severe, pervasive and
in some cases irreversible detrimental impacts.
Some risks are particularly relevant for individual regions
while others are global as shown in diagram in next
slide.


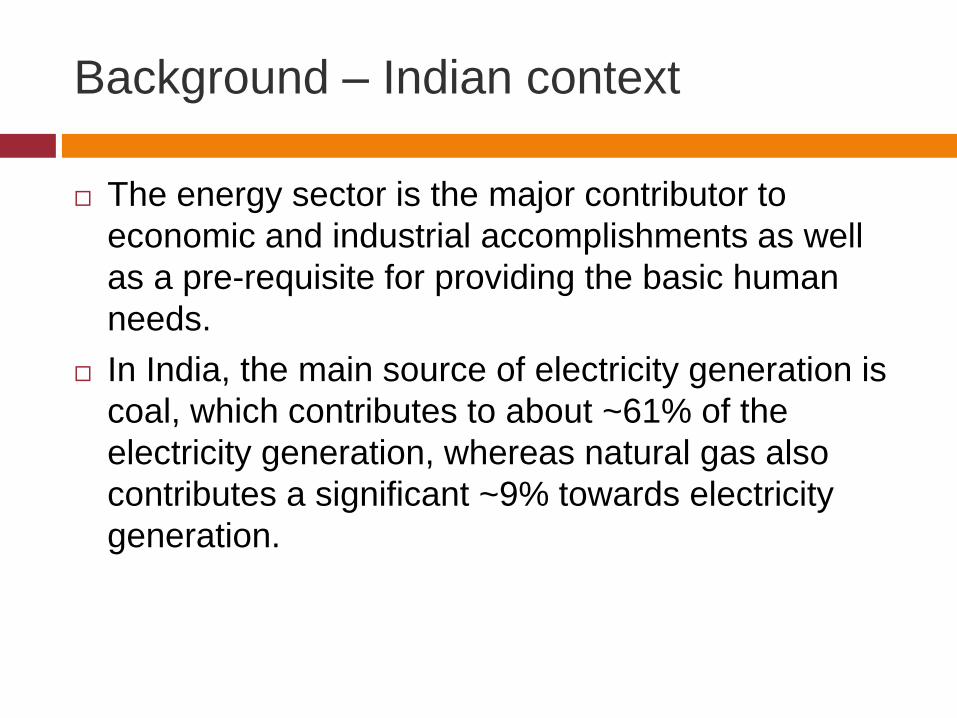
Background – Indian context
The energy sector is the major contributor to
economic and industrial accomplishments as well
as a pre-requisite for providing the basic human
needs.
In India, the main source of electricity generation is
coal, which contributes to about ~61% of the
electricity generation, whereas natural gas also
contributes a significant ~9% towards electricity
generation.

Total Installed Capacity - As on 31.01.2016
Coal61%Gas
9%Oil0%
Hydro15%
Nuclear2%
RES(MNRE)13%

Classifying the impacts of energy use
By source
For example, oil, natural gas, coal, nuclear power, biomass, hydroelectricity etc.
By pollutant
Pb, CO, Nox, SOx, RSPM (PM1, PM2.5 and PM10), SPM, HC, VOC, CH4 etc.
By scale
Household scale
wood burning in developing countries
Workplace scale
Biomass harvesting and forestry
Hydro and wind power
Coal, oil and gas
Nuclear power
Community scale
Sulphur dioxide, NOx, CO, Dioxins etc.
Regional scale
Acid deposition
Global scale
Global climate change

Impact on human health

The impact pathway approach

PM2.5 (2031: Winter)PM2.5 (2011: Winter)
By 2011/12, most cities in the country had already exceeded the ambient air quality standard
• In 2011/12 mortality from PM 2.5 was 5.73 lakhs
• In future, the air quality worsens increasing the mortality to 10.4 lakhs (2031/32)
Source: TERI’s Integrated MARKAL, WRF, CMAQ Models Results
24
Regional scale air quality in India -2011 and
projections for Reference Scenario 2031

Mortality due to PM2.5 under various
policy intervention's/scenarios
0.0
0.2
0.4
0.6
0.8
1.0
1.2
1.4
1.6
1.8
2.0
BAU 2011 BAU 2031 BAU 2051 ES 2031 ES 2051 CS 2031 CS2051
Mo
rtality
in
millio
ns

Case study
Examples from thermal power

Life cycle assessment -
a case study of thermal power plant

Methodology
The CML 2001 and Eco-Indicator 99 (H) methods have
been used for midpoint and endpoint impacts,
respectively using life cycle analysis (LCA).
This study uses ISO 14040 methodology along with
‘cradle to gate’ approach which includes upstream and
power generation processes.
The primary data collected by personal visits for air
emissions, wastewater, fuel used, and technical
specifications.
The impacts category comprised of global warming,
acidification, eutrophication, ecotoxicity, carcinogens,
respiratory organics, respiratory inorganics and climate
change.

Environmental impact assessment
Source: Eco indicator 1999-H method would be used for environmental impact assessment using LCA approach

LCA framework used
to estimate the life
cycle environmental
impacts from NGCC
thermal power plant
Source: Agrawal, K., Jain, S., Jain, A.K.,
Dahiya, S., 2014. Assessment of
Environmental Impacts of Natural Gas
Combined Cycle Power Plant using life cycle
approach. Environmental Development ,
doi.org/10.1016/j.envdev.2014.04.002

Boundary conditions

Boundary conditions

Boundary conditions

Boundary conditions

Global warming and climate change
potential - NGCC thermal power plant
0.00
0.05
0.10
0.15
0.20
0.25
0.30
0.35
0.40
0.45
0.50
Combustion process Remaining process
GW
P (
kg C
O2 e
q./
kW
h)
(a) Global Warming Potential (CML)
0.0E+00
2.0E-08
4.0E-08
6.0E-08
8.0E-08
1.0E-07
1.2E-07
Combustion process Remaining process
CC
P (
DA
LY
/kW
h)
(b) Climate Change potential (Eco-Indicator)

Human health damage potential - NGCC
0
0.005
0.01
0.015
0.02
0.025
0.03
0.035
0.04
Combustion process Remaining processes
HT
P (
kg
1,4
-DB
eq
./k
Wh
)
(a) Human Toxicity potential (CML 2001)
5.08E-08
5.1E-08
5.12E-08
5.14E-08
5.16E-08
5.18E-08
5.2E-08
Combustion process Remaining processes
Res
pir
ato
ry i
no
rga
nic
s (D
AL
Y/k
Wh
)
(c) Respiratory Inorganics potential
(Eco-Indicator-99)
0
5E-11
1E-10
1.5E-10
2E-10
2.5E-10
3E-10
3.5E-10
4E-10
Combustion process Remaining processes
Res
pir
ato
ry o
rga
nic
s (D
AL
Y/k
Wh
)
(d) Respiratory Organics potential
(Eco-Indicator-99)
0
5E-10
1E-09
1.5E-09
2E-09
2.5E-09
3E-09
Combustion process Remaining processes
CP
(D
AL
Y/k
Wh
)
(b) Carcinogens potential (Eco-Indicator-99)
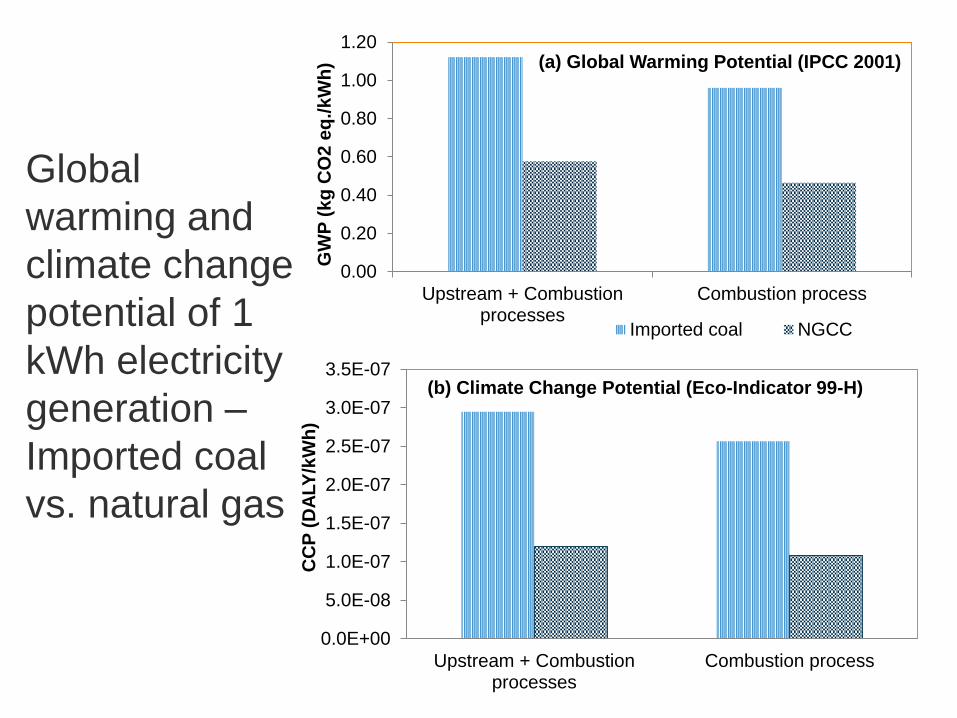
Global
warming and
climate change
potential of 1
kWh electricity
generation –
Imported coal
vs. natural gas
0.00
0.20
0.40
0.60
0.80
1.00
1.20
Upstream + Combustionprocesses
Combustion process
GW
P (
kg
CO
2 e
q./
kW
h) (a) Global Warming Potential (IPCC 2001)
Imported coal NGCC
0.0E+00
5.0E-08
1.0E-07
1.5E-07
2.0E-07
2.5E-07
3.0E-07
3.5E-07
Upstream + Combustionprocesses
Combustion process
CC
P (
DA
LY
/kW
h)
(b) Climate Change Potential (Eco-Indicator 99-H)
0
0.02
0.04
0.06
0.08
0.1
0.12
0.14
0.16
Total of all processes Combustion process
kg
1,4
-DB
eq
.
(a) Human Toxicity Impacts (CML 2001)
Coal TPP with FGD Coal TPP without FGD Natural Gas TPP
0.0E+00
5.0E-11
1.0E-10
1.5E-10
2.0E-10
2.5E-10
3.0E-10
3.5E-10
4.0E-10
4.5E-10
Total of all processes Combustion process
DA
LY
(c) Respiratory Organic Impacts (Eco-Indicator 99-H)
Coal TPP with FGD Coal TPP without FGD Natural Gas TPP
0.0E+00
2.0E-08
4.0E-08
6.0E-08
8.0E-08
1.0E-07
1.2E-07
1.4E-07
Total of all processes Combustion process
DA
LY
(d) Carcinogenic Impacts (Eco-Indicator99-H)
Coal TPP with FGD Coal TPP without FGD Natural Gas TPP
0.0E+00
3.0E-07
6.0E-07
9.0E-07
1.2E-06
1.5E-06
1.8E-06
Total of all processes Combustion process
DA
LY
(b) Respiratory Inorganics Impacts (Eco-Indicator 99-H)
Coal TPP with FGD Coal TPP without FGD Natural Gas TPP
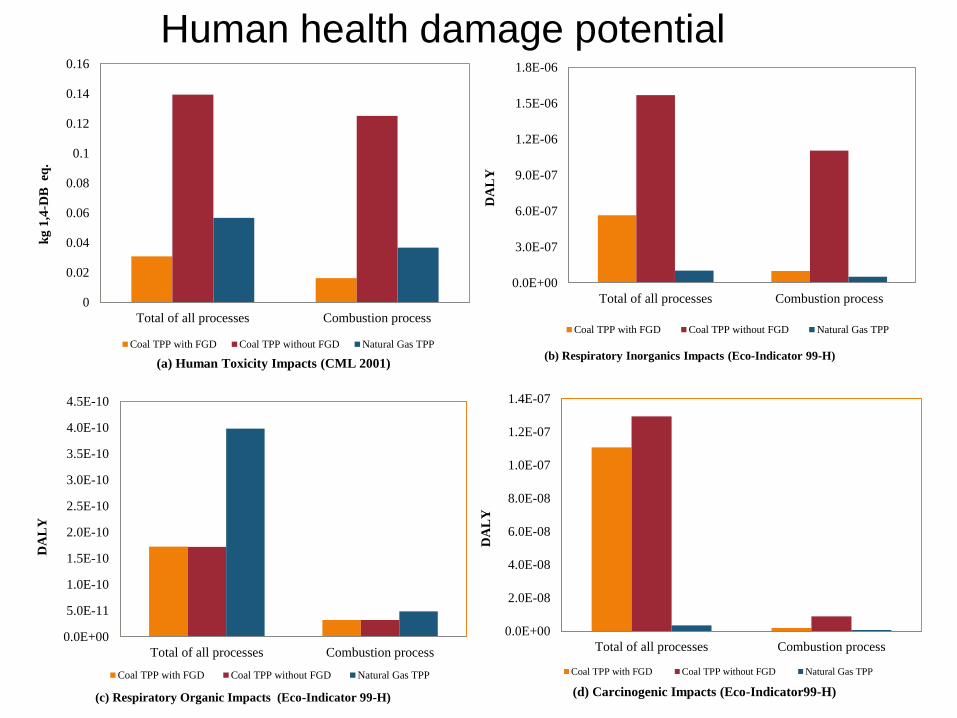
Human health damage potential

0.E+00
2.E-03
4.E-03
6.E-03
8.E-03
1.E-02
1.E-02
1.E-02
2.E-02
Total of all processes Combustion process
kg
SO
2 e
q.
(a) Acidification Impacts (CML 2001)
0.E+00
2.E-04
4.E-04
6.E-04
8.E-04
1.E-03
1.E-03
1.E-03
Total of all processes Combustion process
kg
PO
4 e
q.
(b) Eutrophication Impacts (CML 2001)
0.0E+00
5.0E-03
1.0E-02
1.5E-02
2.0E-02
2.5E-02
3.0E-02
3.5E-02
4.0E-02
Total of all processes Combustion process
PD
F×
m2
×yr
(c) Acidification/ Eutrophication Impacts (Eco-Indicator 99-H)
Coal TPP with FGD
Coal TPP without FGD
Natural Gas TPP
0.E+00
2.E-02
4.E-02
6.E-02
8.E-02
1.E-01
1.E-01
1.E-01
2.E-01
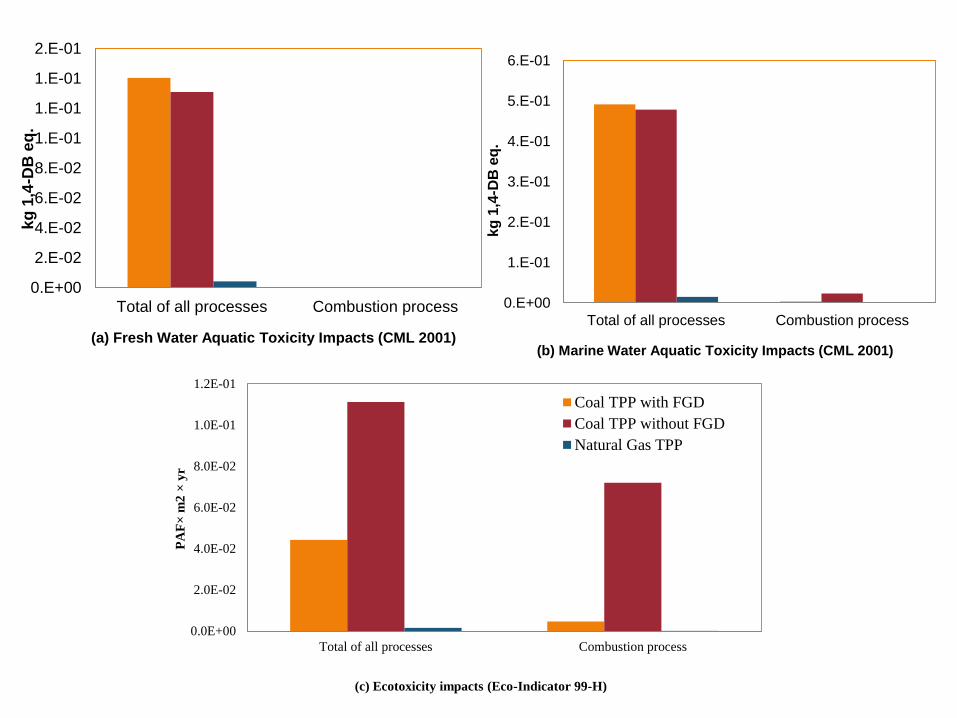
Total of all processes Combustion process
kg
1,4
-DB
eq
.
(a) Fresh Water Aquatic Toxicity Impacts (CML 2001)
0.E+00
1.E-01
2.E-01
3.E-01
4.E-01
5.E-01
6.E-01
Total of all processes Combustion process
kg
1,4
-DB
eq
.
(b) Marine Water Aquatic Toxicity Impacts (CML 2001)
0.0E+00
2.0E-02
4.0E-02
6.0E-02
8.0E-02
1.0E-01
1.2E-01
Total of all processes Combustion process
PA
F×
m2
×y
r
(c) Ecotoxicity impacts (Eco-Indicator 99-H)
Coal TPP with FGD
Coal TPP without FGD
Natural Gas TPP
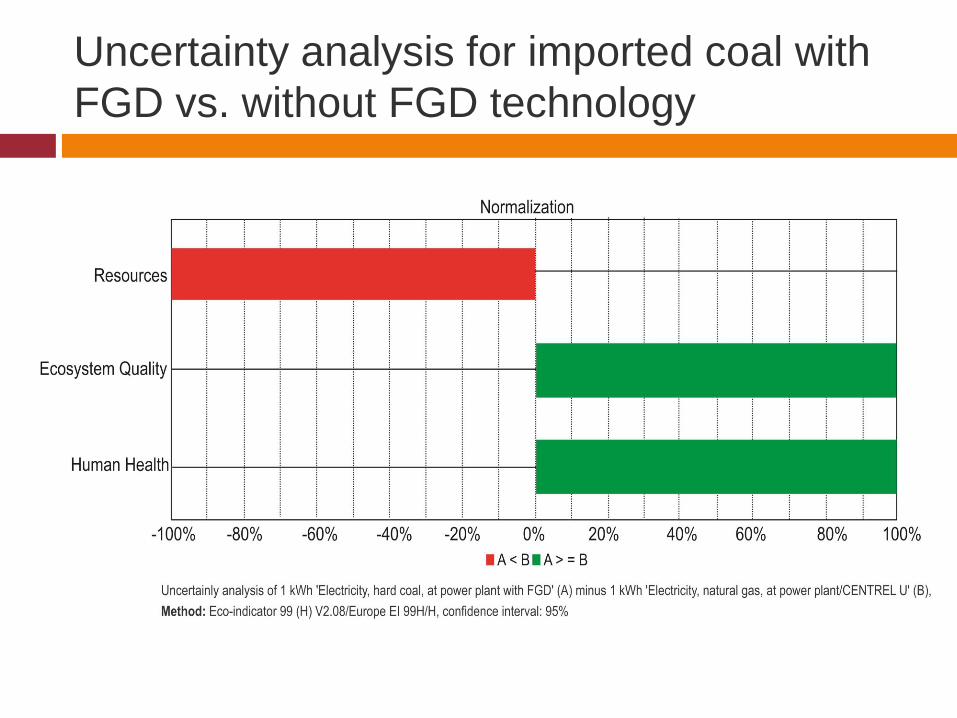
Uncertainty analysis for imported coal with
FGD vs. without FGD technology
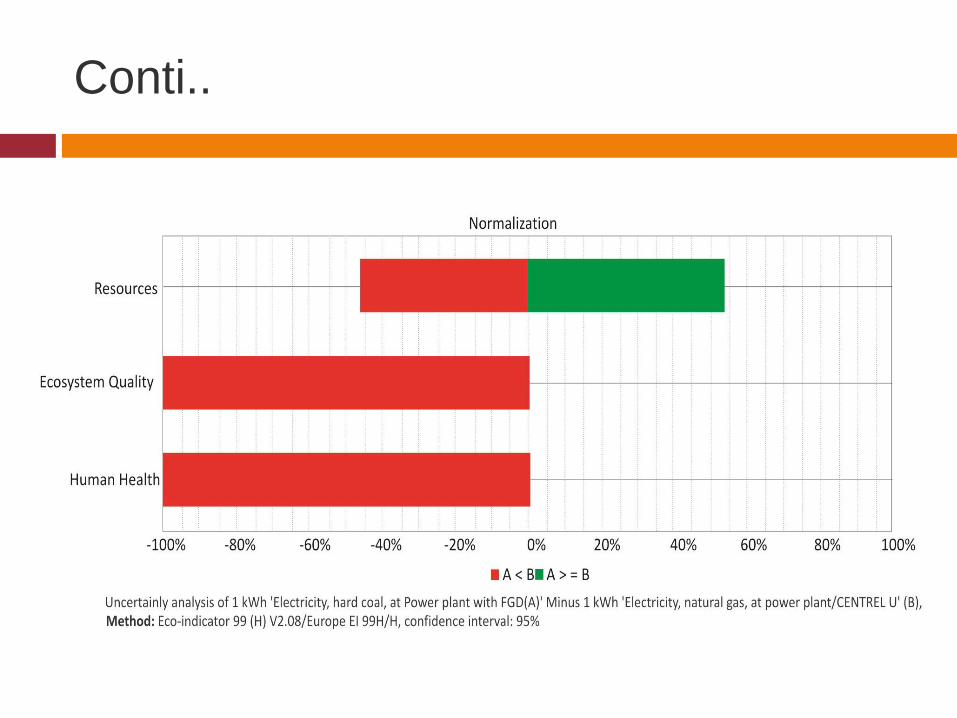
Conti..

Cost analysis
Parameter Units Coal based TPP Gas based TPP
Fixed Cost Rs/kWh 1.55 1.54
Variable Cost Rs/kWh 2.11 3.09
Total Cost Rs/kWh 3.66 4.63
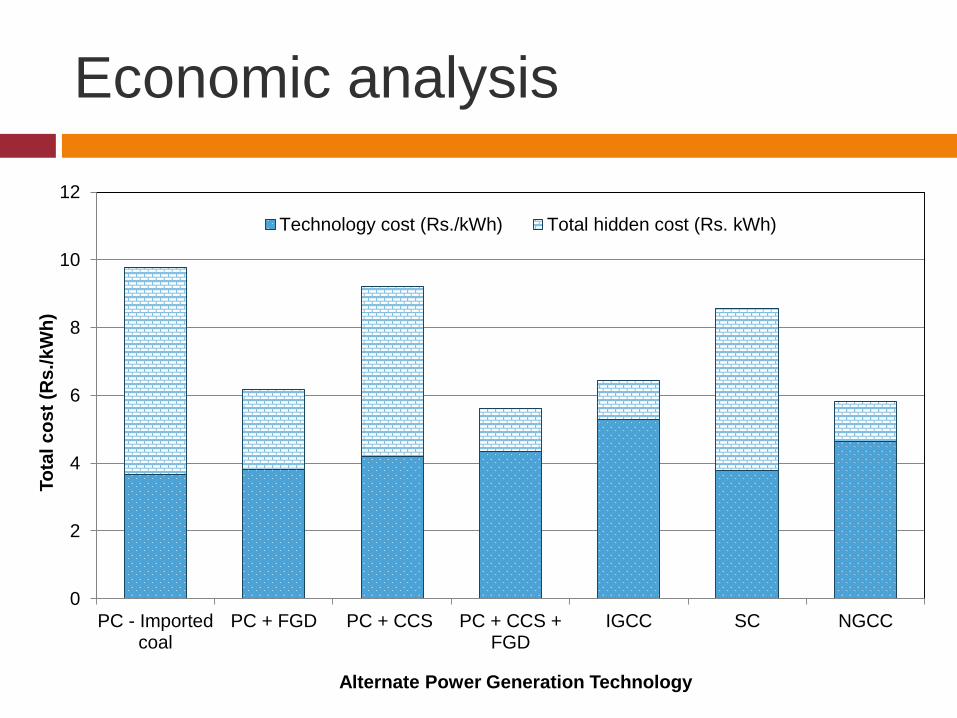
Economic analysis
0
2
4
6
8
10
12
PC - Importedcoal
PC + FGD PC + CCS PC + CCS +FGD
IGCC SC NGCC
To
tal c
os
t (R
s./
kW
h)
Alternate Power Generation Technology
Technology cost (Rs./kWh) Total hidden cost (Rs. kWh)

The twin problems that India's thermal
power sector must overcome
India has around 20 coal-fired thermal plants with capacities
of 2000 MW or above while the average energy efficiency of
these plants is a mere 32.8 percent (CSE)
The average CO2 emission of these plants was 1.08 kg per
kWh, which was 14% higher than China's
Some of India's power plants emit up to 120 percent more
CO2 than the average emissions by plants in European
countries.
Thermal power plants have historically accounted for 88
percent of water consumed by all industry sectors put
together (TERI)
Source: The twin problems that India's thermal power sector must overcome
http://economictimes.indiatimes.com/articleshow/51056423.cms?utm_source=contentofinterest&utm_
medium=text&utm_campaign=cppst

New emission norms to raise power
cost by 10 per cent
The environment ministry notified new
standards for thermal power stations
relating to consumption of water, PM, SO2,
NOx and mercury
New emission norms for thermal power
plants are likely to increase NTPC's cost of
producing power by 10 per cent
The cost of power production would
increase by Rs 50 lakh per Mw. The
current cost of power production is Rs 5
crore per Mw. This translates into a 50-60
paise increase in the final customer tariff
Other Industry estimates cost escalation
of Rs 1.5 crore per Mw and tariff hike of 80
paisa per unit
Source: Emission norms to raise NTPC power cost by 10 per cent - http://www.business-standard.com/article/companies/emission-
norms-to-raise-ntpc-power-cost-by-10-per-cent-116022000026_1.html
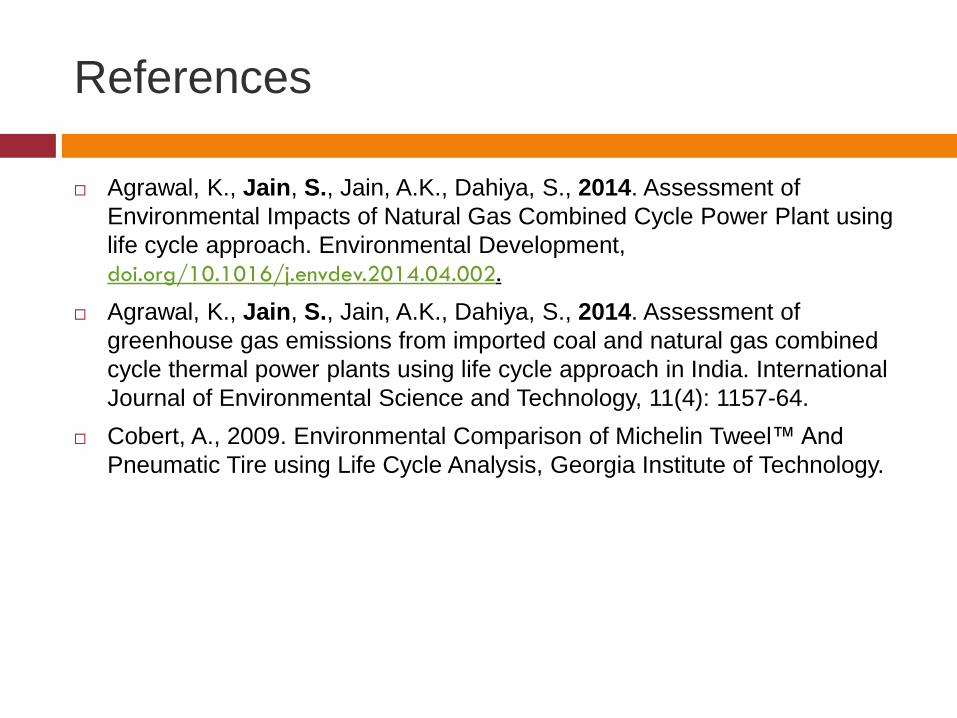
References
Agrawal, K., Jain, S., Jain, A.K., Dahiya, S., 2014. Assessment of
Environmental Impacts of Natural Gas Combined Cycle Power Plant using
life cycle approach. Environmental Development,
doi.org/10.1016/j.envdev.2014.04.002.
Agrawal, K., Jain, S., Jain, A.K., Dahiya, S., 2014. Assessment of
greenhouse gas emissions from imported coal and natural gas combined
cycle thermal power plants using life cycle approach in India. International
Journal of Environmental Science and Technology, 11(4): 1157-64.
Cobert, A., 2009. Environmental Comparison of Michelin Tweel™ And
Pneumatic Tire using Life Cycle Analysis, Georgia Institute of Technology.
Bibliography
http://www.slideshare.net/sandeep7162/analysis-of-environmental-
impact-on-oil-gas-company?related=1
http://www.eia.gov/todayinenergy/detail.cfm?id=18491

Case study
Impacts from transport sector


Introduction
• Nine districts spread in an area of 1483 square kilometers (in 2011)
• Population is 16.75 million (2011) and projected to grow up to 23 million by 2020
• Largest road network with 7.49 million registered vehicles
• Current traffic volume 182.7 million PKM and projected to increase up to 280.9 million by 2021
Urbanization & transportation in Delhi
• Automobiles cause 66% of total transport-based carbon emissions in Delhi
• Ambient air pollutants from automobile violates NAAQS reflecting poor air quality and deteriorating human health
• Policy interventions till date focus more on controlling the ambient air emissions; while, the impact of urban transport on climate remains unrecognized (Aggarwal and Jain, 2014)
Energy demand and CO2 emissions

Scope of work & objectives
Inventorizing and
characterizing on-road
vehicle activity
Energy demand modeling
Carbon emission
accounting
Future policy intervention
using Scenario Analysis
To assess the impact of transport policy
interventions on energy demand and carbon
emission in Delhi region; using ASIF energy
modelling and scenario analysis approach
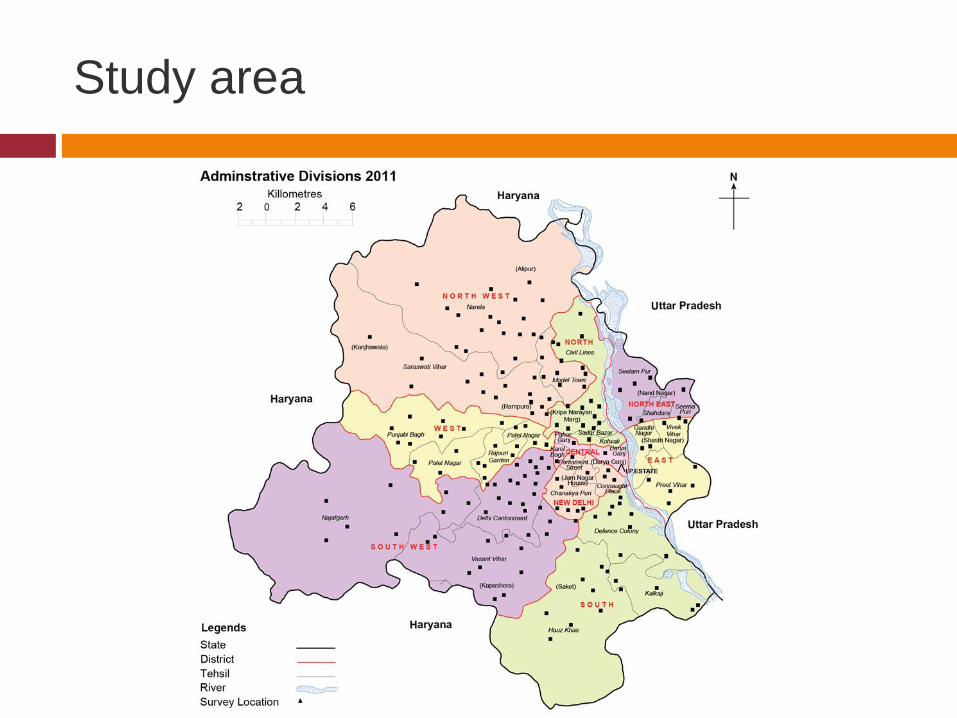
Study area

ASI and ASF framework for estimation
of energy demand and CO2 emissions
Where, EEnergy is energy demand from all modes of transport; ECO2-emissionis CO2 emission load from all modes of transport;
‘k’ represents mode-type (scooter, motorcycle, cars, auto, bus and Delhi metro); ‘j’ represents vehicle technology (2/4
stroke); ‘i’ represents fuel type (gasoline/diesel/CNG); represents travel demand activity (in km); represents modal
structure (in percentage); represents vehicle mileage by mode and fuel type (km/kg or km/l); represents fuel-based
calorific value (MJ/kg or MJ/l); represents CO2emission factor (g/km).
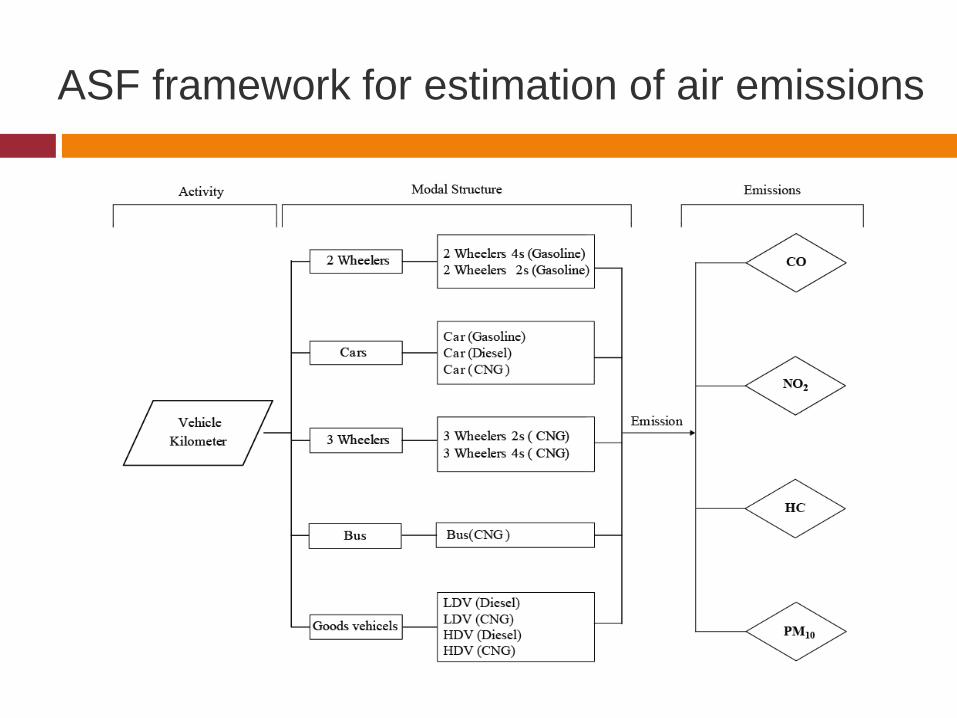
ASF framework for estimation of air emissions

According to the ASIF framework
E = A x S x I x F
A is activity level expressed as total travel demand in passenger-kilometers
(PKM). Passenger-kilometer demand by each mode has been estimated using
vehicle kilometers (VKM) travelled and occupancy of each mode.
VKM = Total number of vehicles in each mode x Average vehicle utilization
Travel demand = ∑ PKM = ∑ VKM x Occupancy
S stands for structure, which is the modal split of travel demand.
I is energy intensity i.e. energy consumed per passenger kilometer. Energy
intensity depends upon occupancy and fuel efficiency of the mode.
I = 1/(Mileage x occupancy)
F is emission factor of the fuel used.
Energy consumed in passenger transport = ∑Total passenger kilometers x Share of
each mode x Energy intensity of each mode
Total emissions resulting from passenger transport = ∑Energy consumed in
passenger transport x emission factors for each of the fuels used in different modes

Scenario analysisScenario Description and Rationale
2007-REF Lines 1 to 3 of the Delhi metro (part of IMRTS), covering a distance of 65 km are taken as
operational
2021-BAU No policy interventions except covered under 2007-REF year
BS IV was introduced in the year 2010 and others have been have been assumed in
accordance to BS III norms, respectively.
2021-ALT-I Full phase of IMRTS implementation, which includes 4 phases of Delhi metro and Bus
Rapid Transit (BRT) system, has been considered by the year 2021 (see SI Table S.3), in
addition to the assumptions taken in 2021-BAU.
2021-ALT-II Two interventions have been added to the 2021-ALT-I scenario, in addition to the
assumptions taken in 2021-BAU –
(i) bus speed has been regulated to 25 km h–1 because of new infrastructural development
for dedicated bus corridors, and (ii) parking fees has been hiked (from Rs. 10-20 to Rs. 60-
200) for private vehicles.
2021-ALT-III One intervention have been added to 2021-ALT-II scenario, in addition to the assumptions
taken in 2021-BAU –
(i) Fuel economy standards have been implemented for gasoline and diesel cars in India,
by 2017 (as proposed by EU).
2021-ALT-IV One intervention have been added to 2021-ALT-II scenario, in addition to the assumptions
taken in 2021-BAU –
(i) Occupancy for two-wheelers has been increased from 1.2 to 1.5 and for car will
increase from 1.8 to 3.

Energy and CO2 emission in 2021 (BAU & ALT)
• Energy demand reduced from 65.4 billion MJ to 44.6 billion MJ (32% reduction)
• CO2 emission reduced from 4.1 million tons to 2.9 million tons
0%
25%
50%
75%
100%
125%
2021-BAU 2021-ALT-I 2021-ALT-II 2021-ALT-III 2021-ALT-IV
% c
hange in E
nerg
y a
nd C
O2
2021 Scenarios
Energy CO2

Private and public share in 2021 (ALT scenario)
0%
20%
40%
60%
80%
100%
2021-ALT-I 2021-ALT-II 2021-ALT-III 2021-ALT-IV
% c
hange in E
nerg
y a
nd C
O2
2021 Scenario
Energy-Private Energy-Public CO2-Private CO2-Public

Fuel and CNG usage in 2007 and 2021 (All scenario)
• 48% reduction in fuel demand in 2021-ALT-IV
• Demand for electricity increased by 71%
0
1
2
3
4
5
6
7
0
5
10
15
20
25
30
35
40
45
50
2007-REF 2021-BAU 2021-ALT-I 2021-ALT-II 2021-ALT-III 2021-ALT-IV
Die
se
l (i
n litre
) a
nd
Ele
ctr
icity (
in M
J)*
Gaso
line
(in
litre
) a
nd
CN
G (
in k
g)*
Gasoline (l) CNG (kg) Diesel (l) Electricity (kWh)

Overall Methodology
for Integrated Impact
Assessment

Annual emissions from passenger
transport under different scenarios
0
100
200
300
400
500
600
0
5
10
15
20
25
30
2007-BASE 2021-BAU 2021-ALT-I 2021-ALT-II 2021-ALT-III
PM
10 (
in t
ons/y
ear)
Em
issio
ns (
in thou
sands tons/y
ear)
CO HC NO2 PM10

3a. CO concentration in 2007 and 2021
2007-BASE 2021-BAU 2021-ALT-I 2021-ALT-II 2021-ALT-
III
2007-BASE 2021-BAU 2021-ALT-I 2021-ALT-II 2021-ALT-III
2007-BASE 2021-BAU 2021-ALT-I 2021-ALT-II 2021-ALT-
III
3b. NO2 concentration in 2007 and 2021
3c. PM10 concentration in 2007 and 2021
Imp
act
on
urb
an
air
qu
ali
ty
5a. CO concentration in 2007 and 2021
2007-BASE-O 2021-BAU-O 2021-ALT-I-O 2021-ALT-II-O 2021-ALT-III-O
5b. NO2 concentration in 2007 and 2021
2007-BASE-O 2021-BAU-O 2021-ALT-I-O 2021-ALT-II-O 2021-ALT-III-O
5c. PM10 concentration in 2007 and 2021
2007-BASE-O 2021-BAU-O 2021-ALT-I-O 2021-ALT-II-O 2021-ALT-III-O 2021-ALT-IV-O

Air quality and health impact of surface
transport in NCTD region
Modes of Transport POLICY SCENARIOS
Passenger 2007-BASE 2021-BAU 2021-ALT-I 2021-ALT-II 2021-ALT-III
NO2 Annual Conc. (μg/m3) 10 13 8 7 8
MortalityRespiratory 4 (4, 0.3) 8 (8, 0.5) 5 (5, 0.3) 4 (4, 0.3) 4 (5, 0.3)
Cardiovascular 24 (25, 2) 47 (49, 3) 29 (30, 2) 26 (27, 2) 27 (28, 2)
Morbidity
Respiratory - - - - -
Cardiovascular24213 (25244,
1849)
46232 (48217,
3395)
29114 (30383,
2108)
25831 (26961,
1866)
27119 (28304,
1961)
DALY
Respiratory 112 (117, 8) 215 (225, 15) 134 (140, 9) 118 (123, 8) 124 (130, 9)
Cardiovascular25721 (26817,
1963)
49124 (51235,
3604)
30923 (32272,
2238)
27434 (28635,
1981)
28803 (30062,
2081)
PM2.5 Annual Conc. (μg/m3) 0.46 0.36 0.22 0.15 0.15
MortalityRespiratory 136 (142, 8) 155 (162, 9) 96 (100, 5) 85 (88, 5) 65 (68, 4)
Cardiovascular 17 (18, 1) 19 (20, 1) 12 (12, 1) 10 (11, 1) 8 (8, 0.5)
MorbidityRespiratory
1073 (1120,
64)
1225 (1278,
75)754 (787, 43) 667 (697, 38) 516 (539, 29)
Cardiovascular 866 (904, 52) 989 (1032, 60) 609 (636, 35) 539 (563, 31) 417 (435, 24)
DALY
Respiratory5210 (5437,
310)
5949 (6207,
363)
3663 (3825,
209)
3243 (3386,
185)
2510(2621,
143)
Cardiovascular1370 (1430,
82)
1564 (1632,
95)963 (1005, 55) 852 (890, 48)
660 (689,
38)


Diurnal variation in PM2.5 concentration
at Punjabi Bagh station
100
200
300
400
PM
2.5
(µg/m
3)
0.0
0.5
1.0
1.5
2.0
2.5
WS (
m/s
)
5
10
15
20
25
Tem
p. (°
C)
20
40
60
80
00:0
0
02:0
0
04:0
0
06:0
0
08:0
0
10:0
0
12:0
0
14:0
0
16:0
0
18:0
0
20:0
0
22:0
0
00:0
0
02:0
0
04:0
0
06:0
0
08:0
0
10:0
0
12:0
0
14:0
0
16:0
0
18:0
0
20:0
0
22:0
0
00:0
0
02:0
0
04:0
0
06:0
0
08:0
0
10:0
0
12:0
0
14:0
0
16:0
0
18:0
0
20:0
0
22:0
0
00:0
0
02:0
0
04:0
0
06:0
0
08:0
0
10:0
0
12:0
0
14:0
0
16:0
0
18:0
0
20:0
0
22:0
0
RH
(%
)
Pre-scheme Post-schemeDuring-scheme
Low PM2.5
High Wind Speed
High PM2.5
Low Wind Speed
Low RH High RH
Source: SEAR, 2016
GOAL
OUTCOMES
IMPROVE
AIR QUALITY
Reduction in
Travel Time
by 25%
Avoided
Emissions
from Traffic
Fuel
Savings
Reduction in
GHG
Emissions
Increased
level of
awareness
3 tonnes of
PM
71 tonnes
of NO2
118 tonnes
of HCs
12,763 kL of
Gasoline
1951 kL of
Diesel
52,931 tonnes
of CNG 282 tonnes
of CO
35,253 tonnes of
CO2eq
Source: SEAR, 2016


Video and latest news web-links
The End of Coal?
http://www.abc.net.au/4corners/stories/2015/06/15/4253096.htm
Linc Energy: Secret report reveals toxic legacy of coal gasification trials near SE
Queensland town of Chinchilla Exclusive by the National Reporting Team's Mark
Solomons and Mark Willacy – available at: http://www.abc.net.au/news/2015-
08-10/linc-energy-secret-report-reveals-toxic-chemical-risk/6681740
Coal Fired Power Plant - https://www.youtube.com/watch?v=rEJKiUYjW1E
Stricter Norms A Costly Affair for Power Players
http://www.newindianexpress.com/states/odisha/Stricter-Norms-A-Costly-Affair-
for-Power-Players/2016/02/19/article3285355.ece
Climate Change 2014: The State of the Science, IGBP https://www.youtube.com/watch?v=jdN9IJQssKE
Top 6 Climate Change Problems
https://www.youtube.com/watch?v=4Ew05sRDAcU
Bibliography
The Finance minister Arun Jaitley in his budget speech in support of an additional cess of Rs 100 per tonne on coal that will be used to invest in clean generation." Source: http://www.dnaindia.com/india/report-moef-issues-new-draft-
emission-norms-for-coal-based-thermal-power-plants-2087316
Pachauri, R. K. , Allen, M. R. , Barros, V. R. , Broome, J. , Cramer, W. , Christ, R. , Church, J. A. , Clarke, L. , Dahe, Q. , Dasgupta, P. , Dubash, N. K. , Edenhofer, O. , Elgizouli, I. , Field, C. B. , Forster, P. , Friedlingstein, P. , Fuglestvedt, J. , Gomez-Echeverri, L. , Hallegatte, S. , Hegerl, G. , Howden, M. , Jiang, K. , Jimenez Cisneroz, B. , Kattsov, V. , Lee, H. , Mach, K. J. , Marotzke, J. , Mastrandrea, M. D. , Meyer, L. , Minx, J. , Mulugetta, Y. , O'Brien, K. , Oppenheimer, M. , Pereira, J. J. , Pichs-Madruga, R. , Plattner, G. K. , Pörtner, H. O. , Power, S. B. , Preston, B. , Ravindranath, N. H. , Reisinger, A. , Riahi, K. , Rusticucci, M. , Scholes, R. , Seyboth, K. , Sokona, Y. , Stavins, R. , Stocker, T. F. , Tschakert, P. , van Vuuren, D. and van Ypserle, J. P. (2014): Climate Change 2014: Synthesis Report. Contribution of Working Groups I, II and III to the Fifth Assessment Report of the Intergovernmental Panel on Climate Change / R. Pachauri and L. Meyer (editors) , Geneva, Switzerland, IPCC, 151 p., ISBN: 978-92-9169-143-2