entropyexplorer: an r package for computing and … · for computing and comparing differential...
TRANSCRIPT
Wang et al. BMC Res Notes (2015) 8:832 DOI 10.1186/s13104-015-1786-4
TECHNICAL NOTE
EntropyExplorer: an R package for computing and comparing differential Shannon entropy, differential coefficient of variation and differential expressionKai Wang1, Charles A. Phillips1*, Arnold M. Saxton2 and Michael A. Langston1
Abstract
Background: Differential Shannon entropy (DSE) and differential coefficient of variation (DCV) are effective met-rics for the study of gene expression data. They can serve to augment differential expression (DE), and be applied in numerous settings whenever one seeks to measure differences in variability rather than mere differences in magni-tude. A general purpose, easily accessible tool for DSE and DCV would help make these two metrics available to data scientists. Automated p value computations would additionally be useful, and are often easier to interpret than raw test statistic values alone.
Results: EntropyExplorer is an R package for calculating DSE, DCV and DE. It also computes corresponding p values for each metric. All features are available through a single R function call. Based on extensive investigations in the litera-ture, the Fligner-Killeen test was chosen to compute DCV p values. No standard method was found to be appropriate for DSE, and so permutation testing is used to calculate DSE p values.
Conclusions: EntropyExplorer provides a convenient resource for calculating DSE, DCV, DE and associated p values. The package, along with its source code and reference manual, are freely available from the CRAN public repository at http://cran.r-project.org/web/packages/EntropyExplorer/index.html.
Keywords: Differential Shannon entropy, Differential coefficient of variation, Differential expression, Statistical tests
© 2015 Wang et al. This article is distributed under the terms of the Creative Commons Attribution 4.0 International License (http://creativecommons.org/licenses/by/4.0/), which permits unrestricted use, distribution, and reproduction in any medium, provided you give appropriate credit to the original author(s) and the source, provide a link to the Creative Commons license, and indicate if changes were made. The Creative Commons Public Domain Dedication waiver (http://creativecommons.org/publicdomain/zero/1.0/) applies to the data made available in this article, unless otherwise stated.
BackgroundShannon entropy (SE) and coefficient of variation (CV) are used to measure the variability or dispersion of numerical data. Such variability has potential utility in numerous application domains, perhaps most notably in the analysis of high throughput biological data. Variabil-ity has been applied, for example, to study gene expres-sion data in the context of human disease [1]. Increased entropy in particular, in both gene expression and protein interaction data, has been observed to be a characteristic of cancer [2]. Numerous other examples typify the utility of entropy [3–8] and coefficient of variation [9–12].
Shannon entropy is famously rooted in information theory [13]. To avoid confusion, we emphasize that we use the term “differential entropy” to denote a difference between two Shannon entropy values. This is distinct from information-theoretic terminology, in which “differ-ential entropy” often means the entropy of a continuous, rather than a discrete, random variable [14].
We are particularly interested in differential analysis. In [15], we studied differential Shannon entropy (DSE) and differential coefficient of variation (DCV), and found them highly effective in identifying genes of potential interest not found by differential expression (DE) alone. DSE and DCV are applicable to other types of biological data as well, such as that produced by RNA-Seq technol-ogies, although the usual caveats about careful interpre-tation apply. The usefulness of DSE and DCV is of course
Open Access
BMC Research Notes
*Correspondence: [email protected] 1 Department of Electrical Engineering and Computer Science, University of Tennessee, Knoxville, TN 37996-2250, USAFull list of author information is available at the end of the article

Page 2 of 5Wang et al. BMC Res Notes (2015) 8:832
not limited to biological data. They may be applied to any numerical data for which normalized measures of differ-ential variability are relevant.
ImplementationEntropyExplorer is implemented in R [16]. All features are wrapped into a single function call, which takes as input up to eight arguments. Two of these arguments are numerical matrices, with identical labels for each row. The output is a matrix with two, three or five columns that contains in each row two SE, CV or mean values; a DSE, DCV or DE value; and/or two p values, one raw and one adjusted. Output rows can be sorted by value, raw p value or adjusted p value, and can be filtered to show only the top-ranked rows.
Permutation testing for DSE is accomplished with the help of the R function sample.int. The default number of tests to be employed is set to 1000, which the user can override. The p value for DCV is calculated by applying the Fligner-Killeen test for homogeneity of variances, implemented via the R function fligner.test, to the log-transform of the input data. The R function t.test is used to find a p value for DE. Adjusted p values are calculated using the p.adjust function in R, which provides false discovery rate and multiple testing corrections. A more thorough explanation of p value calculations is provided in the discussion section.
EntropyExplorer checks that all matrix entries are posi-tive. This is because calculations of a DSE value/p value and a DCV p value involve taking logarithms, which are undefined on data containing zeros or negative val-ues. Also, CV becomes less meaningful when means approach zero or are negative. Experimental data may be noisy, however, and so EntropyExplorer provides mecha-nisms to handle non-positive values. An optional two-value argument permits the user to add a positive bias to all elements of one or both matrices prior to performing any other calculations. The argument can also be set to make this adjustment automatically, based on the least non-positive value in each matrix.
MetricsLet x1, x2, . . . , xn represent a list of n positive numbers, and let x =
∑
n
i=1 xi denote their sum. The Shannon entropy of this list is
The coefficient of variation is
SE =−∑
n
i=1xixlog2
xix
log2 n.
CV =s
|x̄|
where x̄ = x/n is the sample mean and s =√
∑
n
i=1 (xi−x̄)2
n−1 is the sample standard deviation. Given two such lists of positive numbers with Shannon entropies SE1 and SE2 , coefficients of variation CV1 and CV2, and means x̄1 and x̄2, DSE = |SE1 − SE2|, DCV = |CV1 − CV2|, and DE = |x̄1 − x̄2|.
Shannon entropy falls in the range [0, 1]; DSE there-fore also falls in the range [0, 1]. Lower (higher) SE corre-sponds to more (less) variability. CV falls in the range [0, ∞); DCV therefore also has a range of [0, ∞).
ApplicationEntropyExplorer is invoked as follows:
EntropyExplorer(expm1, expm2, dmetric, otype, ntop, nperm, shift, padjustmethod)
We refer the reader to the reference manual, included as Additional file 1 and available on the project webpage, for a detailed description of all arguments and options. Included with the package is a sample mRNA microarray dataset, consisting of a few rows from a dataset obtained from the Gene Expression Omnibus (GEO) [17]. This dataset, GSE10810, contains case/control data on breast cancer [18]. Figures 1 and 2 provide example uses of EntropyExplorer on the full data.
DiscussionIn addition to calculating DSE, DCV and DE, Entropy-Explorer can calculate both raw and adjusted p values for each. ANOVA-based tests are the standard way to obtain differential expression p values. We therefore use a t-test for this purpose. Certainly more sophisticated methods exist. See, for example, [19, 20]. Thus, we emphasize that EntropyExplorer includes DE only as a simple, convenient and straightforward point of comparison with the other
Fig. 1 The output of EntropyExplorer on breast cancer data. The numerical matrices m1 and m2 have been read into R. The function call has specified “dse” for differential Shannon entropy, “v” for value, and 10 to return the top 10 values

Page 3 of 5Wang et al. BMC Res Notes (2015) 8:832
two metrics. For DCV p values, we observe that 11 tests of equal relative variation were compared in [21], with the conclusion that the Fligner-Killeen test [22] is usually the most appropriate. It strikes a balance between type I and type II errors, and is robust to non-normal distributions.
Obtaining reliable p values for DSE proved much more challenging. We found no known method in the literature specific to DSE p values. We therefore investigated the extent to which SE is correlated to variance. A high cor-relation would suggest that they may be proxies for each other, in which case the p value of an F-test or some deri-vation thereof might serve as suitable estimate of the DSE p value. Unfortunately, correlations between SE and vari-ance, or between SE and a function of variance, were not high enough to justify using one as a surrogate for the other. Table 1 shows the correlation between SE and vari-ance V, and between SE and the function 12 ln (2πeV ) as an attempt to linearize the relationship, using the 16 datasets from [15]. The only notably high correlation is found in the obesity dataset. The obesity data, however, contains a large number of missing values, rendering the high correlation less reliable. We conclude that standard statistical tests related to variance do not appear suitable for testing DSE.
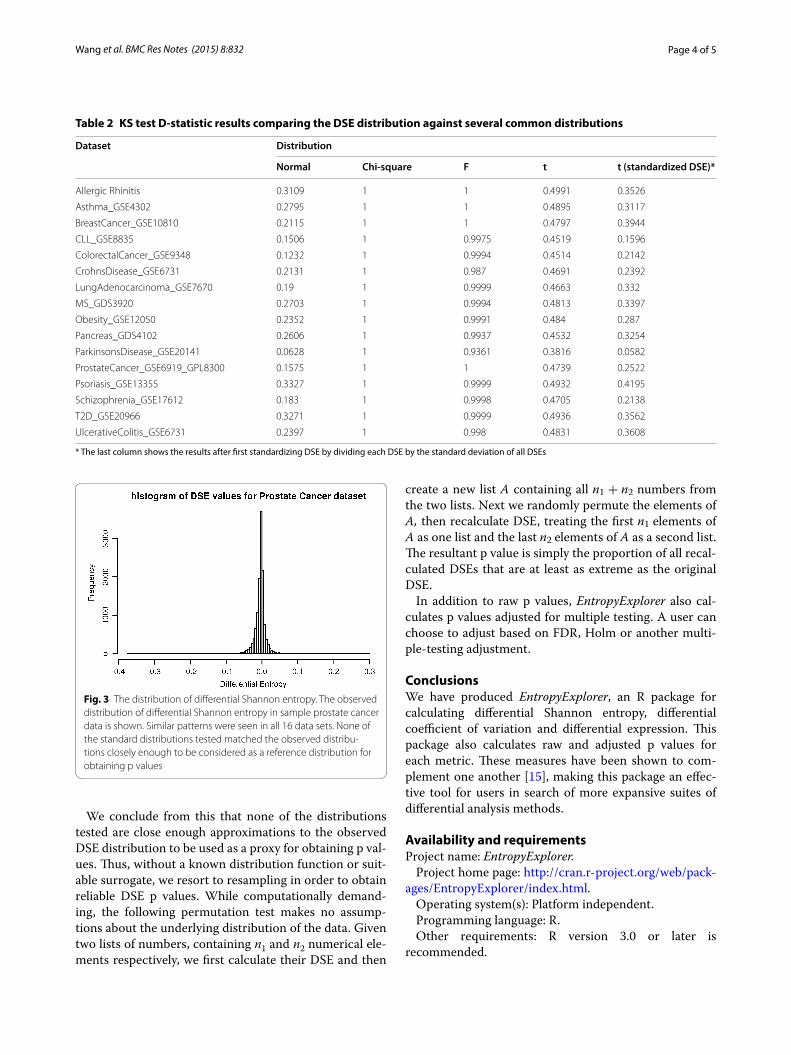
We also examined the distribution of DSE on the 16 datasets, with the goal of empirically determining a suit-able reference distribution for DSE. From this, we could then estimate p values analytically. We applied the Kol-mogorov–Smirnov (KS) test to compare the DSE dis-tribution of each dataset to some of the more common reference distributions, such as normal, F, t, and Chi square. When performing a KS test, p values can be overly sensitive to deviations from the reference distri-bution [23], so a D-statistic value below 0.1 was used to
identify matching distributions. In our experiments, only the Parkinson’s dataset produced a D-statistic below 0.1 when tested against a normal or standardized t distribu-tion (Table 2). Figure 3 shows a sample distribution of DSE, in this case using prostate cancer data.
Fig. 2 Another use of EntropyExplorer on breast cancer data. The function call has specified “dcv” for differential coefficient of variation, “bv” to specify both value and p value, and to sort by value, and 12 to return the top 12 rows
Table 1 Correlations between SE and variance, and between SE and 1
2ln (2πeV), on 16 microarray gene
expression datasets
Datasets Correlation Between SE and Variance
Correlation between SE and 1
2ln (2πeV)
Case Control Case Control
Allergic Rhinitis −0.5515 −0.5769 −0.9703 −0.9658
Asthma_GSE4302 −0.4272 −0.4677 −0.1924 −0.2004
BreastCancer_GSE10810 −0.3942 −0.3378 −0.1810 −0.1265
CLL_GSE8835 0.2251 0.2522 −0.0806 −0.0624
ColorectalCancer_GSE9348 0.3122 0.4454 −0.0086 0.0206
CrohnsDisease_GSE6731 −0.2826 −0.2380 −0.1664 −0.4020
LungAdenocarcinoma_GSE7670
0.0725 0.3360 −0.0173 0.0105
MS_GDS3920 −0.3615 −0.3320 −0.0515 −0.0559
Obesity_GSE12050 0.9998 0.9990 0.1584 0.5420
Pancreas_GDS4102 −0.4137 −0.4455 −0.1331 −0.0890
ParkinsonsDisease_GSE20141
−0.1732 −0.2554 −0.0024 −0.0155
ProstateCancer_GSE6919_GPL8300
0.2118 0.1552 −0.0562 −0.0699
Psoriasis_GSE13355 −0.6386 −0.6554 −0.5200 −0.6779
Schizophrenia_GSE17612 0.3632 0.3910 0.0170 0.0235
T2D_GSE20966 −0.6006 −0.5550 −0.4356 −0.4663
UlcerativeColitis_GSE6731 −0.3112 −0.2555 −0.1799 −0.1451
Page 4 of 5Wang et al. BMC Res Notes (2015) 8:832
We conclude from this that none of the distributions tested are close enough approximations to the observed DSE distribution to be used as a proxy for obtaining p val-ues. Thus, without a known distribution function or suit-able surrogate, we resort to resampling in order to obtain reliable DSE p values. While computationally demand-ing, the following permutation test makes no assump-tions about the underlying distribution of the data. Given two lists of numbers, containing n1 and n2 numerical ele-ments respectively, we first calculate their DSE and then
create a new list A containing all n1 + n2 numbers from the two lists. Next we randomly permute the elements of A, then recalculate DSE, treating the first n1 elements of A as one list and the last n2 elements of A as a second list. The resultant p value is simply the proportion of all recal-culated DSEs that are at least as extreme as the original DSE.
In addition to raw p values, EntropyExplorer also cal-culates p values adjusted for multiple testing. A user can choose to adjust based on FDR, Holm or another multi-ple-testing adjustment.
ConclusionsWe have produced EntropyExplorer, an R package for calculating differential Shannon entropy, differential coefficient of variation and differential expression. This package also calculates raw and adjusted p values for each metric. These measures have been shown to com-plement one another [15], making this package an effec-tive tool for users in search of more expansive suites of differential analysis methods.
Availability and requirementsProject name: EntropyExplorer.
Project home page: http://cran.r-project.org/web/pack-ages/EntropyExplorer/index.html.
Operating system(s): Platform independent.Programming language: R.Other requirements: R version 3.0 or later is
recommended.
Table 2 KS test D-statistic results comparing the DSE distribution against several common distributions
* The last column shows the results after first standardizing DSE by dividing each DSE by the standard deviation of all DSEs
Dataset Distribution
Normal Chi-square F t t (standardized DSE)*
Allergic Rhinitis 0.3109 1 1 0.4991 0.3526
Asthma_GSE4302 0.2795 1 1 0.4895 0.3117
BreastCancer_GSE10810 0.2115 1 1 0.4797 0.3944
CLL_GSE8835 0.1506 1 0.9975 0.4519 0.1596
ColorectalCancer_GSE9348 0.1232 1 0.9994 0.4514 0.2142
CrohnsDisease_GSE6731 0.2131 1 0.987 0.4691 0.2392
LungAdenocarcinoma_GSE7670 0.19 1 0.9999 0.4663 0.332
MS_GDS3920 0.2703 1 0.9994 0.4813 0.3397
Obesity_GSE12050 0.2352 1 0.9991 0.484 0.287
Pancreas_GDS4102 0.2606 1 0.9937 0.4532 0.3254
ParkinsonsDisease_GSE20141 0.0628 1 0.9361 0.3816 0.0582
ProstateCancer_GSE6919_GPL8300 0.1575 1 1 0.4739 0.2522
Psoriasis_GSE13355 0.3327 1 0.9999 0.4932 0.4195
Schizophrenia_GSE17612 0.183 1 0.9998 0.4705 0.2138
T2D_GSE20966 0.3271 1 0.9999 0.4936 0.3562
UlcerativeColitis_GSE6731 0.2397 1 0.998 0.4831 0.3608
Fig. 3 The distribution of differential Shannon entropy. The observed distribution of differential Shannon entropy in sample prostate cancer data is shown. Similar patterns were seen in all 16 data sets. None of the standard distributions tested matched the observed distribu-tions closely enough to be considered as a reference distribution for obtaining p values

Page 5 of 5Wang et al. BMC Res Notes (2015) 8:832
License: GNU General Public License version 3.0 (GPLv3).
Any restrictions to use by non-academics: None.Additional availability: EntropyExplorer is integrated
into the GrAPPA toolkit at http://grappa.eecs.utk.edu/.
Authors’ contributionsKW implemented the package and performed numerous analytical tests. CAP led exhaustive software evaluations and isolated relevant data. AMS provided statistical expertise and assisted with human factors engineering. MAL directed the project and provided for its support. All authors participated in writing the paper. All authors read and approved the final manuscript.
Author details1 Department of Electrical Engineering and Computer Science, University of Tennessee, Knoxville, TN 37996-2250, USA. 2 Department of Animal Science, University of Tennessee Institute of Agriculture, Knoxville, TN 37996-4574, USA.
AcknowledgementsThis work has been supported in part by the National Institutes of Health under awards R01-AA-018776 and 3P20MD000516-07S1.
Competing interestsThe authors declare that they have no competing interests.
Received: 12 August 2015 Accepted: 2 December 2015
References 1. Ho JW, Stefani M, dos Remedios CG, Charleston MA. Differential variability
analysis of gene expression and its application to human diseases. Bioin-formatics. 2008;24(13):i390–8.
2. West J, Bianconi G, Severini S, Teschendorff AE. Differential network entropy reveals cancer system hallmarks. Scientific reports. 2012;2:802.
3. Berretta R, Moscato P. Cancer biomarker discovery: the entropic hallmark. PLoS One. 2010;5(8):e12262.
4. Sherwin WB. Entropy and information approaches to genetic diversity and its expression: genomic geography. Entropy. 2010;12(7):1765–98.
5. Masisi L, Nelwamondo F, Marwala T. The use of entropy to measure struc-tural diversity. In: IEEE 6th International Conference on Computational Cybernetics. Stará Lesná, Slovakia.
6. Chen B-S, Li C-W. On the interplay between entropy and robustness of gene regulatory networks. Entropy. 2010;12(5):1071–101.
Additional file
Additional file 1. EntropyExplorer R package reference manual.
7. Furlanello C, Serafini M, Merler S, Jurman G. Entropy-based gene ranking without selection bias for the predictive classification of microarray data. BMC Bioinform. 2003;4:54.
8. Kohane IS, Kho AT, Butte AJ. Microarrays for an integrative genomics. Cambridge, Mass.: MIT Press; 2003.
9. Reed GF, Lynn F, Meade BD. Use of coefficient of variation in assess-ing variability of quantitative assays. Clin Diagn Lab Immunol. 2002;9(6):1235–9.
10. Weber EU, Shafir S, Blais AR. Predicting risk sensitivity in humans and lower animals: risk as variance or coefficient of variation. Psychol Rev. 2004;111(2):430–45.
11. Faber DS, Korn H. Applicability of the coefficient of variation method for analyzing synaptic plasticity. Biophys J. 1991;60(5):1288–94.
12. Bedeian AG, Mossholder KW. On the use of the coefficient of variation as a measure of diversity. Organ Res Methods. 2000;3(3):285–97.
13. Shannon CE. A mathematical theory of communication. Bell Syst Tech J. 1948;27(3):45.
14. Cover TM, Thomas JA. Elements of information theory. 2nd ed. Hoboken: Wiley-Interscience; 2006.
15. Wang K, Phillips CA, Rogers GL, Barrenas F, Benson M, Langston MA. Dif-ferential Shannon entropy and differential coefficient of variation: alterna-tives and augmentations to differential expression in the search for disease-related genes. Int J Comput Biol Drug Des. 2014;7(2–3):183–94.
16. R Core Team. R: A language and environment for statistical computing. In: R Foundation for Statistical Computing. Vienna, Austria; 2014.
17. Edgar R, Domrachev M, Lash AE. Gene expression omnibus: NCBI gene expression and hybridization array data repository. Nucleic Acids Res. 2002;30(1):207–10.
18. Pedraza V, Gomez-Capilla JA, Escaramis G, Gomez C, Torne P, Rivera JM, Gil A, Araque P, Olea N, Estivill X, et al. Gene expression signatures in breast cancer distinguish phenotype characteristics, histologic subtypes, and tumor invasiveness. Cancer. 2010;116(2):486–96.
19. Love MI, Huber W, Anders S. Moderated estimation of fold change and dispersion for RNA-seq data with DESeq2. Genome Biol. 2014;15(12):550.
20. Tusher VG, Tibshirani R, Chu G. Significance analysis of microarrays applied to the ionizing radiation response. Proc Natl Acad Sci USA. 2001;98(9):5116–21.
21. Donnelly SM, Kramer A. Testing for multiple species in fossil samples: an evaluation and comparison of tests for equal relative variation. Am J Phys Anthropol. 1999;108(4):507–29.
22. Fligner MA, Killeen TJ. Distribution-free two-sample tests for scale. J Am Stat Assoc. 1976;71(353):210–3.
23. Ghasemi A, Zahediasl S. Normality tests for statistical analysis: a guide for non-statisticians. Int J Endocrinol Metab. 2012;10(2):486–9.
• We accept pre-submission inquiries
• Our selector tool helps you to find the most relevant journal
• We provide round the clock customer support
• Convenient online submission
• Thorough peer review
• Inclusion in PubMed and all major indexing services
• Maximum visibility for your research
Submit your manuscript atwww.biomedcentral.com/submit
Submit your next manuscript to BioMed Central and we will help you at every step: