energy management opportunities for georgetown hospital · energy management opportunities for...
TRANSCRIPT

Energy Management Opportunities for Georgetown Hospital
A Customer Service of Halton Hills Hydro Inc.

Georgetown Hospital Energy Management Opportunities Page 1
Contents Summary ............................................................................................................................. 1
Background ......................................................................................................................... 3 Site Conditions .................................................................................................................... 4 Electricity Analysis ............................................................................................................. 7 Natural Gas Analysis ........................................................................................................ 14 Comparison with Similar Facilities .................................................................................. 16
Recommendations ............................................................................................................. 19 1. Lighting ..................................................................................................................... 19
2. HVAC - Electrical ..................................................................................................... 20 3. Natural Gas Solutions ................................................................................................ 23 4. Other Measures for Consideration ............................................................................. 25 Impact on Energy Intensity ............................................................................................... 26
Next Steps ......................................................................................................................... 27 Appendix – Electric Equipment Inventory ....................................................................... 29

Georgetown Hospital Energy Management Opportunities Page 1
Summary A site assessment was undertaken by Aladaco Consulting Inc. on behalf of Halton Hills
Hydro at the Georgetown Hospital for Halton Healthcare Services. Halton Hills Hydro
Inc. (HHH) undertakes these assessments to promote energy efficiency and help its
customers identify opportunities for cost and energy savings. Certain recommended
retrofits will qualify for incentive programs which are designed to provide customers
with supporting funding to implement energy efficiency improvements.
A detailed energy analysis was conducted on both electricity and natural gas
consumption. Highlights of the energy analysis include:
There is a very high correlation between weather and electricity consumption and
demand
Strong evidence that mechanical cooling is being used at relatively low outdoor
temperatures when ‘free-cooling’ is available
High natural gas baseload consumption likely due to extensive reheat and system
standing losses
When compared to comparable facilities, Georgetown Hospital consumes more energy
than the average or median facility of its size. We have suggested the hospital set a goal
of achieving energy intensity that is 25% lower than the median of the 2006 OHA Energy
Benchmarking study. This would require a reduction of approximately 35% of current
energy consumption.
Based on our analysis and on-site assessment, we have recommended improvements to
several hospital systems to lower electricity and natural gas consumption. These
recommendations also provide for extensive renewal of very old mechanical and
electrical infrastructure that will minimize future capital investment. The financial results
of these recommendations are summarized below.
Recommendation Estimated Cost Incentives Annual
Savings
Simple
Payback
Lighting $140,000 $25,000 $35,000 3.3 years
HVAC –
Electrical
$900,000 $150,000 $68,000 11 years
Natural Gas $500,000 $40,000 $57,000 7.7 years
Totals $1,540,000 $215,000 $160,000 8.3 years

Georgetown Hospital Energy Management Opportunities Page 2
The recommendations of this report are, by definition, preliminary and further
investigation will be required. We also discuss further steps that can be taken to validate
the potential of these opportunities and funding that is available to assist with this effort.
Finally, we also briefly touch on some alternative approaches to implementing energy
efficiency improvements. It is valuable to consider these options early in the planning of
your energy efficiency program to minimize delays and create a clear plan for funding
and execution.

Georgetown Hospital Energy Management Opportunities Page 3
Background The objective of this Energy Assessment is to develop a high-level review of electricity
use at the Georgetown Hospital and identify areas for efficiency improvement. This
assessment is provided free of charge to Halton Healthcare Services for this facility by
Halton Hills Hydro as part of their mandate to produce significant electrical demand and
consumption reductions in their service territory. The Energy Assessment was prepared
by Aladaco Consulting Inc. on behalf of Halton Hills Hydro.
This report will provide guidance and prioritization for further, more detailed audits or
studies into specific systems with high conservation potential. These subsequent
investigations should enable capital investment with high confidence in the efficiency
and financial outcomes. Halton Hills Hydro will continue to support Halton Healthcare
Services throughout this process to ensure they can achieve their full efficiency potential
and maximize financial resources (incentives) available for these projects.
Because of the interactive nature of some electrical and natural gas-fueled systems, a
brief assessment of natural gas consumption and systems is also included.
Representatives from Union Gas were involved in this assessment and will also support
Halton Healthcare Services in their pursuit of natural gas efficiency improvements
through incentives.

Georgetown Hospital Energy Management Opportunities Page 4
Site Conditions The Georgetown Hospital complex consists of two (2) distinct facilities with differing
operations. The Hospital is an acute-care community hospital with 33 beds. This facility
is connected to the Bennett Center, a long-term/complex care facility with 25 beds. The
two facilities are connected by an enclosed walkway known as the “Tunnel”.
Hospital
The hospital was first constructed in 1961and expanded in 1972 with a 9,000 square foot
addition. The Hospital as it stands now is a single story building encompassing 56,700
square feet.
HVAC Systems
When the Hospital was originally built, there was no air conditioning or central
ventilation system. A pair of 200 HP steam boilers provided space heating,
domestic hot water and some process steam with 100% redundancy. Space
heating is provided through perimeter hot water radiation with no local
temperature control. A reset controller adjusts the temperature of the perimeter
radiation in response to outdoor temperature – as the outdoor temperature drops,
the loop temperature increases.
The expansion in 1972 added a multi-zone air-handling unit and central chiller to
provide partial cooling and ventilation to the facility.
A major retrofit in 1993 expanded air conditioning to the remainder of the
hospital through installation of rooftop mounted air handling units with integrated
direct expansion (DX) refrigeration. The combined cooling capacity at the
hospital is now approximately 200 tons.
These rooftop mounted units use glycol heating coils with glycol provided
through a steam/glycol heat exchanger. Many of the units also have hot water
reheat coils in the downstream ductwork to provide local temperature control.
Because of limited ceiling space, much of the trunk ductwork is located outdoors
on the roof. This ductwork is insulated and sealed (believed to be 1” fiberglass
insulation sandwiched between sheet metal panels) and is inspected regularly for
deterioration.
At the time of the air conditioning retrofit, a Honeywell automation system was
installed to centralize control of the HVAC system. Refer to the Appendix for a
list of HVAC components.
Georgetown Hospital Energy Management Opportunities Page 5
Lighting
The common area and patient room general lighting systems in the hospital were
retrofitted in approximately 2000. This retrofit converted predominantly 2 lamp
T12 fluorescent fixtures with electromagnetic ballasts to 2 lamp T8 fluorescent
with electronic ballasts.
The over bed lighting was not retrofitted at the time, likely due to low operating
hours and comparatively high cost (2 ballasts at each fixture for separate up and
down lighting). These retain the T12 lamps and electromagnetic ballasts.
Some accent (pot) lights were observed to still be using incandescent lamps.
Based on a couple of sample areas, general lighting power density was estimated
to be 0.5 – 0.6 watts/ft2. This is based on an assumed load of 55 watts for the
existing fluorescent fixtures.
Bennett Center
The Bennett Center is a two story facility encompassing 75,000 square feet. It was
opened in 1985 and caters to long-term/complex care residents and related support
services. The kitchen facilities for the entire complex are located in the Bennett Center.
HVAC
There are 14 air-handling units of varying types serving the Bennett Center. Some
use chilled water provided by an 80 ton packaged chiller, while others have
integrated DX cooling. A couple of units have no cooling at all. Some units have
built in gas fired heating while others have glycol heating coils (heat provided by
steam from Hospital boiler plant). Some have no heating source at all. Total
cooling capacity at the Bennett Center is approximately 180 tons.
There are ceiling-mounted hot water radiant heating panels on the perimeter.
These are controlled by local pneumatic thermostats but are not interconnected
with the air-handling equipment. Hot water is provided by a steam/hot water
converter using steam from the Hospital boiler plant.
Most, but not all, of the HVAC equipment in the Bennett Center are controlled by
the Honeywell automation system.
Lighting
The predominant lighting source in the Bennett Center is 2 lamp T12 fluorescent
with magnetic ballasts. The only exception is the cafeteria which has been

Georgetown Hospital Energy Management Opportunities Page 6
retrofitted with electronic ballasts and T8 lamps. The accent lights in the cafeteria
were still using 150 incandescent lamps, while some of the accent lights in the
common areas were using plug-in fluorescent lamps.
Based on a few sample areas in the facility, the average lighting power density is
estimated as 1.5 - 1.6 watts/ft2. This is based on assumed load per fixture of 78
watts/fixture. The light level in most of the Bennett Center appeared to be higher
than that of the Hospital although light measurements were not taken.
Tunnel & Exterior
The tunnel is a 10,000 square foot covered pathway joining the Hospital to the Bennett
Center. In addition to providing sheltered access for staff and patients between the two
buildings, it also conveys central electrical and mechanical services.
The tunnel is heated by perimeter hot water radiation and cooled by a dedicated
rooftop unit that was installed in 2004.
Lighting is provided by linear 4’ T12 lamps in a continuous strip down the entire
length of the tunnel. Two lamps share a single magnetic ballast.
The parking lot is illuminated by three (3) tall light standards with 2 heads, each
400 watt high pressure sodium lamps and ballasts. The pathway and driveways
are illuminated by 8-10’ high standards with clear glass globe lights with 70 watt
high pressure sodium lamps and ballasts. There is a variety of high pressure
sodium, metal halide and even incandescent fixtures at various entrances and exits
of the facility.
Georgetown Hospital Energy Management Opportunities Page 7
Electricity Analysis
Load Profile
Based on past electricity consumption patterns and the observed operation of the facility,
we have been able to prepare a profile of electricity use at this facility and where it is
being used.
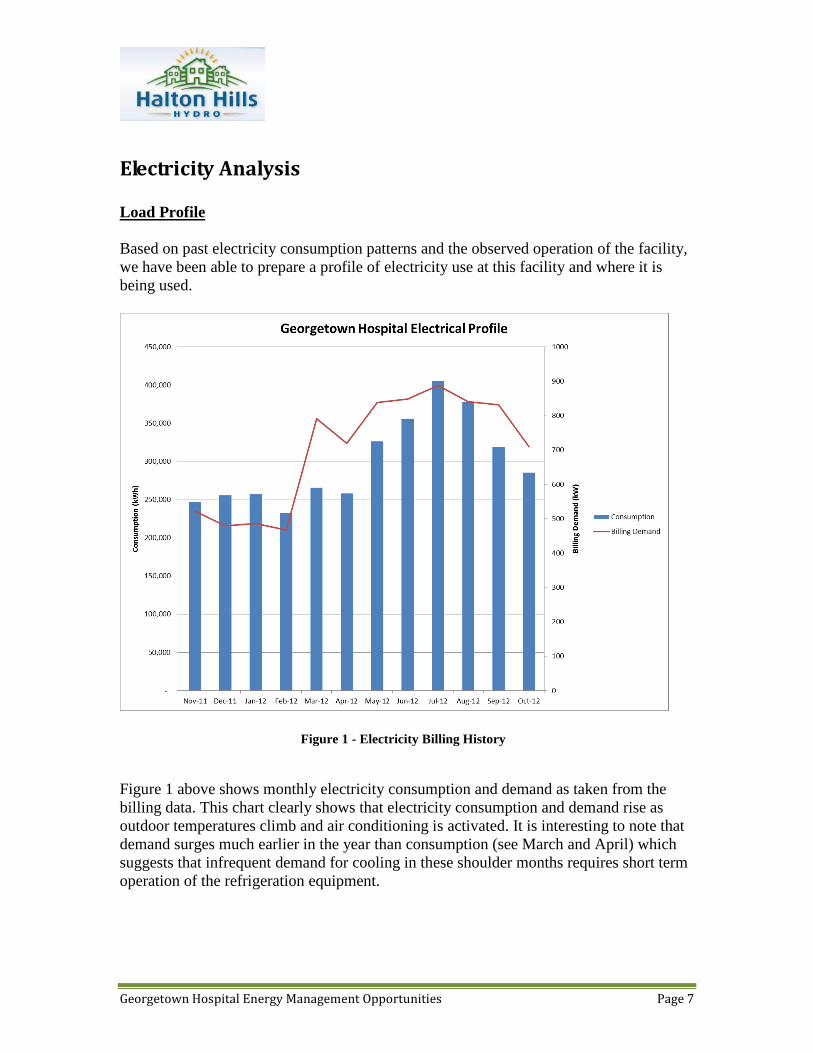
Figure 1 above shows monthly electricity consumption and demand as taken from the
billing data. This chart clearly shows that electricity consumption and demand rise as
outdoor temperatures climb and air conditioning is activated. It is interesting to note that
demand surges much earlier in the year than consumption (see March and April) which
suggests that infrequent demand for cooling in these shoulder months requires short term
operation of the refrigeration equipment.
Figure 1 - Electricity Billing History

Georgetown Hospital Energy Management Opportunities Page 8
If we drill down into the hourly load data, we can gain greater insight into the operation
of the facility. In Figure 2, we have charted the average hourly electrical load for each
day of the week in February. This represents typical ‘winter’ conditions where
mechanical air conditioning (refrigeration) is unlikely to be present.
Figure 2 clearly shows a constant baseload of approximately 300 kW exists at all times.
This increases rapidly starting around 7 am as the facility commences regular daily
activity. Not surprisingly, activity and electrical loads are lower on the weekends when
fewer departmental systems and staff are active. During the week, this daily ‘activity’
demand adds approximately 175 kW to the electrical load. Later in the report we
reconcile these measured results against major electrical loads in the facility to determine
what systems are responsible for each component.
In Figure 3 below, we repeat the same hourly analysis for August. While the same
general daily pattern exists, the baseline load is higher (~ 400 kW) and the daily increase
is also much larger (200-225 kW). In both cases, these are attributable to the added air
conditioning load that is present around the clock.
Figure 2 - Average Hourly Load by Day - February

Georgetown Hospital Energy Management Opportunities Page 9
It is important to point out that the monthly billing demand from Figure 1 will be higher
than the corresponding peak loads from the hourly averages in Figure 2 and 3. That is
because billing demand is based on the highest 15 minute value in each month.
Figure 3 - Hourly Average Electrical Load by Day - August

Georgetown Hospital Energy Management Opportunities Page 10
Weather Sensitivity
To accurately determine the impact of weather on electricity consumption, 12 months of
billing data was analyzed in the Metrix Utility Analysis software program. Using daily
weather data for the area, this program determines the statistical correlation between
energy consumption and outside temperatures.
Figure 4 below is a screenshot from the Metrix software system showing the very strong
correlation between electricity consumption (kWh) and Cooling Degree Days (CDD).
Figure 4 - Correlation of Electricity Consumption and Outside Temperature
There are two important pieces of information that we can learn from this analysis. The
first is that the balance temperature – the outside temperature where mechanical cooling
starts – is 8.3 degrees C (47 degrees F). This is quite low and suggests that the HVAC
system is not properly set up to use cool outside air for inside space cooling. The second
insight is that the consumption model from the software predicts that annual electricity
consumption for space cooling is 595 MWh. This is valuable because it helps us
understand the operation of this equipment.
To round out the impact of weather on electricity, we also analyzed the relationship with
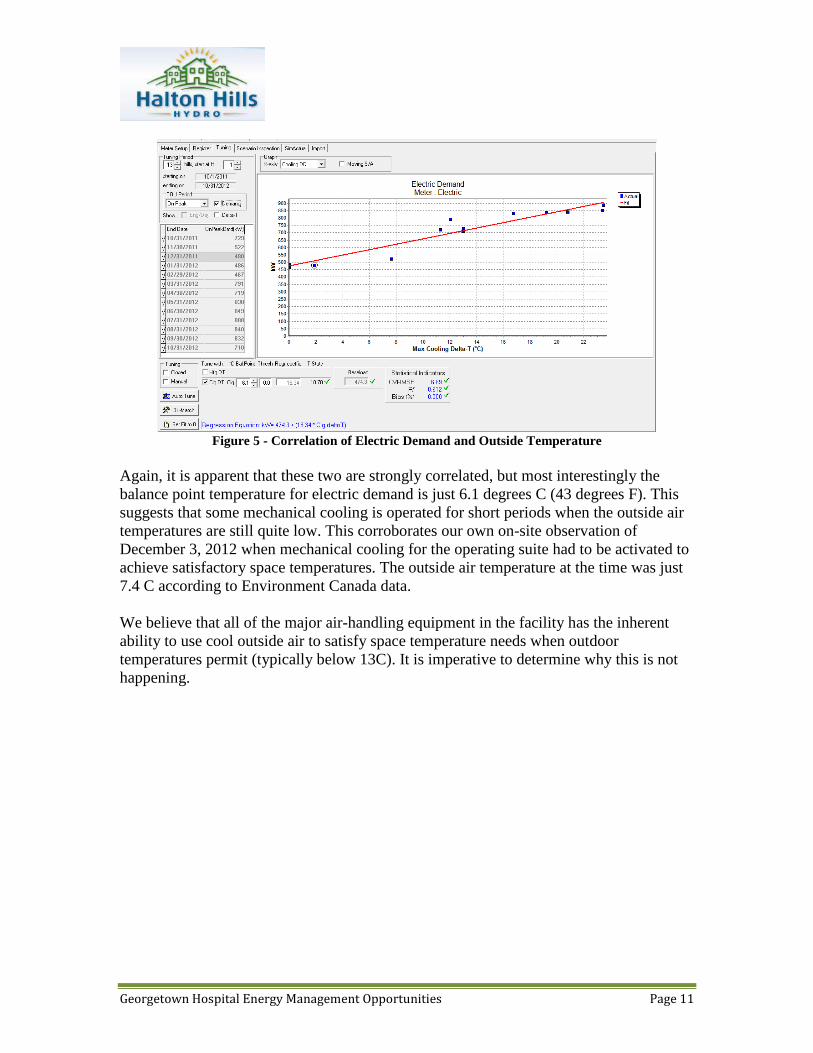
electrical demand (monthly billing demand). See Figure 5 below.
Georgetown Hospital Energy Management Opportunities Page 11
Figure 5 - Correlation of Electric Demand and Outside Temperature
Again, it is apparent that these two are strongly correlated, but most interestingly the
balance point temperature for electric demand is just 6.1 degrees C (43 degrees F). This
suggests that some mechanical cooling is operated for short periods when the outside air
temperatures are still quite low. This corroborates our own on-site observation of
December 3, 2012 when mechanical cooling for the operating suite had to be activated to
achieve satisfactory space temperatures. The outside air temperature at the time was just
7.4 C according to Environment Canada data.
We believe that all of the major air-handling equipment in the facility has the inherent
ability to use cool outside air to satisfy space temperature needs when outdoor
temperatures permit (typically below 13C). It is imperative to determine why this is not
happening.
Georgetown Hospital Energy Management Opportunities Page 12
Electricity End Use Analysis
The preceding analysis of electricity consumption and weather sensitivity is helpful to
understand the operating characteristics of the facility related to schedule and weather. To
deepen the understanding of the systems and components responsible for these
characteristics, a high level inventory of major building electrical systems was prepared.
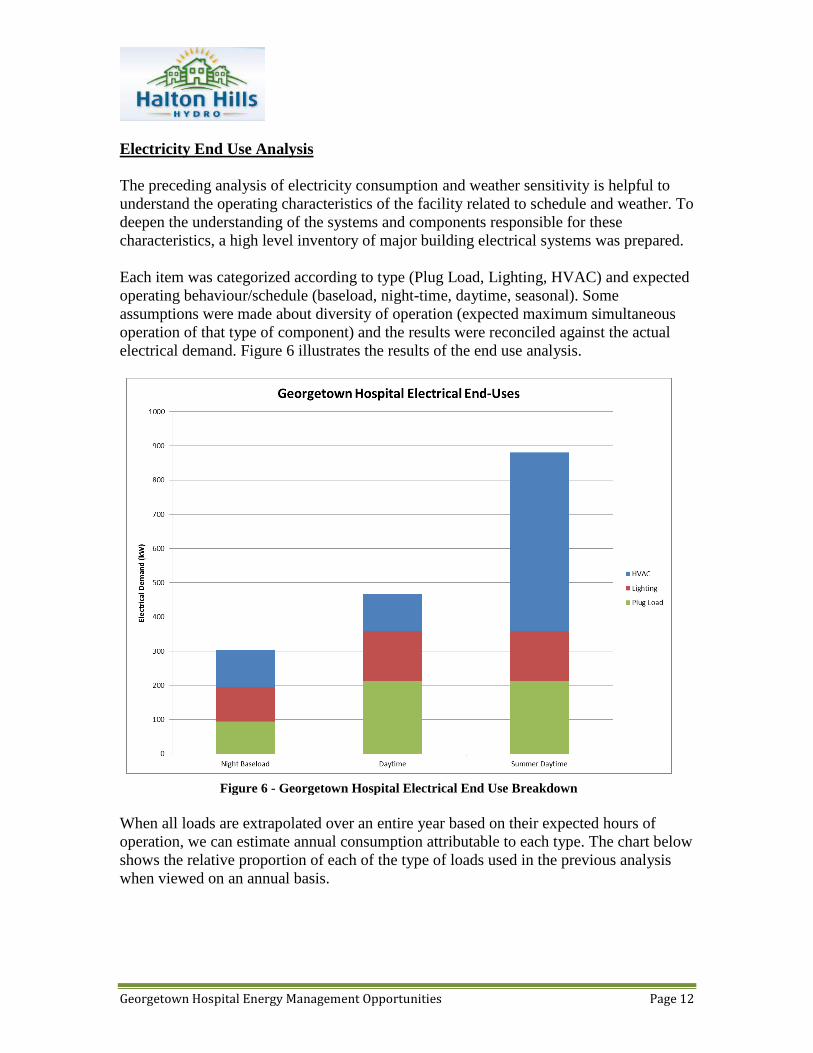
Each item was categorized according to type (Plug Load, Lighting, HVAC) and expected
operating behaviour/schedule (baseload, night-time, daytime, seasonal). Some
assumptions were made about diversity of operation (expected maximum simultaneous
operation of that type of component) and the results were reconciled against the actual
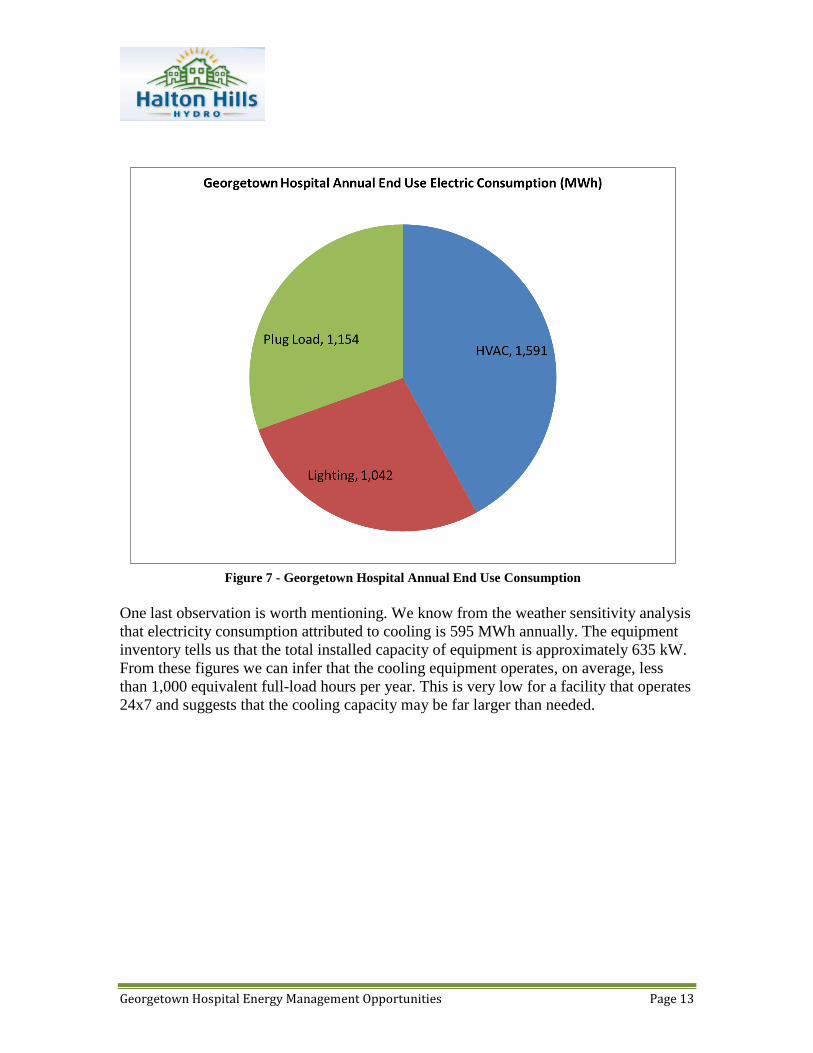
electrical demand. Figure 6 illustrates the results of the end use analysis.
When all loads are extrapolated over an entire year based on their expected hours of
operation, we can estimate annual consumption attributable to each type. The chart below
shows the relative proportion of each of the type of loads used in the previous analysis
when viewed on an annual basis.
Figure 6 - Georgetown Hospital Electrical End Use Breakdown
Georgetown Hospital Energy Management Opportunities Page 13
One last observation is worth mentioning. We know from the weather sensitivity analysis
that electricity consumption attributed to cooling is 595 MWh annually. The equipment
inventory tells us that the total installed capacity of equipment is approximately 635 kW.
From these figures we can infer that the cooling equipment operates, on average, less
than 1,000 equivalent full-load hours per year. This is very low for a facility that operates
24x7 and suggests that the cooling capacity may be far larger than needed.
Figure 7 - Georgetown Hospital Annual End Use Consumption

Georgetown Hospital Energy Management Opportunities Page 14
Natural Gas Analysis
The chart below illustrates the strong winter weather influence on natural gas
consumption.
Weather Sensitivity
As with electricity, we used the Metrix Utility Analysis software to determine the
statistical relationship between natural gas use and outdoor temperature. As the
screenshot below illustrates, this relationship is quite strong.
Interestingly, the balance point temperature – the outdoor temperature below which space
heating is required – is determined to be 16.1 C. This is almost nine degrees higher than
the cooling balance point temperature suggesting a wide range when heating and cooling
are acting simultaneously.
Figure 8 - Natural Gas Consumption (04-11 to 03-12)

Georgetown Hospital Energy Management Opportunities Page 15
The baseload natural gas consumption in this facility would normally be attributed to
domestic hot water and sterilization uses. However, it is likely that this is inflated by hot
water reheat coils that temper space cooling throughout the year.
Figure 9 - Correlation of Natural Gas Consumption and Outdoor Temperature

Georgetown Hospital Energy Management Opportunities Page 16
Comparison with Similar Facilities
It is helpful to compare the energy consumption of the Georgetown Hospital with other
similar facilities. This ‘benchmark’ exercise is approximate at best since no two facilities
are physically or operationally identical.
Facilities are compared on the basis of energy intensity – units of energy per unit of
interior (conditioned) area. For the purposes of this analysis, we will normalize energy
intensity as ‘equivalent kilowatt-hours per square foot (ekWh/ft2). For Georgetown
Hospital, the energy intensities are as follows:
Electricity
Baseload 21.1 ekWh/ft2
Cooling 4.2 ekWh/ft2
Total 25.3 ekWh/ft2
Natural Gas
Baseload 21.4 ekWh/ft2
Heating 22.3 ekWh/ft2
Total 43.7 ekWh/ft2
Total energy intensity 69.0 ekWh/ft2
Finding comparable facilities or benchmarks to assess the performance of Georgetown
Hospital is further complicated by the dual nature of the site - part hospital, part long-
term/complex care facility. Each of these operations have differing energy characteristics.
Where possible, we have tried to produce benchmark indices that offer reasonable
similarity to the Georgetown Hospital.
Benchmarks we have selected for comparison include:
“Energy Efficiency Opportunities in Ontario Hospitals”, 2006, Ontario Hospital
Association
Based on voluntary survey responses from Ontario Hospitals
Data for Small Hospitals and Continuing Care/Rehab selected for comparison
US Department of Energy, Energy Star Target Finder
Based on data from the US Department of Energy Commercial Buildings
Energy Consumption Survey 2003

Georgetown Hospital Energy Management Opportunities Page 17
Data for Hospitals and Senior Care Facilities selected as closest comparable
building types
Benchmarks refined to reflect key energy consumption drivers (i.e. number of
beds, MRI machines in hospitals etc.)
Data reflects results for Western New York as closest weather proxy
Benchmarks prepared for Median, Top 25% and Top 10% targets
For each source, a comparative benchmark was produced by a weighted average, based
on square footage (60% LT/CC; 40% Small Hospital), of the two facility types. Results
are:
OHA 2006 Survey Electricity Natural
Gas Total
Small Hospital 21.58 45.34 66.92 CCC/Rehab Hospital 14.94 39.51 54.45
Weighted Average 17.83 42.05 59.88
EnergyStar Median Benchmark Hospital 27.42 25.31 52.74
Senior Care Facility 6.97 17.93 24.90
Weighted Average 15.88 21.15 37.02
EnergyStar Top 25% Benchmark Hospital 23.77 21.94 45.71
Senior Care Facility 5.74 14.77 20.51
Weighted Average 13.59 17.89 31.48
EnergyStar Top 10% Benchmark Hospital 20.87 19.27 40.14
Senior Care Facility 4.84 12.45 17.29
Weighted Average 11.82 15.42 27.24
The chart below provides a visual comparison of these figures.

Georgetown Hospital Energy Management Opportunities Page 18
As stated earlier, this benchmarking exercise is approximate at best. The sources we have
used are among the best available, but are still imperfect and should not be used to create
firm performance targets. We believe this is especially true of the OPA electrical energy
intensity targets for Senior Care Facilities which appear unreasonably low and may
represent functionally different facilities than the Bennett Center.
Natural Resources Canada is undertaking a benchmarking program based on the
EnergyStar Portfolio Manager program but it is still in its infancy and cannot provide
useful benchmark targets.
We believe that an aggressive, but realistic goal for a comprehensive energy efficiency
program would be to beat the OHA 2006 Blended target by 25%. This would result in
energy intensity of 45 ekWh/ft2 and would require a combined energy reduction of almost
35% - aggressive, but not impossible.
Nominal Performance Goal

Georgetown Hospital Energy Management Opportunities Page 19
Recommendations
Based on the high level assessment of the facility, we have identified a number of energy
efficiency improvements that may be financially feasible and are worthy of further
investigation. For all recommendations, estimates of savings are provided to the extent
that they can be estimated with any accuracy. Because incentives are also based on
energy savings, we have provided estimates of these as well. Any retrofit cost estimates
are guidelines and should be viewed as ‘order of magnitude’ only, particularly HVAC
recommendations.
1. Lighting
Lighting recommendations focus on the primary lighting systems and do not deal with
secondary architectural or exit lights. In all situations, any incandescent lamps should be
replaced with LED or comparable high efficiency components.
Hospital
Newer T8 lamp and electronic ballast technologies can provide further savings over the
T8/ballast retrofit from 2000. It is possible to reduce electric demand at each 2 lamp
fixture by approximately 13 watts (from 55 to 42 watts). This is financially reasonable in
the common areas where lighting operates 8,760 hours/year (24x7). However, in the
patient rooms and offices where operating hours are considerably lower (estimate 2,920
hours/year) the payback is quite a bit longer.
The over bed lighting still suffers from the long payback that prevented conversion to T-
8/electronic ballasts back in 2000. The situation now is a bit better as the efficiency of
modern technology is better than it was 13 years ago so savings are higher. A more
urgent driver to pursue this retrofit is the phase out of magnetic ballasts and T-12 lamps
that has already started in Ontario. It is better to retrofit this now to ensure that you are
not in a position where you cannot get reasonably prices replacement parts. Converting to
T-8 will simplify materials management by eliminating a lamp and ballast type that needs
to be stocked.
Bennett Center
We recommend converting all existing T12 lamps and magnetic ballasts to T8 lamps and
electronic ballasts. The payback for this retrofit is excellent and will have the added
benefit of reducing the cooling load in the facility.
As we pointed out in the description of the lighting in this part of the facility, it appears to
be subjectively much brighter than the hospital. It may be possible to pursue a more

Georgetown Hospital Energy Management Opportunities Page 20
aggressive lighting retrofit that would involve de-lamping the fixtures or a wholesale
redesign of the lighting layout. Proper photometric measurement and analysis will be
required to determine if this is viable.
Like the hospital, over bed lighting is not nearly as financially attractive but should still
be undertaken to avoid problems with availability of ballasts and lamps and harmonize
lamp and ballast inventories to simplify maintenance.
Tunnel
The tunnel is an excellent candidate for conversion from T12/magnetic ballasts to
T8/electronic ballasts because of the long operating hours (8760 hrs/year).
There is also an opportunity to selectively turn lights off in the tunnel to take advantage
of the extensive natural lighting from the windows that run full length of the tunnel. It
may be possible under some circumstances to turn all of the lights off, but a more
conservative alternative would be to turn off every second fixture based on a photocell
input. This would also have the secondary benefit of reducing the cooling load in an area
that has been identified as having insufficient cooling capacity.
Exterior
It may be possible to use LED lamps or fixtures to replace the existing high pressure
sodium lamps in the parking lots, driveways/pathways and entrances/exits. Exterior
lighting applications for LED technologies are still in their infancy and would require
more in-depth examination to confirm their photometric and financial viability.
Financial Summary - Lighting
Estimated
Cost
Electricity
Savings
(kWh)
Peak
Demand
Savings
(kW)
Incentive Annual
Savings
Simple
Payback
$140,000 320,000 50 $25,000 $35,000 3.3 years
2. HVAC - Electrical
The HVAC systems throughout the facility are wide mix of technologies, ages, capacities
and control strategies. The recommendations here reflect what we were able to learn in
the limited time available for assessment and may ultimately be deemed impractical or
Georgetown Hospital Energy Management Opportunities Page 21
financial unfeasible. Based on the information available, they are worthy of further
investigation.
There are a number of issues related to the HVAC systems in the facility that have been
identified and, if addressed, should significantly improve efficiency. These issues are:
Lack of local control of perimeter radiation heating. Because this operates totally
independent of the air-handling system, there is undoubtedly simultaneous heating
and cooling occurring, especially during the shoulder months. This may be a
contributor to the premature operation of the cooling equipment. Ideally, each
perimeter zone would have a control valve that would be sequenced with the local
reheat coil (or VAV damper if that retrofit is viable).
The multi-zone air-handling units are an inefficient way to perform temperature
control because it mixes hot and cold air to satisfy space needs. The preferable
method is to vary the amount of cold air, and vary the temperature of the cold air
to ensure that minimum flow levels can be maintained.
Zone hot water reheat coils are a wasteful way to perform local temperature
control. The preferable method is to use a damper to vary the volume of air in
response to local temperature control needs. If variable air volume control is
impractical or unsuitable for the space, the hot water reheat loop temperature
should be adaptively controlled to minimize losses and prevent overheating.
The control strategy for the entire HVAC system is ‘static’ and does not
intelligently adapt to changing conditions and demand. Although there is a digital
automation system present, the control strategies that it appears to follow are
fairly simplistic and could be achieved with pneumatic controls and electric time
clocks. Upgrading the automation system and implementing intelligent controls
could dramatically improve efficiency and comfort.
The entire hospital is fully ventilated 24x7. There are many areas of the hospital,
such as staff offices and departments with daily schedules that can have the
ventilation shut off or significantly reduced during unoccupied hours.
Furthermore, in hospitals zones that remain active around the clock, outside air
volumes could be reduced at night when occupancy is considerably lighter.
Much of the refrigeration equipment (chiller and rooftop DX systems) is quite old
and inefficient compared to new equipment. It is also likely that the aggregate
cooling system is oversized and could benefit from thorough cooling load re-
calculation and ‘right-sizing’. This will be particularly evident after a lighting
retrofit which could lower cooling demand by 12-15 tons.

Georgetown Hospital Energy Management Opportunities Page 22
To address these issues, we recommend investigating the feasibility of the following
improvements:
1. Perform a detailed heating and cooling load analysis by zone for the entire
hospital. This will allow rebalancing of both water and air flows to properly
match loads. Most of the subsequent recommendations will succeed only if a
proper load calculation is performed to determine zone conditioning needs.
2. Install hot water control valves in hospital perimeter radiation loop. The number
and location of the valves will be dictated by the practical limitation of where they
can be installed and how they can be integrated into the control of the local air-
handling unit zone controls (currently reheat coils or multizone mixed
temperature).
3. Retrofit, or replace, the multizone units. If retrofitting, block off the hot deck and
re-purpose the cold deck dampers to modulate in response to zone temperatures.
Variable frequency drives will be required on the supply and return fan motors.
Also, the control strategy will need to change to allow adjustment of supply
discharge temperature so minimum zone ventilation can be maintained without
overcooling.
4. Replace existing zone hot water re-heat coils with variable air volume or constant
volume control boxes. It is acknowledged that the ceiling space in the hospital is
severely restricted so there may be practical limitations to making this
recommendation a reality. Many of these coils are served by rooftop units with
DX cooling. Because of the inherent limitation in supply airflow volume range of
DX systems, the control range of the dampers may be limited. Whether variable
or constant volume, these control boxes can be programmed to shut down, or
significantly reduce ventilation during unoccupied periods. A VFD would be
added required on the supply and, where it exists, return air fans to modulate
airflow in response to duct pressure.
5. Upgrade the entire automation system and extend control down to the local zone
level. This will allow the primary HVAC equipment (chillers, rooftop units) to
adjust output in response to changing loads rather than coasting along at constant
output. New automation technology will also make it easier to monitor operating
conditions and alert building operators when systems are out of spec.
6. Where it is suitable, install variable frequency drives on hot water and chilled
water distribution pumping systems. This would only be suitable where local
water flow control was achieved with 2-way valves.
7. Upgrade all major refrigeration components to modern, high efficiency
equipment. Where possible, convert rooftop unit cooling from DX to chilled

Georgetown Hospital Energy Management Opportunities Page 23
water or use DX technology that is suitable for Variable Air Volume operation.
This will allow superior part load efficiency and should improve comfort
conditions. If wholesale replacement of airhandling or rooftop units cannot be
justified, a full recommissioning/refurbishment of the outdoor air/return air
dampers must be completed to ensure the system is capable of using outside for
cooling when conditions permit.
Financial Summary – HVAC Electrical
Estimated
Cost
Electricity
Savings
(kWh)
Peak
Demand
Savings
(kW)
Incentive Annual
Savings
Simple
Payback
$900,000 625,000 185 $150,000 $68,000 11 years
3. Natural Gas Solutions Opportunities for natural gas conservation are provided here in very general terms for
your consideration and further investigation.
Boiler Plant Steam to Hot Water Conversion
The current boiler plant that serves the entire complex consists of 2 – 200 HP steam
boilers. It is believed these date back to the initial construction in 1961. There is evidence
that a boiler stack economizer (to extract heat from the combustion exhaust stream) was
installed at some point in the past, but it is no longer functional. Plant operators say that
they have lowered the operating pressure to 80 psi with no detrimental effects on
performance.
The heating needs of the facility never require operation of the second boiler. In fact,
based on the gas consumption history of the facility we estimate that the current steam
plant is oversized and a replacement plant could be significantly smaller. The original
system was designed to support laundry facilities that have since been removed so the
assertion that the plant is oversized is reasonable.
Because steam plants produce energy of very high content, there is potential for extensive
energy losses in the distribution and conversion stages. A quick visit to the boiler room
clearly demonstrates the enormous heat that is lost from the steam and escapes to the
surrounding space. This same heat loss occurs throughout the distribution system but is
less visible/obvious to observers because it is spread through the facility.
We believe it is worth considering the conversion of this plant from steam to hot water.
There are few loads in the hospital that require the high heat content of steam and could

Georgetown Hospital Energy Management Opportunities Page 24
be satisfied much more efficiently with hot water. Any equipment that must use steam
(i.e. autoclaves) could be served more efficiently by a small, high efficiency steam
generator. The layout of the facility, with the long tunnel connecting the Bennett Center
to the hospital, presents some challenges for a hot water system, but these can be
overcome.
Below are the highlights of a steam to hot water conversion for the facility:
Install a small high efficiency steam generator to serve the sterilizer and autoclave
loads year round.
Replace single steam-heated laundry dryer with a natural gas unit
Remove steam boilers and replace with high efficiency hot water and/or glycol
boilers properly sized to serve the space heating needs of the hospital and tunnel.
Install dedicated high efficiency domestic hot water boilers or instantaneous
natural gas water heaters to serve this load.
Convert heating coil in the multi-zone unit to glycol. This may or may not require
the replacement of the coil itself to ensure sufficient capacity. If the multi-zone
unit is replaced, a suitably sized glycol/hot water coil can be specified.
Depending on capacity, re-use or replace steam to hot water/glycol converters for
space heating
Install smaller natural gas hot water heating plant in ground floor utility room in
Bennett Center. This space currently houses the steam to glycol converter used for
many of the heating coils of rooftop units in the Bennett Center. Depending on
piping layout, this same plant could provide hot water for perimeter radiation and
the same space may be able to house domestic hot water heating equipment for
the Bennett Center.
Savings potential for natural gas should be in the range of 30-40% of historic natural gas
consumption. This is not only due to the efficiency improvements of the boiler plant, but
also savings that will accrue through many of the HVAC measures described earlier.
Financial Summary – Natural Gas
Estimated
Cost
Natural
Gas
Savings
(m3)
Incentive Annual
Savings
Simple
Payback
$500,000 210,000 $40,000 $57,000 8.0 years

Georgetown Hospital Energy Management Opportunities Page 25
4. Other Measures for Consideration Below are other opportunities for conservation or cost improvement that are worth further
investigation:
Replace 12 kW hot water booster heater for dishwasher with natural gas heater
Install variable speed drives on the kitchen hood exhaust and make up air fans and
control with temperature or occupancy sensors
Install local lighting controls in offices and other departmental areas with
intermittent occupancy
Install additional insulation and PVC covering on all external ductwork to reduce
heat loss/gain and minimize load on boilers and cooling equipment.
Summary Below, the table summarizes all of the recommended improvements described in the
preceding section.
Recommendation Estimated
Cost
Incentives Annual
Savings
Simple
Payback
Lighting $140,000 $25,000 $35,000 3.3 years
HVAC – Electrical $900,000 $150,000 $68,000 11 years
Natural Gas $500,000 $40,000 $57,000 7.7 years
Totals $1,540,000 $215,000 $160,000 8.3 years
The next table summarizes costs and savings for Bennett Center and the Hospital. Note
that these figures are approximate – estimates of costs and savings for improvements in
the Tunnel, Exterior Lighting and Natural Gas upgrades are split equally between the two
facilities.
Facility Investment Incentives Annual
Savings
Simple
Payback
Bennett Center $ 751,000 $ 111,000 $ 88,000 7.3 years
Hospital $ 789,000 $ 104,000 $ 72,000 9.5 years
Total $ 1,540,000 $ 215,000 $ 160,000 8.3 years

Georgetown Hospital Energy Management Opportunities Page 26
Impact on Energy Intensity The combined impact of the preceding recommendations on energy intensity is
summarized below. All values are in equivalent kilowatt hours/square foot (ekWh/ft2)
Recommendation Electricity
Intensity
Savings
Natural Gas
Intensity
Savings
Total Energy
Intensity
Savings
Lighting 2.26
HVAC 4.41
Boiler Plant/HVAC 15.44
Total 6.67 15.44 22.11
If the preceding recommendations can achieve these savings, the resulting energy
intensity will drop from 69.0 ekWh/ft2 to 46.9 ekWh/ft2. The resulting energy intensity is
approximately 22% below the weighted average benchmark from the OHA 2006
Benchmark study, consistent with the goal we suggested earlier.

Georgetown Hospital Energy Management Opportunities Page 27
Next Steps Our assessment has determined that there is a sizeable opportunity for improving energy
efficiency and reducing operating costs at the Georgetown Hospital. As we stated earlier,
the assessment was high-level and cannot be used to move directly into design or
construction of the recommended improvements. Here we discuss a few paths that you
may follow to validate these findings and proceed to construction with confidence.
Detailed Audit
Halton Hills Hydro, through the Ontario Power Authority, and Union Gas have incentives
available to financially support detailed energy audits. You can follow this path to gain
more certainty about the viability of the recommendations in this assessment before
deciding on a contracting approach.
The Electricity Survey and Analysis incentive provides up to $25,000 in funding
according to the following formula:
$0.10/ft2 for the first 30,000 square feet
$0.05/ft2 for areas above 30,000 square feet
The incentive is capped at 50% of total eligible audit costs less any third-party
contributions (ie Union Gas Incentives). For Georgetown Hospital, the potential incentive
from the Electricity Survey and Analysis could be:
30,000 ft2 x $0.10 = $3,000
111,700 ft2 x $0.05 = $5,585
Total = $8,585
To be eligible for this full amount, the eligible audit costs would have to be greater than
$17,170.
Additional funding for Detailed Analysis of Capital Improvements and Detailed Analysis
of Non-Capital Improvements are also available when following a Electricity Survey and
Analysis. The Capital Improvements Analysis is based on $0.05/ft up to $10,000. The
Non-Capital Intensive funding is capped at $5,000.
For more information go to https://saveonenergy.ca/Business/Program-Overviews/Audit-
Funding.aspx.
Union Gas also offers funding for Feasibility Studies based on 50% of eligible costs up to
$10,000.

Georgetown Hospital Energy Management Opportunities Page 28
Implementation – Conventional Procurement
Following the audit stage, you will have sufficient confidence in the costs, savings and
incentives to embark on project implementation with confidence. Further design
engineering may be required to develop specifications and design drawings but the final
outcome should still be reasonably certain.
When undertaking a conventional procurement approach, it can be done on a ‘measure by
measure’ basis or comprehensively. Organizations sometimes elect to proceed on a
‘measure by measure’ basis, focussing on the low payback options first. The challenge
with this approach is that it then becomes harder to secure funding for the longer payback
measures that must stand on their own financially. This is particularly true of
improvements like HVAC that provide for extensive infrastructure renewal.
Unfortunately, this benefit is not well reflected in a simple payback analysis.
The greatest challenge usually faced by organizations looking to implement energy
efficiency improvements is access to capital. This assessment has suggested that it would
require investment of approximately $1.5 million to have a meaningful impact on your
operating costs. This is a sizeable investment and often must compete with other
priorities in the hospital that perhaps have a greater impact on patient care.
Implementation – Energy Performance Contracting
An alternative to conventional procurement is to use Energy Performance Contracting
(EPC) as the delivery method. EPC is a proven contracting approach used by specialist
firms who provide a turn-key solution of design, construction, financing and ongoing
performance management. It is well suited to larger projects (> $1 million) that involve a
wide range of systems and can generate large energy savings.
EPC offers some advantages over conventional procurement that may be of interest to
Georgetown Hospital
In-house energy experts who are intimately familiar with the energy implications
of design decisions
Turnkey abilities from audit to design, construction, commissioning and ongoing
performance management
Ability to provide 3rd party financing for construction to avoid competing for
limited internal capital
Energy savings performance guarantees to ensure the financial viability of the
project
EPC has been used extensively in the public sector in Canada and there a numerous local
firms that have the resources and expertise for a project like this one.

Georgetown Hospital Energy Management Opportunities Page 29
Appendix – Electric Equipment Inventory
Lighting
Area Description Type Operation Number
Hospital General Lighting 2x4' T8 Baseload 300
Hospital Room Lighting 2x4' T8 Daytime 250
Hospital Above Bed 1x4' T12 (2 per bed) Daytime 66
Tunnel Hallways 2x4' T12 Baseload 100
Bennett General Lighting 2x4' T12 Baseload 900
Bennett Room Lighting 2x4' T12 Daytime 600
Bennett Above Bed 1x4' T12 (2 per bed) Daytime 50
Exterior Parking 2 x 400 w HPS Nighttime 3
Exterior Pathway/Driveway 1 x 70 w HPS Nighttime 39
Exterior Wallpacks Misc. HPS, MH Nighttime 8
Exterior Bennett Entry 100 W Incandescent Nighttime 6
HVAC
Area Name/Tag Total
Fan
Power
Cooling
Type
Cooling
Capacity
(tons)
Heating
Type
Notes
Hospital RTU1 5 DX 7.4 HW
Hospital RTU2 5 DX 10.6 HW
Hospital RTU3 5 DX 12.1 HW
Hospital RTU4 5 DX 7.4 HW
Hospital RTU5 5 DX 21.7 HW
Hospital RTU6 12.5 DX 20.7 HW
Hospital RTU7 7 DX 15.2 HW
Hospital S2 5 DX 13.2 HW
Hospital S4 3 DX 14.4 HW
Hospital S6 20 CW HW Estimate, no data
Hospital S7 2 DX 5 HW Estimate, no data
Hospital MZU 22.5 CW Steam
Tunnel AHU6 0.5 DX 1.5 HW
Bennett AHU1 15 CW None Estimate, no data
Bennett AHU2 15 CW HW Multi-zone, estimate,
no data

Georgetown Hospital Energy Management Opportunities Page 30
Area Name/Tag Total
Fan
Power
Cooling
Type
Cooling
Capacity
(tons)
Heating
Type
Notes
Bennett AHU3 15 CW None Estimate, no data;
multizone unit
Bennett AHU4 1 None None Estimate, electrical
room
Bennett AHU5 2 None HW Estimate, kitchen
MUA
Bennett AHU7 10 DX 25 HW Estimate, no data
Bennett AHU8 10 DX 25 HW Estimate, no data
Bennett AHU9 10 DX 25 HW Estimate, no data
Bennett RTU1B 2 DX 5 Gas
Bennett RTU2B 5 DX 8 Gas
Bennett RTU3B 3 DX 7 Gas
Bennett RTU4B 2 DX 5 Gas
Bennett RTU5B 7.5 CW HW
Bennett RTU6B 7.5 CW HW
Area Name/Tag Cooling
Capacity
(tons)
Notes
Hospital Chiller 80 Packaged, air-cooled
Bennett Chiller 80 Packaged, air cooled