energy harvesting on highway bridges - okladot.state.ok.us · the other fundamental problem with...
TRANSCRIPT

ENERGY HARVESTING ON HIGHWAY BRIDGES
FINAL REPORT - FHWA-OK-11-01 ODOT SPR ITEM NUMBER 2224
By
J. David Baldwin, Ph.D., P.E. Associate Professor
Samuel Roswurm Justin Nolan
Graduate Research Assistants
Lisa Holliday, Ph.D. Research Associate
School of Aerospace & Mechanical Engineering University of Oklahoma
Norman, OK 73019
Submitted to
Oklahoma Department of Transportation Planning and Research Division 200 N.E. 21st Street, Room 3A7
Oklahoma City, OK 73105
January 2011

ii
TECHNICAL REPORT DOCUMENTATION PAGE
1. REPORT NO. FHWA-OK-11-01
2. GOVERNMENT ACCESSION NO.
3. RECIPIENT=S CATALOG NO.
4. TITLE AND SUBTITLE Energy Harvesting on Highway Bridges
5. REPORT DATE
January 2011 6. PERFORMING ORGANIZATION CODE
7. AUTHOR(S)
J. David Baldwin, Samuel Roswurm, Justin Nolan, and Lisa Holliday
8. PERFORMING ORGANIZATION REPORT
9. PERFORMING ORGANIZATION NAME AND ADDRESS University of Oklahoma
School of Aerospace & Mechanical Engineering
865 Asp Avenue, Room 212
Norman, OK 73019
10. WORK UNIT NO.
11. CONTRACT OR GRANT NO. ODOT SPR Item Number 2224
12. SPONSORING AGENCY NAME AND ADDRESS Oklahoma Department of Transportation Planning and Research Division 200 N.E. 21st Street, Room 3A7 Oklahoma City, OK 73105
13. TYPE OF REPORT AND PERIOD COVERED Final Report November 2009 – November 2010 14. SPONSORING AGENCY CODE
15. SUPPLEMENTARY NOTES
16 . ABSTRACT A concept for harvesting energy from the traffic-induced loadings on a highway bridge using piezoelectric materials to generate electricity was explored through the prototype stage. A total of sixteen lead-zirconate titanate (PZT) Type 5A piezoelectric wafers [0.080 inch (2.0 mm) thick] were attached to the steel shims of a six-layer bridge bearing; 60-durometer rubber sheets separated the shims. The outputs of the piezoelectric wafers were each sent through 480-ohm load resistors, and the voltage drops across the resistors were measured to estimate instantaneous power output and overall energy generation. The prototype energy harvesting bridge bearing was subjected to cyclic force loading (square wave) with mean load, load amplitude, and loading frequency being the experimental parameters. The highest observed energy generation of 1.253×10⁻⁶ W·hr occurred with a mean load of 10 kip (44.5 kN), a load amplitude of 4 kip (17.8 kN) and a frequency of 1.5 Hz. The concept of generating electric power from a piezoelectric-wafer-equipped bridge bearing was proven, but the energy generated was well below what would be required to operate a modest electrical load.
17. KEY WORDS Energy harvesting, bridge bearing, piezoelectric material, power generation
18. DISTRIBUTION STATEMENT No restrictions. This publication is available from the Planning & Research Div., Oklahoma DOT.
19. SECURITY CLASSIF. (OF THIS REPORT) Unclassified
20. SECURITY CLASSIF. (OF THIS PAGE) Unclassified
21. NO. OF PAGES
26
22. PRICE
N/A
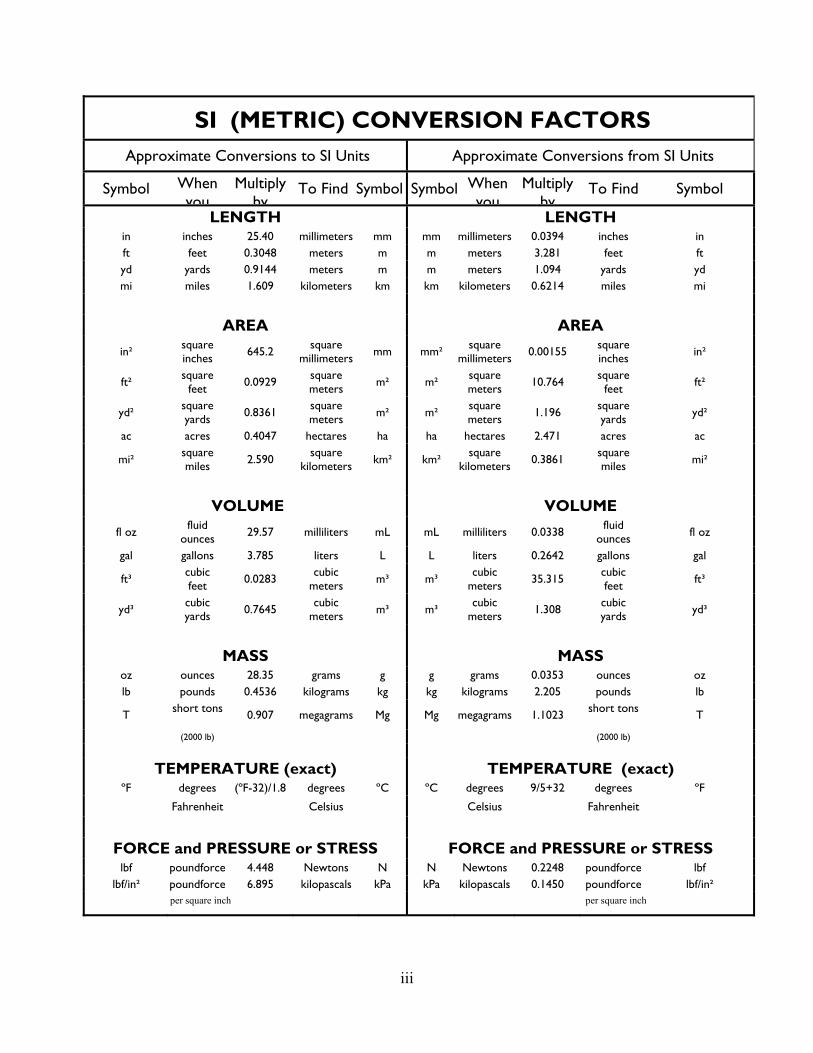
SI (METRIC) CONVERSION FACTORS Approximate Conversions to SI Units Approximate Conversions from SI Units
Symbol When you
Multiply by
To Find Symbol Symbol When you
Multiply by
To Find Symbol
LENGTH in inches 25.40 millimeters mm ft feet 0.3048 meters m yd yards 0.9144 meters m mi miles 1.609 kilometers km
AREA
in² square inches 645.2
square millimeters mm
ft² square
feet 0.0929
square meters
m²
yd² square yards
0.8361 square meters
m²
ac acres 0.4047 hectares ha
mi² square miles 2.590
square kilometers km²
VOLUME
fl oz fluid
ounces 29.57 milliliters mL
gal gallons 3.785 liters L
ft³ cubic feet
0.0283 cubic
meters m³
yd³ cubic yards 0.7645
cubic meters m³
LENGTH mm millimeters 0.0394 inches in m meters 3.281 feet ft m meters 1.094 yards yd km kilometers 0.6214 miles mi
AREA
mm² square
millimeters 0.00155 square inches in²
m² square meters
10.764 square
feet ft²
m² square meters
1.196 square yards
yd²
ha hectares 2.471 acres ac
km² square
kilometers 0.3861 square miles mi²
VOLUME
mL milliliters 0.0338 fluid
ounces fl oz
L liters 0.2642 gallons gal
m³ cubic
meters 35.315
cubic feet
ft³
m³ cubic
meters 1.308 cubic yards yd³
MASS oz ounces 28.35 grams g lb pounds 0.4536 kilograms kg
T short tons 0.907 megagrams Mg
(2000 lb)
TEMPERATURE (exact) ºF degrees (ºF-32)/1.8 degrees ºC
Fahrenheit Celsius
FORCE and PRESSURE or STRESS lbf poundforce 4.448 Newtons N
lbf/in² poundforce 6.895 kilopascals kPa per square inch
MASS g grams 0.0353 ounces oz kg kilograms 2.205 pounds lb
Mg megagrams 1.1023 short tons T
(2000 lb)
TEMPERATURE (exact) ºC degrees 9/5+32 degrees ºF
Celsius Fahrenheit
FORCE and PRESSURE or STRESS N Newtons 0.2248 poundforce lbf
kPa kilopascals 0.1450 poundforce lbf/in² per square inch
iii

The contents of this report reflect the views of the author(s) who is responsible for the facts and the accuracy of the data presented herein. The contents do not necessarily reflect the views of the Oklahoma Department of Transportation or the Federal Highway Administration. This report does not constitute a standard, specification, or regulation. While trade names may be used in this report, it is not intended as an endorsement of any machine, contractor, process, or products.
iv

Table of Contents
List of Figures .................................................................................................................... vi
List of Tables .................................................................................................................... vii
Introduction......................................................................................................................... 1
Objectives ........................................................................................................................... 1
Background......................................................................................................................... 1
Solution Constraints............................................................................................................ 2
Implementation ................................................................................................................... 3
Tasks ................................................................................................................................... 4
Prototype Energy Harvesting Bearing Development .......................................................... 5
Bridge Bearing Specification.......................................................................................... 5
Piezoelectric Wafer Selection ......................................................................................... 6
Bearing Compression Test Fixtures ................................................................................ 7
"Pre-Prototype" Bearing Assemblies .............................................................................. 7
Energy Harvesting Bearing Assembly............................................................................ 9
Bearing Prototype Performance Evaluation ...................................................................... 11
Results........................................................................................................................... 12
Concluding Remarks ......................................................................................................... 17
Literature Cited/References .............................................................................................. 17
v

List of Figures
Figure 1: Crystal Dipoles [1] .............................................................................................. 2 Figure 2: Crystal Charge Production Under Mechanical Stress [1] ................................... 3 Figure 3: Steel shim layers for the bridge bearing .............................................................. 5 Figure 4: Elastomeric rubber layers for the bridge bearing ................................................ 6 Figure 5: Bearing Compression Test Fixtures .................................................................... 7
Figure 6: "Pre-Prototype" Bearing Plate............................................................................. 8 Figure 7: "Pre-Prototype Bearing" in the Test Machine ..................................................... 8
Figure 8: Six 0.080-Inch Thick Wafers on a Bearing Plate .............................................. 10 Figure 9: Fully-Assembled Bearing Prototype ................................................................. 10 Figure 10: Representative Voltage vs. Time (16 Wafers) ................................................ 12 Figure 11: Zoomed Voltage History ................................................................................. 13 Figure 12: Energy Accumulated With Varying Load Amplitude ..................................... 14 Figure 13: Energy Accumulated With Varying Loading Frequency ................................ 15 Figure 14: Energy Accumulation With Varying Mean Force .......................................... 16
vi

List of Tables
Table 1: Test Results for 10-kip Mean Load and 1 Hz. Cycling Frequency .................... 13 Table 2: Test Results for 10-kip Mean Load and 4-kip Load Amplitude ......................... 14 Table 3: Test Results for 4-kip Load Amplitude and 1 Hz. Cycling Frequency .............. 15
vii

Introduction Oklahoma’s transportation infrastructure is easily seen as presenting a crisis/opportunity scenario. This state has a bewildering collection of the worst problems affecting transportation facilities, including cold prairie winters, tropical summertime heat, major rivers lying within or on the state’s boundaries, and a chronic lack of finances for its sprawling distributed transportation resources.
The research reported here considered one of the most important venues for tackling such challenges, as it considered a path toward harvesting energy from the ambient (i.e., traffic-induced) vibrations of bridges as a means of providing electrical power that could be used to drive sensor, lighting, and other systems.
Objectives The primary goals of this research project were these:
(1) finding safe, reliable, and cost-effective ways to harvest the energy of vehicular traffic to permit power to be delivered to essential electrical systems along Oklahoma highways
(2) Deploying the proposed technologies under laboratory conditions to evaluate the state of the art in energy harvesting for transportation electrical systems.
Background The fundamental problem investigated in this project was that of harvesting power from vehicles traveling over highway bridges, so that the energy obtained could be utilized to support essential bridge systems such as sensors, lighting, and signage. The fundamental technical barrier that must be overcome here is that the energy created by vehicles traveling over bridges is necessarily distributed and low in intensity, so that it is readily lost to heat or other dissipative effects, e.g., local wind gusts as vehicles pass over the bridge. Thus the goals of this research are constrained by well-established thermodynamic principles that limit an engineer’s ability to design systems to harvest concentrated high-quality energy supplies from distributed low-quality energy sources.
The cost-effective harvesting of energy from vehicle motions over transportation facilities is an important technology for realizing the goal of sustainable infrastructure. The largest fraction of current greenhouse gas emissions are the by-product of burning coal to generate electricity, and because of fundamental limitations in propagation of electrical current through the grid, electrical losses are especially significant when power supplies are located far from their uses. Thus the lighting, signage, and sensor systems of remote highway bridges represent an important venue for reducing pollution and fossil fuel use, but only if locally-generated energy supplies can be developed to replace central-station electrical generation technologies.
Many local generation schemes have been proposed over the past few decades, since the U.S. energy crisis of the early 1970’s. Most of these proposed approaches utilize some form of energy transmission whereby vehicular motions drive fluid mechanical systems (either using compressed-air or hydraulic fluid technologies to carry the harvested energy
1

to a nearby conversion facility), which in turn are used to concentrate the distributed vibrations resulting from vehicles into a form more amenable for generating electrical currents.
Unfortunately, these schemes suffer from several limiting factors, including the all-important ramifications of the Second Law of Thermodynamics, which places very strict constraints on the real-world utility of these indirect-conversion methods. But since these methods have been proposed in the past, one of the key tasks in the proposed research plan will be to survey those harvesting techniques known already, so that they can be evaluated on the basis of their real-world utility and their scalability to permit larger supplies of energy to be harvested.
The other fundamental problem with energy-harvesting technologies is the same problem affecting all energy-generation methods, namely the problem of safely storing the resulting energy for use when generation capability is impaired. This problem is essential to solve as a key component of any national energy strategy, but in the near term, this storage problem is not as important for traffic-generated systems such as warning signs, because when no vehicles are present to generate electricity, no such warnings are necessary. But as national energy R&D investments in scalable energy storage are developed in the near future, these advancements will serve to improve the performance of the energy-harvesting technologies suggested below.
Solution Constraints The fundamental problem to be addressed in this project was to employ piezoelectric elements in a prototype bridge bearing with the goal of producing a useable amount of electrical power from compressive loading.
The chosen approach was to use a direct conversion of mechanical energy into electrical energy using the well-known technology known as the piezoelectric effect (with piezo translating from Greek as “pressure”, thus “pressure-generated electricity”). The piezoelectric effect naturally occurs in polycrystalline structures with no center of symmetry where the polar axes of dipoles have no common direction (Figure 1).
Figure 1: Crystal Dipoles [1]
When a compressive mechanical stress is applied to the crystal, the initially randomly oriented polar axes become aligned and produce an electric charge on the crystal surface, Figure 2.
2
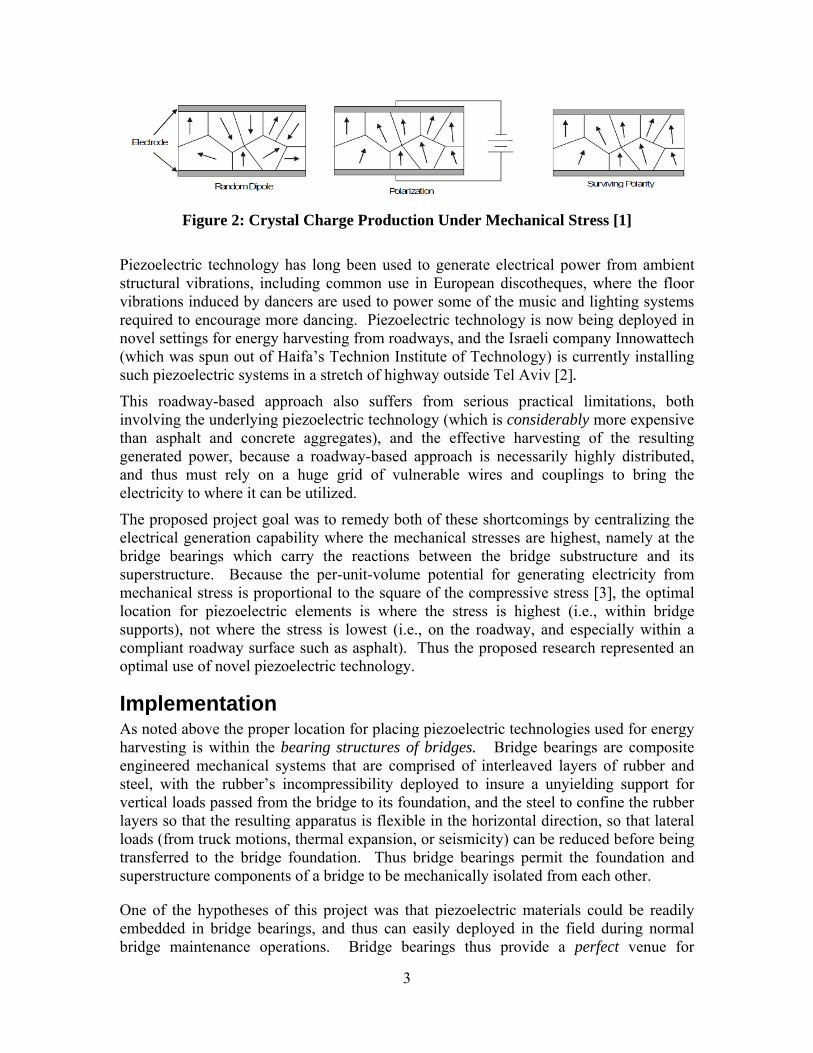
Figure 2: Crystal Charge Production Under Mechanical Stress [1]
Piezoelectric technology has long been used to generate electrical power from ambient structural vibrations, including common use in European discotheques, where the floor vibrations induced by dancers are used to power some of the music and lighting systems required to encourage more dancing. Piezoelectric technology is now being deployed in novel settings for energy harvesting from roadways, and the Israeli company Innowattech (which was spun out of Haifa’s Technion Institute of Technology) is currently installing such piezoelectric systems in a stretch of highway outside Tel Aviv [2].
This roadway-based approach also suffers from serious practical limitations, both involving the underlying piezoelectric technology (which is considerably more expensive than asphalt and concrete aggregates), and the effective harvesting of the resulting generated power, because a roadway-based approach is necessarily highly distributed, and thus must rely on a huge grid of vulnerable wires and couplings to bring the electricity to where it can be utilized.
The proposed project goal was to remedy both of these shortcomings by centralizing the electrical generation capability where the mechanical stresses are highest, namely at the bridge bearings which carry the reactions between the bridge substructure and its superstructure. Because the per-unit-volume potential for generating electricity from mechanical stress is proportional to the square of the compressive stress [3], the optimal location for piezoelectric elements is where the stress is highest (i.e., within bridge supports), not where the stress is lowest (i.e., on the roadway, and especially within a compliant roadway surface such as asphalt). Thus the proposed research represented an optimal use of novel piezoelectric technology.
Implementation As noted above the proper location for placing piezoelectric technologies used for energy harvesting is within the bearing structures of bridges. Bridge bearings are composite engineered mechanical systems that are comprised of interleaved layers of rubber and steel, with the rubber’s incompressibility deployed to insure a unyielding support for vertical loads passed from the bridge to its foundation, and the steel to confine the rubber layers so that the resulting apparatus is flexible in the horizontal direction, so that lateral loads (from truck motions, thermal expansion, or seismicity) can be reduced before being transferred to the bridge foundation. Thus bridge bearings permit the foundation and superstructure components of a bridge to be mechanically isolated from each other.
One of the hypotheses of this project was that piezoelectric materials could be readily embedded in bridge bearings, and thus can easily deployed in the field during normal bridge maintenance operations. Bridge bearings thus provide a perfect venue for
3

embedding piezoelectric materials for power harvesting, as these bearings satisfy some specific requirements that match up perfectly to the natural requirements of any effective piezoelectric harvesting capability:
• the compressive mechanical stresses that are required for optimal piezoelectric generation are maximized in the bridge bearings
• the bearings are repetitive elements, so that as more power is needed, additional bearings can be placed under adjacent girders to handle the increased power generation needs
• bearings permit relatively large volumes to be utilized in the piezoelectric design, so that the greater volume of material can generate concomitant larger supplies of electric power
• bearings are located in positions between the foundation and the bridge superstructure that are protected from disruptive elements (e.g., environmental degradation, curious citizens, etc.) that might degrade the performance (or existence) of piezoelectric components placed in more accessible locations
• bearings are centralized in location at the ends of the main structural girders, so that it is easy to deploy the electrical networks required to distribute power from the bearing generators to where it is needed for powering sensors, lights, and signs, and
• bearings are commonly replaced on heavily-traveled bridges, so that installing a new piezoelectric generation system is a task that is already well-understood by existing bridge maintenance personnel.
Tasks The scope of the project followed naturally from the technical material above, including the project goals and motivations. The project scope included the various strategies required to realize these project goals, including:
(a) Investigations into the feasibility of piezoelectric-based energy harvesting methods,
(b) Assessment of competing best-currently-available technology for use in piezoelectric harvesting applications relevant to this project,
(c) A scaled laboratory prototype demonstrations of the results of (a) and (b)
Plan tasks were derived directly from strategies required to reach the project goals, including the key tasks outlined below.
Goal (1): Finding safe, reliable, and cost-effective ways to harvest the energy of vehicular traffic to permit power to be delivered to essential electrical systems along Oklahoma highways
Tasks (Goal 1)
(a) preliminary investigations of currently-available commercial piezoelectric materials, based on cost, conversion efficiencies, reliability, and constructability considerations
(b) preliminary design evaluations for bridge bearing structures that can be safely assumed to both generate sufficient electricity and carry required reaction loads
4

between the bridge foundation and its superstructure
Goal (2): deploying the best resulting technologies under laboratory conditions to evaluate the state of the art in energy harvesting for transportation electrical systems.
Tasks (Goal 2)
(a) Construction of initial laboratory prototype based on outcomes of Tasks (1)
(b) Suggested refinement of designs for future deployment in operational settings.
Our findings from the Goal 1 investigations were implemented into the Goal 2 laboratory prototypes as noted in the following.
Prototype Energy Harvesting Bearing Development The core element of this investigation was the specification, build-up, and performance evaluation of the energy harvesting bridge bearing assembly. This involved selecting the bearing base material (in the form of a commercially-available bearing), specifying and installing the piezoelectric wafers, building the test fixtures, assembling the data acquisition system for capturing the piezoelectric system output, and conducting laboratory experiments that mimic the bridge's vehicle-induced loading passing through the bearing assembly.
Bridge Bearing SpecificationOur goal in constructing the bearing prototype was to conform as closely as possible to current ODOT bearing specifications and to use as "typical" a bearing as possible. After consultation with ODOT engineers, the Type IV bridge bearing (@ 80 foot span), quoted from Oklahoma Department of Transportation Bridge Standard B40-I-BRG-PC4BT [4] with 60 durometer rubber layers [5], was ordered from Seismic Energy Corp. in Athens, TX. The overall bearing nominal dimensions are 3-1/8" x 6" x 26"; it was ordered without the final heat treatment that adheres the layers to allow the team to easily insert piezoelectric wafers between the layers. The 11-gauge steel shims are shown in Figure 3, and the elastomer sheets are shown in Figure 4.
Figure 3: Steel shim layers for the bridge bearing
5

Figure 4: Elastomeric rubber layers for the bridge bearing
Upon inspection of the bearing components, we found that the elastomeric material was stickier than expected. We decided that the piezoelectric wafers could stick to the elastomeric material too firmly making it too difficult to reposition the components during assembly. Due to this complication, we decided to build a smaller simplified version (6 in. × 12 in.) of the bearing pad with a less sticky rubber layer (same durometer hardness, however) to establish our piezoelectric material mounting and wiring procedures prior to assembling the larger test assembly. This "pre-prototype" bearing will be discussed below.
Piezoelectric Wafer Selection Commercially-available piezoelectric materials in the wafer form used here typically are lead-zirconate-titanate (PZT) crystals in either the 5A alloy (Navy Type II) or the 5H alloy (Navy Type IV). Both alloys consist of 60-70% lead, 20-25% zirconium oxide, 1015% titanium oxide, and the balance lanthanum oxide. The primary discriminators between the two materials are in the values of the piezoelectric constitutive constants that favor the 5H alloy as a higher-output material. A NASA study [6] showed that the PZT-5 family delivered favorable material properties in comparison with other candidate alloys, with 5H showing the highest piezoelectric properties including electromechanical coupling coefficient, transverse strain constant, extensional strain constant, followed by 5A.
For this project, square piezoelectric wafers with an area of 2.85 × 2.85 inches and nicle electrodes were ordered from Piezo Products Inc. as follows: Type 5A, 0.0105 in. thick (PN T110-A4E-642); Type 5A, 0.080 in. thick (P/N T180-A4E-602); and Type 5H, 0.0105 in. thick (P/N T110-H4E-642).
6
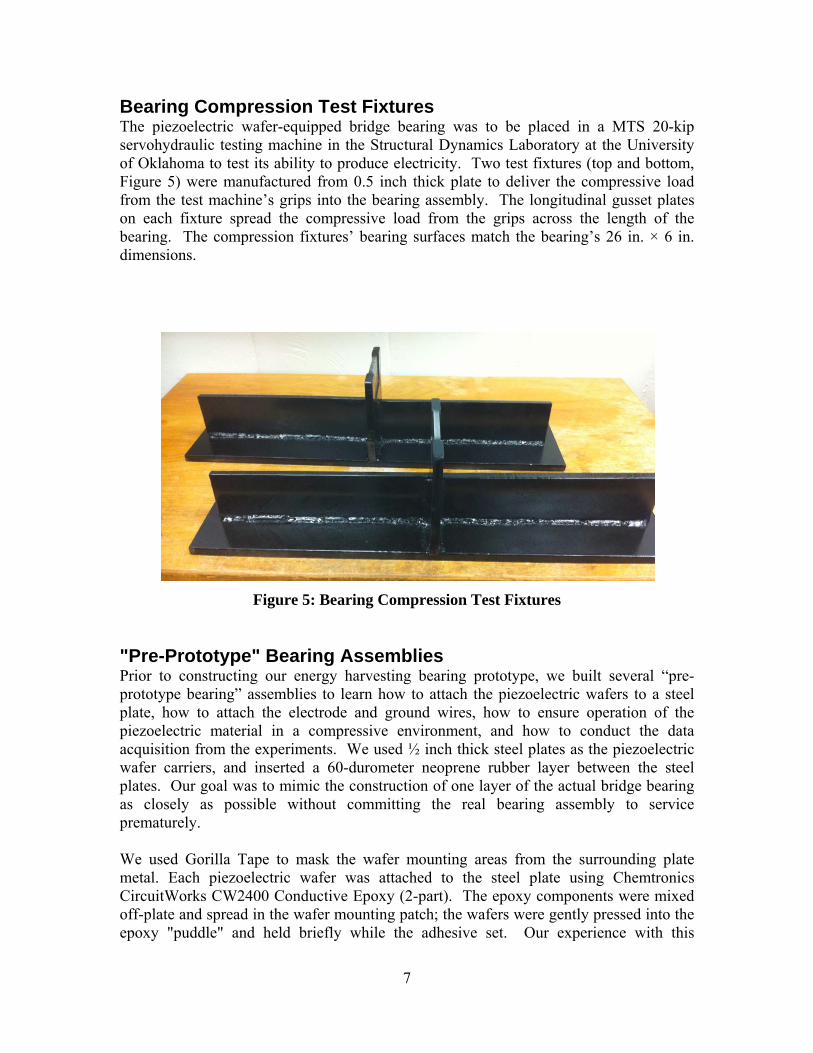
Bearing Compression Test FixturesThe piezoelectric wafer-equipped bridge bearing was to be placed in a MTS 20-kip servohydraulic testing machine in the Structural Dynamics Laboratory at the University of Oklahoma to test its ability to produce electricity. Two test fixtures (top and bottom, Figure 5) were manufactured from 0.5 inch thick plate to deliver the compressive load from the test machine’s grips into the bearing assembly. The longitudinal gusset plates on each fixture spread the compressive load from the grips across the length of the bearing. The compression fixtures’ bearing surfaces match the bearing’s 26 in. × 6 in. dimensions.
Figure 5: Bearing Compression Test Fixtures
"Pre-Prototype" Bearing Assemblies Prior to constructing our energy harvesting bearing prototype, we built several “pre-prototype bearing” assemblies to learn how to attach the piezoelectric wafers to a steel plate, how to attach the electrode and ground wires, how to ensure operation of the piezoelectric material in a compressive environment, and how to conduct the data acquisition from the experiments. We used ½ inch thick steel plates as the piezoelectric wafer carriers, and inserted a 60-durometer neoprene rubber layer between the steel plates. Our goal was to mimic the construction of one layer of the actual bridge bearing as closely as possible without committing the real bearing assembly to service prematurely.
We used Gorilla Tape to mask the wafer mounting areas from the surrounding plate metal. Each piezoelectric wafer was attached to the steel plate using Chemtronics CircuitWorks CW2400 Conductive Epoxy (2-part). The epoxy components were mixed off-plate and spread in the wafer mounting patch; the wafers were gently pressed into the epoxy "puddle" and held briefly while the adhesive set. Our experience with this
7

adhesive was that it began to cure very quickly after the wafer was in contact. When fully cured, the conductive epoxy made very strong a mechanical connection between the wafer and steel plate with a very low electrical resistance, i.e., it made a very good electrical connection as well. Alpha Wire model 3051 22 AWG stranded wires were used as electrode (red) and ground (black) wiring and were attached to the piezoelectric wafers and plates using the conductive epoxy. In these "pre-prototypes", we installed a ground wire for each piezoelectric wafer, but in later assemblies we used a single ground for the entire plate.
Figure 6 shows one of the “pre-prototype bearings” outfitted with three 0.080 inch thick piezoelectric wafers ready for testing; Figure 7 shows that specimen in the test machine.
Figure 6: "Pre-Prototype" Bearing Plate
Figure 7: "Pre-Prototype Bearing" in the Test Machine
8

In the construction and initial load cycling of the "pre-prototypes", we learned some important lessons that guided our build-up of the full bearing prototype. The piezoelectric wafers, especially the 0.0105 inch thick ones, are very brittle and can break if handled improperly. The thicker 0.080 inch thick plates are more robust to handling, but can still crack if they are not supported fully by the adhesive. Thus, it was important to assure a full adhesive bond line on the bottom of the wafer. Gaps and cavities made the unsupported part of the wafer prone to cracking and fracture.7
Our initial testing results with these “bearing” assemblies (Figure 7) employed a multimeter to capture the voltage and current output from the wafers individually. In the full bearing prototype, this would be inadequate, however, for two reasons: 1) we could not read the very small current output by the wafers directly, and 2) when we moved to the bearing prototype with many more wafers we would need a multi-channel data acquisition system. For that series of experiments, we used a computer-based data acquisition system running LabVIEW software.
Energy Harvesting Bearing AssemblyWe prepared the bridge bearing shims for piezoelectric wafer attachment by masking the areas surrounding the wafer mounting patches and bead blasting the paint off the plate in those patches to ensure good electrical conductivity throughout the plate. Given the 2.85 × 2.85 inch square wafer size, we were able to put six wafers on each side of the 22-inch long bearing plates.
The piezoelectric wafers were installed on the bearing plates in the following manner: Qty. 6 of 0.0105-inch thick, Type 5A wafers on Plate 1 Qty. 6 of 0.0105-inch thick Type 5H wafers on Plate 2 Qty. 6 of 0.080-inch thick Type 5A wafers on Plates 3 and 4 Qty. 4 of 0.080-inch thick Type 5A wafers on Plate 5
Plate 5 had only four piezoelectric wafers because we ran out of stock and were unable to purchase more in time to support our performance testing schedule. All of these wafers were installed using the conductive epoxy and 22 gauge braided wire as noted before. A single ground wire (black) was used on the individual plates and an electrode wire (red) was attached to the individual wafers. Figure 8 below shows one of the five piezoelectric wafer-equipped plates with the 0.080-inch thick wafers mounted.
9
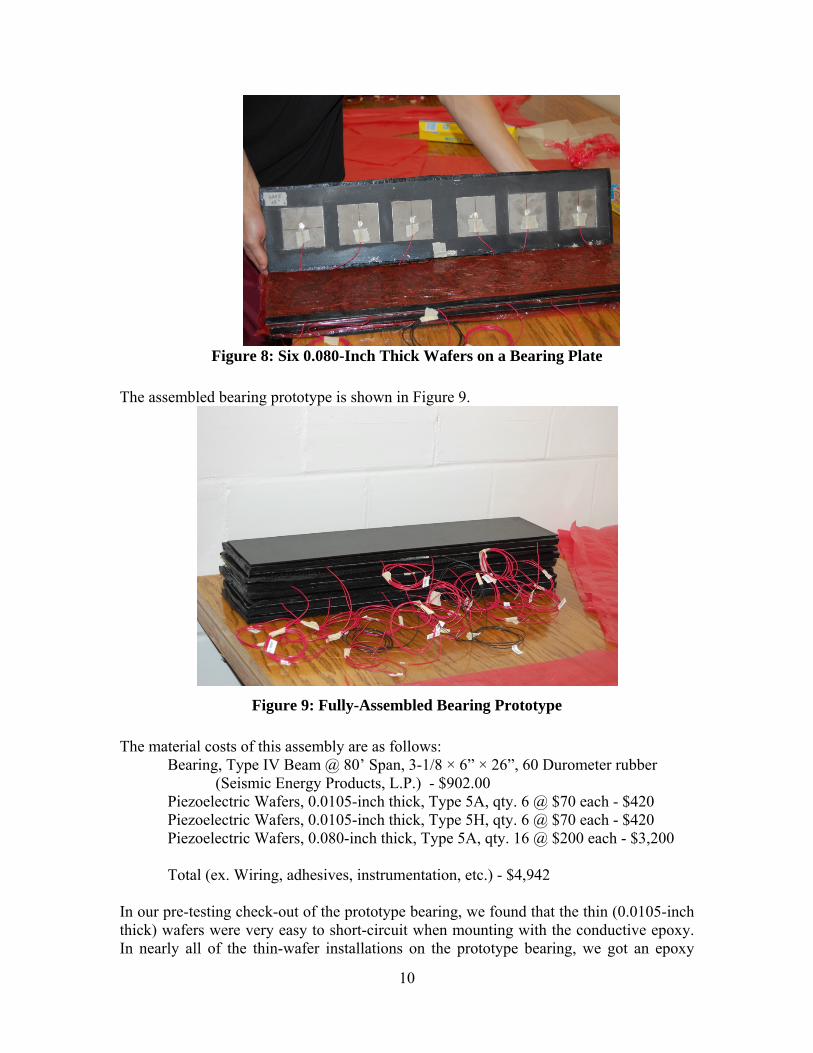
Figure 8: Six 0.080-Inch Thick Wafers on a Bearing Plate
The assembled bearing prototype is shown in Figure 9.
Figure 9: Fully-Assembled Bearing Prototype
The material costs of this assembly are as follows: Bearing, Type IV Beam @ 80’ Span, 3-1/8 × 6” × 26”, 60 Durometer rubber
(Seismic Energy Products, L.P.) - $902.00 Piezoelectric Wafers, 0.0105-inch thick, Type 5A, qty. 6 @ $70 each - $420 Piezoelectric Wafers, 0.0105-inch thick, Type 5H, qty. 6 @ $70 each - $420 Piezoelectric Wafers, 0.080-inch thick, Type 5A, qty. 16 @ $200 each - $3,200
Total (ex. Wiring, adhesives, instrumentation, etc.) - $4,942
In our pre-testing check-out of the prototype bearing, we found that the thin (0.0105-inch thick) wafers were very easy to short-circuit when mounting with the conductive epoxy. In nearly all of the thin-wafer installations on the prototype bearing, we got an epoxy
10
“bridge” along the wafer edge that electrically connected the bottom surface to the top surface of the wafer; this short circuits the wafer and renders it essentially useless. Because the wafer could not be removed from the plate after the epoxy sets, there is no remedy for the thin wafers. Several of the thick (0.080-inch thick) wafers were also short-circuited, but we were able to scrape the wafer edges with a razor knife, removing most of the offending epoxy and restoring some measure of operability to the wafer. We found, however, that these “repaired” wafers did not respond as vigorously to loading as did the wafers that were not short-circuited.
Bearing Prototype Performance Evaluation With the piezoelectric material-based energy harvesting bearing prototype fully assembled, we worked through our test protocols to determine its performance under cycling loads. We used a MTS 810 Material Test System (servohydraulic) to produce force-controlled compressive load histories in the bearing assembly and explored variations in mean force, force amplitude, and cycling frequency. These loads were intended to simulate the forces in the bearing induced by a heavy vehicle traveling over a bridge. Because of the 20-kip load limit of the machine, we did not have unlimited latitude in selecting mean-amplitude pairs for testing, and we were constrained by the bearing's stiffness in how high a load frequency we could use and maintain force waveform fidelity. In practice, we were able to use mean forces in the range 6-12 kips, amplitudes in the range 2-8 kips, and frequencies in the range 0.5-2.0 Hz. During testing, we found that a square-wave force profile produced the most vigorous response from the piezoelectric wafers in the bearing.
As noted above, we experienced short-circuiting in all of the 0.0105-inch thick wafers and were unable to gather energy from them. For the remaining 16 0.080-inch thick wafers, we measured the output voltage drop V across 480Ω load resistors as a measure of the bearing's energy production. The load resistors were necessary to make the piezoelectric wafers output a current. When a wafer was connected directly across a 50kΩ resistor of the data acquisition signal conditioner, the output current was determined by the DC circuit relationship
I VR
where V is the piezoelectric wafer output voltage, and R is the signal conditioner resistance (50kΩ in this case). For the millivolt output of these materials, the current will be negligibly small. By putting the 480Ω load resistor in the circuit, we reduced the equivalent circuit resistance and increased the current to measurable levels. We feel that this load resistor value is near-optimum for the current application.
For each channel of signal, we sampled the piezoelectric wafer output voltages at 1000 Hz. and computed the instantaneous power (Watts)
P Req WV 2
11
from each wafer. From all of the individual wafer instantaneous powers, we computed the total energy (Watt·seconds) dissipated in 2 seconds,
2 P dt Pi 2 [ ]E W s
0 i The performance tests results are summarized below.
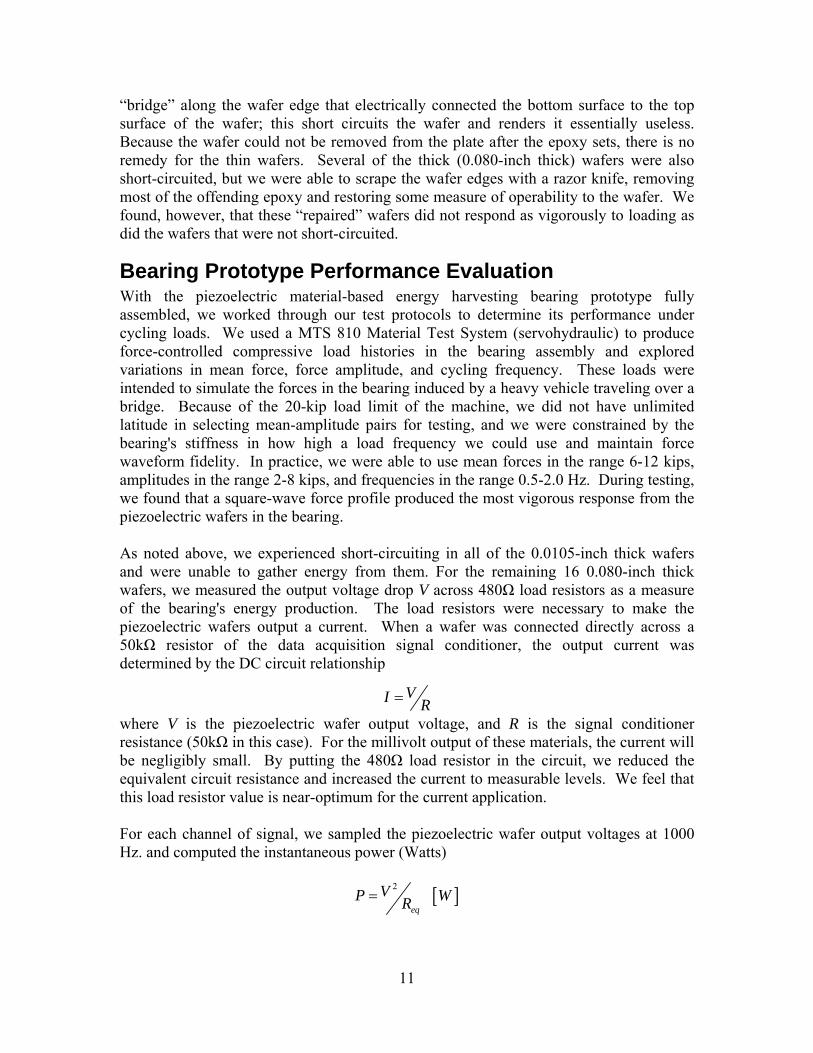
Results The energy generated by the 16 active piezoelectric wafers in five minutes of continuous cycling is summarized in the following discussion. To illustrate some general performance characteristics of the bearing prototype, a representative test data series is examined. Figure 10 shows typical combined voltage time histories from all 16 data channels simultaneously. Recall that this data set represents only the output of the thick (0.080 inch) Type 5A piezoelectric wafers.
Figure 10: Representative Voltage vs. Time (16 Wafers)
From this Figure, it can be seen that the 16 channels recorded were in phase, i.e., there were no lags in the response through the layers in the bearing. This is an important finding because we were concerned about the possibility of the material nonlinearity of the rubber layers causing out-of-phase voltage generation. We can also see that there appears to be some instances of reduced response in each spike. Figure 11 gives an improved view of the performance of each individual channel.
12
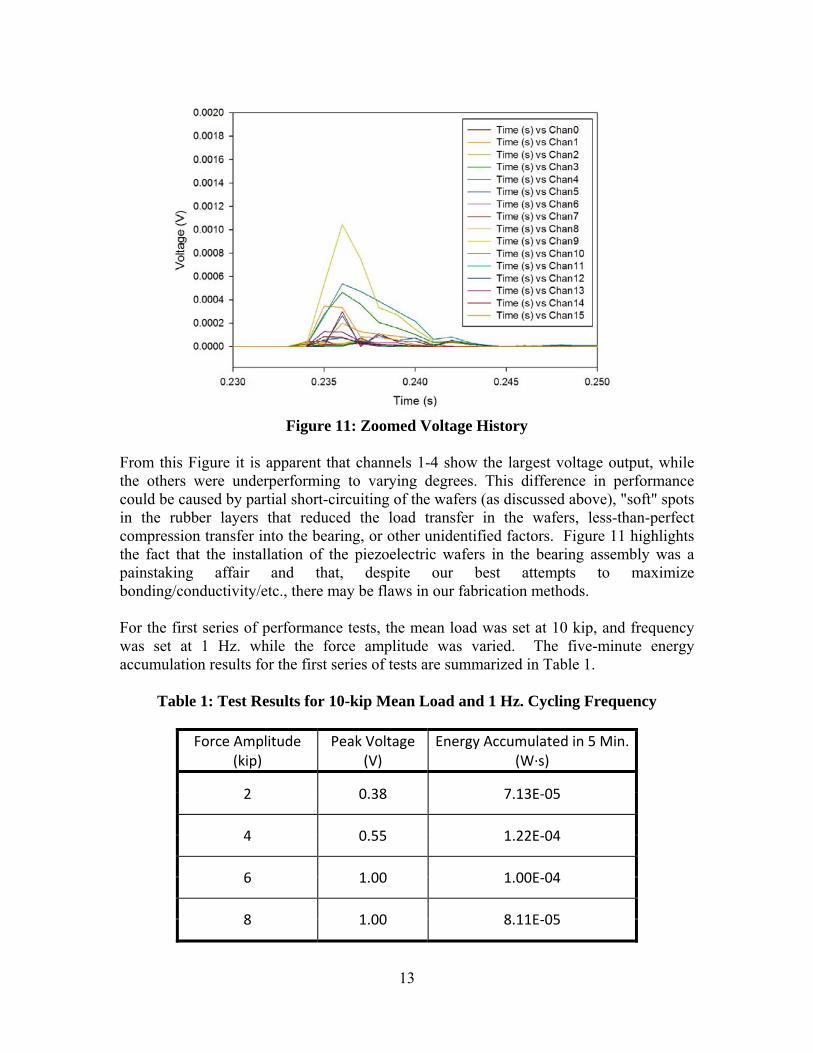
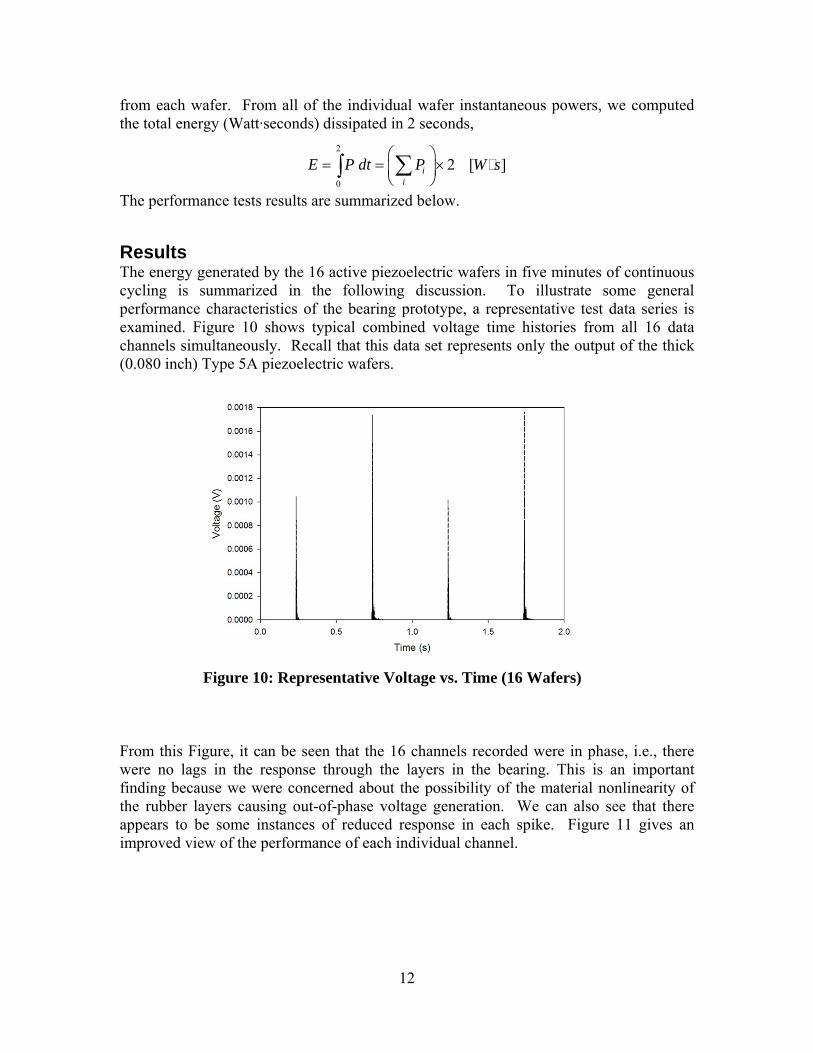
Figure 11: Zoomed Voltage History
From this Figure it is apparent that channels 1-4 show the largest voltage output, while the others were underperforming to varying degrees. This difference in performance could be caused by partial short-circuiting of the wafers (as discussed above), "soft" spots in the rubber layers that reduced the load transfer in the wafers, less-than-perfect compression transfer into the bearing, or other unidentified factors. Figure 11 highlights the fact that the installation of the piezoelectric wafers in the bearing assembly was a painstaking affair and that, despite our best attempts to maximize bonding/conductivity/etc., there may be flaws in our fabrication methods.
For the first series of performance tests, the mean load was set at 10 kip, and frequency was set at 1 Hz. while the force amplitude was varied. The five-minute energy accumulation results for the first series of tests are summarized in Table 1.
Table 1: Test Results for 10-kip Mean Load and 1 Hz. Cycling Frequency
Force Amplitude (kip)
Peak Voltage (V)
Energy Accumulated in 5 Min. (W∙s)
2 0.38 7.13E‐05
4 0.55 1.22E‐04
6 1.00 1.00E‐04
8 1.00 8.11E‐05
13

The peak voltage clearly increased with amplitude, while energy seems to peak at the median amplitude. This trend is shown in Figure 12 where the maximum response is highlighted.
Mean Force = 10 kip; Frequency = 1 Hz. E
nerg
y G
ene
rate
d -
5 m
inu
tes
(Ws)
0.00000
0.00002
0.00004
0.00006
0.00008
0.00010
0.00012
0.00014
0 2 4 6 8 10
Force Amplitude (kip)
Figure 12: Energy Accumulated With Varying Load Amplitude
The second test series was performed while holding mean force constant at 10 kip, the amplitude constant at 4 kip and varying the cycling frequency. The five-minute energy accumulation results are summarized in Table 2.
Table 2: Test Results for 10-kip Mean Load and 4-kip Load Amplitude
Cycling Frequency (Hz)
Peak Voltage (V)
Energy Accumulated in 5 min. (W∙s)
0.5 0.55 8.19E‐05
1.0 0.65 5.48E‐05
1.5 0.65 1.67E‐04
2.0 0.60 1.44E‐04
14

Here, voltage peaked at mid-range frequency values, while energy accumulated appears to oscillate. It makes intuitive sense that the energy production should increase with cycling frequency because the wafers experience more cycles in the test period. It is not clear why the energy falls at 2.0 Hz., but it could be caused by the inherent nonlinearity in the bearing materials retarding the force waves in the assembly. This trend is shown in Figure 13 where the maximum response is highlighted.
Mean Force = 10 kip; Amplitude = 4 kip
Ene
rgy
Gen
era
ted
- 5
Min
ute
s (W
s)
0.00000
0.00002
0.00004
0.00006
0.00008
0.00010
0.00012
0.00014
0.00016
0.00018
0.5 Hz 1Hz 1.5 Hz 2.0 Hz
Frequency (Hz.)
Figure 13: Energy Accumulated With Varying Loading Frequency
For the third series of tests, the force amplitude was held constant at 4 kip and the frequency was held constant at 1 Hz. while the mean force was varied. These results are summarized in Table 3.
Table 3: Test Results for 4-kip Load Amplitude and 1 Hz. Cycling Frequency
Mean Force (kip)
Peak Voltage (V)
Energy Accumulated in 5 Min. (W∙s)
6 1.05 1.28E‐04
10 0.65 1.02E‐04
12 0.65 8.68E‐05
15

In this case the voltage values decreased with mean load, while energy accumulated did not appear to substantially change. This trend is shown in Figure 14.
Amplitude = 4 kip; Frequency = 1 Hz.
Ene
rgy
Gen
era
ted
- 5
Min
ute
s (W
s)
0.00014
0.00012
0.00010
0.00008
0.00006
0.00004
0.00002
0.00000
4 kip 6 kip 10 kip 12 kip
Mean Force (kip)
Figure 14: Energy Accumulation With Varying Mean Force
The over-all performance trend for the energy harvesting bearing is that voltage peak increases with the difference between mean load and amplitude. This is supported by the first series of tests in which the amplitude increased from 2 to 8 kip (Figure 12), and the third series of tests in which the mean was increasing relative to the amplitude (Figure 14). Another clear trend can be seen in the second series of tests (Figure 13). Here, the energy accumulated increases with frequency. This is as expected, because increasing frequency results in more compression/relaxation cycles and, hence, more charges from the piezoelectric material. Finally, we observe from these Figures that there seems to be enhanced energy production near the conditions Mean = 6-10 kip, Amplitude = ~4 kip, Frequency = ~1.5 Hz.
For all of our tests, the largest observed 5-minute energy production was 1.670×10⁻⁴ W·s, which equates to 5.567×10⁻⁷ W·hr over 60 minutes. By scaling this production to a full 36-piezo wafer installation, we would expect a maximum energy yield of approximately Emax = 1.253×10⁻⁶ W·hr. As a point of comparison, operating a 20W load for 24 hours (typical of a microwave canopy we are using in the field) would require 480 W·hr of energy. As this estimated maximum energy production is based on continuous cycling (as opposed to the intermittent nature of vehicular traffic), we conclude from these data that, in its current form, our piezoelectric material-based energy harvesting bridge bearing will not generate enough energy to operate a modest electrical load.
16
Concluding Remarks Our goal of producing an energy harvesting bridge bearing prototype employing piezoelectric wafers was successful in its implementation, but was unsuccessful in its performance in that it could not produce a meaningful amount of electric energy. We feel that the performance could be improved by more fully protecting the piezoelectric wafers against short circuiting, which was at least partially responsible for the low response exhibited by some of the wafers in the prototype bearing. Further, if the wafers were installed on both sides of a shim, they would share a common ground and thus be connected electrically in series, raising the current generated. Then adjacent plates could be connected to each other in parallel to boost the voltages. It remains an open question as to whether this connection scheme will result in significantly improved performance. Finally, it is possible that the rubber layers deform around the piezoelectric wafers and bypass some of the load; a less compliant rubber may lead to superior load transfer into the wafers boosting their output.
Literature Cited/References [1] “The Piezoelectric Effect.” PZT Application Manual. Pg. 1-3
http://www.aurelienr.com/electronique/piezo/piezo.pdf
[2] Reuters Environment News, March 10, 2009
[3] Piezoelectric Energy Harvesting for Bridge Health Monitoring, Technical Whitepaper by W.W. Clark, C. Mo, J.D. Baldwin, K.D. Mish, and C.M. Ramseyer, University of Pittsburgh and University of Oklahoma, 2008
[4] 2009 ODOT Specification Book, Filename: 2009SpecBook_ODOT.pdf, page 671.
[5] Oklahoma Department of Transportation Bridge Standard "Bearing Details, Type IV and Type BT-72 P.C. Beams, Conventional, 2009 Specifications", Drawing No. B40C-BRG-PC4BT, Filename: b-397.pdf.
[6] Hooker, Matthew W. “Properties of PZT-Based Piezoelectric Ceramics between -150 and 250˚C.” National Aeronautics and Space Administration. Langley Research
Center. Hampton, VA. September, 1998.
17