energy efficient pons with service delay guarantees and...
TRANSCRIPT

EE-LSDS Conference Apr. 22-24 2013 Wien, Austria
Energy Efficient PONswith Service Delay Guarantees
and Long Reach
L. Valcarenghi, P.
CastoldiTeCIP Institute
Scuola Superiore Sant’Anna, Pisa
M. ChincoliCNIT, Pisa, Italy
P. Monti and L. WosinskaONLab, KTH, Kista, Sweden

2
Summary
• Energy consumption in optical access networks overview
• Scenario– PON– Long Reach (LR) PON
• Cyclic sleep with Service based Variable sleep Period (CSVP)– System description– System model– Results
• CSVP in Long-Reach PON – Results
• Conclusions

3
Summary
• Energy consumption in optical access networks overview
• Scenario– PON– Long Reach (LR) PON
• Cyclic sleep with Service based Variable sleep Period (CSVP)– System description– System model– Results
• CSVP in Long-Reach PON – Results
• Conclusions

4
Energy Consumption in Communications Networks
• Access networks + mobile radio networks (except home networks) major contributors to energy consumption in communications networks:– high number of Customer
Premises Equipment (CPE)– bandwidth underutilization
Remaining part home networks
Access=Fixed Access Network= Fiber to the Exchange (FTTE) and Fiber to the Cabinet (FTTC): fiber + xDSL; FTTH (PON)
Wired optical access network energy consumption50%-80%
of wired networks energy consumption
Source: C. Lange, D. Kosiankowski, R. Weidmann, and A. Gladisch,
“Energy Consumption of telecommunication networks and related improvement options”, IEEE
JSTQE, March/April, 2011

5
Considered Scenario – PON and LR PON
ONU-2
Passive Splitter
Central Office
Idle traffic, butactive receivers and service lines
ONU-1
OLT
ONU-N
Differential reaches
ONU1
ONU2
ONUk
LR-PONUp to 100 km and beyond

6
Long Reach (LR) PONs
• Site reduction implies that longer distances must be covered by the same ODN– Reach up to 100 km– Longer distance -> longer RTT
• Node consolidation decreases energy consumption by decreasing the number of central offices
• Node consolidation increases energy consumption because of presence of amplifiers

7
Summary
• Energy consumption in optical access networks overview
• Scenario– PON– Long Reach (LR) PON
• Cyclic sleep with Service based Variable sleep Period (CSVP)– System description– System model– Results
• CSVP in Long-Reach PON – Results
• Conclusions

8
Service based variable sleep period
• Two main decisions must be made– When to sleep– For how long
• Reduce ONU energy consumption– By means of service-based variable sleep period – initially proposed by R. Kubo, et. al , “Adaptive Power Saving Mechanism for 10
Gigabit Class PON Systems,” IEICE Transactions on Communications, vol. 2, no. E93.B, pp. 280–288, 2010
• Guarantee delay constraints to applications subscribed by end-users @ONU– By computing the maximum allowed sleep time based on subscribed
services and queuing theory system model • “End-user multimedia QoS categories,” ITU-T Recommendation G.1010, nov. 2001.
• “Network performance objectives for IP-based services,” ITU-T Recommendation Y.1541, Dec. 2011.
• “Ethernet frame transfer and availability performance,” ITU-T Recommendation Y.1563, Jan. 2009.
IPTD=IP packet Transfer Delay; IPDV=IP packet Delay Variation
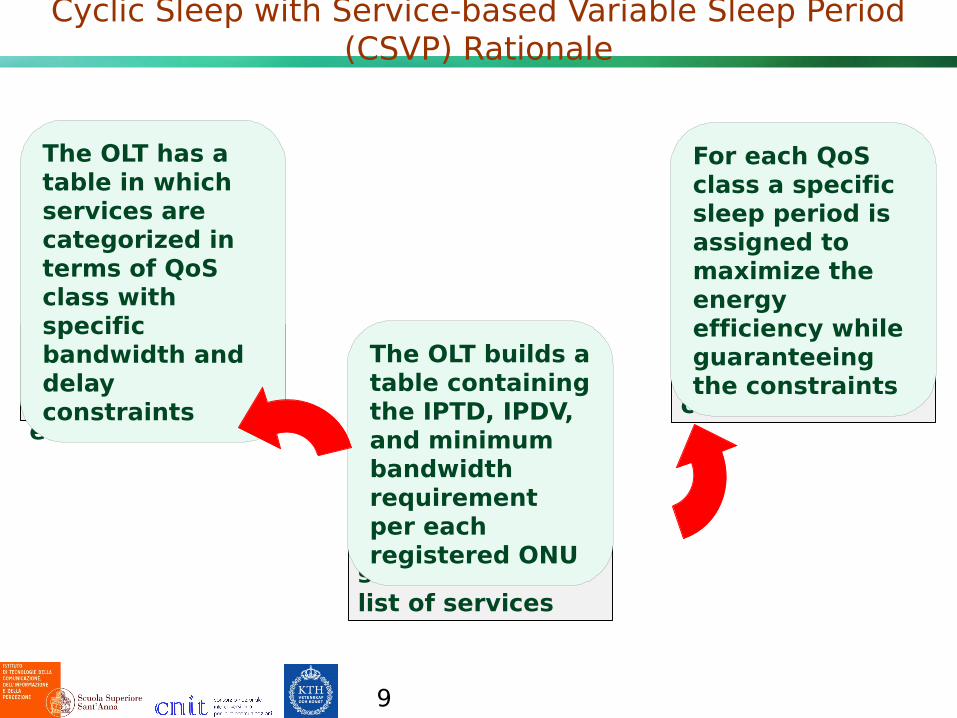
Cyclic Sleep with Service-based Variable Sleep Period (CSVP) Rationale
Tsl is a function of the delay constraints
For each QoS class a specific sleep period is assigned to maximize the energy efficiency while guaranteeing the constraints
Each ONU is subscribed to a list of services
The OLT builds a table containing the IPTD, IPDV, and minimum bandwidth requirement per each registered ONU
The OLT is costantly aware of the services subscribed to each ONU
The OLT has a table in which services are categorized in terms of QoS class with specific bandwidth and delay constraints
9

10
CSVP System description
Modified SPW with service-based variable sleep period
ONU Finite State
Machine

11
ServiceSubscription
Update IPTD(min IPTD)
Tsl = 2*(IPTDmax – S – RTT) - TOH Inform ONU
Tsl
( )( ) ( )Sλ
Sλ+
Sλ
Sλ+V+
V
VV=Wq ⋅−⋅
⋅⋅−⋅⋅⋅
⋅−
1212
1
2
222
22
RTT+T+T=
VW OHsl
q ≈
CSVP: IP packet Transfer Delay (IPTD) model
2/max RTTSWIPTD q ++=
RTT+T+T=V OHsl
1,1 2 <<<< SS λλ
• Constant V
• Low load condition
Hp:
POLLING SYSTEM WITH GATED SERVICE POLICY WITH IDENTICAL STATIONS
Queuing
delay
V Vacation
time=Idle time
S Service time
qW
Assumption: 1 ONU and 1 OLT

12
ServiceSubscription
Update IPDV(min IPDV)
Tsl = IPDV - TOH - RTT Inform ONU
Tsl
CSVP: IP packet Delay Variation (IPDV) model
IPDV = IPTDupper-IPTDmin
IPTDupper = 1-103 quantile of the IPTDIPTDmin = minimum IPTD
IPTDupper ≈ IPTDmax = TDS,max+RTT+Tsl++TOH+S+RTT/2
Frame arriving right after the CONFIRMATION
Frame arriving right before the CONFIRMATION and no frame in the OLT
queue
IPTDmin=S+RTT/2
IPDV = TDS,max+RTT+Tsl+T
OH0,1 max, ≈<< DSTSλ
Hp: low load condition
IPDV = RTT+Tsl+TOH
Tsl = min{TslIPTD,TslIPD
V}
ITU-T Y.1541 def.
Assumption: 1 ONU and 1 OLT

13
Parameter Variable Value
Overhead time TOH 2ms
Round-trip time RTT 0.4ms
Power consumption in sleep mode Psl 1 W
Power consumption in active mode Pa 10 W
Channel rate C 10 Gb/s
Number of span n 8
Simulation Scenario CSVP
• 1 OLT, 1 ONU
• Event driven simulation
• Different QoS classes mix
• Negative exponential frame interarrival time distribution
Class ID
Frame Payload size
[Byte]
Data rate Bi [b/s]
IPTD[ms]
IPDV
[ms]
1 1500 30.4k 125 125
2 560 1k 50 125
3 1067 256k 125 125
4 200 64k 12.5 6.25
Service characteristics
Simulation parameters

Results – IPTD constraint guaranteed
14
IPDV computation based on the cumulative distribution
function (CDF) of IPTD, uniformly distributed
Tsl as a function of IPTD only
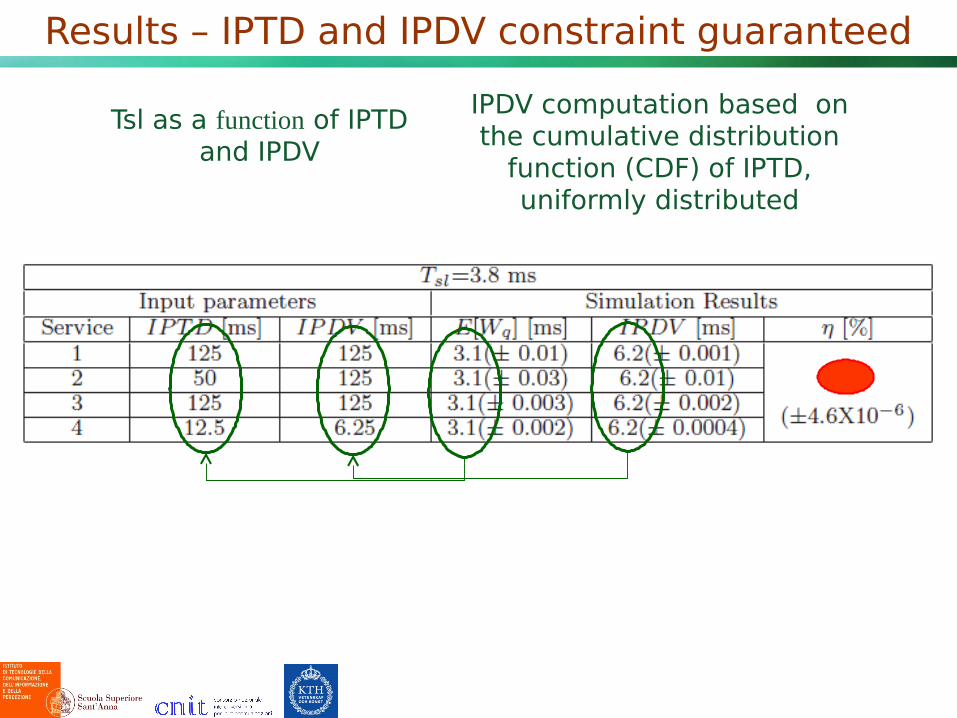
Results – IPTD and IPDV constraint guaranteed
15
Tsl as a function of IPTD and IPDV
IPDV computation based on the cumulative distribution
function (CDF) of IPTD, uniformly distributed

16
Summary
• Energy consumption in optical access networks overview
• Scenario– PON– Long Reach (LR) PON
• Cyclic sleep with Service based Variable sleep Period (CSVP)– System description– System model– Results
• CSVP in Long-Reach PON – Results
• Conclusions

17
Parameter Variable Value
Overhead time TOH 0 - 2 ms
Reach R 20 - 100 km
Power consumption in sleep mode Psl 1 W
Power consumption in active mode Pa 10 W
Channel rate C 10 Gb/s
Number of span n 8
LR PON - Simulation Scenario CSVP
• Event driven simulation
• Different QoS class mix
• Negative exponential frame interarrival time distribution
Class ID
Frame Payload size
[Byte]
Data rate Bi [b/s]
Wq,a
[ms]
Wq,b
[ms]
1 1500 30.4k U 200
2 560 1k 400 100
3 1067 256k 1000 40
4 200 64k 100 5
Service characteristics
Simulation parameters

18
LR PON - Results
• Stricter delay constraint -> Reach heavily affects energy efficiency
• Increase in overhead time (i.e., an increased synchronization time) is more detrimental for energy efficiency than a reach increase
Assumption: 1 ONU and 1 OLT
TOH = 2ms
Tsl = 2*(IPTDmax – S – RTT) - TOH

19
LR PON - Results (2)
• With fixed cycle time and higher number of ONUs, energy efficiently apparently increases because the slot for an ONU decreases but most of the time spent in scynchronization
• Contemporarily the bandwidth utilization per cycle decreases (smaller slots)
58%
60%62%
64%66%
68%
16 32 64 128 256 512 1024
# of ONUs
eta
[%
]
59%
60%
61%
62%
63%
64%
65%
66%
67%
68%
16 32 64 128 256 512 1024
# of ONUs
eta
[%
]
1.00E+06
1.00E+07
1.00E+08
1.00E+09
Bw
per
ON
U
eta Bw per ONU
−−
−=−=
C
OH
a
sl
T
T
N
N
P
P
E
EE 11
'
η
Tc=2 ms,
TOH=0.5ms
20
Conclusions
• Energy consumption in optical access networks• Cyclic sleep with service-based variable sleep period
(CSVP)– Energy consumption reduction while providing
delay guarantees• Queuing theory model to compute sleep time• Both average frame delay and frame jitter QoS
constraints are met with different energy efficiencies• Reach might heavily impact energy savings • An increase in the number of ONUs decreases the
energy consumption per ONU but at the expenses of a decreased bandwidth share, higher loss rate and delay per cycle

21
thank you!andthanks to