energy access energy renewable efficiency energy - seforall · and optimization of risk; (iii)...
TRANSCRIPT
Energy
efficiency
Renewable
energy
Energy
access
Prepared by
SE4All Advisory Board’s Finance Committee Report on Scaling Up Finance for Sustainable Energy Investments
4 July 2015
Finance Committee Report 2015
Prepared by
i
3
51
53
60
66
68
73
85
90
99
106
107
108
109
113
114
3. Sources of Capital and Financing Instruments
Risks and Investors
Identifying New Pools of Capital
Prioritising Risks and Structures
Thematic Areas
Overview
Scaling Up Green Bonds
DFIs and Risk-Sharing Structures
Enabling New Insurance Solutions
Aggregating Smaller Opportunities
4. Recommendations
Annexes: Supporting Material
Model Assumptions for Energy Access
Project Appraisal Criteria
Menu of Project finance de-risking approaches
Green Bond Principles
SE4All Finance Committee Members
iii iv
v
vi 1 3
7
10 14 18 21 22 24 26
28 30 36
Cover Note Foreword by Mr. Ban Ki-moon, United Nations Secretary-General Foreword by Dr. Jim Yong Kim, World Bank Group President Preface Introduction Executive Summary 1. Characterising the Market Opportunities Energy Access Renewable Energy Energy Efficiency Analysis of Reference Countries Selection Access to Finance Benchmarking 2. Increasing the Deal-flow Enabling Environment Project Preparation
Finance Committee Report 2015
Table of Contents
The Advisory Board constituted four committees, one each on Access, Renewables, Energy Efficiency, and Finance. Each committee is co-chaired by Advisory Board members and is supported by a member of the GFT. The Finance Committee is supported by Mr. Mohinder Gulati, Chief Operating Officer ([email protected]). Most committees also invited non-Advisory Board members to participate on a thematic basis to draw on expertise and experiences that could enrich the debate and analysis on the topic area under discussion. The Access Committee has focused on the decentralized, off-grid, mini-grid and clean cooking elements of the access challenge. Its deliberations include policies, business models and financing of on mini- /off-grids, as well as enterprise-based solutions for energy services provision. The Committee will continue to provide advice and recommendations to support the goal of achieving universal energy access focusing on diverse approaches to decentralized energy, energy enterprise development and financing models that can be used by governments, entrepreneurs, social enterprises, NGOs or other local organizations. Key messages from the Access Committee are to promote Country Action Agendas as coordination and implementation tool for SE4All objective and proposed SDG7; support financial innovation to attract private sector to mini-grids and decentralized solutions; support gender-sensitive energy solutions; and encourage governments to strengthen policy and regulatory environment. The Renewable Energy committee has focused on developing recommendations to achieve the objective by 2030, and initiating a set of game-changing initiatives/instruments in support of the renewable objective. The Committee set out three priority areas: knowledge management, policy and regulation, and public support. IRENA’s REmap 2030 is a roadmap to double the share of renewable energy by 2030. REmap 2030 is the first global study to provide renewable energy options based on a bottom-up analysis of national resources. The Energy Efficiency Committee has organized a series of dialogues on Energy Efficiency resulting in establishment of a global energy efficiency platform with a number of ‘accelerators’ in a selected number of sectors (i) buildings, (ii) lighting, (iii) motors, (iv) appliances, (v) district energy, (vi) industrial energy efficiency (large industry, small and medium size enterprises, and energy sector itself), and (vii) transportation. A working group is responsible for work program of each accelerator. The Finance Committee’s focus is on (i) defining the market opportunity i.e. countries, sub-sectors of energy, typology of projects and the size of financing-deficit to be addressed for the developing countries; (ii) sources of capital and financing instruments: to prepare a review of investors, transaction structures, financing instruments, and optimization of risk; (iii) preparation and implementation of bankable projects: to identify typical project sponsors in the energy sector. The Finance Committee co-chaired by Dr. Luciano Coutinho, President of the Brazilian National Development Bank (BNDES) and Mr. Purna Saggurti, Chairman of Global Corporate and Investment Banking, Bank of America Merrill Lynch prepared a draft report that was presented to the Advisory Board in June 2014. Since then the report was circulated for review and comments. The Committee gratefully acknowledges very insightful and constructive comments received from members of other three Committees, ADB, Brazilian Ministry of Energy, Carbon War Room, EIB, GEF, Korea Eximbank. This report presents conclusions and recommendations of the Finance Committee and reflects comments received from reviewers. Key messages of this report are: to generate a healthy pipeline of bankable projects support project development funds; encourage governments to improve legal, policy, regulatory environment and institutional capacity; systematically deploy de-risking instruments to attract private sector investments; DFIs should consider leveraging at project, portfolio and balance-sheet level; improve governance of power utilities to rapidly increase access through grid and equally importantly facilitate decentralized solutions, improve operational and financial efficiency, and scale up investments in renewables; support robust aggregation mechanisms for base-of-pyramid investments.
Cover Note
Finance Committee Report 2015 iii
2015 is the year for global action for people and the planet. The international community has agreed on an inspiring new 2030 Agenda aimed at ending poverty and building lives of dignity for all. Sustainable Development Goal 7 – one of 17 that will guide our work – calls on Governments and all their partners to work together to “ensure access to affordable, reliable, sustainable and modern energy for all”. Governments are also committed to reaching a universal and meaningful agreement at the climate change conference in Paris in December. Energy is at the heart of this effort, too, as we strive to seize the great opportunities of renewable energy and a low-carbon pathway.
Foreword by Mr. BAN Ki-moon, United Nations Secretary-General
Finance Committee Report 2015
Turning these agreements into reality will depend crucially on mobilizing resources. This timely report from the Finance Committee of Sustainable Energy for All’s (SE4All) Advisory Board points the way towards solutions. It describes four financial instruments with a combined potential to raise an additional $120 billion in annual investments by 2020. I thank the Finance Committee for its work, and in particular the Brazilian Development Bank, Bank of America, the World Bank and the Sustainable Energy for All Global Facilitation Team, which led the drafting. Sustainable energy is the thread that links economic growth, increased social equity and a healthy environment. I hope the recommendations in this report reach a wide global audience and help us to take the steps we need in this decisive year.
Bringing modern energy services to the world’s poor while transitioning toward a more sustainable future is a defining challenge of our time. Achieving SE4All’s three goals by 2030—universal energy access, doubling the share of renewable energy in the global energy mix, and doubling the rate of improvement in energy efficiency—will require innovation and increased investments in clean energy technology. Official development assistance and concessional financing are cornerstones of this effort, particularly for increasing energy access in developing countries. The global need, however, far outstrips what public resources can provide. It is our responsibility to use public funds to attract private sector funding and investments of all kinds. Ultimately, the private sector will be a critical piece in achieving our energy goals.
Foreword by Dr. Jim Yong Kim, World Bank Group President
Finance Committee Report 2015
Dr. Jim Yong Kim The President of the World Bank Group,
Co-chair of the SE4All Advisory Board v
To achieve these three goals, clean energy investments need to nearly triple from the current $400 billion a year, to more than $1 trillion a year. This report points to some of the potential solutions: green-bond issuances; de-risking investments through insurance products and other instruments; and improved structuring and bundling of small-scale energy projects. At the same time, countries can improve their investment climates by strengthening sustainable energy policies, removing trade barriers, improving the performance of utilities, and ending fossil fuel subsidies. The good news is that the world is acting on these fronts—countries and businesses are testing new policies and financial approaches; we’re seeing advancements in clean technologies; modern energy services are increasingly reaching poor and remote communities; and investments in renewable energy and energy efficiency are growing. With this momentum and collective action, we can put in place the solutions and recommendations of this report. This pivotal year presents opportunities to make energy available to the hundreds of millions who need it, and we stand ready to support countries with their reform and investment agendas. Together, we can end energy poverty in our lifetime.
Energy has become the central theme in discussions on alleviating poverty, promoting economic development and improving quality of life of people. The ambitious goals that the international community is setting to achieve sustainable development and address climate change require creative collaborations and finding new and innovative solutions. The UN’s Sustainable Energy for All (SE4All) initiative, a multi-stakeholder partnership, has encouraged governments, international organizations, private sector and civil society to take prompt actions to address these global issues and provided a unique platform for collaboration. With its three interlinked objectives—ensuring universal access to modern energy services, doubling the global rate of improvement in energy efficiency, and doubling the share of renewable energy in the world’s energy mix, all by 2030—it provides a road map for a better future in which progresses in other areas from health and education to job creation and gender equality are promoted by affordable, reliable and sustainable energy. However, none of this would be possible without scaling up investments in sustainable energy. Most recent estimates show that annual investments need to be increased by an additional US$650 billion over its current levels of US$350 billion. SE4All’s Advisory Board had set up four committees- one each for Access, Energy Efficiency, Renewables, and Finance. We are pleased to submit the Finance Committee Report. We examined opportunities for public and private investment that could help achieve these three SE4All goal of reliable, affordable, sustainable modern energy for all expected to be enshrined in the potential post-2015 Sustainable Development Goals. This Report brings together innovative ideas on scaling up finance for sustainable energy investments and makes concrete recommendations based on in-depth analysis and the latest research outcome of SE4All’s partner organizations. Annual investments of about $1 trillion are needed from both public and private sectors to reach the objectives of SE4All. To attract more private sector investment, this Report identifies four broad investment themes which have a potential of raising additional annual financing of $120 billion until 2020 for scaling up finance for sustainable energy both in developed economies and emerging markets. Building upon the success, the pace and scale of financing could be ramped up. This document is organized into four sections. The first section reviews the size of the financing challenge and segmenting of the market opportunity in both developing and developed economies. The second section provides an overview of some of the prerequisites to achieve a significant increase in sustainable energy infrastructure investment and on increasing the deal flow in emerging markets. The third section reviews various innovative approaches that are being developed to attract more private sector investment, with a particular focus on leveraging public sector funds and assets. In the last section, the Report provides key recommendations focusing on specific actions for each type of stakeholders over the short and long term to achieve the Sustainable Energy for All goal. Finally, the SE4All Advisory Board’s Finance Committee would like to express thanks to the task team from Bank of America Merrill Lynch, the Brazilian National Development Bank (BNDES), the World Bank Group and SE4All Global Facilitation Team for preparing analytical inputs, consultations, drafting and updating this Report. The Committee gratefully acknowledges very insightful and constructive comments received from members of other SE4All committees, Asian Development Bank, Brazilian Ministry of Energy, Carbon War Room, European Investment Bank, Global Environment Facility and Korea Eximbank.
Preface
Finance Committee Report 2015
Mr. Purna Saggurti Co-chair of SE4All Finance Committee, Chairman of Global Corporate and Investment Banking Bank of America Merrill Lynch
Dr. Luciano Coutinho Co-chair of SE4All Finance Committee, President of the Brazilian National Development Bank
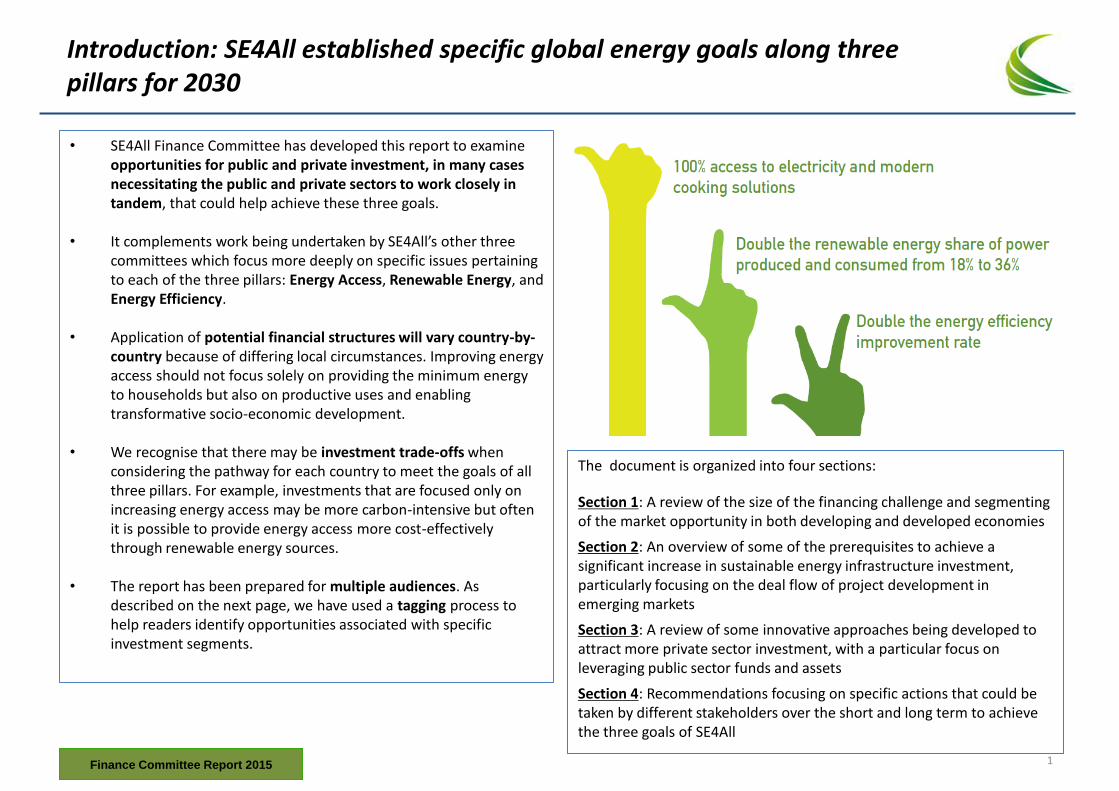
Introduction: SE4All established specific global energy goals along three pillars for 2030
• SE4All Finance Committee has developed this report to examine opportunities for public and private investment, in many cases necessitating the public and private sectors to work closely in tandem, that could help achieve these three goals.
• It complements work being undertaken by SE4All’s other three
committees which focus more deeply on specific issues pertaining to each of the three pillars: Energy Access, Renewable Energy, and Energy Efficiency.
• Application of potential financial structures will vary country-by-
country because of differing local circumstances. Improving energy access should not focus solely on providing the minimum energy to households but also on productive uses and enabling transformative socio-economic development.
• We recognise that there may be investment trade-offs when considering the pathway for each country to meet the goals of all three pillars. For example, investments that are focused only on increasing energy access may be more carbon-intensive but often it is possible to provide energy access more cost-effectively through renewable energy sources.
• The report has been prepared for multiple audiences. As described on the next page, we have used a tagging process to help readers identify opportunities associated with specific investment segments.
The document is organized into four sections:
Section 1: A review of the size of the financing challenge and segmenting of the market opportunity in both developing and developed economies
Section 2: An overview of some of the prerequisites to achieve a significant increase in sustainable energy infrastructure investment, particularly focusing on the deal flow of project development in emerging markets
Section 3: A review of some innovative approaches being developed to attract more private sector investment, with a particular focus on leveraging public sector funds and assets
Section 4: Recommendations focusing on specific actions that could be taken by different stakeholders over the short and long term to achieve the three goals of SE4All
Finance Committee Report 2015 1
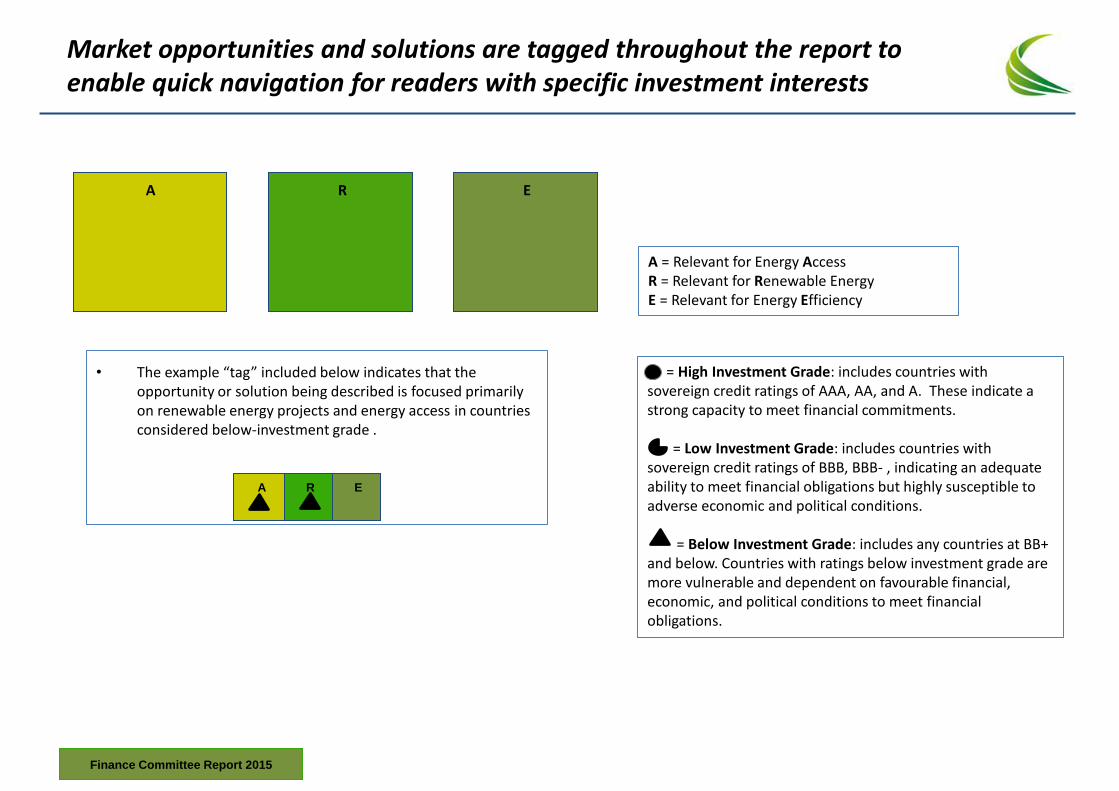
Market opportunities and solutions are tagged throughout the report to enable quick navigation for readers with specific investment interests
A
E
R
A = Relevant for Energy Access R = Relevant for Renewable Energy E = Relevant for Energy Efficiency
= = High Investment Grade: includes countries with sovereign credit ratings of AAA, AA, and A. These indicate a strong capacity to meet financial commitments. = Low Investment Grade: includes countries with sovereign credit ratings of BBB, BBB- , indicating an adequate ability to meet financial obligations but highly susceptible to adverse economic and political conditions. = Below Investment Grade: includes any countries at BB+ and below. Countries with ratings below investment grade are more vulnerable and dependent on favourable financial, economic, and political conditions to meet financial obligations.
• The example “tag” included below indicates that the opportunity or solution being described is focused primarily on renewable energy projects and energy access in countries considered below-investment grade .
A
E
R
Finance Committee Report 2015
Executive Summary
A range of approaches to scaling-up and attracting private sector investment is essential to achieve the three SE4All objectives. Detailed knowledge of where, and in what types of projects, more than $1 trillion of annual investment from both public and private sectors will be needed. Current estimates* show that for the period from 2010 to 2030:
• Energy Access - $49.4 billion is required annually (current annual spending is $9 billion); focus should be in Sub-Saharan Africa, South Asia and East Asia & Pacific.
• Renewable Energy - $442-650 billion is required annually from a current baseline of $258 billion to reach the goal. Except for Europe all regions need to increase investment to meet targets. The largest annual funding gap by far is in developing Asia.
• Energy Efficiency - $560 billion is required annually to achieve the goal (current spending is $130 billion). Energy efficiency investment needs to increase by 4.3x relative to current levels, with the greatest opportunities in Europe, developing Asia and North America.
In developing countries, particularly with energy supply and access deficits, investments in renewables and energy efficiency would also support access. The overriding challenges to delivering this investment relate to:
• Developing the deal flow, the pipelines for projects – higher-level aggregation or blended finance structures cannot work without an ecosystem that promotes preparation and implementation of projects, including: – Regulatory framework, capacity to prepare and implement, transparent long-term pricing structures, clear Power Purchase Agreements – Need for national/local finance infrastructure able to support process – commercial banks, state-owned utilities, local investment pools
• Deploying financing models and structures that will attract private finance to form a larger share of the capital mix – With notable exceptions such as facilities for long-term hedging of foreign-exchange risk for non-G20 currencies, tools required to de-risk
investments do exist but need further development, and the partnerships, structures and commitment to support their rapid adoption need to expand
– Developing markets represent the greatest challenge, given investors preference for investment-grade opportunities. There is a greater need for patient capital, blended capital structures and collaboration to accelerate de-risking of opportunities.
• In most developing countries, the governments and power utilities need to improve governance and management of their energy sector to enhance its creditworthiness
– Governments need to improve regulation, strengthen public governance to help power utilities reduce losses and increase bill collection, make subsidies better targeted and transparent, and enhance capacity of government agencies as well as increase the operational and financial efficiency of power utilities
– Power utilities need to play an important role in scaling up and accelerating access and facilitating financing of small-scale projects
* Global Tracking Framework 2015, World Bank Group
Finance Committee Report 2015 3
Executive Summary
• Consistent with the geographic distribution of market opportunities and the multiple audiences for this report, we examine challenges and potential financing solutions in both OECD and developing countries:
– OECD investor pools will, over time, become a significant source of capital for emerging markets as well as for OECD projects – Developing countries, and in particular the Energy Access theme, may represent a smaller absolute investment need, but success is more
urgent in the development context. Formidable barriers remain and need attention including enhancing local and regional capital markets, developing policy frameworks and strengthening human capacity to develop the necessary deal pipeline. In addition, aggregation of investments and financing for small-sized base of pyramid investments is critical for scaling up off-grid and micro-grid solutions.
• The current pace of investment in sustainable energy is not sufficient to meet SE4All’s stated objectives. Current government and public sector investment and incentives for the private sector, combined with improving technology costs are supporting the current momentum, but are insufficient. One potential constraint on the long-term growth trajectory is perceived risks, some specific to sustainable energy and others specific to emerging markets.
• There is a broad and diverse pool of private sector investors in both OECD and emerging markets, that could increase their exposure to investments in sustainable energy, but it will be important to address scale, risk and liquidity issues, as well as develop financing opportunities tailored to each type of investor.
• While momentum exists, blended capital-focused financing mechanisms, that help mitigate risks and standardize investment structures are needed to increase the size and scale of investment opportunities and also the reach so that many more smaller scale projects can attract financing.
• Developing a robust national project pipeline is a key constraint, and there are a variety of best practices that should be disseminated to enhance project preparation and project finance:
– Use of dedicated project preparation funds
– More systematic use of project structuring to better allocate risks among parties
– Use of more diverse contractual instruments, particularly those that could de-risk project finance for different investors
Finance Committee Report 2015
Executive Summary
• We identify four broad investment themes that have potential to scale up finance for sustainable energy, both in OECD and
emerging markets. With the exception of green bonds, each of the themes, particularly more strategic use of DFI resources,
are targeted more to financing opportunities identified in Section 1 in developing countries:
– Green bonds market development
– Structures that use Development Finance Institutions’ (DFIs) de-risking instruments to mobilize private capital
– Insurance products that focus on removing specific risks
– Aggregation structures that focus on bundling and pooling approaches for small-scale opportunities.
• On the next slide we identify a potential $120 billion of incremental annual investment that could be catalyzed by 2020 by
focusing on these themes. These should not be the only areas of focus for SE4All, and do not address the total funding gaps
identified. They do, however, represent near term, achievable opportunities to expand structures that enable public-private
collaboration including innovative risk-sharing that will increase the prospects of mobilizing investment from several
promising sub-sets of investors.
• Achieving the greater SE4All incremental $654-862 billion target, highlighted in Section 1, will require multiple approaches
and needs time to build momentum. The largest constraints on progress in emerging markets, and particularly for energy
access, will continue to be the insufficiency of enabling framework, credit risk of power sector, and supply and size of high
quality deal flow, but with the right coordination among market participants, in-country capacity building support, and
expanded project preparation activities, significant progress will be made.
Finance Committee Report 2015 5
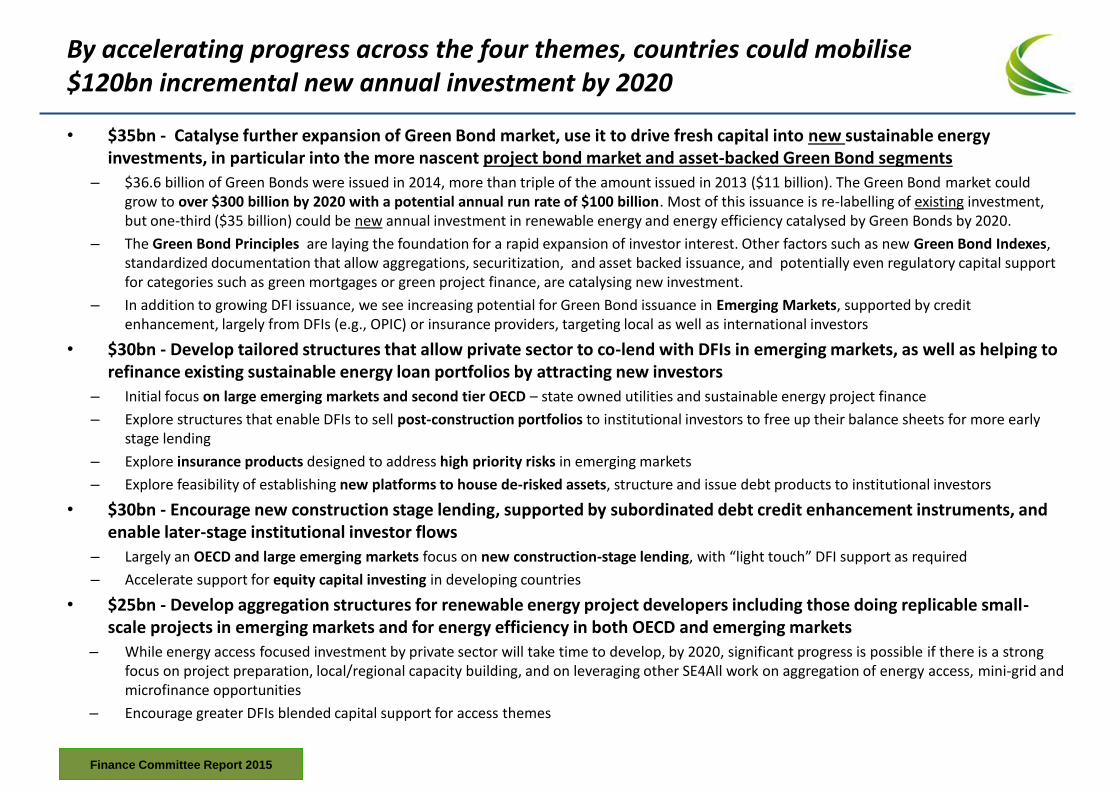
By accelerating progress across the four themes, countries could mobilise $120bn incremental new annual investment by 2020
• $35bn - Catalyse further expansion of Green Bond market, use it to drive fresh capital into new sustainable energy investments, in particular into the more nascent project bond market and asset-backed Green Bond segments
– $36.6 billion of Green Bonds were issued in 2014, more than triple of the amount issued in 2013 ($11 billion). The Green Bond market could grow to over $300 billion by 2020 with a potential annual run rate of $100 billion. Most of this issuance is re-labelling of existing investment, but one-third ($35 billion) could be new annual investment in renewable energy and energy efficiency catalysed by Green Bonds by 2020.
– The Green Bond Principles are laying the foundation for a rapid expansion of investor interest. Other factors such as new Green Bond Indexes, standardized documentation that allow aggregations, securitization, and asset backed issuance, and potentially even regulatory capital support for categories such as green mortgages or green project finance, are catalysing new investment.
– In addition to growing DFI issuance, we see increasing potential for Green Bond issuance in Emerging Markets, supported by credit enhancement, largely from DFIs (e.g., OPIC) or insurance providers, targeting local as well as international investors
• $30bn - Develop tailored structures that allow private sector to co-lend with DFIs in emerging markets, as well as helping to refinance existing sustainable energy loan portfolios by attracting new investors
– Initial focus on large emerging markets and second tier OECD – state owned utilities and sustainable energy project finance
– Explore structures that enable DFIs to sell post-construction portfolios to institutional investors to free up their balance sheets for more early stage lending
– Explore insurance products designed to address high priority risks in emerging markets
– Explore feasibility of establishing new platforms to house de-risked assets, structure and issue debt products to institutional investors
• $30bn - Encourage new construction stage lending, supported by subordinated debt credit enhancement instruments, and enable later-stage institutional investor flows
– Largely an OECD and large emerging markets focus on new construction-stage lending, with “light touch” DFI support as required
– Accelerate support for equity capital investing in developing countries
• $25bn - Develop aggregation structures for renewable energy project developers including those doing replicable small-scale projects in emerging markets and for energy efficiency in both OECD and emerging markets
– While energy access focused investment by private sector will take time to develop, by 2020, significant progress is possible if there is a strong focus on project preparation, local/regional capacity building, and on leveraging other SE4All work on aggregation of energy access, mini-grid and microfinance opportunities
– Encourage greater DFIs blended capital support for access themes
Finance Committee Report 2015
SECTION 1. Characterising the Market Opportunities
Finance Committee Report 2015 7
Introduction to the diverse market opportunities
• We are aware that there are multiple organisations that attempt to outline the precise scale of financing that may be required. Our focus in this report is on the key underlying messages implied by the quantum of finance at the investment-opportunity level rather than attempting to develop a new independent view on the numbers. Our objective is to translate the size of the financing challenge into guidance to help attract public and private investment.
• This first section explores current progress against meeting each of the three SE4LL energy pillars with a view to identifying the size of the challenge relative to historical progress in each.
• Both public and private finance can be better directed once imbued with detailed knowledge of where and in what types of projects investment is actually needed.
• A clear constraint to delivering SE4All’s goals is the capacity of many developing countries to absorb finance that might be available to invest in the sustainable energy sector. We use a set of representative countries from both OECD and emerging markets to outline the diversity or preparedness which the countries and regions have for the development of their energy infrastructure
– High Impact Countries*, determined by (1) highest electricity access deficit (2) highest non-solid fuel access deficit and (3) highest energy consumption
– Fast Moving Countries*, determined by progress along the SE4All goals over the period 1990-2010 including (1) population gaining access to electricity (2) population gaining access to non-solid fuels (3) energy saved through reductions in energy intensity and (4) renewable energy consumed (including traditional biomass)
• Specific challenges have been identified:
– Improving enabling environment for investment
– Expanding rigorous project preparation activities to increase the set of attractive projects for local and international commercial lenders
– Providing, expanding, and scaling more targeted and innovative finance solutions
* As defined by Global Tracking Framework 2015, World Bank Group
Finance Committee Report 2015
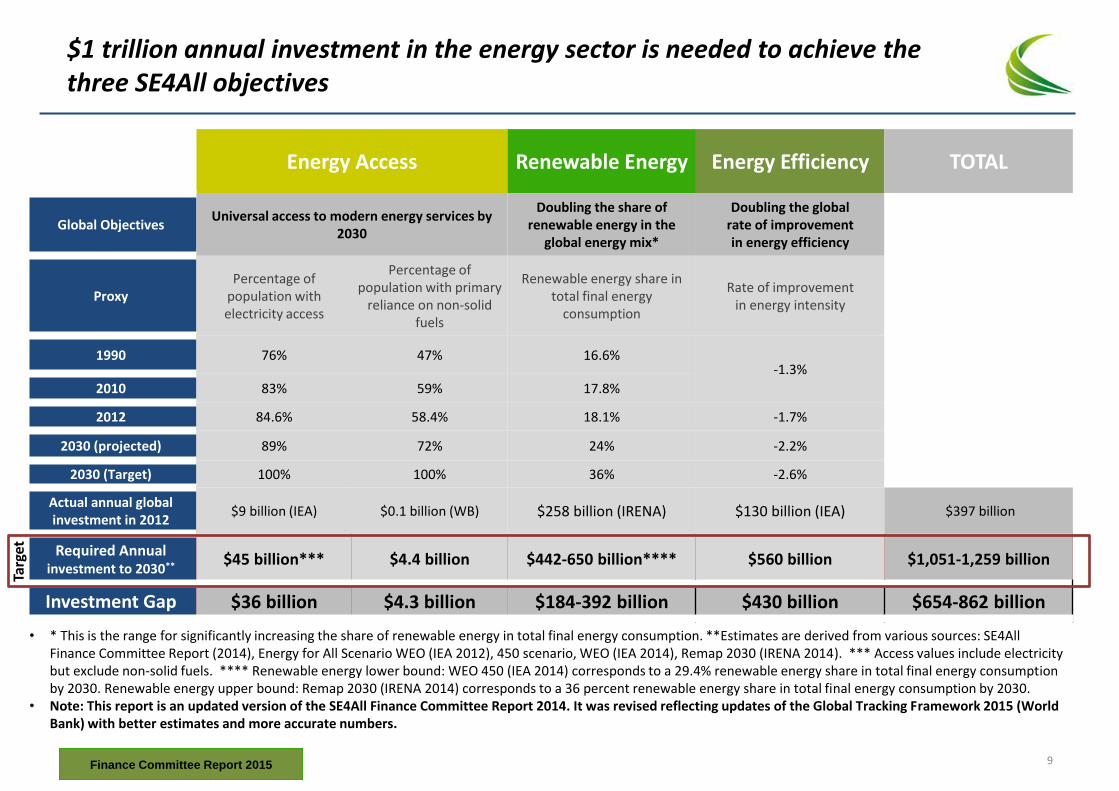
$1 trillion annual investment in the energy sector is needed to achieve the three SE4All objectives
Energy Access Renewable Energy Energy Efficiency TOTAL
Global Objectives Universal access to modern energy services by
2030
Doubling the share of renewable energy in the
global energy mix*
Doubling the global rate of improvement in energy efficiency
Proxy Percentage of
population with electricity access
Percentage of population with primary
reliance on non-solid fuels
Renewable energy share in total final energy
consumption
Rate of improvement in energy intensity
1990 76% 47% 16.6% -1.3%
2010 83% 59% 17.8%
2012 84.6% 58.4% 18.1% -1.7%
2030 (projected) 89% 72% 24% -2.2%
2030 (Target) 100% 100% 36% -2.6%
Actual annual global investment in 2012
$9 billion (IEA) $0.1 billion (WB) $258 billion (IRENA) $130 billion (IEA) $397 billion
Required Annual investment to 2030**
$45 billion*** $4.4 billion $442-650 billion**** $560 billion $1,051-1,259 billion
Investment Gap $36 billion $4.3 billion $184-392 billion $430 billion $654-862 billion
Targ
et
• * This is the range for significantly increasing the share of renewable energy in total final energy consumption. **Estimates are derived from various sources: SE4All Finance Committee Report (2014), Energy for All Scenario WEO (IEA 2012), 450 scenario, WEO (IEA 2014), Remap 2030 (IRENA 2014). *** Access values include electricity but exclude non-solid fuels. **** Renewable energy lower bound: WEO 450 (IEA 2014) corresponds to a 29.4% renewable energy share in total final energy consumption by 2030. Renewable energy upper bound: Remap 2030 (IRENA 2014) corresponds to a 36 percent renewable energy share in total final energy consumption by 2030.
• Note: This report is an updated version of the SE4All Finance Committee Report 2014. It was revised reflecting updates of the Global Tracking Framework 2015 (World Bank) with better estimates and more accurate numbers.
Finance Committee Report 2015 9
Energy Access: Provide Universal Access to Modern Energy Services
Finance Committee Report 2015
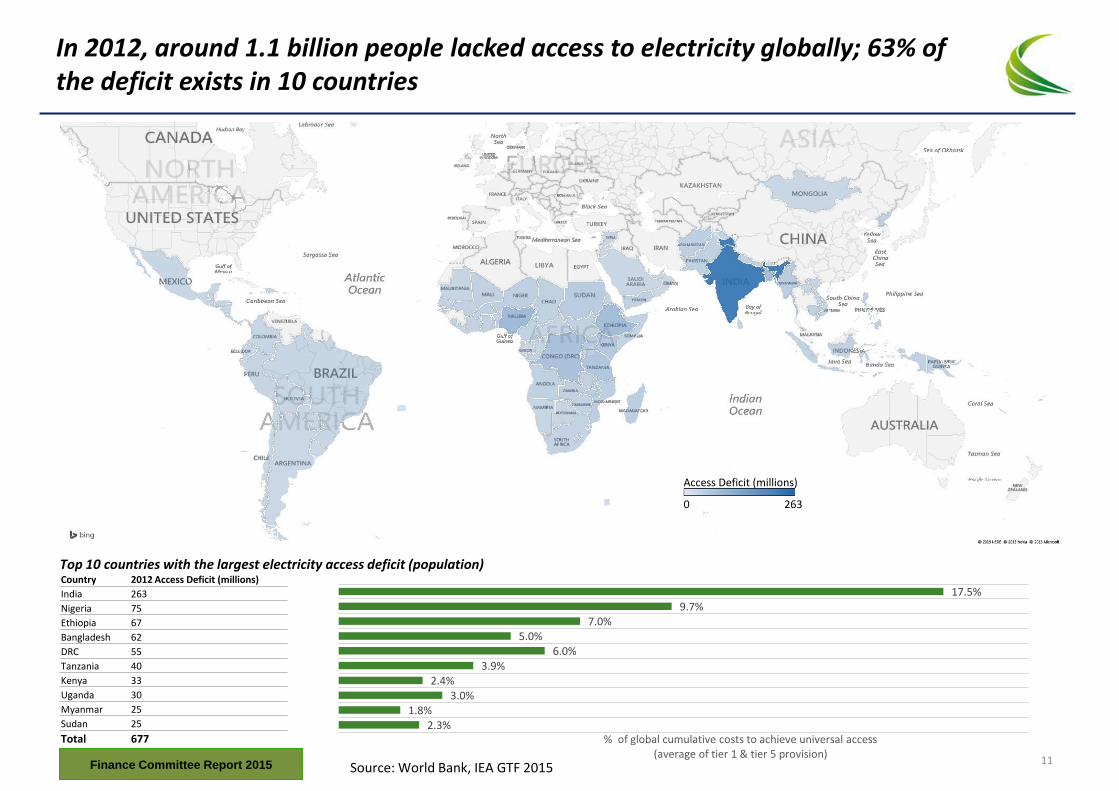
In 2012, around 1.1 billion people lacked access to electricity globally; 63% of the deficit exists in 10 countries
Source: World Bank, IEA GTF 2015
Access Deficit (millions)
0 263
Country 2012 Access Deficit (millions)
India 263
Nigeria 75
Ethiopia 67
Bangladesh 62
DRC 55
Tanzania 40
Kenya 33
Uganda 30
Myanmar 25
Sudan 25
Total 677
Top 10 countries with the largest electricity access deficit (population)
17.5% 9.7%
7.0% 5.0%
6.0% 3.9%
2.4% 3.0%
1.8% 2.3%
% of global cumulative costs to achieve universal access (average of tier 1 & tier 5 provision)
Finance Committee Report 2015 11
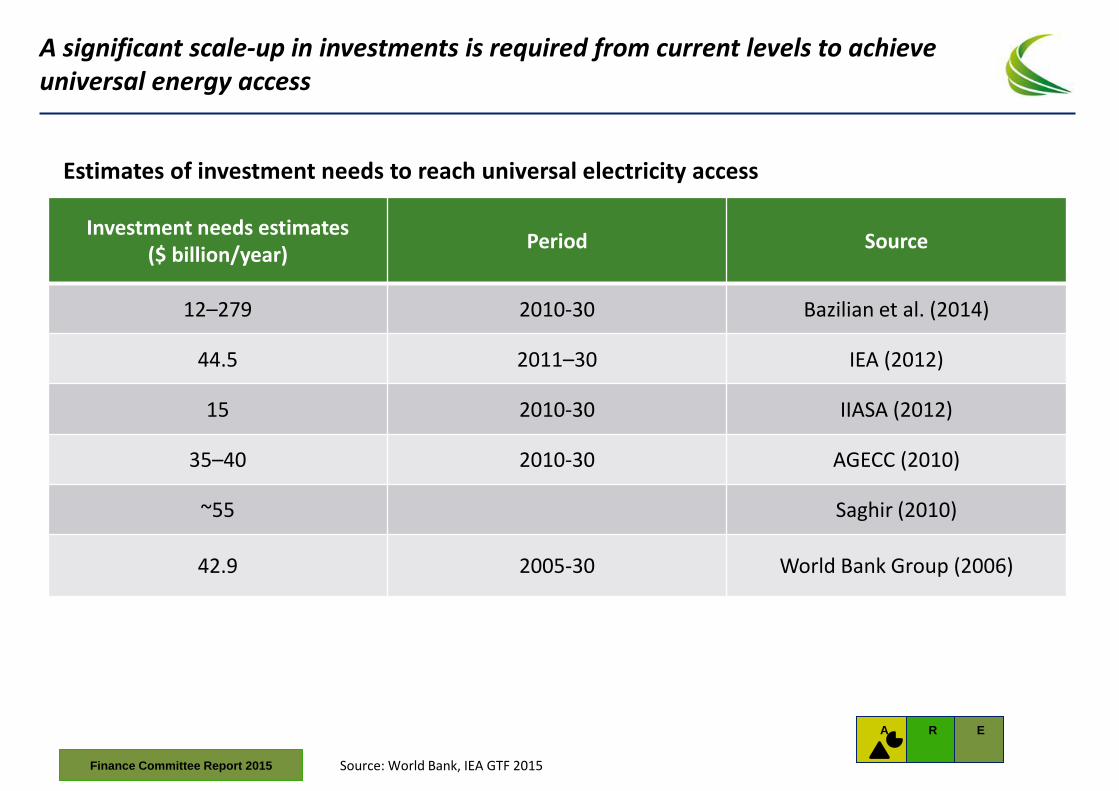
A significant scale-up in investments is required from current levels to achieve universal energy access
A
E
R
Investment needs estimates ($ billion/year)
Period Source
12–279 2010-30 Bazilian et al. (2014)
44.5 2011–30 IEA (2012)
15 2010-30 IIASA (2012)
35–40 2010-30 AGECC (2010)
~55 Saghir (2010)
42.9 2005-30 World Bank Group (2006)
Estimates of investment needs to reach universal electricity access
Source: World Bank, IEA GTF 2015 Finance Committee Report 2015
0
1
2
3
4
5
6
7
8
9
10
Bill
ion
USD
/yea
r
AIM Range SE4ALL 2014
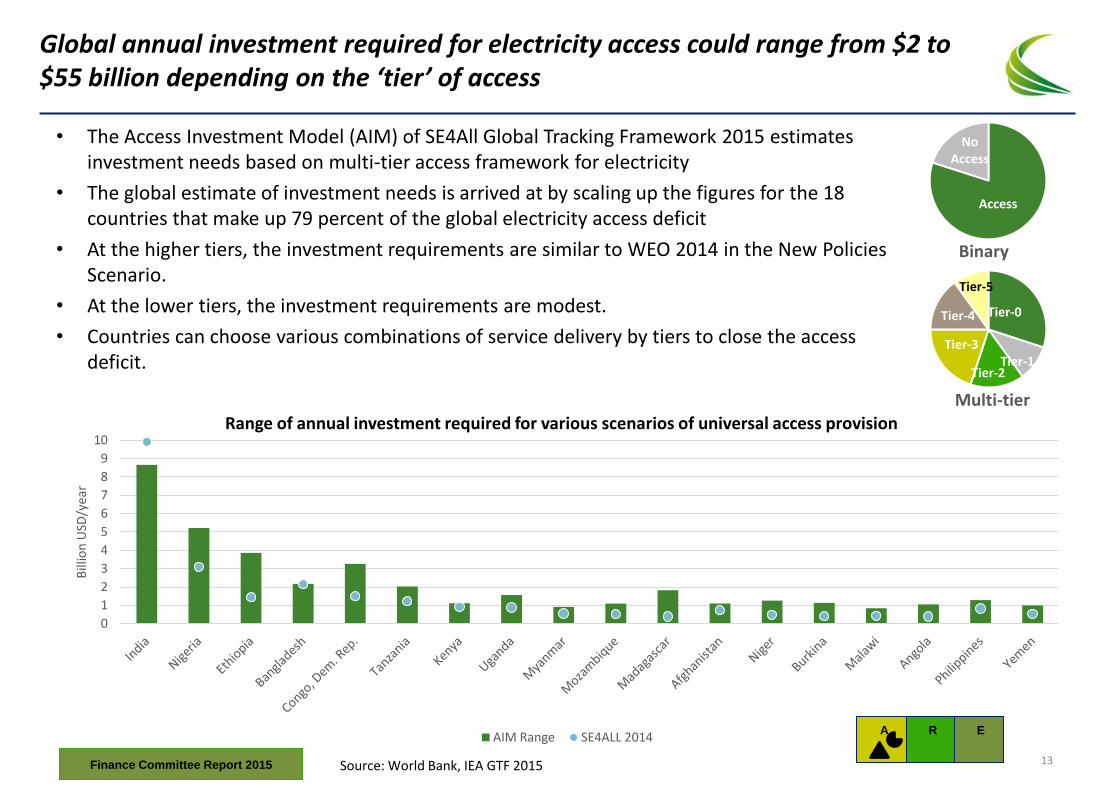
Global annual investment required for electricity access could range from $2 to $55 billion depending on the ‘tier’ of access
Source: World Bank, IEA GTF 2015
A
E
R
• The Access Investment Model (AIM) of SE4All Global Tracking Framework 2015 estimates investment needs based on multi-tier access framework for electricity
• The global estimate of investment needs is arrived at by scaling up the figures for the 18 countries that make up 79 percent of the global electricity access deficit
• At the higher tiers, the investment requirements are similar to WEO 2014 in the New Policies Scenario.
• At the lower tiers, the investment requirements are modest.
• Countries can choose various combinations of service delivery by tiers to close the access deficit.
Tier-0
Tier-1 Tier-2
Tier-3
Tier-4
Tier-5
Multi-tier
Access
No Access
Binary
Range of annual investment required for various scenarios of universal access provision
Finance Committee Report 2015 13
Renewable Energy: Doubling the Share of Renewables in the Global Energy Mix
Finance Committee Report 2015
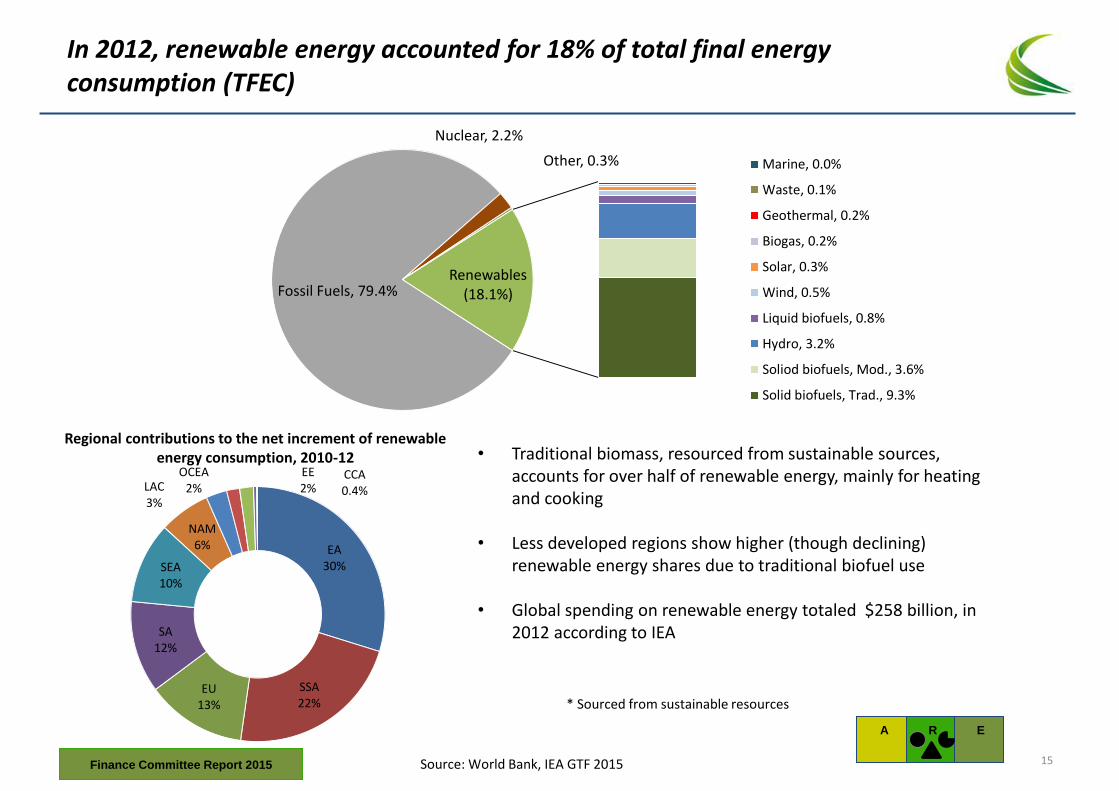
In 2012, renewable energy accounted for 18% of total final energy consumption (TFEC)
• Traditional biomass, resourced from sustainable sources, accounts for over half of renewable energy, mainly for heating and cooking
• Less developed regions show higher (though declining) renewable energy shares due to traditional biofuel use
• Global spending on renewable energy totaled $258 billion, in 2012 according to IEA
Source: World Bank, IEA GTF 2015
A
E
R
* Sourced from sustainable resources
Fossil Fuels, 79.4%
Nuclear, 2.2%
Other, 0.3%
Renewables (18.1%)
Marine, 0.0%
Waste, 0.1%
Geothermal, 0.2%
Biogas, 0.2%
Solar, 0.3%
Wind, 0.5%
Liquid biofuels, 0.8%
Hydro, 3.2%
Soliod biofuels, Mod., 3.6%
Solid biofuels, Trad., 9.3%
EA 30%
SSA 22%
EU 13%
SA 12%
SEA 10%
NAM 6%
LAC 3%
OCEA 2%
EE 2%
CCA 0.4%
Regional contributions to the net increment of renewable energy consumption, 2010-12
Finance Committee Report 2015 15

Roughly 60% of annual investment needed to reach SE4All renewable objective is in emerging markets
Annual Investment of US$650b required from a current baseline of US$258b to reach SE4All objective
Source: IRENA REMap 2014; World Bank, IEA GTF 2015
• Except for Europe all regions need to increase investment to meet this objective
• Middle Eastern and African countries need to increase investment by 50x and 18x, respectively, to meet this objective.
• The largest annual funding gap by far is in Developing Asia
A
E
R
49
11
4
17
65
1 2 9
95
98
66
23
2
50
36
57
0
50
100
150
200
250
NorthAmerica
Europe DevelopedAsia & Oceania
DevelopingAsia
MiddleEast
Africa LatinAmerica
USD
Bill
ion
Investment 2012 REmap 2030
Annual Investments needed in each region to reach RE SE4All goals by 2030
North America
15%
Europe 15%
Developed Asia &
Oceania 10%
Developing Asia 37%
Middle East 8%
Africa 6%
Latin America
9%
Regional share of annual Investments to reach RE SE4All goals by 2030
Finance Committee Report 2015
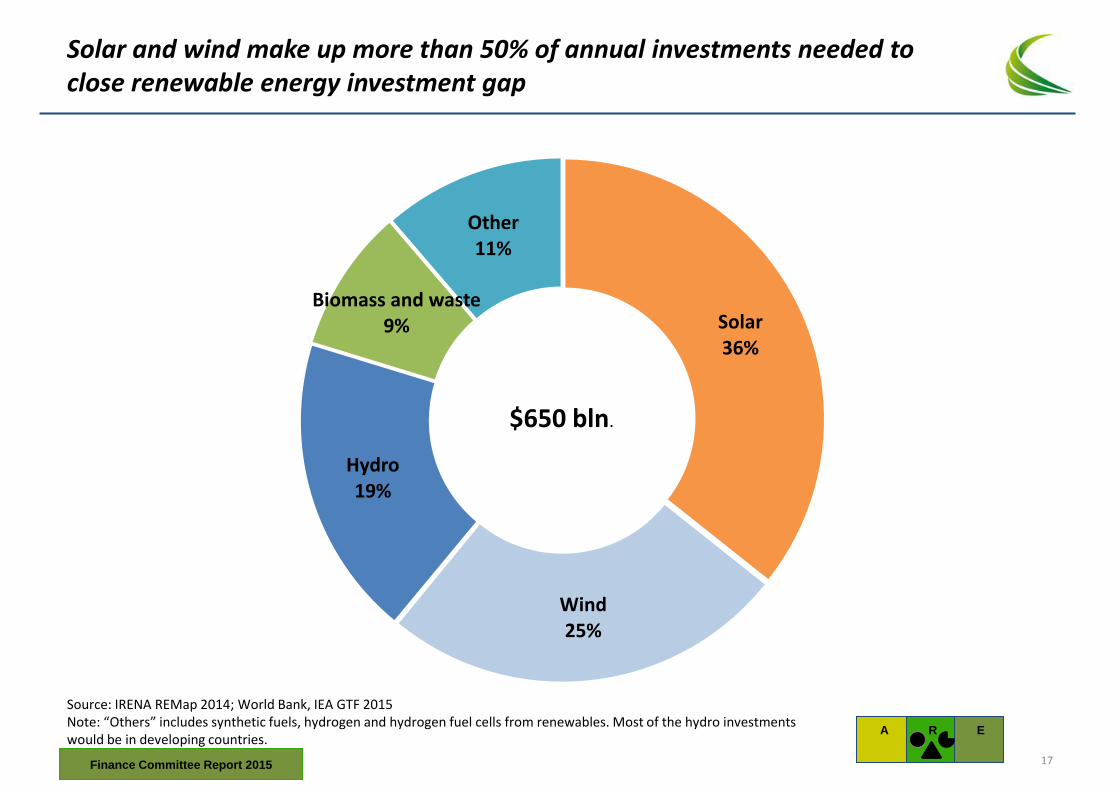
Solar and wind make up more than 50% of annual investments needed to close renewable energy investment gap
Source: IRENA REMap 2014; World Bank, IEA GTF 2015 Note: “Others” includes synthetic fuels, hydrogen and hydrogen fuel cells from renewables. Most of the hydro investments would be in developing countries.
A
E
R
Solar 36%
Wind 25%
Hydro 19%
Biomass and waste 9%
Other 11%
$650 bln.
Finance Committee Report 2015 17
Energy Efficiency: Doubling the Rate of Improvement in Energy Efficiency
Finance Committee Report 2015
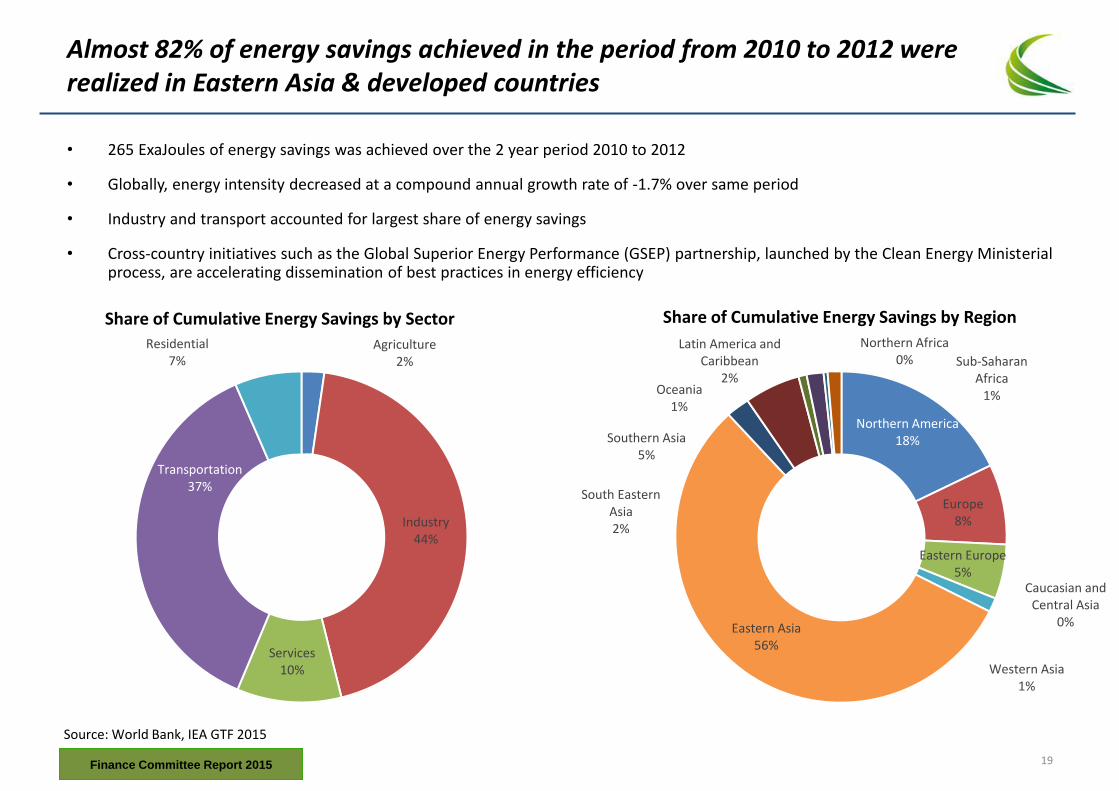
Almost 82% of energy savings achieved in the period from 2010 to 2012 were realized in Eastern Asia & developed countries
Source: World Bank, IEA GTF 2015
• 265 ExaJoules of energy savings was achieved over the 2 year period 2010 to 2012
• Globally, energy intensity decreased at a compound annual growth rate of -1.7% over same period
• Industry and transport accounted for largest share of energy savings
• Cross-country initiatives such as the Global Superior Energy Performance (GSEP) partnership, launched by the Clean Energy Ministerial process, are accelerating dissemination of best practices in energy efficiency
Agriculture 2%
Industry 44%
Services 10%
Transportation 37%
Residential 7%
Share of Cumulative Energy Savings by Sector
Northern America 18%
Europe 8%
Eastern Europe 5%
Caucasian and Central Asia
0%
Western Asia 1%
Eastern Asia 56%
South Eastern Asia 2%
Southern Asia 5%
Oceania 1%
Latin America and Caribbean
2%
Northern Africa 0% Sub-Saharan
Africa 1%
Share of Cumulative Energy Savings by Region
Finance Committee Report 2015 19
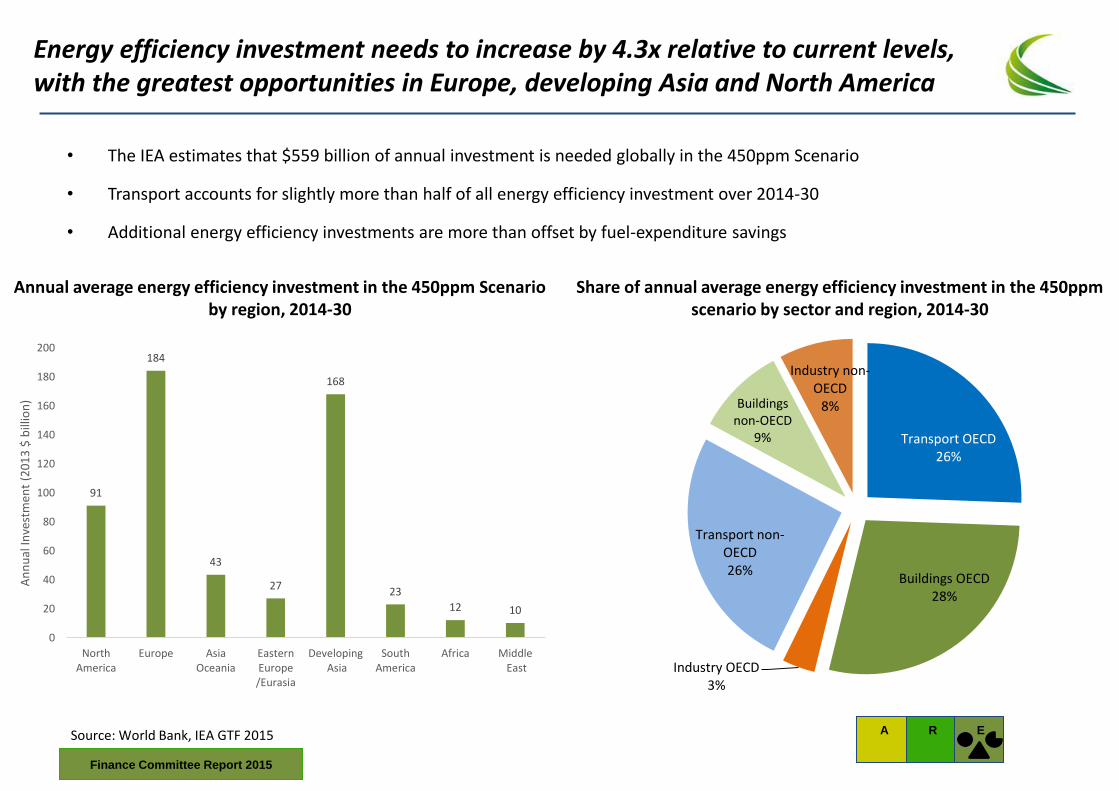
Energy efficiency investment needs to increase by 4.3x relative to current levels, with the greatest opportunities in Europe, developing Asia and North America
Source: World Bank, IEA GTF 2015
• The IEA estimates that $559 billion of annual investment is needed globally in the 450ppm Scenario
• Transport accounts for slightly more than half of all energy efficiency investment over 2014-30
• Additional energy efficiency investments are more than offset by fuel-expenditure savings
A
E
R
Annual average energy efficiency investment in the 450ppm Scenario by region, 2014-30
91
184
43
27
168
23
12 10
0
20
40
60
80
100
120
140
160
180
200
NorthAmerica
Europe AsiaOceania
EasternEurope/Eurasia
Developing Asia
SouthAmerica
Africa Middle East
An
nu
al In
vest
men
t (2
01
3 $
bill
ion
)
Share of annual average energy efficiency investment in the 450ppm scenario by sector and region, 2014-30
Transport OECD 26%
Buildings OECD 28%
Industry OECD 3%
Transport non-OECD 26%
Buildings non-OECD
9%
Industry non-OECD
8%
Finance Committee Report 2015
Analysis of reference countries
Finance Committee Report 2015 21
We have selected a set of geographically representative countries to assess in more granular detail the challenges of scaling up finance
• Having identified some key macro themes, we now explore a geographically representative subset of countries to determine what is needed to prepare countries for investment.
• While the global annual investment necessary to meet SE4All target across all countries is US$755 billion and currently annual investment towards those targets is $388 billion, a key area for further exploration is an examination of the actual capacity many countries actually have to absorb this potential investment.
• This will, in turn, help guide what the most impactful approaches might be to unlock finance.
• 14 countries have been selected as a geographically representative sample, from the countries covered in Global Tracking Framework with emphasis on:
• High Impact Countries, determined by size of electricity access deficit, non-solid fuel access deficit, and energy consumption
• Fast Moving Countries, determined by progress along the SE4All objectives over the period 1990-2010
• This subset includes 7 investment–grade countries and 7 below investment-grade
• While a number of countries have only a limited capacity for significant new investment in the near term, they may well also be those countries where the impact on individuals, communities and the economies are the greatest.
Finance Committee Report 2015

Reference countries have been selected among high impact and fast moving countries with varying perceived credit quality and ease of access to capital
Sources: Standard & Poor’s; World Bank Data Finance Committee Report 2015 23
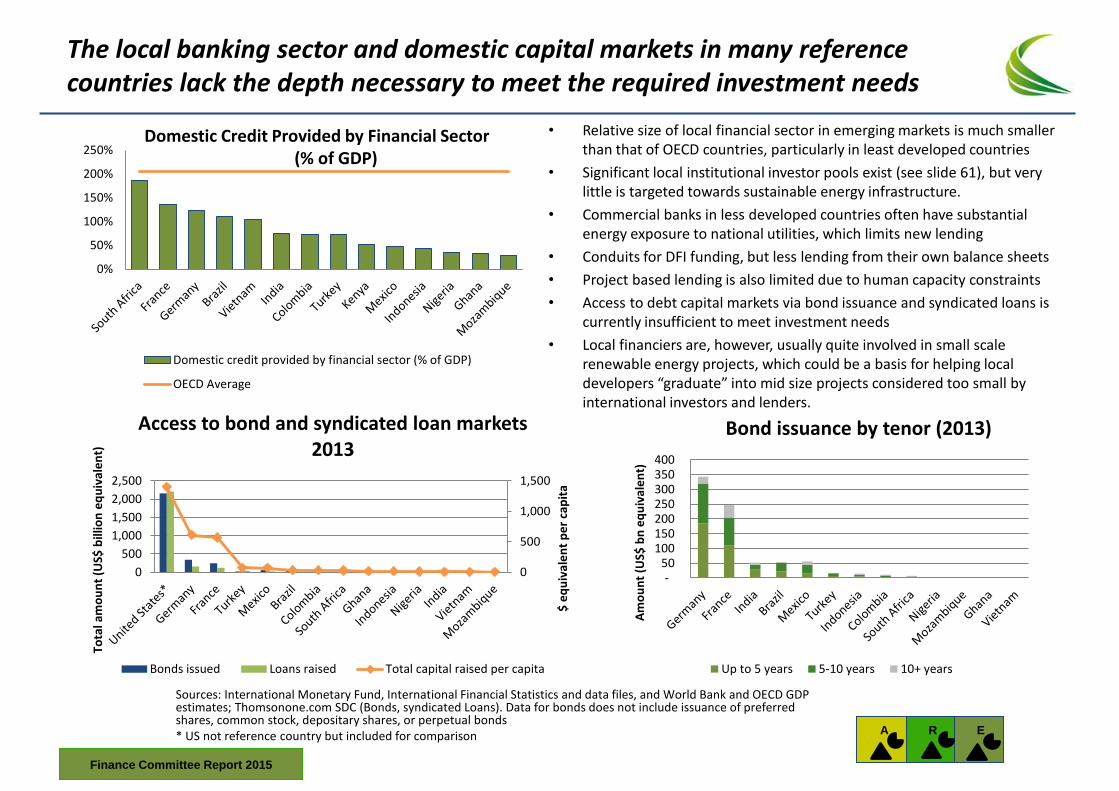
The local banking sector and domestic capital markets in many reference countries lack the depth necessary to meet the required investment needs
Sources: International Monetary Fund, International Financial Statistics and data files, and World Bank and OECD GDP estimates; Thomsonone.com SDC (Bonds, syndicated Loans). Data for bonds does not include issuance of preferred shares, common stock, depositary shares, or perpetual bonds * US not reference country but included for comparison
• Relative size of local financial sector in emerging markets is much smaller than that of OECD countries, particularly in least developed countries
• Significant local institutional investor pools exist (see slide 61), but very little is targeted towards sustainable energy infrastructure.
• Commercial banks in less developed countries often have substantial energy exposure to national utilities, which limits new lending
• Conduits for DFI funding, but less lending from their own balance sheets
• Project based lending is also limited due to human capacity constraints
• Access to debt capital markets via bond issuance and syndicated loans is currently insufficient to meet investment needs
• Local financiers are, however, usually quite involved in small scale renewable energy projects, which could be a basis for helping local developers “graduate” into mid size projects considered too small by international investors and lenders.
0
500
1,000
1,500
0
500
1,000
1,500
2,000
2,500
$ e
qu
ival
en
t p
er
cap
ita
Tota
l am
ou
nt
(US$
bill
ion
eq
uiv
ale
nt)
Access to bond and syndicated loan markets 2013
Bonds issued Loans raised Total capital raised per capita
- 50
100 150 200 250 300 350 400
Am
ou
nt
(US$
bn
eq
uiv
ale
nt)
Bond issuance by tenor (2013)
Up to 5 years 5-10 years 10+ years
0%
50%
100%
150%
200%
250%
Domestic credit provided by financial sector (% of GDP)
OECD Average
Domestic Credit Provided by Financial Sector (% of GDP)
A
E
R
Finance Committee Report 2015
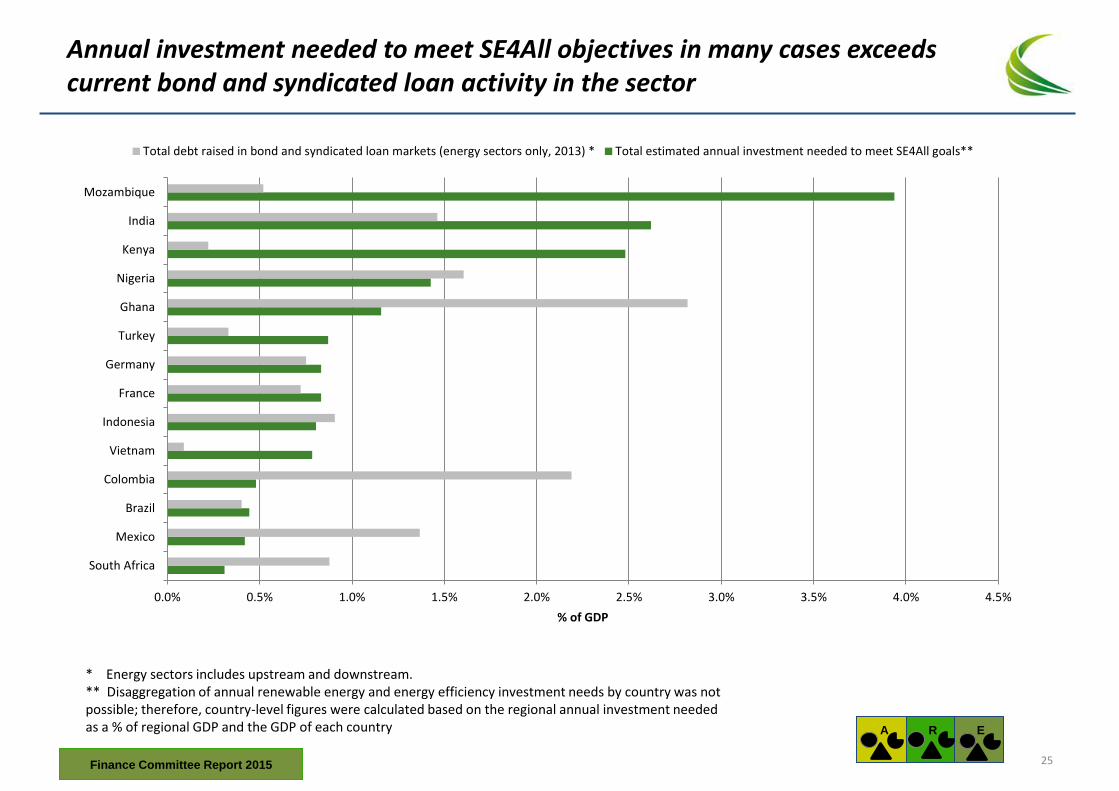
Annual investment needed to meet SE4All objectives in many cases exceeds current bond and syndicated loan activity in the sector
* Energy sectors includes upstream and downstream. ** Disaggregation of annual renewable energy and energy efficiency investment needs by country was not possible; therefore, country-level figures were calculated based on the regional annual investment needed as a % of regional GDP and the GDP of each country
0.0% 0.5% 1.0% 1.5% 2.0% 2.5% 3.0% 3.5% 4.0% 4.5%
South Africa
Mexico
Brazil
Colombia
Vietnam
Indonesia
France
Germany
Turkey
Ghana
Nigeria
Kenya
India
Mozambique
% of GDP
Total debt raised in bond and syndicated loan markets (energy sectors only, 2013) * Total estimated annual investment needed to meet SE4All goals**
A
E
R
Finance Committee Report 2015 25
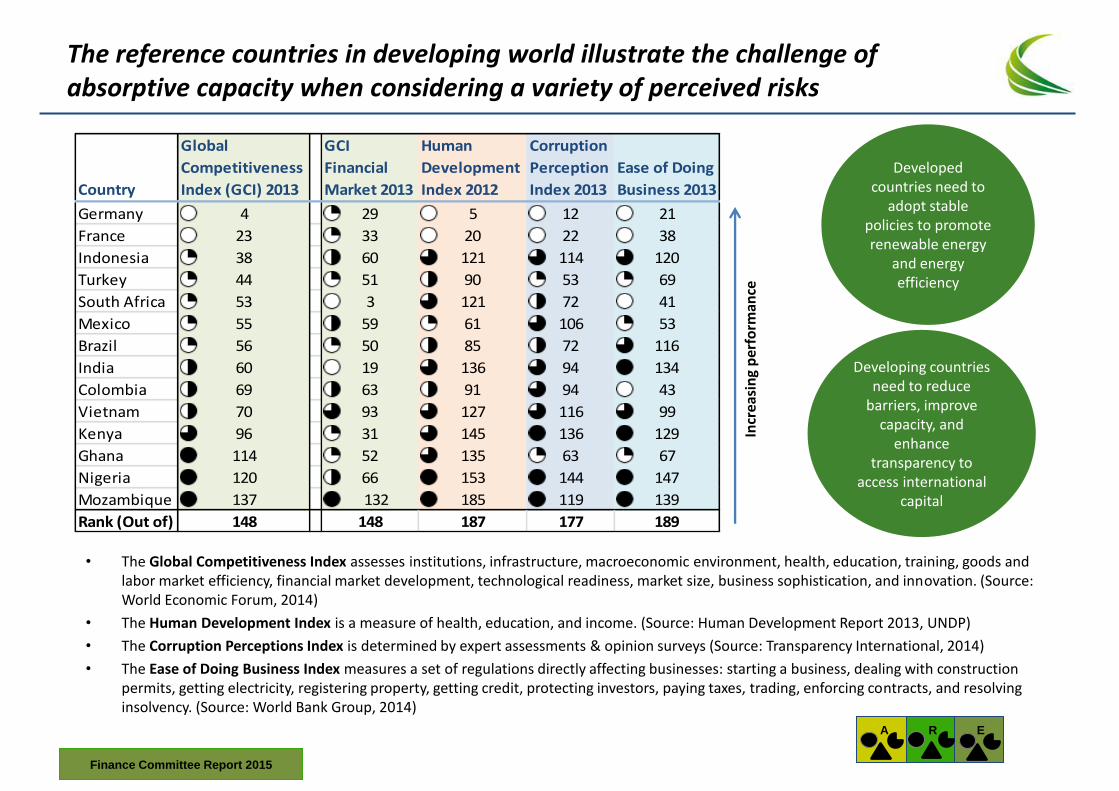
The reference countries in developing world illustrate the challenge of absorptive capacity when considering a variety of perceived risks
• The Global Competitiveness Index assesses institutions, infrastructure, macroeconomic environment, health, education, training, goods and labor market efficiency, financial market development, technological readiness, market size, business sophistication, and innovation. (Source: World Economic Forum, 2014)
• The Human Development Index is a measure of health, education, and income. (Source: Human Development Report 2013, UNDP)
• The Corruption Perceptions Index is determined by expert assessments & opinion surveys (Source: Transparency International, 2014)
• The Ease of Doing Business Index measures a set of regulations directly affecting businesses: starting a business, dealing with construction permits, getting electricity, registering property, getting credit, protecting investors, paying taxes, trading, enforcing contracts, and resolving insolvency. (Source: World Bank Group, 2014)
Country
Global
Competitiveness
Index (GCI) 2013
GCI
Financial
Market 2013
Human
Development
Index 2012
Corruption
Perception
Index 2013
Ease of Doing
Business 2013
Germany 4 29 5 12 21
France 23 33 20 22 38
Indonesia 38 60 121 114 120
Turkey 44 51 90 53 69
South Africa 53 3 121 72 41
Mexico 55 59 61 106 53
Brazil 56 50 85 72 116
India 60 19 136 94 134
Colombia 69 63 91 94 43
Vietnam 70 93 127 116 99
Kenya 96 31 145 136 129
Ghana 114 52 135 63 67
Nigeria 120 66 153 144 147
Mozambique 137 132 185 119 139
Rank (Out of) 148 148 187 177 189
Incr
easi
ng
per
form
ance
Developing countries need to reduce
barriers, improve capacity, and
enhance transparency to
access international capital
A
E
R
Developed countries need to
adopt stable policies to promote renewable energy
and energy efficiency
Finance Committee Report 2015
There is a need for improved enabling environments for investment, more diligent project preparation activity, and alternative finance mechanisms
• With the financing gap identified, and the capacity challenge that many countries have to attract the investment needed, there are three key conditions will need to be in place in order meet the SE4All objectives
– Countries will need be ready and able to absorb large amounts of capital by increasing implementation capacity and putting enabling investment environments in place
– There will need to be a qualified pipeline of deals for capital to be effectively deployed
– Capital with a suitable risk appetite must be available and willing to be deployed given the nature of the investment opportunities
• Important to establish an enabling environment at the country level (including supporting policies, regulations, and the strengthening of utilities)
• There is also a critical need to boost the investment in project preparation activities to convert concepts into investable deals.
• These topics are tackled in the next section by examining emerging best practices in project preparation and in securing project finance.
A
E
R
Finance Committee Report 2015 27
SECTION 2. Increasing the Deal-flow
Finance Committee Report 2015
There is an emerging set of best practices around how to increase deal-flow in sustainable energy projects and to ensure project finance is secured
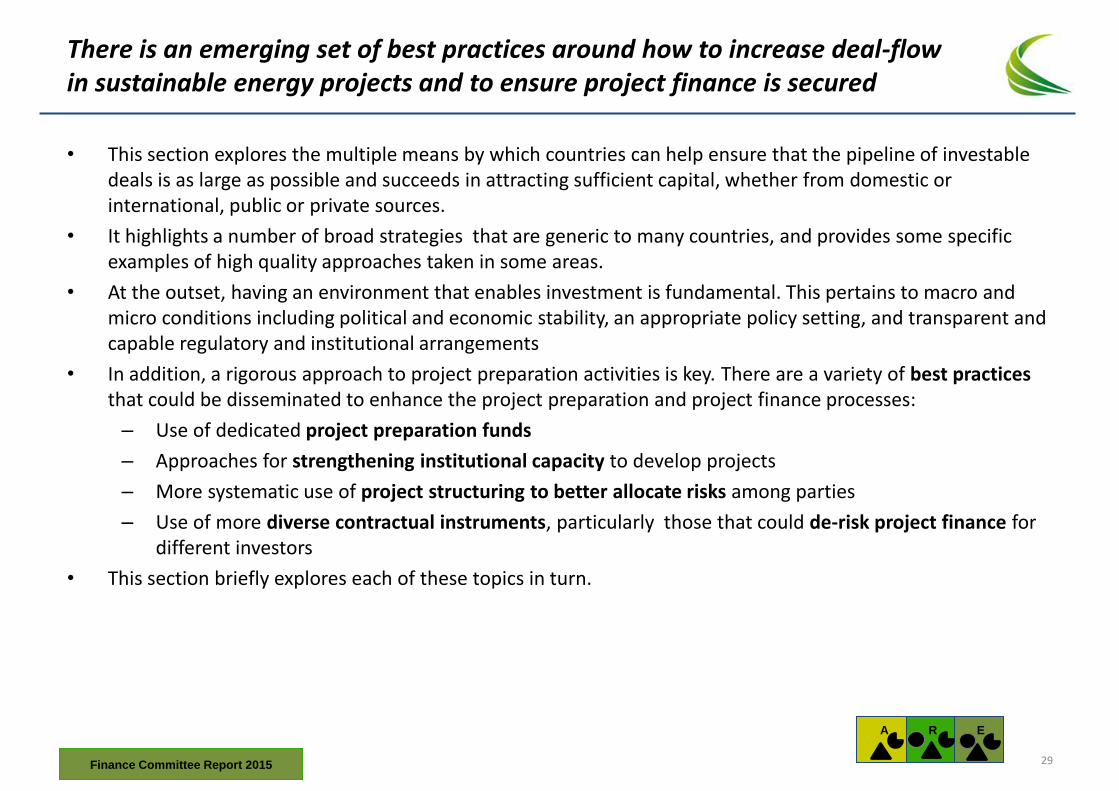
• This section explores the multiple means by which countries can help ensure that the pipeline of investable deals is as large as possible and succeeds in attracting sufficient capital, whether from domestic or international, public or private sources.
• It highlights a number of broad strategies that are generic to many countries, and provides some specific examples of high quality approaches taken in some areas.
• At the outset, having an environment that enables investment is fundamental. This pertains to macro and micro conditions including political and economic stability, an appropriate policy setting, and transparent and capable regulatory and institutional arrangements
• In addition, a rigorous approach to project preparation activities is key. There are a variety of best practices that could be disseminated to enhance the project preparation and project finance processes:
– Use of dedicated project preparation funds
– Approaches for strengthening institutional capacity to develop projects
– More systematic use of project structuring to better allocate risks among parties
– Use of more diverse contractual instruments, particularly those that could de-risk project finance for different investors
• This section briefly explores each of these topics in turn.
A
E
R
Finance Committee Report 2015 29
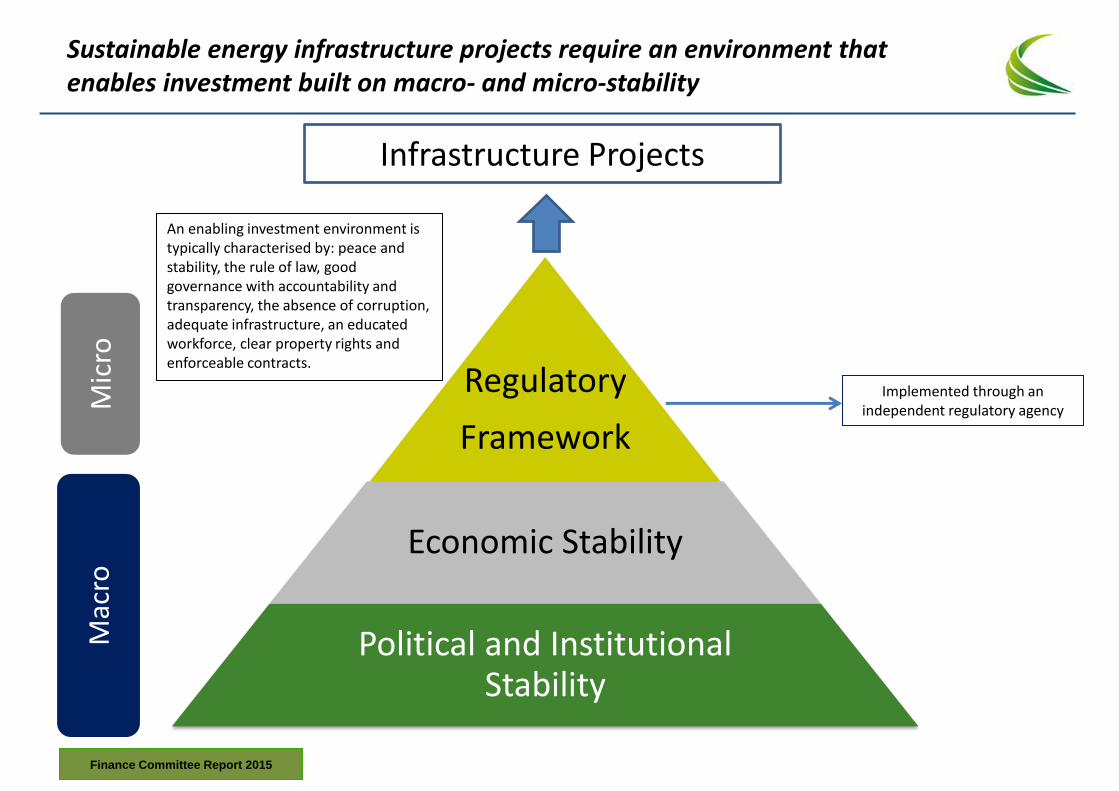
Sustainable energy infrastructure projects require an environment that enables investment built on macro- and micro-stability
Mac
ro
Mic
ro
Infrastructure Projects
Regulatory
Framework
Economic Stability
Political and Institutional Stability
Implemented through an independent regulatory agency
An enabling investment environment is typically characterised by: peace and stability, the rule of law, good governance with accountability and transparency, the absence of corruption, adequate infrastructure, an educated workforce, clear property rights and enforceable contracts.
Finance Committee Report 2015
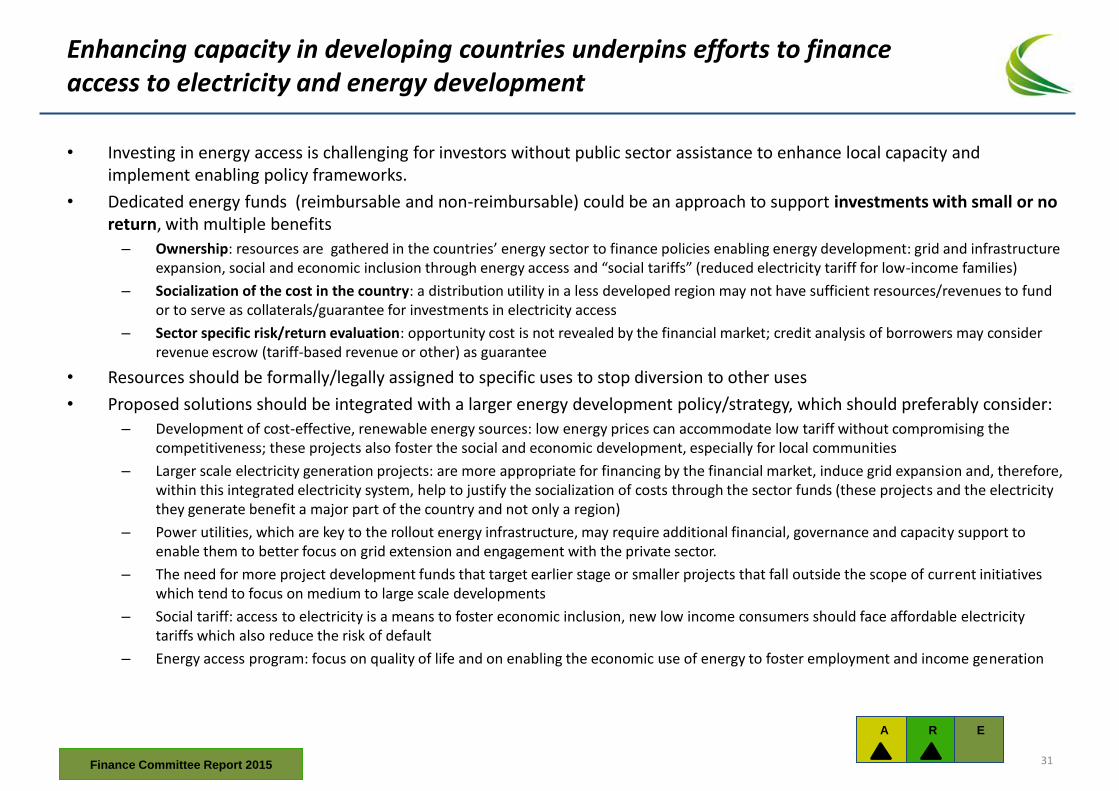
Enhancing capacity in developing countries underpins efforts to finance access to electricity and energy development
• Investing in energy access is challenging for investors without public sector assistance to enhance local capacity and implement enabling policy frameworks.
• Dedicated energy funds (reimbursable and non-reimbursable) could be an approach to support investments with small or no return, with multiple benefits
– Ownership: resources are gathered in the countries’ energy sector to finance policies enabling energy development: grid and infrastructure expansion, social and economic inclusion through energy access and “social tariffs” (reduced electricity tariff for low-income families)
– Socialization of the cost in the country: a distribution utility in a less developed region may not have sufficient resources/revenues to fund or to serve as collaterals/guarantee for investments in electricity access
– Sector specific risk/return evaluation: opportunity cost is not revealed by the financial market; credit analysis of borrowers may consider revenue escrow (tariff-based revenue or other) as guarantee
• Resources should be formally/legally assigned to specific uses to stop diversion to other uses
• Proposed solutions should be integrated with a larger energy development policy/strategy, which should preferably consider:
– Development of cost-effective, renewable energy sources: low energy prices can accommodate low tariff without compromising the competitiveness; these projects also foster the social and economic development, especially for local communities
– Larger scale electricity generation projects: are more appropriate for financing by the financial market, induce grid expansion and, therefore, within this integrated electricity system, help to justify the socialization of costs through the sector funds (these projects and the electricity they generate benefit a major part of the country and not only a region)
– Power utilities, which are key to the rollout energy infrastructure, may require additional financial, governance and capacity support to enable them to better focus on grid extension and engagement with the private sector.
– The need for more project development funds that target earlier stage or smaller projects that fall outside the scope of current initiatives which tend to focus on medium to large scale developments
– Social tariff: access to electricity is a means to foster economic inclusion, new low income consumers should face affordable electricity tariffs which also reduce the risk of default
– Energy access program: focus on quality of life and on enabling the economic use of energy to foster employment and income generation
A
E
R
Finance Committee Report 2015 31
Specific capacity building efforts for energy access must also include local power utilities which can play a key role for both on- and off-grid solutions
Local governments and DFIs will continue to be the main channel for providing energy access, particularly in the least developed countries. Countries may need to make difficult investment trade-offs when considering alternative pathways for achieving access. For example, investments focused only on increasing energy access may be more carbon-intensive than those simultaneously attempting to meet the energy access and renewable energy goals. Universal energy access programs are a vehicle for social and economic development in low-income communities, helping to reduce poverty and increase household income:
• With access to electricity, families acquire appliances and rural electric equipment, allowing increased incomes, improved sanitation, health and education, strengthening the social capital of these communities.
• To achieve its objectives and to optimize the use of public resources, a universal access program should prioritize the development of a low cost power grid and in a complementary way, decentralized generation in isolated networks.
• In this scenario, a universal access program should allocate funds to projects aimed at serving future consumers located in rural areas and emphasizes the social nature of the investment.
• The establishment of project development funds should be considered that specifically target this sector, that would enable technical development and stimulate efficient and productive use of electricity and broader activities.
Local power utilities could facilitate financing of smaller scale projects. They are often state or government-owned and from private investors’ perspectives, sometimes lack sufficient creditworthiness to be a counterparty for a PPA. Targeted support and incentives can complement DFI initiatives and drive progress where the economics for the private sector are still not compelling. They have a key role to play as they often provide the long term off-take agreement, or PPA required to attract project finance, that can build grid access. The approach utilities should take would include:
• Prepare a system expansion plan that provides information on strategy and spatial plans of (a) grid extension in the next 3 to 4 years, (b) areas open to off-grid service providers, and (c) intermediate areas where grid may be extended within a period that is less than necessary for amortization of off-grid investments.
• Establish a policy of compensation to the micro-grid owner for unamortized assets if micro-grid is integrated into the grid. Set clear technical standards for micro-grids for future integration into grid.
• Deploy distributed energy technologies (micro-or-off-grid) to advance rural electrification
• Use innovative business models and create new services to improve energy affordability among low-income populations
• Leverage existing infrastructure to advance urban and semi-urban electrification efforts
• Increase adoption of smart grid technologies to increase absorption of renewable energy and increase efficiency
• Seek innovative ways of improving creditworthiness including through partnerships with those willing and able to provide a PPA guarantee for private investors or project developers.
Source: Accenture, SE4All staff A
E
R
Finance Committee Report 2015
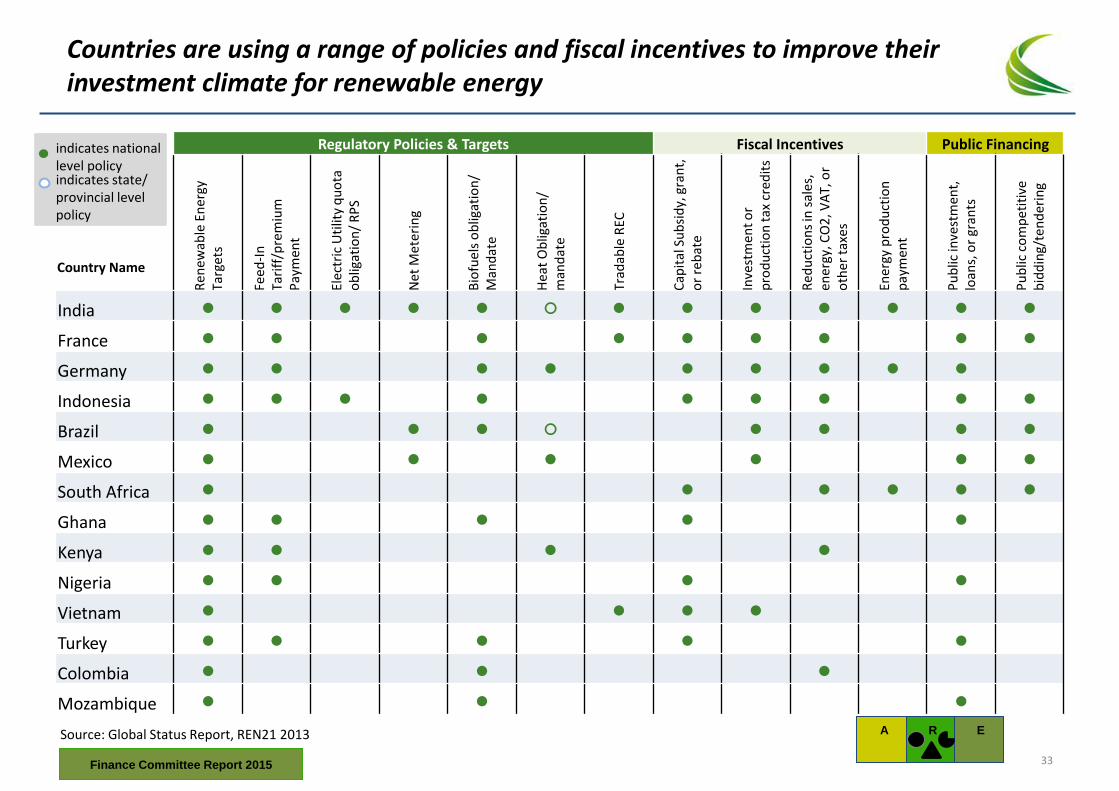
Countries are using a range of policies and fiscal incentives to improve their investment climate for renewable energy
Regulatory Policies & Targets Fiscal Incentives Public Financing
Country Name
Ren
ewab
le E
ner
gy
Targ
ets
Feed
-In
Ta
riff
/pre
miu
m
Pay
men
t
Elec
tric
Uti
lity
qu
ota
o
blig
atio
n/
RP
S
Net
Met
erin
g
Bio
fuel
s o
blig
atio
n/
Man
dat
e
Hea
t O
blig
atio
n/
man
dat
e
Trad
able
REC
Cap
ital
Su
bsi
dy,
gra
nt,
o
r re
bat
e
Inve
stm
ent
or
pro
du
ctio
n t
ax c
red
its
Red
uct
ion
s in
sal
es,
ener
gy, C
O2
, VA
T, o
r o
ther
tax
es
Ener
gy p
rod
uct
ion
p
aym
ent
Pu
blic
inve
stm
ent,
lo
ans,
or
gran
ts
Pu
blic
co
mp
etit
ive
bid
din
g/te
nd
erin
g
India ● ● ● ● ● ○ ● ● ● ● ● ● ●
France ● ● ● ● ● ● ● ● ●
Germany ● ● ● ● ● ● ● ● ●
Indonesia ● ● ● ● ● ● ● ● ●
Brazil ● ● ● ○ ● ● ● ●
Mexico ● ● ● ● ● ●
South Africa ● ● ● ● ● ●
Ghana ● ● ● ● ●
Kenya ● ● ● ●
Nigeria ● ● ● ●
Vietnam ● ● ● ●
Turkey ● ● ● ● ●
Colombia ● ● ●
Mozambique ● ● ●
indicates state/ provincial level policy
indicates national level policy
Source: Global Status Report, REN21 2013 A
E
R
Finance Committee Report 2015 33
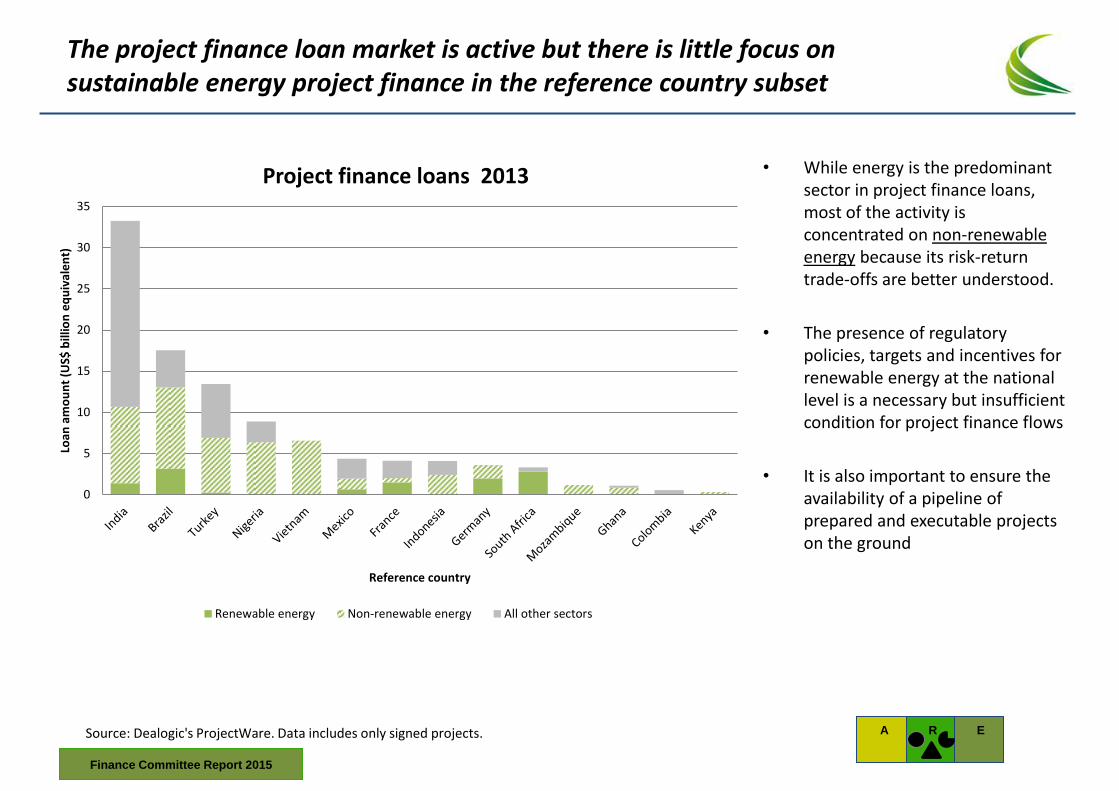
The project finance loan market is active but there is little focus on sustainable energy project finance in the reference country subset
Source: Dealogic's ProjectWare. Data includes only signed projects.
• While energy is the predominant sector in project finance loans, most of the activity is concentrated on non-renewable energy because its risk-return trade-offs are better understood.
• The presence of regulatory policies, targets and incentives for renewable energy at the national level is a necessary but insufficient condition for project finance flows
• It is also important to ensure the availability of a pipeline of prepared and executable projects on the ground
0
5
10
15
20
25
30
35
Loan
am
ou
nt
(US$
bill
ion
eq
uiv
ale
nt)
Reference country
Project finance loans 2013
Renewable energy Non-renewable energy All other sectors
A
E
R
Finance Committee Report 2015
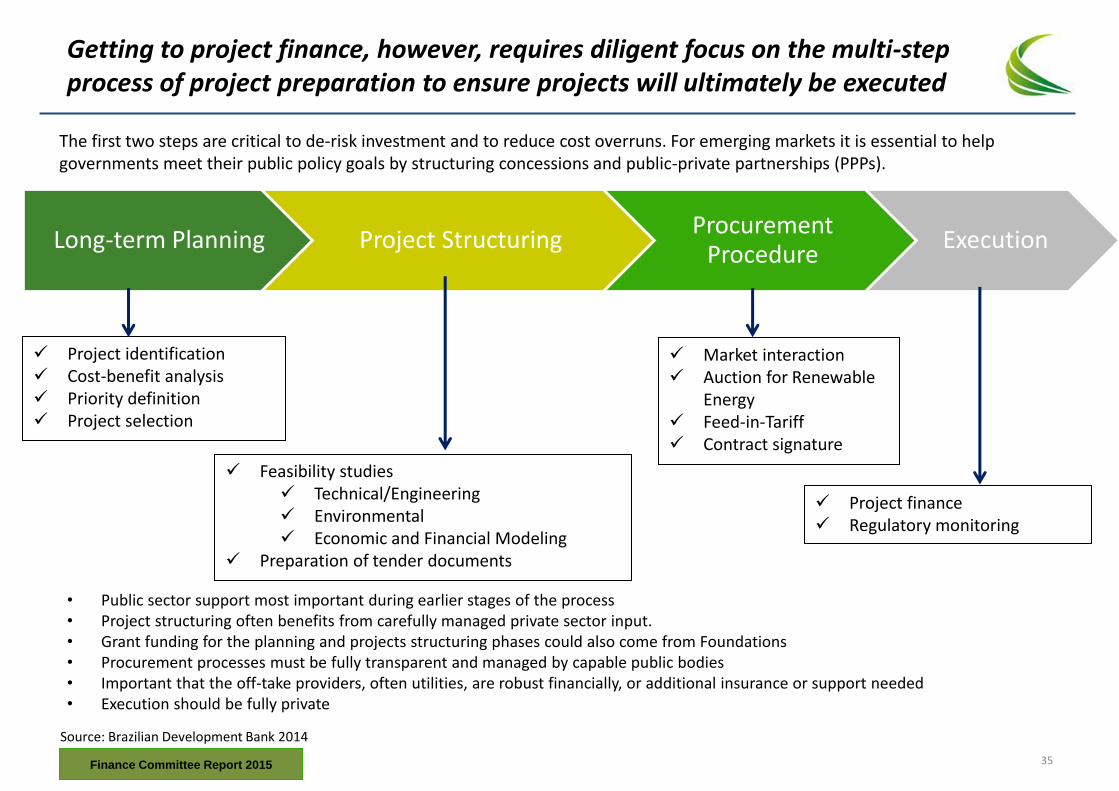
Getting to project finance, however, requires diligent focus on the multi-step process of project preparation to ensure projects will ultimately be executed
Long-term Planning Project Structuring Procurement
Procedure Execution
Project identification Cost-benefit analysis Priority definition Project selection
Project finance Regulatory monitoring
Market interaction Auction for Renewable
Energy Feed-in-Tariff Contract signature
Feasibility studies Technical/Engineering Environmental Economic and Financial Modeling
Preparation of tender documents
Source: Brazilian Development Bank 2014
The first two steps are critical to de-risk investment and to reduce cost overruns. For emerging markets it is essential to help governments meet their public policy goals by structuring concessions and public-private partnerships (PPPs).
• Public sector support most important during earlier stages of the process • Project structuring often benefits from carefully managed private sector input. • Grant funding for the planning and projects structuring phases could also come from Foundations • Procurement processes must be fully transparent and managed by capable public bodies • Important that the off-take providers, often utilities, are robust financially, or additional insurance or support needed • Execution should be fully private
Finance Committee Report 2015 35
Project preparation
Finance Committee Report 2015
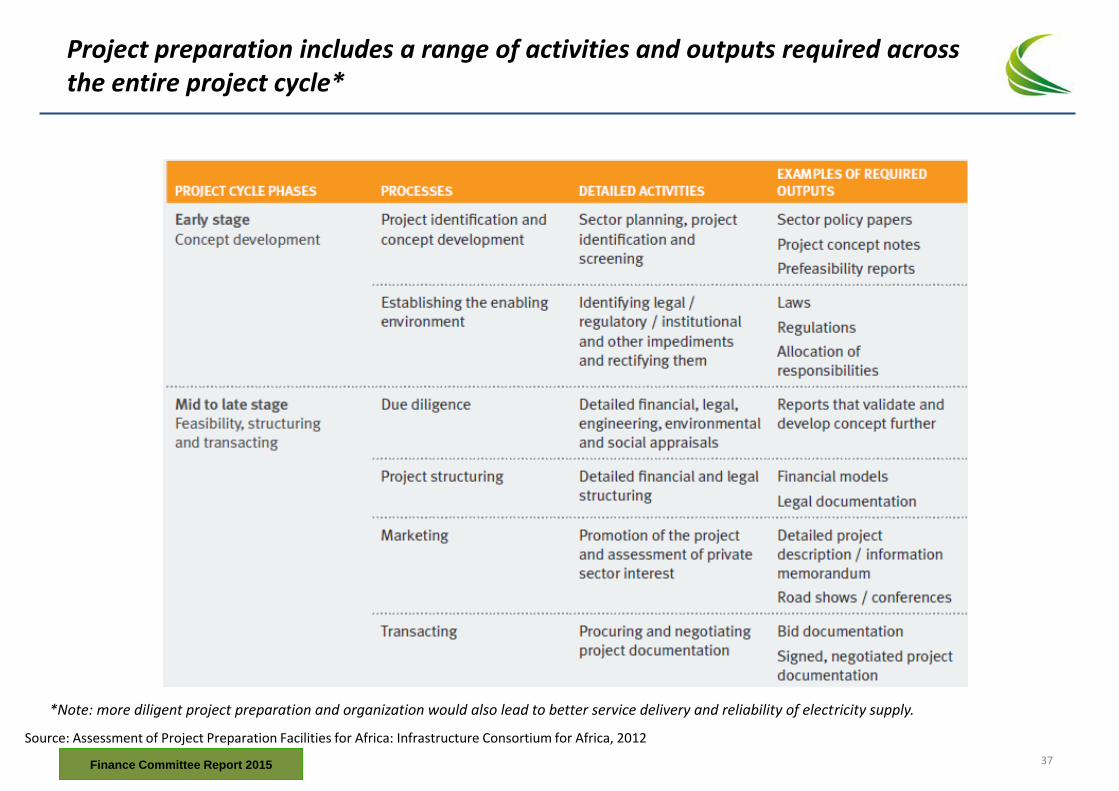
Project preparation includes a range of activities and outputs required across the entire project cycle*
Source: Assessment of Project Preparation Facilities for Africa: Infrastructure Consortium for Africa, 2012
*Note: more diligent project preparation and organization would also lead to better service delivery and reliability of electricity supply.
Finance Committee Report 2015 37
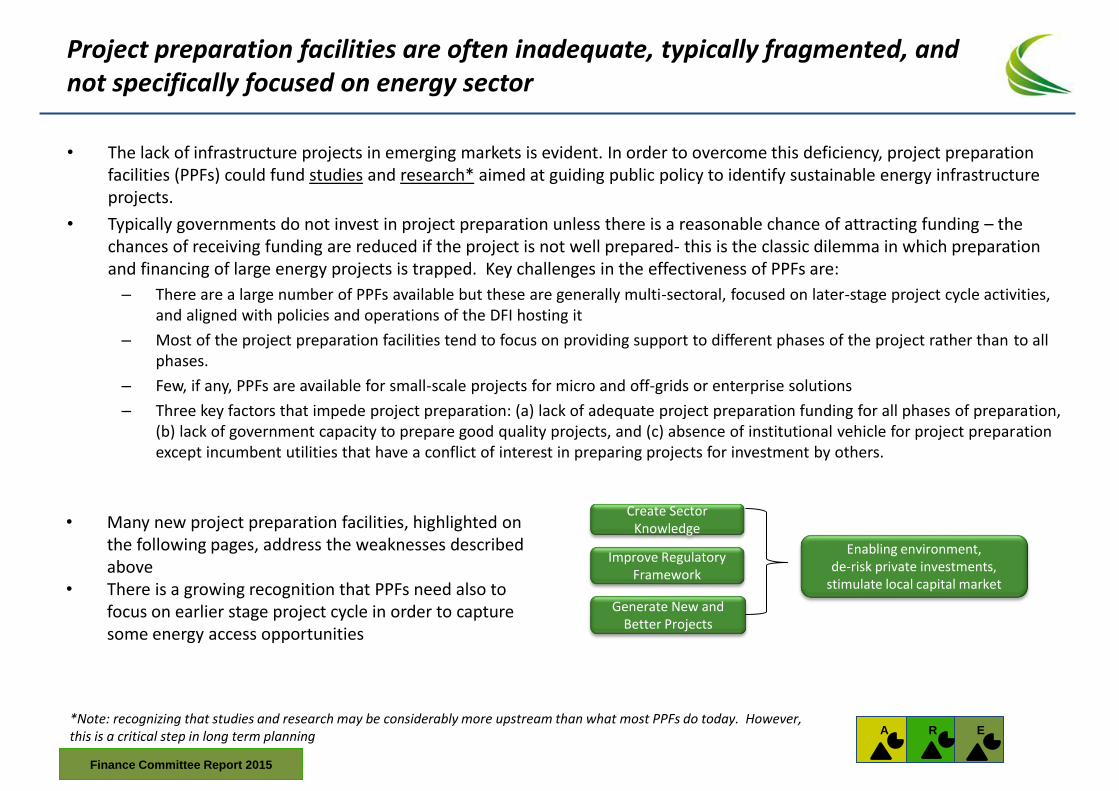
Project preparation facilities are often inadequate, typically fragmented, and not specifically focused on energy sector
• The lack of infrastructure projects in emerging markets is evident. In order to overcome this deficiency, project preparation facilities (PPFs) could fund studies and research* aimed at guiding public policy to identify sustainable energy infrastructure projects.
• Typically governments do not invest in project preparation unless there is a reasonable chance of attracting funding – the chances of receiving funding are reduced if the project is not well prepared- this is the classic dilemma in which preparation and financing of large energy projects is trapped. Key challenges in the effectiveness of PPFs are:
– There are a large number of PPFs available but these are generally multi-sectoral, focused on later-stage project cycle activities, and aligned with policies and operations of the DFI hosting it
– Most of the project preparation facilities tend to focus on providing support to different phases of the project rather than to all phases.
– Few, if any, PPFs are available for small-scale projects for micro and off-grids or enterprise solutions
– Three key factors that impede project preparation: (a) lack of adequate project preparation funding for all phases of preparation, (b) lack of government capacity to prepare good quality projects, and (c) absence of institutional vehicle for project preparation except incumbent utilities that have a conflict of interest in preparing projects for investment by others.
A
E
R
Create Sector Knowledge
Improve Regulatory Framework
Generate New and Better Projects
Enabling environment, de-risk private investments,
stimulate local capital market
• Many new project preparation facilities, highlighted on the following pages, address the weaknesses described above
• There is a growing recognition that PPFs need also to focus on earlier stage project cycle in order to capture some energy access opportunities
*Note: recognizing that studies and research may be considerably more upstream than what most PPFs do today. However, this is a critical step in long term planning
Finance Committee Report 2015
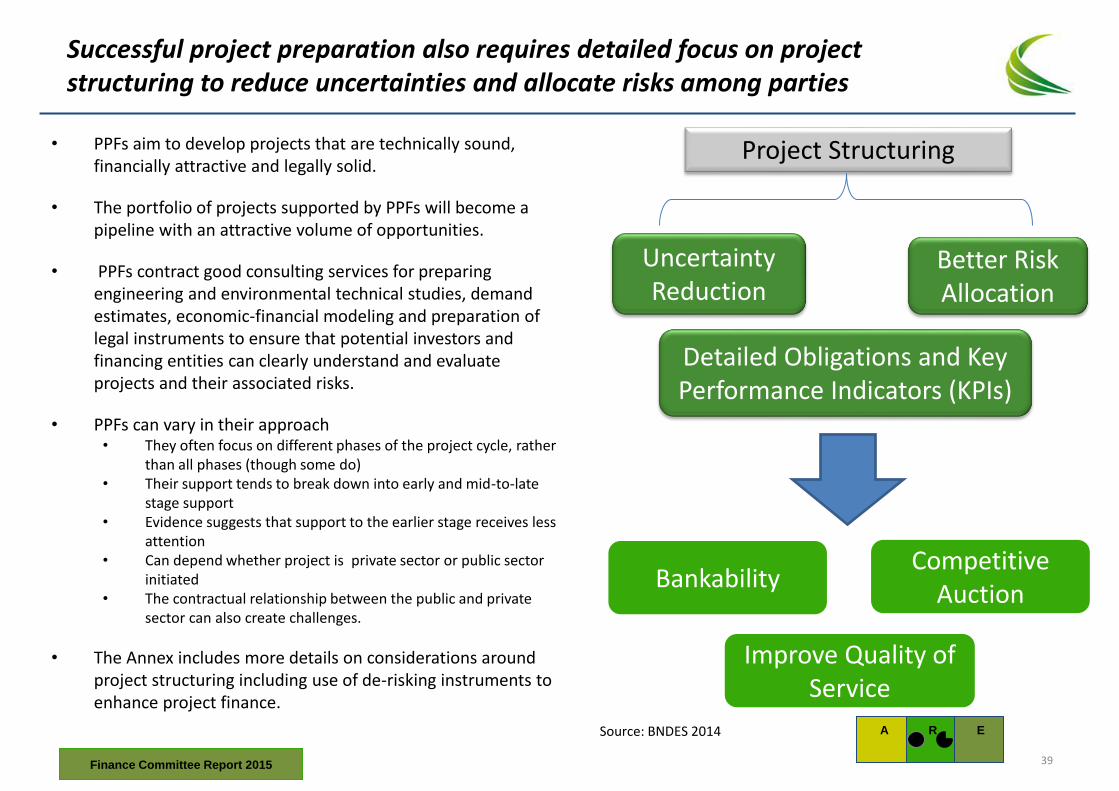
Successful project preparation also requires detailed focus on project structuring to reduce uncertainties and allocate risks among parties
Project Structuring
Uncertainty Reduction
Better Risk Allocation
Bankability Competitive
Auction
Improve Quality of Service
Detailed Obligations and Key Performance Indicators (KPIs)
Source: BNDES 2014
• PPFs aim to develop projects that are technically sound, financially attractive and legally solid.
• The portfolio of projects supported by PPFs will become a pipeline with an attractive volume of opportunities.
• PPFs contract good consulting services for preparing engineering and environmental technical studies, demand estimates, economic-financial modeling and preparation of legal instruments to ensure that potential investors and financing entities can clearly understand and evaluate projects and their associated risks.
• PPFs can vary in their approach • They often focus on different phases of the project cycle, rather
than all phases (though some do) • Their support tends to break down into early and mid-to-late
stage support • Evidence suggests that support to the earlier stage receives less
attention • Can depend whether project is private sector or public sector
initiated • The contractual relationship between the public and private
sector can also create challenges.
• The Annex includes more details on considerations around project structuring including use of de-risking instruments to enhance project finance.
A
E
R
Finance Committee Report 2015 39
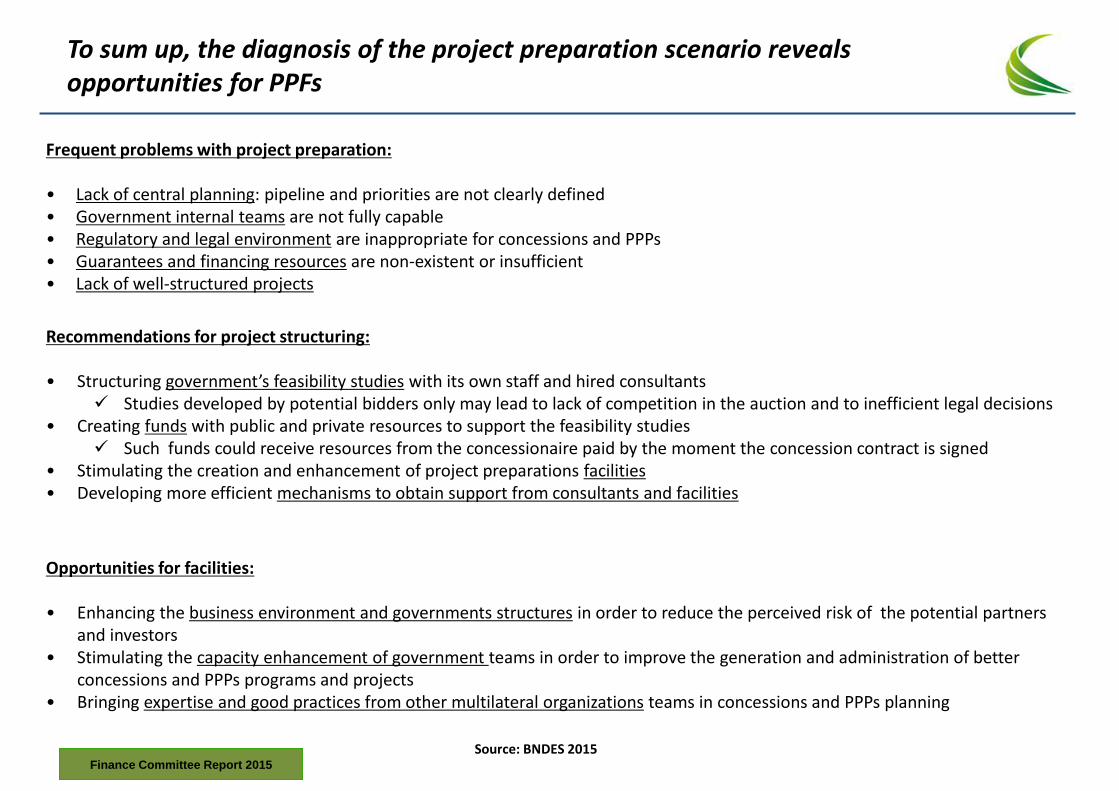
To sum up, the diagnosis of the project preparation scenario reveals opportunities for PPFs
Opportunities for facilities: • Enhancing the business environment and governments structures in order to reduce the perceived risk of the potential partners
and investors • Stimulating the capacity enhancement of government teams in order to improve the generation and administration of better
concessions and PPPs programs and projects • Bringing expertise and good practices from other multilateral organizations teams in concessions and PPPs planning
Source: BNDES 2015
Recommendations for project structuring: • Structuring government’s feasibility studies with its own staff and hired consultants
Studies developed by potential bidders only may lead to lack of competition in the auction and to inefficient legal decisions • Creating funds with public and private resources to support the feasibility studies
Such funds could receive resources from the concessionaire paid by the moment the concession contract is signed • Stimulating the creation and enhancement of project preparations facilities • Developing more efficient mechanisms to obtain support from consultants and facilities
Frequent problems with project preparation: • Lack of central planning: pipeline and priorities are not clearly defined • Government internal teams are not fully capable • Regulatory and legal environment are inappropriate for concessions and PPPs • Guarantees and financing resources are non-existent or insufficient • Lack of well-structured projects
Finance Committee Report 2015
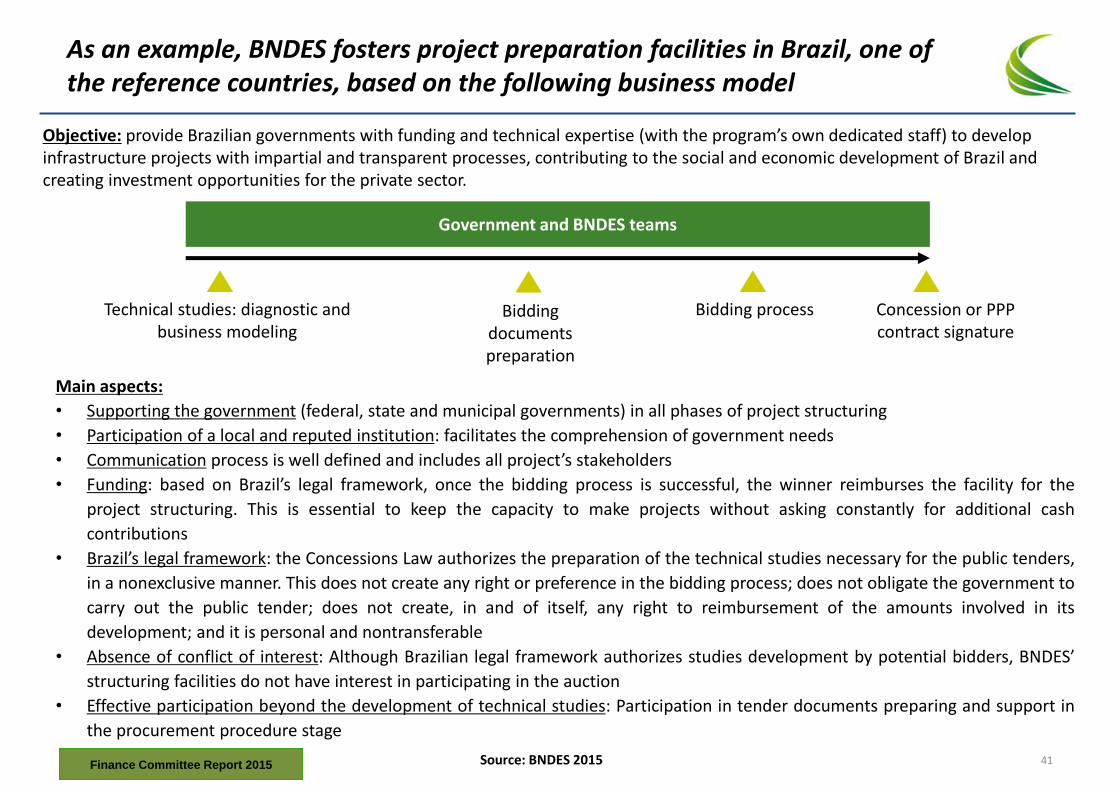
As an example, BNDES fosters project preparation facilities in Brazil, one of the reference countries, based on the following business model
Main aspects:
• Supporting the government (federal, state and municipal governments) in all phases of project structuring
• Participation of a local and reputed institution: facilitates the comprehension of government needs
• Communication process is well defined and includes all project’s stakeholders
• Funding: based on Brazil’s legal framework, once the bidding process is successful, the winner reimburses the facility for the
project structuring. This is essential to keep the capacity to make projects without asking constantly for additional cash
contributions
• Brazil’s legal framework: the Concessions Law authorizes the preparation of the technical studies necessary for the public tenders,
in a nonexclusive manner. This does not create any right or preference in the bidding process; does not obligate the government to
carry out the public tender; does not create, in and of itself, any right to reimbursement of the amounts involved in its
development; and it is personal and nontransferable
• Absence of conflict of interest: Although Brazilian legal framework authorizes studies development by potential bidders, BNDES’
structuring facilities do not have interest in participating in the auction
• Effective participation beyond the development of technical studies: Participation in tender documents preparing and support in
the procurement procedure stage
Concession or PPP contract signature
Bidding process Technical studies: diagnostic and business modeling
Government and BNDES teams
Bidding documents preparation
Source: BNDES 2015
Objective: provide Brazilian governments with funding and technical expertise (with the program’s own dedicated staff) to develop infrastructure projects with impartial and transparent processes, contributing to the social and economic development of Brazil and creating investment opportunities for the private sector.
Finance Committee Report 2015 41
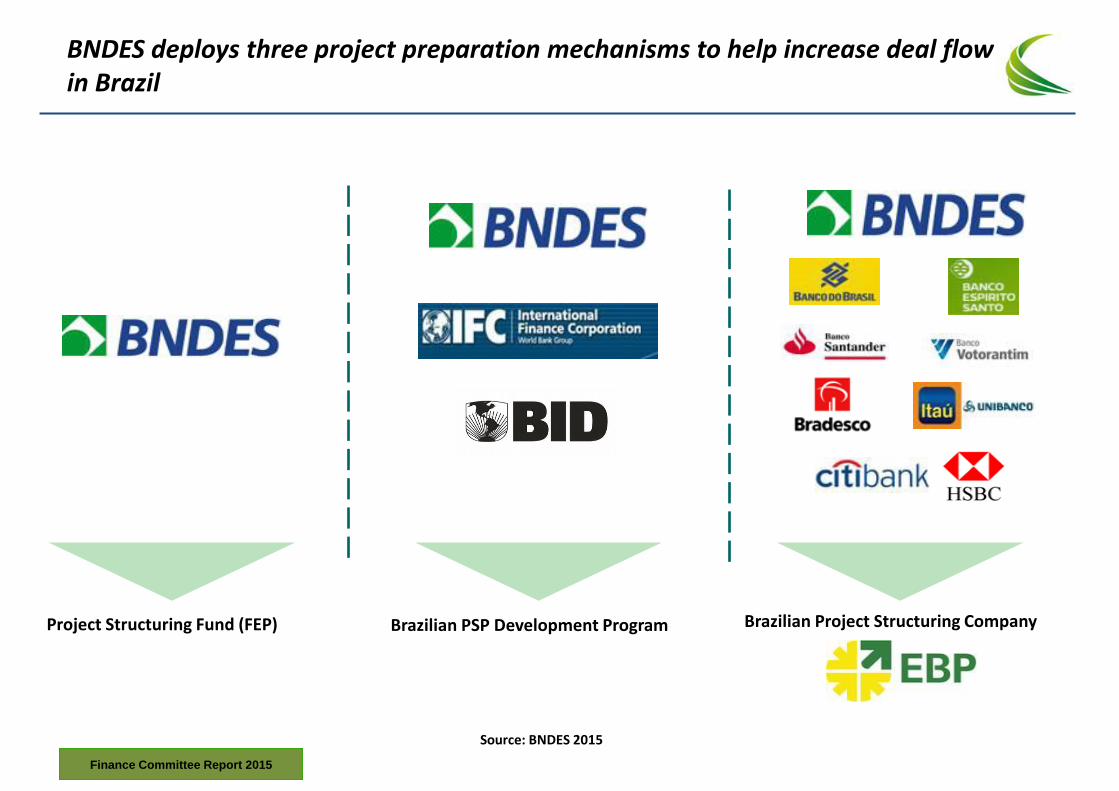
Mechanisms of Projects Structuring
Brazilian PSP Development Program Project Structuring Fund (FEP)
BNDES deploys three project preparation mechanisms to help increase deal flow in Brazil
Brazilian Project Structuring Company
Source: BNDES 2015
Finance Committee Report 2015
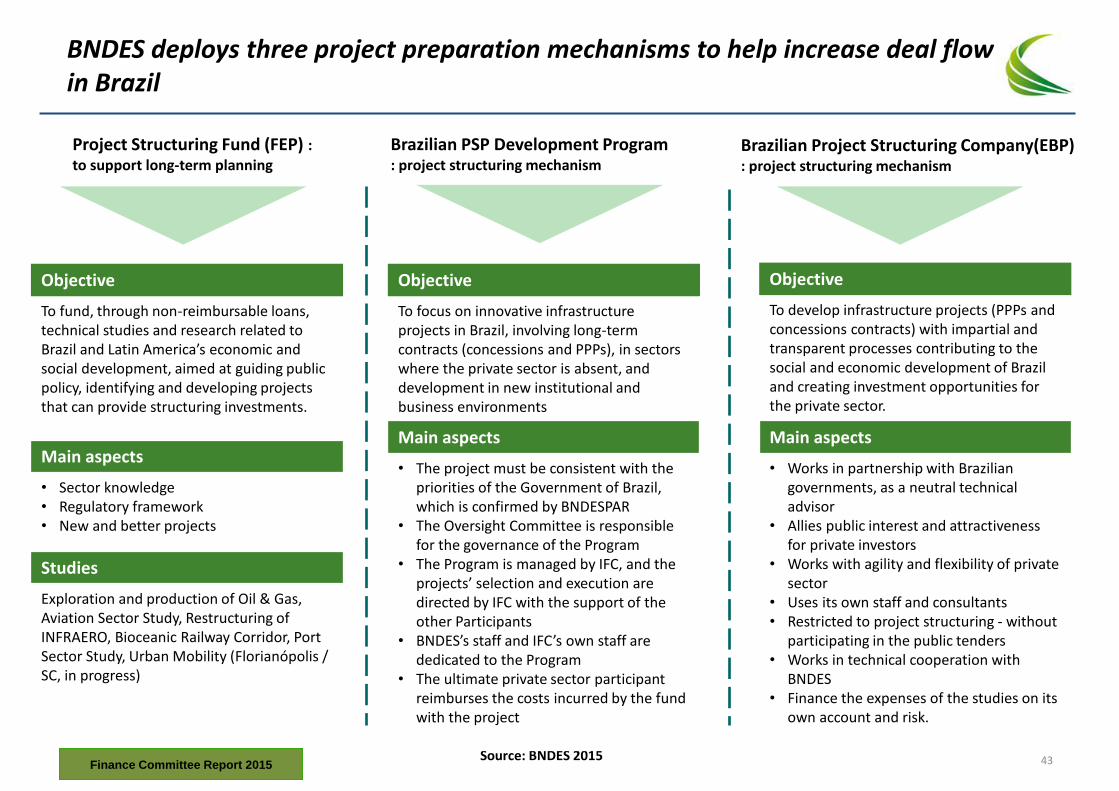
Mechanisms of Projects Structuring
Brazilian PSP Development Program : project structuring mechanism
Project Structuring Fund (FEP) : to support long-term planning
BNDES deploys three project preparation mechanisms to help increase deal flow in Brazil
Brazilian Project Structuring Company(EBP) : project structuring mechanism
Source: BNDES 2015 Finance Committee Report 2015
Objective
To fund, through non-reimbursable loans, technical studies and research related to Brazil and Latin America’s economic and social development, aimed at guiding public policy, identifying and developing projects that can provide structuring investments.
Main aspects
• Sector knowledge • Regulatory framework • New and better projects
Studies
Exploration and production of Oil & Gas, Aviation Sector Study, Restructuring of INFRAERO, Bioceanic Railway Corridor, Port Sector Study, Urban Mobility (Florianópolis / SC, in progress)
Objective
To develop infrastructure projects (PPPs and concessions contracts) with impartial and transparent processes contributing to the social and economic development of Brazil and creating investment opportunities for the private sector.
Main aspects
• Works in partnership with Brazilian governments, as a neutral technical advisor
• Allies public interest and attractiveness for private investors
• Works with agility and flexibility of private sector
• Uses its own staff and consultants • Restricted to project structuring - without
participating in the public tenders • Works in technical cooperation with
BNDES • Finance the expenses of the studies on its
own account and risk.
Objective
To focus on innovative infrastructure projects in Brazil, involving long-term contracts (concessions and PPPs), in sectors where the private sector is absent, and development in new institutional and business environments
Main aspects
• The project must be consistent with the priorities of the Government of Brazil, which is confirmed by BNDESPAR
• The Oversight Committee is responsible for the governance of the Program
• The Program is managed by IFC, and the projects’ selection and execution are directed by IFC with the support of the other Participants
• BNDES’s staff and IFC’s own staff are dedicated to the Program
• The ultimate private sector participant reimburses the costs incurred by the fund with the project
43
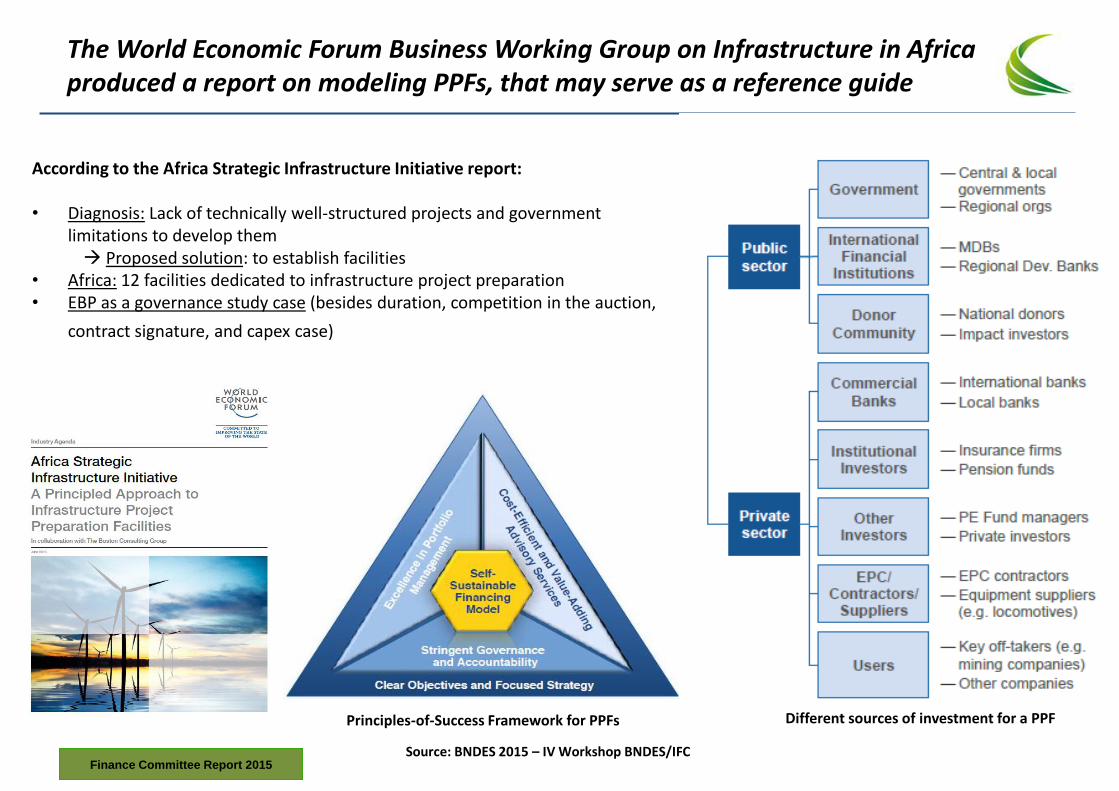
The World Economic Forum Business Working Group on Infrastructure in Africa produced a report on modeling PPFs, that may serve as a reference guide
According to the Africa Strategic Infrastructure Initiative report: • Diagnosis: Lack of technically well-structured projects and government
limitations to develop them Proposed solution: to establish facilities • Africa: 12 facilities dedicated to infrastructure project preparation • EBP as a governance study case (besides duration, competition in the auction,
contract signature, and capex case)
Source: BNDES 2015 – IV Workshop BNDES/IFC
Principles-of-Success Framework for PPFs
Finance Committee Report 2015
Different sources of investment for a PPF
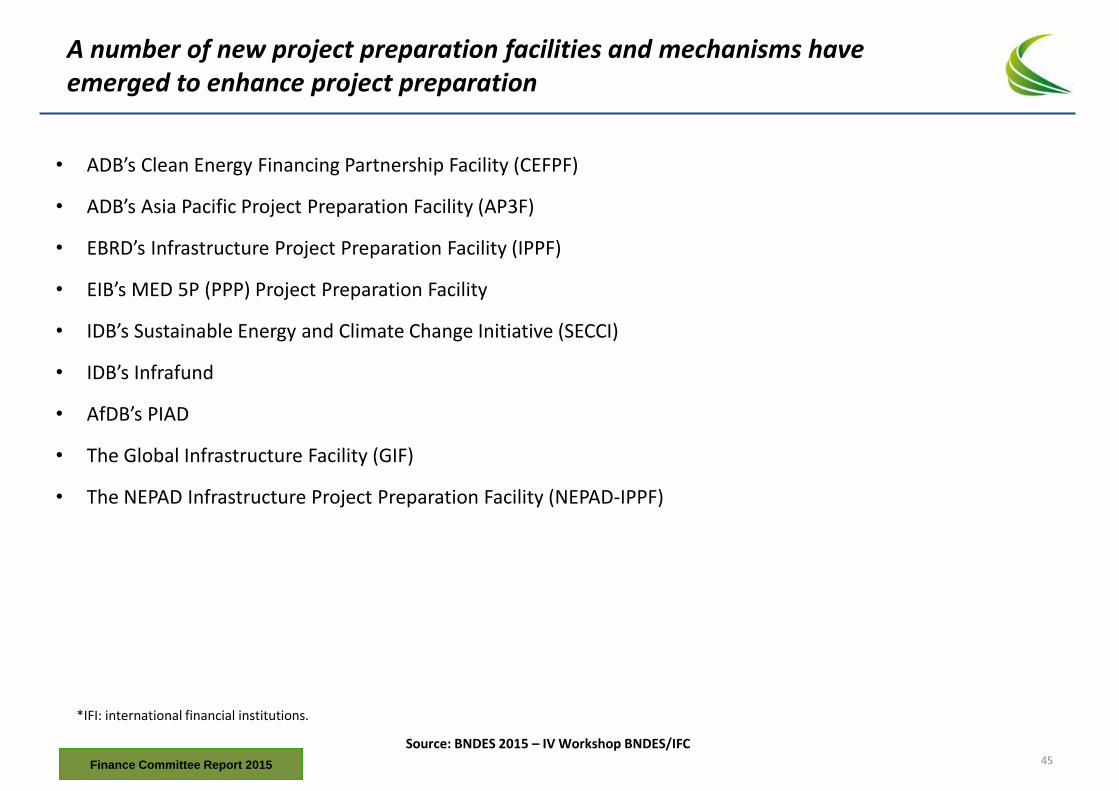
A number of new project preparation facilities and mechanisms have emerged to enhance project preparation
Source: BNDES 2015 – IV Workshop BNDES/IFC
*IFI: international financial institutions.
Finance Committee Report 2015
• ADB’s Clean Energy Financing Partnership Facility (CEFPF)
• ADB’s Asia Pacific Project Preparation Facility (AP3F)
• EBRD’s Infrastructure Project Preparation Facility (IPPF)
• EIB’s MED 5P (PPP) Project Preparation Facility
• IDB’s Sustainable Energy and Climate Change Initiative (SECCI)
• IDB’s Infrafund
• AfDB’s PIAD
• The Global Infrastructure Facility (GIF)
• The NEPAD Infrastructure Project Preparation Facility (NEPAD-IPPF)
45
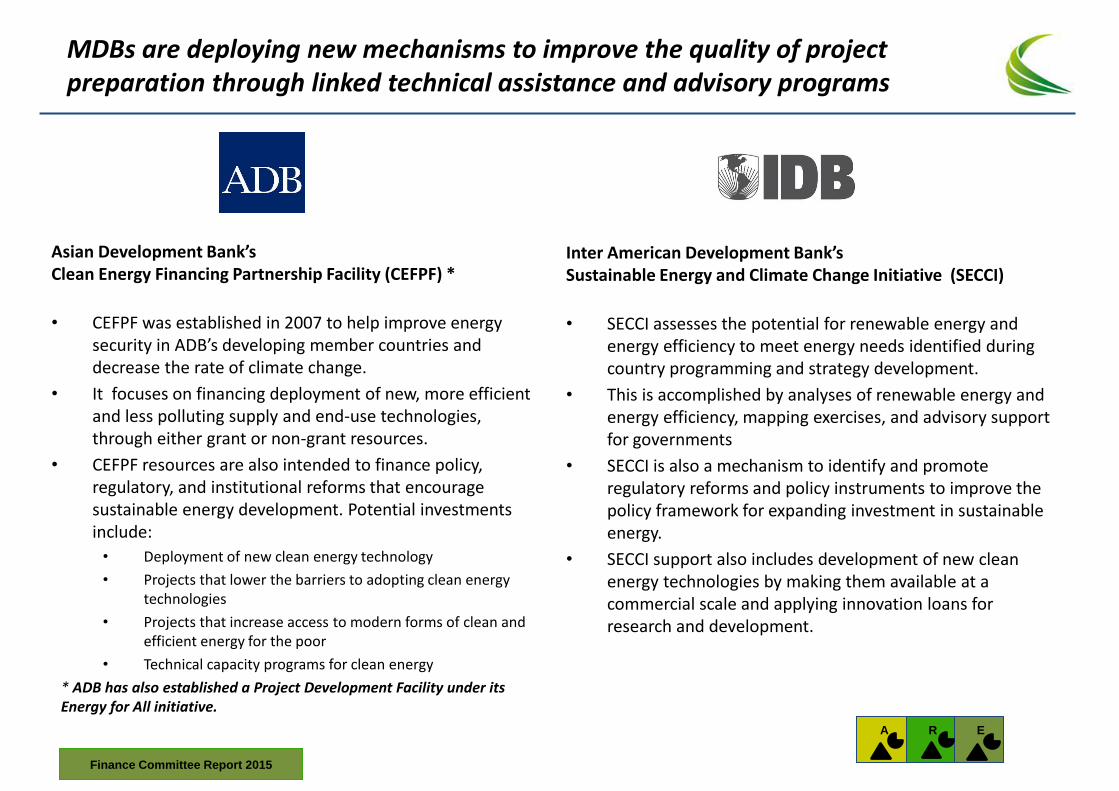
MDBs are deploying new mechanisms to improve the quality of project preparation through linked technical assistance and advisory programs
Asian Development Bank’s Clean Energy Financing Partnership Facility (CEFPF) *
• CEFPF was established in 2007 to help improve energy security in ADB’s developing member countries and decrease the rate of climate change.
• It focuses on financing deployment of new, more efficient and less polluting supply and end-use technologies, through either grant or non-grant resources.
• CEFPF resources are also intended to finance policy, regulatory, and institutional reforms that encourage sustainable energy development. Potential investments include:
• Deployment of new clean energy technology
• Projects that lower the barriers to adopting clean energy technologies
• Projects that increase access to modern forms of clean and efficient energy for the poor
• Technical capacity programs for clean energy
* ADB has also established a Project Development Facility under its Energy for All initiative.
Inter American Development Bank’s Sustainable Energy and Climate Change Initiative (SECCI)
• SECCI assesses the potential for renewable energy and energy efficiency to meet energy needs identified during country programming and strategy development.
• This is accomplished by analyses of renewable energy and energy efficiency, mapping exercises, and advisory support for governments
• SECCI is also a mechanism to identify and promote regulatory reforms and policy instruments to improve the policy framework for expanding investment in sustainable energy.
• SECCI support also includes development of new clean energy technologies by making them available at a commercial scale and applying innovation loans for research and development.
A
E
R
Finance Committee Report 2015
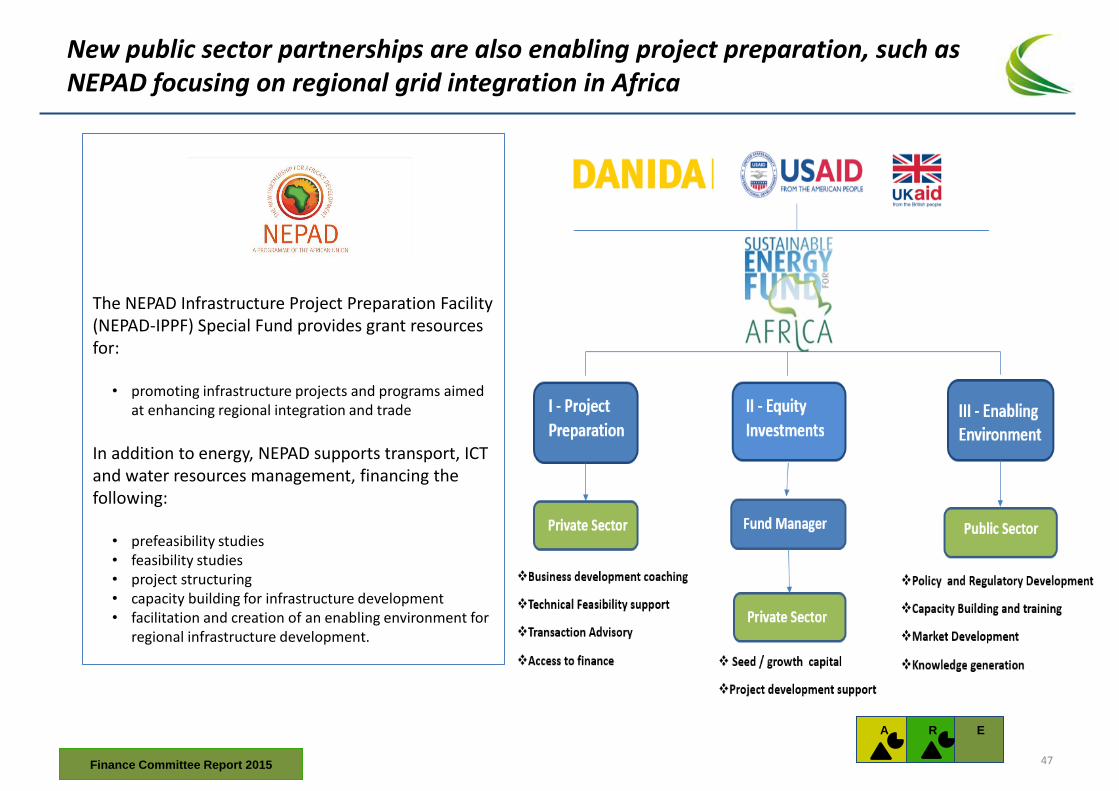
New public sector partnerships are also enabling project preparation, such as NEPAD focusing on regional grid integration in Africa
The NEPAD Infrastructure Project Preparation Facility (NEPAD-IPPF) Special Fund provides grant resources for:
• promoting infrastructure projects and programs aimed at enhancing regional integration and trade
In addition to energy, NEPAD supports transport, ICT and water resources management, financing the following:
• prefeasibility studies • feasibility studies • project structuring • capacity building for infrastructure development • facilitation and creation of an enabling environment for
regional infrastructure development.
A
E
R
Finance Committee Report 2015 47
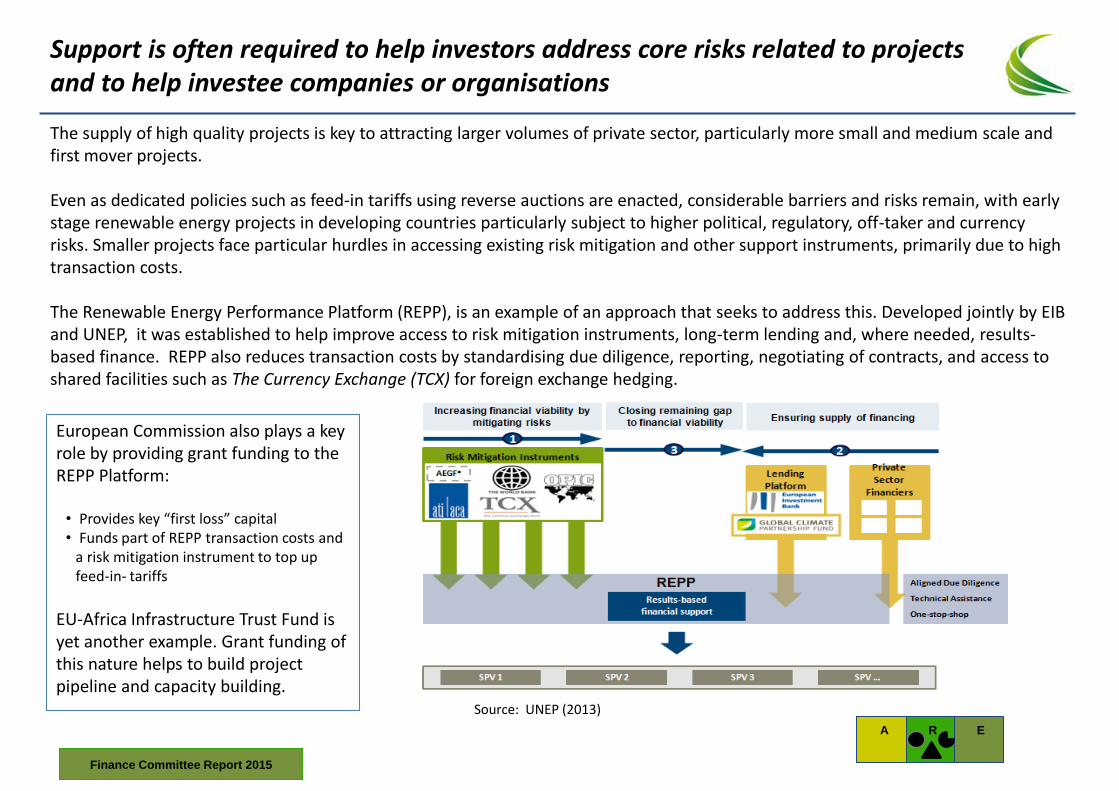
Support is often required to help investors address core risks related to projects and to help investee companies or organisations
The supply of high quality projects is key to attracting larger volumes of private sector, particularly more small and medium scale and first mover projects. Even as dedicated policies such as feed-in tariffs using reverse auctions are enacted, considerable barriers and risks remain, with early stage renewable energy projects in developing countries particularly subject to higher political, regulatory, off-taker and currency risks. Smaller projects face particular hurdles in accessing existing risk mitigation and other support instruments, primarily due to high transaction costs. The Renewable Energy Performance Platform (REPP), is an example of an approach that seeks to address this. Developed jointly by EIB and UNEP, it was established to help improve access to risk mitigation instruments, long-term lending and, where needed, results-based finance. REPP also reduces transaction costs by standardising due diligence, reporting, negotiating of contracts, and access to shared facilities such as The Currency Exchange (TCX) for foreign exchange hedging.
Source: UNEP (2013)
European Commission also plays a key role by providing grant funding to the REPP Platform:
• Provides key “first loss” capital • Funds part of REPP transaction costs and
a risk mitigation instrument to top up feed-in- tariffs
EU-Africa Infrastructure Trust Fund is yet another example. Grant funding of this nature helps to build project pipeline and capacity building.
A
E
R
Finance Committee Report 2015
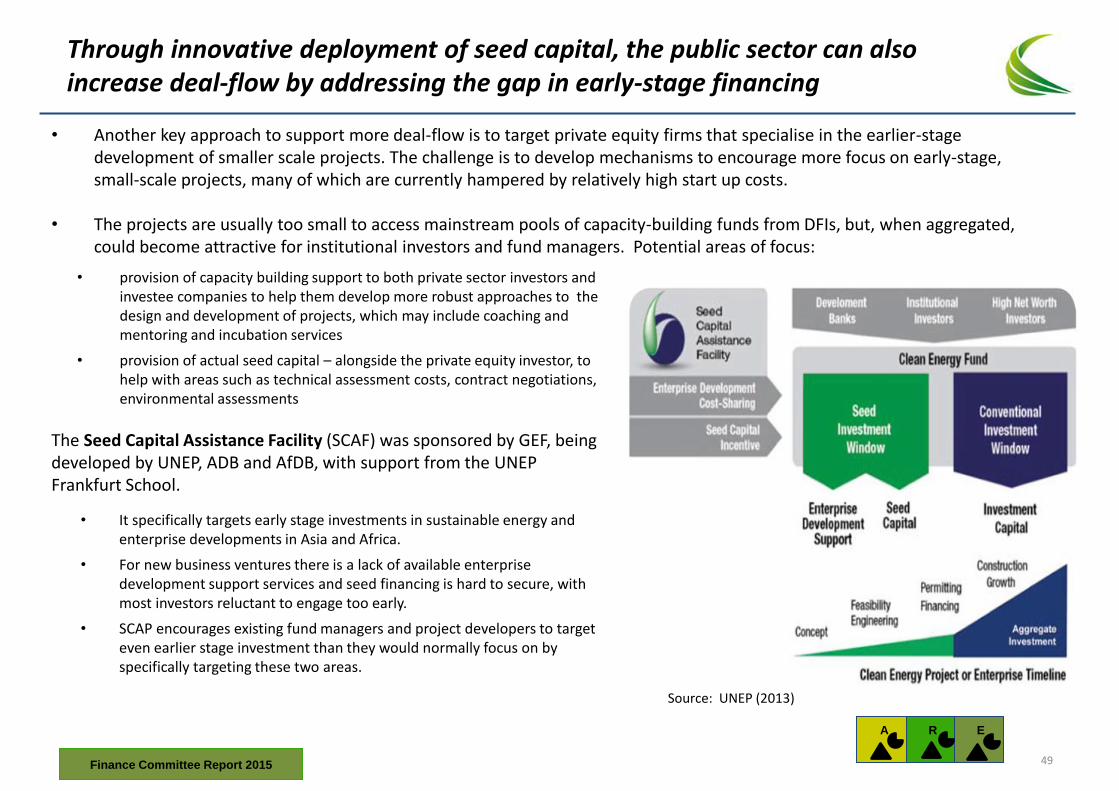
Through innovative deployment of seed capital, the public sector can also increase deal-flow by addressing the gap in early-stage financing
• Another key approach to support more deal-flow is to target private equity firms that specialise in the earlier-stage development of smaller scale projects. The challenge is to develop mechanisms to encourage more focus on early-stage, small-scale projects, many of which are currently hampered by relatively high start up costs.
• The projects are usually too small to access mainstream pools of capacity-building funds from DFIs, but, when aggregated, could become attractive for institutional investors and fund managers. Potential areas of focus:
• provision of capacity building support to both private sector investors and
investee companies to help them develop more robust approaches to the design and development of projects, which may include coaching and mentoring and incubation services
• provision of actual seed capital – alongside the private equity investor, to help with areas such as technical assessment costs, contract negotiations, environmental assessments
The Seed Capital Assistance Facility (SCAF) was sponsored by GEF, being developed by UNEP, ADB and AfDB, with support from the UNEP Frankfurt School.
• It specifically targets early stage investments in sustainable energy and enterprise developments in Asia and Africa.
• For new business ventures there is a lack of available enterprise development support services and seed financing is hard to secure, with most investors reluctant to engage too early.
• SCAP encourages existing fund managers and project developers to target even earlier stage investment than they would normally focus on by specifically targeting these two areas.
Source: UNEP (2013)
A
E
R
Finance Committee Report 2015 49
An improved environment for investors and a more rigorous approach to project preparation are key steps for mobilizing access to finance
• Section 2 has examined the emerging best practices for project preparation activities and begun to explore issues of risk allocation and mitigation that increase the likelihood that project finance will be secured.
• In addition, another key challenges in developing countries is that of unsolicited project proposals. The scarcity of commitment and capacity to fund and run project preparation facilities, is particularly exposed when projects are not sourced from more established channels. This can lead to projects being developed on a more ad hoc basis, which may then lead them to struggle to attract funding from lenders wary of integrity issues and corruption risks.
• However, while the capacity of countries or individual sectors of their economies to foster new projects is a fundamental pre-requisite for progress, so is the existence of flexible pools of investment capital, within the country, the region or globally.
• Here, it is clear that given the sheer scale of the financing challenge, new, or expanded finance mechanisms are needed to increase capital flow from international and domestic sources in order to meet the size of the investment gap and domestic access to capital constraints identified in Section 1.
• These mechanisms need to focus on risk reduction and risk sharing, and require a significant increase in public/private coordination in the coming years.
• The topic of expanding the sources of capital available for investment into the three objectives of SE4All and expanding the array of financial instruments used to help de-risk investment opportunities for different investors is tackled in the next section.
Finance Committee Report 2015
SECTION 3. Sources of Capital and Financing Instruments
Finance Committee Report 2015 51
Introduction to Sources of Capital and Financing Instruments
This section focuses on identifying sources of primarily fixed income capital for energy investment and financing instruments, and on structures that might help accelerate the growth of investment into the opportunities identified in Section 1, catalysed by the best practices in project preparation identified in Section 2. It is divided into two main parts:
• Risks and Investors – we review investors’ perceptions of risks and identify most likely pools of new investment into SE4All-related energy themes. Our focus is primarily on OECD-based investor capacity who have interest in investing in both developed and developing countries. However, we also examine pools of capital within developing countries, but which are not currently targeting sustainable energy infrastructure.
• Themes – we identify four investment themes:
– growth and evolution of “Green Bond” markets
– recognition of the need for large scale public-private partnerships to drive investment volume in developing countries as well as in OECD economies.
– development of new private sector insurance initiatives, and
– innovation around aggregation models to help diversify risks and attract larger scale investors to small-scale projects in energy access, renewable energy and energy efficiency
Within each of these themes, we identify de-risking structures and products that have the most potential for rapid growth, with an emphasis on those mechanisms that might encourage international investors to target emerging market opportunities. We will focus on highlighting examples of what currently exists and what needs to happen if we are to drive the growth needed to deliver SE4All objectives.
• Additional considerations taken into account include:
– coverage of opportunities across the three objectives of SE4All but, as identified in Section 1, the largest-scale, near-term opportunities are predominantly in renewable energy.
– while Energy Access is the smallest financing need in Section 1, it is hardest to catalyse but has strongest development impact.
– this is not intended to be an exhaustive analysis, but an opportunity to shine a light on some key areas that show significant potential.
Finance Committee Report 2015
Risks and Investors: Identifying New Pools of Capital
Finance Committee Report 2015 53
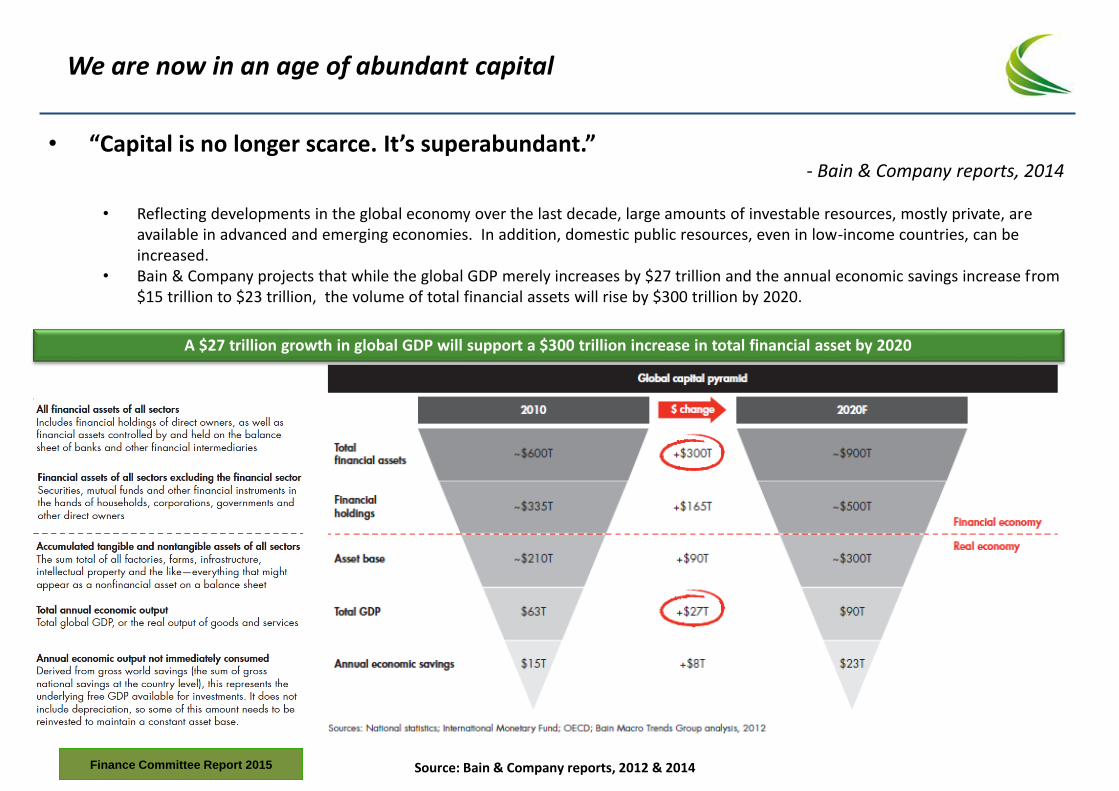
We are now in an age of abundant capital
• “Capital is no longer scarce. It’s superabundant.” - Bain & Company reports, 2014
• Reflecting developments in the global economy over the last decade, large amounts of investable resources, mostly private, are
available in advanced and emerging economies. In addition, domestic public resources, even in low-income countries, can be increased.
• Bain & Company projects that while the global GDP merely increases by $27 trillion and the annual economic savings increase from $15 trillion to $23 trillion, the volume of total financial assets will rise by $300 trillion by 2020.
A $27 trillion growth in global GDP will support a $300 trillion increase in total financial asset by 2020
Finance Committee Report 2015 Source: Bain & Company reports, 2012 & 2014
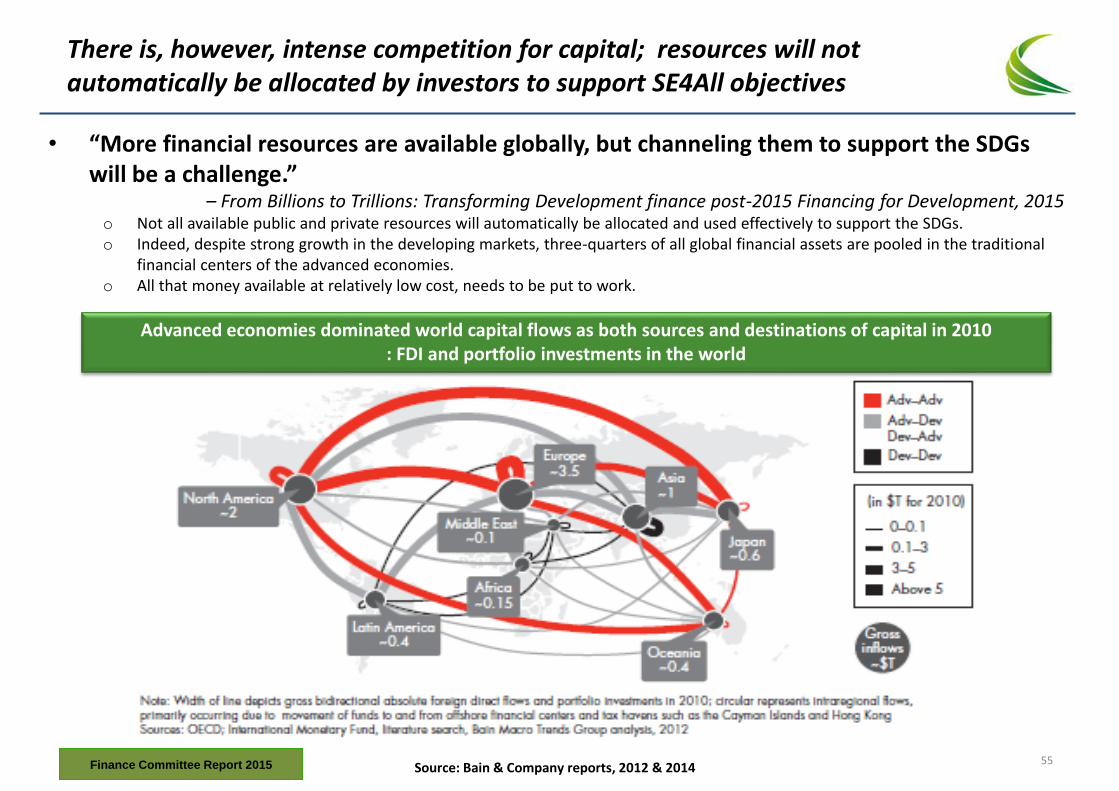
There is, however, intense competition for capital; resources will not automatically be allocated by investors to support SE4All objectives
• “More financial resources are available globally, but channeling them to support the SDGs will be a challenge.”
– From Billions to Trillions: Transforming Development finance post-2015 Financing for Development, 2015 o Not all available public and private resources will automatically be allocated and used effectively to support the SDGs. o Indeed, despite strong growth in the developing markets, three-quarters of all global financial assets are pooled in the traditional
financial centers of the advanced economies. o All that money available at relatively low cost, needs to be put to work.
Advanced economies dominated world capital flows as both sources and destinations of capital in 2010 : FDI and portfolio investments in the world
Finance Committee Report 2015 Source: Bain & Company reports, 2012 & 2014 55
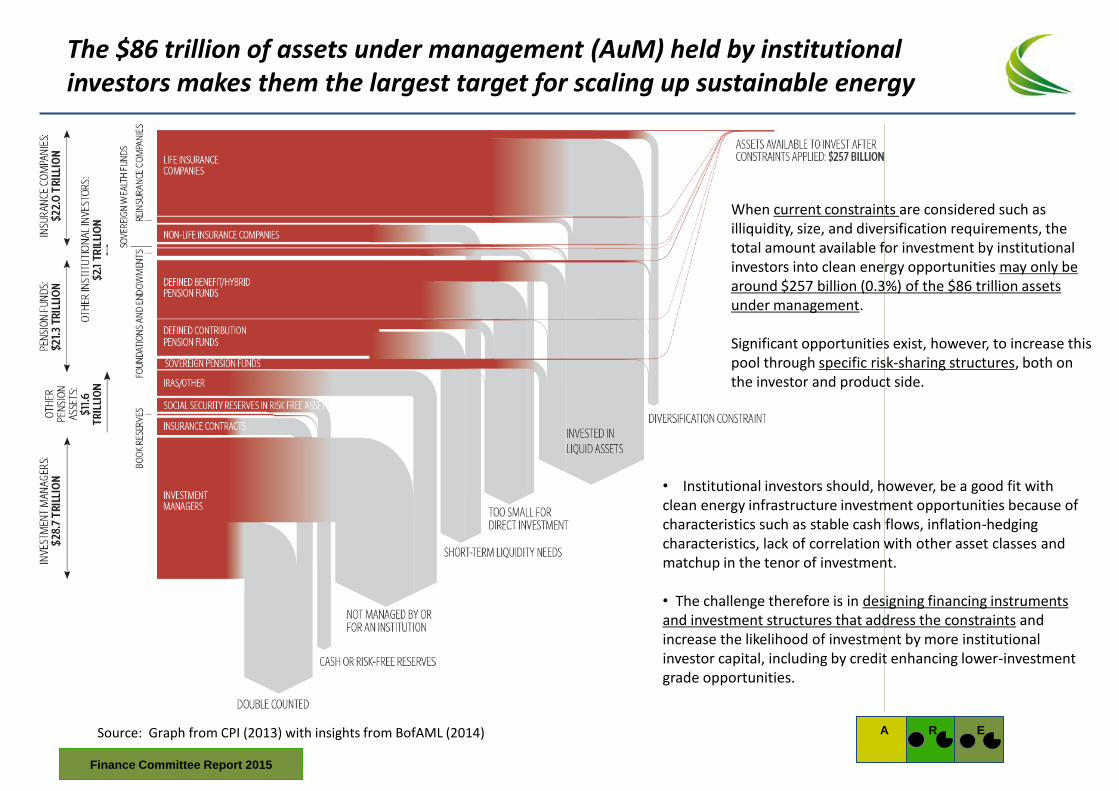
The $86 trillion of assets under management (AuM) held by institutional investors makes them the largest target for scaling up sustainable energy
Source: Graph from CPI (2013) with insights from BofAML (2014)
• Institutional investors should, however, be a good fit with clean energy infrastructure investment opportunities because of characteristics such as stable cash flows, inflation-hedging characteristics, lack of correlation with other asset classes and matchup in the tenor of investment.
• The challenge therefore is in designing financing instruments and investment structures that address the constraints and increase the likelihood of investment by more institutional investor capital, including by credit enhancing lower-investment grade opportunities.
A
E
R
When current constraints are considered such as illiquidity, size, and diversification requirements, the total amount available for investment by institutional investors into clean energy opportunities may only be around $257 billion (0.3%) of the $86 trillion assets under management. Significant opportunities exist, however, to increase this pool through specific risk-sharing structures, both on the investor and product side.
Finance Committee Report 2015
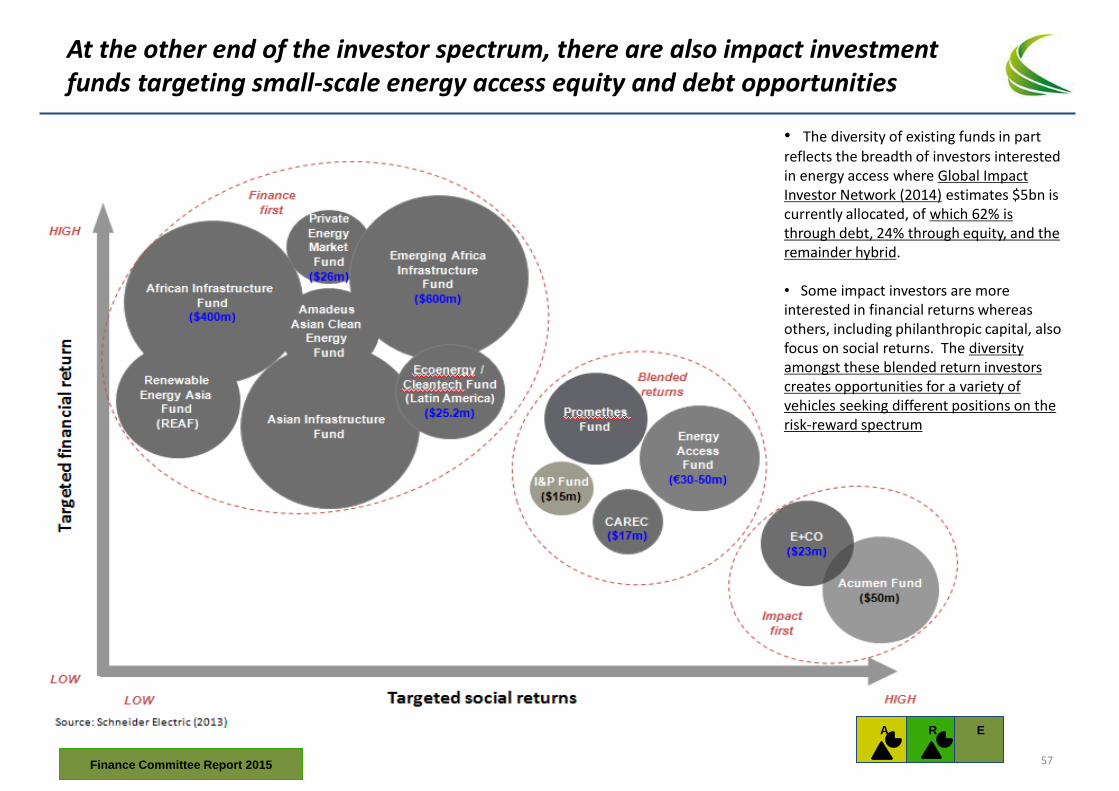
• The diversity of existing funds in part reflects the breadth of investors interested in energy access where Global Impact Investor Network (2014) estimates $5bn is currently allocated, of which 62% is through debt, 24% through equity, and the remainder hybrid.
• Some impact investors are more interested in financial returns whereas others, including philanthropic capital, also focus on social returns. The diversity amongst these blended return investors creates opportunities for a variety of vehicles seeking different positions on the risk-reward spectrum
At the other end of the investor spectrum, there are also impact investment funds targeting small-scale energy access equity and debt opportunities
A
E
R
Finance Committee Report 2015 57
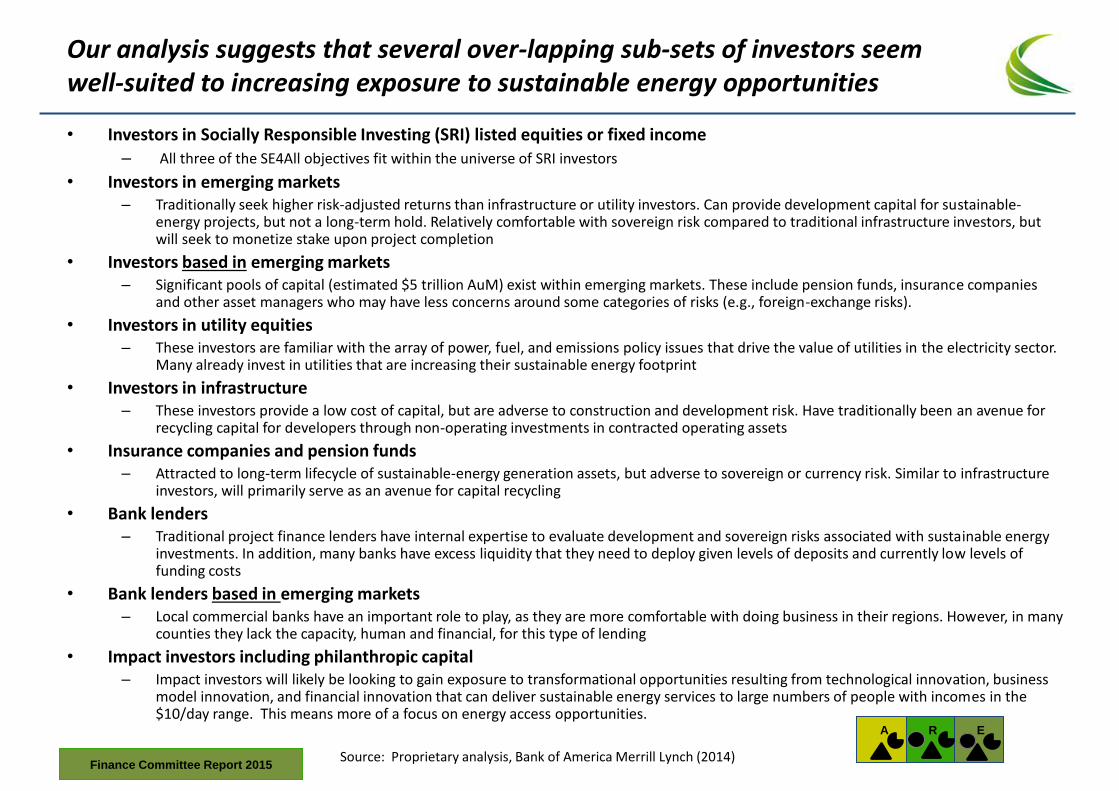
Our analysis suggests that several over-lapping sub-sets of investors seem well-suited to increasing exposure to sustainable energy opportunities
• Investors in Socially Responsible Investing (SRI) listed equities or fixed income – All three of the SE4All objectives fit within the universe of SRI investors
• Investors in emerging markets – Traditionally seek higher risk-adjusted returns than infrastructure or utility investors. Can provide development capital for sustainable-
energy projects, but not a long-term hold. Relatively comfortable with sovereign risk compared to traditional infrastructure investors, but will seek to monetize stake upon project completion
• Investors based in emerging markets – Significant pools of capital (estimated $5 trillion AuM) exist within emerging markets. These include pension funds, insurance companies
and other asset managers who may have less concerns around some categories of risks (e.g., foreign-exchange risks).
• Investors in utility equities – These investors are familiar with the array of power, fuel, and emissions policy issues that drive the value of utilities in the electricity sector.
Many already invest in utilities that are increasing their sustainable energy footprint
• Investors in infrastructure – These investors provide a low cost of capital, but are adverse to construction and development risk. Have traditionally been an avenue for
recycling capital for developers through non-operating investments in contracted operating assets
• Insurance companies and pension funds – Attracted to long-term lifecycle of sustainable-energy generation assets, but adverse to sovereign or currency risk. Similar to infrastructure
investors, will primarily serve as an avenue for capital recycling
• Bank lenders – Traditional project finance lenders have internal expertise to evaluate development and sovereign risks associated with sustainable energy
investments. In addition, many banks have excess liquidity that they need to deploy given levels of deposits and currently low levels of funding costs
• Bank lenders based in emerging markets – Local commercial banks have an important role to play, as they are more comfortable with doing business in their regions. However, in many
counties they lack the capacity, human and financial, for this type of lending
• Impact investors including philanthropic capital – Impact investors will likely be looking to gain exposure to transformational opportunities resulting from technological innovation, business
model innovation, and financial innovation that can deliver sustainable energy services to large numbers of people with incomes in the $10/day range. This means more of a focus on energy access opportunities.
Source: Proprietary analysis, Bank of America Merrill Lynch (2014)
A
E
R
Finance Committee Report 2015
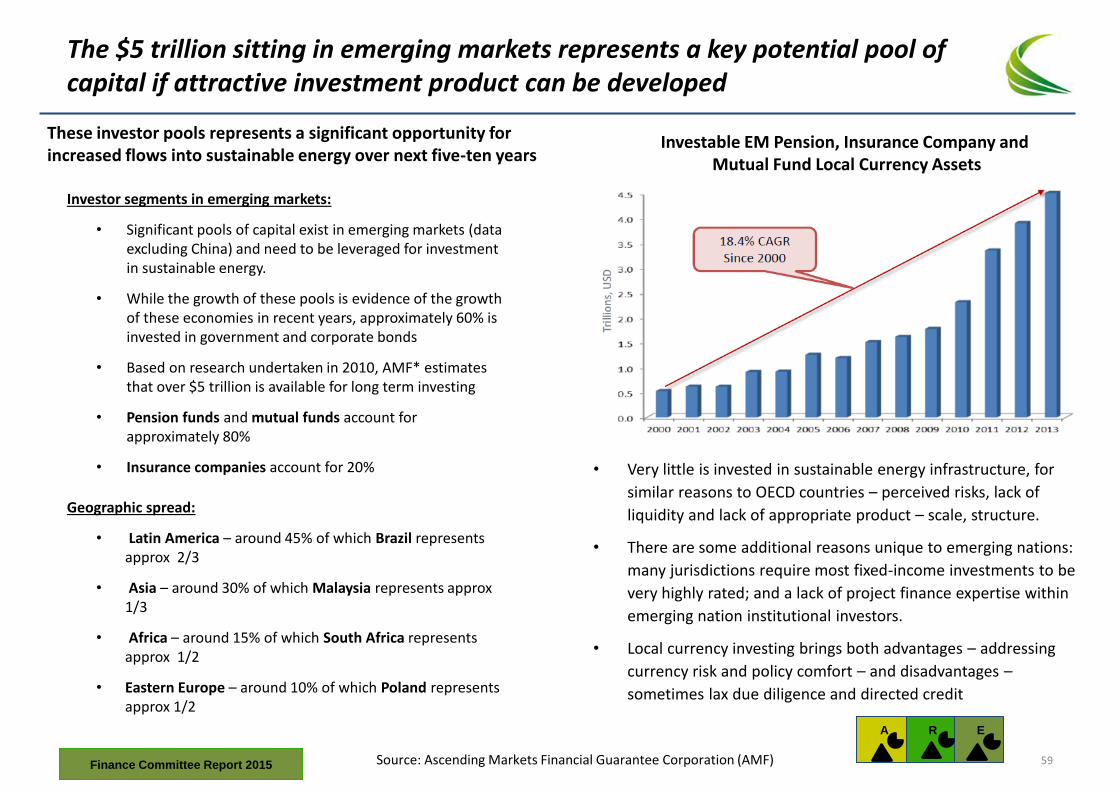
The $5 trillion sitting in emerging markets represents a key potential pool of capital if attractive investment product can be developed
Investor segments in emerging markets:
• Significant pools of capital exist in emerging markets (data excluding China) and need to be leveraged for investment in sustainable energy.
• While the growth of these pools is evidence of the growth of these economies in recent years, approximately 60% is invested in government and corporate bonds
• Based on research undertaken in 2010, AMF* estimates that over $5 trillion is available for long term investing
• Pension funds and mutual funds account for approximately 80%
• Insurance companies account for 20%
Geographic spread:
• Latin America – around 45% of which Brazil represents approx 2/3
• Asia – around 30% of which Malaysia represents approx 1/3
• Africa – around 15% of which South Africa represents approx 1/2
• Eastern Europe – around 10% of which Poland represents approx 1/2
Investable EM Pension, Insurance Company and Mutual Fund Local Currency Assets
Source: Ascending Markets Financial Guarantee Corporation (AMF)
• Very little is invested in sustainable energy infrastructure, for
similar reasons to OECD countries – perceived risks, lack of
liquidity and lack of appropriate product – scale, structure.
• There are some additional reasons unique to emerging nations:
many jurisdictions require most fixed-income investments to be
very highly rated; and a lack of project finance expertise within
emerging nation institutional investors.
• Local currency investing brings both advantages – addressing
currency risk and policy comfort – and disadvantages –
sometimes lax due diligence and directed credit
A
E
R
These investor pools represents a significant opportunity for increased flows into sustainable energy over next five-ten years
Finance Committee Report 2015 59
Risks and Investors: Prioritising Risks and Structures
Finance Committee Report 2015
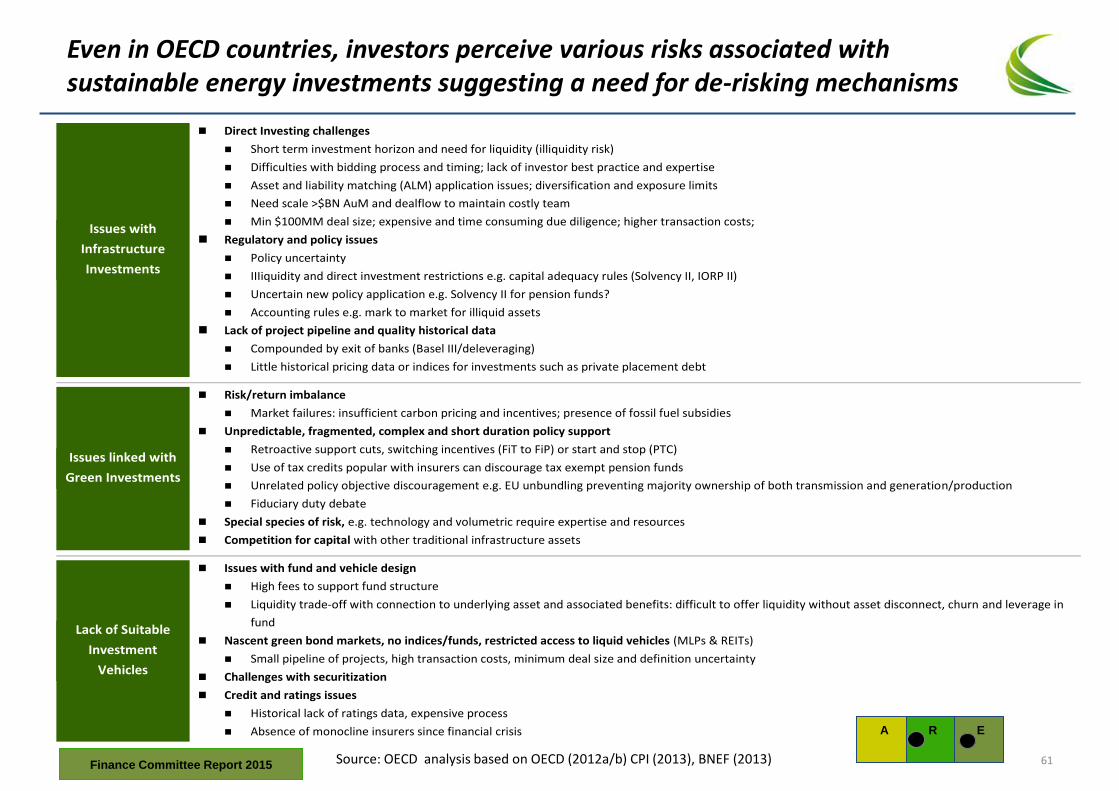
Even in OECD countries, investors perceive various risks associated with sustainable energy investments suggesting a need for de-risking mechanisms
Source: OECD analysis based on OECD (2012a/b) CPI (2013), BNEF (2013)
Issues with
Infrastructure
Investments
Direct Investing challenges
Short term investment horizon and need for liquidity (illiquidity risk)
Difficulties with bidding process and timing; lack of investor best practice and expertise
Asset and liability matching (ALM) application issues; diversification and exposure limits
Need scale >$BN AuM and dealflow to maintain costly team
Min $100MM deal size; expensive and time consuming due diligence; higher transaction costs;
Regulatory and policy issues
Policy uncertainty
IIIiquidity and direct investment restrictions e.g. capital adequacy rules (Solvency II, IORP II)
Uncertain new policy application e.g. Solvency II for pension funds?
Accounting rules e.g. mark to market for illiquid assets
Lack of project pipeline and quality historical data
Compounded by exit of banks (Basel III/deleveraging)
Little historical pricing data or indices for investments such as private placement debt
Issues linked with
Green Investments
Risk/return imbalance
Market failures: insufficient carbon pricing and incentives; presence of fossil fuel subsidies
Unpredictable, fragmented, complex and short duration policy support
Retroactive support cuts, switching incentives (FiT to FiP) or start and stop (PTC)
Use of tax credits popular with insurers can discourage tax exempt pension funds
Unrelated policy objective discouragement e.g. EU unbundling preventing majority ownership of both transmission and generation/production
Fiduciary duty debate
Special species of risk, e.g. technology and volumetric require expertise and resources
Competition for capital with other traditional infrastructure assets
Lack of Suitable
Investment
Vehicles
Issues with fund and vehicle design
High fees to support fund structure
Liquidity trade-off with connection to underlying asset and associated benefits: difficult to offer liquidity without asset disconnect, churn and leverage in
fund
Nascent green bond markets, no indices/funds, restricted access to liquid vehicles (MLPs & REITs)
Small pipeline of projects, high transaction costs, minimum deal size and definition uncertainty
Challenges with securitization
Credit and ratings issues
Historical lack of ratings data, expensive process
Absence of monocline insurers since financial crisis
A
E
R
Finance Committee Report 2015 61
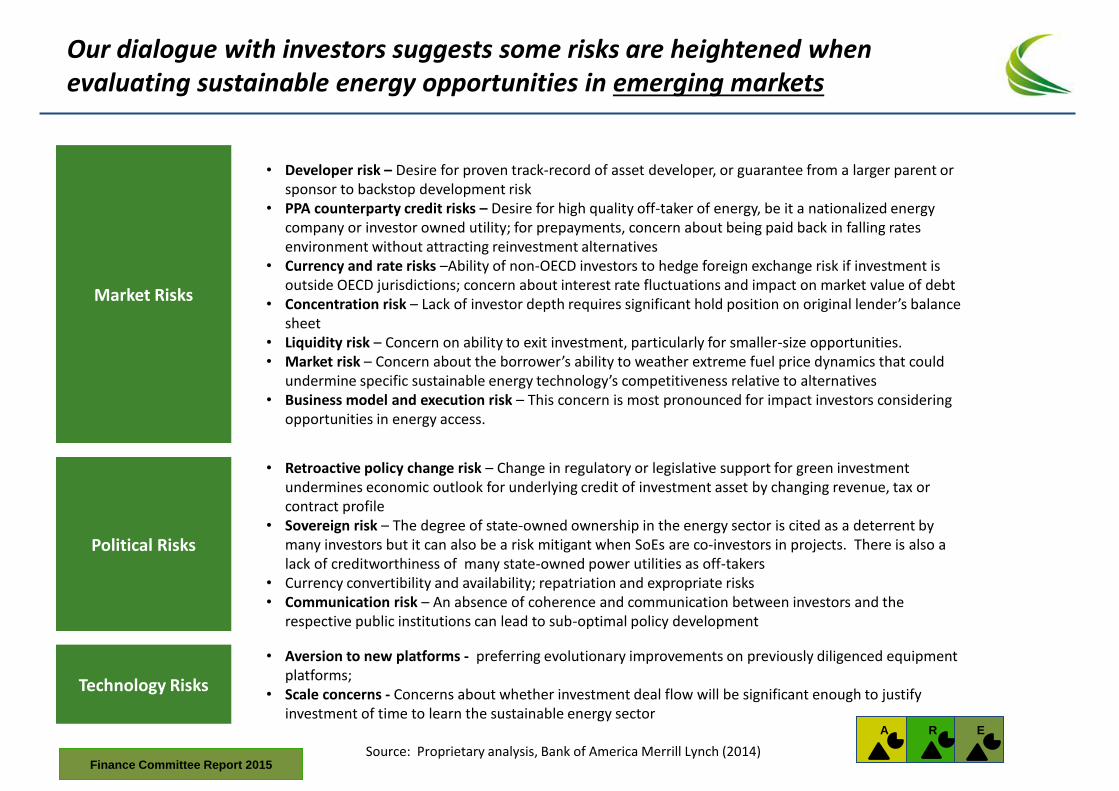
Our dialogue with investors suggests some risks are heightened when evaluating sustainable energy opportunities in emerging markets
Source: Proprietary analysis, Bank of America Merrill Lynch (2014)
Market Risks
• Developer risk – Desire for proven track-record of asset developer, or guarantee from a larger parent or sponsor to backstop development risk
• PPA counterparty credit risks – Desire for high quality off-taker of energy, be it a nationalized energy company or investor owned utility; for prepayments, concern about being paid back in falling rates environment without attracting reinvestment alternatives
• Currency and rate risks –Ability of non-OECD investors to hedge foreign exchange risk if investment is outside OECD jurisdictions; concern about interest rate fluctuations and impact on market value of debt
• Concentration risk – Lack of investor depth requires significant hold position on original lender’s balance sheet
• Liquidity risk – Concern on ability to exit investment, particularly for smaller-size opportunities. • Market risk – Concern about the borrower’s ability to weather extreme fuel price dynamics that could
undermine specific sustainable energy technology’s competitiveness relative to alternatives • Business model and execution risk – This concern is most pronounced for impact investors considering
opportunities in energy access.
Political Risks
• Retroactive policy change risk – Change in regulatory or legislative support for green investment undermines economic outlook for underlying credit of investment asset by changing revenue, tax or contract profile
• Sovereign risk – The degree of state-owned ownership in the energy sector is cited as a deterrent by many investors but it can also be a risk mitigant when SoEs are co-investors in projects. There is also a lack of creditworthiness of many state-owned power utilities as off-takers
• Currency convertibility and availability; repatriation and expropriate risks • Communication risk – An absence of coherence and communication between investors and the
respective public institutions can lead to sub-optimal policy development
Technology Risks
• Aversion to new platforms - preferring evolutionary improvements on previously diligenced equipment platforms;
• Scale concerns - Concerns about whether investment deal flow will be significant enough to justify investment of time to learn the sustainable energy sector
A
E
R
Finance Committee Report 2015
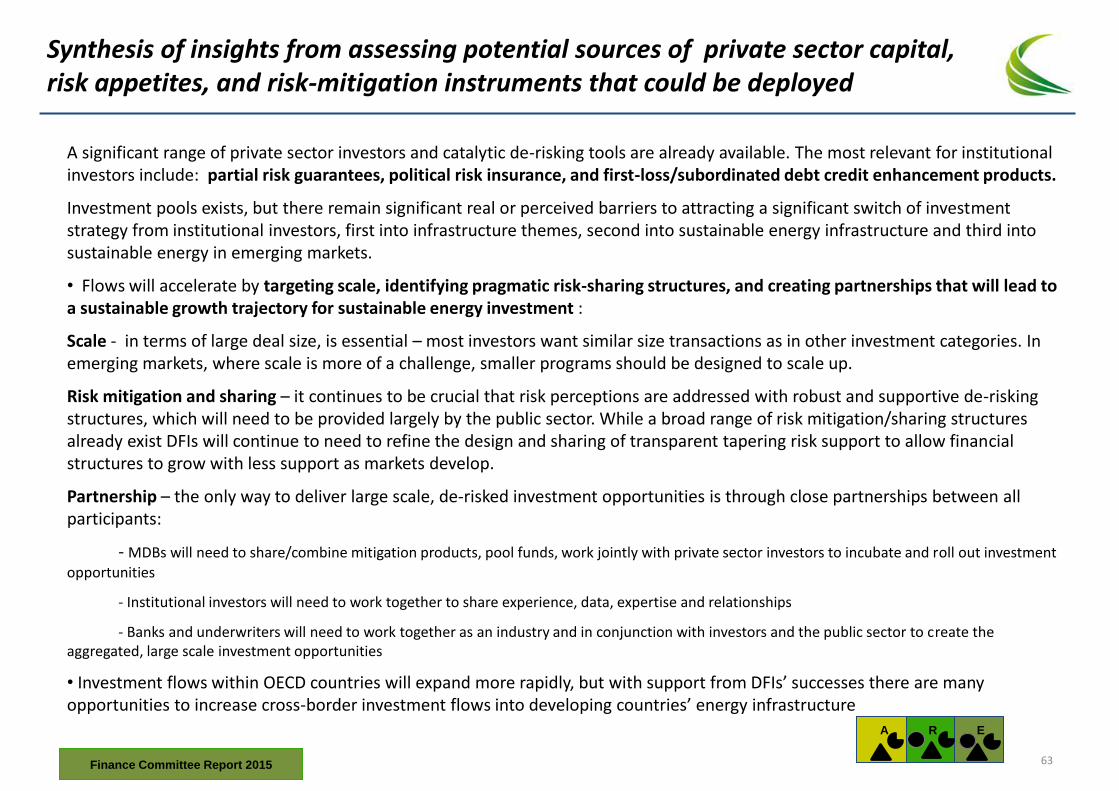
Synthesis of insights from assessing potential sources of private sector capital, risk appetites, and risk-mitigation instruments that could be deployed
A significant range of private sector investors and catalytic de-risking tools are already available. The most relevant for institutional investors include: partial risk guarantees, political risk insurance, and first-loss/subordinated debt credit enhancement products.
Investment pools exists, but there remain significant real or perceived barriers to attracting a significant switch of investment strategy from institutional investors, first into infrastructure themes, second into sustainable energy infrastructure and third into sustainable energy in emerging markets.
• Flows will accelerate by targeting scale, identifying pragmatic risk-sharing structures, and creating partnerships that will lead to a sustainable growth trajectory for sustainable energy investment :
Scale - in terms of large deal size, is essential – most investors want similar size transactions as in other investment categories. In emerging markets, where scale is more of a challenge, smaller programs should be designed to scale up.
Risk mitigation and sharing – it continues to be crucial that risk perceptions are addressed with robust and supportive de-risking structures, which will need to be provided largely by the public sector. While a broad range of risk mitigation/sharing structures already exist DFIs will continue to need to refine the design and sharing of transparent tapering risk support to allow financial structures to grow with less support as markets develop.
Partnership – the only way to deliver large scale, de-risked investment opportunities is through close partnerships between all participants:
- MDBs will need to share/combine mitigation products, pool funds, work jointly with private sector investors to incubate and roll out investment opportunities
- Institutional investors will need to work together to share experience, data, expertise and relationships
- Banks and underwriters will need to work together as an industry and in conjunction with investors and the public sector to create the aggregated, large scale investment opportunities
• Investment flows within OECD countries will expand more rapidly, but with support from DFIs’ successes there are many opportunities to increase cross-border investment flows into developing countries’ energy infrastructure
A
E
R
Finance Committee Report 2015 63
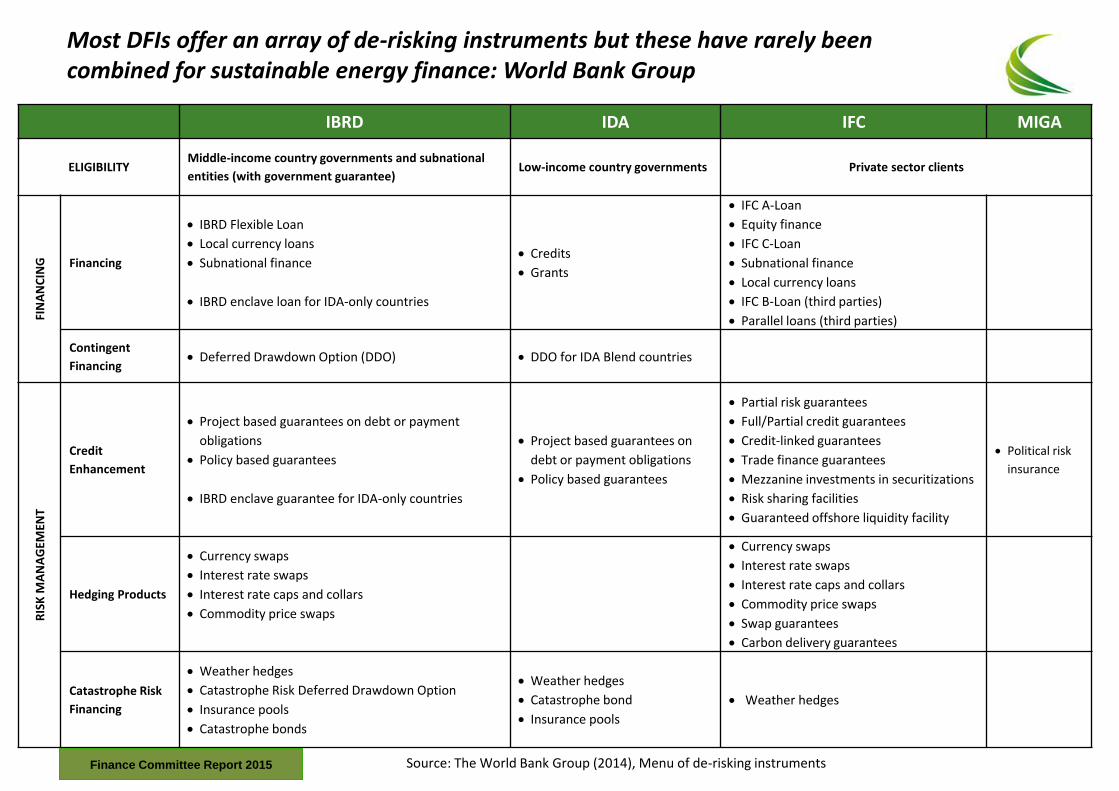
Most DFIs offer an array of de-risking instruments but these have rarely been combined for sustainable energy finance: World Bank Group
IBRD IDA IFC MIGA
ELIGIBILITY Middle-income country governments and subnational
entities (with government guarantee) Low-income country governments Private sector clients
FIN
AN
CIN
G
Financing
IBRD Flexible Loan
Local currency loans
Subnational finance
IBRD enclave loan for IDA-only countries
Credits
Grants
IFC A-Loan
Equity finance
IFC C-Loan
Subnational finance
Local currency loans
IFC B-Loan (third parties)
Parallel loans (third parties)
Contingent
Financing Deferred Drawdown Option (DDO) DDO for IDA Blend countries
RIS
K M
AN
AG
EMEN
T
Credit
Enhancement
Project based guarantees on debt or payment
obligations
Policy based guarantees
IBRD enclave guarantee for IDA-only countries
Project based guarantees on
debt or payment obligations
Policy based guarantees
Partial risk guarantees
Full/Partial credit guarantees
Credit-linked guarantees
Trade finance guarantees
Mezzanine investments in securitizations
Risk sharing facilities
Guaranteed offshore liquidity facility
Political risk
insurance
Hedging Products
Currency swaps
Interest rate swaps
Interest rate caps and collars
Commodity price swaps
Currency swaps
Interest rate swaps
Interest rate caps and collars
Commodity price swaps
Swap guarantees
Carbon delivery guarantees
Catastrophe Risk
Financing
Weather hedges
Catastrophe Risk Deferred Drawdown Option
Insurance pools
Catastrophe bonds
Weather hedges
Catastrophe bond
Insurance pools
Weather hedges
Source: The World Bank Group (2014), Menu of de-risking instruments Finance Committee Report 2015
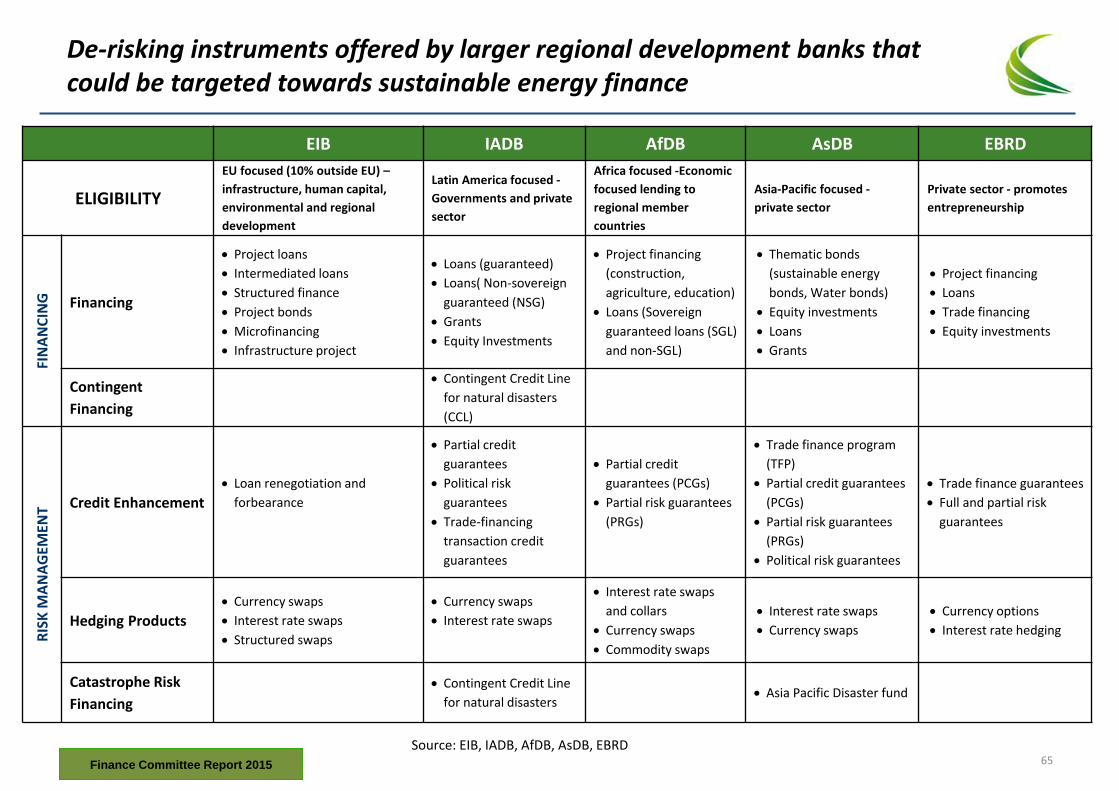
De-risking instruments offered by larger regional development banks that could be targeted towards sustainable energy finance
EIB IADB AfDB AsDB EBRD
ELIGIBILITY
EU focused (10% outside EU) –
infrastructure, human capital,
environmental and regional
development
Latin America focused -
Governments and private
sector
Africa focused -Economic
focused lending to
regional member
countries
Asia-Pacific focused -
private sector
Private sector - promotes
entrepreneurship
FIN
AN
CIN
G
Financing
Project loans
Intermediated loans
Structured finance
Project bonds
Microfinancing
Infrastructure project
Loans (guaranteed)
Loans( Non-sovereign
guaranteed (NSG)
Grants
Equity Investments
Project financing
(construction,
agriculture, education)
Loans (Sovereign
guaranteed loans (SGL)
and non-SGL)
Thematic bonds
(sustainable energy
bonds, Water bonds)
Equity investments
Loans
Grants
Project financing
Loans
Trade financing
Equity investments
Contingent
Financing
Contingent Credit Line
for natural disasters
(CCL)
RIS
K M
AN
AG
EMEN
T Credit Enhancement
Loan renegotiation and
forbearance
Partial credit
guarantees
Political risk
guarantees
Trade-financing
transaction credit
guarantees
Partial credit
guarantees (PCGs)
Partial risk guarantees
(PRGs)
Trade finance program
(TFP)
Partial credit guarantees
(PCGs)
Partial risk guarantees
(PRGs)
Political risk guarantees
Trade finance guarantees
Full and partial risk
guarantees
Hedging Products
Currency swaps
Interest rate swaps
Structured swaps
Currency swaps
Interest rate swaps
Interest rate swaps
and collars
Currency swaps
Commodity swaps
Interest rate swaps
Currency swaps
Currency options
Interest rate hedging
Catastrophe Risk
Financing
Contingent Credit Line
for natural disasters Asia Pacific Disaster fund
Source: EIB, IADB, AfDB, AsDB, EBRD
Finance Committee Report 2015 65
Thematic Areas: Overview
Finance Committee Report 2015
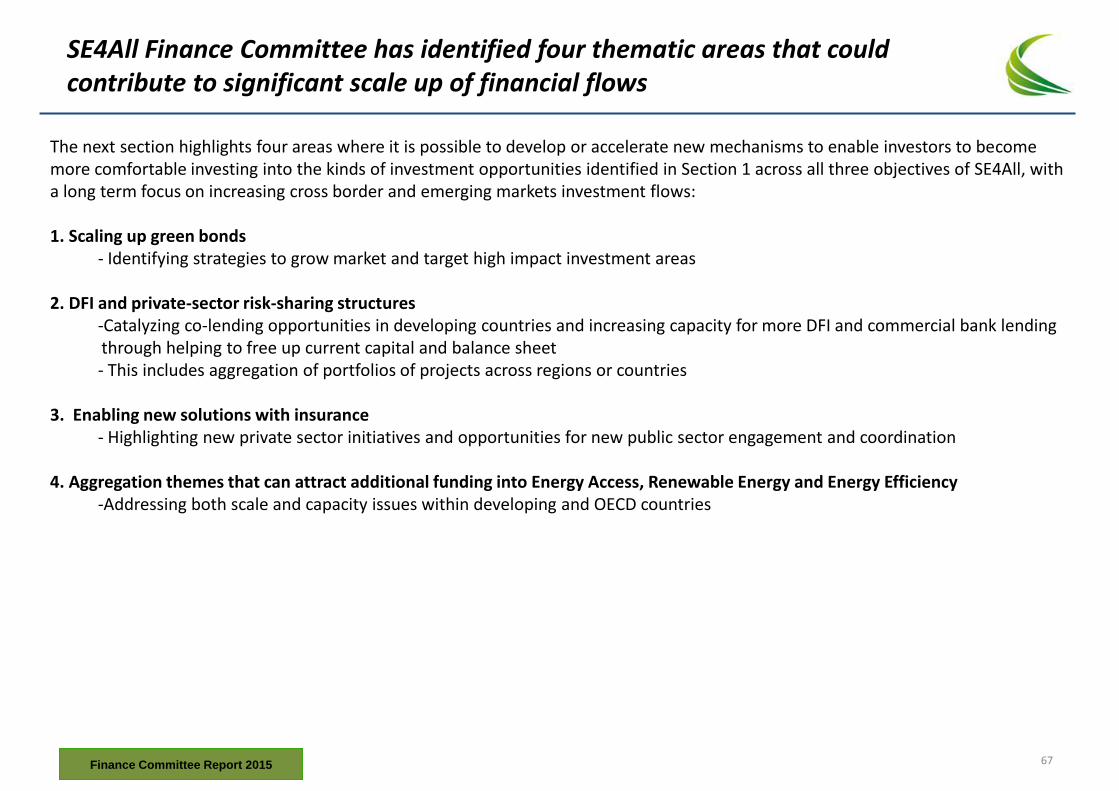
SE4All Finance Committee has identified four thematic areas that could contribute to significant scale up of financial flows
The next section highlights four areas where it is possible to develop or accelerate new mechanisms to enable investors to become more comfortable investing into the kinds of investment opportunities identified in Section 1 across all three objectives of SE4All, with a long term focus on increasing cross border and emerging markets investment flows: 1. Scaling up green bonds
- Identifying strategies to grow market and target high impact investment areas
2. DFI and private-sector risk-sharing structures -Catalyzing co-lending opportunities in developing countries and increasing capacity for more DFI and commercial bank lending through helping to free up current capital and balance sheet - This includes aggregation of portfolios of projects across regions or countries
3. Enabling new solutions with insurance
- Highlighting new private sector initiatives and opportunities for new public sector engagement and coordination
4. Aggregation themes that can attract additional funding into Energy Access, Renewable Energy and Energy Efficiency -Addressing both scale and capacity issues within developing and OECD countries
Finance Committee Report 2015 67
Thematic Area 1: Scaling Up Green Bonds
Finance Committee Report 2015
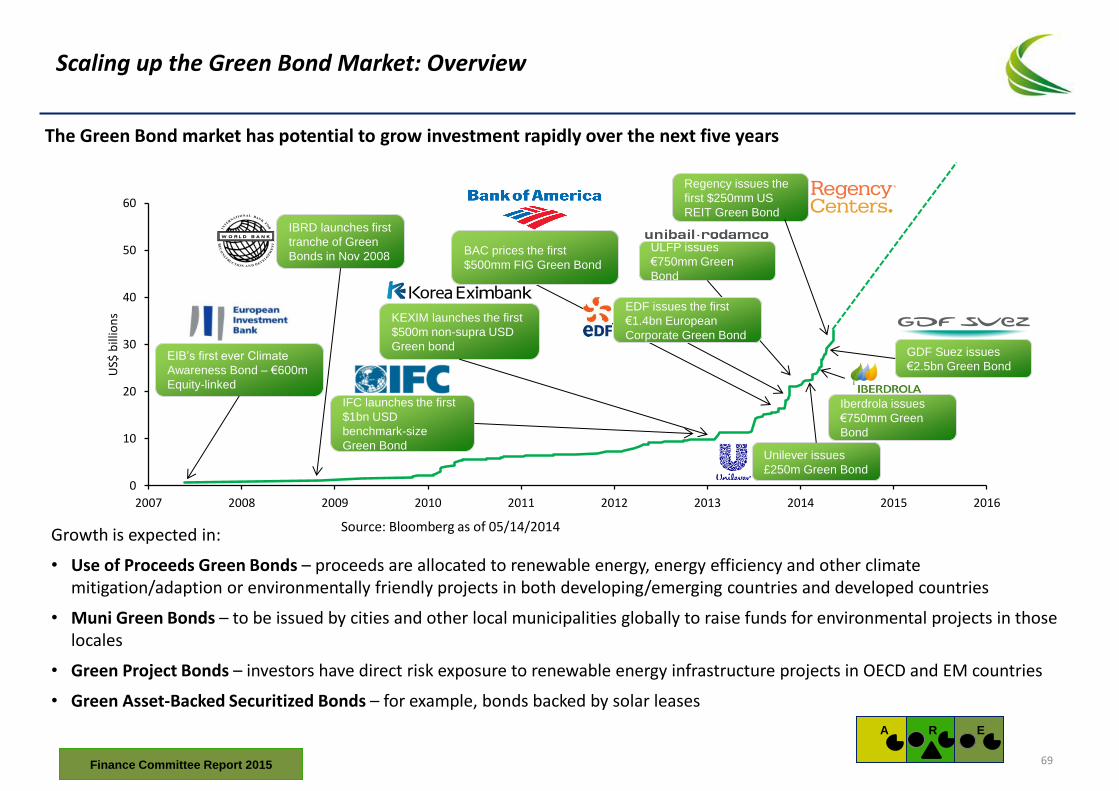
0
10
20
30
40
50
60
2007 2008 2009 2010 2011 2012 2013 2014 2015 2016
US$
bill
ion
s
Scaling up the Green Bond Market: Overview
The Green Bond market has potential to grow investment rapidly over the next five years
Source: Bloomberg as of 05/14/2014
ULFP issues
€750mm Green
Bond
EIB’s first ever Climate
Awareness Bond – €600m
Equity-linked
IBRD launches first
tranche of Green
Bonds in Nov 2008
IFC launches the first
$1bn USD
benchmark-size
Green Bond Unilever issues
£250m Green Bond
KEXIM launches the first
$500m non-supra USD
Green bond
EDF issues the first
€1.4bn European
Corporate Green Bond
BAC prices the first
$500mm FIG Green Bond
Iberdrola issues
€750mm Green
Bond
GDF Suez issues
€2.5bn Green Bond
Regency issues the
first $250mm US
REIT Green Bond
A
E
R
Growth is expected in:
• Use of Proceeds Green Bonds – proceeds are allocated to renewable energy, energy efficiency and other climate mitigation/adaption or environmentally friendly projects in both developing/emerging countries and developed countries
• Muni Green Bonds – to be issued by cities and other local municipalities globally to raise funds for environmental projects in those locales
• Green Project Bonds – investors have direct risk exposure to renewable energy infrastructure projects in OECD and EM countries
• Green Asset-Backed Securitized Bonds – for example, bonds backed by solar leases
Finance Committee Report 2015 69
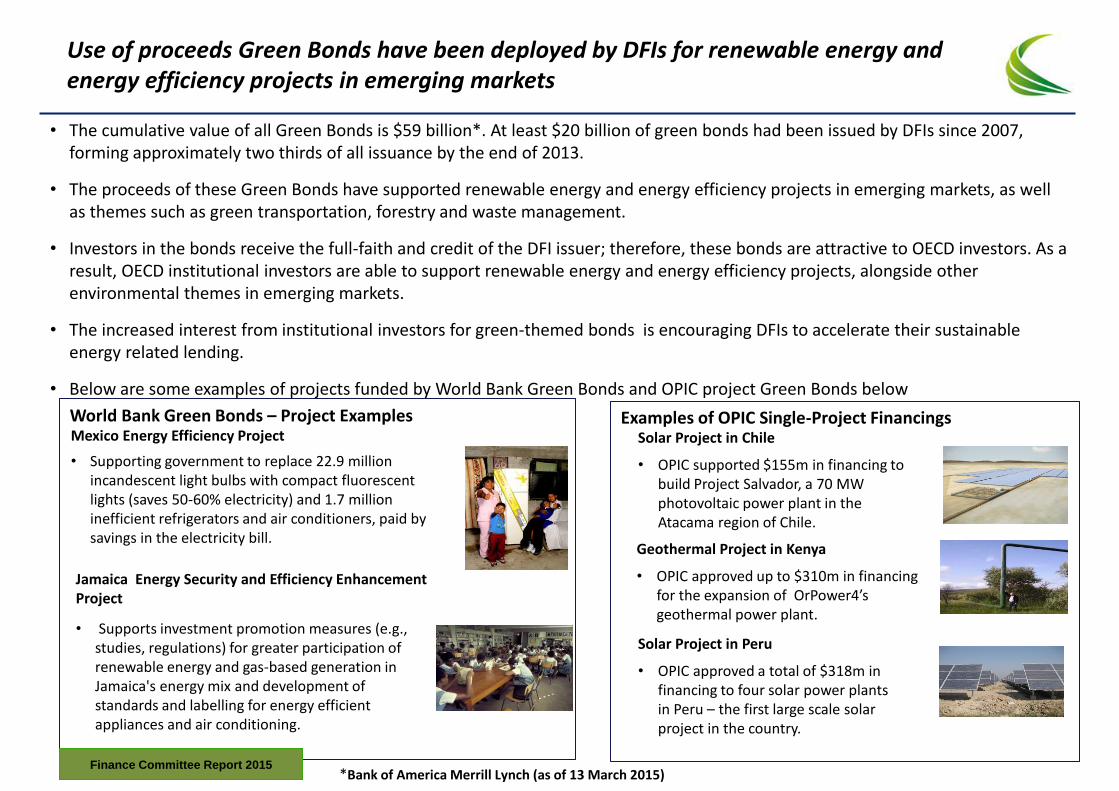
Use of proceeds Green Bonds have been deployed by DFIs for renewable energy and energy efficiency projects in emerging markets
• The cumulative value of all Green Bonds is $59 billion*. At least $20 billion of green bonds had been issued by DFIs since 2007, forming approximately two thirds of all issuance by the end of 2013.
• The proceeds of these Green Bonds have supported renewable energy and energy efficiency projects in emerging markets, as well as themes such as green transportation, forestry and waste management.
• Investors in the bonds receive the full-faith and credit of the DFI issuer; therefore, these bonds are attractive to OECD investors. As a result, OECD institutional investors are able to support renewable energy and energy efficiency projects, alongside other environmental themes in emerging markets.
• The increased interest from institutional investors for green-themed bonds is encouraging DFIs to accelerate their sustainable energy related lending.
• Below are some examples of projects funded by World Bank Green Bonds and OPIC project Green Bonds below
Examples of OPIC Single-Project Financings
Geothermal Project in Kenya
• OPIC approved up to $310m in financing for the expansion of OrPower4’s geothermal power plant.
Solar Project in Peru
• OPIC approved a total of $318m in financing to four solar power plants in Peru – the first large scale solar project in the country.
Solar Project in Chile
• OPIC supported $155m in financing to build Project Salvador, a 70 MW photovoltaic power plant in the Atacama region of Chile.
World Bank Green Bonds – Project Examples
Mexico Energy Efficiency Project
• Supporting government to replace 22.9 million incandescent light bulbs with compact fluorescent lights (saves 50-60% electricity) and 1.7 million inefficient refrigerators and air conditioners, paid by savings in the electricity bill.
Jamaica Energy Security and Efficiency Enhancement Project
• Supports investment promotion measures (e.g., studies, regulations) for greater participation of renewable energy and gas-based generation in Jamaica's energy mix and development of standards and labelling for energy efficient appliances and air conditioning.
Finance Committee Report 2015 *Bank of America Merrill Lynch (as of 13 March 2015)
Four interventions that could accelerate expansion of the Green Bond market
1. Broader Uptake of the Green Bond Principles
• Originally published as a White Paper in Global Capital Magazine (previously Euroweek Magazine) in September 2013, formally launched in January 2014, and as of May 2015 supported by more than 60 entities representing underwriting banks, institutional investors, and bond issuers
• Developed in conjunction with issuers and investors to serve as voluntary guidelines on recommended process for issuing Green Bonds (see Annex for an overview of the Green Bond Principles)
• Core focus on designating, disclosing, managing and reporting on the proceeds of a bond • International Capital Markets Association (ICMA) named as independent Secretariat in April 2014; governance process
established to engage issuers, investors and underwriters in the future development of the Principles; NGOs can also contribute • Enables investors to evaluate the environmental impact of their Green Bond investments by ensuring availability of information
2. Increasing Size and Scope of Use of Proceeds (aka “vanilla”) Issuance
• Growth of the market is helping to create a narrative for investors; should encourage greater comfort in green investments beyond vanilla
• Banks, rating agencies and NGO’s actively educating both issuers and investors about the long term opportunities this market may bring
• While most issuance to date may be considered more a “re-labelling” exercise, there is evidence that the strong investor demand for benchmark issues is beginning to encourage issuers to actively seek out new green projects to fund and for asset managers to seek out new investors, especially in the foundation, endowment, high-net worth and next generation space
• US Green Muni push led by California, New York and Massachusetts State Treasurers • International/emerging markets Green City Bond push with C40 and World Bank support • Opportunity for China / India issuer and investor education • Green Bond benchmark indices (e.g., Bank of America Merrill Lynch Green Bond Index) and ETFs have been launched during
2014 -5 and this is improving liquidity • Ecosystem of consultants that work with prospective issuers • Public policy incentives for green bonds: tax, regulatory
A
E
R
Finance Committee Report 2015 71
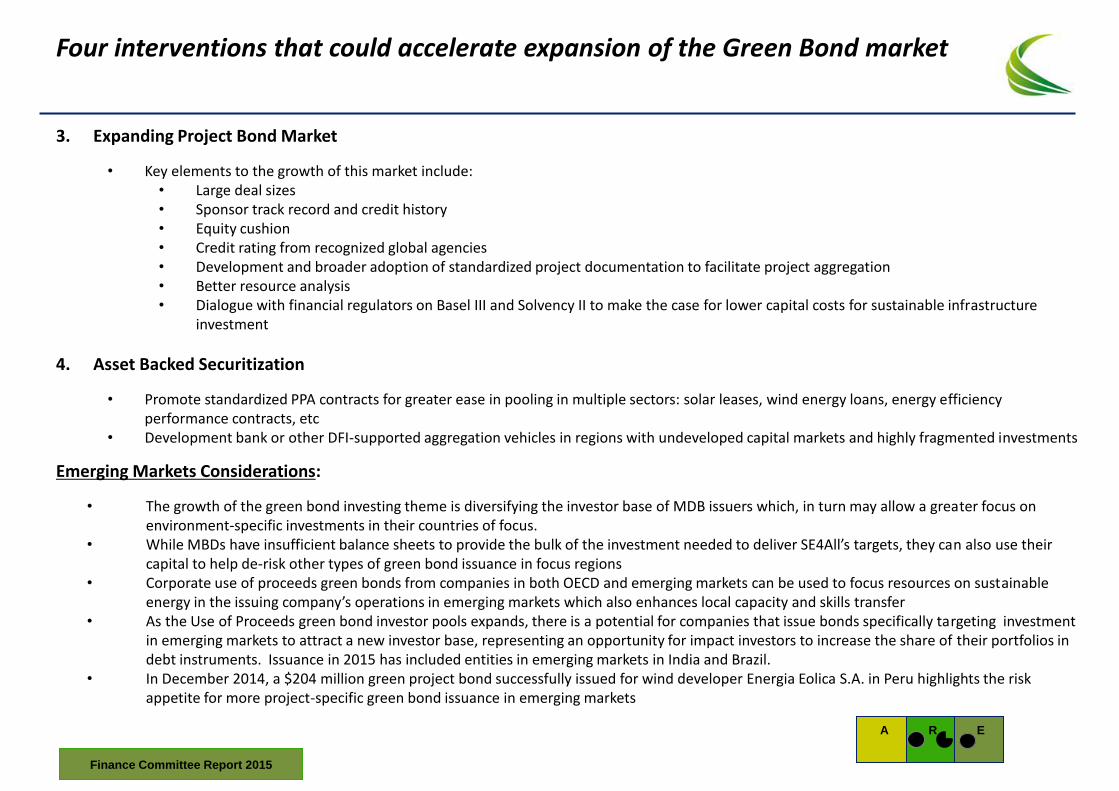
Four interventions that could accelerate expansion of the Green Bond market
3. Expanding Project Bond Market
• Key elements to the growth of this market include: • Large deal sizes • Sponsor track record and credit history • Equity cushion • Credit rating from recognized global agencies • Development and broader adoption of standardized project documentation to facilitate project aggregation • Better resource analysis • Dialogue with financial regulators on Basel III and Solvency II to make the case for lower capital costs for sustainable infrastructure
investment
4. Asset Backed Securitization
• Promote standardized PPA contracts for greater ease in pooling in multiple sectors: solar leases, wind energy loans, energy efficiency performance contracts, etc
• Development bank or other DFI-supported aggregation vehicles in regions with undeveloped capital markets and highly fragmented investments
Emerging Markets Considerations:
• The growth of the green bond investing theme is diversifying the investor base of MDB issuers which, in turn may allow a greater focus on environment-specific investments in their countries of focus.
• While MBDs have insufficient balance sheets to provide the bulk of the investment needed to deliver SE4All’s targets, they can also use their capital to help de-risk other types of green bond issuance in focus regions
• Corporate use of proceeds green bonds from companies in both OECD and emerging markets can be used to focus resources on sustainable energy in the issuing company’s operations in emerging markets which also enhances local capacity and skills transfer
• As the Use of Proceeds green bond investor pools expands, there is a potential for companies that issue bonds specifically targeting investment in emerging markets to attract a new investor base, representing an opportunity for impact investors to increase the share of their portfolios in debt instruments. Issuance in 2015 has included entities in emerging markets in India and Brazil.
• In December 2014, a $204 million green project bond successfully issued for wind developer Energia Eolica S.A. in Peru highlights the risk appetite for more project-specific green bond issuance in emerging markets
A
E
R
Finance Committee Report 2015
Thematic Area 2: DFIs and Private-Sector Risk-sharing Structures
Finance Committee Report 2015 73
A spectrum of investment products could be structured to increase flow of capital to developing countries
The lending capacity of DFIs is not sufficient, by itself, to finance the global market opportunity for sustainable energy and infrastructure identified in Section 1. With the right structure, private-sector institutional investors can provide a much-needed additional source of financing. In particular, structuring of cash flows and use of DFI risk-mitigation tools including credit enhancement, as required, could attract institutional investors.
SE4All Finance Committee has explored different approaches with a variety of DFIs, leading to a range of structural variations. Some key differences among these structures include:
• Degree of credit enhancement and other risk-mitigation support needed to be provided by the DFI • Geographic focus and diversification • Borrower-type for loan portfolios, and • Whether DFIs will invest alongside the institutional investors.
While all these structures largely target increasing the capacity of the DFIs to more effectively leverage their capital base and balance sheets, additional work is being done to explore how DFIs might develop de-risking structures or platforms to sell portions of their existing lending portfolios to institutional investors.
On the next slides, we summarise five examples of these approaches that illustrate the key differences in design features: Structure 1: Promoting DFI and Institutional Co-Investment: DFI structure focused on State-Owned Enterprise Borrowers in Emerging Markets
Structure 2: Promoting DFI and Institutional Co-Investment: DFI structure focused on Private Project Borrowers in Emerging Markets
Structure 3: Promoting Institutional Investment: DFI structure focused on Private Sector Project Borrowers in Emerging Markets
Structure 4: Promoting Institutional Investment: DFI facilitated structure with focus on Private Sector Project Borrowers in Developed Markets
Structure 5: Platform to free up DFI balance-sheets to help catalyze new lending to sustainable energy investments
Most of these structures seek to accelerate financing in developing countries, with the target loan recipients being local or regional utilities or project finance. They involve complexity and set up costs, but address the challenge of scaling up investment.
Finance Committee Report 2015
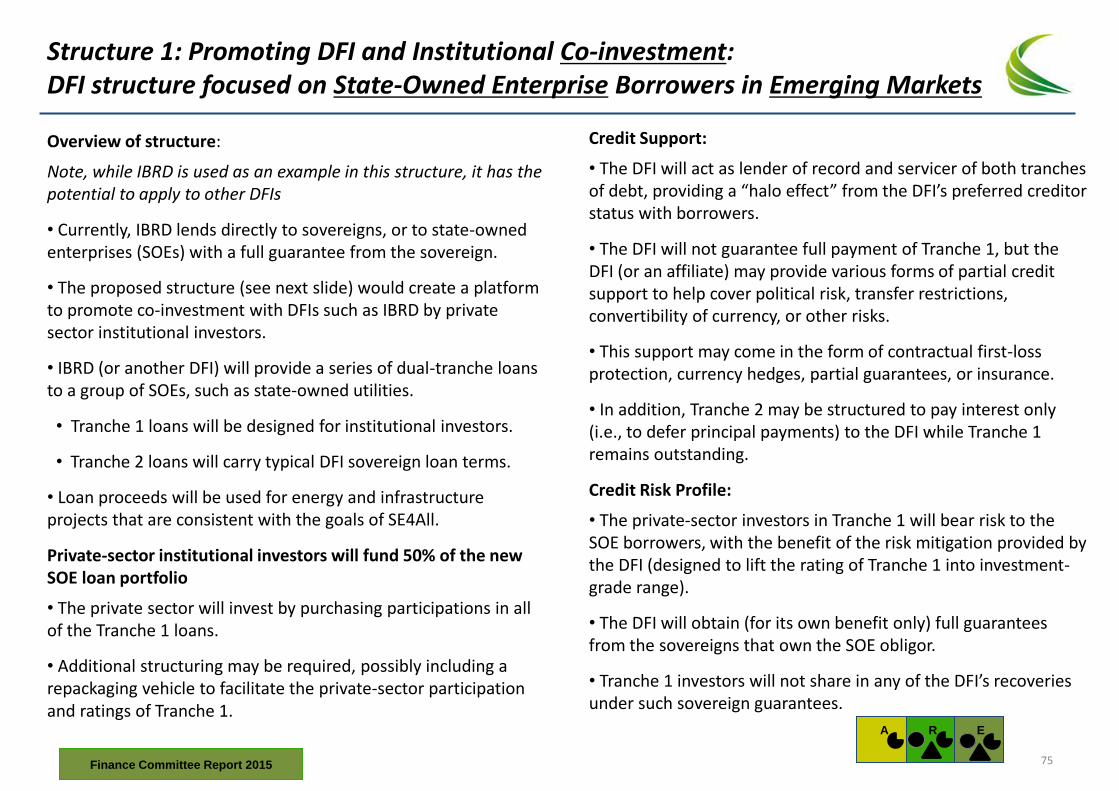
Credit Support:
• The DFI will act as lender of record and servicer of both tranches of debt, providing a “halo effect” from the DFI’s preferred creditor status with borrowers.
• The DFI will not guarantee full payment of Tranche 1, but the DFI (or an affiliate) may provide various forms of partial credit support to help cover political risk, transfer restrictions, convertibility of currency, or other risks.
• This support may come in the form of contractual first-loss protection, currency hedges, partial guarantees, or insurance.
• In addition, Tranche 2 may be structured to pay interest only (i.e., to defer principal payments) to the DFI while Tranche 1 remains outstanding.
Credit Risk Profile:
• The private-sector investors in Tranche 1 will bear risk to the SOE borrowers, with the benefit of the risk mitigation provided by the DFI (designed to lift the rating of Tranche 1 into investment-grade range).
• The DFI will obtain (for its own benefit only) full guarantees from the sovereigns that own the SOE obligor.
• Tranche 1 investors will not share in any of the DFI’s recoveries under such sovereign guarantees.
Overview of structure:
Note, while IBRD is used as an example in this structure, it has the potential to apply to other DFIs
• Currently, IBRD lends directly to sovereigns, or to state-owned enterprises (SOEs) with a full guarantee from the sovereign.
• The proposed structure (see next slide) would create a platform to promote co-investment with DFIs such as IBRD by private sector institutional investors.
• IBRD (or another DFI) will provide a series of dual-tranche loans to a group of SOEs, such as state-owned utilities.
• Tranche 1 loans will be designed for institutional investors.
• Tranche 2 loans will carry typical DFI sovereign loan terms.
• Loan proceeds will be used for energy and infrastructure projects that are consistent with the goals of SE4All.
Private-sector institutional investors will fund 50% of the new SOE loan portfolio
• The private sector will invest by purchasing participations in all of the Tranche 1 loans.
• Additional structuring may be required, possibly including a repackaging vehicle to facilitate the private-sector participation and ratings of Tranche 1.
Structure 1: Promoting DFI and Institutional Co-investment: DFI structure focused on State-Owned Enterprise Borrowers in Emerging Markets
A
E
R
Finance Committee Report 2015 75
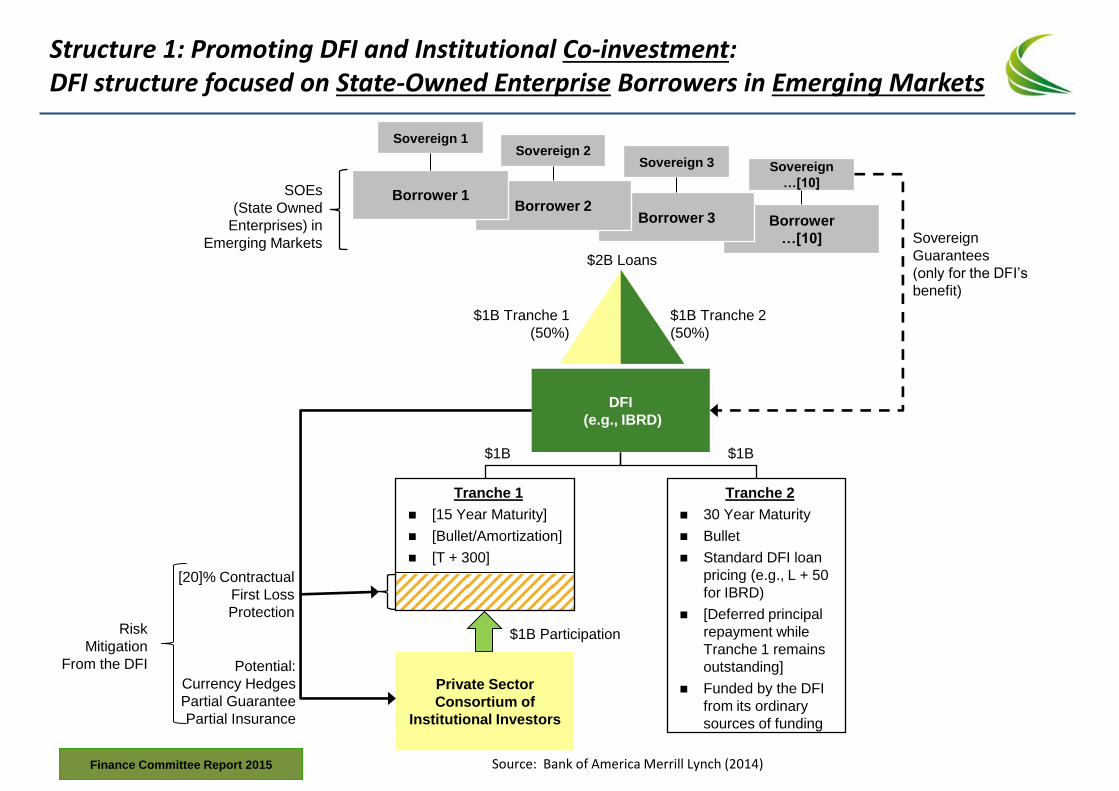
Borrower
…[10]
Borrower 3 Borrower 2
DFI
(e.g., IBRD)
Borrower 1 SOEs
(State Owned
Enterprises) in
Emerging Markets
[20]% Contractual
First Loss
Protection
Tranche 1
[15 Year Maturity]
[Bullet/Amortization]
[T + 300]
Tranche 2
30 Year Maturity
Bullet
Standard DFI loan
pricing (e.g., L + 50
for IBRD)
[Deferred principal
repayment while
Tranche 1 remains
outstanding]
Funded by the DFI
from its ordinary
sources of funding
Potential:
Currency Hedges
Partial Guarantee
Partial Insurance
$1B Participation
$1B Tranche 1
(50%)
Sovereign 1 Sovereign 2
Sovereign 3 Sovereign
…[10]
Sovereign
Guarantees
(only for the DFI’s
benefit)
Risk
Mitigation
From the DFI
$1B $1B
Private Sector
Consortium of
Institutional Investors
$1B Tranche 2
(50%)
$2B Loans
Structure 1: Promoting DFI and Institutional Co-investment: DFI structure focused on State-Owned Enterprise Borrowers in Emerging Markets
Source: Bank of America Merrill Lynch (2014) Finance Committee Report 2015
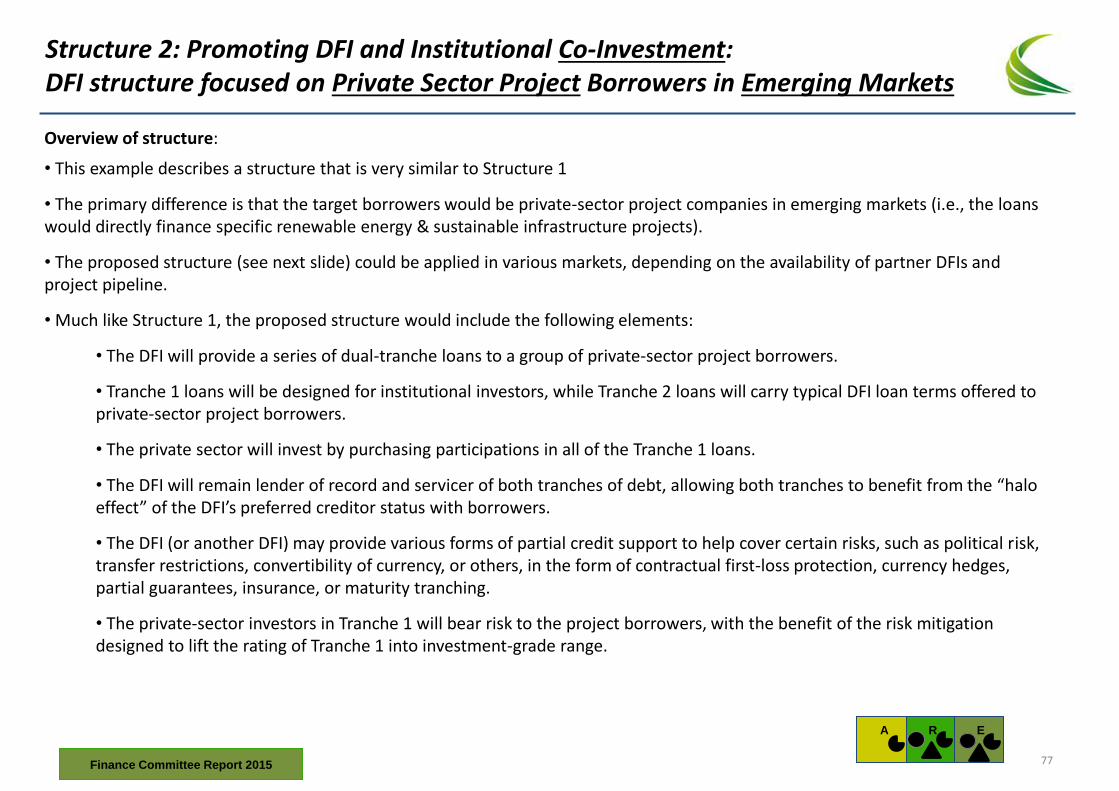
Overview of structure:
• This example describes a structure that is very similar to Structure 1
• The primary difference is that the target borrowers would be private-sector project companies in emerging markets (i.e., the loans would directly finance specific renewable energy & sustainable infrastructure projects).
• The proposed structure (see next slide) could be applied in various markets, depending on the availability of partner DFIs and project pipeline.
• Much like Structure 1, the proposed structure would include the following elements:
• The DFI will provide a series of dual-tranche loans to a group of private-sector project borrowers.
• Tranche 1 loans will be designed for institutional investors, while Tranche 2 loans will carry typical DFI loan terms offered to private-sector project borrowers.
• The private sector will invest by purchasing participations in all of the Tranche 1 loans.
• The DFI will remain lender of record and servicer of both tranches of debt, allowing both tranches to benefit from the “halo effect” of the DFI’s preferred creditor status with borrowers.
• The DFI (or another DFI) may provide various forms of partial credit support to help cover certain risks, such as political risk, transfer restrictions, convertibility of currency, or others, in the form of contractual first-loss protection, currency hedges, partial guarantees, insurance, or maturity tranching.
• The private-sector investors in Tranche 1 will bear risk to the project borrowers, with the benefit of the risk mitigation designed to lift the rating of Tranche 1 into investment-grade range.
Structure 2: Promoting DFI and Institutional Co-Investment: DFI structure focused on Private Sector Project Borrowers in Emerging Markets
A
E
R
Finance Committee Report 2015 77
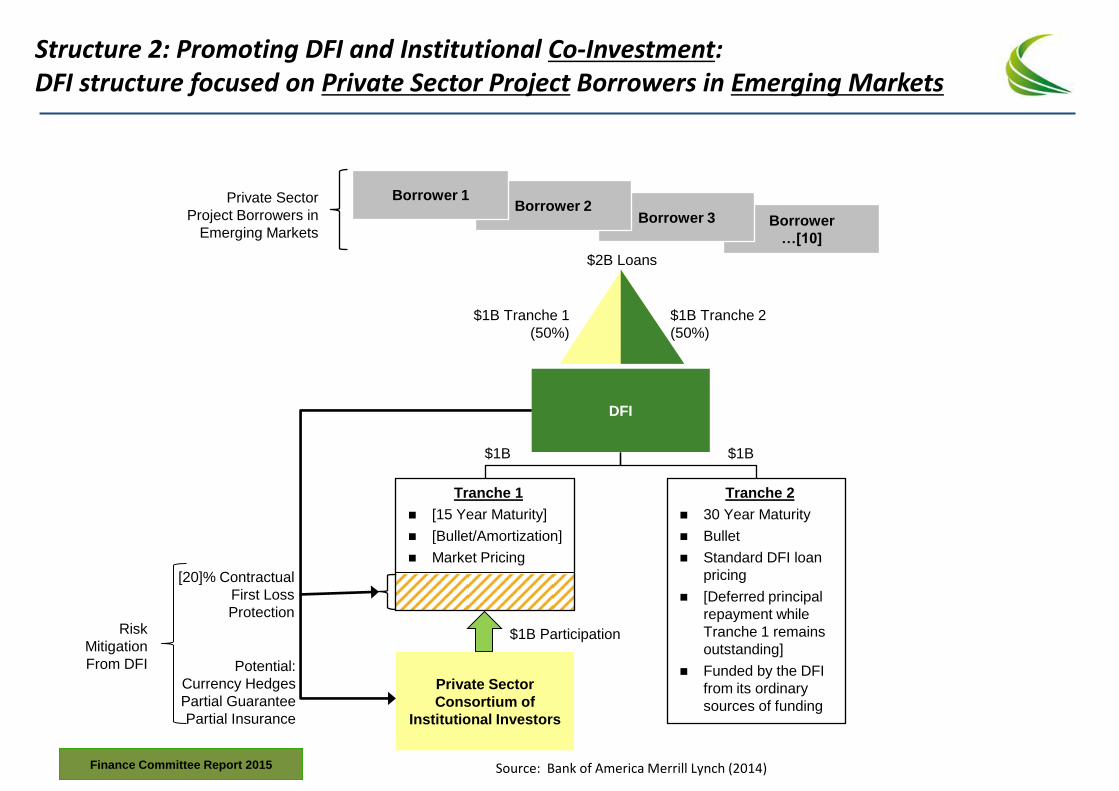
Borrower
…[10]
Borrower 3 Borrower 2
DFI
Borrower 1 Private Sector
Project Borrowers in
Emerging Markets
[20]% Contractual
First Loss
Protection
Tranche 1
[15 Year Maturity]
[Bullet/Amortization]
Market Pricing
Tranche 2
30 Year Maturity
Bullet
Standard DFI loan
pricing
[Deferred principal
repayment while
Tranche 1 remains
outstanding]
Funded by the DFI
from its ordinary
sources of funding
Potential:
Currency Hedges
Partial Guarantee
Partial Insurance
$1B Participation
$1B Tranche 1
(50%)
Risk
Mitigation
From DFI
$1B $1B
Private Sector
Consortium of
Institutional Investors
$1B Tranche 2
(50%)
$2B Loans
Source: Bank of America Merrill Lynch (2014)
Structure 2: Promoting DFI and Institutional Co-Investment: DFI structure focused on Private Sector Project Borrowers in Emerging Markets
Finance Committee Report 2015
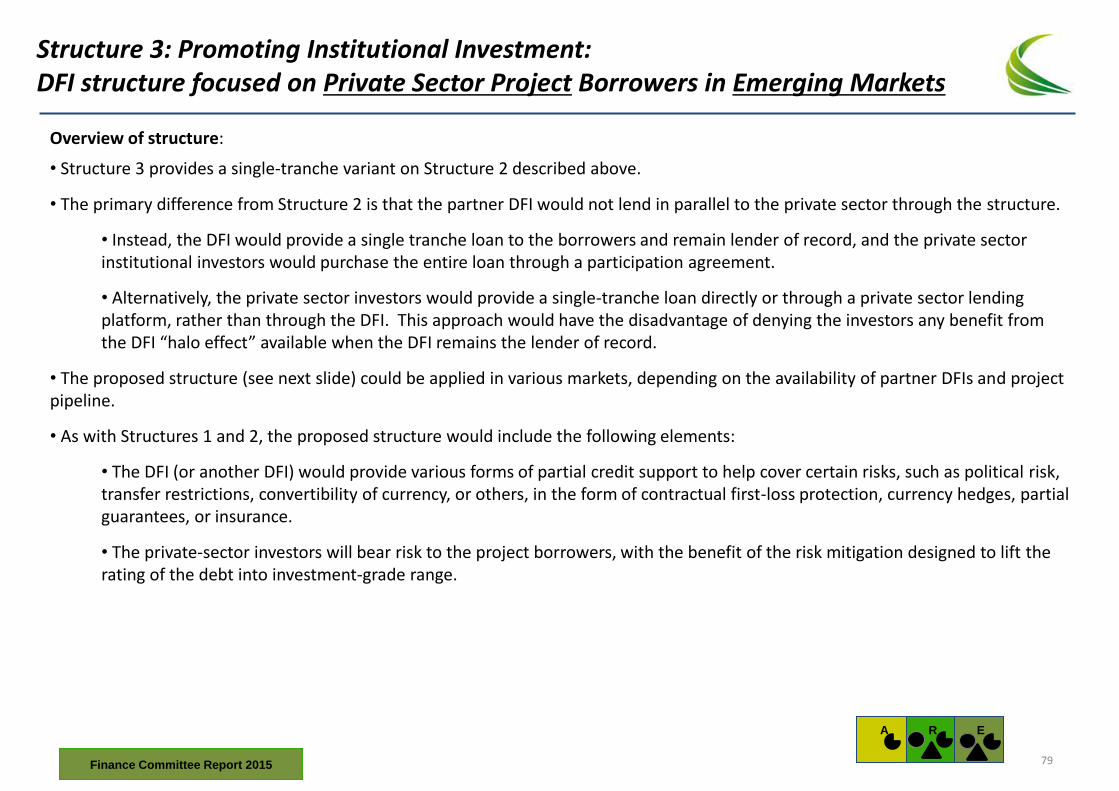
Overview of structure:
• Structure 3 provides a single-tranche variant on Structure 2 described above.
• The primary difference from Structure 2 is that the partner DFI would not lend in parallel to the private sector through the structure.
• Instead, the DFI would provide a single tranche loan to the borrowers and remain lender of record, and the private sector institutional investors would purchase the entire loan through a participation agreement.
• Alternatively, the private sector investors would provide a single-tranche loan directly or through a private sector lending platform, rather than through the DFI. This approach would have the disadvantage of denying the investors any benefit from the DFI “halo effect” available when the DFI remains the lender of record.
• The proposed structure (see next slide) could be applied in various markets, depending on the availability of partner DFIs and project pipeline.
• As with Structures 1 and 2, the proposed structure would include the following elements:
• The DFI (or another DFI) would provide various forms of partial credit support to help cover certain risks, such as political risk, transfer restrictions, convertibility of currency, or others, in the form of contractual first-loss protection, currency hedges, partial guarantees, or insurance.
• The private-sector investors will bear risk to the project borrowers, with the benefit of the risk mitigation designed to lift the rating of the debt into investment-grade range.
Structure 3: Promoting Institutional Investment: DFI structure focused on Private Sector Project Borrowers in Emerging Markets
A
E
R
Finance Committee Report 2015 79
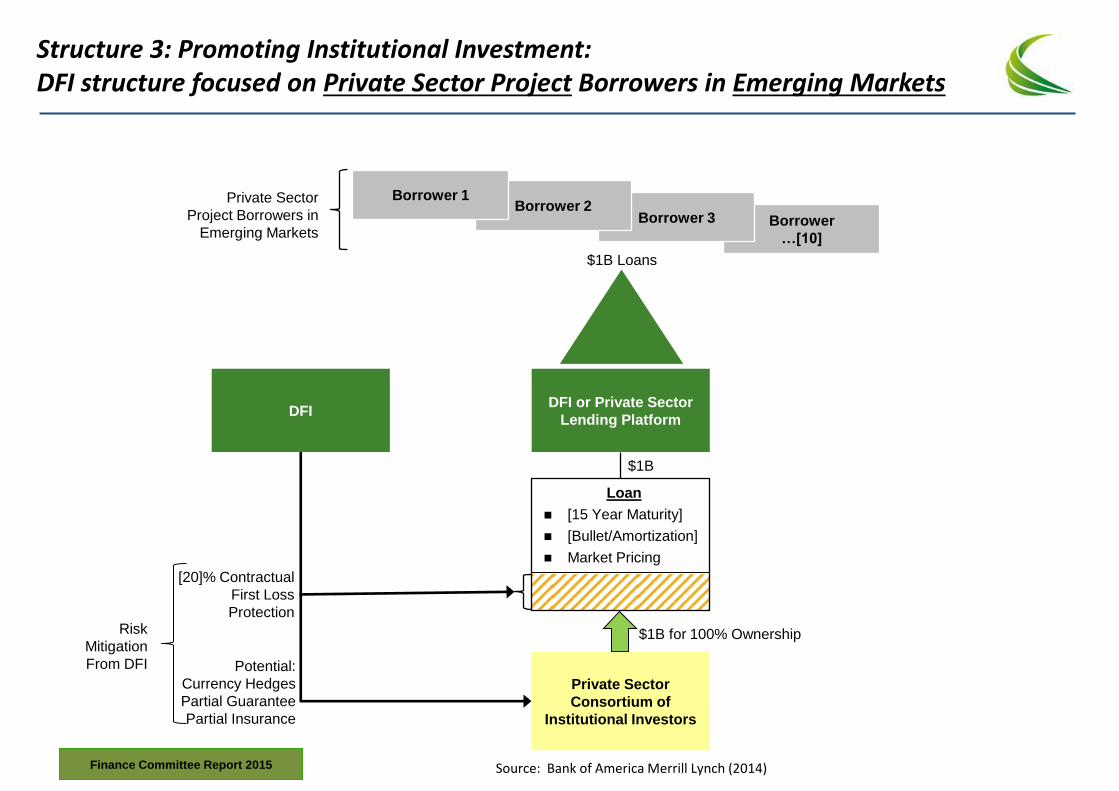
Borrower
…[10]
Borrower 3 Borrower 2
DFI or Private Sector
Lending Platform
Borrower 1 Private Sector
Project Borrowers in
Emerging Markets
[20]% Contractual
First Loss
Protection
Loan
[15 Year Maturity]
[Bullet/Amortization]
Market Pricing
Potential:
Currency Hedges
Partial Guarantee
Partial Insurance
$1B for 100% Ownership
Private Sector
Consortium of
Institutional Investors
$1B Loans
$1B
Risk
Mitigation
From DFI
DFI
Structure 3: Promoting Institutional Investment: DFI structure focused on Private Sector Project Borrowers in Emerging Markets
Source: Bank of America Merrill Lynch (2014) Finance Committee Report 2015
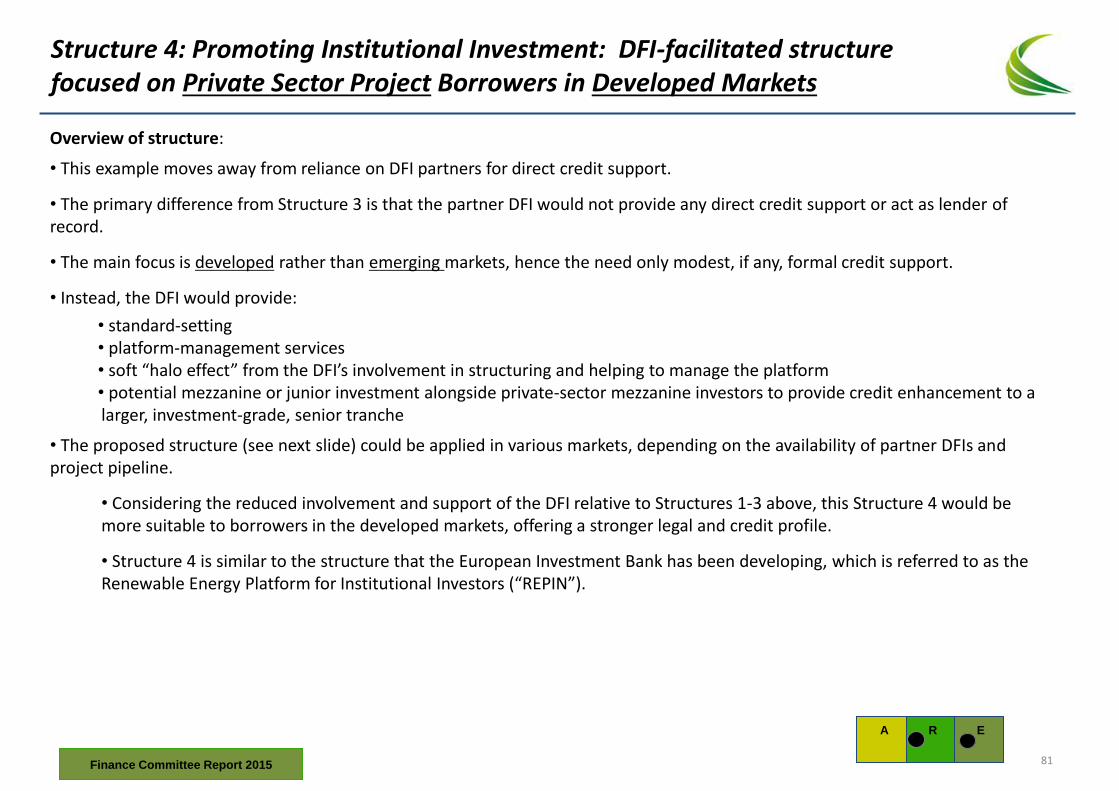
Overview of structure:
• This example moves away from reliance on DFI partners for direct credit support.
• The primary difference from Structure 3 is that the partner DFI would not provide any direct credit support or act as lender of record.
• The main focus is developed rather than emerging markets, hence the need only modest, if any, formal credit support.
• Instead, the DFI would provide:
• standard-setting • platform-management services • soft “halo effect” from the DFI’s involvement in structuring and helping to manage the platform • potential mezzanine or junior investment alongside private-sector mezzanine investors to provide credit enhancement to a larger, investment-grade, senior tranche
• The proposed structure (see next slide) could be applied in various markets, depending on the availability of partner DFIs and project pipeline.
• Considering the reduced involvement and support of the DFI relative to Structures 1-3 above, this Structure 4 would be more suitable to borrowers in the developed markets, offering a stronger legal and credit profile.
• Structure 4 is similar to the structure that the European Investment Bank has been developing, which is referred to as the Renewable Energy Platform for Institutional Investors (“REPIN”).
Structure 4: Promoting Institutional Investment: DFI-facilitated structure focused on Private Sector Project Borrowers in Developed Markets
A
E
R
Finance Committee Report 2015 81
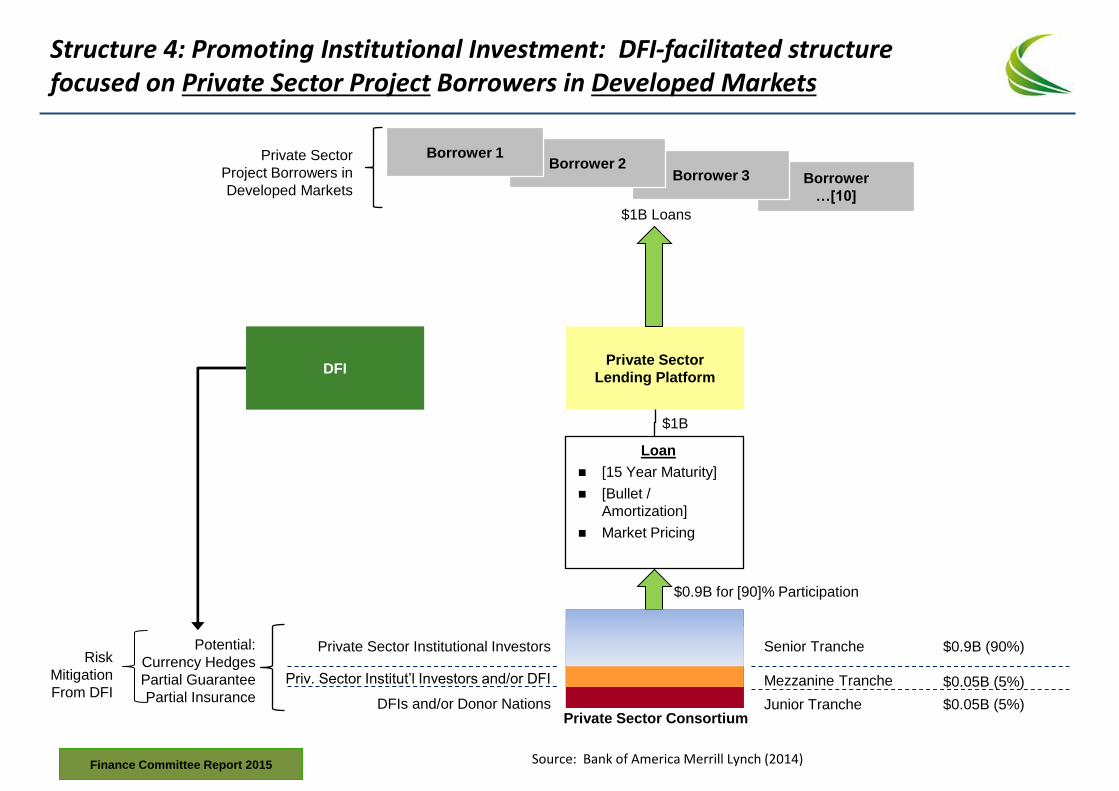
Borrower
…[10]
Borrower 3 Borrower 2
Private Sector
Lending Platform
Borrower 1 Private Sector
Project Borrowers in
Developed Markets
Loan
[15 Year Maturity]
[Bullet /
Amortization]
Market Pricing
Potential:
Currency Hedges
Partial Guarantee
Partial Insurance
$0.9B for [90]% Participation
$1B Loans
$1B
Risk
Mitigation
From DFI
$0.9B (90%)
$0.05B (5%)
$0.05B (5%)
Senior Tranche
Mezzanine Tranche
Junior Tranche Private Sector Consortium
Private Sector Institutional Investors
DFIs and/or Donor Nations
Priv. Sector Institut’l Investors and/or DFI
DFI
Structure 4: Promoting Institutional Investment: DFI-facilitated structure focused on Private Sector Project Borrowers in Developed Markets
Source: Bank of America Merrill Lynch (2014) Finance Committee Report 2015
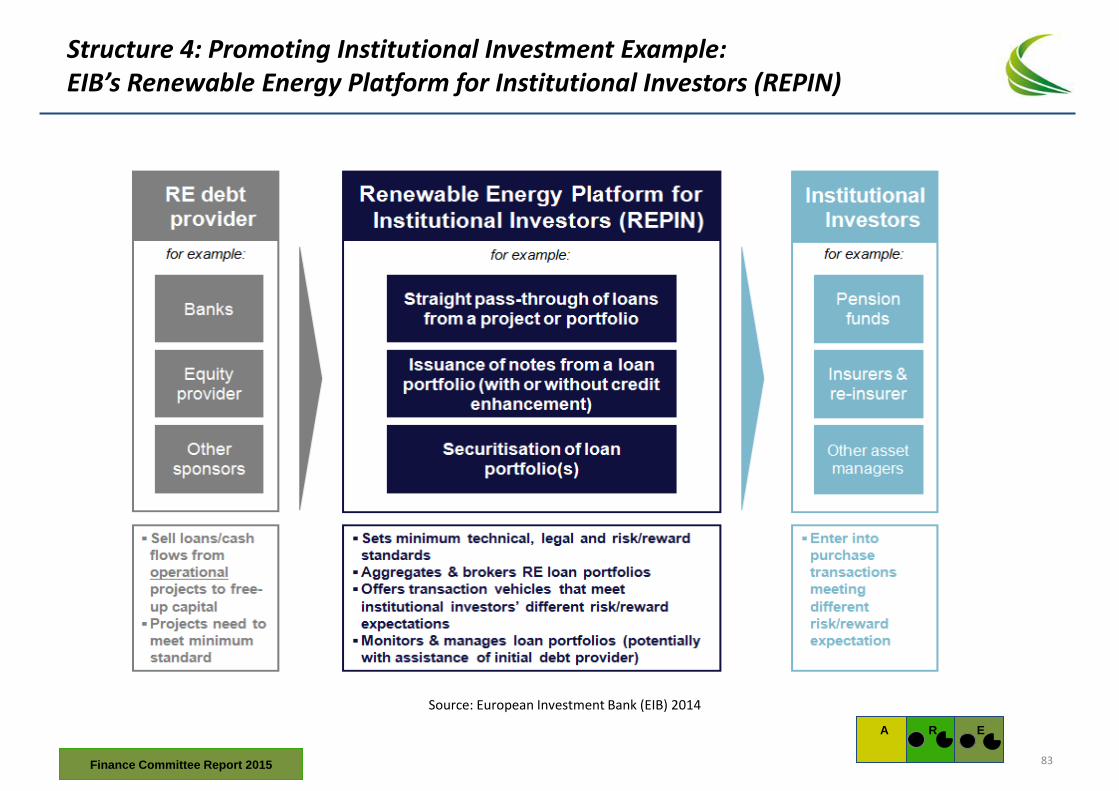
Structure 4: Promoting Institutional Investment Example: EIB’s Renewable Energy Platform for Institutional Investors (REPIN)
Source: European Investment Bank (EIB) 2014
A
E
R
Finance Committee Report 2015 83
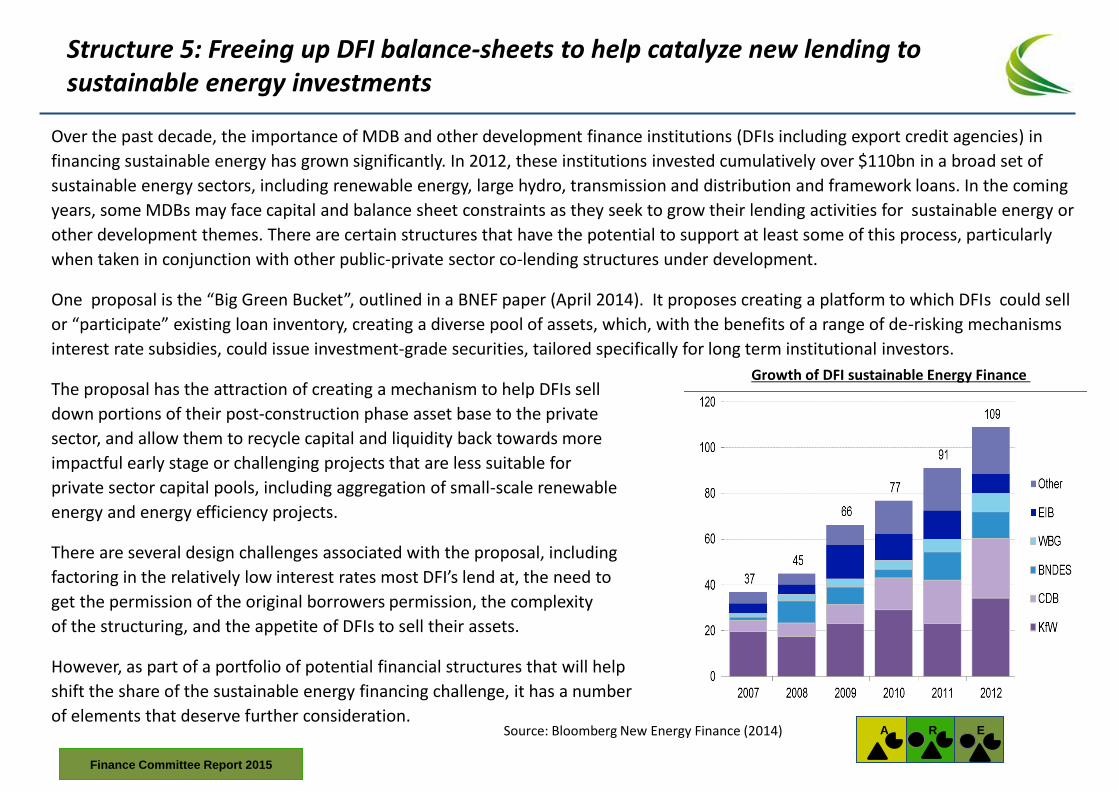
Structure 5: Freeing up DFI balance-sheets to help catalyze new lending to sustainable energy investments
Over the past decade, the importance of MDB and other development finance institutions (DFIs including export credit agencies) in
financing sustainable energy has grown significantly. In 2012, these institutions invested cumulatively over $110bn in a broad set of
sustainable energy sectors, including renewable energy, large hydro, transmission and distribution and framework loans. In the coming
years, some MDBs may face capital and balance sheet constraints as they seek to grow their lending activities for sustainable energy or
other development themes. There are certain structures that have the potential to support at least some of this process, particularly
when taken in conjunction with other public-private sector co-lending structures under development.
One proposal is the “Big Green Bucket”, outlined in a BNEF paper (April 2014). It proposes creating a platform to which DFIs could sell
or “participate” existing loan inventory, creating a diverse pool of assets, which, with the benefits of a range of de-risking mechanisms
interest rate subsidies, could issue investment-grade securities, tailored specifically for long term institutional investors.
The proposal has the attraction of creating a mechanism to help DFIs sell
down portions of their post-construction phase asset base to the private
sector, and allow them to recycle capital and liquidity back towards more
impactful early stage or challenging projects that are less suitable for
private sector capital pools, including aggregation of small-scale renewable
energy and energy efficiency projects.
There are several design challenges associated with the proposal, including
factoring in the relatively low interest rates most DFI’s lend at, the need to
get the permission of the original borrowers permission, the complexity
of the structuring, and the appetite of DFIs to sell their assets.
However, as part of a portfolio of potential financial structures that will help
shift the share of the sustainable energy financing challenge, it has a number
of elements that deserve further consideration.
Source: Bloomberg New Energy Finance (2014)
Growth of DFI sustainable Energy Finance
A
E
R
Finance Committee Report 2015
Thematic Area 3: Enabling New Insurance Solutions
Finance Committee Report 2015 85
Publicly-financed insurance has not played a material role to date in mobilising sustainable energy finance
• Ultimately, the route to lowest cost capital for projects is to lower their risk. Insurance and guarantee products can play an important role in allowing specific project risks to be identified and managed, and have the potential to play an increasingly important role if addressing specific risks in the project finance process. This is particular the case in emerging markets where our dialogue with investors highlighted several risks that could be addressed through innovative application of insurance approaches.
• Our review of insurance-related products available from MDBs (see slide 92) highlights that while a few instruments are available such as political risk insurance (e.g., MIGA from within the World Bank Group), these have rarely been applied to address sustainable energy financing opportunities. There is also a need for more targeted solutions to assist in facilitating more flows of institutional investor funds towards opportunities relevant for SE4All.
• In the following pages, we have identified some of the most applicable new insurance products. While many of them are driven by private sector companies, there is some opportunity for public-private partnership to help scale-up financing efforts Africa Energy Guarantee Fund to provide political and credit risk insurance
Geothermal reservoir output risk insurance
Warrantees for energy efficiency performance
Private providers of credit protection against losses in infrastructure loan portfolios
Monoline financial guarantees – the AMF private sector example, Public Sector monoline guarantees – providing a transitional strategy for higher risk projects in emerging countries.
• We explore each of these in the subsequent slides by looking at the specific risks each product seeks to address, its applicability to sub-sections within SE4All, approaches, and providers.
Finance Committee Report 2015
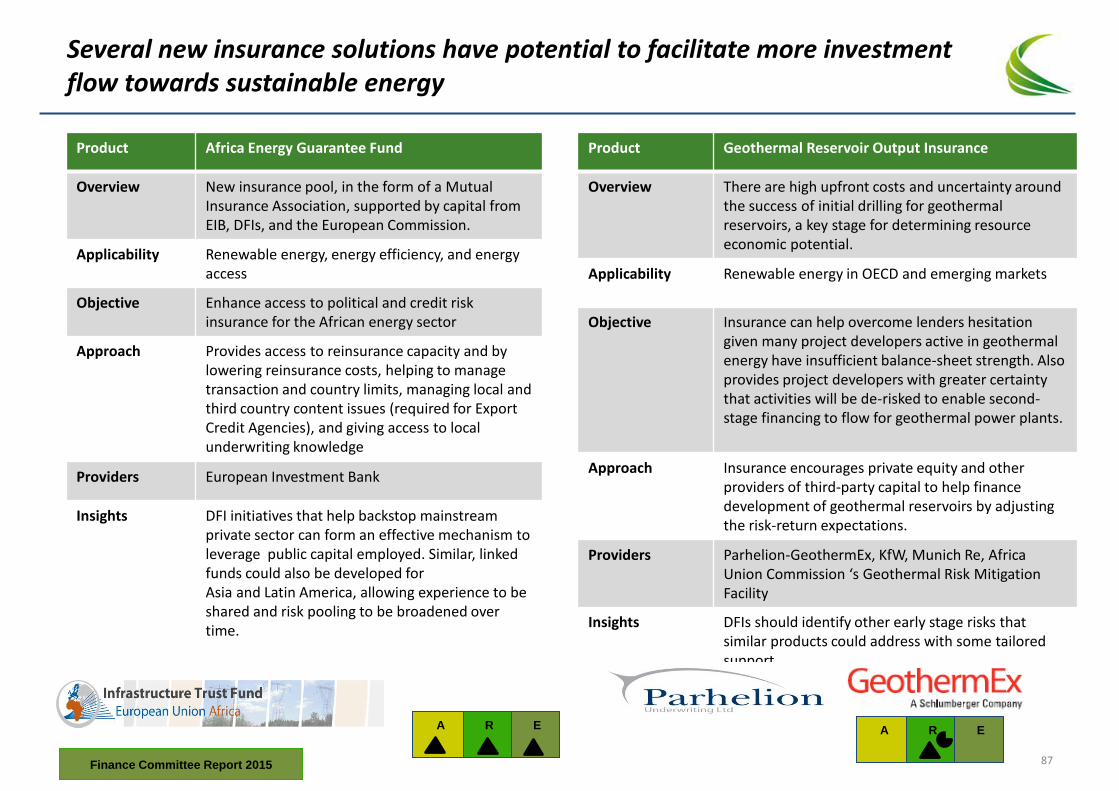
Several new insurance solutions have potential to facilitate more investment flow towards sustainable energy
Product Africa Energy Guarantee Fund
Overview New insurance pool, in the form of a Mutual Insurance Association, supported by capital from EIB, DFIs, and the European Commission.
Applicability Renewable energy, energy efficiency, and energy access
Objective Enhance access to political and credit risk insurance for the African energy sector
Approach Provides access to reinsurance capacity and by lowering reinsurance costs, helping to manage transaction and country limits, managing local and third country content issues (required for Export Credit Agencies), and giving access to local underwriting knowledge
Providers European Investment Bank
Insights DFI initiatives that help backstop mainstream private sector can form an effective mechanism to leverage public capital employed. Similar, linked funds could also be developed for Asia and Latin America, allowing experience to be shared and risk pooling to be broadened over time.
Product Geothermal Reservoir Output Insurance
Overview There are high upfront costs and uncertainty around the success of initial drilling for geothermal reservoirs, a key stage for determining resource economic potential.
Applicability Renewable energy in OECD and emerging markets
Objective Insurance can help overcome lenders hesitation given many project developers active in geothermal energy have insufficient balance-sheet strength. Also provides project developers with greater certainty that activities will be de-risked to enable second-stage financing to flow for geothermal power plants.
Approach Insurance encourages private equity and other providers of third-party capital to help finance development of geothermal reservoirs by adjusting the risk-return expectations.
Providers Parhelion-GeothermEx, KfW, Munich Re, Africa Union Commission ‘s Geothermal Risk Mitigation Facility
Insights DFIs should identify other early stage risks that similar products could address with some tailored support
A
E
R
A
E
R
Finance Committee Report 2015 87
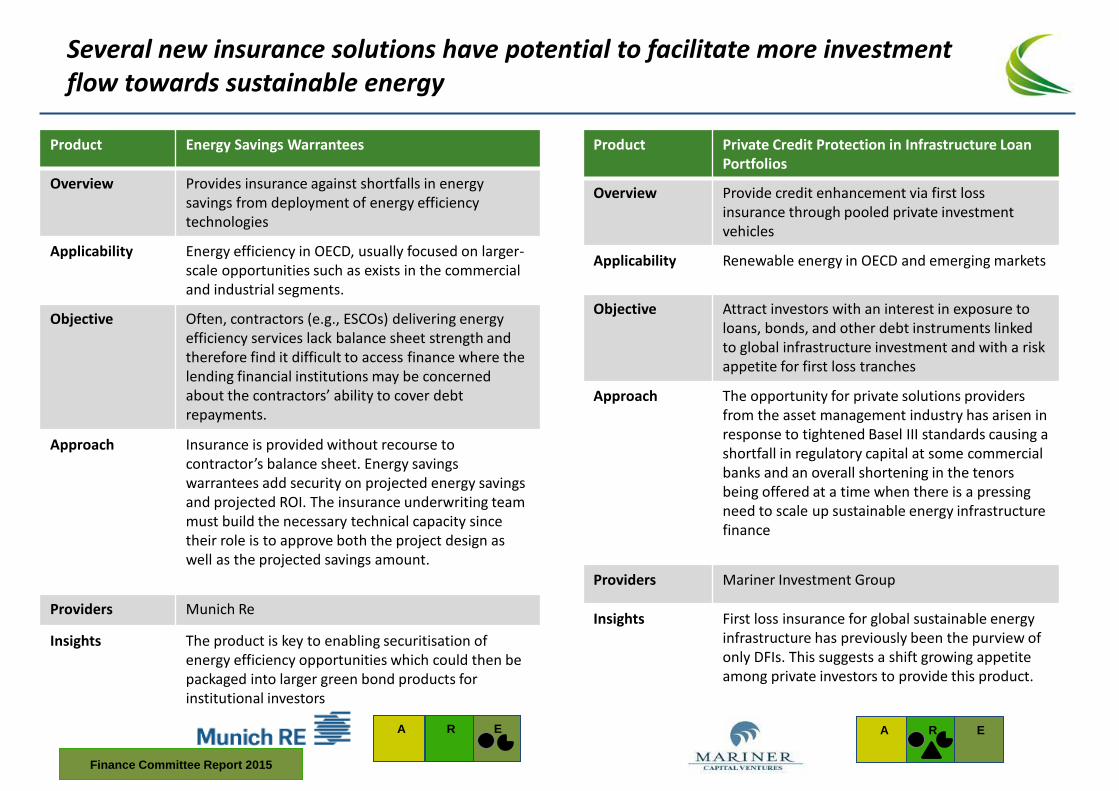
Several new insurance solutions have potential to facilitate more investment flow towards sustainable energy
Product Energy Savings Warrantees
Overview Provides insurance against shortfalls in energy savings from deployment of energy efficiency technologies
Applicability Energy efficiency in OECD, usually focused on larger-scale opportunities such as exists in the commercial and industrial segments.
Objective Often, contractors (e.g., ESCOs) delivering energy efficiency services lack balance sheet strength and therefore find it difficult to access finance where the lending financial institutions may be concerned about the contractors’ ability to cover debt repayments.
Approach Insurance is provided without recourse to contractor’s balance sheet. Energy savings warrantees add security on projected energy savings and projected ROI. The insurance underwriting team must build the necessary technical capacity since their role is to approve both the project design as well as the projected savings amount.
Providers Munich Re
Insights The product is key to enabling securitisation of energy efficiency opportunities which could then be packaged into larger green bond products for institutional investors
Product Private Credit Protection in Infrastructure Loan Portfolios
Overview Provide credit enhancement via first loss insurance through pooled private investment vehicles
Applicability Renewable energy in OECD and emerging markets
Objective Attract investors with an interest in exposure to loans, bonds, and other debt instruments linked to global infrastructure investment and with a risk appetite for first loss tranches
Approach The opportunity for private solutions providers from the asset management industry has arisen in response to tightened Basel III standards causing a shortfall in regulatory capital at some commercial banks and an overall shortening in the tenors being offered at a time when there is a pressing need to scale up sustainable energy infrastructure finance
Providers Mariner Investment Group
Insights First loss insurance for global sustainable energy infrastructure has previously been the purview of only DFIs. This suggests a shift growing appetite among private investors to provide this product.
A
E
R
A
E
R
Finance Committee Report 2015
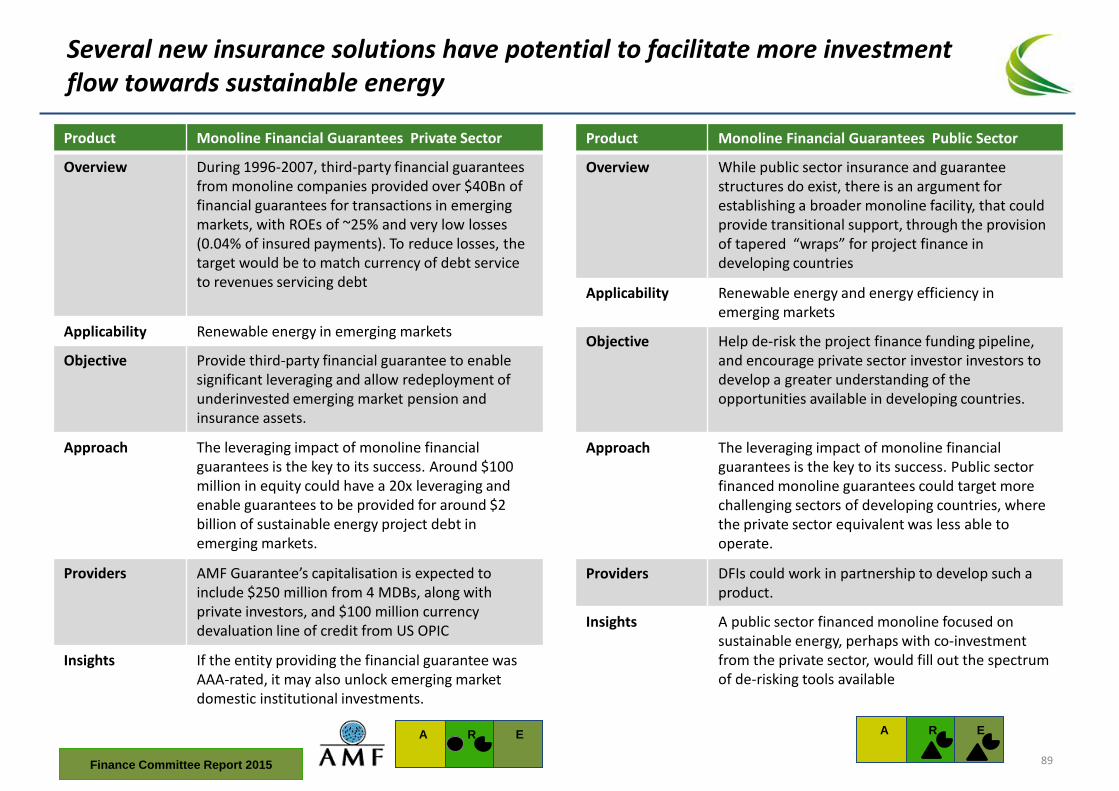
Several new insurance solutions have potential to facilitate more investment flow towards sustainable energy
Product Monoline Financial Guarantees Private Sector
Overview During 1996-2007, third-party financial guarantees from monoline companies provided over $40Bn of financial guarantees for transactions in emerging markets, with ROEs of ~25% and very low losses (0.04% of insured payments). To reduce losses, the target would be to match currency of debt service to revenues servicing debt
Applicability Renewable energy in emerging markets
Objective Provide third-party financial guarantee to enable significant leveraging and allow redeployment of underinvested emerging market pension and insurance assets.
Approach The leveraging impact of monoline financial guarantees is the key to its success. Around $100 million in equity could have a 20x leveraging and enable guarantees to be provided for around $2 billion of sustainable energy project debt in emerging markets.
Providers AMF Guarantee’s capitalisation is expected to include $250 million from 4 MDBs, along with private investors, and $100 million currency devaluation line of credit from US OPIC
Insights If the entity providing the financial guarantee was AAA-rated, it may also unlock emerging market domestic institutional investments.
Product Monoline Financial Guarantees Public Sector
Overview While public sector insurance and guarantee structures do exist, there is an argument for establishing a broader monoline facility, that could provide transitional support, through the provision of tapered “wraps” for project finance in developing countries
Applicability Renewable energy and energy efficiency in emerging markets
Objective Help de-risk the project finance funding pipeline, and encourage private sector investor investors to develop a greater understanding of the opportunities available in developing countries.
Approach The leveraging impact of monoline financial guarantees is the key to its success. Public sector financed monoline guarantees could target more challenging sectors of developing countries, where the private sector equivalent was less able to operate.
Providers DFIs could work in partnership to develop such a product.
Insights A public sector financed monoline focused on sustainable energy, perhaps with co-investment from the private sector, would fill out the spectrum of de-risking tools available
A
E
R
A
E
R
Finance Committee Report 2015 89
Thematic Area 4: Aggregating Small-Scale Opportunities to Attract Additional Finance
Finance Committee Report 2015
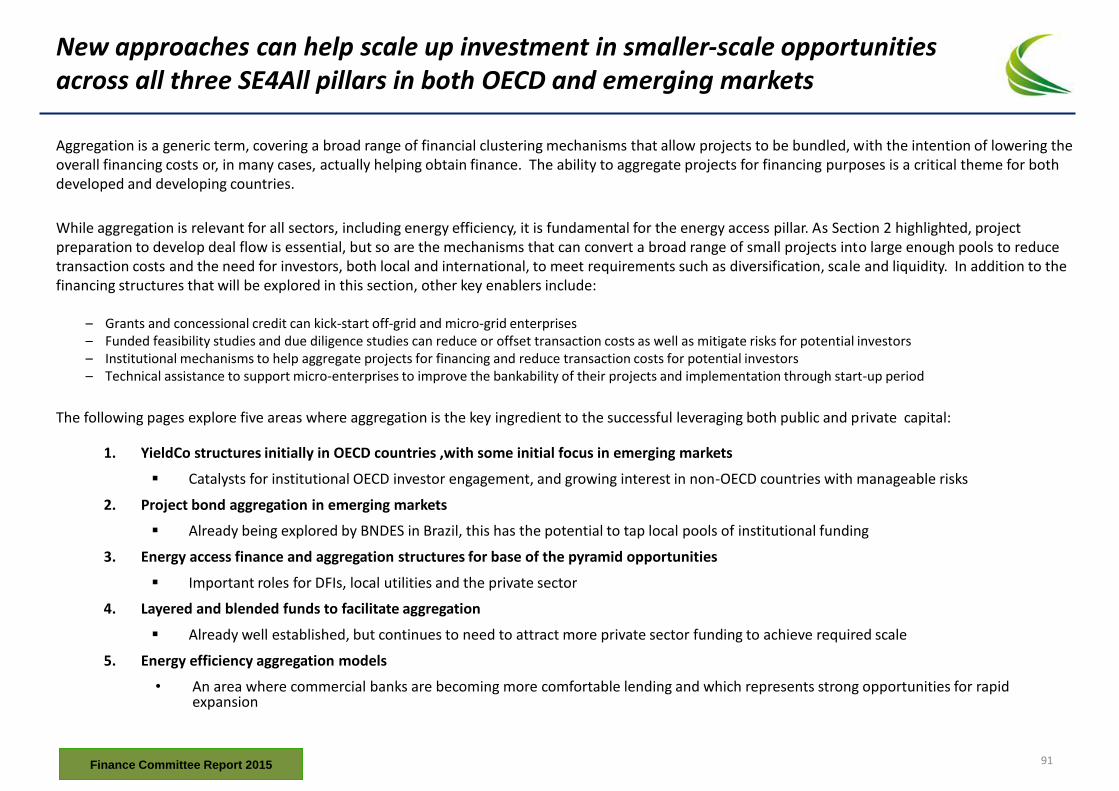
New approaches can help scale up investment in smaller-scale opportunities across all three SE4All pillars in both OECD and emerging markets
Aggregation is a generic term, covering a broad range of financial clustering mechanisms that allow projects to be bundled, with the intention of lowering the overall financing costs or, in many cases, actually helping obtain finance. The ability to aggregate projects for financing purposes is a critical theme for both developed and developing countries.
While aggregation is relevant for all sectors, including energy efficiency, it is fundamental for the energy access pillar. As Section 2 highlighted, project preparation to develop deal flow is essential, but so are the mechanisms that can convert a broad range of small projects into large enough pools to reduce transaction costs and the need for investors, both local and international, to meet requirements such as diversification, scale and liquidity. In addition to the financing structures that will be explored in this section, other key enablers include:
– Grants and concessional credit can kick-start off-grid and micro-grid enterprises – Funded feasibility studies and due diligence studies can reduce or offset transaction costs as well as mitigate risks for potential investors – Institutional mechanisms to help aggregate projects for financing and reduce transaction costs for potential investors – Technical assistance to support micro-enterprises to improve the bankability of their projects and implementation through start-up period
The following pages explore five areas where aggregation is the key ingredient to the successful leveraging both public and private capital:
1. YieldCo structures initially in OECD countries ,with some initial focus in emerging markets
Catalysts for institutional OECD investor engagement, and growing interest in non-OECD countries with manageable risks
2. Project bond aggregation in emerging markets
Already being explored by BNDES in Brazil, this has the potential to tap local pools of institutional funding
3. Energy access finance and aggregation structures for base of the pyramid opportunities
Important roles for DFIs, local utilities and the private sector
4. Layered and blended funds to facilitate aggregation
Already well established, but continues to need to attract more private sector funding to achieve required scale
5. Energy efficiency aggregation models
• An area where commercial banks are becoming more comfortable lending and which represents strong opportunities for rapid expansion
Finance Committee Report 2015 91
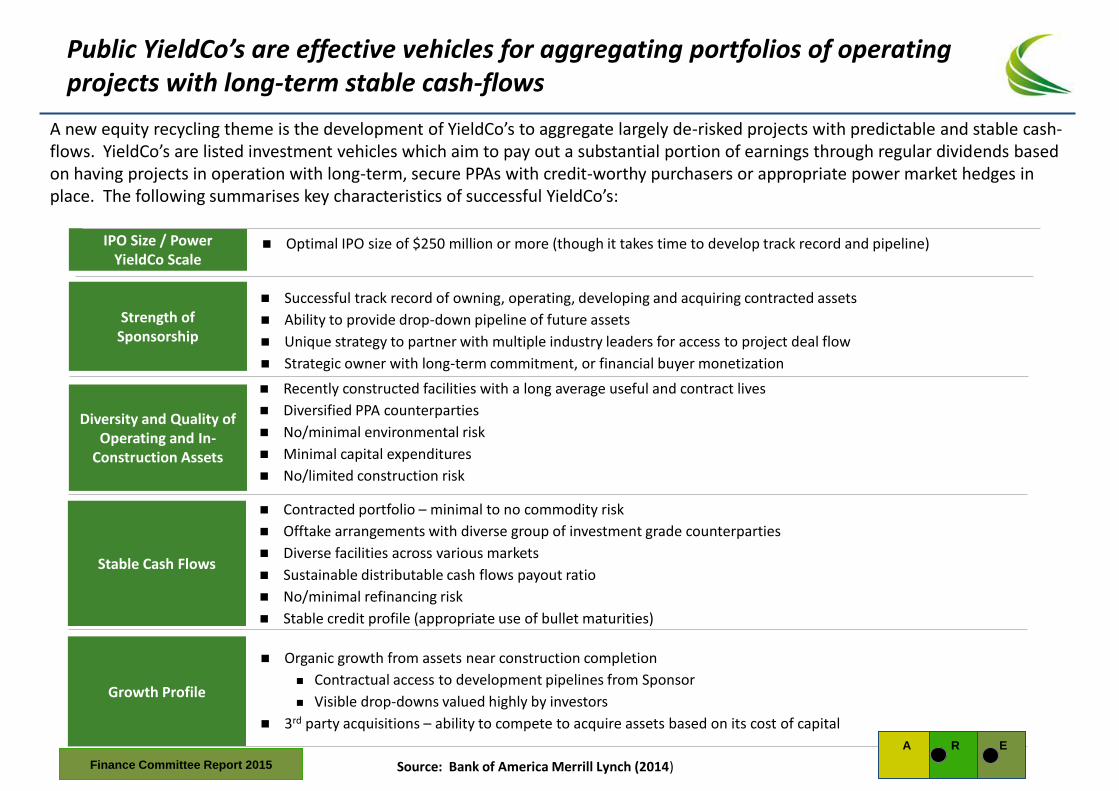
Public YieldCo’s are effective vehicles for aggregating portfolios of operating projects with long-term stable cash-flows
Strength of Sponsorship
Growth Profile
Stable Cash Flows
Diversity and Quality of Operating and In-
Construction Assets
Successful track record of owning, operating, developing and acquiring contracted assets
Ability to provide drop-down pipeline of future assets
Unique strategy to partner with multiple industry leaders for access to project deal flow
Strategic owner with long-term commitment, or financial buyer monetization
Recently constructed facilities with a long average useful and contract lives
Diversified PPA counterparties
No/minimal environmental risk
Minimal capital expenditures
No/limited construction risk
Contracted portfolio – minimal to no commodity risk
Offtake arrangements with diverse group of investment grade counterparties
Diverse facilities across various markets
Sustainable distributable cash flows payout ratio
No/minimal refinancing risk
Stable credit profile (appropriate use of bullet maturities)
Organic growth from assets near construction completion
Contractual access to development pipelines from Sponsor
Visible drop-downs valued highly by investors
3rd party acquisitions – ability to compete to acquire assets based on its cost of capital
IPO Size / Power YieldCo Scale
Optimal IPO size of $250 million or more (though it takes time to develop track record and pipeline)
Source: Bank of America Merrill Lynch (2014)
A new equity recycling theme is the development of YieldCo’s to aggregate largely de-risked projects with predictable and stable cash-flows. YieldCo’s are listed investment vehicles which aim to pay out a substantial portion of earnings through regular dividends based on having projects in operation with long-term, secure PPAs with credit-worthy purchasers or appropriate power market hedges in place. The following summarises key characteristics of successful YieldCo’s:
A
E
R
Finance Committee Report 2015
Aggregation of project bonds by pooled DFI investment clubs could help support sustainable energy infrastructure projects
In developing countries, projects are already supported by many DFIs, in terms of project preparation support, investment and credit support and other de-risking products. However, many investors need to invest in securities rather than loans, and may also want diversification and scale.
BNDES is exploring the creation of project bond aggregation structures, facilitated perhaps by groups of DFIs like the International Development Finance Club (IDFC):
• They see the commitment of development banks in improving the financial conditions of support for projects that issue bonds in the local capital market as a complementary source of long term funding. These commitments could be related to:
– Increase maturity of debt
– Constant amortization system to French system of amortization
– Leverage increase
– DSCR reduction
• All of the project guarantees would be provided by the special purpose companies to the long term lenders could be fully shared with the bondholders, without any kind of subordination
• Development banks could commit to create some investment funds that would purchase a portion of these bonds issued by entities responsible for implementing sustainable energy projects
• Institutional asset managers, pension funds, and other private investors could then acquire senior quotas issued by these funds created by the development banks. On the other hand, the development banks could remain the bondholders of the subordinated quotas, more risky, but with a greater remuneration
• In order to boost the local capital market and to make the green projects more competitive, the governments could approve some tax reduction on the capital gain related to the issuance of bonds by companies responsible for implement these project
Source: BNDES (2014) A
E
R
Finance Committee Report 2015 93
New approaches to private sector funding are also being facilitated by innovations in business models, and the introduction of aggregation models
The private sector also has a key role to play if SE4All targets are to be met, and companies targeting the $38 billion/year distributed generation opportunities in Africa like M-KOPA, Azuri, and Off-Grid Electric have attracted early stage venture capital funding.
Much of the business model innovation in emerging markets has been due to piggybacking delivery of energy solutions onto the booming adoption of mobile telephony. Mobile telephony coverage in 2013 was estimated to reach 76% of Africa in contrast to a 32% electrification rate. Research from GSMA highlights the following synergies with mobile telephony infrastructure improvements relevant for improving energy access:
• Pay-As-You-Go solutions common to the mobile telephony markets can also be transferred to the energy access market provided there is sufficient working capital, efficient distribution networks, and innovative partnerships with mobile operators to strengthen last-mile delivery of services to consumers.
• Availability of mobile financial services presents an opportunity to leverage mobile payments and mobile monitoring platforms to improve energy access by: increasing affordability, enabling connection finance, proposing smart tariffs, improving payment efficiency, and managing customer consumption.
• Telecom tower infrastructure in place and being rolled-out could be leveraged to pilot mini-grid solutions
These developments also allow the collection of high quality metrics: data about the payment patterns of clients, their energy usage etc. This, in turn is beginning to make them more able to attract funding from local banks (M-Kopa), and specialised impact investment funds (ResponsAbility), but also helps develop broader aggregation options.
The pooling tens of thousands of individual contacts with individual households or small businesses, with transparent supporting data, is a key ingredient for aggregation structures in countries like Kenya, just as has already been seen in the US residential solar market.
Aggregation is key to large scale funding for energy access, and while still very early stage, the examples overleaf represent the beginning of financing themes that are building momentum.
A
E
R
Finance Committee Report 2015
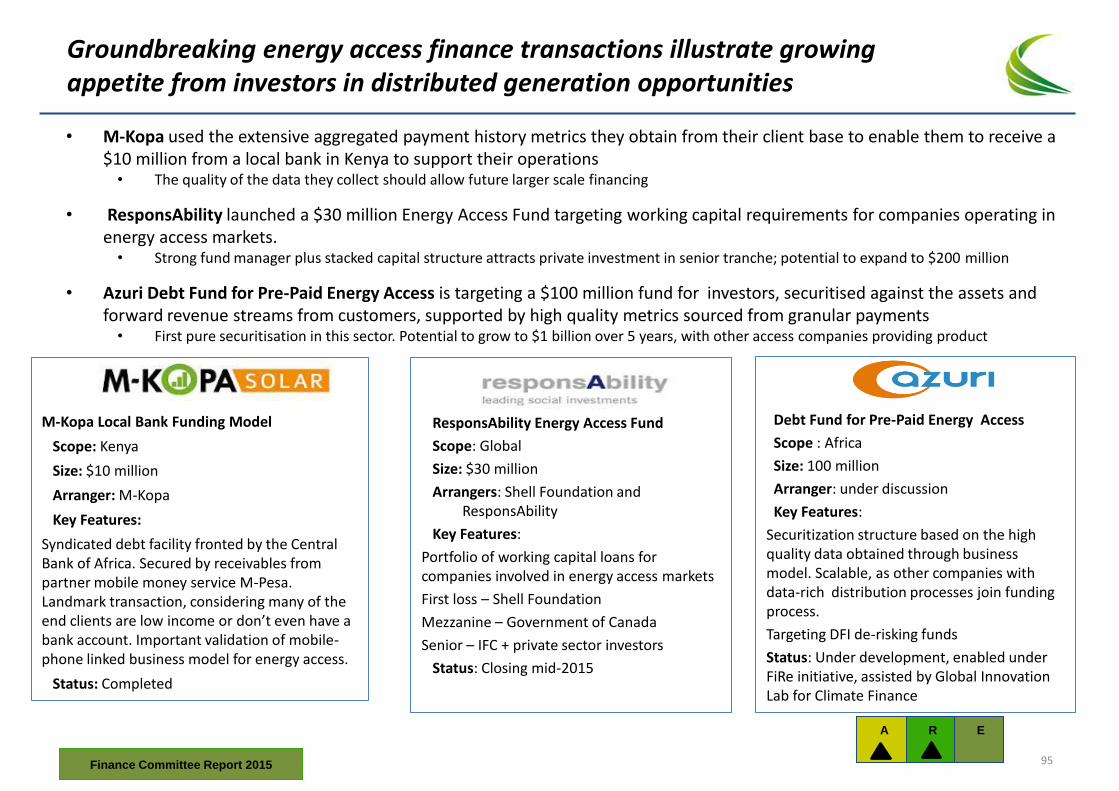
Groundbreaking energy access finance transactions illustrate growing appetite from investors in distributed generation opportunities
Debt Fund for Pre-Paid Energy Access
Scope : Africa
Size: 100 million
Arranger: under discussion
Key Features:
Securitization structure based on the high quality data obtained through business model. Scalable, as other companies with data-rich distribution processes join funding process.
Targeting DFI de-risking funds
Status: Under development, enabled under FiRe initiative, assisted by Global Innovation Lab for Climate Finance
ResponsAbility Energy Access Fund
Scope: Global
Size: $30 million
Arrangers: Shell Foundation and ResponsAbility
Key Features:
Portfolio of working capital loans for companies involved in energy access markets
First loss – Shell Foundation
Mezzanine – Government of Canada
Senior – IFC + private sector investors
Status: Closing mid-2015
• M-Kopa used the extensive aggregated payment history metrics they obtain from their client base to enable them to receive a $10 million from a local bank in Kenya to support their operations
• The quality of the data they collect should allow future larger scale financing
• ResponsAbility launched a $30 million Energy Access Fund targeting working capital requirements for companies operating in energy access markets.
• Strong fund manager plus stacked capital structure attracts private investment in senior tranche; potential to expand to $200 million
• Azuri Debt Fund for Pre-Paid Energy Access is targeting a $100 million fund for investors, securitised against the assets and forward revenue streams from customers, supported by high quality metrics sourced from granular payments
• First pure securitisation in this sector. Potential to grow to $1 billion over 5 years, with other access companies providing product
M-Kopa Local Bank Funding Model
Scope: Kenya
Size: $10 million
Arranger: M-Kopa
Key Features:
Syndicated debt facility fronted by the Central Bank of Africa. Secured by receivables from partner mobile money service M-Pesa. Landmark transaction, considering many of the end clients are low income or don’t even have a bank account. Important validation of mobile-phone linked business model for energy access.
Status: Completed
A
E
R
Finance Committee Report 2015 95
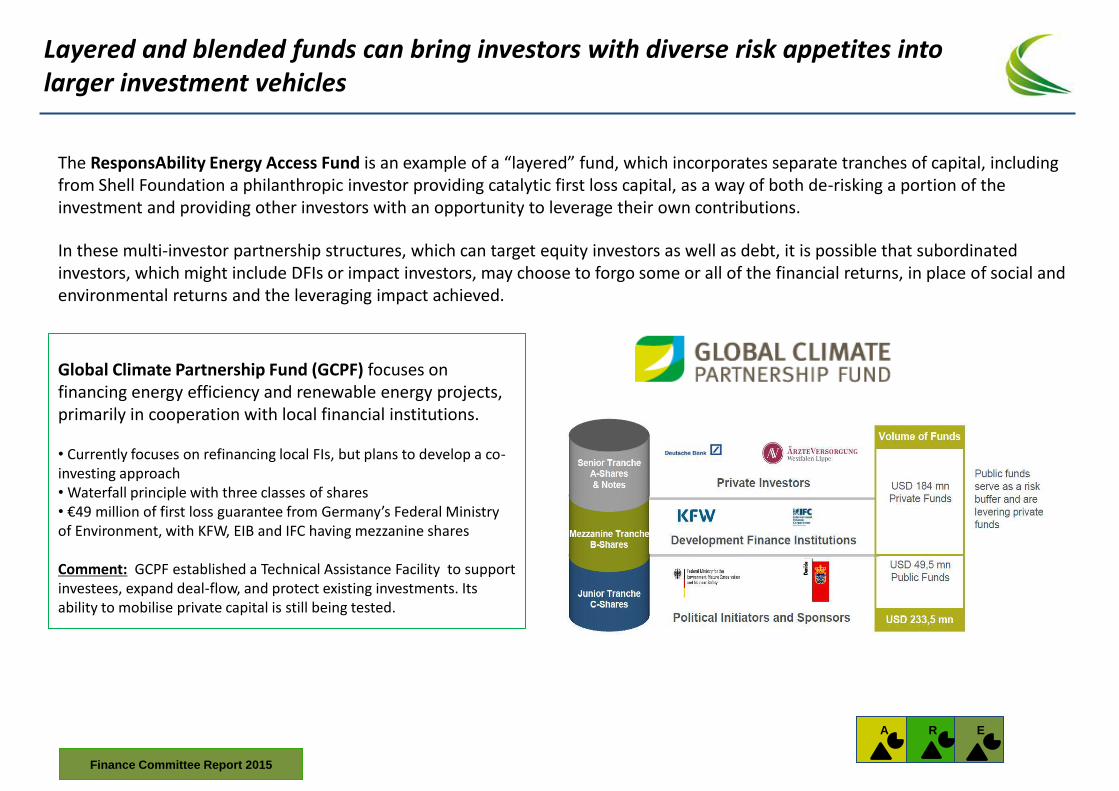
Layered and blended funds can bring investors with diverse risk appetites into larger investment vehicles
The ResponsAbility Energy Access Fund is an example of a “layered” fund, which incorporates separate tranches of capital, including from Shell Foundation a philanthropic investor providing catalytic first loss capital, as a way of both de-risking a portion of the investment and providing other investors with an opportunity to leverage their own contributions.
In these multi-investor partnership structures, which can target equity investors as well as debt, it is possible that subordinated investors, which might include DFIs or impact investors, may choose to forgo some or all of the financial returns, in place of social and environmental returns and the leveraging impact achieved.
Global Climate Partnership Fund (GCPF) focuses on financing energy efficiency and renewable energy projects, primarily in cooperation with local financial institutions. • Currently focuses on refinancing local FIs, but plans to develop a co-investing approach • Waterfall principle with three classes of shares • €49 million of first loss guarantee from Germany’s Federal Ministry of Environment, with KFW, EIB and IFC having mezzanine shares
Comment: GCPF established a Technical Assistance Facility to support investees, expand deal-flow, and protect existing investments. Its ability to mobilise private capital is still being tested.
A
E
R
Finance Committee Report 2015
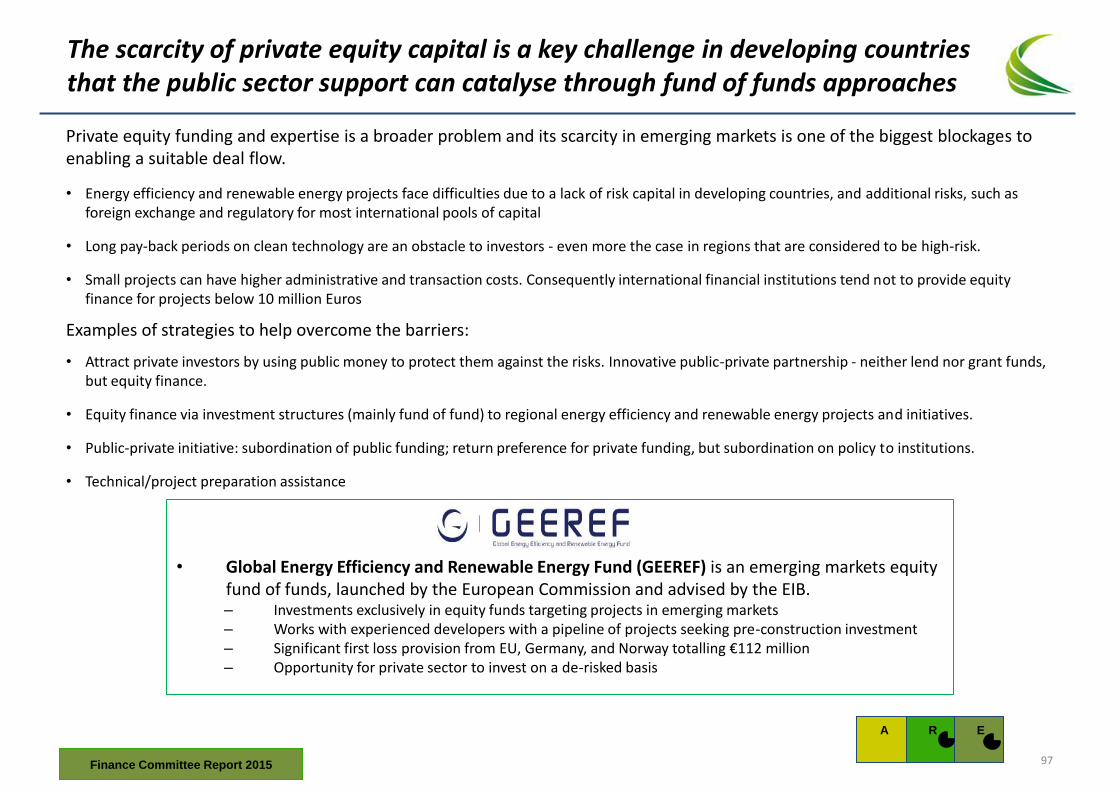
The scarcity of private equity capital is a key challenge in developing countries that the public sector support can catalyse through fund of funds approaches
• Global Energy Efficiency and Renewable Energy Fund (GEEREF) is an emerging markets equity fund of funds, launched by the European Commission and advised by the EIB. – Investments exclusively in equity funds targeting projects in emerging markets – Works with experienced developers with a pipeline of projects seeking pre-construction investment – Significant first loss provision from EU, Germany, and Norway totalling €112 million – Opportunity for private sector to invest on a de-risked basis
Private equity funding and expertise is a broader problem and its scarcity in emerging markets is one of the biggest blockages to enabling a suitable deal flow.
• Energy efficiency and renewable energy projects face difficulties due to a lack of risk capital in developing countries, and additional risks, such as foreign exchange and regulatory for most international pools of capital
• Long pay-back periods on clean technology are an obstacle to investors - even more the case in regions that are considered to be high-risk.
• Small projects can have higher administrative and transaction costs. Consequently international financial institutions tend not to provide equity finance for projects below 10 million Euros
Examples of strategies to help overcome the barriers:
• Attract private investors by using public money to protect them against the risks. Innovative public-private partnership - neither lend nor grant funds, but equity finance.
• Equity finance via investment structures (mainly fund of fund) to regional energy efficiency and renewable energy projects and initiatives.
• Public-private initiative: subordination of public funding; return preference for private funding, but subordination on policy to institutions.
• Technical/project preparation assistance
A
E
R
Finance Committee Report 2015 97
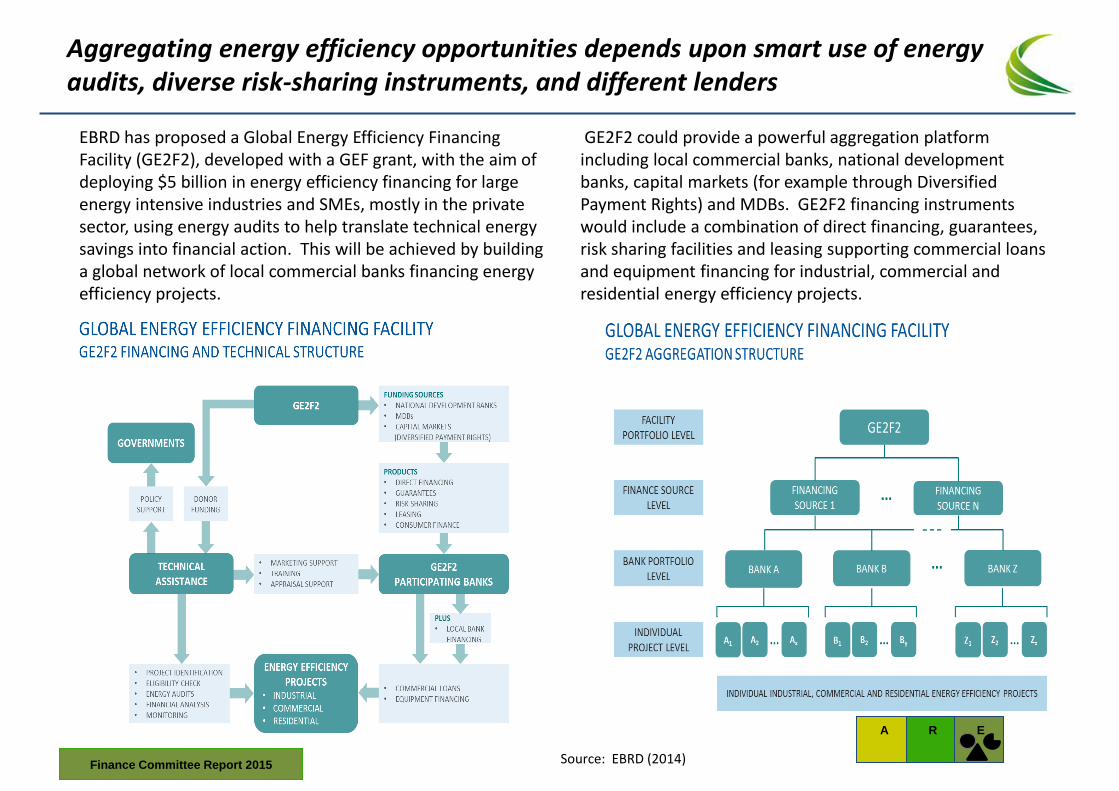
Aggregating energy efficiency opportunities depends upon smart use of energy audits, diverse risk-sharing instruments, and different lenders
EBRD has proposed a Global Energy Efficiency Financing Facility (GE2F2), developed with a GEF grant, with the aim of deploying $5 billion in energy efficiency financing for large energy intensive industries and SMEs, mostly in the private sector, using energy audits to help translate technical energy savings into financial action. This will be achieved by building a global network of local commercial banks financing energy efficiency projects.
GE2F2 could provide a powerful aggregation platform including local commercial banks, national development banks, capital markets (for example through Diversified Payment Rights) and MDBs. GE2F2 financing instruments would include a combination of direct financing, guarantees, risk sharing facilities and leasing supporting commercial loans and equipment financing for industrial, commercial and residential energy efficiency projects.
Source: EBRD (2014)
A
E
R
Finance Committee Report 2015
SECTION 4. Recommendations
Finance Committee Report 2015 99
Recommendations: Overview
This presentation has highlighted three key conditions that will need to be in place in order to meet the SE4All objectives:
• Countries will need to be ready and able to (a) absorb large amounts of capital by increasing implementation capacity and (b) putting enabling investment environment in place
• A pipeline of bankable projects needs to be effectively deployed
• Capital with a suitable risk appetite must be available and willing to be deployed given the nature of investment opportunities.
Recommendations are organized into two sections:
• First, we highlight opportunities for both public and private sector stakeholders in sustainable energy to commit to actions that would catalyze progress:
Public sector
– DFIs and other public finance
– Financial regulators
– Developing country governments
Private sector
– Power utilities in developing countries
– Companies involved in sustainable energy
– Investors interested in increasing their exposure to sustainable energy
• Second, we propose some actionable next steps for SE4All to consider taking forward
This section presents high level recommendations. It is hoped that some governments, DFIs, investors, and CSOs would volunteer to implement one or more of these recommendations.
Finance Committee Report 2015
Recommendations: possible commitments from public sector
• Public finance from MDBs and other DFIs, including the IDFC:
– Systematically deploy de-risking instruments to target specific barriers faced by investors preventing mobilisation of private funds for sustainable energy
• Greater use of catalytic first loss capital will help to de-risk opportunities for institutional investors interested in exposure to emerging markets. New public funds such as the Green Climate Fund, with its Private Sector Facility and $10.2 billion in committed funds for its first round of funding, could have a significant role in piloting innovative instruments for sustainable energy in emerging markets that can lever in large flows of private capital
• Note that this type of support from MDBs could include a tapering element to allow the market to mature
• Guarantee or insurance structures to backstop PPA and off-take agreements provided by state owned utilities
– Explore setting up a dedicated facility to facilitate investors’ long-term hedging of non-G20 foreign exchange • Foreign exchange risk is widely cited by investors as a deterrent to investment in emerging markets. The Global
Innovation Lab on Climate Finance is developing a potential solution with MDB, DFI, and investor involvement
– DFIs should consider leveraging their balance sheet, portfolio, and project finance and use new approaches to expand their borrowers’ capacity to provide sovereign guarantees.
• If the investment gaps are to be bridged more rapidly, there is a need for faster evolution in the business models used by DFIs, including the much more targeted use of public finance instruments, largely already available, that can help de-risk opportunities for institutional investors
• DFIs should provide a detailed inventory of all existing public-private structures currently being used to develop a full suite of design possibilities for risk-sharing approaches
• Financial regulators:
– Consider reviewing Basel III and Solvency II to lower the cost of capital for sustainable energy investments • UNEP’s Inquiry into the Design of a Sustainable Financial System should explore in detail the potential barriers to
investments in sustainable energy posed by Basle III and Solvency II regulations
• Recommendations from UNEP’s Inquiry may assist in unblocking any barriers from the unanticipated consequences of financial regulation
A
B
Finance Committee Report 2015 101
Recommendations: possible commitments from public sector
• Developing country governments focused on attracting on-grid investments:
– Improve public governance to enable power utilities to reduce technical and commercial losses, improve bill collection, make subsidy for the poor better targeted and transparent, gradually adjust tariffs and fund the gap until tariffs reach efficient-cost recovery level.
– Improve corporate governance of state-owned power utilities, skills and incentives of employees, and technical and commercial capacity of the power utilities.
– For a large pipeline of similar projects, create a special purpose company to develop and spin-off projects for private sector financing.
• Developing country governments focused on attracting off-grid and micro-grid investments:
– Enable development of robust aggregation mechanisms for base-of-pyramid projects to encourage investment and financing decisions.
– For small scale projects, provide capacity building support to both private sector investors and investee companies for coaching and mentoring incubation services to improve design and development of projects for access; similar approaches would also be useful for small scale renewables and energy efficiency.
– Reduce costs of technical assessment, contract negotiations, environmental assessments through standardisation of contracts and processes. Encourage seed capital, along with private equity, to defray these costs.
– Through transparent policies and regulation support convergence of telecom, energy services and mobile financial services and create fertile environment for innovative business models to reach the last mile consumers.
– Promote standardised PPA and other contracts for greater ease in pooling in multiple sub-sectors: solar leases, wind energy loans, energy efficiency performance contracts.
– Create development bank-supported aggregation vehicles in regions with under-developed capital markets and highly fragmented investments.
C
D
Finance Committee Report 2015
Recommendations: possible commitments from private sector
• Power Utilities in Emerging Markets:
– Power utilities need to play an important role in scaling up and accelerating access and facilitating financing of small scale
projects for which they should:
• Prepare system expansion plan that provides information on strategy and spatial plans of
– (i) grid extension in the next 3 to 4 years, (ii) areas open to off-grid service providers
– intermediate areas where grid may be extended within a period that is less than necessary for amortization of off-
grid investments
• Establish a policy of compensation to the micro-grid owner for unamortized assets if micro-grid is integrated into the grid
• Set clear technical standards for micro-grids for future integration into grid
• Deploy distributed energy technologies (micro-or-off-grid) to advance rural electrification
• Use innovative business models and create new products and services to improve energy affordability among low-income
populations
• Leverage existing infrastructure to advance urban and semi-urban electrification efforts
• Increase adoption of smart grid technologies to increase absorption of renewables and increase efficiency
• Companies involved in sustainable energy businesses should explore issuance of green bonds to help tap into increased
investor appetite for debt instruments that meet a high quality green standard.
– Issuers should ensure consistency with the Green Bond Principles to accelerate standardisation in the market-place.
– The FiRe work related to green bonds should continue to be a complementary locus of activity for these efforts, including the
focus on developing new Green Bond Indexes to enhance market liquidity so as to attract a broader array of investors
E
F
Finance Committee Report 2015 103
Recommendations: possible commitments from private sector
• Impact investors focused on energy access opportunities:
– Collaborate to create a larger investment platforms for scaling up efforts in energy access
• There is significant interest in energy access as an impact investment theme and an opportunity to scale-up investment by providing growth capital to the many new private enterprises focused on base-of-pyramid, off-grid market opportunities including in lighting and clean cooking.
• Fund managers and financial intermediaries could assist by developing structures that blend funds to create larger and more diversified pools of capital including from impact investors, DFIs, and other investors with different risk/return expectations.
• Many purely private fund structures might get financed faster and have more scale, with an element of first loss provision.
• Develop partnerships among Foundations and other philanthropic capital to share experience and expertise around the provision of catalytic first loss capital and support for project preparation to enable more deal flow for access projects.
• Institutional investors focused on large-scale sustainable energy opportunities:
– Deepen dialogue with private financial intermediaries and DFIs on potential risk-sharing structures
• The SE4All Finance Committee work has enabled considerable constructive dialogue among DFIs, private financial
intermediaries, and interested investors on possible approaches and structures for risk-sharing to enable upgrading the
quality of investment opportunities.
• The next phase of analysis will require a deeper dive by investors to examine key parameters key to any transaction, such
as the level of risk mitigation and credit enhancement support required to adequately cover risk premiums.
• The objective should be to develop some pilot transactions validating the commercial viability of the structures identified
in the report.
G
H
Finance Committee Report 2015
Recommendations: next steps for SE4All
• Work with local and international interested stakeholders to establish a Project Development Fund (PDF) to support investments identified as having high potential
– A dedicated PDF, managed by DFIs/Countries/Local institutions, could enable investment in public, private and PPP infrastructure and pipeline flow
– Three tiers of activities:
• Tier One: Grant funds for scoping and preparatory work.
• Tier Two: For sector policy, planning, market structure; organizational transformation and capacity development of state-owned power utilities and government agencies, instrument design; project structuring and final stages of project preparation. Grant, with possible cost-sharing for higher income countries.
• Tier Three: For full project preparation; feasibility studies; and joint upstream-downstream sectoral reform and pipeline development. Higher level of cost sharing, with cost recovery in case of private sector project uptake perhaps through revolving fund structure.
• Establish metrics within SE4All’s existing Global Tracking Framework to track progress of PDF in helping to catalyse the proposed incremental $120 billion investment by focusing on the four investment themes identified in the report
– Metrics will be key to evaluating performance, identifying potential impediments, and putting in place to continuously review experiences with new financing structures to examine what modifications might be needed to succeed in different countries, given differing environments and risks, or to attract specific new investors, given their risk and return preferences.
• Create a forum to share experience on how public sector utilities in emerging markets can be catalyzed to accelerate their focus on clean energy and energy access
– A forum, in collaboration with existing platforms, could provide a strong platform for utilities and other stakeholders to collaborate to catalyse progress on the three pillars of SE4All.
– Content should include a focus on emerging ideas for improving creditworthiness of state-owned utilities – e.g., the Africa Green Regional Energy Efficient New and Creditworthy Offtaker (Africa GreenCo) should be examined for viability
I
J
K
Finance Committee Report 2015 105
Annex: Supporting Materials
Finance Committee Report 2015
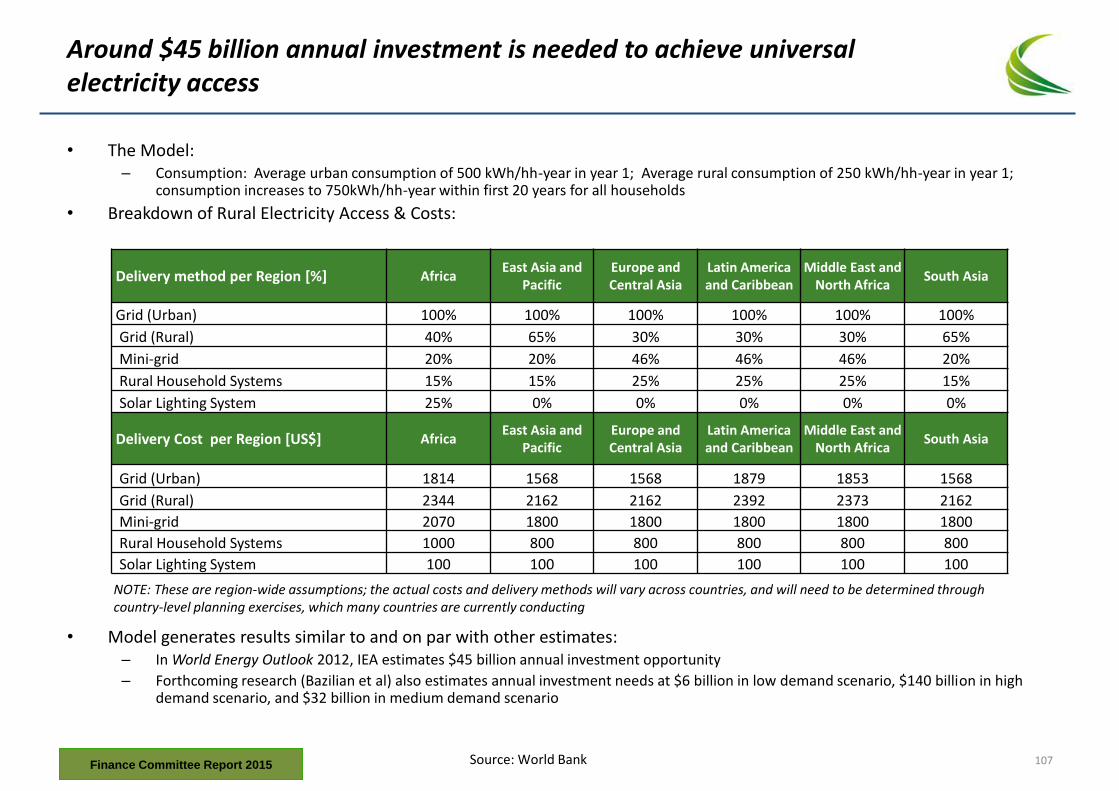
Around $45 billion annual investment is needed to achieve universal electricity access
• The Model: – Consumption: Average urban consumption of 500 kWh/hh-year in year 1; Average rural consumption of 250 kWh/hh-year in year 1;
consumption increases to 750kWh/hh-year within first 20 years for all households
• Breakdown of Rural Electricity Access & Costs:
• Model generates results similar to and on par with other estimates: – In World Energy Outlook 2012, IEA estimates $45 billion annual investment opportunity
– Forthcoming research (Bazilian et al) also estimates annual investment needs at $6 billion in low demand scenario, $140 billion in high demand scenario, and $32 billion in medium demand scenario
Delivery method per Region [%] Africa East Asia and
Pacific Europe and Central Asia
Latin America and Caribbean
Middle East and North Africa
South Asia
Grid (Urban) 100% 100% 100% 100% 100% 100%
Grid (Rural) 40% 65% 30% 30% 30% 65%
Mini-grid 20% 20% 46% 46% 46% 20%
Rural Household Systems 15% 15% 25% 25% 25% 15%
Solar Lighting System 25% 0% 0% 0% 0% 0%
Delivery Cost per Region [US$] Africa East Asia and
Pacific Europe and Central Asia
Latin America and Caribbean
Middle East and North Africa
South Asia
Grid (Urban) 1814 1568 1568 1879 1853 1568
Grid (Rural) 2344 2162 2162 2392 2373 2162
Mini-grid 2070 1800 1800 1800 1800 1800
Rural Household Systems 1000 800 800 800 800 800
Solar Lighting System 100 100 100 100 100 100
Source: World Bank
NOTE: These are region-wide assumptions; the actual costs and delivery methods will vary across countries, and will need to be determined through country-level planning exercises, which many countries are currently conducting
Finance Committee Report 2015 107
Before deciding to structure a project as a concession or PPP, governments need to assess whether these options are a good use of resources
Project appraisal means an assessment of whether or not to develop the project, and to implement it as a concession or a PPP
Project appraisal criteria:
• Feasibility and economic viability of the project — whether the underlying project makes sense, irrespective of the procurement mode. First, this means confirming that the project is central to policy priorities and sector and infrastructure plans. It then involves feasibility studies to check if the project is possible, and economic appraisal to check if the project is cost-benefit justified, and the least-cost approach to delivering the expected benefits. This appraisal may be carried out prior to identifying the project as a possible concession or PPP, or as part of the concession or PPP development process.
• Commercial viability — whether the project is likely to be able to attract good-quality sponsors and lenders by providing robust and reasonable financial returns. This is subsequently confirmed through the tender process.
• Value for money — whether developing the project as the proposed concession or PPP can be expected to best achieve value for money, compared to the other options. This can include comparing against the alternative of public procurement (where that would be an option). It can also include comparing against other possible concession structures, to check that the proposed structure provides the best value (for example that risks have been allocated optimally).
• Fiscal responsibility — whether the project’s overall revenue requirements are within the capacity of users, the public authority, or both, to pay for the infrastructure service. This involves checking the fiscal cost of the project — both in terms of regular payments, and fiscal risk — and establishing whether this can be accommodated within prudent budget and other fiscal constraints.
Source: PPP Reference Guide Version 2.0 – World Bank Group, PPIAF, ADB, IDB and Multilateral Investment Fund Finance Committee Report 2015
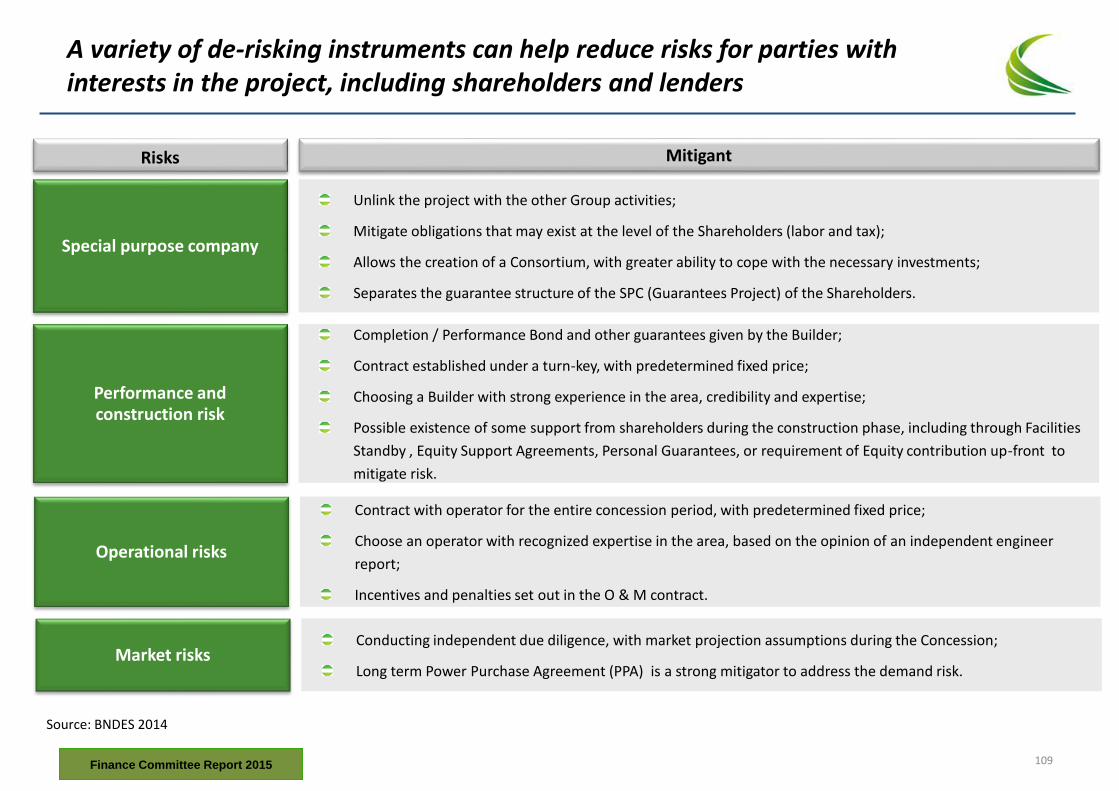
A variety of de-risking instruments can help reduce risks for parties with interests in the project, including shareholders and lenders
Risks Mitigant
Special purpose company
Unlink the project with the other Group activities;
Mitigate obligations that may exist at the level of the Shareholders (labor and tax);
Allows the creation of a Consortium, with greater ability to cope with the necessary investments;
Separates the guarantee structure of the SPC (Guarantees Project) of the Shareholders.
Performance and construction risk
Completion / Performance Bond and other guarantees given by the Builder;
Contract established under a turn-key, with predetermined fixed price;
Choosing a Builder with strong experience in the area, credibility and expertise;
Possible existence of some support from shareholders during the construction phase, including through Facilities
Standby , Equity Support Agreements, Personal Guarantees, or requirement of Equity contribution up-front to
mitigate risk.
Operational risks
Contract with operator for the entire concession period, with predetermined fixed price;
Choose an operator with recognized expertise in the area, based on the opinion of an independent engineer
report;
Incentives and penalties set out in the O & M contract.
Market risks Conducting independent due diligence, with market projection assumptions during the Concession;
Long term Power Purchase Agreement (PPA) is a strong mitigator to address the demand risk.
Source: BNDES 2014
Finance Committee Report 2015 109
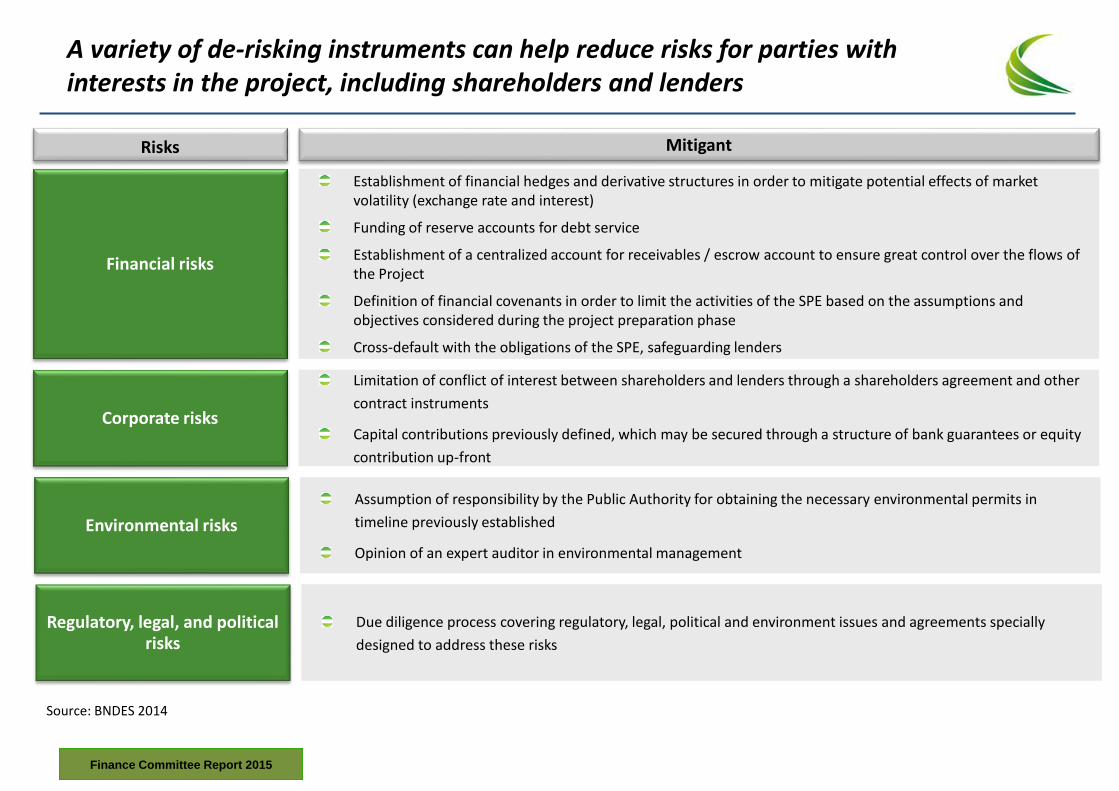
Risks Mitigant
Financial risks
Establishment of financial hedges and derivative structures in order to mitigate potential effects of market volatility (exchange rate and interest)
Funding of reserve accounts for debt service
Establishment of a centralized account for receivables / escrow account to ensure great control over the flows of the Project
Definition of financial covenants in order to limit the activities of the SPE based on the assumptions and objectives considered during the project preparation phase
Cross-default with the obligations of the SPE, safeguarding lenders
Corporate risks
Limitation of conflict of interest between shareholders and lenders through a shareholders agreement and other
contract instruments
Capital contributions previously defined, which may be secured through a structure of bank guarantees or equity
contribution up-front
Environmental risks
Assumption of responsibility by the Public Authority for obtaining the necessary environmental permits in
timeline previously established
Opinion of an expert auditor in environmental management
Regulatory, legal, and political risks
Due diligence process covering regulatory, legal, political and environment issues and agreements specially
designed to address these risks
Source: BNDES 2014
A variety of de-risking instruments can help reduce risks for parties with interests in the project, including shareholders and lenders
Finance Committee Report 2015
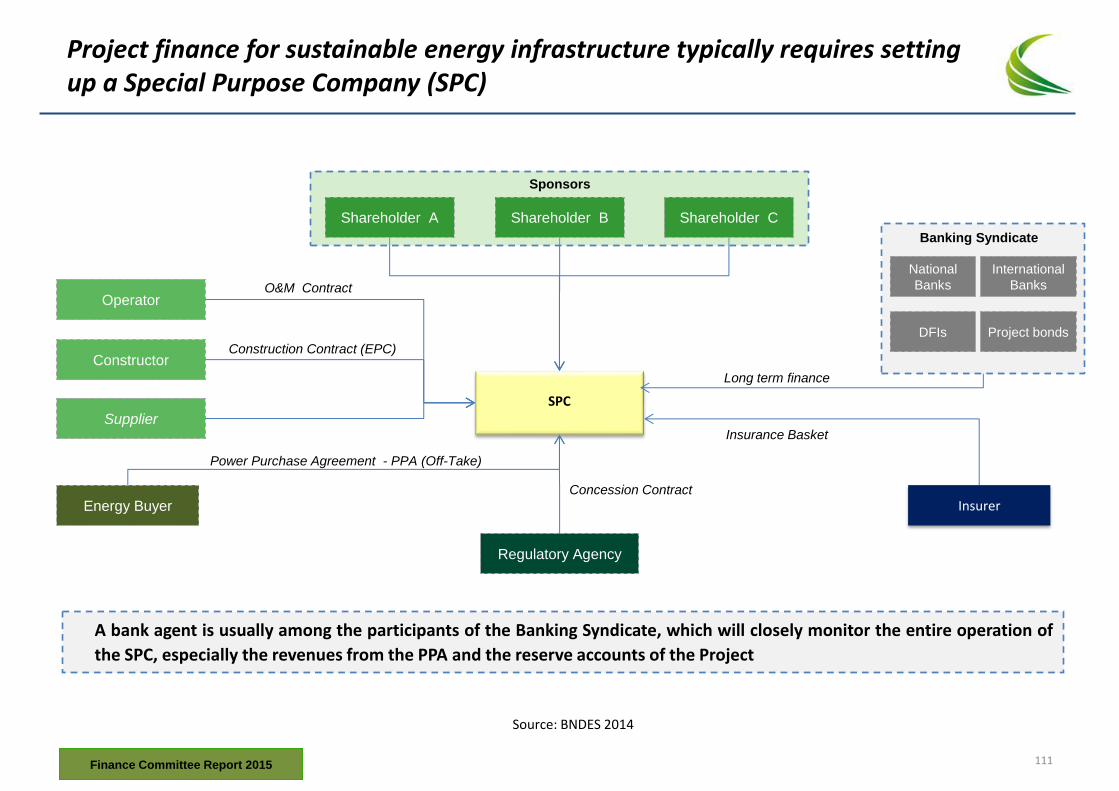
Project finance for sustainable energy infrastructure typically requires setting up a Special Purpose Company (SPC)
SPC
Banking Syndicate
DFIs
National
Banks
Long term finance
Constructor
Operator
Regulatory Agency
Construction Contract (EPC)
Concession Contract
Project bonds
International
Banks
Shareholder B Shareholder A Shareholder C
Sponsors
Insurer
Insurance Basket Supplier
O&M Contract
A bank agent is usually among the participants of the Banking Syndicate, which will closely monitor the entire operation of
the SPC, especially the revenues from the PPA and the reserve accounts of the Project
Energy Buyer
Power Purchase Agreement - PPA (Off-Take)
Source: BNDES 2014
Finance Committee Report 2015 111
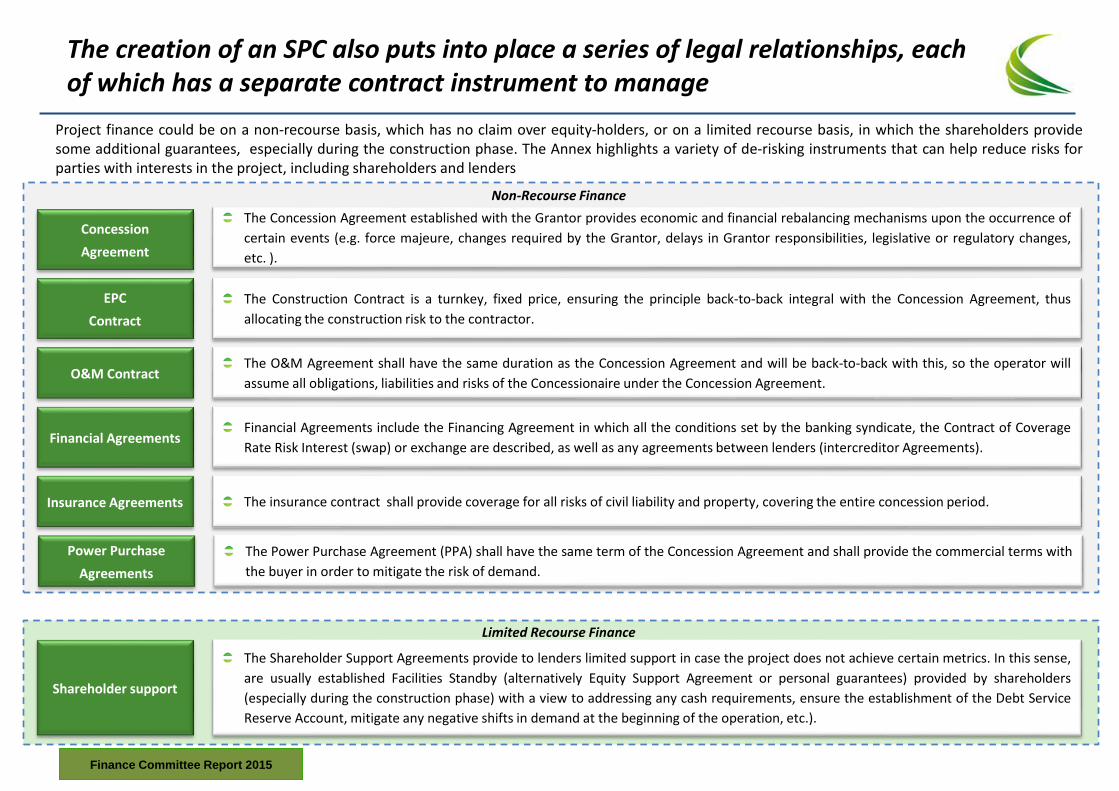
The creation of an SPC also puts into place a series of legal relationships, each of which has a separate contract instrument to manage
Concession
Agreement
The Concession Agreement established with the Grantor provides economic and financial rebalancing mechanisms upon the occurrence of
certain events (e.g. force majeure, changes required by the Grantor, delays in Grantor responsibilities, legislative or regulatory changes,
etc. ).
Project finance could be on a non-recourse basis, which has no claim over equity-holders, or on a limited recourse basis, in which the shareholders provide some additional guarantees, especially during the construction phase. The Annex highlights a variety of de-risking instruments that can help reduce risks for parties with interests in the project, including shareholders and lenders
EPC
Contract
The Construction Contract is a turnkey, fixed price, ensuring the principle back-to-back integral with the Concession Agreement, thus
allocating the construction risk to the contractor.
O&M Contract The O&M Agreement shall have the same duration as the Concession Agreement and will be back-to-back with this, so the operator will
assume all obligations, liabilities and risks of the Concessionaire under the Concession Agreement.
Financial Agreements Financial Agreements include the Financing Agreement in which all the conditions set by the banking syndicate, the Contract of Coverage
Rate Risk Interest (swap) or exchange are described, as well as any agreements between lenders (intercreditor Agreements).
Insurance Agreements The insurance contract shall provide coverage for all risks of civil liability and property, covering the entire concession period.
Shareholder support
The Shareholder Support Agreements provide to lenders limited support in case the project does not achieve certain metrics. In this sense,
are usually established Facilities Standby (alternatively Equity Support Agreement or personal guarantees) provided by shareholders
(especially during the construction phase) with a view to addressing any cash requirements, ensure the establishment of the Debt Service
Reserve Account, mitigate any negative shifts in demand at the beginning of the operation, etc.).
Non-Recourse Finance
Limited Recourse Finance
Power Purchase
Agreements
The Power Purchase Agreement (PPA) shall have the same term of the Concession Agreement and shall provide the commercial terms with
the buyer in order to mitigate the risk of demand.
Source: BNDES 2014 Finance Committee Report 2015
Overview of the Green Bond Principles
The Green Bond Principles (GBP) were developed with guidance from issuers, investors and environmental groups and serve as voluntary guidelines on recommended process for the development and issuance of Green Bonds. They encourage transparency, disclosure and integrity in the development of the Green Bond market.
They suggest process for designating, disclosing, managing and reporting on the proceeds of a Green Bond. They are designed to provide issuers with guidance on the key components involved in launching a Green Bond, to aid investors by ensuring the availability of information necessary to evaluate the environmental impact of their Green Bond investments and to assist underwriters by moving the market towards standard disclosures which facilitate transactions. From April 2014, the International Capital Markets Association (ICMA) serves as Secretariat assuming administrative duties as well as providing guidance for governance of the GBP.
Overview
The Use of Proceeds
The issuer should declare the eligible Green Project categories (including types of investments made indirectly through financial intermediaries) in the Use of Proceeds section of the legal documentation for the security
The GBP recommend that all designated Green Project categories provide clear environmental benefits that can be described and, where feasible, quantified and/or assessed
The Process for Project Evaluation and Selection
The issuer of a Green Bond should outline the investment decision-making process it follows to determine the eligibility of an individual investment using Green Bond proceeds
A process review should determine and document an investment’s eligibility within the Issuer’s stated eligible Green Project categories
Management of Proceeds
The net proceeds should be moved to a sub-portfolio or otherwise tracked by the issuer and attested by a formal internal process that will be linked to the issuers’ lending and investment operations in Eligible Projects
The management process to be followed by the issuer for tracking the proceeds should be clearly and publicly disclosed
Reporting
In addition to reporting on the Use of Proceeds and the eligible investments for unallocated proceeds, issuers should report at least Annually, if not Semi-Annually, via newsletters, website updates or filed financial reports on the specific investments made from the Green Bond proceeds, detailing wherever possible the specific project and the amounts invested in the project
The GBP recommend the use of quantitative and/or qualitative performance indicators which measure, where feasible, the impact of the specific investments (e.g. reductions in greenhouse gas emissions, number of people provided with access to sustainable power or sustainable water, or avoided vehicle miles travelled, etc.)
Finance Committee Report 2015 113
Members of Sustainable Energy for All Finance Committee
Co-Chair: Luciano Coutinho, Brazilian Development Bank
Co-Chair: Purna Saggurti, Bank of America Merrill Lynch
SE4All - GFT Focal Point: Mohinder Gulati
Supporting Orgs.: World Bank, BAML, BNDES
1. Gyan Acharya, UNHRLLS
2. Sultan Al Jaber, United Arab Emirates
3. Suleiman Jasir Al-Herbish, OFID
4. Mustapha Bakkoury, Moroccan Solar Power Agency
5. Jim Barry, Blackstone Group
6. Michael Eckhart, Citigroup
7. Naoko Ishii, Global Environment Facility
8. Donald Kaberuka, African Development Bank
9. Lutaf Kassam, Industrial Promotion Services Limited
10. Kyung-Ah Park, Goldman Sachs
11. Michael Liebreich, BNEF
12 Strive Masiyiwa, Carbon War Room
13. Joan McNaughton, World Energy Council Energy Trilemma
14. Luis Alberto Moreno, IADB
15. Takehiko Nakao, Asian Development Bank
16. Robert Ichord, US State Department
17. Carter Roberts, WWF USA
18. Klaus Rudischhauser, European Commission
19. Klaus Schwab, WEF
20. Tim Wirth, UN Foundation
Finance Report Task Team: • Abyd Karmali, Matthew Hale, Jonathan Plowe, Suzanne Buchta • Rhonda Jordan, Pankaj Gupta, Arsh Shama, Natalie Nicolaou, Richard McGeorge • Leonardo Botelho, Antonio Tovar, Claudia Amarante, Ana Caputo • Mohinder Gulati
Finance Committee Report 2015
For further information, please contact:
Mr. Mohinder Gulati Chief Operating Officer for SE4All
Organizations with representatives on the SE4All Finance
Committee:
Sustainable Energy for All Andromeda Tower 15th floor, Donau City Strasse 6, 1220 , Vienna, AUSTRIA
Tel: +43 (0)1 2606083403 / Email: [email protected]